UNITED STATES
SECURITIES AND EXCHANGE COMMISSION
Washington, D.C. 20549
Form 10-K
(Mark One)
[X] Annual report pursuant to Section 13 or 15(d) of the Securities Exchange Act of 1934
For the fiscal year endedDecember 31, 2008
OR
[ ] Transition report pursuant to Section 13 or 15(d) of the Securities Exchange Act of 1934
For the transition period from ________ to ________
Commission File Number 000-24503
Washington Banking Company
(Exact name of registrant as specified in its charter)
| |
| Washington | 91-1725825 |
| (State or other jurisdiction of | (I.R.S. Employer |
| incorporation or organization) | Identification Number) |
450 SW Bayshore Drive
Oak Harbor, Washington 98277
(Address of principal executive offices) (Zip Code)
Registrant’s Telephone Number, Including Area Code: (360) 679-3121
Securities Registered Pursuant to Section 12(b) of the Act:None
Securities Registered Pursuant to Section 12(g) of the Act:
Common Stock, No Par Value
(Title of Class)
Indicate by check mark if the registrant is a well-known seasoned issuer, as defined in Rule 405 of the Securities Act.
Yes [ ] No [ X ]
Indicate by check mark if the registrant is not required to file reports pursuant to Section 13 or Section 15(d) of the Act. Yes [ ] No [ X ]
Indicate by check mark whether the registrant (1) has filed all reports required to be filed by Section 13 or 15 (d) of the Securities and Exchange Act of 1934 during the preceding 12 months (or for such shorter period that the registrant was required to file such reports), and (2) has been subject to such filing requirements for the past 90 days. Yes[ X ] No [ ]
Indicate by check mark if disclosure of delinquent filers pursuant to Item 405 of Regulation S-K (17 C.F.R. 229.405) is not contained herein, and will not be contained, to the best of registrant’s knowledge, in definitive proxy of information statements incorporated by reference in Part III of this Form 10-K or any amendments to this Form 10-K. [ X ]
Indicate by check mark if the registrant is a large accelerated filer, an accelerated filer, or a non-accelerated filer. See definition of “accelerated filer and large accelerated filer in Rule 12b-2 of the Exchange Act. (Check one):
| | | |
| Large accelerated filer [ ] | Accelerated filer [ X ] | Non-Accelerated filer [ ] | Smaller Reporting Company [ ] |
Indicate by check mark if the registrant is a shell company as defined in Rule 12b-2 under the Securities Exchange Act of 1934, as amended. Yes [ ] No [ X ]
The aggregate market value of Common Stock held by non-affiliates of registrant at June 30, 2008 was approximately $68,425,984 based upon the closing price of the registrant’s common stock as quoted on the Nasdaq National Market on June 30, 2008 of $7.90.
The number of shares of registrant’s Common Stock outstanding at March 06, 2009 was 9,529,496. Documents incorporated by reference and parts of Form 10-K into which incorporated:
Registrant’s definitive Proxy Statement
to be filed within 120 days of our 2008 fiscal year end | Part III, except the reports of the audit and
compensation committees |
2
| | | | |
| | | Cross Reference Sheet |
| |
| | | Location in Definitive Proxy Statement |
| | | Items required by Form 10-K |
| |
| |
| Form 10-K | | Definitive Proxy Statement |
| Part and | | | | |
| Item No. | | Caption | | Caption |
| Part III | | | | |
| Item 10. | | Directors, Executive Officers and Corporate | | Election of Directors and Beneficial |
| | | Governance | | Ownership and Section 16(a) Reporting |
| | | | | Compliance |
| Item 11. | | Executive Compensation | | Executive Compensation |
| |
| Item 12. | | Security Ownership of Certain Beneficial | | Security Ownership of Certain Beneficial |
| | | Owners and Management and Related | | Owners and Management |
| | | Stockholder Matters | | |
| Item 13. | | Certain Relationships, Related Transactions, | | Interest of Management in Certain |
| | | and Director Independence | | Transactions |
| Item 14. | | Principal Accounting Fees and Services | | Relationship with Independent Registered |
| | | | | Public Accounting Firm |
i
| | |
| | Table of Contents | |
| | PART I | Page |
| Item 1. | Business | 1 |
| Item 1A. | Risk Factors | 7 |
| Item 1B. | Unresolved Staff Comments | 12 |
| Item 2. | Properties | 12 |
| Item 3. | Legal Proceedings | 12 |
| Item 4. | Submission of Matters to a Vote of Security Holders | 13 |
| | PART II | |
| Item 5. | Market for the Registrant’s Common Equity, Related Stockholder Matters and Issuer | 13 |
| | Purchases of Equity Securities | |
| Item 6. | Selected Financial Data | 16 |
| Item 7. | Management’s Discussion and Analysis of Financial Condition and Results of Operations | 17 |
| Item 7A. | Quantitative and Qualitative Disclosures about Market Risk | 34 |
| Item 8. | Financial Statements and Supplementary Data | 36 |
| Item 9. | Changes in and Disagreements with Accountants on Accounting and Financial Disclosure | 71 |
| Item 9A. | Controls and Procedures | 71 |
| Item 9B. | Other Information | 71 |
| | PART III | |
| Item 10. | Directors, Executive Officers and Corporate Governance | 71 |
| Item 11. | Executive Compensation | 71 |
| Item 12. | Security Ownership of Certain Beneficial Owners and Management and Related Stockholder | 71 |
| | Matters | |
| Item 13. | Certain Relationships, Related Transactions, and Director Independence | 72 |
| Item 14. | Principal Accounting Fees and Services | 72 |
| | PART IV | |
| Item 15. | Exhibits and Financial Statement Schedules | 72 |
ii
| Note Regarding Forward-Looking Statements: This Annual Report on Form 10-K includes forward-looking statements within the meaning of Section 21E of the Securities Exchange Act of 1934, as amended (the “Exchange Act”) that are subject to risks and uncertainties. These forward-looking statements describe management's expectations regarding future events and developments such as future operating results, growth in loans and deposits, credit quality and loan losses, and continued success of the Company’s business plan. Readers should not place undue reliance on forward-looking statements, which reflect management’s views only as of the date hereof. The words “anticipate,” “expect,” “will,” “believe,” and words of similar meaning are intended, in part, to help identify forward-looking statements. Future events are difficult to predict, and the expe ctations described above are subject to risk and uncertainty that may cause actual results to differ materially. In addition to discussions about risks and uncertainties set forth from time to time in the Company’s filings with the Securities and Exchange Commission, Item 1a of the Annual Report and the following factors that may cause actual results to differ materially from those contemplated in these forward-looking statements include, among others: (1) local and national general and economic condition; (2) changes in interest rates and their impact on net interest margin; (3) competition among financial institutions; (4) legislation or regulatory requirements; (5) the ability to realize the efficiencies expected from investment in personnel and infrastructure. For a more detailed discussion of some of the risk factors, see the section entitled “Risk Factors” below. Washington Banking Company does not undertake to update forward-looking statements to reflect circumstances or events that occ ur after the date the forward-looking statements were made. Any such statements are made in reliance on the safe harbor protections provided under the Securities Exchange Act of 1934, as amended. |
PART IItem 1. Business
General
Washington Banking Company (the “Company”) was formed on April 30, 1996 and is a registered bank holding company whose primary business is conducted by its wholly-owned subsidiary, Whidbey Island Bank (the “Bank”). The business of the Bank, which is focused in the northern area of Western Washington, consists primarily of attracting deposits from the general public and originating loans.
Whidbey Island Bank is a Washington state-chartered bank that conducts a full-service community commercial banking business. The Bank also offers nondeposit managed investment products and services, which are not Federal Deposit Insurance Corporation (“FDIC”) insured. These programs are provided through the investment advisory companies Elliott Cove Capital Management LLC and DFC Services & DFC Insurance Services. Another nondeposit product offered through the Bank, which is not FDIC insured, is a sweep investment option available through a brokerage account.
Washington Banking Capital Trust I (“The Trust”) is a wholly-owned subsidiary of the Company. The Trust was formed in June 2002 for the exclusive purpose of issuing trust preferred securities to acquire junior subordinated debentures issued by the Company. Those debentures are the sole assets of the Trust and payments on the debt are the sole revenues of the Trust. The Company has fully and unconditionally guaranteed all obligations of the Trust. In 2007, the Company terminated the Trust, after the Company repaid all outstanding debentures and the Trust repaid all holders of the trust preferred securities.
Washington Banking Master Trust (the “Master Trust”) is a wholly-owned subsidiary of the Company. The Master Trust was formed in April 2007 for the exclusive purpose of issuing trust preferred securities to acquire junior subordinated debentures issued by the Company. Those debentures are the sole assets of the Master Trust and payments on the debt are the sole revenues of the Master Trust. See Note 8- Trust Preferred Securities and Junior Subordinated Debentures to the consolidated financial statements for further details.
Rural One, LLC (“Rural One”) is a majority-owned subsidiary of the Bank and is certified as a Community Development Entity by the Community Development Financial Institutions Fund of the United Stated Department of Treasury. Rural One was formed in September 2006, for the exclusive purpose of an investment in Federal tax credits related to the New Markets Tax Credit program.
At December 31, 2008, the Company had total assets of $899.6 million, total deposits of $747.2 million and shareholders’ equity of $80.6 million. A more thorough discussion of the Company’s financial performance appears in Item 7-Management’s Discussion and Analysis of Financial Condition and Results of Operations.
The Company’s website address iswww.wibank.com. Exchange Act reports are available free of charge from the Company’s website. The reports can also be obtained through the Securities and Exchange Commission’s (the “SEC”) EDGAR database
1
athttp://www.sec.gov. The contents of the Company’s Internet website are not incorporated into this report or into any other communication delivered to security holders or furnished to the SEC.
Growth Strategy
The Company’s strategy is one of value-added growth. Management believes that qualitative and sustainable growth of the Company, coupled with maintaining profitability, is currently the most appropriate path to providing good value for its shareholders. To date, the Company’s growth has been achieved organically and it attributes its reputation for focusing on customer service and satisfaction as one of the cornerstones to the Company’s success. The Company’s primary objectives are to improve profitability and operating efficiencies, increase market penetration in areas currently served, and to continue an expansion strategy in appropriate market areas.
The Company’s geographical expansion to date has primarily been concentrated along the I-5 corridor from Snohomish to Whatcom Counties; however, additional areas will be considered if they meet the Company’s criteria. Acquisition of banks or branches may also be used as a means of expansion if appropriate opportunities are presented. The primary factors considered in determining the areas of geographic expansion are the availability of knowledgeable personnel, such as managers and lending officers with experience in their fields of expertise, longstanding community presence and extensive banking relationships, customer demand and perceived market potential.
Management believes that increasing the success of current branches and expanding into appropriate market places while managing up-front costs is an excellent way to build franchise value and increase business. The Company’s strategy is to support its employees in providing a high level of personal service to its customers while expanding the loan, deposit and investment products and other services that the Company offers. Maintenance of asset quality will be emphasized by controlling nonperforming assets and adhering to prudent underwriting standards. In addition, management will maintain its focus on improving operating efficiencies and internal operating systems to further manage noninterest expense.
Growth requires expenditures of substantial sums to purchase or lease real property and equipment and to hire experienced personnel. New branch offices are often not profitable for a period of time after opening and management expects that earnings may be negatively affected in the short term.
Market Areas
The Company’s primary market area currently consists of Island, Skagit, Whatcom, Snohomish and San Juan counties in northwest Washington State. Although the Pacific Northwest is typically associated with industries such as computer technology, aerospace and coffee, the Company’s market encompasses distinct economies that are somewhat removed from the Seattle metropolitan region.
Island County’s largest population center, Oak Harbor, is dominated by a large military presence with naval operations at NAS Whidbey Island. The jobs generated by NAS Whidbey contribute significantly to the county’s economy. Other primary industries providing employment for county residents are: education; health and social services; retail trade; and manufacturing. Due to its natural beauty, the county attracts tourism and has a number of retirement communities.
The economy of Skagit County is primarily comprised of agriculture, fishing, wood products, tourism, international trade, and specialized manufacturing. With its accessible ports and refineries, Skagit County is the center of the state’s petroleum industry.
Whatcom County, which borders Canada, has an economy with a prominent manufacturing base, as well as a significant academic-research and vocational-technical base, as it is the home of Western Washington University, one of Washington’s largest four-year academic centers. The United States Customs and Border Patrol and municipal, county and state governments give Whatcom County an additional employment base.
Snohomish County industrial sectors include aerospace, biotechnology, and electronics, as well as a military naval base and large retail influences.
The economy of San Juan County is predominantly comprised of retail trade, tourism, finance and insurance, and real estate services. The county is known for its beautiful locale, which attracts many visitors, and serves as a second home to an affluent sector of the population.
2
Competition
The Company operates in a highly competitive banking environment, competing for deposits, loans and other financial services with a number of larger and well-established commercial banks, savings banks, savings and loan associations, credit unions and other institutions, including nonbanking financial services companies.
Some of the Bank’s competitors are not subject to the same regulations as the Bank; they may have substantially higher lending limits, and may offer certain services that the Bank does not provide. Federal law allows mergers or other combinations, relocations of a bank’s main office and branching across state lines. Recent amendments to the federal banking laws to eliminate certain barriers between banking and commercial firms are expected to result in even greater competition in the future. Although the Company has been able to compete effectively in its market areas to date, there can be no assurance that the Company's competitive efforts will continue to be successful.
Executive Officers of the Company
| The following table sets forth certain information about the executive officers of the Company: | |
| | | | Has served as an executive |
| | | | officer of the Company or |
| Name | Age | Position | Bank since |
| John L. Wagner | 65 | President and Chief Executive Officer | 2004 |
| Joseph W. Niemer | 57 | Executive Vice President and Chief Credit Officer | 2005 |
| Richard A. Shields | 49 | Executive Vice President and Chief Financial Officer | 2004 |
John L. Wagner.Mr. Wagner, 65, is the President and Chief Executive Officer of the Bank . He joined the Bank in 1999 as Senior Vice President and Regional Manager in Whatcom County. In 2002, Mr. Wagner was selected to oversee branch administration and was promoted to COO in 2004. In 2007, Mr. Wagner was promoted to the Chief Executive Officer of the Bank. On October 1, 2008 Mr. Wagner was promoted to the position of Chief Executive Officer of the Company. Mr. Wagner has an extensive background in banking and international finance as well as comprehensive administrative experience as former President of Bank of Washington in Bellingham, Washington.
Joseph W. Niemer.Mr. Niemer, 57, is the Executive Vice President and Chief Credit Officer of the Bank. Mr. Niemer has over 30 years of experience in various credit-related positions with Pacific Northwest-based banks. Most recently, he was the Senior Vice President and Chief Credit Officer for Washington Mutual Bank’s Commercial Group, where he oversaw commercial and commercial real estate credit decisions.
Richard A. Shields.Mr. Shields, 49, is the Executive Vice President and Chief Financial Officer of the Company and the Bank. Mr. Shields joined the Bank in 2004 and has over 20 years of experience in various accounting-related positions with Pacific Northwest-based banks. Most recently, he was the Vice President and Controller at Umpqua Bank that has grown substantially both organically and through multiple acquisitions.
Employees
The Company had 258 full time equivalent employees at December 31, 2008. None of the Company’s employees are covered by a collective bargaining agreement or represented by a collective bargaining group. Management considers its relations with employees to be good.
The Company’s principal subsidiary, Whidbey Island Bank, provides services through nineteen bank branches in five counties located in northwestern Washington. The Company’s executive officers are fully involved and responsible for managing the day-to-day business of the Bank.
Supervision and Regulation
The Company is a bank holding company within the meaning of the Bank Holding Company Act of 1956 (“BHC Act”) registered with and subject to examination by the Federal Reserve Board (“FRB”). The Bank is a Washington state-chartered commercial bank and is subject to examination, supervision and regulation by the Washington State Department of
3
Financial Institutions–Division of Banks (“Division”). FDIC insures the Bank’s deposits and in that capacity also regulates the Bank.
The Company’s earnings and activities are affected by legislation, by actions of the FRB, the Division, the FDIC and other regulators, by local legislative and administrative bodies, and by decisions of courts in Washington State. These include limitations on the ability of the Bank to pay dividends to the Company, and numerous federal and state consumer protection laws imposing requirements on the making, enforcement, and collection of consumer loans, and restrictions by regulators on the sale of mutual funds and other uninsured investment products to customers.
Gramm-Leach-Bliley Financial Services Modernization Act.Congress enacted major federal financial institution reform legislation in 1999. Title I of the Gramm-Leach-Bliley Act (the “GLB Act”), which became effective March 11, 2000, allows bank holding companies to elect to become financial holding companies. In addition to activities previously permitted bank holding companies, financial holding companies may engage in nonbanking activities that are financial in nature, such as securities, insurance and merchant banking activities, subject to certain limitations.
The activities of bank holding companies, such as the Company that are not financial holding companies, are generally limited to managing or controlling banks. A bank holding company is required to obtain the prior approval of the FRB for the acquisition of more than 5% of the outstanding shares of any class of voting securities or substantially all of the assets of any bank or bank holding company. Nonbank acquisitions by bank holding companies such as the Company are generally limited to 5% of voting shares of a company and activities previously determined by the FRB by regulation or order to be so closely related to banking as to be a proper incident to banking or managing or controlling banks.
The GLB Act also included the most extensive consumer privacy provisions ever enacted by Congress. These provisions, among other things, require full disclosure of the Company’s privacy policy to consumers and mandate offering the consumer the ability to “opt out” of having non-public personal information disclosed to third parties. Pursuant to these provisions, the federal banking regulators have adopted privacy regulations. In addition, the states are permitted to adopt more extensive privacy protections through legislation or regulation. The Company does not disclose any nonpublic personal information about its customers or former customers to anyone, except as permitted by law.
Additional legislation may be enacted or regulations imposed to further regulate banking and financial services or to limit finance charges or other fees or charges earned in such activities. There can be no assurance whether any such legislation or regulation will place additional limitations on the Company’s operations or adversely affect its earnings.
There are various legal restrictions on transactions between the Company and any nonbank subsidiaries, and between the Company and the Bank. With certain exceptions, federal law also imposes limitations on, and requires collateral for, extensions of credit by insured depository institutions, such as the Bank, to their nonbank affiliates, such as the Company.
Interstate Banking and Branching.The Riegle-Neal Interstate Banking and Branching Efficiency Act of 1994 (“Interstate Act”) permits nationwide interstate banking and branching under certain circumstances. Subject to certain limitations and restrictions, a bank holding company, with prior approval of the FRB, may acquire an out-of-state bank. Banks in states that do not prohibit out-of-state mergers may merge with the approval of the appropriate federal banking agency. A state bank may establish a de novo branch out of state if such branching is expressly permitted by the other state.
Federal and State Bank Regulation.Among other things, applicable federal and state statutes and regulations which govern a bank’s activities relate to minimum capital requirements, required reserves against deposits, investments, loans, legal lending limits, mergers and consolidations, borrowings, issuance of securities, payment of dividends, establishment of branches and other aspects of its operations. The Division and the FDIC also have authority to prohibit banks under their supervision from engaging in what they consider to be unsafe and unsound practices.
Specifically with regard to the payment of dividends, there are certain limitations on the ability of the Company to pay dividends to its shareholders. It is the policy of the FRB that bank holding companies should pay cash dividends on common stock only out of income available over the past year and only if prospective earnings retention is consistent with the organization's expected future needs and financial condition. The policy provides that bank holding companies should not maintain a level of cash dividends that undermines the bank holding company's ability to serve as a source of strength to its banking subsidiaries. Various federal and state statutory provisions also limit the amount of dividends that subsidiary banks can pay to their holding companies without regulatory approval. Additionally, depending upon the circumstances, the FDIC or the Division could take the position that paying a dividend would constitute an unsafe or unsound banking practi ce.
4
Under longstanding FRB policy, a bank holding company is expected to act as a source of financial strength for its subsidiary banks and to commit resources to support such banks. The Company could be required to commit resources to the Bank in circumstances where it might not do so, absent such policy.
The Bank is required to file periodic reports with the FDIC and the Division and is subject to periodic examinations and evaluations by those regulatory authorities. These examinations must be conducted every 12 months. The FDIC and the Division may each accept the results of an examination by the other in lieu of conducting an independent examination.
In the liquidation or other resolution of a failed insured depository institution, deposits in offices and certain claims for administrative expenses and employee compensation are afforded a priority over other general unsecured claims, including nondeposit claims, and claims of a parent company such as the Company. Such priority creditors would include the FDIC, which succeeds to the position of insured depositors.
Federal Deposit Insurance.The deposits of the Bank are currently insured to the maximum amount allowable per depositor through the Deposit Insurance Fund (DIF) administered by the FDIC. In October 2008, the FDIC temporarily increased the amount of deposit insurance from $100,000 to $250,000 per depositor through December 31, 2009. The FDIC also made unlimited deposit insurance coverage available for non-interest bearing transactions accounts and certain low-interest NOW accounts through December 31, 2009 at institutions participating in the FDIC’s Temporary Liquidity Guarantee Program (TLGP). The Bank is participating in the TLGP.
The FDIC implemented a new risk-based insurance premium system effective January 1, 2007 under which banks are assessed insurance premiums based on how much risk they present to the DIF. Banks with higher levels of capital and a lower degree of supervisory risk are assessed lower premium rates than banks with lower levels of capital and/or a higher degree of supervisory risk. These premium rates are applied to the average balance of deposits in the prior quarter. Because the Bank is participating in the TLGP, a 10 basis point annual rate surcharge will be applied to non-interest bearing transaction deposit amounts over $250,000. The FDIC may increase or decrease the assessment rate schedule in order to manage the DIF to prescribed statutory target levels. An increase in the assessment rate could have an adverse effect on the Bank’s earnings, depending upon the amount of the increase. The FDIC may terminate deposit insurance if it determines the instituti on involved has engaged in or is engaging in unsafe or unsound banking practices, is in an unsafe or unsound condition, or has violated applicable laws, regulations or orders.
In December of 2008, the FDIC adopted a rule that would further amend the system for risk-based assessments and change assessment rates in attempts to restore targeted reserve ratios in the DIF. Effective January 1, 2009, the risk-based assessment rates will be uniformly raised seven basis points (annualized). Furthermore, the FDIC in February 2009 adopted additional modifications to the assessment system by requiring riskier institutions pay a larger share of the assessment. Characteristics of riskier institutions may include institutions with a significant reliance on secured liabilities or brokered deposits, particularly when combined with rapid asset growth. The proposal would also provide incentives for institutions to hold long-term unsecured debt and, for smaller institutions, high levels of Tier 1 capital. These changes would be effective beginning April 1, 2009.
The FDIC may terminate the deposit insurance of any insured depository institution if it determines that the institution has engaged in or is engaging in unsafe and unsound banking practices, is in an unsafe or unsound condition or has violated any applicable law, regulation or order or any condition imposed in writing by, or pursuant to, any written agreement with the FDIC. The termination of deposit insurance for the Bank could have a material adverse effect on our financial condition and results of operations due to the fact that the Bank’s liquidity position would likely be affected by deposit withdrawal activity.
Community Reinvestment Act.The Community Reinvestment Act (CRA) requires that, in connection with examinations of financial institutions within their jurisdiction, regulators must evaluate the records of the financial institutions in meeting the credit needs of their local communities, including low and moderate income neighborhoods, consistent with the safe and sound operation of those banks. These factors are also considered in evaluating mergers, acquisitions and applications to open a branch or facility.
Capital Adequacy.The Company and the Bank are subject to risk-based capital and leverage guidelines issued by federal banking agencies for banks and bank holding companies. These agencies are required by law to take specific prompt corrective actions with respect to institutions that do not meet minimum capital standards. As of December 31, 2008, the Company and the Bank exceeded the minimum capital standards. Broad regulatory authority is given to the FDIC if capital levels drop below minimum standards including restrictions on growth, acquisition, branching and new lines of business as well as interest rate restrictions on deposit gathering activities.
5
Dividends.The Bank is subject to restrictions on the payment of cash dividends to the Company. The principal source of the Company’s cash flow is dividends received from the Bank, the issuance of junior subordinated debentures, and cash received from the exercise of stock options. Regulatory authorities may prohibit banks and bank holding companies from paying dividends which would constitute an unsafe or unsound banking practice. In addition, a bank may not pay cash dividends if that payment could reduce the amount of its capital below that necessary to meet the “adequately capitalized” level in accordance with regulatory capital requirements. Also, the payment of cash dividends by the Bank must satisfy a net profits test and an undivided profits test or the Bank must obtain prior approval of its regulators before such dividend is paid. The net profits test limits the dividend declared in any calendar year to the net profits of the current year plus retained net inco me of the preceding two years. The undivided profits test limits the dividends declared to the undivided profits on hand after deducting bad debts in excess of the allowance for loan and lease losses. Washington law also provides that no cash dividend may be paid if, after giving effect to the dividend, (1) a corporation would not be able to pay its debts as they become due in the usual course of business, or (2) a corporation’s total assets would be less than the sum of its total liabilities.
Federal Securities Laws; Sarbanes-Oxley Act of 2002.The Company is also subject to the periodic reporting, information disclosure, proxy solicitation, insider trading restrictions and other requirements of the Securities Exchange Act of 1934, as amended, including provisions of the Sarbanes Oxley Act of 2002.
The Sarbanes-Oxley Act represents significant federal involvement in matters traditionally left to state regulatory systems, such as the regulation of the accounting profession, and regulation of the relationship between a Board of Directors and management and between a Board of Directors and its committees.
Key components of the Sarbanes-Oxley Act are follows:
A prohibition on personal loans by the Company to its directors and executive officers except loans made by the Bank in accordance with federal banking regulations
Independence requirements for Board audit committee members and the Company’s auditors
Certification of Exchange Act reports by the chief executive officer, chief financial officer and principal accounting officer
Disclosure of off-balance sheet transactions
Expedited reporting of stock transactions by insiders
Increased criminal penalties for violations of securities laws.
The Sarbanes-Oxley Act also requires:
Management to establish, maintain and evaluate disclosure controls and procedures;
Management to report on its annual assessment of the effectiveness of internal controls over financial reporting;
The Company’s external auditor to attest to the effectiveness of internal controls over financial reporting.
The SEC has adopted regulations to implement various provisions of the Sarbanes-Oxley Act, including disclosures in periodic filings pursuant to the Exchange Act. Also, in response to the Sarbanes-Oxley Act, NASDAQ adopted new standards for listed companies.
USA Patriot Act of 2001. Under the USA Patriot Act of 2001 (“Patriot Act”), adopted by the U.S. Congress on October 26, 2001 to combat terrorism, FDIC-insured banks and commercial banks are required to increase their due diligence efforts for correspondent accounts and private banking customers. The Patriot Act requires the Bank to engage in additional record keeping or reporting, requiring identification of owners of accounts, or of the customers of foreign banks with accounts, and restricting or prohibiting certain correspondent accounts. While management believes that the Patriot Act may affect recordkeeping and reporting expenses to some degree, it does not believe that it will have a material adverse effect on the Company’s business and operations.
6
Emergency Economic Stabilization Act of 2008 (EESA).EESA granted broad powers to the U.S. Department of the Treasury, the FDIC and the Federal Reserve to stabilize the financial markets under the following programs:
the Capital Purchase Program allocated $250 billion to Treasury to purchase senior preferred shares and warrants to purchase commons stock from approved financial institutions;
the Troubled Asset Purchase Program allocated $250 billion to Treasury to purchase troubled assets from financial institutions, with Treasury to also receive securities issued by participating institutions;
the Temporary Liquidity Guaranty Program authorized the FDIC to insure newly issued senior unsecured debt and insure the total balance in non-interest bearing transactional deposit accounts of those institutions who elect to participate;
the Commercial Paper and Money Market Investor Funding Facilities authorized the Federal Reserve Bank of New York to purchase rated commercial paper from U.S. companies and to purchase money market instruments from U.S. money market mutual funds.
Effects of Governmental Monetary Policies
Profitability in banking depends on interest rate differentials. In general, the difference between the interest earned on a bank’s loans, securities and other interest-earning assets and the interest paid on a bank’s deposits and other interest-bearing liabilities is the major source of a bank’s earnings. Thus, the earnings and growth of the Company are affected not only by general economic conditions, but also by the monetary and fiscal policies of the United States and its agencies, particularly the FRB. The FRB implements national monetary policy for such purposes as controlling inflation and recession by its open market operations in United States government securities, control of the discount rate applicable to borrowing from the FRB and the establishment of reserve requirements against certain deposits. The actions of the FRB in these areas influence the growth of bank loans, investments and deposits, and also affect interest rates charg ed on loans and paid on deposits. The nature and impact of future changes in monetary policies and their impact on the Company are not predictable.
Item 1A. Risk Factors
Historical performance may not be indicative of future performance and, as noted elsewhere in this report, the Company has included forward-looking statements about its business, plans and prospects that are subject to change. Forward-looking statements are particularly located in, but not limited to, the sections Item 1-Businessand Item 7-Management’s Discussion and Analysis of Financial Condition and Results of Operations.In addition to the other risks or uncertainties contained in this report, the following risks may affect operating results, financial condition and cash flows. If any of these risks occur, either alone or in combination with other factors, the Company’s business, financial condition or operating results could be adversely affected. Moreover, readers should note this is not an exhaustive list; that some risks are unknown or not quantifiable, and other risks that are currently perceived as immaterial may ultimately prove more significant than expected. Statements about plans, predictions or expectations should not be construed to be assurances of performance or promises to take a given course of action.
A large percentage of the Company’s loan portfolio is secured by real estate, in particular commercial real estate. Continued deterioration in the real estate market or other segments of the Company’s loan portfolio would lead to additional losses which could have a material adverse effect on the Company’s business, financial condition and results of operations
Approximately 64.8% of the Company’s loan portfolio is secured by real estate, the majority of which is commercial real estate. As a result increased levels of commercial and consumer delinquencies and declining real estate values, the Company has experienced increasing levels of net charge-offs and allowances for loan losses. Continued increases in commercial and consumer delinquency levels or continued declines in real estate market values would require increased net charge-offs and increases in the allowance for loan losses, which could have a material adverse effect on the Company’s business, financial condition and results of operations and prospects.
7
Future loan losses may exceed the allowance for loan losses
The Company has established a reserve for possible losses expected in connection with loans in the credit portfolio. This allowance reflects estimates of the collectibility of certain identified loans, as well as an overall risk assessment of total loans outstanding. The determination of the amount of loan loss allowance is subjective; although the method for determining the amount of the allowance uses criteria such as risk ratings and historical loss rates, these factors may not be adequate predictors of future loan performance. Accordingly, the Company cannot offer assurances that these estimates ultimately will prove correct or that the loan loss allowance will be sufficient to protect against losses that ultimately may occur. If the loan loss allowance proves to be inadequate, it may require unexpected charges to income, which would adversely impact results of operations and financial condition. Moreover, bank regulators frequently monitor banks' loan lo ss allowances, and if regulators were to determine that the allowance was inadequate, they may require the Company to increase the allowance, which also would adversely impact revenues and financial condition.
Defaults may negatively impact the Company
A source of risk arises from the possibility that losses will be sustained if a significant number of borrowers, guarantors and related parties fail to perform in accordance with the terms of their loans. The Company has adopted underwriting and credit monitoring procedures and credit policies, including the establishment and review of the allowance for credit losses, which management believes are appropriate to minimize risk by assessing the likelihood of nonperformance, tracking loan performance and diversifying the credit portfolio. These policies and procedures, however, may not prevent unexpected losses that could materially affect results of operations.
A rapid change in interest rates could reduce the Company’s net interest margin, net interest income and fee income
The Company’s earnings are impacted by changing interest rates. Changes in interest rates affect the demand for new loans, the credit profile of existing loans, the rates received on loans and securities, and rates paid on deposits and borrowings. The relationship between the rates received on loans and securities and the rates paid on deposits and borrowings is known as the net interest spread. Based on the Company’s current volume and mix of interest-bearing liabilities and interest-earning assets, net interest spread could be expected to increase during times when interest rates rise in a parallel shift along the yield curve and, conversely, to decline during times of similar falling interest rates. Exposure to interest rate risk is managed by monitoring the re-pricing frequency of rate-sensitive assets and rate-sensitive liabilities over any given period. Although management believes the current level of interest rate sensitivity is reasonable, significant fluctuations in interest rates could potentially have an adverse affect on the Company’s business, financial condition and results of operations.
Tightening of credit markets and liquidity risk
Liquidity measures the ability to meet loan demand and deposit withdrawals and to service liabilities as they come due. Dramatic fluctuations in loan or deposit balances make it challenging to manage liquidity. A sharp reduction in deposits could force the Company to borrow heavily in the wholesale deposit market. In addition, rapid loan growth during periods of low liquidity could induce the Company to purchase federal funds from correspondent banks, borrow at the Federal Home Loan Bank of Seattle or Federal Reserve discount window, raise deposit interest rates or reduce lending activity. Wholesale deposits and federal funds or other sources for borrowings may not be available to us due to regulatory constraints, market upheaval or unfavorable terms.
Slower than anticipated growth from new branches, service offerings or acquisitions could result in reduced net income
Financial performance and profitability will depend on the Company’s ability to manage recent growth and potential future growth. In addition, any future acquisitions and continued growth may present operating and other problems that could have an adverse effect on the Company’s business, financial condition and results of operations. Accordingly, there can be no assurance that the Company will be able to execute it’s growth strategy or maintain the level of profitability that it has achieved in the past.
8
Internal control systems could fail to detect certain events
The Company is subject to many operating risks, including but not limited to data processing system failures and errors, and customer or employee fraud. There can be no assurance that such an event will not occur, and if such an event is not prevented or detected by other Company’s internal controls and does occur, and it is uninsured or is in excess of applicable insurance limits, it could have a significant adverse impact on the Company’s reputation in the business community and the Company’s business, financial condition, and results of operations.
The Company’s operations could be interrupted if third party service providers experience difficulty, terminate their services, or fail to comply with banking regulations
The Company depends, and will continue to depend to a significant extent, on a number of relationships with third-party service providers. Specifically, the Company utilizes software and hardware systems for processing, essential web hosting, debit and credit card processing, merchant processing, Internet banking systems, and other processing services from third-party service providers. If these third-party service providers experience difficulties or terminate their services, and the Company is unable to replace them with other qualified service providers, the Company’s operations could be interrupted. If an interruption were to continue for a significant period of time, the Company’s business, financial condition, and results of operations could be materially adversely affected.
The network and computer systems on which the Company depends could fail or experience a security breach
The Company’s computer systems could be vulnerable to unforeseen problems. Because the Company conducts part of its business over the Internet and outsource several critical functions to third parties, operations depend on the Company’s ability, and to a degree on the ability of third-party service providers to protect computer systems and network infrastructure against damage from fire, power loss, telecommunications failure, mechanical failure, software errors, operator errors, physical break-ins, or similar catastrophic events. Any damage or failure that causes interruptions in operations could have a material adverse effect on the Company’s business, financial condition, and results of operations.
In addition, a significant barrier to online financial transactions is the secure transmission of confidential information over public networks. The Company’s Internet banking system relies on encryption and authentication technology to provide the security and authentication necessary to effect secure transmission of confidential information. Advances in computer capabilities, new discoveries in the field of cryptography, fraud perpetrated by a customer, employee, or third-party, or other developments could result in a compromise or breach of the algorithms the Bank or our third-party service providers use to protect the confidentiality and integrity of data, including non-public customer information. If any such compromise of security were to occur, it could have a material adverse effect on our business, financial condition, and results of operations.
The Company may not be able to replace key members of management or attract and retain qualified employees in the future
The Company depends on the services of existing management to carry out its business strategies. As the Company expands, it will need to continue to attract and retain additional management and other qualified staff. In particular, because the Company plans to continue to expand its locations and products and services, it will need to continue to attract and retain qualified banking personnel. Competition for such personnel is significant in the Company’s geographic market areas. The loss of the services of any management personnel, or the inability to recruit and retain qualified personnel in the future, could have an adverse effect on our results of operations, financial conditions, and prospects.
The Company’s operations are geographically concentrated in Northwest Washington State
Substantially, all of the Company’s business is derived from a five-county area in northwest Washington State. Employment opportunities within these communities have traditionally been primarily in the areas of military spending, oil and gas industries, tourism and manufacturing. While the Company’s expansion strategy has been built around these growing and diverse geographic markets, the Company’s business is, and will remain, sensitive to economic factors that relate to these industries and to local and regional business conditions. As a result, local or regional economic downturns, or downturns that disproportionately affect one or more of the key industries in the Company’s markets, may have a more pronounced effect upon it’s business than they might on an institution that is more broadly diverse in geographic concentration. The extent of the future impact of these events on economic and business conditions cannot be predicted; ho wever, prolonged or acute fluctuations could have a material and adverse impact upon the Company’s results of operation and financial condition.
9
There are significant risks associated with potential acquisitions, including participating in FDIC-assisted acquisitions or assuming deposits from a troubled institution
The Company may make opportunistic whole or partial acquisitions of other banks, branches, financial institutions, or related businesses from time to time that it expects to further its business strategy. These acquisitions could involve numerous risks, including lower than expected performance or higher than expected costs, difficulties related to integration, diversion of management’s attention from other business activities, changes in relationships with customers, and the potential loss of key employees. Any possible acquisition will be subject to regulatory approval, and there can be no assurance that the Company will be able to obtain such approval. The Company may not be successful in identifying acquisition candidates, integrating acquired institutions, or preventing deposit erosion or loan quality deterioration at acquired institutions. Competition for acquisitions in the Company’s market area is highly competitive, and the Company may not be able to acquire other institutions on attractive terms. There can be no assurance that the Company will be successful in completing or will even pursue future acquisitions, or if such transactions are completed, that it will be successful in integrating acquired businesses into its operations. The Company’s ability to grow may be limited if it chooses not to pursue or are unable to successfully make acquisitions in the future.
The Company’s banking operations are subject to extensive government regulation that is expected to become more burdensome, increase its costs and make it less competitive compared to financial services firms that are not subject to the same regulation
The Company is subject to government regulation that could limit or restrict it’s activities, which in turn could adversely impact operations. The financial services industry is regulated extensively. Federal and state regulation is designed primarily to protect the deposit insurance funds and consumers, as well as shareholders. These regulations can sometimes impose significant limitations on operations. Moreover, federal and state banking laws and regulations undergo frequent, significant changes. Changes in laws and regulations may affect the cost of doing business, limit permissible activities (including insurance and securities activities), or the Company’s competitive position in relation to credit unions, savings associations and other financial institutions. These changes could also reduce federal deposit insurance coverage, broaden the powers or geographic range of financial holding companies, alter the taxation of financial institutions an d change the structure and jurisdiction of various regulatory agencies. Federal monetary policy, particularly as implemented through the Federal Reserve System, can significantly affect credit availability. Other federal legislation such as the Sarbanes-Oxley Act can dramatically shift resources and costs to ensure adequate compliance.
Difficult market conditions have adversely affected our industry
The capital and credit markets have been experiencing volatility and disruption for more than twelve months. Dramatic declines in the housing market over the past year, with falling home prices and increasing foreclosures and unemployment, have negatively impacted the credit performance of mortgage loans and resulted in significant write-downs of asset values by financial institutions, including government-sponsored entities. These write-downs have caused many financial institutions to seek additional capital, to merge with larger and stronger institutions and, in some cases, to fail. Reflecting concern about the stability of the financial markets generally and the strength of counterparties, many lenders and institutional investors have reduced or ceased providing funding to borrowers, including to other financial institutions. This market turmoil and tightening of credit have led to an increased level of commercial and consumer delinquencies, lack of consum er confidence, increased market volatility and widespread reduction of business activity, generally. The resulting economic pressure on consumers and lack of confidence in the financial markets has adversely affected our business, financial condition and results of operations. The Company does not expect that the difficult conditions in the financial markets are likely to improve in the near future. A worsening of these conditions would likely exacerbate the adverse effects of these difficult market conditions on us and others in the financial services industry. In particular, we may face the following risks in connection with these events:
The Company expects to face increased regulation of our industry, including as a result of the EESA and ARRA. Compliance with such regulation may increase our costs and limit our ability to pursue business opportunities.
Government stimulus packages and other responses to the financial crises may not stabilize the economy or financial system.
The Company’s ability to assess the creditworthiness of our customers may be impaired if the models and approaches the Company uses to select, manage, and underwrite our customers become less predictive of future behaviors.
10
The process the Company uses to estimate losses inherent in its credit exposure requires difficult, subjective, and complex judgments, including forecasts of economic conditions and how these economic predictions might impair the ability of the Bank’s borrowers to repay their loans, which may no longer be capable of accurate estimation which may, in turn, impact the reliability of the process.
The Company will be required to pay significantly higher Federal Deposit Insurance Corporation premiums because market developments have significantly depleted the insurance fund of the FDIC and reduced the ratio of reserves to insured deposits.
There may be downward pressure on the Company’s stock price.
The Company’s ability to engage in routine funding transactions could be adversely affected by the actions and commercial soundness of other financial institutions and government sponsored entities.
The Company may face increased competition due to intensified consolidation of the financial services industry.
If current levels of market disruption and volatility continue or worsen, there can be no assurance that the Company will not experience an adverse effect, which may be material, on the Company’s ability to access capital and on the Company’s business, financial condition and results of operations.
Because of the Company’s participation in the Troubled Asset Relief Program, the Company is subject to several restrictions including restrictions on its ability to declare or pay dividends and repurchase its shares as well as restrictions on compensation paid to our executives
On January 16, 2009, in exchange for an aggregate purchase price of $26.4 million, the Company issued and sold to the United States Department of the Treasury pursuant to the TARP Capital Purchase Program the following: (i) 26,380 shares of the Company’s newly designated Fixed Rate Cumulative Perpetual Preferred Stock, Series A, no par value per share, and liquidation preference $1,000 per share ($26.4 million liquidation preference in the aggregate) and (ii) a warrant to purchase up to 492,164 shares of the Company’s common stock, no par value per share, at an exercise price of $8.04 per share, subject to certain anti-dilution and other adjustments. The Warrant may be exercised for up to ten years after it is issued.
In connection with the issuance and sale of the Company’s securities, the Company entered into a Letter Agreement including the Securities Purchase Agreement — Standard Terms, dated January 16, 2009, with the United States Department of the Treasury (the “Agreement”). The Agreement contains limitations on the payment of quarterly cash dividends on the Company’s common stock in excess of $0.065 per share, and on the Company’s ability to repurchase its common stock. The Agreement also grants the holders of the Series A Preferred Stock, the Warrant and the common stock to be issued under the Warrant registration rights and subjects the Company to executive compensation limitations included in the Emergency Economic Stabilization Act of 2008. Participants in the TARP Capital Purchase Program are required to have in place limitations on the compensation of Senior Executive Officers.
The financial services industry is highly competitive
Competition may adversely affect the Company’s performance. The financial services business is becoming increasingly competitive due to changes in regulation, technological advances, and the accelerating pace of consolidation among financial services providers. The Company faces competition both in attracting deposits and in originating loans. Competition for loan’s principally through the pricing of interest rates and loan fees, and the efficiency and quality of services. Increasing levels of competition in the banking and financial services industries may reduce market share or cause the prices charged for services to fall. Results may differ in future periods depending upon the nature or level of competition.
Shares eligible for future sale could have a dilutive effect
Shares of the Company’s common stock eligible for future sale, including those that may be issued in connection with the Company’s various stock option and equity compensation plans, in possible acquisitions, and any other offering of Company’s common stock for cash, could have a dilutive effect on the market for Company’s common stock and could adversely affect its market price. There are 13,679,757 shares of Company’s common stock authorized, of which 9,510,007 shares were outstanding as of December 31, 2008.
11
The failure of the Federal Home Loan Bank (“FHLB”) of Seattle or the national Federal Home Loan Bank System may have a material negative impact on the Company’s earnings and liquidity
Recently, the FHLB of Seattle announced that it did not meet minimum regulatory capital requirements for the quarter ended September 30, 2008, and that it did not expect to comply with those requirements at December 31, 2008, due to the deterioration in the market value of their mortgage-backed securities portfolio. As a result, the FHLB of Seattle cannot pay a dividend on their common stock and it cannot repurchase or redeem common stock. While the FHLB of Seattle has announced it does not anticipate that additional capital is immediately necessary, nor does it believe that its capital level is inadequate to support realized losses in the future, the FHLB of Seattle could require its members, including the Company, to contribute additional capital in order to return the FHLB of Seattle to compliance with capital guidelines.
At December 31, 2008, the Company held $2.4 million of common stock in the FHLB of Seattle. Should the FHLB of Seattle fail, the Company anticipates that its investment in the FHLB’s common stock would be “other than temporarily” impaired and may have no value.
At December 31, 2008, the Company held $381,567 of cash on deposit with the FHLB of Seattle. At that date, all other cash and cash equivalents were held on deposit at the Pacific Coast Banker’s Bank, or on hand in branch office vaults.
At December 31, 2008, the Company maintained a line of credit with the FHLB of Seattle equal to 18% of total assets to the extent the Company provides qualifying collateral and holds sufficient FHLB stock. At December 31, 2008, the Company was in compliance with collateral requirements and $121.1 million of the line of credit was available for additional borrowings. The Company is highly dependent on the FHLB of Seattle to provide the primary source of wholesale funding for immediate liquidity and borrowing needs. The failure of the FHLB of Seattle or the FHLB system in general, may materially impair the Company’s ability to meet its growth plans or to meet short and long term liquidity demands.
Changes in accounting standards may impact how the Company reports its financial condition and results of operations
The Company’s accounting policies and methods are fundamental to how it records and reports its financial condition and results of operations. From time to time the Financial Accounting Standards Board (“FASB”) changes the financial accounting and reporting standards that govern the preparation of the Company’s financial statements. These changes can be difficult to predict and can materially impact how the Company records and reports its financial condition and results of operations. In some cases, the Company could be required to apply a new or revised standard retroactively, resulting in a restatement of prior period financial statements.
Item 1B. Unresolved Staff Comments
The Company had no unresolved staff comments from the Securities and Exchange Commission.
Item 2. Properties
The executive offices of the Company are located at 450 Southwest Bayshore Drive in Oak Harbor, WA in a building that is owned by the Company on leased land. The building also houses the Bank’s Oak Harbor branch. At December 31, 2008, the Bank conducted business at 19 branch locations, thirteen of which are owned by the Bank, including the main office in Coupeville, WA, and six are leased under various agreements. The Company owns two properties which are used for administrative purposes. Additionally, at the end of 2008, the Company entered into a lease agreement for an additional administrative building.
Item 3. Legal Proceedings
The Company and its subsidiaries are, from time to time, defendants in, and are threatened with, various legal proceedings arising from regular business activities. Management believes that its liability for damages, if any, arising from current claims or contingencies will not have a material adverse effect on the Company’s results of operations, financial conditions or cash flows.
12
Item 4. Submission of Matters to a Vote of Security Holders
The annual meeting of shareholders was held at Oak Harbor, Washington at 3:00 p.m. on December 11, 2008. The total number of shares of common stock represented in person or by proxy at the meeting was 7,843,863 shares. This represented 82.7% of the 9,489,087 shares held by shareholders as of October 28, 2008 and entitled to vote at the meeting. The following issue came before the shareholders for vote:
Election of directors to serve on the Board of Directors: two persons to serve as Class 3 directors until the annual meeting of shareholders in the year 2011, and one person to serve as a Class 2 director until the annual meeting of shareholders in the year 2010, or until their successors are duly elected and qualified. The nominees for the two Class 3 positions were Jay T. Lien and Edward J. Wallgren, and the nominee for the Class 2 director position was John L. Wagner, each of whom were elected with the following vote totals:
| | | |
| | For | Against | Withheld |
| Jay T. Lien | 7,702,694 | 0 | 141,169 |
| Edward J. Wallgren | 7,747,895 | 0 | 95,968 |
| John L. Wagner | 7,768,739 | 0 | 75,124 |
The other directors who continue in office are: Karl C. Krieg; Robert B. Olson; Anthony B. Pickering; and Dennis A. Wintch. Former director Michal D. Cann retired from his position as CEO and director of the Company effective September 30, 2008.
PART II
Item 5. Market for the Registrant’s Common Equity, Related Stockholder Matters and Issuer Purchases of Equity Securities
The Company’s common stock is traded on the Nasdaq Global Select Market System under the symbol “WBCO.”
The Company is aware that blocks of its stock are held in street name by brokerage firms. As a result, the number of shareholders of record does not include the actual number of beneficial owners of the Company’s stock. As of March 6, 2009, the Company’s common stock was held of record by approximately 464 shareholders, a number which does not include beneficial owners who hold shares in “street name.”
The following are the high and low adjusted closing prices for the Company’s stock as reported by the Nasdaq National Market System and the quarterly cash dividends paid by the Company to its shareholders on a per share basis during 2008 and 2007, as adjusted for stock dividends and splits:
| | | | | | | | | | | | |
| | | | | 2008 | | | | | | 2007 | | |
| | | High | | Low | | Dividend | | High | | Low | | Dividend |
| First quarter | $ | 16.99 | $ | 13.47 | $ | .060 | $ | 15.12 | $ | 15.12 | $ | 0.05 |
| Second quarter | | 17.73 | | 7.90 | | .065 | | 15.99 | | 15.02 | | 0.06 |
| Third quarter | | 10.61 | | 6.85 | | .065 | | 20.24 | | 13.60 | | 0.06 |
| Fourth quarter | | 9.19 | | 7.00 | | .065 | | 20.94 | | 14.90 | | 0.06 |
The Company’s dividend policy requires the Board of Directors to review the Company’s financial performance, capital adequacy, cash resources, regulatory restrictions, economic conditions and other factors, and if such review is favorable, the Board may declare and pay dividends. For 1997 and prior years, cash dividends were paid on an annual basis. After completion of the initial public offering in 1998, the Company has paid cash dividends on a quarterly basis. The ability of the Company to pay dividends will depend on the profitability of the Bank, the need to retain or increase capital, and the dividend restrictions imposed upon the Bank by applicable banking law. Although the Company anticipates payment of a regular quarterly cash dividend, future dividends are subject to these limitations and to the discretion of the Board of Directors, and could be reduced or eliminated.
13
Equity Compensation Plan Information
The following table sets forth information about equity compensation plans that provide for the award of securities or the grant of options to purchase securities to employees and directors of the Company its subsidiaries and its predecessors by merger that were in effect at December 31, 2008.
| | | | |
| | Equity Compensation Plan Information |
| | (A) | | (B) | (C) |
| | | | | Number of securities |
| | | | Weighted | remaining available for |
| | Number of securities | | average exercise | future issuance under |
| | to be issued upon | | price of | equity compensation |
| | exercise of | | outstanding | plans excluding |
| | outstanding options, | | options, warrants | securities reflected in |
| Plan category | warrants and rights | | and rights | column (A) |
Equity compensation plans approved by
security holders | | | | |
| 1998 stock option and restricted award plan(1) | 64,777 | $ | 4.85 | — |
| 2005 stock incentive plan(2) | 222,625 | $ | 10.04 | 581,152 |
| Total | | | | |
| (1) | The 1998 plan was terminated as to further grants upon the adoption of the Company’s 2005 stock incentive plan. |
| (2) | The 2005 plan is currently the only stock award plan available for new grants. |
Sales of Unregistered Securities
The Company had no sales of unregistered securities during the fourth quarter of 2008.
Purchases of Equity Securities
The Company had no purchases of its equity securities during the fourth quarter of 2008.
14
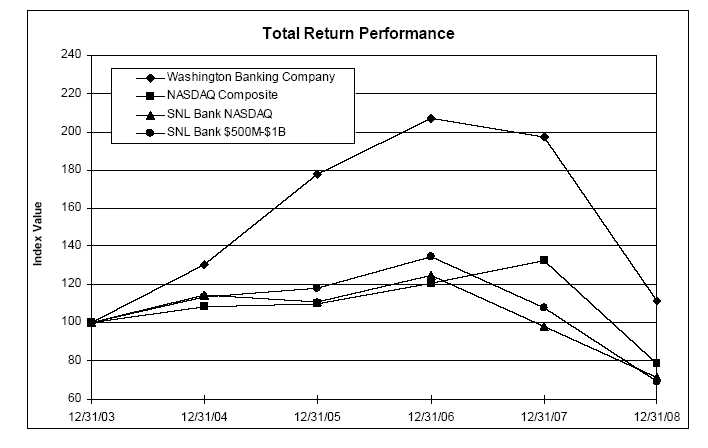
Five-Year Stock Performance Graph
The following chart compares the yearly percentage change in the cumulative shareholder return on the Company’s common stock during the five years ended December 31, 2008, with (1) the Total Return for the NASDAQ Stock Market Index (which is a broad nationally recognized index of stock performance by companies traded on the NASDAQ Market System and the NASDAQ Small Cap Market) (2) the Total Return Index for SNL Bank NASDAQ (comprised of banks listed on the NASDAQ National Market System) and (3) Total Return for SNL Bank $500M to $1 Billion Bank Index (comprised of publicly-traded banks located in the U.S. with total assets between $500 million and $1billion).
The graph assumes $100 was invested on December 31, 2003, in the Company’s common stock and the comparison groups and assumes the reinvestment of all cash dividends prior to any tax effect and retention of all stock dividends.
| | | | | | |
| | | | Period Ending | | |
| Index | 12/31/03 | 12/31/04 | 12/31/05 | 12/31/06 | 12/31/07 | 12/31/08 |
| Washington Banking Company | 100.00 | 130.64 | 177.52 | 206.92 | 197.44 | 111.30 |
| NASDAQ Composite | 100.00 | 108.59 | 110.08 | 120.56 | 132.39 | 78.72 |
| SNL Bank NASDAQ | 100.00 | 114.61 | 111.12 | 124.75 | 97.94 | 71.13 |
| SNL Bank $500M-$1B | 100.00 | 113.32 | 118.18 | 134.41 | 107.71 | 69.02 |
| |
| Source: SNL Financial LC, | | | | | | |
| Charlottesville, VA (434) 977-1600 © 2009 | | | | | |
15
Item 6. Selected Financial Data
Consolidated Five-Year Statements of Operations and Selected Financial Data
The following table sets forth selected audited consolidated financial information and certain financial ratios for the Company. This information is derived in part from the audited consolidated financial statements and notes thereto of the Company set forth in Item 8-Financial Statements and Supplementary Dataand should be read in conjunction with the Company’s financial statements and the management discussion set forth in Item 7-Management’s Discussion and Analysis of Financial Condition and Results of Operations.
| | | | | | | | | | |
| | | | | Years Ended December 31 | | | |
| (Dollars in thousands, except per share amounts) | | 2008 | | 2007 | | 2006 | | 2005 | | 2004 |
| Operating data: | | | | | | | | | | |
| Total interest income | $ | 58,782 | $ | 62,368 | $ | 55,185 | $ | 45,582 | $ | 38,319 |
| Total interest expense | | 20,834 | | 24,810 | | 18,441 | | 11,566 | | 8,837 |
| Net interest income | | 37,948 | | 37,558 | | 36,744 | | 34,016 | | 29,482 |
| Provision for loan losses | | (5,050) | | (3,000) | | (2,675) | | (2,250) | | (3,500) |
| Net interest income after provision | | 32,898 | | 34,558 | | 34,069 | | 31,766 | | 25,982 |
| Service charges on deposits | | 2,987 | | 3,135 | | 3,296 | | 3,150 | | 2,986 |
| Other noninterest income | | 3,899 | | 4,355 | | 3,954 | | 4,357 | | 3,830 |
| Total noninterest income | | 6,886 | | 7,490 | | 7,250 | | 7,507 | | 6,816 |
| Noninterest expense | | 27,523 | | 28,471 | | 27,530 | | 25,225 | | 23,267 |
| Income before income taxes | | 12,261 | | 13,577 | | 13,789 | | 14,048 | | 9,531 |
| Provision for income taxes | | 3,929 | | 4,179 | | 4,298 | | 4,580 | | 2,985 |
| Loss from discontinued operations, net of tax | | — | | — | | — | | — | | (370) |
| Net income | $ | 8,332 | $ | 9,398 | $ | 9,491 | $ | 9,468 | $ | 6,176 |
| |
| Average number of shares outstanding, basic | | 9,465,000 | | 9,365,000 | | 9,217,000 | | 9,098,000 | | 9,012,000 |
| Average number of shares outstanding, diluted | | 9,513,000 | | 9,493,000 | | 9,490,000 | | 9,428,000 | | 9,326,000 |
| |
| Per share data(1): | | | | | | | | | | |
| Net income per share, basic | $ | 0.88 | $ | 1.00 | $ | 1.03 | $ | 1.04 | $ | 0.69 |
| Net income per share, diluted | | 0.88 | | 0.99 | | 1.00 | | 1.00 | | 0.66 |
| Book value per share | | 8.47 | | 7.78 | | 7.07 | | 6.27 | | 5.48 |
| Dividends per share | | 0.26 | | 0.23 | | 0.20 | | 0.18 | | 0.18 |
| |
| Balance sheet data: | | | | | | | | | | |
| Total assets | $ | 899,631 | $ | 882,289 | $ | 794,545 | $ | 725,976 | $ | 657,724 |
| Federal funds sold | | — | | — | | — | | 21,095 | | — |
| Loans receivable | | 823,068 | | 805,862 | | 719,580 | | 630,258 | | 579,980 |
| Allowance for loan losses | | 12,250 | | 11,126 | | 10,048 | | 8,810 | | 7,903 |
| Other real estate owned | | 2,226 | | 1,440 | | 363 | | — | | 1,222 |
| Deposits | | 747,159 | | 758,354 | | 703,767 | | 637,489 | | 563,001 |
| Overnight borrowings | | 11,640 | | 20,500 | | 3,075 | | — | | 22,000 |
| Other borrowed funds | | 30,000 | | — | | — | | 10,000 | | 5,000 |
| Junior subordinated debentures | | 25,774 | | 25,774 | | 15,007 | | 15,007 | | 15,007 |
| Shareholders’ equity | | 80,560 | | 73,570 | | 66,393 | | 57,849 | | 49,591 |
| |
| Selected performance ratios: | | | | | | | | | | |
| Return on average assets | | 0.94% | | 1.12% | | 1.25% | | 1.37% | | 0.98% |
| Return on average equity | | 10.82% | | 13.53% | | 15.36% | | 17.87% | | 13.37% |
| Net interest margin (fully tax-equivalent) | | 4.60% | | 4.89% | | 5.25% | | 5.33% | | 5.12% |
| Net interest spread | | 4.18% | | 4.32% | | 4.73% | | 4.99% | | 4.86% |
| Noninterest expense to average assets | | 3.09% | | 3.40% | | 3.64% | | 3.64% | | 3.71% |
| Efficiency ratio (fully tax-equivalent) | | 60.90% | | 62.31% | | 62.07% | | 60.37% | | 63.55% |
| Dividend payout ratio | | 29.01% | | 23.07% | | 19.58% | | 16.97% | | 23.24% |
| |
| Asset quality ratios: | | | | | | | | | | |
| Nonperforming loans to period-end loans | | 0.23% | | 0.35% | | 0.51% | | 0.34% | | 0.48% |
| Allowance for loan losses to period-end loans | | 1.49% | | 1.38% | | 1.40% | | 1.40% | | 1.36% |
| Allowance for loan losses to nonperforming loans | | 638.67% | | 391.90% | | 276.19% | | 408.06% | | 281.05% |
| Nonperforming assets to total assets | | 0.46% | | 0.48% | | 0.50% | | 0.30% | | 0.61% |
| Net loan charge-offs to average loans outstanding | | 0.48% | | 0.25% | | 0.20% | | 0.22% | | 0.32% |
| (1) | Per share data adjusted for the 5-for-4 stock split distributed on September 6, 2006, 4-for-3 stock split distributed on May 17, 2005 and 15% stock dividend distributed February 26, 2004. |
16
| | | | | | | | | |
| Years Ended December 31 |
| (Continued) | | | | | | | | | |
| 2008 | | 2007 | | 2006 | | 2005 | | 2004 |
| Total risk-based capital | 13.23% | | 12.45% | | 11.52% | | 11.52% | | 11.40% |
| Tier 1 risk-based capital | 11.98% | | 11.14% | | 10.27% | | 10.28% | | 10.15% |
| Leverage ratio | 11.68% | | 11.29% | | 10.24% | | 10.26% | | 9.87% |
| Average equity to average assets | 8.65% | | 8.30% | | 8.17% | | 7.65% | | 7.36% |
| |
| Other data: | | | | | | | | | |
| Number of banking offices | 19 | | 20 | | 20 | | 19 | | 18 |
| Number of full time equivalent employees | 258 | | 283 | | 324 | | 296 | | 289 |
Summary of Quarterly Financial Information
See Item 8-Financial Statements and Supplementary Data, Note 21- Selected Quarterly Financial Data (Unaudited) in the consolidated financial statements.
Item 7. Management’s Discussion and Analysis of Financial Condition and Results of Operations
The following discussion and analysis should be read in conjunction with Item 8-Financial Statements and Supplementary Data.
Recent Developments and Executive Overview
Recent Developments: On January 16, 2009, in exchange for an aggregate purchase price of $26.4 million, the Company issued and sold to the United States Department of the Treasury pursuant to the Trouble Asset Relief Program Capital Purchase Program the following: (i) 26,380 shares of the Company’s newly designated Fixed Rate Cumulative Perpetual Preferred Stock, Series A, no par value per share, and liquidation preference $1,000 per share ($26.4 million liquidation preference in the aggregate) and (ii) a warrant to purchase up to 492,164 shares of the Company’s common stock, no par value per share, at an exercise price of $8.04 per share, subject to certain anti-dilution and other adjustments. The Warrant may be exercised for up to ten years after it is issued.
In connection with the issuance and sale of the Company’s securities, the Company entered into a Letter Agreement including the Securities Purchase Agreement — Standard Terms, dated January 16, 2009, with the United States Department of the Treasury (the “Agreement”). The Agreement contains limitations on the payment of quarterly cash dividends on the Company’s common stock in excess of $0.065 per share, and on the Company’s ability to repurchase its common stock. The Agreement also grants the holders of the Series A Preferred Stock, the Warrant and the common stock to be issued under the Warrant registration rights, and subjects the Company to executive compensation limitations included in the Emergency Economic Stabilization Act of 2008. Participants in the TARP Capital Purchase Program are required to have in place limitations on the compensation of Senior Executive Officers.
The Series A Preferred Stock will bear cumulative dividends at a rate of 5% per annum for the first five years and 9% per annum thereafter, in each case, applied to the $1,000 per share liquidation preference, but will only be paid when, as and if declared by the Company’s Board of Directors out of funds legally available. The Series A Preferred Stock has no maturity date and ranks senior to the Company’s common stock with respect to the payment of dividends and distributions and amounts payable upon liquidation, dissolution and winding up of the Company.
On January 13, 2009, the Company’s shareholders approved an amendment to the Company’s Restated Articles of Incorporation setting the specific terms and conditions of the preferred stock and designating such shares as the Series A Preferred Stock. The amendment was filed with the Secretary of State of the State of Washington on January 13, 2009.
On February 27, 2009, the FDIC announced its board of directors took action to strengthen the Deposit Insurance Fund by proposing a special assessment on insured institutions of 20 basis points (20 cents per $100 of deposits). The assessment is to be collected on September 30, 2009. The FDIC board of directors is also permitted to impose an emergency special assessment of 10 basis points (10 cents per $100 of deposits) after June 30, 2009, if necessary to maintain public confidence in federal deposit insurance. Currently the assessment is under review and has not been finalized. However, if the Company is required to pay the assessment in its current form, it will be approximately $1.6 million.
17
Executive Overview:2008 was a unique year for the Company. The Company was relatively unaffected by the slowdown in the housing industry and produced some of the strongest operating results in the banking industry. Results included:
| • | Net income per diluted share was $0.88 in 2008 compared to $0.99 in 2007. Net income was directly impacted by the Company’s decision to increase the provision for loan losses in response to the deterioration on the loan portfolio.
|
| • | Return on average equity was 10.82% in 2008 compared to 13.53% in 2007.
|
| • | Allowance for loan losses to loans increased to 1.49% of total loans in 2008 from 1.38% of total loans in 2007.
|
| • | Net charge-offs to average loans was 0.48% in 2008 compared to 0.25% in 2007.
|
| • | Nonperforming assets to total assets was 0.46% in 2008 compared to 0.48% in 2007.
|
The Company also dealt with some challenges in the past year including:
| • | The Company’s termination of the merger agreement with Frontier Financial Corporation during the second quarter of 2008 and the related impact on the Company operations and management. On November 25, 2008, the Company and Frontier Financial Corporation settled all legal claims concerning the terminated merger agreement, whereby neither company will make any payment under the arrangement.
|
| • | The Company’s net interest margin, on a tax-equivalent basis, compressed during 2008 to 4.60% compared to 4.89% in 2007. This decrease was due to the impact of the rapid reduction in short term interest rates during 2008. |
Summary of Critical Accounting Policies
Significant accounting policies are described in the consolidated financial statements in Note 1- Summary of Significant Accounting Policies. Several of these accounting policies require management to make difficult, subjective or complex judgments or estimates. Management believes that the following accounting policies could be considered critical under the SEC’s definition.
Allowance for Loan Losses:The allowance for loan losses is established to absorb known and inherent losses attributable to loans outstanding. The adequacy of the allowance is monitored on a regular basis and is based on management’s evaluation of numerous quantitative and qualitative factors. Quantitative factors include our historical loss experience, delinquency and charge-off trends, estimates of, and changes in, collateral values, changes in risk ratings on loans and other factors. Qualitative factors include the general economic environment in our markets and, in particular, the state of the real estate market and specific relevant industries. Other qualitative factors that are considered in our methodology include, size and complexity of individual loans in relation to the lending officer’s background and experience levels, loan structure, extent and nature of waivers of existing loan policies, and pace of loan portfolio growth. As the Company adds new products, increase the co mplexity of the loan portfolio, and expand its geographic coverage, the Company intends to enhance and adapt its methodology to keep pace with the size and complexity of the loan portfolio. Changes in any of the above factors could have a significant effect on the calculation of the allowance for credit losses in any given period. The Company believes that its systematic methodology continues to be appropriate given our size and level of complexity.
Stock-based Compensation:Effective January 1, 2006, the Company adopted the provisions of Statement of Financial Accounting Standards (“SFAS”) No. 123R,Share-Based Payment, a revision to the previously issued guidance on accounting for stock options and other forms of equity-based compensation. The Company recognizes in the income statement the grant-date fair value of stock awards issued to employees over the employees’ requisite service period (generally the vesting period). The fair value of each stock option grant is estimated as of the grant date using the Black-Scholes option-pricing model. Significant variables are used to estimate the fair value of the stock options granted include volatility, forfeiture rate and expected life. The Company’s assumptions utilized at the time of grant impact the fair value of the stock option calculated under the Black-Scholes methodology, and ultimately, the expense that will be recognized over the life of the stock award.
Results of Operations Overview
For the year ended December 31, 2008, net income was $8.3 million, or $0.88 per diluted share, an 11% decrease compared to 2007. The decrease in net income was principally attributable to increased provision for loan losses and decreased noninterest income, partially offset by decreased noninterest expense. On May 29, 2008 the Company terminated the planned merger with Frontier Financial Corporation. The Company incurred merger related expense during the first six months of 2008 and the last three months of 2007.
18
Additionally in 2008, the Company incurred employee separation expense related to the retirement of the Company’s CEO. For the year ended December 31, 2007, net income was $9.4 million, or $0.99 per diluted share compared to $9.5 million or $1.00 per diluted share in 2006. The decrease in net income was principally attributable to increase in noninterest expense and provision for loan losses, partially offset by increases in net interest and noninterest income.
Net Interest Income:One of the Company’s key sources of earnings is net interest income. To make it easier to compare results among several periods and the yields on various types of earning assets (some of which are taxable and others which are not), net interest income is presented in this discussion on a “taxable-equivalent basis” (i.e., as if it were all taxable at the same rate). There are several factors that affect net interest income including:
• | The volume, pricing, mix and maturity of interest-earning assets and interest-bearing liabilities; |
• | The volume of free funds (consisting of noninterest-bearing deposits and other liabilities and shareholders’ equity); |
• | The volume of noninterest-earning assets, market interest rate fluctuations, and asset quality. |
The following tables set forth various components of the balance sheet that affect interest income and expense, and their respective yields or rates:
Net Interest Income Analysis as of:
| | | | | | | | | | | | | | | |
| | | Years Ended December 31 |
| | | | | 2008 | | | | | 2007 | | | | | 2006 | |
| | | Average | | Interest | Average | | Average | | Interest | Average | | Average | | Interest | Average |
| (Dollars in thousands) | | balance | | earned/paid | Yield | | balance | | earned/paid | yield | | balance | | earned/paid | yield |
| Assets | | | | | | | | | | | | | | | |
| Loans(1) (2) | $ | 819,468 | $ | 58,607 | 7.13% | $ | 759,242 | $ | 61,911 | 8.15% | $ | 682,939 | $ | 54,450 | 7.97% |
| Federal funds sold | | 2,760 | | 28 | 1.02% | | 2,395 | | 121 | 5.06% | | 2,686 | | 135 | 5.02% |
| Interest-bearing cash | | 408 | | 8 | 1.94% | | 964 | | 52 | 5.39% | | 844 | | 43 | 5.10% |
| Investments: | | | | | | | | | | | | | | | |
| Taxable | | 9,522 | | 397 | 4.16% | | 12,198 | | 547 | 4.48% | | 12,618 | | 457 | 3.62% |
| Non-taxable(2) | | 5,298 | | 301 | 5.66% | | 6,497 | | 384 | 5.91% | | 7,306 | | 458 | 6.27% |
| Interest-earning assets | | 837,456 | | 59,341 | 7.07% | | 781,296 | | 63,015 | 8.07% | | 706,393 | | 55,543 | 7.86% |
| Noninterest-earning assets | | 53,133 | | | | | 55,442 | | | | | 50,384 | | | |
| Total assets | $ | 890,589 | | | | $ | 836,738 | | | | $ | 756,777 | | | |
| |
| Liabilities and | | | | | | | | | | | | | | | |
| Shareholders’ Equity | | | | | | | | | | | | | | | |
| Deposits: | | | | | | | | | | | | | | | |
| Interest-bearing demand | | | | | | | | | | | | | | | |
| and money market | $ | 262,959 | | 4,070 | 1.54% | $ | 268,817 | $ | 7,049 | 2.62% | $ | 231,316 | $ | 4,521 | 1.95% |
| Saving deposits | | 41,662 | | 167 | 0.40% | | 46,152 | | 311 | 0.67% | | 55,139 | | 432 | 0.78% |
| Time deposits | | 352,137 | | 14,205 | 4.02% | | 316,308 | | 15,309 | 4.84% | | 276,211 | | 11,604 | 4.20% |
| Interest-bearing deposits | | 656,758 | | 18,442 | 2.80% | | 631,277 | | 22,669 | 3.59% | | 562,666 | | 16,557 | 2.94% |
| Fed funds purchased | | 12,503 | | 352 | 2.80% | | 4,480 | | 242 | 5.40% | | 6,850 | | 362 | 5.29% |
| Junior subordinated | | 25,774 | | 1,254 | 4.85% | | 23,061 | | 1,762 | 7.64% | | 15,007 | | 1,337 | 8.91% |
| debentures | | | | | | | | | | | | | | | |
| Other interest-bearing | | | | | | | | | | | | | | | |
| liabilities | | 23,060 | | 786 | 3.40% | | 2,493 | | 137 | 5.49% | | 4,183 | | 185 | 4.41% |
| Interest-bearing liabilities | | 718,095 | | 20,834 | 2.89% | | 661,311 | | 24,810 | 3.75% | | 588,706 | | 18,441 | 3.13% |
| Noninterest-bearing deposits | | 91,891 | | | | | 100,830 | | | | | 100,267 | | | |
| Other noninterest-bearing | | | | | | | | | | | | | | | |
| liabilities | | 3,605 | | | | | 5,109 | | | | | 6,004 | | | |
| Total liabilities | | 813,591 | | | | | 767,250 | | | | | 694,977 | | | |
| Shareholders’ equity | | 76,998 | | | | | 69,488 | | | | | 61,800 | | | |
| Total liabilities and | | | | | | | | | | | | | | | |
| shareholders’ equity | $ | 890,589 | | | | $ | 836,738 | | | | | $ 756,777 | | | |
| Net interest income(2) | | | $ | 38,507 | | | | $ | 38,205 | | | | $ | 37,102 | |
| Net interest spread | | | | | 4.18% | | | | | 4.32% | | | | | 4.73% |
| Net interest margin(2) | | | | | 4.60% | | | | | 4.89% | | | | | 5.25 % |
19
(1) | Of this amount, loan fees accounted for $2,690, $2,406, and $2,001, for the years ended December 31, 2008, 2007 and 2006, respectively. Loan totals include nonaccrual loans. |
(2) | Interest income on non-taxable assets is presented on a fully tax-equivalent basis using a federal statutory rate of 35.0%, 35.0% and 34.4%, for the years ended December 31, 2008, 2007 and 2006, respectively. These adjustments were $559, $647, and $358, for the years ended December 31, 2008, 2007 and 2006, respectively. |
Net interest income on a taxable-equivalent basis totaled $38.5 million at December 31, 2008 compared with $38.2 million in 2007. Changes in net interest income during the year were principally caused by an increase in average interest-earning assets due to strong loan growth, coupled with a decrease in rates paid on average interest-bearing liabilities.
The Company’s yields were impacted in 2008 due to the changing interest rate environment. The yield on interest-earning assets was 7.07% for 2008, a decrease of 100 basis points as compared to the same period in 2007. This decrease is primarily attributable to a decrease in the rates charged on new loans and the repricing of variable rate loans. Variable rate loans represented approximately 67.7% of the Company’s total loan portfolio at December 31, 2008; the large majority of these variable rate loans did not have interest rate floors in place during 2008. The Company is currently implementing interest rate floors on its variable rate loans when they renew. The yield on interest-bearing liabilities was 2.89%, a decrease of 86 basis points as compared to the same period in 2007. This decrease is primarily attributable to a decrease in rates offered on interest-bearing deposits, lower interest rates on short term borrowings, and the full impact of the Company’s refinancing of junior subordinated debentures. Additional information concerning the refinancing of the junior subordinated debentures can be found in the borrowing section of Item 7-Management’s Discussion and Analysis of Financial Condition and Results of Operations.
Net interest margin (net interest income as a percentage of average interest-earning assets) on a taxable-equivalent basis was 4.60% for 2008, a decrease of 29 basis points as compared to the same period in 2007. The decrease in net interest margin in 2008 resulted from the increase in average interest-earning assets, coupled with, minimal increase in net interest income.
Net interest income on a tax-equivalent basis totaled $38.2 million at December 31, 2007 compared to $37.1 million in 2006. Changes in net interest income were principally due to an increase in average interest-earning assets due to strong loan growth and higher yields on interest-earning assets.
The yield on interest-earning assets increased 21 basis points to 8.07% at December 31, 2007. This increase was primarily attributable to a increase in the rates charged on new loans and the repricing of variable rate loans. Pricing pressure caused the yield on interest-bearing liabilities to increase 62 basis points during 2007, which was exacerbated by the change in deposit mix towards higher cost time deposit and money market products. As a result, the interest rate spread contracted 41 basis points in 2007 to end the year at 4.32% .
Net interest margin on a taxable-equivalent basis was 4.89% for 2007, a decrease of 36 basis points as compared to the same period in 2006. The decrease in net interest margin in 2007 resulted from a $74.9 million increase in average interest-earning assets, coupled with slower growth in net interest income.
The following table details the effects of the interest changes over the last two years:
| | | | | | | | | | | | |
| | Interest Rate & Volume Analysis |
| | | | | |
| | | 2008 compared to 2007 | | 2007 compared to 2006 |
| | | Increase (decrease) due to(2) | | Increase (decrease) due to(2) |
| (Dollars in thousands) | | Volume | | Rate | | Total | | Volume | | Rate | | Total |
| Loans(1) (3) | $ | 5,699 | $ | (9,003) | $ | (3,304) | $ | 6,198 | $ | 1,263 | $ | 7,461 |
| Federal funds sold | | 22 | | (115) | | (93) | | (15) | | 1 | | (14) |
| Interest-earning cash | | (21) | | (23) | | (44) | | 6 | | 3 | | 9 |
| Securities(1) | | (179) | | (54) | | (233) | | (63) | | 79 | | 16 |
| Total interest income | $ | 5,521 | $ | (9,195) | $ | (3,674) | $ | 6,126 | $ | 1,346 | $ | 7,472 |
| Interest-bearing demand deposits | $ | (150) | $ | (2,829) | $ | (2,979) | $ | 814 | $ | 1,714 | $ | 2,528 |
| Savings deposits | | (28) | | (116) | | (144) | | (65) | | (56) | | (121) |
| Time deposits | | 2,252 | | (3,356) | | (1,104) | | 1,810 | | 1,895 | | 3,705 |
| Fed funds purchased | | 150 | | (40) | | 110 | | (128) | | 7 | | (121) |
| Junior subordinated debentures | | 242 | | (750) | | (508) | | 579 | | (153) | | 426 |
| Other borrowings | | 680 | | (31) | | 649 | | (121) | | 73 | | (48) |
| Total interest expense | $ | 3,146 | $ | (7,122) | $ | (3,976) | $ | 2,889 | $ | 3,480 | $ | 6,369 |
20
| (1) | Interest income on non-taxable investments is presented on a fully tax-equivalent basis using the federal statutory rate of 35.0%, 35.0% and 34.4%, for the years ended December 31, 2008, 2007 and 2006, respectively. |
| (2) | The changes attributable to the combined effect of volume and interest rates have been allocated proportionately. |
| (3) | Interest income previously accrued on nonaccrual loans is reversed in the period the loan is placed on nonaccrual status. |
Provision for Loan Losses:The provision for loan losses is highly dependent on the Company’s ability to manage asset quality and control the level of net charge-offs through prudent underwriting standards. In addition, decline in general economic conditions could increase future provisions for loan loss and materially impact the Company’s net income. For further discussion of the Company’s asset quality see the Credit Risks and Asset Quality section found in Item 7-Management’s Discussion and Analysis of Financial Condition and Results of Operations.
In 2008, the provision for loan losses increased 68% to $5.1 million, compared with $3.0 million in 2007. Changes in the provision were due to higher net charge-offs of $3.9 million in 2008, compared with $1.9 million in 2007 and continued loan portfolio growth and internal downgrades of credit within the portfolio as compared to 2007. At year-end 2008, the allowance for loan losses as a percent of total loans was 1.49% as compared to 1.38% in 2007.
In 2007, the provision for loan losses increased 12% to $3.0 million, compared with $2.7 million in 2006. Changes in the provision were due to higher net charge-offs of $1.9 million in 2007, compared with $1.4 million in 2006 and continued loan portfolio growth as compared to 2006. At year-end 2007, the allowance for loan losses as a percent of total loans was 1.38% as compared to 1.40% in 2006.
Noninterest Income:Noninterest income remains a key focus of the Company. The Company has focused on diversifying the noninterest income mix. The diversification of the noninterest income mix resulted primarily from the introduction of nondeposit investment products consisting primarily of annuity sales, and investment service fees, and income from the Company’s Bank Owned Life Insurance (“BOLI”). The following table presents the key components of noninterest income:
| | | | | | | | | | |
| | | Noninterest Income as of: |
| |
| | | Years Ended December 31 | | Change | | Change |
| (Dollars in thousands) | | 2008 | | 2007 | | 2006 | | 2008 vs. 2007 | | 2007 vs. 2006 |
| Service charges and fees | $ | 2,987 | $ | 3,135 | $ | 3,296 | $ | ( 148) | $ | ( 161) |
| Electronic banking income | | 1,333 | | 1,252 | | 1,052 | | 81 | | 200 |
| Investment products | | 338 | | 364 | | 344 | | ( 26) | | 20 |
| Bank owned life insurance | | 306 | | 587 | | 372 | | ( 281) | | 215 |
| Income from sale of SBA loans | | 259 | | 490 | | 597 | | ( 231) | | (107) |
| Income from sale of loans | | 223 | | 667 | | 709 | | ( 444) | | ( 42) |
| Other income | | 1,440 | | 995 | | 880 | | 445 | | 115 |
| Total noninterest expense | $ | 6,886 | $ | 7,490 | $ | 7,250 | $ | (604) | $ | 240 |
The changes in noninterest income in 2008 compared to 2007 were related to the following areas:
| • | Service charges and fees decrease is principally attributable to the decreased volume of transaction deposit accounts. |
| • | Electronic banking income consists primarily of ATM service charges. The increase was principally due to increased ATM transaction volume. Income from electronic banking is likely to decrease in 2009 as consumers reduce nonessential expenditures. |
| • | BOLI income in 2008 was impacted by the performance of the mortgage backed securities market. During the third quarter of 2008, the Company renegotiated with the insurance carrier and investment manager to invest the BOLI assets into more stable investments with a more consistent yield. |
| • | Income from the sale of SBA loans decreased due to lower volumes of SBA loan originations. Additionally, the Company did not sell SBA loans during the third and fourth quarters of 2008 due to unfavorable premiums for SBA loans in the secondary financial market. |
21
| • | Income from the sale of loans decreased due to lower volumes of loan originations. The level of loan originations was impacted by a slow down in lending on 1-4 family homes during the first nine months of 2008. Additionally, loan originations for the Company were impacted by the terminated merger with Frontier Financial Corporation. Under the proposed merger, the department originating real estate loans for sale was to be closed at the time of the merger. |
| • | Other noninterest income principally increased in 2008 due to a non-recurring loan fee adjustment of $342,000. |
The changes in noninterest income in 2007 compared to 2006 were related to the following areas:
| • | Service charges and fees decrease is principally attributable to the decreased volume of transaction deposit accounts. |
| • | Electronic banking income consists primarily of ATM service charges. The increase was principally due to increased ATM transaction volume. |
| • | BOLI income in 2007 increased due to the Company adding an additional $5.0 million in BOLI assets. |
| • | Income from sale of SBA loans in 2007 decreased due to lower volumes of SBA loan originations. |
| • | Other noninterest income principally increased in 2007 due to gains on the sale of other real estate owned of approximately $78,000. |
Noninterest Expense:The Company continues to focus on controlling noninterest expenses and addressing long term operating expenses. As a result of improving operating efficiencies, the Company continued to successfully manage noninterest expense in 2008 and 2007.
Recent Developments:In February 2009, the FDIC adopted final rules which increase the assessment rates paid on deposits. 2008 Assessment rates, for well capitalized banks, ranged from $0.05 to $0.07 per $100 deposits annually. Assessment rates for 2009 will range from $0.12 to $0.16 per deposits annually. The Company anticipates its FDIC premiums to double in 2009.
The Company’s efficiency ratio was relatively stable at 60.90% in 2008 as compared to 62.31% in 2007. As detailed in the table below, noninterest expense was directly impacted by one time charges for employee separation expenses and merger related expenses, respectively. The following table presents the key components of noninterest expense:
| | | | | | | | | | |
| | | Noninterest Expense as of: | | |
| |
| | | Years Ended December 31 | | Change | | Change |
| (Dollars in thousands) | | 2008 | | 2007 | | 2006 | | 2008 vs. 2007 | | 2007 vs. 2006 |
| Salaries and benefits | $ | 17,148 | $ | 19,777 | $ | 19,757 | $ | (2,629) | $ | 20 |
| Less: loan origination costs | | (1,775) | | (2,695) | | (2,950) | | 920 | | 255 |
| Net salaries and benefits (as reported) | | 15,373 | | 17,082 | | 16,807 | | (1,709) | | 275 |
| Occupancy expense | | 3,762 | | 3,805 | | 3,596 | | (43) | | 209 |
| Employee separation expense | | 874 | | — | | 575 | | 874 | | (575) |
| Consulting and professional fees | | 794 | | 735 | | 769 | | 59 | | (34) |
| Data processing | | 625 | | 663 | | 479 | | ( 38) | | 184 |
| Office supplies and printing | | 572 | | 558 | | 640 | | 14 | | (82) |
| FDIC premiums | | 499 | | 219 | | 81 | | 280 | | 138 |
| Merger related expenses | | 266 | | 513 | | — | | ( 247) | | 513 |
| Other | | 4,758 | | 4,896 | | 4,613 | | ( 138) | | 283 |
| Total noninterest expense | $ | 27,523 | $ | 28,471 | $ | 27,560 | $ | (948) | $ | 911 |
The changes in noninterest expenses in 2008 compared to 2007 were related to the following areas:
| • | Salaries and benefits decreased due to the reduction of full time equivalent employees (FTEs). The Company’s number of FTEs decreased to 258 at December 31, 2008 from 283 at year end 2007. A number of those employees left subsequent to the announcement of the proposed merger with Frontier Financial Corporation. However, the Company believes that staffing levels are adequate for continuing operations. |
| • | Employee separation expense in 2008 consists primarily of a one-time charge for the recognition of severance expense involving the retirement of the Company’s former CEO. |
22
| • | Merger related expenses in 2008 consisted of expenses associated with the terminated merger with Frontier Financial Corporation. These expenses were recognized during the first and second quarters of 2008. On November 25, 2008, the parties settled all legal claims concerning the merger agreement, whereby neither company will make any payment under the arrangement. |
| • | The increase in other expenses in 2008 was due primarily to the write down of other real estate owned by $134,000, operational losses of $128,000, and increase in FDIC premiums of $280,000. These increases were offset by overall decreases in other expense categories. |
The changes in noninterest expenses in 2007 compared to 2006 were related to the following areas:
| • | Salaries and benefits were flat due to the Company maintaining employee benefit expenses at 2006 levels and the reduction of full time equivalent employees (FTE’s). The Company’s number of FTE’s decreased to 283 at December 31, 2007 from 324 at year end 2006. However, in December 2006, the Company eliminated twenty positions within the Bank; this reduction in workforce was primarily in back office operations. The expense related to these employee eliminations was recognized under the employee separation expense category in 2006. |
| • | Occupancy expense was $3.8 million in 2007 compared to $3.6 million in 2006. The increase in occupancy expense was primarily due to the addition of new locations. |
| • | There was no employee separation expense recognized in 2007. The expense in 2006 was related to the elimination of twenty employee positions at the end of 2006. |
| • | Data processing expenses increased in 2007 were due primarily to increased electronic processing expenses with the Federal Reserve Bank in association with Check 21 requirements. |
| • | Merger related expenses in 2007 consisted of expenses associated with the proposed merger with Frontier Financial Corporation. These expenses were recognized during the third and fourth quarters of 2007. |
| • | The increase in other expenses was due primarily to a one-time adjustment of $308,000 in net deferred loan costs which were written off on closed loans. In 2007, a review of the Company’s loan system found active amortizing net deferred loan costs on closed loans; the Company’s accounting policy is to recognize all remaining unamortized net deferred loan costs at time of loan payoff. |
Income Tax:The Company’s consolidated effective tax rate, as a percentage of pre-tax income from continuing operations, increased to 32.04%, in 2008 compared to an effective tax rate of 30.78% and 31.17% for 2007 and 2006, respectively. The effective tax rate is lower than the federal statutory rate of 35.00% due to nontaxable income generated from investments in BOLI, tax-exempt municipal bonds and loans. Additionally, the Company’s 2008 and 2007 tax rates reflect a benefit from the New Market Tax Credit Program whereby a subsidiary of the Bank will be awarded approximately $3.1 million in future federal tax credits. The tax benefits related to these credits will be recognized in the same periods that the credits are recognized on the Company’s income tax returns.
Additional information on income taxes is provided in Item 8-Financial Statements and Supplementary Data,Note 9-Income Taxes of the consolidated financial statements.
Financial Condition Overview
In 2008, the Company focused on maintaining its loan portfolio and deposit funding base following the terminated merger with Frontier Financial Corporation. Loans at December 31, 2008 grew 2.1% to $823.1 million compared to $805.9 million at December 31, 2007. Deposits at December 31, 2008 decreased 1.5% to $747.2 million compared to $758.4 million at December 31, 2007. Shareholders’ equity increased $7.0 million to $80.6 million, with a book value of $8.47 per share at December 31, 2008. The Company’s ability to sustain continued loan and deposit growth is dependent on many factors, including the effects of competition, economic conditions, retention of key personnel and valued customers, and the Company’s ability to close loans.
Investment Securities:The composition of the Company’s investment portfolio reflects management’s investment strategy of maintaining an appropriate level of liquidity while providing a relatively stable source of investment income. The investment securities portfolio mitigates interest rate risk inherent in the loan portfolio, while providing a vehicle for the investment of available funds and a source of liquidity.
23
In 2008, total investment securities increased $4.0 million compared to 2007. The increase was a result of the Company actively adding investment securities during the fourth quarter of 2008. During 2007, total investment securities decreased $3.0 million compared to 2006. The decrease was a result of the maturity of investment securities that were not replaced due to the low rate environment coupled with an anticipated increase in loan demand.
The Company’s investment portfolio mix, based upon market value, is outlined in the table below:
Investment Portfolio as of: |
| | | |
| | | Years Ended December 31 |
| (Dollars in thousands) | | 2008 | | 2007 | | 2006 |
| |
| U.S. government agency securities | $ | 9,737 | $ | 8,537 | $ | 9,872 |
| Pass-through securities | | 40 | | 78 | | 101 |
| Corporate obligations | | 1,044 | | — | | — |
| State & political subdivisions | | 6,977 | | 5,217 | | 6,817 |
| Total(1) | $ | 17,798 | $ | 13,832 | $ | 16,790 |
| |
| (1)No investment in aggregate, to a single issuer, exceeds 10% of shareholders’ equity. | | | | | |
The average contractual life of the Company’s investment portfolio in 2008 increased to 5.0 years from 4.4 years in 2007. The following table further details the Company’s investment portfolio, based upon market value at December 31, 2008. Additional information about the investment portfolio is provided in Item 8-Financial Statements and Supplementary Data,Note 3-Investment Securities of the consolidated financial statements.
| | | Investment Portfolio Maturities and Average Yield |
| | | | | | | |
| | | | | December 31, 2008 | | |
| | | Within 1 | | 1-5 | | 5-10 | | Over 10 | | |
| (Dollars in thousands) | | year | | years | | years | | years | | Total |
| U.S. government agency securities | | | | | | | | | | |
| Balance | $ | 2,011 | $ | 7,726 | $ | — | $ | — | $ | 9,737 |
| Weighted average yield | | 5.01% | | 4.44% | | 0.00% | | 0.00% | | 4.72% |
| Pass-through securities | | | | | | | | | | |
| Balance | | 40 | | — | | — | | — | | 40 |
| Weighted average yield | | 3.63% | | 0.00% | | 0.00% | | 0.00% | | 3.63% |
| Corporate securities | | | | | | | | | | |
| Balance | | — | | 1,044 | | — | | — | | 1,044 |
| Weighted average yield | | 0.00% | | 3.10% | | 0.00% | | 0.00% | | 3.10% |
| State and political subdivisions | | | | | | | | | | |
| Balance | | 1,099 | | 3,590 | | 1,243 | | 1,045 | | 6,977 |
| Weighted average yield | | 3.96% | | 4.34% | | 3.72% | | 4.67% | | 4.17% |
| Total balance | $ | 3,150 | $ | 12,360 | $ | 1,243 | $ | 1,045 | $ | 17,798 |
| Weighted average yield | | 4.20% | | 3.96% | | 3.72% | | 4.67% | | 3.32% |
Loans:Interest and fees earned on the Company’s loan portfolio is the primary source of revenue. In 2008, loans, excluding net deferred loan costs, increased 2.1% or $16.9 million to $820.4 million compared to $803.5 million in 2007. In 2008, commercial real estate loans were the primary source of growth, adding an additional $30.8 million in loans. This increase was offset by decreases in the Company commercial and consumer loan portfolios. The Company attempts to balance the diversity of its portfolio, believing that this provides a good means of minimizing risk. Active portfolio management has resulted in solid loan growth and a diversified portfolio that is not heavily concentrated in any one industry or in any one community.
24
| | | | | | | | | | | | | | | | | | | | |
| The following table further details the loan portfolio: | | | | | | | | | | | | | | |
| |
| | | Loan Portfolio Composition as of: |
| |
| | | December 31 |
| (Dollars in thousands) | | 2008 | | 2007 | | 2006 | | 2005 | | 2004 |
| | | | | | | % of | | | % of | | | % of | | | % of |
| | | Balance | total | | Balance | total | | Balance | total | | Balance | total | | Balance | total |
| Commercial | $ | 94,522 | | 11.5% | $ | 102,284 | | 12.7% | $ | 82,990 | | 11.6% | $ | 78,723 | | 12.6% | $ | 80,927 | | 14.0% |
| Real estate mortgages: | | | | | | | | | | | | | | | | | | | | |
| One-to-four family residential | | 58,099 | | 7.1% | | 56,636 | | 7.0% | | 54,554 | | 7.6% | | 45,326 | | 7.2% | | 46,242 | | 8.0% |
| Commercial | | 327,704 | | 40.0% | | 296,902 | | 37.0% | | 249,109 | | 34.7% | | 218,260 | | 34.7% | | 173,280 | | 29.9% |
| Total real estate mortgages | | 385,803 | | 47.1% | | 353,538 | | 44.0% | | 303,663 | | 42.3% | | 263,586 | | 41.9% | | 219,522 | | 37.9% |
| |
| Real estate construction | | 145,423 | | 17.7% | | 146,647 | | 18.3% | | 142,436 | | 19.8% | | 113,661 | | 18.1% | | 105,940 | | 18.3% |
| Consumer | | 194,630 | | 23.7% | | 200,987 | | 25.0% | | 188,490 | | 26.3% | | 173,270 | | 27.4% | | 172,249 | | 29.8% |
| Subtotal | | 820,378 | | 100.0% | | 803,456 | | 100.0% | | 717,579 | | 100.0% | | 629,240 | | 100.0% | | 578,638 | | 100.0% |
| Less: allowance for loan losses | | (12,250) | | | | (11,126) | | | | (10,048) | | | | (8,810) | | | | (7,903) | | |
| Deferred loan costs, net | | 2,690 | | | | 2,406 | | | | 2,001 | | | | 1,018 | | | | 1,342 | | |
| Loans, net | $ | 810,818 | | | $ | 794,736 | | | $ | 709,532 | | | $ | 621,448 | | | $ | 572,077 | | |
The Company’s loan portfolio is comprised of the following loan types:
• | Commercial Loans:Commercial loans include both secured and unsecured loans for working capital and expansion. Short-term working capital loans generally are secured by accounts receivable, inventory and/or equipment, while longer-term commercial loans are usually secured by equipment. |
• | Real Estate Mortgage Loans:Real estate loans consist of two types: one-to-four family residential and commercial properties. |
| o | One-to-Four Family Residential Loans:One-to-four family residential loans are secured principally by 1stdeeds of trust on residential properties principally located within the Company’s market area. |
| o | Commercial Real Estate Loans:Commercial real estate loans are secured principally by manufacturing facilities, apartment buildings and commercial buildings for office, storage and warehouse space. Loans secured by commercial real estate may involve a greater degree of risk than one-to-four family residential loans. Payments on such loans are often dependent on successful business management operations. |
The composition of the commercial real estate loan portfolio by occupancy type is a follows:
| | | | | | | | | | | | | | | | |
| | | December 31 |
| (Dollars in thousands) | | 2008 | | 2007 | | 2006 | | 2005 | | 2004 |
| | | | % of | | | % of | | | % of | | | % of | | | % of |
| | | Balance | total | | Balance | total | | Balance | total | | Balance | total | | Balance | total |
| Commercial real estate: | | | | | | | | | | | | | | | |
| Owner Occupied | $ | 162,435 | 49.6% | $ | 145,200 | 48.9% | $ | 128,638 | 51.6% | $ | 134,465 | 61.6% | $ | 98,774 | 57.0% |
| Non-Owner Occupied | | 165,269 | 50.4% | | 151,702 | 51.1% | | 120,471 | 48.4% | | 83,795 | 38.4% | | 74,506 | 43.0% |
| Total commercial real | $ | 327,704 | 100.0% | $ | 296,902 | 100.0% | $ | 249,109 | 100.0% | $ | 218,260 | 100.0% | $ | 173,280 | 100.0% |
The owner occupied commercial real estate and non-owner occupied segments expanded fairly evenly in 2008. Due to the weak economic conditions the Company anticipates less growth in the commercial real estate loan portfolio, and particularly, in the non-owner occupied segment in 2009.
25
| • | Real Estate Construction Loans:Real estate construction loans consist of three types: 1) commercial real estate, 2) one-to-four family residential construction, and 3) speculative construction. |
| o | Commercial Real Estate:Commercial real estate construction loans are primarily for owner-occupied properties. |
| o | One-to-Four Family Residential:One-to-four family residential construction loans are for the construction of custom homes, where the homebuyer is the borrower. |
| o | Speculative Construction:Speculative construction provides financing to builders for the construction of pre-sold homes and speculative residential construction. With few exceptions, the Company limits the number of unsold homes being built by each builder. The Company lends to qualified builders who are building in markets that management believes it understands and in which it is comfortable with the economic conditions. |
| • | Consumer Loans:The Company’s consumer loan portfolio consists of automobile loans, boat and recreational vehicle financing, home equity and home improvement loans, and miscellaneous secured and unsecured personal loans |
| o | Direct Consumer Loans:Direct consumer loans consist of automobile loans, boat and recreational vehicle financing, home equity and home improvement loans, and miscellaneous secured and unsecured personal loans originated directly by the Bank’s loan officers. |
| o | Indirect Consumer Loans:The Company makes loans for new and used automobile and recreational vehicles that are originated indirectly by selected dealers located in the Company’s market areas. The Company has limited its indirect loan purchases primarily to dealerships that are established and well known in their market areas and to applicants that are not classified as sub-prime. |
The Company makes certain loans which are guaranteed by the SBA. The SBA, an independent agency of the federal government, provides loan guarantees to qualifying small and medium sized businesses for up to 85% of the principal loan amount. The Company generally sells the guaranteed portion of each loan to investors in the secondary market. The guaranteed portion of an SBA loan is generally sold at a premium. In 2008, the Company sold total guaranteed portions of SBA loans in the amount of $2.9 million, compared with $6.1 million in 2007. The Company retains the unguaranteed portion of the loan. The retained portion of the SBA loan is classified within the portfolio by loan type.
Specific types of loans within the Company’s portfolio are more sensitive to interest rate changes. Commercial and real estate construction loan interest rates are primarily based upon current market rates plus a basis point spread charged by the Company. To better understand the Company’s risk associated with these loans, the following table sets forth the maturities by loan type:
| | | | | | | | |
| | | | | | | | |
| | Maturing |
| (Dollars in thousands) | | Within 1 year | | 1 - 5 years | | After 5 years | | Total |
| Commercial | $ | 45,461 | $ | 27,416 | $ | 21,645 | $ | 94,522 |
| Real estate construction: | | | | | | | | |
| One-to-four family residential | | 75,710 | | 22,089 | | 3,222 | | 101,021 |
| Commercial | | 33,582 | | 4,966 | | 5,854 | | 44,402 |
| Total real estate construction | | 109,292 | | 27,055 | | 9,076 | | 145,423 |
| Total | $ | 154,753 | $ | 54,471 | $ | 30,721 | $ | 239,945 |
| |
| Fixed-rate loans | $ | 14,514 | $ | 34,121 | $ | 6,942 | $ | 55,577 |
| Variable-rate loans | | 140,239 | | 20,350 | | 23,779 | | 184,368 |
| Total | $ | 154,753 | $ | 54,471 | $ | 30,721 | $ | 239,945 |
At December 31, 2008, the large majority of these variable rate loans did not have interest rate floors in place. The Company is currently implementing interest rate floors on its variable rate loans as they renew.
26
Credit Risks and Asset Quality
Credit Risks:The extension of credit, in the form of loans or other credit substitutes, to individuals and businesses is a major portion of the Company’s principal business activity. Company policies and applicable laws and regulations require risk analysis as well as ongoing portfolio and credit management.
The Company manages its credit risk through lending limits, credit review, approval policies and extensive, ongoing internal monitoring. Through this monitoring process, nonperforming loans are identified. Nonperforming assets consist of nonaccrual loans, restructured loans, past due loans and other real estate owned. Additional information on nonperforming assets is provided in Item 8-Financial Statements and Supplementary Data,Note 1- Significant Accounting Policies of the consolidated financial statements. Nonperforming assets are assessed for potential loss exposure on an individual or homogeneous group basis. Further details on the loss analysis are provided below in the Allowance for Loan Losses section.
| | | | | | | | | | |
| The following table summarizes the Company’s nonperforming assets for the past five years: | | | | |
| |
| | | | | Nonperforming Assets as of: | | |
| |
| | | | | | Years Ended December 31 | | |
| (Dollars in thousands) | | 2008 | | 2007 | | 2006 | | 2005 | | 2004 |
| Nonaccrual loans | $ | 1,918 | $ | 2,839 | $ | 3,638 | $ | 2,159 | $ | 2,812 |
| Restructured loans | | — | | — | | — | | — | | — |
| Total nonperforming loans | | 1,918 | | 2,839 | | 3,638 | | 2,159 | | 2,812 |
| Other real estate owned | | 2,226 | | 1,440 | | 363 | | — | | 1,222 |
| Total nonperforming assets | $ | 4,144 | $ | 4,279 | $ | 4,001 | $ | 2,159 | $ | 4,034 |
| |
| Impaired loans | $ | 1,918 | $ | 2,839 | $ | 3,668 | $ | 2,159 | $ | 3,417 |
| Accruing loans past due> 90 days | | 1 | | — | | 30 | | — | | — |
| Potential problem loans(1) | | 5,168 | | — | | — | | — | | 356 |
| Allowance for loan losses | | 12,250 | | 11,126 | | 10,048 | | 8,810 | | 7,903 |
| Interest foregone on nonaccrual loans | | 118 | | 154 | | 265 | | 185 | | 204 |
| |
| Nonperforming loans to loans | | 0.23% | | 0.35% | | 0.51% | | 0.34% | | 0.48% |
| Allowance for loan losses to loans | | 1.49% | | 1.38% | | 1.40% | | 1.40% | | 1.36% |
| Allowance for loan losses to nonperforming loans | | 638.67% | | 391.90% | | 276.19% | | 408.06% | | 281.05% |
| Allowance for loan losses to nonperforming assets | | 295.58% | | 262.34% | | 251.13% | | 408.06% | | 195.91% |
| Nonperforming assets to total assets | | 0.46% | | 0.48% | | 0.50% | | 0.30% | | 0.61% |
| (1) | Potential problem loans represent loans where known information about possible credit problems of borrowers causes management to have serious doubts about the ability of such borrowers to comply with the present loan repayment terms. |
Allowance for Loan Losses:The allowance for loan losses is maintained at a level considered adequate by management to provide for loan losses inherent in the portfolio. The Company assesses the allowance on a quarterly basis. The Company's methodology for making such assessments and determining the adequacy of the allowance includes the following key elements:
• | Specific Allowances.A specific allowance is established when management has identified unique or particular risks that are related to a specific loan that demonstrate risk characteristics consistent with impairment. Specific allowances may also be established to address the unique risks associated with a group of loans or particular type of credit exposure. |
• | Formula Allowance.The formula allowance is calculated by applying loss factors to individual loans based on the assignment of risk ratings, or through the assignment of loss factors to homogenous pools of loans. Changes in risk grades of both performing and nonperforming loans affect the amount of the formula allowance. Loss factors are based on historical loss experience and are adjusted for significant factors that, in management’s judgment, affect the collectability of the portfolio as of the evaluation date. The adjustments to historical loss rates are a result of our judgment about risks inherent in the portfolio, economic uncertainties, historical loss experience relative to current trends, and other subjective factors. Other considerations include: economic and business conditions that impact our portfolio, loan growth, depth and skill level of lending staff, the interest rate environment, findings from our internal credit review, and bank regulatory examination results. |
27
| • | Unallocated Allowance.The unallocated loan loss allowance represents an amount for imprecision or uncertainty that is inherent in estimates used to determine the allowance, which may change from period to period. During the fourth quarter of 2008, the Company changed its estimate of the allocation of the allowance for credit losses. Effective January 1, 2009 the bank will no longer maintain an unallocated allowance. Any unallocated allowance at December 31, 2008 will be allocated to specific loan types. In prior years, the unallocated portion of the allowance was associated with the portfolio as a whole, rather than with an individual loan type and was categorized as unallocated. |
The evaluation of each element and the overall allowance is based on a continuing assessment of nonperforming assets, recent and historical loss experience, and other factors, including regulatory guidance and economic factors. The allocation of the allowance is based on an evaluation of nonperforming assets, historical ratios of loan losses and other factors that may affect future loan losses in specific categories of loans. The following table shows the allocation of the allowance for loan losses, by loan type, for the past five years:
| | | | | | | | | | | | | | | |
| | | | | | Allocation of Allowance for Loan Losses as of: | | | |
| |
| | | Years Ended December 31 |
| | | 2008 | | 2007 | | 2006 | | 2005 | | 2004 |
| | | | % of | | | % of | | | % of | | | % of | | | % of |
| (Dollars in thousands) | | Amount | total(1) | | Amount | total(1) | | Amount | total(1) | | Amount | total(1) | | Amount | total(1) |
| Balance applicable to: | | | | | | | | | | | | | | | |
| Commercial | $ | 1,124 | 11.5% | $ | 976 | 12.8% | $ | 782 | 11.5% | $ | 737 | 12.6% | $ | 772 | 14.0% |
| Real estate mortgage | | 5,426 | 47.1% | | 3,928 | 44.0% | | 3,303 | 41.3% | | 2,844 | 41.8% | | 2,352 | 37.9% |
| Real estate construction | | 2,258 | 17.7% | | 1,812 | 18.3% | | 1,781 | 21.3% | | 1,378 | 18.0% | | 1,399 | 18.2% |
| Consumer | | 3,313 | 23.7% | | 2,773 | 24.9% | | 2,593 | 25.9% | | 2,308 | 27.6% | | 2,449 | 29.9% |
| Unallocated | | 129 | N/A | | 1,637 | N/A | | 1,589 | N/A | | 1,543 | N/A | | 931 | N/A |
| Total | $ | 12,250 | 100.0% | $ | 11,126 | 100.0% | $ | 10,048 | 100.0% | $ | 8,810 | 100.0% | $ | 7,903 | 100.0% |
| |
| (1)Represents the total of outstanding loans in each category as a percent of total loans outstanding. | | | | | | | |
The decrease in unallocated portion of allowance for loan losses in the current year reflects management's evaluation of the existing general business and economic conditions, and declining credit quality and collateral value trends in the loan portfolio. The allowance for loan losses composition should not be interpreted as an indication of specific amounts or loan categories in which future charge-offs may occur.
While the Company believes that it uses the best information available to determine the allowance for loan losses, unforeseen market conditions could result in adjustments to the allowance for loan losses, and net income could be significantly affected if circumstances differ substantially from the assumptions used in making the final determination. Based on the assessment of loan quality, the Company believes that the current allowance for loan losses is appropriate under the current circumstances and economic conditions.
Asset Quality:The following table sets forth historical information regarding the Company's net charge-offs and average loans for the past five years:
| | | | | | | | | | |
| | | | | Net Loan Charge-Offs as of: | | | |
| |
| | | Years Ended December 31 |
| (Dollars in thousands) | | 2008 | | 2007 | | 2006 | | 2005 | | 2004 |
| Indirect net charge-offs | $ | (1,440) | $ | (677) | $ | (332) | $ | (837) | $ | (926) |
| Other net charge-offs | | (2,486) | | (1,245) | | (1,105) | | (506) | | (787) |
| Total net charge-offs | $ | (3,926) | $ | (1,922) | $ | (1,437) | $ | (1,343) | $ | (1,713) |
| |
| Average indirect loans | $ | 110,536 | $ | 111,542 | $ | 98,889 | $ | 95,126 | $ | 103,278 |
| Average other loans | | 708,038 | | 647,700 | | 581,890 | | 508,201 | | 436,678 |
| Total average loans(1) | $ | 818,574 | $ | 759,242 | $ | 680,779 | $ | 603,327 | $ | 539,956 |
| |
| Indirect net charge-offs to average indirect loans | | 1.30% | | 0.61% | | 0.34% | | 0.88% | | 0.90% |
| Other net charge-offs to average other loans | | 0.35% | | 0.19% | | 0.25% | | 0.10% | | 0.18% |
| Net charge-offs to average loans | | 0.48% | | 0.25% | | 0.21% | | 0.22% | | 0.32% |
| |
| (1)Excludes average on loans held for sale. | | | | | | | | | | |
28
The following table sets forth historical information regarding changes in the Company's allowance for loan losses:
| | | | | | | | | | |
| | | Summary of Loan Loss Experience as of: |
| | | Years Ended December 31 |
| (Dollars in thousands) | | 2008 | | 2007 | | 2006 | | 2005 | | 2004 |
| Balance at beginning of period | $ | 11,126 | $ | 10,048 | $ | 8,810 | $ | 7,903 | $ | 6,116 |
| Charge-offs: | | | | | | | | | | |
| Commercial | | (1,902) | | (1,090) | | (1,239) | | (524) | | (467) |
| Real estate | | (555) | | (20) | | (86) | | (98) | | (206) |
| Consumer and other | | (2,947) | | (1,672) | | (1,062) | | (1,594) | | (1,668) |
| Total charge-offs | | (5,404) | | (2,782) | | (2,387) | | (2,216) | | (2,341) |
| Recoveries: | | | | | | | | | | |
| Commercial | | 553 | | 265 | | 345 | | 227 | | 184 |
| Real estate | | 182 | | 77 | | 12 | | 143 | | 79 |
| Consumer and other: | | 743 | | 518 | | 593 | | 503 | | 365 |
| Total recoveries | | 1,478 | | 860 | | 950 | | 873 | | 628 |
| Net charge-offs | | (3,926) | | (1,922) | | (1,437) | | (1,343) | | (1,713) |
| Provision for loan losses | | 5,050 | | 3,000 | | 2,675 | | 2,250 | | 3,500 |
| Balance at end of period | $ | 12,250 | $ | 11,126 | $ | 10,048 | $ | 8,810 | $ | 7,903 |
Deposits:In 2008, the Company focused its efforts on maintaining its deposit base through competitive pricing and delivery of quality service. As outlined in the following table, the Company increased average deposit balances during 2008. Additional information regarding deposits is provided in Item 8-Financial Statements and Supplementary Data,Note 6-Deposits.
| | | Average Deposit Balances as of: |
| | | | | | | | | |
| | | Years Ended December 31 |
| | | 2008 | | 2007 | | 2006 |
| | | Average | Average | | Average | Average | | Average | Average |
| (Dollars in thousands) | | balance | rate | | balance | rate | | balance | rate |
| Interest-bearing demand and | | | | | | | | | |
| money market deposits | $ | 262,959 | 1.54% | $ | 268,817 | 2.62% | $ | 231,316 | 1.95% |
| Savings deposits | | 41,662 | 0.40% | | 46,152 | 0.67% | | 55,139 | 0.78% |
| Time deposits | | 352,137 | 4.02% | | 316,308 | 4.84% | | 276,211 | 4.20% |
| Total interest-bearing deposits | | 656,758 | 2.80% | | 631,277 | 3.59% | | 562,666 | 2.94% |
| Demand and other | | | | | | | | | |
| noninterest-bearing deposits | | 91,891 | | | 100,830 | | | 100,267 | |
| Total average deposits | $ | 748,649 | | $ | 732,107 | | $ | 662,933 | |
Recent Developments:On January 27, 2009, the Company received notice from the Washington State Treasurer, that the Company would be required to pay a pro rata assessment of $114,000 to cover losses related to uninsured public deposits of a recently failed bank. The Company currently participates in a program where qualified commercial banks may accept public funds and pledge collateral representing 10.0% of the public funds accepted. Under the 1969 Washington State law, all banks participating in the program are required to cover losses related to uninsured public deposits. This is the first instance of the payment by participating banks in the laws thirty nine year history.
Currently the Washington State Office of the Treasurer is reviewing the public deposit program and proposing new collateral requirements whereby all public deposits would have pledged collateral of 100.0% by June 30, 2009. At December 31, 2008, the Company had $49.2 million in public deposits. The Company is currently assessing this issue and preparing a plan by which to meet the new collateral requirements as of June 30, 2009.
29
Wholesale Deposits:The following table further details wholesale deposits, which are included in total deposits shown above:
| | | | | | | | | |
| | | Years Ended December 31 |
| | | 2008 | | 2007 | | 2006 |
| (Dollars in thousands) | | Balance | % of Total | | Balance | % of Total | | Balance | % of Total |
| |
| Brokered time deposits | $ | 10,000 | 20.5% | $ | 10,000 | 100.0% | $ | — | 0.0% |
| Mutual fund money market deposits | | 26,002 | 53.4% | | — | 0.0% | | — | 0.0% |
| Certificate of deposits account registry system deposits | | 12,727 | 26.1% | | — | 0.0% | | — | 0.0% |
| Total wholesale deposits | $ | 48,729 | 100.0% | $ | 10,000 | 100.0% | $ | — | 0.0% |
| |
| Wholesale deposits to total deposits | | 6.5% | | | 1.3% | | | 0.0% | |
Brokered time deposits are obtained through intermediary brokers that sell the certificates on the open market. All $10.0 million of the brokered time deposits mature in February 2009; the Company will evaluate alternate funding at maturity.
Mutual fund money market deposits are obtained from an intermediary that provides cash sweep services to broker-dealers and clearing firms. Currently, the Company anticipates limiting the growth of these types of deposits to approximately $25.0 million. The deposits are payable upon demand.
Certificate Deposit Account Registry System (“CDARS”) deposits are obtained through a broker and represent a reciprocal agreement, whereby the Company obtains a portion of time deposits from another financial institution, not to exceed $100,000 per customer. In return, the other financial institution obtains a portion of the Company’s time deposits. All CDARS deposits represent direct customer relationships with the Company, but for regulatory purposes are required to be classified as brokered deposits. Deposit maturities range between four weeks and twenty four months.
Although a significant amount of time deposits will mature and reprice in the next twelve months, the Company expects to retain the majority of such balances. In the short term, time deposits have limited impact on the liquidity of the Company and these deposits can generally be retained and expanded with increases in rates paid which might, however, increase the cost of funds more than anticipated.
The following table sets forth the amounts and maturities of time deposits at December 31, 2008:
| | | | | | | | | | |
| | | | | Maturities of Time Deposits | | |
| |
| (Dollars in thousands) | | Less than 3 | | 3 to 6 | | 6 to 12 | | Over 12 | | Total |
| | | months | | months | | months | | months | | |
| Time deposits of $100,000 or more | $ | 53,810 | $ | 45,427 | $ | 45,506 | $ | 32,708 | $ | 177,451 |
| All other time deposits | | 42,324 | | 40,096 | | 43,579 | | 48,096 | | 174,095 |
| Total time deposits | $ | 96,134 | $ | 85,523 | $ | 89,085 | $ | 80,804 | $ | 351,546 |
Borrowings:Total borrowings outstanding increased to $67.4 million at December 31, 2008 compared to $46.3 million in 2007. The change in borrowings is attributable to $30.0 million in other borrowings from the FHLB. The Company’s sources of funds consist of borrowings from correspondent banks, the FHLB and junior subordinated debentures.
| • | FHLB Overnight Borrowings and Other Borrowed Funds: The Company relies upon advances from the FHLB to supplement funding needs. The FHLB provides credit for member financial institutions in the form of overnight borrowings, short term and long term advances. As a member, the Bank is required to own capital stock in the FHLB and is authorized to apply for advances on the pledge of certain of its mortgage loans and other assets (principally, securities which are obligations of, or guaranteed by, the United States) provided certain standards related to creditworthiness have been met. |
30
| At December 31, 2008 the Company had an outstanding $10.5 million in overnight borrowings, with a remaining unused line of credit of $121.1 million, subject to certain collateral and stock requirements. Additional information regarding FHLB borrowings is provided in Item 8-Financial Statements and Supplementary Data,Note 7- FHLB Advances and Stock to the consolidated financial statements. |
• | Federal Funds Purchased:The Company also uses lines of credit at correspondent banks to purchase federal funds for short-term funding. There were $1.1 million in outstanding borrowings as of December 31, 2008 and no outstanding borrowings as of December 31, 2007. Available borrowings under these lines of credit totaled $50.0 million as of December 31, 2008 and December 31, 2007. |
• | Junior Subordinated Debentures:On April 2, 2007, a newly created wholly-owned subsidiary of the Company issued $10.3 million of trust preferred securities with a quarterly adjustable rate based upon the London Interbank Offered Rate (“LIBOR”) plus 1.56% . Additionally, on June 29, 2007, the Company prepaid $15.0 million of outstanding trust preferred securities with a quarterly adjustable rate of LIBOR plus 3.65% . On the same day, the Company replaced the called securities with another issuance of $15.5 million of trust preferred securities with a quarterly adjustable rate of LIBOR plus 1.56% . The debentures, within certain limitations, are considered Tier 1 capital for regulatory capital requirements. |
Capital
Shareholders’ Equity:Shareholders’ equity increased $7.0 million to $80.6 million at December 31, 2008 from $73.6 million at December 31, 2007. The increase in shareholders’ equity was due to $8.3 million of net income for the year, stock-based compensation of $567,000 and proceeds from the exercise of stock options of $302,000. These increases were offset by the payment of cash dividends of $2.4 million.
Recent Developments:On January 16, 2009, in exchange for an aggregate purchase price of $26.4 million, the Company issued and sold to the United States Department of the Treasury pursuant to the Troubled Asset Relief Program Capital Purchase Program the following: (i) 26,380 shares of the Company’s newly designated Fixed Rate Cumulative Perpetual Preferred Stock, Series A, no par value per share, and liquidation preference $1,000 per share ($26.4 million liquidation preference in the aggregate) and (ii) a warrant to purchase up to 492,164 shares of the Company’s common stock, no par value per share, at an exercise price of $8.04 per share, subject to certain anti-dilution and other adjustments. The Warrant may be exercised for up to ten years after it is issued.
In connection with the issuance and sale of the Company’s securities, the Company entered into a Letter Agreement including the Securities Purchase Agreement — Standard Terms, dated January 16, 2009, with the United States Department of the Treasury (the “Agreement”). The Agreement contains limitations on the payment of quarterly cash dividends on the Company’s common stock in excess of $0.065 per share, and on the Company’s ability to repurchase its common stock.
The Series A Preferred Stock will bear cumulative dividends at a rate of 5% per annum for the first five years and 9% per annum thereafter, in each case, applied to the $1,000 per share liquidation preference, but will only be paid when, as and if declared by the Company’s Board of Directors out of funds legally available. The Series A Preferred Stock has no maturity date and ranks senior to our common stock with respect to the payment of dividends and distributions and amounts payable upon liquidation, dissolution and winding up of the Company.
The Company intends to use the $26.4 million TARP investment to bolster its capital position and provide additional lending opportunities within its communities.
The following table represents the cash dividends declared and dividend payout ratio for the past three years:
| | | | | | |
| Cash Dividends & Payout Ratios |
| | | | Years Ended December 31 | |
| | | 2008 | | 2007 | | 2006 |
| |
| Dividend declared per share | $ | 0.26 | $ | 0.23 | $ | 0.20 |
| Dividend payout ratio | | 29.01% | | 23.07% | | 19.58% |
31
Cash dividends are approved by the Board of Directors in connection with its review of the Company’s capital plan. The cash dividend is subject to regulatory limitation as described in Item I-Business,Supervision and Regulation Section. There is no assurance that future cash dividends will be declared or increased. For further information on shareholders’ equity, see Item 8-Financial Statements and Supplementary Data,Consolidated Statements of Shareholders’ Equity.
Stock Repurchase Plan:In April 2007, the Board of Directors approved a plan to repurchase shares of the Company’s common stock. The repurchase plan authorizes the Company to repurchase up to 472,134 shares of common stock. During, 2008, the Company did not repurchase any stock under the plan. The Company’s ability to repurchase shares is limited under the terms of the Letter Agreement entered into with the United States Department of the Treasury in connection with the Troubled Asset Relief Program Capital Purchase Program.
Regulatory Capital Requirements:The Company (on a consolidated basis) and the Bank are subject to minimum capital requirements, under which risk percentages are assigned to various categories of assets and off-balance sheet items to calculate a risk-adjusted capital ratio. The Federal Reserve and FDIC regulations set forth the qualifications necessary for bank holding companies and banks to be classified as “well capitalized,” primarily for assignment of insurance premium rates. Failure to qualify as “well capitalized” can: (a) negatively impact a bank’s ability to expand and to engage in certain activities, (b) cause an increase in insurance premium rates, and (c) impact a bank holding company’s ability to utilize certain expedited filing procedures, among other things. The Company’s and Bank’s current capital ratios are located in Item 8-Financial Statements and Supplementary Data, Note 13- Regulatory Capital Matters of the consolidated financial statements.
Liquidity and Cash Flow
Whidbey Island Bank:The principal objective of the Bank’s liquidity management program is to maintain the ability to meet day-to-day cash flow requirements of its customers who either wish to withdraw funds or to draw upon credit facilities to meet their cash needs. The Bank monitors the sources and uses of funds on a daily basis to maintain an acceptable liquidity position. In addition to liquidity from core deposits and the repayment and maturities of loans, the Bank can utilize established lines of credit with correspondent banks, sale of investment securities or borrowings from the FHLB.
Washington Banking Company:The Company is a separate legal entity from the Bank and must provide for its own liquidity. Substantially all of the Company’s revenues are obtained from dividends declared and paid by the Bank. There are statutory and regulatory provisions that could limit the ability of the Bank to pay dividends to the Company. However, management believes that such restrictions will not have an adverse impact on the ability of the Company to meets its ongoing cash obligations, which consist principally of debt service on the $25.8 million of outstanding junior subordinated debentures, which totaled approximately $1.3 million in 2008. Further information on the Company’s cashflows can be found in Item 8-Financial Statements and Supplementary Data, Note 15- Washington Banking Company Information of the consolidated financial statements.
Consolidated Cashflows:The consolidated cashflows of the Company and its subsidiary the Bank are disclosed in the Consolidated Statement of Cash Flows found in Item 8-Financial Statements and Supplementary Data.Net cash provided by operating activities was $14.9 million during 2008. The principal source of cash provided by operating activities was net income from continuing operations. Investing activities used $27.8 million in 2008. The net use of cash was principally for loan growth of $23.7 million and the purchase of $8.6 million of investment securities. Financing activities provided $7.9 million, primarily through net borrowings of $21.1 million offset by an $11.2 million decrease in deposits.
Capital Resources
Off-Balance Sheet Commitments:Standby letters of credit, commercial letters of credit, and financial guarantees written, are conditional commitments issued by the Company to guarantee the performance of a customer to a third party or payment by a customer to a third party. Those guarantees are primarily issued in international trade or to support public and private borrowing arrangements, including commercial paper, bond financing, and similar transactions. Except for certain long-term guarantees, the majority of guarantees expire in one year. The credit risk involved in issuing letters of credit is essentially the same as that involved in extending loan facilities to customers. Collateral supporting those commitments, for which collateral is deemed necessary, generally amounts to one hundred percent of the commitment amount at December 31, 2008. The Company routinely charges a fee for these credit facilities. The Company has not been required to perform on any financial guarantees.
32
| | |
| The following table summarizes the Company’s commitments to extend credit: | | |
| |
| Commitments to Extend Credit |
| |
| (Dollars in thousands) | | December 31, 2008 |
| Loan commitments | | |
| Fixed rate | $ | 14,745 |
| Variable rate | | 131,859 |
| Standby letters of credit | | 1,865 |
| Total commitments | $ | 148,469 |
Contractual Commitments:The Company is party to many contractual financial obligations, including repayment of borrowings and operating lease payments. The following table summarizes the contractual obligations of the Company as of December 31, 2008:
| | | | | | | | | | |
| | | Future Contractual Obligations |
| | | | | Within 1 | | 1-3 | | 3-5 | | Over 5 |
| (Dollars in thousands) | | Total | | year | | years | | years | | years |
| Debt | $ | 30,000 | $ | 20,000 | $ | 10,000 | $ | — | $ | — |
| Operating leases | | 3,596 | | 486 | | 753 | | 716 | | 1,641 |
| Junior subordinated debentures | | 25,774 | | — | | — | | — | | 25,774 |
| Total | $ | 59,370 | $ | 20,486 | $ | 10,753 | $ | 716 | $ | 27,415 |
33
Item 7A. Quantitative and Qualitative Disclosures about Market Risk
Asset/Liability Management
The purpose of asset/liability management is to provide stable net interest income by protecting the Company’s earnings from undue interest rate risk that arises from volatile interest rates and changes in the balance sheet mix, and by managing the risk/return relationships between liquidity, interest rate risk, market risk, and capital adequacy. The Company maintains an asset/liability management policy that provides guidelines for controlling exposure to interest rate risk by utilizing the following ratios and trend analyses: liquidity, equity, volatile liability dependence, portfolio maturities, maturing assets and maturing liabilities. The Company’s policy is to control the exposure of its earnings to changing interest rates by generally endeavoring to maintain a position within a narrow range around an “earnings neutral position,” which is defined as the mix of assets and liabilities that generate a net interest margin that is least a ffected by interest rate changes.
Market Risk
Interest Rate Risk:The Company is exposed to interest rate risk. Interest rate risk is the risk that financial performance will decline over time due to changes in prevailing interest rates and resulting yields on interest-earning assets and costs of interest-bearing liabilities. Generally, there are three sources of interest rate risk as described below:
| • | Re-pricing Risk:Generally, re-pricing risk is the risk of adverse consequences from a change in interest rates that arises because of differences in the timing of when those interest rate changes affect an institution’s assets and liabilities.
|
| • | Basis Risk:Basis risk is the risk of adverse consequences resulting from unequal changes in the spread between two or more rates for different instruments with the same maturity.
|
| • | Option Risk:In banking, option risks are known as borrower options to prepay loans and depositor options to make deposits, withdrawals, and early redemptions. Option risk arises whenever bank products give customers the right, but not the obligation, to alter the quantity of the timing of cash flows. |
A number of measures are used to monitor and manage interest rate risk, including income simulations and interest sensitivity (gap) analyses. An income simulation model is the primary tool used to assess the direction and magnitude of changes in net interest income resulting from changes in interest rates. Key assumptions in the model include prepayment speeds on fixed rate assets, cash flows and maturities of other investment securities, and loan and deposit volumes and pricing. These assumptions are inherently uncertain and, as a result, the model cannot precisely estimate net interest income or precisely predict the impact of higher or lower interest rates on net interest income. Actual results will differ from simulated results due to timing, magnitude and frequency of interest rate changes and changes in market conditions and management strategies, among other factors.
| | | | | | |
| Interest Rate Simulation Impact on Net Interest Income |
| | | 2008 | | 2007 |
| | | Change in net interest | Percentage | | Change in net interest | Percentage |
| Scenario | | income from scenario | change | | income from scenario | change |
| Up 100 basis points | $ | 161,000 | 0.4% | $ | (181,000) | (1.2 %) |
| Down 100 basis points | $ | — | — | $ | 65,000 | 0.4% |
34
Interest Rate Sensitivity:The analysis of an institution’s interest rate gap (the difference between the repricing of interest-earning assets and interest-bearing liabilities during a given period of time) is another standard tool for the measurement of the exposure to interest rate risk. The Company believes that because interest rate gap analysis does not address all factors that can affect earnings performance, it should be used in conjunction with other methods of evaluating interest rate risk.
The following table sets forth the estimated maturity or repricing, and the resulting interest rate gap of the Company’s interest-earning assets and interest-bearing liabilities at December 31, 2008. The interest rate gaps reported in the table arise when assets are funded with liabilities having different repricing intervals. The amounts shown in the following table could be significantly affected by external factors such as changes in prepayment assumptions, early withdrawals of deposits and competition:
| | | | | | | | | | |
| | | Estimated Maturity and Repricing at December 31, 2008 |
| |
| (Dollars in thousands) | | 0 – 3 | | 4 – 12 | | 1 – 5 | | | | |
| | | months | | months | | years | | Over 5 years | | Total |
| Interest-earning assets: | | | | | | | | | | |
| Interest-earning deposits | $ | 381 | $ | — | $ | — | $ | — | $ | 381 |
| Investment securities | | 40 | | 3,109 | | 12,361 | | 2,288 | | 17,798 |
| Investment in subsidiary | | — | | — | | — | | 774 | | 774 |
| �� FHLB stock | | 2,430 | | — | | — | | — | | 2,430 |
| Loans held for sale | | 2,896 | | — | | — | | — | | 2,896 |
| Loans | | 241,065 | | 65,677 | | 385,219 | | 128,417 | | 820,378 |
| Total interest-earning assets | $ | 246,812 | $ | 68,786 | $ | 397,580 | $ | 131,479 | $ | 844,657 |
| Percent of interest-earning assets | | 29.22% | | 8.14% | | 47.07% | | 15.57% | | 100.00% |
| |
| Interest-bearing liabilities: | | | | | | | | | | |
| Interest-bearing demand deposits | $ | 119,115 | $ | — | $ | — | $ | — | $ | 119,115 |
| Money market deposits | | 143,855 | | — | | — | | — | | 143,855 |
| Savings deposits | | 41,161 | | — | | — | | — | | 41,161 |
| Time deposits | | 96,134 | | 174,608 | | 80,804 | | — | | 351,546 |
| FHLB overnight borrowings | | 11,640 | | — | | — | | — | | 11,640 |
| Junior subordinated debentures | | 25,774 | | — | | — | | — | | 25,774 |
| Other borrowed funds | | 10,000 | | 10,000 | | 10,000 | | — | | 30,000 |
| Total interest-bearing liabilities | $ | 447,679 | $ | 184,608 | $ | 90,804 | $ | — | $ | 723,091 |
| Percent of interest-bearing liabilities | | 61.91% | | 25.53% | | 12.56% | | 0.00% | | 100.00% |
| |
| Interest sensitivity gap | $ | (200,867) | $ | (115,822) | $ | 306,776 | $ | 131,479 | $ | 121,566 |
| Interest sensitivity gap, as a percentage of total assets | | (22.33 %) | | (12.87%) | | 34.10% | | 14.61% | | |
| |
| Cumulative interest sensitivity gap | $ | (200,867) | $ | (316,689) | $ | (9,913) | $ | 121,566 | | |
| Cumulative interest sensitivity gap, as a percentage of total assets | | (22.33%) | | (35.20%) | | (1.10%) | | 13.51% | | |
Impact of Inflation and Changing Prices
The primary impact of inflation on the Company’s operations is increased operating costs. Unlike most industrial companies, virtually all the assets and liabilities of a financial institution are monetary in nature. As a result, interest rates generally have a more significant impact on a financial institution’s performance than the effects of general levels of inflation. Although interest rates do not necessarily move in the same direction or to the same extent as the prices of goods and services, increases in inflation generally have resulted in increased interest rates.
35
| |
| Item 8. Financial Statements and Supplementary Data | |
| |
| INDEX TO CONSOLIDATED FINANCIAL STATEMENTS | |
| | Page |
| Management’s Report on Internal Control over Financial Reporting | 37 |
| |
| Report of Independent Registered Public Accounting Firm | 38 |
| |
| Consolidated Statements of Financial Condition at December 31, 2008 and 2007 | 40 |
| |
| Consolidated Statements of Income for the years ended December 31, 2008, 2007 and 2006 | 41 |
| |
| Consolidated Statements of Changes in Shareholders’ Equity for the years ended December 31, 2008, 2007 and 2006 | 42 |
| |
| Consolidated Statements of Comprehensive Income for the years ended December 31, 2008, 2007 and 2006 | 43 |
| |
| Consolidated Statements of Cash Flows for the years ended December 31, 2008, 2007 and 2006 | 44 |
| |
| Notes to Consolidated Financial Statements | 46 |
36
MANAGEMENT’S REPORT ON INTERNAL CONTROL OVER FINANCIAL REPORTING
The Company’s management, including its Chief Executive Officer and its Chief Financial Officer, together with its consolidated subsidiary, is responsible for establishing, maintaining and assessing adequate internal control over financial reporting (as defined in Rule 13a-15(f) under the Securities Exchange Act of 1934). The Company’s internal control over financial reporting is a process designed to provide reasonable assurance regarding the reliability of financial reporting and the preparation of the Company’s financial statements for external reporting purposes in accordance with accounting principals generally accepted in the United States of America.
The Company’s internal control over financial reporting includes policies and procedures that pertain to the maintenance of records that, in reasonable detail, accurately and fairly reflect transactions and dispositions of assets; provide reasonable assurances that transactions are recorded as necessary to permit preparation of financial statements in accordance with accounting principals generally accepted in the United States of America, and that receipts and expenditures are being made only in accordance with authorizations of management and the directors of the Company; and provide reasonable assurance regarding prevention or timely detection of unauthorized acquisition, use or disposition of the Company’s assets that could have a material effect on the Company’s financial statements.
Management recognizes that there are inherent limitations in the effectiveness of any system of internal control, and accordingly, even effective internal control can provide only reasonable assurance with respect to financial statement preparation and fair presentation. Further, because of changes in conditions, the effectiveness of internal control may vary over time.
The Company’s management assessed the effectiveness of the Company’s internal control over financial reporting as of December 31, 2008. In making this assessment, management used the criteria set forth by the Committee of Sponsoring Organizations of the Treadway Commission in theInternal Control-Integrated Framework. Based on this assessment, management believes that, as of December 31, 2008, the Company’s internal control over financial reporting was effective based on those criteria.
The Company’s independent registered public accounting firm has audited the Company’s consolidated financial statements as of and for the year ended December 31, 2008 that are included in this annual report and issued their Report of Independent Registered Public Accounting Firm, appearing under Item 8, which includes an attestation report on the Company’s internal control over financial reporting. The attestation report expresses an unqualified opinion on the effectiveness of the Company’s internal controls over financial reporting as of December 31, 2008.
37

REPORT OF INDEPENDENT REGISTERED PUBLIC ACCOUNTING FIRM
To the Board of Directors and Shareholders
Washington Banking Company and Subsidiaries
We have audited the accompanying consolidated statements of financial condition of Washington Banking Company and Subsidiaries (the Company) as of December 31, 2008 and 2007, and the related consolidated statements of income, changes in shareholders' equity, comprehensive income, and cash flows for each of the years in the three-year period ended December 31, 2008. We also have audited the Company’s internal control over financial reporting as of December 31, 2007, based on criteria established in Internal Control - Integrated Framework issued by the Committee of Sponsoring Organizations of the Treadway Commission (COSO). The Company’s management is responsible for these financial statements, for maintaining effective internal control over financial reporting, and for its assessment of the effectiveness of internal control over financial reporting included in the accompanying Report of Management on Internal Control over Financial Reporting. Our responsibility is to express an opinion on these financial statements and an opinion on the effectiveness of the Company's internal control over financial reporting based on our audits.
We conducted our audits in accordance with auditing standards of the Public Company Accounting Oversight Board (United States). Those standards require that we plan and perform the audits to obtain reasonable assurance about whether the financial statements are free of material misstatement and whether effective internal control over financial reporting was maintained in all material respects. Our audit of the financial statements included examining, on a test basis, evidence supporting the amounts and disclosures in the financial statements, assessing the accounting principles used and significant estimates made by management, as well as evaluating the overall financial statement presentation. Our audit of internal control over financial reporting included obtaining an understanding of internal control over financial reporting, assessing the risk that a material weakness exists, and testing and evaluating the design and operating effectiveness of internal control based on the assessed risks. Our audits also included performing such other procedures as we considered necessary in the circumstances. We believe that our audits provide a reasonable basis for our opinions.
The Company's internal control over financial reporting is a process designed to provide reasonable assurance regarding the reliability of financial reporting and the preparation of financial statements for external purposes in accordance with generally accepted accounting principles. The Company's internal control over financial reporting includes those policies and procedures that (1) pertain to the maintenance of records that, in reasonable detail, accurately and fairly reflect the transactions and dispositions of the assets of the Company; (2) provide reasonable assurance that transactions are recorded as necessary to permit preparation of financial statements in accordance with generally accepted accounting principles, and that receipts and expenditures of the Company are being made only in accordance with authorizations of management and Directors of the Company; and (3) provide reasonable assurance regarding prevention or timely detection of unauthorized acquisition, use, or disposition of the Company's assets that could have a material effect on the financial statements.
Because of its inherent limitations, internal control over financial reporting may not prevent or detect misstatements. Also, projections of any evaluation of effectiveness to future periods are subject to the risk that controls may become inadequate because of changes in conditions, or that the degree of compliance with the policies or procedures may deteriorate.
38

REPORT OF INDEPENDENT REGISTERED PUBLIC ACCOUNTING FIRM– (continued)
In our opinion, the consolidated financial statements referred to above present fairly, in all material respects, the consolidated financial position of Washington Banking Company and Subsidiaries as of December 31, 2008 and 2007, and the results of their operations and their cash flows for each of the years in the three-year period ended December 31, 2008, in conformity with accounting principles generally accepted in the United States of America. Also in our opinion, Washington Banking Company maintained, in all material respects, effective internal control over financial reporting as of December 31, 2008, based on criteria established in Internal Control - Integrated Framework issued by the Committee of Sponsoring Organizations of the Treadway Commission (COSO).

Portland, Oregon
March 12, 200939
WASHINGTON BANKING COMPANY
AND SUBSIDIARIES
Consolidated Statements of Financial Condition
Years Ended December 31, 2008 and 2007
(Dollars in thousands, except per share data)
| | | | |
| |
| Assets | | 2008 | | 2007 |
| Cash and due from banks | $ | 13,609 | $ | 18,795 |
| ($ 1,458 and $ 3,496, respectively, are restricted) | | | | |
| Interest-bearing deposits | | 381 | | 257 |
| Total cash, restricted cash, and cash equivalents | | 13,990 | | 19,052 |
| |
| Investment securities available for sale | | 17,798 | | 13,832 |
| |
| Federal Home Loan Bank stock | | 2,430 | | 1,984 |
| Loans held for sale | | 2,896 | | 2,347 |
| Loans receivable | | 823,068 | | 805,862 |
| Allowance for loan losses | | (12,250) | | (11,126) |
| Total loans, net | | 810,818 | | 794,736 |
| Premises and equipment, net | | 24,971 | | 25,138 |
| Bank owned life insurance | | 16,822 | | 16,517 |
| Other real estate owned | | 2,226 | | 1,440 |
| Other assets | | 7,680 | | 7,243 |
| Total assets | $ | 899,631 | $ | 882,289 |
| |
| Liabilities and Shareholders’ Equity | | | | |
| Liabilities: | | | | |
| Deposits | | | | |
| Noninterest-bearing | $ | 91,482 | $ | 101,539 |
| Interest-bearing | | 304,131 | | 315,298 |
| Time deposits | | 351,546 | | 341,517 |
| Total deposits | | 747,159 | | 758,354 |
| FHLB overnight borrowings | | 11,640 | | 20,500 |
| Other term borrowings | | 30,000 | | — |
| Junior subordinated debentures | | 25,774 | | 25,774 |
| Other liabilities | | 4,498 | | 4,091 |
| Total liabilities | | 819,071 | | 808,719 |
| |
| Commitments and contingencies (See Notes 16 and 18) | | | | |
| Shareholders’ equity: | | | | |
| Preferred stock, no par value. Authorized 20,000 shares: | | | | |
| no shares issued or outstanding | | — | | — |
| Common stock, no par value. Authorized 13,679,757 shares: | | | | |
| issued and outstanding 9,510,007 and 9,453,767 shares | | | | |
| at December 31, 2008 and 2007, respectively | | 33,701 | | 32,812 |
| Retained earnings | | 46,567 | | 40,652 |
| Accumulated other comprehensive income, net | | 292 | | 106 |
| Total shareholders’ equity | | 80,560 | | 73,570 |
| Total liabilities and shareholders’ equity | $ | 899,631 | $ | 882,289 |
| |
| See accompanying notes to consolidated financial statements. | | | | |
40
WASHINGTON BANKING COMPANY
AND SUBSIDIARIES
Consolidated Statements of Income
Years Ended December 31, 2008, 2007 and 2006
(Dollars in thousands, except per share data)
| | | | | | |
| |
| | | 2008 | | 2007 | | 2006 |
| Interest income: | | | | | | |
| Interest and fees on loans | $ | 58,144 | $ | 61,385 | $ | 54,240 |
| Interest on taxable investment securities | | 397 | | 547 | | 457 |
| Interest on tax-exempt investment securities | | 205 | | 263 | | 310 |
| Other | | 36 | | 173 | | 178 |
| Total interest income | | 58,782 | | 62,368 | | 55,185 |
| Interest expense: | | | | | | |
| Interest on time deposits | | 14,205 | | 15,309 | | 11,604 |
| Interest on savings and money market deposits | | 3,076 | | 4,837 | | 2,919 |
| Interest on NOW deposits | | 1,161 | | 2,523 | | 2,034 |
| Interest on other borrowings | | 1,138 | | 379 | | 547 |
| Interest on junior subordinated debentures | | 1,254 | | 1,762 | | 1,337 |
| Total interest expense | | 20,834 | | 24,810 | | 18,441 |
| Net interest income | | 37,948 | | 37,558 | | 36,744 |
| Provision for loan losses | | 5,050 | | 3,000 | | 2,675 |
| Net interest income after provision for loan losses | | 32,898 | | 34,558 | | 34,069 |
| Noninterest income: | | | | | | |
| Service charges and fees | | 2,987 | | 3,135 | | 3,296 |
| Income from the sale of loans | | 223 | | 667 | | 709 |
| Electronic banking income | | 1,333 | | 1,252 | | 1,052 |
| SBA premium income | | 259 | | 491 | | 597 |
| Other | | 2,084 | | 1,945 | | 1,596 |
| Total noninterest income | | 6,886 | | 7,490 | | 7,250 |
| Noninterest expense: | | | | | | |
| Salaries and benefits | | 15,373 | | 17,082 | | 16,807 |
| Occupancy and equipment | | 3,762 | | 3,805 | | 3,596 |
| Office supplies and printing | | 572 | | 558 | | 640 |
| Data processing | | 625 | | 663 | | 479 |
| Merger related expenses | | 266 | | 513 | | — |
| Restructuring charge | | 874 | | — | | 575 |
| Consulting and professional fees | | 794 | | 735 | | 769 |
| Other | | 5,257 | | 5,115 | | 4,664 |
| Total noninterest expense | | 27,523 | | 28,471 | | 27,530 |
| Income before provision for income taxes | | 12,261 | | 13,577 | | 13,789 |
| Provision for income taxes | | 3,929 | | 4,179 | | 4,298 |
| Net income | $ | 8,332 | $ | 9,398 | $ | 9,491 |
| |
| |
| Earnings per common share, basic(1) | $ | 0.88 | $ | 1.00 | $ | 1.03 |
| Earnings per common share, diluted(1) | $ | 0.88 | $ | 0.99 | $ | 1.00 |
| |
| |
| Average number of shares outstanding, basic(1) | | 9,465,000 | | 9,365,000 | | 9,217,000 |
| Average number of shares outstanding, diluted(1) | | 9,513,000 | | 9,493,000 | | 9,490,000 |
| |
| (1)Adjusted to reflect a 5-for-4 stock split distributed by the Company on September 6, 2006. | | | | |
| See accompanying notes to consolidated financial statements. | | | | | | |
41
WASHINGTON BANKING COMPANY
AND SUBSIDIARIES
Consolidated Statements of Changes in Shareholders'' Equity
Years Ended December 31, 2008, 2007 and 2006
(Dollars and shares in thousands, except per share data)
| | | | | | | | | | | |
| |
| |
| | | | | | | | | | Accumulated | | |
| | | | | | | | | | other | | Total |
| | Common stock | | Retained | | Deferred | | comprehensive | | shareholders’ |
| | Shares | | Amount | | earnings | | compensation | | income | | equity |
| Balance at December 31, 2005(1) | 9,228 | $ | 32,492 | $ | 25,789 | $ | (386) | $ | (46) | $ | 57,849 |
| Net income | — | | — | | 9,491 | | — | | — | | 9,491 |
| Net change in unrealized (loss) | | | | | | | | | | | |
| on securities available for sale | — | | — | | — | | — | | 1 | | 1 |
| Tax benefit associated with stock awards | — | | 29 | | — | | — | | — | | 29 |
| Cash dividend, $0.20 per share | — | | — | | (1,858) | | — | | — | | (1,858) |
| Stock-based compensation | — | | 316 | | — | | — | | — | | 316 |
| Transition adjustment SFAS No. 123R | — | | (386) | | — | | 386 | | — | | — |
| Issuance of restricted stock | 18 | | — | | — | | — | | — | | — |
| Issuance of common stock under stock | | | | | | | | | | | |
| plans | 143 | | 565 | | — | | — | | — | | 565 |
| Balance at December 31, 2006 | 9,389 | $ | 33,016 | $ | 33,422 | $ | — | $ | ( 45) | $ | 66,393 |
| Net income | — | | — | | 9,398 | | — | | — | | 9,398 |
| Net change in unrealized (loss) | | | | | | | | | | | |
| on securities available for sale | — | | — | | — | | — | | 151 | | 151 |
| Tax benefit associated with stock awards | — | | 253 | | — | | — | | — | | 253 |
| Cash dividend, $0.23 per share | — | | — | | (2,168) | | — | | — | | (2,168) |
| Stock-based compensation | — | | 345 | | — | | — | | — | | 345 |
| Forfeited and cancelled restricted stock | (2) | | — | | — | | — | | — | | — |
| Common stock repurchased and retired | (116) | | (1,851) | | — | | — | | — | | (1,851) |
| Issuance of common stock under stock | | | | | | | | | | | |
| plans | 183 | | 1,049 | | — | | — | | — | | 1,049 |
| Balance at December 31, 2007 | 9,454 | $ | 32,812 | $ | 40,652 | $ | — | $ | 106 | $ | 73,570 |
| Net income | — | | — | | 8,332 | | — | | — | | 8,332 |
| Net change in unrealized gain | | | | | | | | | | | |
| on securities available for sale | — | | — | | — | | — | | 186 | | 186 |
| Tax benefit associated with stock awards | — | | 20 | | — | | — | | — | | 20 |
| Cash dividend, $0.26 per share | — | | — | | (2,417) | | — | | — | | (2,417) |
| Stock-based compensation | — | | 567 | | — | | — | | — | | 567 |
| Forfeited and cancelled restricted stock | (2) | | — | | — | | — | | — | | — |
| Issuance of common stock under stock | | | | | | | | | | | |
| plans | 58 | | 302 | | — | | — | | — | | 302 |
| Balance at December 31, 2008 | 9,510 | $ | 33,701 | $ | 46,567 | $ | — | $ | 292 | $ | 80,560 |
| |
| (1)Adjusted to reflect a 5-for-4 stock split distributed by the Company on September 6, 2006. | | | | | | |
| |
| See accompanying notes to consolidated financial statements. | | | | | | | | |
42
WASHINGTON BANKING COMPANY
AND SUBSIDIARIES
Consolidated Statements of Comprehensive Income
Years Ended December 31, 2008, 2007 and 2006
(Dollars in thousands)
| | | | | | |
| |
| |
| Comprehensive Income: | | 2008 | | 2007 | | 2006 |
| Net income | $ | 8,332 | $ | 9,398 | $ | 9,491 |
| Change in unrealized gains on securities available for | | | | |
| sale, net of tax, of $(99) ($84) and ($1), for years ended 2008, 2007 | | | | |
| and 2006, respectively | | 186 | | 151 | | 1 |
| Comprehensive income | $ | 8,518 | $ | 9,549 | $ | 9,492 |
| |
| |
| See accompanying notes to consolidated financial statements. | | | | |
43
WASHINGTON BANKING COMPANY
AND SUBSIDIARIES
Consolidated Statements of Cash Flows
Years Ended December 31, 2008, 2007 and 2006
(Dollars in thousands)
| | | | | | |
| | | 2008 | | 2007 | | 2006 |
| Cash flows from operating activities: | | | | | | |
| Net income from operations | $ | 8,332 | $ | 9,398 | $ | 9,491 |
| Adjustments to reconcile net income to net cash | | | | | | |
| provided by operating activities: | | | | | | |
| Deferred income tax expense (benefit) | | (336) | | 1 | | (684) |
| Amortization (accretion) of investment premiums, net | | (8) | | (10) | | 11 |
| Earnings on bank owned life insurance | | (305) | | (587) | | (372) |
| Provision for loan losses | | 5,050 | | 3,000 | | 2,675 |
| Depreciation and amortization of premises and equipment | | 1,731 | | 1,796 | | 1,629 |
| Net (gain) loss on sale of premises and equipment | | 19 | | — | | (17) |
| Net gain on sale of other real estate | | (32) | | (24) | | (6) |
| Write downs on other real estate | | 254 | | — | | 10 |
| Excess tax benefit from stock-based compensation | | (20) | | (253) | | (29) |
| Amortization of stock-based compensation | | 567 | | 345 | | 316 |
| Net Changes in assets and liabilities: | | | | | | |
| Loans held for sale | | (549) | | 111 | | 371 |
| Other assets | | (180) | | 2,296 | | (1,119) |
| Other liabilities | | 406 | | (2,212) | | 674 |
| Cash flows from operating activities | | 14,929 | | 13,861 | | 12,950 |
| Cash flows from investing activities: | | | | | | |
| Purchases of investment securities available for sale | | (8,556) | | (2,635) | | (3,675) |
| Purchase of Federal Home Loan Bank Stock | | (446) | | — | | — |
| Maturities/calls/principal payments of investment and mortgage-backed securities | | | | | | |
| available for sale | | 4,883 | | 5,838 | | 5,951 |
| Purchase of bank owned life insurance | | — | | (5,000) | | — |
| Net increase in loans | | (23,747) | | (90,756) | | (91,191) |
| Purchases of premises and equipment | | (1,583) | | (3,562) | | (4,470) |
| Proceeds from sale of other real estate owned and premises and equipment | | 1,607 | | 1,499 | | 65 |
| Cash flows used in investing activities | | (27,842) | | (94,616) | | (93,320) |
| Cash flows from financing activities: | | | | | | |
| Net (decrease) increase in deposits | | (11,194) | | 54,587 | | 66,277 |
| Gross payments on other borrowed funds | | (30,000) | | — | | (26,845) |
| New borrowings on other borrowed funds | | 60,000 | | — | | 16,845 |
| Net Increase (decrease) in FHLB overnight borrowings | | (8,860) | | 17,425 | | 3,075 |
| Gross payments on junior subordinated debentures | | — | | (15,007) | | — |
| New borrowings on junior subordinated debentures | | — | | 25,774 | | — |
| Dividends paid on common stock | | (2,417) | | (2,168) | | (1,858) |
| Common stock repurchased | | — | | (1,851) | | — |
| Excess tax benefit from stock-based compensation | | 20 | | 253 | | 29 |
| Proceeds from issuance of common stock- stock options | | 302 | | 1,049 | | 565 |
| Cash flows from financing activities | | 7,851 | | 80,062 | | 58,088 |
| Net change in cash and cash equivalents | | (5,062) | | (693) | | (22,282) |
| Cash and cash equivalents at beginning of period | | 19,052 | | 19,745 | | 42,027 |
| Cash and cash equivalents at end of period | $ | 13,990 | $ | 19,052 | $ | 19,745 |
44
WASHINGTON BANKING COMPANY
AND SUBSIDIARIES
Consolidated Statements of Cash Flows
Years Ended December 31, 2008, 2007 and 2006
(Dollars in thousands)
(Continued)
Supplemental information:
| | | | | | |
| | | 2008 | | 2007 | | 2006 |
| Loans foreclosed and transferred to other real estate owned | $ | 2,615 | $ | 2,552 | $ | 432 |
| Cash paid for interest | 21,271 | | 24,572 | | 17,574 |
| Cash paid for income taxes | 4,352 | | 4,123 | | 5,210 |
| |
| See accompanying notes to consolidated financial statements. | | | | | |
45
NOTES TO CONSOLIDATED FINANCIAL STATEMENTS
(Dollars in thousands, except per share data)
(1) Description of Business and Summary of Significant Accounting Policies
(a) Description of Business:Washington Banking Company (the “Company”) was formed on April 30, 1996 and is a registered bank holding company whose primary business is conducted by its wholly-owned subsidiary, Whidbey Island Bank (the “Bank”). The business of the Bank, which is focused in the northern area of Western Washington, consists primarily of attracting deposits from the general public and originating loans. The Company and the Bank have formed several subsidiaries for various purposes as follows:Washington Banking Capital Trust I (the “Trust”) was a wholly-owned subsidiary of the Company. The Trust, was formed in June 2002 for the exclusive purpose of issuing trust preferred securities. In 2003, the Trust subsidiary was consolidated. In 2004, pursuant to Financial Accounting Standards Board (“FASB”) Financial Interpretation No. 46R (“FIN 46R”), the Company deconsolidated the Trust. During the second quarter of 2007 the Trust was closed after the trust preferred securities were paid off. See Note 9- Trust Preferred Securities and Junior Subordinated Debentures for further details.
Washington Banking Master Trust (the “Master Trust”) is a wholly-owned subsidiary of the Company. The Master Trust was formed in April 2007 for the exclusive purpose of issuing trust preferred securities. See Note 9- Trust Preferred Securities and Junior Subordinated Debentures for further details.
Rural One, LLC (“Rural One”) is a majority-owned subsidiary of the Bank and is certified as a Community Development Entity by the Community Development Financial Institutions Fund of the United States Department of Treasury. Rural One was formed in September 2006, for the exclusive purpose of investing in Federal tax credits related to the New Markets Tax Credit program. See Note 10- Income Taxes for further details.
(b) Basis of Presentation:The accompanying consolidated financial statements include the accounts of the Company and its subsidiaries as described above. The consolidated financial statements of the Company have been prepared in conformity with accounting principles generally accepted in the United States of America. All significant intercompany balances and transactions have been eliminated in consolidation. In preparing the consolidated financial statements, in conformity with generally accepted accounting principles, management makes estimates and assumptions that affect the reported amounts of assets and liabilities and disclosure of contingent assets and liabilities at the date of the financial statements and the reported amounts of income and expense during the reported periods. Actual results could differ from these estimates. Management considers the estimates used in developing the allowance for loan losses and determining the fair value of financial assets and liabilities to be particular ly sensitive estimates that may be subject to revision in the near term.(c) Recent Financial Accounting Pronouncements:In December 2007, FASB issued SFAS No. 141 (revised),Business Combinations. SFAS No. 141R establishes principles and requirements for how an acquirer recognizes and measures in its financial statements the identifiable assets acquired, the liabilities assumed, any noncontrolling interest in the acquired entity and the goodwill acquired. Furthermore, acquisition-related and other costs will now be expensed rather than treated as cost components of the acquisition. SFAS No. 141R also establishes disclosure requirements to enable the evaluation of the nature and financial effects of the business combination. This statement applies prospectively to business combinations for which the acquisition date is on or after January 1, 2009. The adoption of SFAS No. 141R will have not have an impact on the Company’s consolidated financial statements prior to January 1, 2009. The Company expects the adoption of SFAS No. 141R will increase the costs charged to operations for acquisitions c onsummated on or after January 1, 2009.
In March 2008, the Financial Accounting Standards Board (“FASB”) issued FASB Statement No. 161,Disclosures about Derivative Instruments and Hedging Activities - an Amendment of FASB Statement 133.Statement No. 161 enhances required disclosures regarding derivatives and hedging activities, including enhanced disclosures regarding how: (a) an entity uses derivative instruments; (b) derivative instruments and related hedged items are accounted for under FASB Statement No. 133,Accounting for Derivative Instruments and Hedging Activities;and (c) derivative instruments and related hedged items effect on the entity's financial position, financial performance, and cash flows.
46
NOTES TO CONSOLIDATED FINANCIAL STATEMENTS (Continued)
(Dollars in thousands, except per share data)
Specifically, Statement 161 requires:
Disclosure of the objectives for using derivative instruments be disclosed in terms of underlying risk and accounting designation;
Disclosure of the fair values of derivative instruments and their gains and losses in a tabular format;
Disclosure of information about credit-risk-related contingent features; and
Cross-reference from the derivative footnote to other footnotes in which derivative-related information is disclosed.
Statement No. 161 is effective for fiscal years and interim periods beginning after November 15, 2008. The Company does not expect the standard to have a material impact on its consolidated financial statements.
In May 2008, the Financial Accounting Standards Board (“FASB”) issued FASB Statement No. 162,The Hierarchy of Generally Accepted Accounting Principles. Statement No. 162 identifies the sources of accounting principles and the framework for selecting the principles to be used in the preparation of financial statements of nongovernmental entities that are presented in conformity with generally accepted accounting principles (GAAP) in the United States (the GAAP hierarchy).
Statement No. 162 is effective 60 days following the SEC’s approval of the Public Company Accounting Oversight Board amendments to AU Section 411, “The Meaning of Present Fairly in Conformity With Generally Accepted Accounting Principles.” The Company does not expect the standard to have any impact on its consolidated financial statements.
In May 2008, FASB issued Statement No. 163,Accounting for Financial Guarantee Insurance Contracts: An interpretation of FASB Statement No. 60.Statement No. 163 requires that an insurance enterprise recognize a claim liability prior to an event of default when there is evidence that credit deterioration has occurred in an insured financial obligation.
Statement No. 163 is effective for financial statements issued for fiscal years beginning after December 15, 2008, and all interim periods within those fiscal years. The Company does not expect the standard to have any impact on its consolidated financial statements.
In June 2008, FASB issued FSP EITF 03-6-1,Determining Whether Instruments Granted in Share-Based Payment Transactions Are Participating Securities. FSP EITF 03-6-1 concludes that nonvested share-based payment awards that contain nonforfeitable rights to dividends or dividend equivalents are participating securities and shall be included in the computation of EPS pursuant to the two-class method. This statement is effective for fiscal years beginning after December 15, 2008, to be applied retrospectively. Certain of the Company’s nonvested restricted stock awards qualify as participating securities as described under this pronouncement. The Company is currently evaluating the impact of the adoption on the Company’s consolidated financial statements.
In October 2008, FASB issued FSP No. 157-3,Determining the Fair Value of a Financial Asset When the Market for That Asset Is Not Active.FSP No. 157-3 clarifies the application of SFAS 157 in a market that is not active and provides an example to illustrate key considerations in determining the fair value of a financial asset when the market for that financial asset is not active. The FSP does not change existing generally accepted accounting principles. This FSP was effective immediately upon issuance, including prior periods for which financial statements have not been issued. The impact of adoption did not have a material impact on the Company’s consolidated financial statements.
47
NOTES TO CONSOLIDATED FINANCIAL STATEMENTS (Continued)
(Dollars in thousands, except per share data)
On January 12, 2009, FASB issued FSP EITF 99-20-1,Amendments to the Impairment Guidance of EITF Issue No. 99-20.FSP EITF 99-20-1 addresses certain practice issues in EITF No. 99-20,Recognition of Interest Income and Impairment on Purchased Beneficial Interests and Beneficial Interests That Continue to Be Held by a Transferor in Securitized Financial Assets, by making its other-than-temporary impairment assessment guidance consistent with SFAS No. 115,Accounting for Certain Investments in Debt and Equity Securities. FSP EITF 99-20-1 removes the reference to the consideration of a market participant’s estimates of cash flows in EITF 99-20, and instead requires an assessment of whether it is probable, based on current information and events, that the holder of the security will be unable to collect all amounts due according to the contractual terms. If it is probable that there has been an adverse change in estimated cash flows, an other-than-temporary impairment is deemed to exist, and a corresponding loss shall be recognized in earnings equal to the entire difference between the investment’s carrying value and its fair value at the balance sheet date of the reporting period for which the assessment is made. This FSP is effective for interim and annual reporting periods ending after December 15, 2008, and shall be applied prospectively. The Company does not expect the standard to have any impact on its consolidated financial statements.
(d) Cash and Cash Equivalents:For purposes of reporting cash flows, cash and cash equivalents include cash on hand and due from banks, interest-earning deposits and federal funds sold, all of which have original maturities of three months or less.
(e) Federal Home Loan Bank Stock:The Bank’s investment in FHLB stock is carried at par value, which approximates its fair value. As a member of the FHLB system, the Bank is required to maintain a minimum level of investment in FHLB stock based on specific percentages of the Bank’s outstanding mortgages, total assets or FHLB advances. At December 31, 2008, the Bank’s minimum required investment was approximately $1,699. Amounts in excess of the required minimum for FHLB membership may be redeemed at par at FHLB’s discretion, which is subject to their capital plan, bank policies, and regulatory requirements, which may be amended or revised periodically.
(f) Investment Securities:Investment securities available for sale include securities that management intends to use as part of its overall asset/liability management strategy and that may be sold in response to changes in interest rates and resultant prepayment risk and other related factors. Securities available for sale are carried at market value, and unrealized gains and losses (net of related tax effects) are excluded from net income but are included as a separate component of comprehensive income. Upon realization, such gains and losses will be included in net income using the specific identification method. Declines in the fair value of individual securities available-for-sale below their cost that are other than temporary result in write-downs of the individual securities to their fair value. Such write-downs are included in earnings as realized losses.
Investment securities held to maturity are comprised of debt securities for which the Company has positive intent and ability to hold to maturity and are carried at cost, adjusted for amortization of premiums and accretion of discounts using the interest method over the estimated lives of the securities. Amortization of premiums and accretion of discounts are recognized in interest income over the period to maturity.
Management determines the appropriate classification of investment securities at the purchase date in accordance with SFAS No. 115,Accounting for Certain Investments in Debt and Equity Securities.
(g) Loans Held for Sale:Mortgage loans originated and intended for sale in the secondary market are carried at the lower of cost or estimated market value in the aggregate. Net unrealized losses are recognized through a valuation allowance by charges to income. When a loan is sold, the gain is recognized in the consolidated statement of income as the proceeds less the book value of the loan including unamortized fees and capitalized direct costs.
(h) Loans Receivable, Net:Loans receivable, net, are stated at the unpaid principal balance, net of premiums, unearned discounts, net deferred loan origination fees and costs, and the allowance for loan losses.
Interest on loans is calculated using the simple interest method based on the daily balance of the principal amount outstanding and is credited to income as earned.
48
NOTES TO CONSOLIDATED FINANCIAL STATEMENTS (Continued)
(Dollars in thousands, except per share data)
Loans are placed on nonaccrual status when collection of principal or interest is considered doubtful (generally, loans are 90 days or more past due). Indirect consumer loans are charged-off immediately when collection of principal or interest is considered doubtful (generally loans are 90 days or more past due).
A loan is considered impaired when, based upon currently known information, it is deemed probable that the Company will be unable to collect all amounts due as scheduled according to the original terms of the agreement. Impaired loans are measured based on the present value of expected future cash flows discounted at the loan’s effective interest rate or, as a practical expedient, based on the loan’s observable market price or the fair value of collateral, if the loan is collateral dependent.
Interest income previously accrued on nonaccrual loans, but not yet received, is reversed in the period the loan is placed on nonaccrual status. Payments received are generally applied to principal. However, based on management’s assessment of the ultimate collectibility of an impaired or nonaccrual loan, interest income may be recognized on a cash basis. Nonaccrual loans are returned to an accrual status when management determines the circumstances have improved to the extent that there has been a sustained period of repayment performance and both principal and interest are deemed collectible.
Loan fees and certain direct loan origination costs are deferred and the net fee or cost is recognized in interest income using the interest method over the estimated life of the individual loans, adjusted for actual prepayments.
(i) Allowance for Loan Losses:The allowance for loan losses is based upon the Company’s estimates. The Company determines the adequacy of the allowance for loan losses based on evaluations of the loan portfolio, recent loss experience and other factors, including economic and market conditions. The Company determines the amount of the allowance for loan losses required for certain sectors based on relative risk characteristics of the loan portfolio. Actual losses may vary from current estimates. These estimates are reviewed periodically and as adjustments become necessary, are reported in earnings in the periods in which they become known. The allowance for loan losses is increased by charging to the provision for loan losses. Losses are charged to the allowance and recoveries are credited to the allowance.
(j) Premises and Equipment:Premises and equipment are stated at cost, less accumulated depreciation and amortization. Depreciation and amortization are computed using the straight-line method over the estimated useful lives of the assets. The estimated useful lives used to compute depreciation and amortization include buildings and building improvements, 15 to 40 years; land improvements, 15 to 25 years; furniture, fixtures and equipment, 3 to 7 years; and leasehold improvements, lesser of useful life or life of the lease.
(k) Bank Owned Life Insurance:During the second quarter of 2007 and 2004, the Bank made a $5,000 and $10,000 investment, respectively, in bank owned life insurance (“BOLI”). These policies insure the lives of officers of the Bank, and name the Bank as beneficiary. Noninterest income is generated tax-free (subject to certain limitations) from the increase in the policies' underlying investments made by the insurance company. The Bank is capitalizing on the ability to partially offset costs associated with employee compensation and benefit programs with the BOLI.
(l) Other Real Estate Owned:Other real estate owned includes properties acquired through foreclosure. These properties are recorded at the lower of cost or estimated fair value. Losses arising from the initial acquisition of property, in full or partial satisfaction of loans, are charged to the allowance for loan losses.
Subsequent to the transfer to other real estate owned, these assets continue to be recorded at the lower of cost or fair value (less estimated cost to sell), based on periodic evaluations. Generally, legal and professional fees associated with foreclosures are expensed as incurred. However, in no event are recorded costs allowed to exceed fair value. Subsequent gains, losses or expenses recognized on the sale of these properties are included in noninterest income or expense.
49
NOTES TO CONSOLIDATED FINANCIAL STATEMENTS (Continued)
(Dollars in thousands, except per share data)
(m) Federal Income Taxes:The Company files a consolidated federal income tax return. Deferred tax assets and liabilities are recognized for the future tax consequences attributable to differences between the financial statement carrying amounts of existing assets and liabilities and their respective tax basis. Deferred tax assets and liabilities are measured using enacted tax rates expected to apply to taxable income in the periods in which those temporary differences are expected to be recovered or settled. The effect on deferred tax assets and liabilities of a change in tax rate is recognized in income in the period that includes the enactment date.
The Company adopted FIN 48,Accounting for Uncertainty in Income Taxes,on January 1, 2007. FIN 48 is an interpretation of SFAS No. 109,Accounting for Income Taxes,and it seeks to reduce the diversity in practice associated with certain aspects of measurement and recognition in accounting for income taxes. In addition, FIN 48 provides guidance on derecognition, classification, interest and penalties, and accounting in interim periods and requires expanded disclosure with respect to uncertainty in income taxes. As a result of the implementation of FIN 48, the Company recognized no material adjustments in the liability for unrecognized income tax benefits, all of which would affect the Company’s effective income tax rate if recognized.
(n) Stock-Based Compensation:The Company adopted Financial Accounting Standards Board Statement No. 123R, “Share-Based Payment” (“SFAS 123R”) effective January 1, 2006. SFAS 123R requires companies to measure and recognize compensation expense for all share-based payments at the grant date based on the fair value of the award, as defined in SFAS 123R, and include such costs as an expense in our income statements over the requisite service (vesting) period. The Company adopted SFAS 123R using a modified prospective application, whereby the provisions of the statement have been applied prospectively only from the date of adoption for new (issued subsequent to December 31, 2005) and unvested stock option awards for which the requisite service is rendered after the date of adoption. Thus, the Company recognizes as expense the fair value of stock options issued prior to January 1, 2006, but vesting after January 1, 2006, over the remaining vesting period. In addition, compensation expen se must be recognized for any awards modified, repurchased, or cancelled after the date of adoption. The Company uses the Black-Scholes option pricing model to measure fair value. For further details on the impact to the Company’s financial statements please refer to Note (12)- Stock-Based Compensation.
(o) Reclassifications:Certain amounts in previous years may have been reclassified to conform to the 2008 financial statement presentation. The reclassifications had no impact to reported net income.
(2) Restrictions on Cash Balance
The Company is required to maintain an average reserve balance with the Federal Reserve Bank or maintain such reserve balance in the form of cash. The amount of the required reserve balance on December 31, 2008 and 2007 was $1,458 and $3,496, respectively, and was met by holding cash with the Federal Reserve Bank.
(3) Investment Securities
The amortized costs and market values of investment securities at December 31, 2008 and 2007 were as summarized:
| | | | | | | | | | |
| | | | | Gross | | Gross unrealized | | Gross unrealized | | |
| | | Amortized | | unrealized | | losses less than | | losses greater than | | Market |
| December 31, 2008: | | cost | | gains | | 12 months | | 12 months | | value |
| Investments available for sale: | | | | | | | | | | |
| U.S. government agency securities | $ | 9,402 | $ | 335 | $ | — | $ | — | $ | 9,737 |
| Pass-through securities | | 40 | | — | | — | | — | | 40 |
| State and political subdivisions | | 6,903 | | 95 | | (21) | | — | | 6,977 |
| Corporate securities | | 1,004 | | 40 | | — | | — | | 1,044 |
| Total investment securities | | | | | | | | | | |
| available for sale | $ | 17,349 | $ | 470 | $ | ( 21) | $ | — | $ | 17,798 |
50
NOTES TO CONSOLIDATED FINANCIAL STATEMENTS (Continued)
(Dollars in thousands, except per share data)
(3) Investment Securities- (Continued)
| |
| | | | | Gross | | Gross unrealized | | Gross unrealized | | |
| | | Amortized | | unrealized | | losses less than | | losses greater than | | Market |
| December 31, 2007: | | cost | | gains | | 12 months | | 12 months | | value |
| Investments available for sale: | | | | | | | | | | |
| U.S. government agency securities | $ | 8,395 | $ | 144 | $ | — | $ | (2) | $ | 8,537 |
| Pass-through securities | | 78 | | — | | — | | — | | 78 |
| State and political subdivisions | | 5,195 | | 22 | | — | | — | | 5,217 |
| Total investment securities | | | | | | | | | | |
| available for sale | $ | 13,668 | $ | 166 | $ | — | $ | (2) | $ | 13,832 |
Certain investment securities shown in the preceding table currently have fair values less than amortized cost and therefore contain unrealized losses. As of December 31, 2008 and 2007, the Company had four and three investment securities that were in an unrealized loss position. The Company has evaluated these securities and has determined that the decline in value is temporary and is related to the change in market interest rates since purchase. The decline in value is not related to any company or industry specific event.
The amortized cost and market value of investment securities by contractual maturity at December 31, 2008 are as follows:
| | | | | | | | | | |
| | | | | | | Dates of Maturities | | | | |
| | | Under 1 | | 1 - 5 | | 5 –10 | | Over 10 | | |
| Investments available for sale: | | year | | years | | years | | years | | Total |
| U.S. government agency securities: | | | | | | | | | | |
| Amortized cost | $ | 1,959 | $ | 7,443 | $ | — | $ | — | $ | 9,402 |
| Market value | | 2,011 | | 7,726 | | — | | — | | 9,737 |
| Pass-through securities: | | | | | | | | | | |
| Amortized cost | | 40 | | — | | — | | — | | 40 |
| Market value | | 40 | | — | | — | | — | | 40 |
| Corporate Securities: | | | | | | | | | | |
| Amortized cost | | — | | 1,004 | | — | | — | | 1,004 |
| Market value | | — | | 1,044 | | — | | — | | 1,044 |
| State and political subdivisions: | | | | | | | | | | |
| Amortized cost | | 1,096 | | 3,570 | | 1,231 | | 1,006 | | 6,903 |
| Market value | | 1,099 | | 3,590 | | 1,243 | | 1,045 | | 6,977 |
| Total amortized cost | $ | 3,095 | $ | 12,017 | $ | 1,231 | $ | 1,006 | $ | 17,349 |
| Total market value | $ | 3,150 | $ | 12,360 | $ | 1,243 | $ | 1,045 | $ | 17,798 |
At December 31, 2008 and 2007, investment securities with recorded values of $7,577 and $7,280, respectively, were pledged to secure public deposits and for other purposes as required or permitted by law.
For the years ended December 31, 2008, 2007 and 2006, there were no sales of investment securities available for sale.
51
NOTES TO CONSOLIDATED FINANCIAL STATEMENTS (Continued)
(Dollars in thousands, except per share data)
(4) Loans and Allowance for Loan Losses
The loan portfolio composition, based upon the purpose and primary source of repayment of the loans, was as follows:
| | | | |
| | | December 31 |
| | | 2008 | | 2007 |
| Commercial loans | $ | 94,522 | $ | 102,284 |
| Real estate mortgages | | 385,803 | | 353,538 |
| Real estate construction loans | | 145,423 | | 146,647 |
| Consumer loans | | 194,630 | | 200,987 |
| Subtotal | | 820,378 | | 803,456 |
| Less: | | | | |
| Allowance for loan losses | | (12,250) | | (11,126) |
| Deferred loan costs, net | | 2,690 | | 2,406 |
| Net loans | $ | 810,818 | $ | 794,736 |
| | | | | | |
| The following is an analysis of the changes in the allowance for loan losses: | | | |
| |
| | | | | December 31 | | |
| | | 2008 | | 2007 | | 2006 |
| Beginning balance | $ | 11,126 | $ | 10,048 | $ | 8,810 |
| Provision for loan losses | | 5,050 | | 3,000 | | 2,675 |
| Recoveries | | 1,478 | | 860 | | 950 |
| Charge-offs | | (5,404) | | (2,782) | | (2,387) |
| Ending balance | $ | 12,250 | $ | 11,126 | $ | 10,048 |
The Company had impaired loans which consisted of nonaccrual and accrual loans. As of December 31, 2008, the Company had no commitments to extend additional credit on these impaired loans. Impaired loans and their related reserve for loan losses were as follows:
| | | | | | | |
| | | | | December 31 | | | |
| | | 2008 | | 2007 | | 2006 |
| Impaired loans | | | | | | | |
| Nonaccrual loans | $ | 1,918 | $ | 2,839 | $ | | 3,638 |
| Accrual loans | | — | | — | | | 30 |
| Total impaired loans | $ | 1,918 | $ | 2,839 | $ | | 3,668 |
| Reserve for impaired loans | | | | | | | |
| Nonaccrual loans | $ | 132 | $ | 500 | $ | | 551 |
| Accrual loans | | — | | — | | | 30 |
| Total reserve for impaired loans | $ | 132 | $ | 500 | $ | | 581 |
| |
| The average balance on impaired loans was as follows: | | | | | | |
| |
| | | | | December 31 | | | |
| | | 2008 | | 2007 | | 2006 |
| Average balance impaired loans | | | | | | | |
| Nonaccrual loans | $ | 2,424 | $ | 2,538 | $ | | 2,518 |
| Accrual loans | | — | | — | | | 14 |
| Ending balance | $ | 2,424 | $ | 2,538 | $ | | 2,532 |
52
NOTES TO CONSOLIDATED FINANCIAL STATEMENTS (Continued)
(Dollars in thousands, except per share data)
(4) Loans and Allowance for Loan Losses- (Continued)
The following table details the interest income which would have been recognized if the loans had accrued interest, in accordance with their original terms, and the interest actually recognized on a cash basis.
| | | | | | | | | | | | | |
| | | | | | | | | December 31 |
| | | | | | | | 2008 | | 2007 | | 2006 |
| Interest income not recognized on impaired loans | | | $ | 118 | $ | | 154 | $ | 265 |
| Interest income recognized on impaired loans | | | $ | 83 | $ | | 164 | $ | 189 |
| |
| (5) Premises and Equipment | | | | | | | | | | | |
| |
| Premises and equipment consisted of the following: | | | | | | | | | |
| |
| | | | | | | | | | | December 31 |
| | | | | | | | | | | 2008 | | 2007 |
| Land and buildings | | | | | | | | | $ | 20,682 | $ | 20,684 |
| Furniture and equipment | | | | | | | | | 9,390 | | 9,467 |
| Land improvements | | | | | | | | | | 2,260 | | 2,268 |
| Computer software | | | | | | | | | | 1,979 | | 2,705 |
| Construction in progress | | | | | | | | | 4,246 | | 3,010 |
| Subtotal | | | | | | | | | | 38,557 | | 38,134 |
| Less: accumulated depreciation | | | | | | | | (13,586) | | (12,996) |
| Total | | | | | | | | | $ | 24,971 | $ | 25,138 |
| |
| |
| (6) Deposits | | | | | | | | | | | | | |
| |
| Deposits are summarized as follows: | | | | | | | | | | | |
| |
| | | | | | | | | | | December 31 |
| | | | | | | | | | | 2008 | | 2007 |
| Time deposits | | | | | | | | | $ | 351,546 | $ | 341,517 |
| Money market | | | | | | | | | | 143,855 | | 133,265 |
| Negotiable orders of withdrawal (“NOWs”) | | | | | | 119,115 | | 140,145 |
| Noninterest-bearing demand | | | | | | | | 91,482 | | 101,539 |
| Savings | | | | | | | | | | 41,161 | | 41,888 |
| Total | | | | | | | | | $ | 747,159 | $ | 758,354 |
| |
| Time deposits mature as follows: | | | | | | | | | | | | |
| |
| | | December 31, 2008 |
| | | Less than | | 1 - 2 | | 2 - 3 | | 3 - 4 | | 4 - 5 | | Over 5 | | |
| | | 1 year | | years | | years | | years | | years | | Years | | Total |
| Time deposits of | | | | | | | | | | | | | | |
| $100,000 or more | $ | 144,743 | $ | 29,890 | $ | 400 | $ | 2,035 | $ | 383 | $ | — | $ | 177,451 |
| All other time deposits | | 125,998 | | 45,607 | | 1,035 | | 636 | | 819 | | — | | 174,095 |
| Total | $ | 270,741 | $ | 75,497 | $ | 1,435 | $ | 2,671 | $ | 1,202 | $ | — | $ | 351,546 |
53
NOTES TO CONSOLIDATED FINANCIAL STATEMENTS (Continued)
(Dollars in thousands, except per share data)
(7) Federal Home Loan Bank Stock
The Bank is required to maintain an investment in the stock of the FHLB. The requirement is based on the following components:
3.5% of the average daily balance of advances outstanding during the most recent quarter; plus
the greater of $500 or 0.75% of mortgage loans and pass-through securities; or
5.0% of the outstanding balance of loans sold to the FHLB minus the membership requirement.
At December 31, 2008, the Bank held $2.4 million of common stock in the FHLB of Seattle. This security is reported at par value, which represents the Bank’s cost. The FHLB of Seattle recently announced that it would report a risk-based capital deficiency under the regulations of the Federal Housing Finance Agency (the “FHFA”), its primary regulator, as of December 31, 2008, and as a result would not pay a dividend for the fourth calendar quarter of 2008 and that it would suspend the repurchase and redemption of outstanding common stock.
The FHLB of Seattle has communicated to the Bank that they believe the calculation of risk-based capital under the current rules of the FHFA significantly overstates the market risk of the FHLB’s private-label mortgage-backed securities in the current market environment and that they have enough capital to cover the risks reflected in the FHLB’s balance sheet. As a result, the Bank has not recorded an "other than temporary impairment" on its investment in FHLB stock. However, continued deterioration in the FHLB of Seattle’s financial position may result in impairment in the value of those securities, the requirement that the Bank contribute additional funds to recapitalize the FHLB of Seattle, or reduce the Bank’s ability to borrow funds from the FHLB of Seattle, impairing the Bank’s ability to meet liquidity demands.
On February 20, 2009, the FHLB of Seattle communicated to the Bank that they believe they are in compliance with the risk based capital requirements as outlined under the regulations of the FHFA.
(8)Federal Home Loan Bank Borrowings and Federal Funds Purchased
A credit line has been established by the FHLB for the Bank. At December 31, 2008, the line of credit available to the Bank was $161,561. The Bank may borrow from the FHLB in amounts up to 20% of its total assets, subject to certain restrictions and collateral. Advances on the line are collateralized by securities pledged and held in safekeeping by the FHLB, as well as supported by eligible real estate loans. As of December 31, 2008, collateral consisted entirely of eligible real estate loans in the amount of $245,664.
The Company also uses lines of credit at correspondent banks to purchase federal funds for short-term funding. There were $1.1 million in outstanding borrowings as of December 31, 2008 and no outstanding borrowings as of December 31, 2007. Available borrowings under these lines of credit totaled $50.0 million as of December 31, 2008 and December 31, 2007.
| | | | | | | | | | | | | | |
| | | | | | | | | | | | | December 31 |
| | | | | | | | | | | | | 2008 | | 2007 |
| Year to date average balance | | | | | | | | | $ | 12,245 | $ | 4,316 |
| Maximum amount outstanding at any month end | | | | | | | | 41,640 | | 20,500 |
| Weighted average interest rate on amount outstanding at December 31 | | | | 2.19% | | 4.44% |
| |
| Future maturities of borrowed funds at December 31, 2008 are as follows: | | | | | | |
| |
| | | 2009 | | 2010 | | 2011 | | 2012 | | 2013 | | Thereafter | | Total |
| Overnight borrowings | $ | 11,640 | $ | — | $ | — | $ | — | $ | — | $ | — | $ | 11,640 |
| Term borrowings | | 20,000 | | 10,000 | | — | | — | | — | | — | | 30,000 |
| Total | $ | 31,640 | $ | 10,000 | $ | — | $ | — | $ | — | $ | — | $ | 41,640 |
54
NOTES TO CONSOLIDATED FINANCIAL STATEMENTS (Continued)
(Dollars in thousands, except per share data)
(9) Trust Preferred Securities and Junior Subordinated Debentures
Washington Banking Capital Trust I, a statutory business trust, was a wholly-owned subsidiary of the Company created for the exclusive purposes of issuing and selling capital securities and utilizing sale proceeds to acquire junior subordinated debt issued by the Company. On June 27, 2002, the Trust issued $15,000 of trust preferred securities with a 30-year maturity, callable after the fifth year by the Company. On June 29, 2007, the Company called the $15,000 of trust preferred securities issued. The Trust was subsequently closed.
Washington Banking Master Trust, a statutory business trust, is a wholly-owned subsidiary of the Company created for the exclusive purposes of issuing and selling capital securities and utilizing sale proceeds to acquire junior subordinated debt issued by the Company. During the second quarter of 2007, the Master Trust issued $25,000 of trust preferred securities with a 30-year maturity, callable after the fifth year by the Company. The trust preferred securities have a quarterly adjustable rate based upon the London Interbank Offered Rate (“LIBOR”) plus 1.56% . On December 31, 2008 the rate was 3.56% .
The junior subordinated debentures are the sole assets of the Master Trust, and payments under the junior subordinated debentures are the sole revenues of the Trust. All of the common securities of the Master Trust are owned by the Company. Washington Banking Company has fully and unconditionally guaranteed the capital securities along with all obligations of the Master Trust under the trust agreements.
(10) Income Taxes
The following table presents the components of income tax expense attributable to continuing operations included in the consolidated statements of income for the years ended December 31:
| | | | | | |
| | | December 31 |
| | | 2008 | | 2007 | | 2006 |
| Federal: | | | | | | |
| Current tax expense | $ | 4,265 | $ | 4,178 | $ | 4,982 |
| Deferred tax expense (benefit) | | (336) | | 1 | | (684) |
| Total | $ | 3,929 | $ | 4,179 | $ | 4,298 |
Reconciliation between the statutory federal income tax rate and the effective tax rate is as follows:
| | | | | | | | | |
| | | December 31 |
| | | 2008 | | 2007 | | 2006 |
| Income tax expense at federal statutory rate | $ | 4,291 | 35.0% | $ | 4,752 | 35.0% | $ | 4,744 | 34.4% |
| Federal tax credits | | (400) | (3.3%) | | (400) | (2.9%) | | (400) | (2.9%) |
| Interest income on tax-exempt securities | | (218) | (1.8%) | | (382) | (2.8%) | | (305) | (2.2%) |
| Other liabilities | | 256 | 2.1% | | 209 | 1.5% | | 259 | 1.9% |
| Total | $ | 3,929 | 32.0% | $ | 4,179 | 30.8% | $ | 4,298 | 31.2% |
Federal tax credits are related to the New Markets Tax Credit program, whereby a subsidiary of the Bank has been awarded $3,100 in future Federal tax credits which are available through 2012. Tax benefits related to these credits will be recognized for financial reporting purposes in the same periods that the credits are recognized in the Company’s income tax returns. The Company believes that it has complied with the various regulatory provisions of the New Markets Tax Credit program for all years presented, and therefore has reflected the impact of these credits in its estimated annual effective tax rate for all years presented.
55
NOTES TO CONSOLIDATED FINANCIAL STATEMENTS (Continued)
(Dollars in thousands, except per share data)
(10) Income Taxes- (Continued)
The following table presents major components of the net deferred income tax asset resulting from differences between financial reporting and tax basis:
| | | | |
| | | December 31 |
| | | 2008 | | 2007 |
| Deferred tax assets: | | | | |
| Allowance for loan loss | $ | 4,288 | $ | 3,894 |
| Deferred compensation | | 350 | | 394 |
| Other | | 51 | | 6 |
| Total deferred tax assets | | 4,689 | | 4,294 |
| Deferred tax liabilities: | | | | |
| Deferred loan fees | | 1,886 | | 1,859 |
| Premises and equipment | | 180 | | 304 |
| FHLB stock dividend | | 152 | | 152 |
| Investment in partnership | | 420 | | 280 |
| Prepaid expenses | | 144 | | 127 |
| Market value adjustment of investment securities available for sale | | 157 | | 57 |
| Other | | 43 | | 45 |
| Total deferred tax liabilities | | 2,982 | | 2,824 |
| Deferred tax assets, net | $ | 1,707 | $ | 1,470 |
There was no valuation allowance for deferred tax assets as of December 31, 2008 or 2007. The Company has determined that it is not required to establish a valuation allowance for the deferred tax assets as management believes it is more likely than not that the deferred tax asset will be realized in the normal course of business.
(10) Earnings Per Share
The following illustrates the reconciliation of the numerators and denominators of the basic and diluted earnings per share (“EPS”) computations:
| | | | | | |
| | | Year Ended December 31, 2008 |
| | | Income | | Weighted average shares | | Per share amount |
| Basic EPS | | | | | | |
| Income available to common shareholders | $ | 8,332 | | 9,465,000 | | 0.88 |
| Effect of dilutive securities: stock awards | | — | | 48,000 | | — |
| Diluted EPS | $ | 8,332 | | 9,513,000 | | 0.88 |
| |
| |
| | | Year Ended December 31, 2007 |
| | | Income | | Weighted average shares | | Per share amount |
| Basic EPS | | | | | | |
| Income available to common shareholders | $ | 9,398 | | 9,365,000 | $ | 1.00 |
| Effect of dilutive securities: stock awards | | — | | 128,000 | | (0.01) |
| Diluted EPS | $ | 9,398 | | 9,493,000 | $ | 0.99 |
56
NOTES TO CONSOLIDATED FINANCIAL STATEMENTS (Continued)
(Dollars in thousands, except per share data)
(10) Earnings Per Share-(Continued)
| | | Year Ended December 31, 2006 |
| | | Income | | Weighted average shares | | Per share amount |
| Basic EPS | | | | | | |
| Income available to common shareholders | $ | 9,491 | | 9,217,000 | $ | 1.03 |
| Effect of dilutive securities: stock options | | — | | 273,000 | | (0.03) |
| Diluted EPS | $ | 9,491 | | 9,490,000 | $ | 1.00 |
On September 6, 2006, the Company issued a 5-for-4 stock split to shareholders of record as of August 21, 2006. All periods presented have been restated to reflect the stock splits.
(11)Employee Benefit Plans
(a)401(k) and Profit Sharing Plan:During 1993, the Board of Directors approved a defined contribution plan (“the Plan”). The Plan covers substantially all full-time employees and many part-time employees once they meet the age and length of service requirements. The Plan allows for a voluntary salary reduction, under which eligible employees are permitted to defer a portion of their salaries, with the Company contributing a percentage of the employee’s contribution to the employee’s account. Employees are fully vested in their elected and employer-matching contributions at all times. At the discretion of the Board of Directors, an annual profit sharing contribution may be made to eligible employees. Profit sharing contributions vest over a six-year period.
The Company’s contributions for the years ended December 31, 2008, 2007 and 2006 under the employee matching feature of the plan were $273, $280 and $230, respectively. This represents a match of the participating employees’ salary deferral of 50% of the first 6% of the compensation deferred for 2008 and 2007 and 5% for 2006. There were no contributions under the profit sharing portion of the plan for the years presented.
(b)Deferred Compensation Plan:In December 2000, the Bank approved the adoption of an Executive Deferred Compensation Plan (“Comp Plan”) to take effect January 2001, under which select participants may elect to defer receipt of a portion of eligible compensation. The following is a summary of the principal provisions of the Compensation Plan:
Purpose: The purpose of the Comp Plan is to (1) provide a deferred compensation arrangement for a select group of management or highly compensated employees within the meaning of Sections 201(2) and 301(a)(3) of ERISA and directors of the Bank, and (2) attract and retain the best available personnel for positions of responsibility with the Bank and its subsidiaries. The Comp Plan is intended to be an unfunded deferred compensation agreement. Participation in the Comp Plan is voluntary.
Source of Benefits: Benefits under the Comp Plan are payable solely by the Bank. To enable the Bank to meet its financial commitment under the Comp Plan, assets may be set aside in a corporate-owned vehicle. These assets are available to all general creditors of the Bank in the event of the Bank’s insolvency. Participants of the Comp Plan are unsecured general creditors of the Bank with respect to the Comp Plan benefits. Deferrals under the Comp Plan may reduce compensation used to calculate benefits under the Bank’s 401(k) Plan.
At December 31, 2008 and 2007, liabilities recorded in connection with deferred compensation plan benefits totaled $750 and $866, respectively, and are recorded in other liabilities.
(c)Bank Owned Life Insurance:During the second quarter of 2004 and 2007, the Bank made $10,000 and $5,000 investments, respectively in BOLI. These policies insure the lives of officers of the Bank, and name the Bank as beneficiary. Noninterest income is generated tax-free (subject to certain limitation) from the increase in the policies' underlying investments made by the insurance company.
57
NOTES TO CONSOLIDATED FINANCIAL STATEMENTS (Continued)
(Dollars in thousands, except per share data)
(12) Stock-Based Compensation
The Company adopted the 2005 Stock Incentive Plan (“2005 Plan”) following stockholders’ approval at the 2005 Annual Meeting of Stockholders. Subsequent to the adoption of the 2005 Plan, no additional grants may be issued under the prior plans.
The 2005 Plan provides grants of up to 833,333 shares, which includes any remaining shares subject to stock awards under the prior plans for future awards, or which have been forfeited, cancelled or expire. Grants from the 2005 Plan may take any of the following forms: incentive stock options, nonqualified stock options, restricted stock, restricted units, performance shares, performance units, stock appreciation rights or dividend equivalent rights. As of December 31, 2008, the Company had 581,152 shares available for grant.
(a)Stock Options:Under the terms of the 2005 Plan, the exercise price of each incentive stock option must be greater than or equal to the market price of the Company’s stock on the date of the grant. The plan further provides that no stock option granted to a single grantee may exceed $100 in aggregate fair market value in a single calendar year. Stock options vest over a period of no greater than five years from the date of grant. Additionally, the right to exercise the option terminates ten years from the date of grant.
On January 1, 2006, the Company adopted the provisions of SFAS 123R,Share Based Payment, requiring the Company to recognize expense related to the fair value of stock option awards. The Company elected to use the modified prospective transition method as permitted by SFAS 123R and therefore has not restated the financial results for prior periods. Under this transition method, stock option compensation expense for the twelve months ended December 31, 2006 includes compensation expense for all stock option compensation awards granted prior to, but not yet vested as of January 1, 2006, based on the grant date fair value estimated in accordance with the original provisions of SFAS 123. Stock option compensation expense for all stock option compensation awards granted subsequent to January 1, 2006 was based on the grant date fair value estimated in accordance with the provisions of SFAS 123R. The Company recognizes compensation expense for stock option awards on a straight-line basis over the requisite service period of the award.
The Company measures the fair value of each stock option grant at the date of the grant, using the Black Scholes option pricing model using assumptions noted in the following table.
Expected volatility is based on the historical volatility of the price of the Company’s common stock. The Company uses historical data to estimate option exercise and stock option forfeiture rates within the valuation model. The expected term of options granted is determined based on historical experience with similar options, giving consideration to the contractual terms and vesting schedules, and represents the period of time that options granted are expected to be outstanding. The expected dividend yield is based on dividend trends and the market value of the Company’s common stock at the time of grant. The risk-free rate for periods within the contractual life of the option is based on the U.S. Treasury yield curve in effect at the time of grant.
The following weighted average assumptions were used to determine the fair value of stock option grants as of the grant date to determine compensation cost under SFAS No. 123R for the years ended December 31, 2008, 2007 and 2006:
| | | | | |
| | 2008 | | 2007 | | 2006 |
| Risk-free interest rate | 1.65%- 3.44% | | 4.59% | | 4.32%-4.95% |
| Dividend yield rate | 2.80%-2.90% | | 1.50% | | 1.20%-1.40% |
| Price volatility | 40.50%-46.99% | | 33.00% | | 38.13% |
| Expected life of options | 5 years | | 5 years | | 7 years |
| Weighted average grant date fair value of options granted | $2.82 | | $5.11 | | $6.10 |
58
NOTES TO CONSOLIDATED FINANCIAL STATEMENTS (Continued)
(Dollars in thousands, except per share data)
(12) Stock-Based Compensation-(Continued)
The following table summarizes information about stock options outstanding at December 31, 2008:
| | | | | | | | | |
| | | | Outstanding | | | | | Exercisable | |
| | | | Weighted | | | | | Weighted | |
| Exercise Price | | | average | Average | | | | average | Average |
| Range | Shares | | exercise price | Life(1) | | Shares | | exercise price | Life(1) |
| $ 4.39 to 5.00 | 35,781 | $ | 4.50 | 2.73 | | 35,781 | $ | 4.50 | 2.73 |
| 5.01 to 8.50 | 26,394 | | 6.42 | 4.12 | | 24,394 | | 6.29 | 4.12 |
| 8.51 to 12.00 | 125,500 | | 9.11 | 9.49 | | — | | — | — |
| 12.01 to 15.50 | 20,465 | | 14.59 | 6.99 | | 9,626 | | 14.59 | 7.03 |
| 15.51 to 17.35 | 46,074 | | 15.98 | 8.17 | | 10,795 | | 15.98 | 8.17 |
| | 254,214 | $ | 9.87 | 7.58 | | 80,596 | $ | 5.36 | 4.26 |
| | | | | | |
| (1)Average contractual life remaining in years. | | | | | | |
| |
| The following table summarizes information on stock option activity during 2008: | | | |
| |
| | | | Weighted | | | Aggregate |
| | | | average | Average | | intrinsic |
| | Shares | | exercise price | Life(1) | | value |
| Outstanding at January 1, 2008 | 192,618 | $ | 9.63 | | $ | 4 |
| Granted | 133,500 | | 9.09 | | | |
| Exercised | (52,374) | | 5.52 | | $ | 319 |
| Forfeited, expired or cancelled | (19,530) | | 13.90 | | | |
| Outstanding at December 31, 2008 | 254,214 | $ | 9.87 | 7.58 | $ | 210 |
| |
| Exercisable at December 31, 2008 | 80,596 | $ | 5.36 | 4.26 | $ | 209 |
| (1)Average contractual life remaining in years. | | | | | | |
The aggregate intrinsic value in the table above represents the total pretax intrinsic value (i.e., the difference between the Company’s closing stock price on the date of exercise or December 31, 2008 and the exercise price, times the number of shares) that was received or would have been received by the option holders had all the option holders exercised their options on December 31, 2008. This amount changes based upon the fair market value of the Company’s stock. The total intrinsic value of options exercised for the years ended December 31, 2008, 2007 and 2006 was $319, $1,976 and $1,709, respectively.
For the year ended December 31, 2008, 2007 and 2006, the Company recognized, $150, $109 and $110, respectively, in stock option compensation expense as a component of salaries and benefits. As of December 31, 2008 there was approximately $485 of total unrecognized compensation cost related to non-vested options which is expected to be recognized over a weighted-average period of 2.71 years.
(b)Restricted Stock Awards:The Company grants restricted stock periodically for the benefit of employees. Recipients of restricted stock do not pay any cash consideration to the Company for the shares and receive all dividends with respect to such shares, whether or not the shares have vested. Restrictions are based on continuous service.
59
NOTES TO CONSOLIDATED FINANCIAL STATEMENTS (Continued)
(Dollars in thousands, except per share data)
(12) Stock-Based Compensation -(Continued) The following table summarizes information on restricted stock activity during 2008:
| | | | Weighted | | Weighted average |
| | | | average grant | | remaining contractual |
| | Shares | | price per share | | terms (in years) |
| Outstanding at January 1, 2008 | 29,561 | $ | 13.49 | | |
| Granted | — | | — | | |
| Vested | (17,988) | | 13.67 | | |
| Forfeited, expired or cancelled | (1,290) | | 13.41 | | |
| Outstanding at December 31, 2008 | 10,283 | $ | 13.19 | | 1.69 |
The aggregate intrinsic value in the table above represents the total pretax intrinsic value (i.e., the difference between the Company’s closing stock price on the date of exercise or December 31, 2008 and the exercise price, times the number of shares) that was received or would have been received by the option holders had all the option holders exercised their options on December 31, 2008. This amount changes based upon the fair market value of the Company’s stock. The total intrinsic value of restricted stock vested for the years ended December 31, 2008, 2007 and 2006 was $223, $300 and $204, respectively.
For years ended December 31, 2008, 2007 and 2006 the Company recognized $181, $191 and $206 respectively, in restricted stock compensation expense as a component of salaries and benefits. As of December 31, 2008 there was $114 of total unrecognized compensation costs related to non-vested restricted stock which is expected to be recognized over a weighted-average period of 1.69 years.
(c)Restricted Stock Units:The Company grants restricted stock units periodically for the benefit of employees. Recipients of restricted stock units receive shares of the Company’s stock upon the lapse of their related restrictions and do not pay any cash consideration to the Company for the shares. Restrictions are based on continuous service.
The following table summarizes information on restricted stock unit activity during 2008:
| | | | Weighted average | | Weighted average |
| | | | grant price per | | remaining contractual |
| | Shares | | share | | terms (in years) |
| Outstanding at January 1, 2008 | 17,815 | $ | 15.98 | | |
| Granted | 18,075 | | 11.83 | | |
| Vested | (15,443) | | 11.45 | | |
| Forfeited, expired or cancelled | (1,736) | | 13.21 | | |
| Outstanding at December 31, 2008 | 18,711 | $ | 15.97 | | 1.68 |
The aggregate intrinsic value in the table above represents the total pretax intrinsic value (i.e., the difference between the Company’s closing stock price on the date of exercise or December 31, 2008 and the exercise price, times the number of shares) that was received or would have been received by the option holders had all the option holders exercised their options on December 31, 2008. This amount changes based upon the fair market value of the Company’s stock.
For year ended December 31, 2008 and 2007 the Company recognized $236 and $44, respectively, in restricted stock unit compensation expense as a component of salaries and benefits. The Company did not issue any restricted stock units prior to 2007. As of December 31, 2008 there was $242 of total unrecognized compensation costs related to non-vested restricted stock units which is expected to be recognized over a weighted-average period of 1.68 years.
60
NOTES TO CONSOLIDATED FINANCIAL STATEMENTS (Continued)
(Dollars in thousands, except per share data)
(13) Regulatory Capital Matters
The Company is subject to various regulatory capital requirements administered by the federal banking agencies. Failure to meet minimum capital requirements can initiate certain mandatory and possibly additional discretionary actions by regulators that, if undertaken, could have a direct material effect on the Company’s financial statements. Under capital adequacy guidelines and the regulatory framework for prompt corrective action, the Company must meet specific capital guidelines that involve quantitative measures of the Company’s assets, liabilities and certain off-balance sheet items as calculated under regulatory accounting practices. The Company’s capital amounts and classification are also subject to qualitative judgments by the regulators about risk components, asset risk weighting and other factors.
Risk-based capital guidelines issued by the FDIC establish a risk-adjusted ratio relating capital to different categories of assets and off-balance sheet exposures for banks. The Bank’s Tier 1 capital is comprised primarily of common equity and trust preferred securities, and excludes the equity impact of adjusting available-for-sale securities to fair value. Total capital also includes a portion of the allowance for loan losses, as defined according to regulatory guidelines. In addition, under Washington State banking regulations, the Bank is limited as to the ability to declare or pay dividends to the Company up to the amount of the Bank’s retained earnings then on hand. Quantitative measures established by regulation to ensure capital adequacy require the Bank to maintain minimum amounts and ratios (set forth in the following table) of total and Tier 1 capital to risk-weighted assets (as defined in the regulations), and of Tier 1 capital to avera ge assets (as defined in the regulations). As of December 31, 2008, the Company and Bank met the minimum capital requirements to which it is subject and is considered to be “well-capitalized.”
The following tables describe the Company’s and Bank’s regulatory capital and threshold requirements for the 2008 and 2007 periods:
| | | | | | | | | To be well-capitalized |
| | | | | | For capital | | under prompt corrective |
| | | Actual | | adequacy purposes | | action provisions |
| December 31, 2008: | | | | | | Minimum | | | Minimum |
| | | Amount | Ratio | | Amount | ratio | | Amount | ratio |
| Total risk-based capital | | | | | | | | | |
| (to risk-weighted assets) | | | | | | | | | |
| Consolidated | $ | 116,260 | 13.23% | $ | 70,308 | 8.00% | $ | N/A | |
| Whidbey Island Bank | | 114,890 | 13.10% | | 70,168 | 8.00% | | 87,709 | 10.00% |
| Tier 1 capital | | | | | | | | | |
| (to risk-weighted assets) | | | | | | | | | |
| Consolidated | | 105,259 | 11.98% | | 35,154 | 4.00% | | N/A | |
| Whidbey Island Bank | | 103,911 | 11.85% | | 35,084 | 4.00% | | 52,626 | 6.00% |
| Tier 1 capital | | | | | | | | | |
| (to average assets) | | | | | | | | | |
| Consolidated | | 105,259 | 11.68% | | 36,059 | 4.00% | | N/A | |
| Whidbey Island Bank | | 103,911 | 11.54% | | 36,016 | 4.00% | | 45,020 | 5.00% |
| |
| | | | | | | | | To be well-capitalized |
| | | | | | For capital | | under prompt corrective |
| | | Actual | | adequacy purposes | | action provisions |
| December 31, 2007: | | | | | | Minimum | | | Minimum |
| | | Amount | Ratio | | Amount | ratio | | Amount | ratio |
| Total risk-based capital | | | | | | | | | |
| (to risk-weighted assets) | | | | | | | | | |
| Consolidated | $ | 109,436 | 12.45% | $ | 70,327 | 8.00% | $ | N/A | |
| Whidbey Island Bank | | 105,629 | 12.03% | | 70,218 | 8.00% | | 87,772 | 10.00% |
| Tier 1 capital | | | | | | | | | |
| (to risk-weighted assets) | | | | | | | | | |
| Consolidated | | 97,934 | 11.14% | | 35,163 | 4.00% | | N/A | |
| Whidbey Island Bank | | 94,658 | 10.78% | | 35,109 | 4.00% | | 52,663 | 6.00% |
| Tier 1 capital | | | | | | | | | |
| (to average assets) | | | | | | | | | |
| Consolidated | | 97,934 | 11.29% | | 34,694 | 4.00% | | N/A | |
| Whidbey Island Bank | | 94,658 | 10.92% | | 34,659 | 4.00% | | 43,324 | 5.00% |
61
NOTES TO CONSOLIDATED FINANCIAL STATEMENTS (Continued)
(Dollars in thousands, except per share data)
(14) Fair Value Measurements and the Fair Value of Financial Instruments
The Financial Accounting Standards Board (“FASB”) has issued several significant FASB statements on the measurement and or reporting of financial instruments at fair value. Additionally, recent FASB statements have amended previously issued FASB statements. To add further complexity to an already complex issue, entities have been permitted to determine whether or not to measure certain financial instruments at fair value and report the changes in the fair value of these financial instruments in their statements of income. Furthermore, all entities are required to measure certain financial instruments at fair value and record the changes in fair value of these financial instruments in their statements of comprehensive income.
This footnote will address three key issues: 1) The footnote will help define the key concepts of fair value and financial instruments. 2) The footnote will identify the key FASB statements related to this issue and the Company’s adoption position. 3) The footnote will provide the required disclosures for the FASB statements adopted.
1) Key Concepts:
Fair Value:FAS No. 157 defines fair value as “the price that would be received to sell an asset or paid to transfer a liability in an orderly transaction between market participants at the measurement date.”
The Company determines fair value based upon quoted prices when available or through the use of alternative approaches, such as matrix or model pricing, when market quotes are not readily accessible or available.
Financial Instrument:FAS No. 107 defines a financial instruments as “as cash, evidence of an ownership interest in an entity, or a contract that both:
a. Imposes on one entity a contractual obligation (1) to deliver cash or another financial instrument to a second entity or (2) to exchange other financial instruments on potentially unfavorable terms with the second entity.
b. Conveys to that second entity a contractual right (1) to receive cash or another financial instrument from the first entity or (2) to exchange other financial instruments on potentially favorable terms with the first entity.”
Financial instruments for the Company represent one of two categories:
| | 1. | Assets:Consisting primarily of cash, short investments (interest bearing deposits, federal funds sold) securities, and loans. |
| | | |
| 2. | Liabilities:Consisting primarily of deposits and various forms of borrowings (overnight borrowings, junior subordinated debentures, other term borrowings) |
The Company further defines these financial instruments in the determination of fair value section of this footnote.
| 2) Key FASB Statements and the Company’s Adoption Position: |
FAS No. 107,Disclosures about Fair Value of Financial Instruments:This Statement extends existing fair value disclosure practices for some instruments by requiring all entities to disclose the fair value of financial instruments, both assets and liabilities recognized and not recognized in the statement of financial position, for which it is practicable to estimate fair value. If estimating fair value is not practicable, this Statement requires disclosure of descriptive information pertinent to estimating the value of a financial instrument. This Statement is effective for financial statements issued for fiscal years ending after December 15, 1992, except for entities with less than $150 million in total assets in the current statement of financial position. For those entities, the effective date is for fiscal years ending after December 15, 1995.
Company’s Position:The Company has adopted FAS No. 107 and has disclosed the required footnote information in all public filings since its initial public offering in 1996.
62
NOTES TO CONSOLIDATED FINANCIAL STATEMENTS (Continued)
(Dollars in thousands, except per share data)
(14) Fair Value of Financial Instruments-(Continued)
FAS No. 157,Fair Value Measurements:This Statement, issued in September 2006, defines fair value, establishes a framework for measuring fair value in generally accepted accounting principles (GAAP), and expands disclosures about fair value measurements. This Statement applies under other accounting pronouncements that require or permit fair value measurements, FASB having previously concluded in those accounting pronouncements that fair value is the relevant measurement attribute. Accordingly, this Statement does not require any new fair value measurements. However, for some entities, the application of this Statement will change current practice. This Statement is effective for financial statements issued for fiscal years beginning after November 15, 2007, and interim periods within those fiscal years.
Additionally, FAS No. 157 amended FAS No. 107,Disclosure about Fair Value of Financial Instruments(FAS 107), and, as such, the Company follows FAS No. 157 in determination of FAS No. 107 fair value disclosure amounts.
Company’s Position:Effective January 1, 2008 the Company adopted FAS No. 157 and has disclosed the required footnote information in its interim period public filings.
FAS No. 159,The Fair Value Option for Financial Assets and Financial Liabilities:This Statement permits entities to choose to measure many financial instruments and certain other items at fair value. The objective is to improve financial reporting by providing entities with the opportunity to mitigate volatility in reported earnings caused by measuring related assets and liabilities differently without having to apply complex hedge accounting provisions. This Statement is expected to expand the use of fair value measurement, which is consistent with the Board’s long-term measurement objectives for accounting for financial instruments. This Statement is effective as of the fiscal years that begins after November 15, 2007. Early adoption is permitted as of the beginning of a fiscal year that begins on or before November 15, 2007, provided the entity also elects to apply the provisions of FASB Statement No. 157,Fair Value Measurements.
The Company determines fair value based upon quoted prices when available or through the use of alternative approaches, such as matrix or model pricing, when market quotes are not readily accessible or available.
Company’s Position:The Company has declined to adopt FAS No. 159. The Company determined that the statement at this time would not provide additional useful information, to the user of the financial statements, regarding the financial position of the Company.
3) FAS No. 107 and No. 157 Footnote Disclosure:
FAS No. 157 Fair Value Hierarchy:
The valuation techniques required by Statement No. 157 are based upon observable and unobservable inputs. Observable inputs reflect market data obtained from independent sources, while unobservable inputs reflect the Company’s market assumptions. These two types of inputs create the following fair value hierarchy:
| | Level 1: | Quoted prices for identical instruments in active markets. |
|
Level 2: |
Quoted prices for similar instruments in active markets; quoted prices for identical or similar instruments in markets that are not active; and model-derived valuations whose inputs are observable or whose significant value drivers are observable.
|
|
Level 3: |
Unobservable inputs that are supported by little or no market activity and that are significant to the fair value of the asset or liability. Unobservable inputs are used to measure fair value to the extent that observable inputs are not available. The Company’s own data used to develop unobservable inputs shall be adjusted for market consideration when reasonably available.
|
63
NOTES TO CONSOLIDATED FINANCIAL STATEMENTS (Continued)
(Dollars in thousands, except per share data)
(14) Fair Value of Financial Instruments-(Continued)
Determination of Fair Value
Under FAS No. 157, the Company bases its fair values on the price that would be received to sell an asset or paid to transfer a liability in an orderly transaction between market participants at the measurement date. It is the Company’s policy to maximize the use of observable inputs and minimize the use of unobservable inputs when developing fair value measurements, in accordance with the fair value hierarchy in FAS No. 157.
Fair value measurements for assets and liabilities where there exists limited or no observable market data and, therefore, are based primarily upon the Company’s own estimates, are often calculated based on current pricing policy, the economic and competitive environment, the characteristics of the asset or liability and other such factors. Therefore, the results cannot be determined with precision and may not be realized in an actual sale or immediate settlement of the asset or liability. Additionally, there may be inherent weaknesses in any calculation technique, and changes in the underlying assumptions used, including discount rates and estimates of future cash flows, that could significantly affect the results of current or future values.
Following is a description of valuation methodologies used for assets and liabilities recorded at fair value and for estimating fair value for financial instruments not recorded at fair value (FAS No. 107 disclosures).
Cash and Cash Equivalents:The carrying value of cash and cash equivalent instruments approximates fair value.
Interest-bearing Deposits:The carrying values of interest-bearing deposits maturing within ninety days approximate their fair values. Fair values of other interest-earning deposits are estimated using discounted cash flow analyses based on current rates for similar types of deposits.
Federal Funds Sold:The carrying value of federal funds sold approximates fair value.
Investments in Debt and Equity Securities: When available, the Company uses quoted market prices to determine the fair value of investment securities. These investments are included in Level 1. When quoted market prices are unobservable, the Company uses quotes from independent pricing vendors based on recent trading activity and other relevant information including market interest rate curves, referenced credit spreads and estimated prepayment rates where applicable. These investments are included in Level 2 and comprise the Company’s portfolio of U.S. agency securities, municipal bonds and one mortgage-backed security.
Loans Held for Sale:The carrying value of loans held for sale approximates fair value.
Loans:The loan portfolio is composed of commercial, consumer, real estate construction and real estate loans. The carrying value of variable rate loans approximates their fair value. The fair value of fixed rate loans is estimated by discounting the estimated future cash flows of loans, sorted by type and security, by the weighted average rate of such loans and rising rates currently offered by the Bank for similar loans.
Impaired Loans:A loan is considered impaired when, based upon currently known information, it is deemed probable that the Company will be unable to collect all amounts due as scheduled according to the original terms of the agreement. Impaired loans are measured based on the present value of expected future cash flows discounted at the loan’s effective interest rate or, as a practical expedient, based on the loan’s observable market price or the fair value of collateral, if the loan is collateral dependent. Impaired loans, which are collateral dependent, are included in the nonrecurring basis table below.
Other Real Estate Owned:Other real estate owned (“OREO”) includes properties acquired through foreclosure. These properties are recorded at the lower of cost or estimated fair value (less estimated cost to sell), based on periodic evaluations. Other real estate owned, which has been recorded at estimated fair value is included in the nonrecurring basis table below.
64
NOTES TO CONSOLIDATED FINANCIAL STATEMENTS (Continued)
(Dollars in thousands, except per share data)
(14) Fair Value of Financial Instruments-(Continued)
Deposits:For deposits with no contractual maturity such as checking accounts, money market accounts and savings accounts, fair values approximate book values. The fair value of certificates of deposit are based on discounted cash flows using the difference between the actual deposit rate and an alternative cost of funds rate, currently offered by the Bank for similar types of deposits.
FHLB Overnight Borrowings:The carrying value of FHLB overnight borrowings approximates fair value.
Trust Preferred Securities/Junior Subordinated Debentures:The fair value of trust preferred securities is estimated at their recorded value due to the cost of the instrument re-pricing on a quarterly basis.
Other Borrowed Funds:Other borrowed funds consist of FHLB advances. The carrying amount of FHLB advances is estimated using discounted cash flow analyses based on the Company’s current incremental borrowing rates of similar types of borrowing arrangements.
Off-Balance Sheet Items:Commitments to extend credit represent the principal category of off-balance sheet financial instruments (see Note 16). The fair value of these commitments is not material since they are for relatively short periods of time and are subject to customary credit terms, which would not include terms that would expose the Company to significant gains or losses.
FAS No. 157,Fair Value Measurements,Assets and Liabilities Recorded at Fair Value on a Recurring Basis:
The following table presents the Company’s assets measured at fair value on a recurring basis for the year ending December 31, 2008:
| | | | | | | | |
| | | Year Ended December 31, 2008: |
| | | Level 1 | | Level 2 | | Level 3 | | Total |
| Investment securities | $ | — | $ | 17,798 | $ | — | $ | 17,798 |
| Total | $ | — | $ | 17,798 | $ | — | $ | 17,798 |
FAS No. 157,Fair Value Measurements,Assets and Liabilities Recorded at Fair Value on a Nonrecurring Basis:The Company may be required, from time to time, to measure certain assets at fair value on a nonrecurring basis in accordance with GAAP. These adjustments to fair value usually result from application of lower-of-cost-or-market accounting or write-downs of individual assets. The valuation methodologies used to measure these fair value adjustments are described previously in this Note. For assets measured at fair value on a nonrecurring basis in 2008 and 2007 that were still held in the balance sheet at the respective year ends, the following table provides the level of valuation assumptions used to determine each adjustment and the carrying value of the related individual assets or portfolios at year end.
The following table presents the Company’s assets measured at fair value on a nonrecurring basis for the year ending December 31, 2008:
| | | | | | | | | | |
| | | Year Ended December 31, 2008: |
| | | | | | | | | | | Total losses |
| | | Carrying value at year end | | for year |
| | | Level 1 | | Level 2 | | Level 3 | | Total | | ended |
| Impaired loans(1) | $ | — | $ | — | $ | 1,786 | $ | 1,786 | $ | (132) |
| Other real estate owned(2) | | | | | | 2,226 | | 2,226 | | (86) |
| Total | $ | — | $ | — | $ | 4,012 | $ | 4,012 | $ | (218) |
| (1) | Represents carrying value and related specific valuation allowances, which are included in the allowance for loan losses. |
| (2) | Represents the fair value and related losses of foreclosed real estate and other collateral owned that were measured at fair value subsequent to their initial classification as other real estate owned. |
65
NOTES TO CONSOLIDATED FINANCIAL STATEMENTS (Continued)
(Dollars in thousands, except per share data)
(14) Fair Value of Financial Instruments-(Continued)
FAS No. 107,Disclosures about Fair Value of Financial Instruments
The table below is a summary of fair value estimates as of December 31, 2008 and 2007, for financial instruments, as defined by FAS No. 107. The carrying amounts in the following table are recorded in the balance sheet under the indicated captions.
In accordance with FAS No. 107, the Company has not included assets and liabilities that are not financial instruments in our disclosure, such as the value of the premises and equipment, deferred taxes and other liabilities.
| | | | | | | | |
| | | | | December 31 | | |
| | | | 2008 | | | | 2007 | |
| | | Carrying | | Estimated | | Carrying | | Estimated |
| | | value | | fair value | | value | | fair value |
| Financial assets: | | | | | | | | |
| Cash and cash equivalents | $ | 13,609 | $ | 13,609 | $ | 18,795 | $ | 18,795 |
| Interest-earning deposits | | 381 | | 381 | | 257 | | 257 |
| FHLB stock | | 2,430 | | 2,430 | | 1,984 | | 1,984 |
| Investment securities- available for sale | | 17,798 | | 17,798 | | 13,832 | | 13,832 |
| Loans held for sale | | 2,896 | | 2,896 | | 2,347 | | 2,347 |
| Loans | | 823,068 | | 822,840 | | 805,862 | | 801,728 |
| |
| Financial liabilities: | | | | | | | | |
| Deposits | | 747,159 | | 752,249 | | 758,354 | | 761,875 |
| FHLB overnight borrowings | | 11,640 | | 11,640 | | 20,500 | | 20,500 |
| Junior subordinated debentures | | 25,774 | | 16,090 | | 25,774 | | 23,463 |
| Other borrowed funds | | 30,000 | | 30,399 | | — | | — |
| |
| |
| (15) Washington Banking Company Information | | | | | | |
The summarized condensed financial statements for Washington Banking Company (parent company only) are presented in the following table:
| | | | |
| | | December 31 |
Condensed Balance Sheets | | 2008 | | 2007 |
| Assets: | | | | |
| Cash and cash equivalents | $ | 460 | $ | 3,304 |
| Other assets | | 940 | | 549 |
| Investment in subsidiaries | | 104,986 | | 95,557 |
| Total assets | $ | 106,386 | $ | 99,410 |
| |
| Liabilities: | | | | |
| Junior subordinated debentures | $ | 25,774 | $ | 25,774 |
| Other liabilities | | 52 | | 66 |
| Shareholders’ equity: | | | | |
| Common stock | | 33,701 | | 32,812 |
| Retained earnings | | 46,567 | | 40,652 |
| Accumulated other comprehensive income, net | | 292 | | 106 |
| Total shareholders’ equity | | 80,560 | | 73,570 |
| Total liabilities and shareholders’ equity | $ | 106,386 | $ | 99,410 |
66
NOTES TO CONSOLIDATED FINANCIAL STATEMENTS (Continued)
(Dollars in thousands, except per share data)
(15) Washington Banking Company Information- (Continued) | | | | | | |
| |
| | | Years Ended December 31 |
Condensed Statements of Income | | 2008 | | 2007 | | 2006 |
| Interest income: | | | | | | |
| Interest-earning deposits | $ | 2 | $ | 39 | $ | 26 |
| Common securities | | 38 | | 54 | | 41 |
| Total interest income | | 40 | | 93 | | 67 |
| Interest expense: | | | | | | |
| Junior subordinated debentures | | 1,254 | | 1,762 | | 1,337 |
| Net expense | | (1,214) | | (1,669) | | (1,270) |
| Noninterest expense | | 1,170 | | 1,356 | | 482 |
| Loss before income tax benefit and | | | | | | |
| undistributed earnings of subsidiaries | | (2,384) | | (3,025) | | (1,752) |
| Income tax benefit | | 833 | | 1,075 | | 603 |
| Loss before undistributed earnings of subsidiaries | | (1,551) | | (1,950) | | (1,149) |
| Undistributed earnings of subsidiaries | | 8,683 | | 10,548 | | 7,790 |
| Dividend income from the Bank | | 1,200 | | 800 | | 2,850 |
| Net income | $ | 8,332 | $ | 9,398 | $ | 9,491 |
| |
| Condensed Statements of Cash Flows | | Years Ended December 31 |
| | | 2008 | | 2007 | | 2006 |
| Operating activities: | | | | | | |
| Net income from continuing operations | $ | 8,332 | $ | 9,398 | $ | 9,491 |
| Adjustments to reconcile net income to net cash | | | | | | |
| used in operating activities: | | | | | | |
| Equity in undistributed earnings of subsidiaries | | (8,676) | | (10,383) | | (7,790) |
| Stock-based compensation | | — | | 10 | | 23 |
| Other assets | | (405) | | 847 | | (191) |
| Cash flows provided by operating activities | | (749) | | (128) | | 1,533 |
| |
| Investing activities: | | | | | | |
| Investment in subsidiaries | | — | | (5,741) | | (41) |
| |
| Financing activities: | | | | | | |
| Gross payments on junior subordinated debentures | | — | | (15,007) | | — |
| New borrowings on junior subordinated debentures | | — | | 25,774 | | — |
| Dividends paid on common stock | | (2,417) | | (2,168) | | (1,858) |
| Common stock repurchased | | — | | (1,851) | | — |
| Proceeds from issuance of common stock- stock options | | 322 | | 1,302 | | 594 |
| Cash flows used in financing activities | | (2,095) | | 8,050 | | (1,264) |
| Net increase (decrease) in cash and cash equivalents | | (2,844) | | 2,181 | | 228 |
| Cash and cash equivalents at beginning of year | | 3,304 | | 1,123 | | 895 |
| Cash and cash equivalents at end of year | $ | 460 | $ | 3,304 | $ | 1,123 |
67
NOTES TO CONSOLIDATED FINANCIAL STATEMENTS (Continued)
(Dollars in thousands, except per share data)
(16)Commitments
(a)Leasing Arrangements:The Company is obligated under a number of noncancelable operating leases for land and buildings. The majority of these leases have renewal options. In addition, some of the leases contain escalation clauses tied to the consumer price index with caps.
At December 31, 2008 the Company’s future minimum rental payments required under land, buildings and equipment operating leases that have initial or remaining noncancelable lease terms of one year or more are as follows:
| | | | | | | | | | | | | | |
| | | 2009 | | 2010 | | 2011 | | 2012 | | 2013 | | Thereafter | | Total |
| Minimum Payments | $ | 486 | $ | 377 | $ | 376 | $ | 378 | $ | 338 | $ | 1,641 | $ | 3,596 |
Rent expense applicable to operating leases for the years ended December 31, 2008, 2007 and 2006 was $435, $426, and $419, respectively.
(b)Commitments to Extend Credit:Commitments to extend credit are agreements to lend to a customer as long as there is no violation of any condition established in the contract. Commitments generally have fixed expiration dates or other termination clauses and may require payment of a fee. Since many of the commitments are expected to expire without being drawn upon, the total commitment amounts do not necessarily represent future cash requirements. The amount of collateral obtained, if it is deemed necessary by the Bank upon extension of credit, is based on management’s credit evaluation of the counterparty. Collateral held varies, but may include: property, plant and equipment; accounts receivable; inventory; and income-producing commercial properties.
Standby letters of credit are conditional commitments issued by the Bank to guarantee the performance of a customer to a third party. Those guarantees are primarily issued to support public and private borrowing arrangements, including commercial paper, bond financing, and similar transactions. Except for certain long-term guarantees, the majority of guarantees expire in one year. The credit risk involved in issuing letters of credit is essentially the same as that involved in extending loan facilities to customers. Collateral supporting those commitments, for which collateral is deemed necessary, generally amounts to one hundred percent of the commitment amount at December 31, 2008.
The Bank has not been required to perform on any financial guarantees and did not incur any losses on its commitments in 2008 and 2007.
| | |
| Commitments to extend credit were as follows: | | |
| |
| | | December 31, 2008 |
| Loan commitments | | |
| Fixed rate | $ | 14,745 |
| Variable rate | | 131,859 |
| Standby letters of credit | | 1,865 |
| Total commitments | $ | 148,469 |
68
NOTES TO CONSOLIDATED FINANCIAL STATEMENTS (Continued)
(Dollars in thousands, except per share data)
(17) Related Party Transactions
As of December 31, 2008 and 2007, the Bank had loans to persons serving as directors and executive officers, and to entities related to such individuals. All loans were made on essentially the same terms and conditions as comparable transactions with other persons, and do not involve more than the normal risk of collectibility. The following table details the loan activity of related party transactions:
| | | | |
| | | Years Ended December 31 |
| | | 2008 | | 2007 |
| Beginning Balance | $ | 4,974 | $ | 2,034 |
| Additions | | 2,348 | | 9,467 |
| Payments | | 4,122 | | 6,527 |
| Ending Balance | $ | 3,200 | $ | 4,974 |
| |
| Available Credit | $ | 460 | $ | 1,661 |
Deposits from related parties held by the Bank at December 31, 2008 and 2007 totaled $5,970 and $6,875, respectively.
(18) Contingencies
The Company and its subsidiaries are from time to time defendants in and are threatened with various legal proceedings arising from regular business activities. Management believes the ultimate liability, if any, arising from such claims or contingencies will not have a material adverse effect on the Company’s results of operations or financial condition.
(19) Subsequent Events
On January 13, 2009, the Company’s shareholders approved an amendment to the Company’s Restated Articles of Incorporation increasing the number of authorized shares of preferred stock to 26,380 and designating such shares as the Series A Preferred Stock. The amendment was filed with the Secretary of State of the State of Washington on January 13, 2009.
On January 16, 2009, in exchange for an aggregate purchase price of $26.4 million, the Company issued and sold to the United States Department of the Treasury pursuant to the troubled Asset Relief Program Capital Purchase Program the following: (i) 26,380 shares of the Company’s newly designated Fixed Rate Cumulative Perpetual Preferred Stock, Series A, no par value per share, and liquidation preference $1,000 per share ($26.4 million liquidation preference in the aggregate) and (ii) a warrant to purchase up to 492,164 shares of the Company’s common stock, no par value per share, at an exercise price of $8.04 per share, subject to certain anti-dilution and other adjustments. The Warrant may be exercised for up to ten years after it is issued.
In connection with the issuance and sale of the Company’s securities, the Company entered into a Letter Agreement including the Securities Purchase Agreement — Standard Terms, dated January 16, 2009, with the United States Department of the Treasury (the “Agreement”). The Agreement contains limitations on the payment of quarterly cash dividends on the Company’s common stock in excess of $0.065 per share, and on the Company’s ability to repurchase its common stock. The Agreement also grants the holders of the Series A Preferred Stock, the Warrant and the common stock to be issued under the Warrant registration rights, and subjects the Company to executive compensation limitations included in the Emergency Economic Stabilization Act of 2008. Participants in the TARP Capital Purchase Program are required to have in place limitations on the compensation of senior executive officers.
The Series A Preferred Stock will bear cumulative dividends at a rate of 5% per annum for the first five years and 9% per annum thereafter, in each case, applied to the $1,000 per share liquidation preference, but will only be paid when, as and if declared by the Company’s Board of Directors out of funds legally available. The Series A Preferred Stock has no maturity date and ranks senior to our common stock with respect to the payment of dividends and distributions and amounts payable upon liquidation, dissolution and winding up of the Company.
69
NOTES TO CONSOLIDATED FINANCIAL STATEMENTS (Continued)
(Dollars in thousands, except per share data)
(19) Subsequent Events-(Continued)
On January 22, 2009, the Board of Directors declared a cash dividend of $0.065 per share to shareholders of record as of February 03, 2009, payable on February 19, 2009.
| | | | | | | | |
| (20) Selected Quarterly Financial Data (Unaudited) | | | | | | | | |
| |
| Results of operations on a quarterly basis were as follows: | | | | | | | |
| | | | Year Ended December 31, 2008 | |
| | | First | | Second | | Third | | Fourth |
| | | quarter | | quarter | | quarter | | quarter |
| Interest income | $ | 15,526 | $ | 14,533 | $ | 14,577 | $ | 14,145 |
| Interest expense | | 6,004 | | 5,185 | | 4,973 | | 4,673 |
| Net interest income | | 9,522 | | 9,348 | | 9,604 | | 9,472 |
| Provision for loan losses | | 1,025 | | 1,050 | | 1,075 | | 1,900 |
| Net interest income after provision for loan losses | | 8,497 | | 8,298 | | 8,529 | | 7,572 |
| Noninterest income | | 1,795 | | 1,638 | | 1,875 | | 1,579 |
| Noninterest expense | | 6,879 | | 6,328 | | 7,578 | | 6,735 |
| Income before provision for income taxes | | 3,413 | | 3,608 | | 2,826 | | 2,416 |
| Provision for income taxes | | 1,076 | | 1,187 | | 921 | | 746 |
| Net income | $ | 2,337 | $ | 2,421 | $ | 1,905 | $ | 1,670 |
| |
| |
| Basic earnings per share | $ | 0.25 | $ | 0.25 | $ | 0.20 | $ | 0.18 |
| Diluted earnings per share | $ | 0.25 | $ | 0.25 | $ | 0.20 | $ | 0.18 |
| Cash dividends declared per share | $ | 0.06 | $ | 0.065 | $ | 0.065 | $ | 0.065 |
| |
| | | | Year Ended December 31, 2007 | |
| | | First | | Second | | Third | | Fourth |
| | | quarter | | quarter | | quarter | | quarter |
| Interest income | $ | 14,664 | $ | 15,456 | $ | 16,221 | $ | 16,028 |
| Interest expense | | 5,695 | | 6,100 | | 6,465 | | 6,550 |
| Net interest income | | 8,969 | | 9,356 | | 9,756 | | 9,478 |
| Provision for loan losses | | 550 | | 850 | | 800 | | 800 |
| Net interest income after provision for loan losses | | 8,419 | | 8,506 | | 8,956 | | 8,678 |
| Noninterest income | | 1,804 | | 1,953 | | 1,923 | | 1,808 |
| Noninterest expense | | 6,924 | | 6,870 | | 6,827 | | 7,850 |
| Income before provision for income taxes | | 3,299 | | 3,589 | | 4,052 | | 2,636 |
| Provision for income taxes | | 1,032 | | 1,129 | | 1,232 | | 785 |
| Net income | $ | 2,267 | $ | 2,460 | $ | 2,820 | $ | 1,851 |
| |
| Basic earnings per share | $ | 0.24 | $ | 0.26 | $ | 0.30 | $ | 0.20 |
| Diluted earnings per share | $ | 0.24 | $ | 0.26 | $ | 0.30 | $ | 0.19 |
| Cash dividends declared per share | $ | 0.05 | $ | 0.06 | $ | 0.06 | $ | 0.06 |
70
Item 9. Changes in and Disagreements with Accountants on Accounting and Financial Disclosure
None
Item 9A. Controls and Procedures
As of the end of the fiscal period covered by this report, the Company evaluated the effectiveness of the design and operation of its disclosure controls and procedures. The principal executive and financial officers supervised and participated in this evaluation. Based on this evaluation, the principal executive and financial officers each concluded that the Company’s disclosure controls and procedures are effective in timely alerting them to material information required to be included in the periodic reports to the SEC. The design of any system of controls is based in part upon various assumptions about the likelihood of future events, and there can be no assurance that any of the Company’s plans, products, services or procedures will succeed in achieving their intended goals under future conditions. In addition, there have been no significant changes in the internal controls or in other factors known to management that could significantly affect the internal controls subsequent to the most recent evaluation. that has materially affected, or is reasonably likely to materially affect, internal control over financial reporting.
Management’s Report on Internal Control Over Financial Reporting
See “Management’s Report on Internal Control Over Financial Reporting” set forth in Item 8-Financial Statements and Supplementary Data, immediately preceding the financial statement audit report of Moss Adams LLP.
Item 9B. Other Information
None
PART III
Item 10. Directors, Executive Officers and Corporate Governance
Information concerning directors of the Company is incorporated herein by reference to the section entitled “Election of Directors” in the Company’s definitive Proxy Statement to be filed with 120 days of our 2008 fiscal year end.
The required information with respect to the executive officers of the Company is included under the caption “Executive Officers of the Company” in Part I of this report. Part I of this report is incorporated herein by reference.
The required information with respect to compliance with Section 16(a) of the Exchange Act is incorporated herein by reference to the section entitled “Beneficial Ownership and Section 16(a) Reporting Compliance,” of the Proxy Statement.
Item 11. Executive Compensation
For information concerning executive compensation see “Executive Compensation” of the Proxy Statement, which is incorporated herein by reference. The Report of the Compensation Committee on Executive Compensation which is contained in the Proxy Statement is not incorporated by this reference.
Item 12. Security Ownership of Certain Beneficial Owners and Management and Related Stockholder Matters
For information concerning security ownership of certain beneficial owners and management see “Security Ownership of Certain Beneficial Owners and Management” of the Proxy Statement, which is incorporated herein by reference.
71
Item 13. Certain Relationships, Related Transactions and Director Independence
For information concerning certain relationships and related transactions, see “Interest of Management in Certain Transactions” of the Proxy Statement, which is incorporated herein by reference.
Item 14. Principal Accounting Fees and Services
For information concerning principal accounting fees and services, see “Relationship with Independent Public Accountants” of the Proxy Statement, which is incorporated herein by reference.
PART IV
Item 15. Exhibits and Financial Statement Schedules
(a)(1) Financial Statements:The financial statements and related documents listed in the index set forth in Item 8 of this report are filed as part of this report.
(2)Financial Statement Schedules:All other schedules to the consolidated financial statements are omitted because they are no applicable or not material or because the information is included in the consolidated financial statements or related notes in Item 8 of this report.
(3) Exhibits:The exhibits filed as part of this report and exhibits incorporated herein by reference to other documents are listed in the Index of Exhibits to this annual report.
72
SIGNATURES
Pursuant to the requirements of Section 13 or 15(d) of the Securities Exchange Act of 1934, the Company has duly caused this report to be signed on its behalf by the undersigned, thereunto duly authorized, on the 12thof March, 2009.
WASHINGTON BANKING COMPANY
(Registrant)
By/s/ John L. Wagner
John L. Wagner
President and
Chief Executive Officer
Pursuant to the requirements of the Securities Exchange Act of 1934, this report has been signed below by the following persons on behalf of the Company and in the capacities indicated, on the 12thof March, 2009.
Principal Executive Officer:
By/s/ John L. Wagner
John L. Wagner
President and
Chief Executive Officer
Principal Financial and Accounting Officer:
By/s/ Richard A. Shields
Richard A. Shields
Executive Vice President and
Chief Financial Officer
73
John L. Wagner, pursuant to a power of attorney which is being filed with this Annual Report on Form 10-K, has signed this report on March 12, 2009, as attorney-in-fact for the following directors who constitute a majority of the board of directors.
Gragg Miller
Robert B. Olson
Anthony B. Pickering
Edward J. Wallgren
Dennis A. Wintch
By/s/ John L. Wagner
John L. Wagner
Attorney-in-fact
March 12, 2009
74
INDEX TO EXHIBITS
Exhibit No.
Exhibit Description
| (1) | Incorporated by reference to the Form SB-2 (Registration No. 333-49925) previously filed by the Company, declared effective on June 22, 1998. |
| (2) | Incorporated by reference to the definitive proxy statement dated August 19, 1998 for the Annual Meeting of Shareholders held September 24, 1998. |
| (3) | Incorporated by reference to the Form 8-K dated April 30, 1999, previously filed by the Company. |
| (4) | Incorporated by reference to Forms 8-K dated May 12, 2005 and September 30, 2005, previously filed by the Company. |
| (5) | Incorporated by reference to Form S-8 dated November 10, 2005, previously filed by the Company. |
| (6) | Incorporated by reference to Form 8-K dated July 14, 2005, and Form 8-K dated August 24, 2006, previously filed by the Company. |
75