1
Yichang Spur Chemicals Ltd.
300Kt/a & 1000Kt/a High Analysis Compound
Fertilizer Project
Scoping Study Report
No. NR349
Design Manager: Sun Guocao
Director of Process Department:
Chief Engineer: Gong Jianhua
President: Li Jianguo
Nanjing Chemical Industrial Design Institute
Qualification Certificate Number for Engineering & Consultant: State Planning
Committee Engineering & Consultant (A class) 941207
December 2003
Nanjing
| Participating Engineers | |
| | |
| Phosphate Process Technology: | Xin Yaqing |
| | Sun Guocao |
| | Sun Juping |
| General Planning: | Yu Dahua |
| | Tong Xiaoxiang |
| | Wang Junhe |
| Civil Structure: | Dong Yifu |
| Water Supply & Drainage: | Mao Daxiang |
| Electrical Engineering: | Zhen Jianbing |
| Equipment: | Wang Chunmao |
| Heat Engineering: | Tian Zhifeng |
| | Ding Cao |
| Bulk Materials Handling: | Wang Chongwu |
| | Wang Jianxing |
| | Yang Shaoming |
| Automation: | He Zheng |
| Environmental P rotection: | Jiang Shaojun |
| | Jia Xiuqing |
| Cost Estimation: | Jiang Hongyan |
| | Rao Li |
| Economic Analysis: | Li Dajun |
2
EXECUTIVE SUMMARY
1. Project Name, Sponsor, and Legal Representative
| Project name: | Yichang high-analysis NPK fertilizer project |
| Name of sponsor: | Yichang Spur Chemicals Ltd. |
| Nature of the sponsor : | Sino foreign joint venture |
| Legal representative: | Robert G. Atkinson |
2. Basis for Scoping Study
Nanjing Chemical Industrial Design Institute (NCEC) has been commissioned by Yichang Spur Chemicals Ltd. to conduct a scoping study on the expansion of the existing chemical fertilizer facilities at Xinyuan. The facilities will be built in stages by building a dedicated phosphoric acid production facility, expanding an existing 100,000 t/a NPK fertilizer plant to 300,000 t/a in the first stage, and to an eventual 1,000,000 t/a.
The scope of the study covers the following areas:
| | 1. | Process flow sheet design, |
| | 2. | Raw materials prices and supply, |
| | 3. | General fertilizer market analysis |
| | 4. | General chemical complex layout, |
| | 5. | Infrastructure facilities, |
| | 6 | Environmental protection and waste treatment, |
| | 7. | Project implementation schedule, |
| | 8. | Capital cost estimate , |
| | 9. | Production cost estimate, |
| | 10. | Gross margin analysis. |
NCEC, based in Nanjing in eastern China’s Jiangsu province, was formerly affiliated to the Chinese Ministry of Chemical Industry, with specialization in the engineering and design of sulfuric acid plant and phosphate fertilizer plant. During the restructuring in the 90’s, NCEC was brought under the control of SINOPEC and expanded its business into inorganic chemical industry. NCEC was the engineering company responsible for the engineering and design of most of the Chinese S-NPK plants.
3
3. The Company
Spur Ventures Inc. is a natural resource development company based in Vancouver, Canada. The Company focuses on the development of the Yichang Integrated Phosphate Mining and Fertilizer Project in China. The Yichang phosphate district, located in central China’s Hubei province, contains one of the largest phosphate deposits in China. The deposits dedicated to the project contain 60 million tonnes of phosphate rock resources. The project is intended to integrate phosphate rock mining and chemical processing to produce high-analysis phosphate fertilizers for China’s domestic markets. The integrated project will be implemented in stages and will eventually include a phosphate mining operation to produce 630,000 t/a phosphate concentrate and a chemical complex on the Yangtze River to process the phosphate concentrate into 1,000,000 t/a high-analysis compound fertilizer NPK.
Following the project approval by the Chinese Cabinet (State Council) in 1999, Spur Ventures Inc. commissioned an independent bankable feasibility study on the project. The study concludes that the Yichang project is both technically and economically feasible. A positive environmental impact assessment study was completed and subsequently approved by government environmental agencies in 2001.
Spur’s joint venture partner, Yichang Phosphorus Chemicals Co. (YPCC), is a Chinese company owned by the government of Yichang City, Hubei Province in China. YPCC is the original owner of the mineral rights for the phosphate deposits. It contributes the mining right into the joint venture as its equity contribution.
In 2003, Spur and YPCC decided to separate the integrated Yichang Project into two sections: the phosphate mining section and the chemical processing section. Two joint venture entities were subsequently created, each with more specific and narrowed business scope to implement the projects. Yichang Maple Leaf Chemicals Ltd. (Yichang Maple Leaf) is given the mandate for mining development and phosphate rock production. Yichang Spur Chemicals Ltd. (Yichang Spur) was established in December 2003 through the acquisition of an existing phosphate fertilizer producer, Xinyuan Chemicals Ltd. Yichang Spur has the mandate to carry on the business of Xinyuan Chemicals Ltd. and to expand its existing 100,000 t/a phosphate fertilizer operation to 1,000,000 t/a. The joint venture partners also agreed in principle to eventually merge the two joint venture companies and to fully integrate the operations at an appropriate time in the future.
This scoping study was commissioned by Yichang Spur to focus on the chemical process section of the integrated project.
To mitigate the financing, construction, production and marketing risks, Yichang Spur decided to achieve the target 1,000,000 t/a NPK production capacity in stages. The first
4
stage was the acquisition of an existing 100,000 t/a phosphate fertilizer plant, Xinyuan Chemical Ltd. and its expansion it to 300,000 t/a.
Xinyuan’s phosphate fertilizer plant is located at Zhicheng Township on the bank of the Yangtze River in Yichang. The plant was commissioned in 2000. By contributing US$2.5 million into Xinyuan and committing additional funding to expand the existing facility to 300,000 t/a, Spur will earn a 65% interest in Xinyuan, its other owners being YPCC (21% equity interest) and Yuanfeng (14% equity interest). Yuanfeng is a local private company owned by Xinyuan’s management. The US$2.5 million from Spur will be used to finance a part of the stage one expansion program, building a dedicated 60,000 t/a phosphoric acid plant. Additional financing will be contributed pro rata by the three joint venture partners to build a 200,000 t/a phosphate fertilizer plant.
4. Fertilizer Market
Phosphorus is one of the three essential crop nutrients, others being nitrogen and potassium. Due to differences in nutrient concentration among various fertilizer products, their actual product tonnages do not necessarily reflect the quantity of effective nutrients. To make the market data comparable, convention has been established that the market data only refer to the net nutrients unless otherwise indicated. For example, an NPK fertilizer with a formula of 12:24:12 contains 12% nitrogen (N) by weight, 24% phosphate (P2O5) by weight and 12% potassium oxide (K2O) by weight. Therefore, the total net nutrient is 48%, which is a sum of the three nutrients; one tonne of NPK with a formula of 12:24:12 contains 0.48 tonne net nutrients.
The Yichang project proposes to produce 1,000,000 t/a NPK fertilizer mainly with the formula of 15:15:15. This translates into 150,000 t/a net P2O5 output. The fertilizer prices are, however, quoted on the actual product.
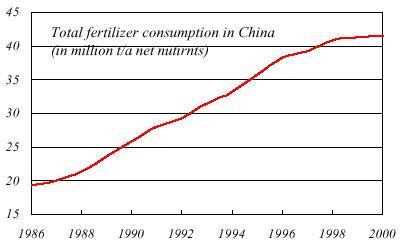
China had experienced a steady increase of fertilizer consumption in all forms, including nitrogen, phosphorus and potassium fertilizers. In a 14-year period from 1986 to 2000 as shown in the figure below, the Chinese fertilizer consumption for the three nutrients jumped from 19.3 million t/a to 41.5 million t/a (100% net nutrients), yielding an annualized growth rate of 5.6%, compared to a 1.2% global growth rate in the same period. The 41.5 million tonnes of net nutrients are equivalent to approximately 100 million tonnes of actual products in various forms.
5
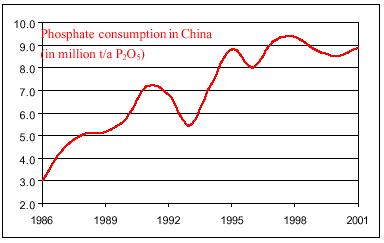
For phosphate fertilizers, the Chinese consumption also experienced significant increase from 3.0 million t/a (net P2O5) in 1986 to 8.9 million t/a in 2001, tripled in 15 years. This is equivalent to 59.3 million tonnes of actual NPK (15:15:15) product.
China has been the largest phosphate fertilizer user in the world, accounting for 26.5% of global consumption. The following table gives a breakdown global consumption by region in 2000.
Global phosphate fertilizer consumption by region in 2000
(in million tonnes of net nutrients) | | | |
| | Phosphate | | |
| Region | (P2O5) | | Percent |
| | Consumption | | % |
| China | 8.55 | | 26.5% |
| Other Asia Countries | 8.95 | | 27.8% |
| North America | 4.36 | | 13.5% |
6
| Latin America | 3.63 | | 11.3% |
| West Europe | 3.10 | | 9.6% |
| Central Europe and FSU | 1.05 | | 3.3% |
| Others | 2.58 | | 8.0% |
| Total | 32.22 | | 100% |
Source: International Fertilizer Industry AssociationChina is also the largest phosphate fertilizer importer, accounting for 25% of global trade. In 2002, China imported 4.92 million tonnes of DAP (18:46:0, containing 18% N, 46% P2O5, and 0% K2O) and 2.82 million tonnes of NPK (15:15:15).
China has recently introduced a series of policy and legal reforms in recent months involving rural land rights, creating the potential for broad based, grass roots economic growth in rural productivity and consumption for 800 million rural Chinese people. A Credit Lyonnais Asia Pacific Markets report dated September, 2003 forecasts that this will result in 210 million farm households earning ownership rights to 130 million hectares of arable land estimated to be worth approximately US$500 billion. This is expected to fuel substantial additional growth in fertilizer demand as these new landowners embrace enterprise ba sed agricultural production.
Scientific agriculture requires balanced fertilization, which means the application of nitrogen, phosphorus and potassium fertilizers at an optimum ratio to achieve maximum crop yields. As Chinese farmers become increasingly aware of the importance of balanced fertilization, direct application of single nutrient fertilizers such as urea, potash, triple super phosphate (TSP) is declining. Because NPK contains three plant nutrients, it is gaining popularity among farmers and its demand is picking up quickly in China. The Xinyuan NPK plant and the subsequent expansion use a proprietary technology patented by Red Sun Group to produce sulfate based NPK (or sometime labeled as S-NPK), which contains four essential crop nutrients: nitrogen (N), phosphorus (P), potassium (K) and sulfur (S). Because of it low chlorine content (<2%) as opposed to the conventional NPK (with chlorine content greater than 7%), the product is greatly sought after by growers of vegetables, fruits, tobaccos, and other high-value crops. The qualities and yields of these crops are very sensitive to and adversely affected by the chlorine which dramatically reduces the crop values.
5. The Project
The Yichang Integrated Phosphate Mining and Fertilizer Project is intended to integrate phosphate rock mining and fertilizer manufacturing to produce 1 million t/a high-analysis phosphate fertilizers mainly for Chinese markets.
7
China has limited phosphate rock resources, concentrated mostly in the landlocked southwestern China, far away from the Chinese agricultural market. Transportation of raw materials (mainly sulfur, potash, and ammonia) into the area and shipping out the finished products are costly to the operations in these areas.
Yichang Phosphate District is located in central China’s Hubei Province. The area hosts one of the largest phosphate resources in China. The phosphate deposits dedicated to this project, Dianziping and Shukongping deposits, are located approximately 100 km NNW of the city of Yichang. The two deposits have been adequately explored to identify a combined 60 million tonnes of phosphate rock resources, sufficient for the joint venture’s 30 years of operation at the planned rate of exploitation at 1 million t/a.
The phosphate ore, existing in a horizontal zone about 3 meters thick, will be extracted by room-and-pillar mining method. The mined ore is treated in a heavy media separation plant to remove impurities and to upgrade the ore to 30% P2O5 content. At a mining rate of 1 million t/a, approximately 0.63 million t/a phosphate concentrate will be produced and is transported by truck from the mine to the chemical complex for chemical processing.
The chemical complex is located at Zhicheng Township, 45 km SE of Yichang City, adjacent to jetties on the Yangtze River. The plant site is served with a rail spur line and is only 400 meters way from a national railway siding leading to interior provinces in the north and coastal provinces in the south. The Yangtze River provides low -cost transportation to eastern and western provinces. The Yangtze River watershed covers one of the largest agricultural areas in the world.
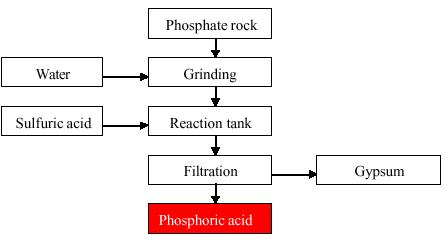
At the chemical complex the phosphate rock concentrate is reacted with sulfuric acid to produce phosphoric acid and a gypsum waste. The phosphoric acid is then reacted with ammonia and potash to produce S-NPK. The recovered hydrogen chloride will be converted to by-product hydrochloric acid. The high-analysis granular fertilizers are conveyed to the nearby storage and bagging facility adjacent to the jetty on the Yangtze River. Bulk and bagged fertilizer shipments will be dispatched via water freight and railway to various distribution centers and customers in China.
8
Project Location & M arket Access

The chemical process of converting phosphate rock into phosphoric acid is illustrated in the process flow chart below:
Phosphoric Acid Production Flow Chart
9
The Red Sun technology will be used for NPK production. It requires a potash conversion process, in which the potash reacts with sulfuric acid to produce a KHSO4 intermediate. The detrimental element chlorine (Cl) conta ined in potash is removed as a byproduct hydrochloric acid (HCl). The process is shown below:
Potash Conversion Plant Flow Chart
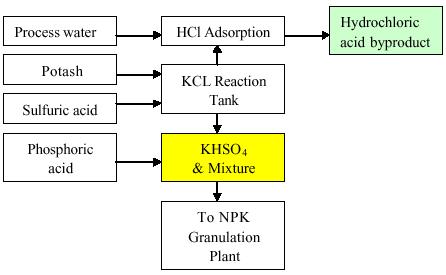
The KHSO4 intermediate is sent to NPK granulation plant, in which KHSO4 is reacted with ammonia and phosphoric acid from the phosphoric acid plant to produce S-NPK.
Advantages of the Yichang project are local source of low cost phosphate rock and its centralized location with ready access to the Chinese market. The estimated cash cost of phosphate rock delivered to the phosphoric acid plant ranges from US$16 to US$18 per metric ton over the study period. The fertilizer plant site is well situated to dispatch fertilizers by water or rail to nearby major agricultural areas, as shown on figure above.
6. Project Implementation
The scoping study envisioned a staged implementation scheme for the chemical complex by expanding the existing NPK plant from 100,000 t/a to 1,000,000 t/a.
In Phase 1, the existing 100,000 t/a NPK plant will be expanded to 300,000 t/a. The Phase 1 project includes the construction of a 60,000 t/a phosphoric acid plant and an additional 200,000 t/a NPK plant. The 60,000 t/a phosphoric acid plant is sufficient to
10
support a 300,000 t/a NPK operation. Sulfuric acid at an annual consumption of 270,000 t/a will be purchased externally.
In Phase 1, the phosphoric acid plant will be built first, followed by the construction of an additional 200,000 t/a NPK plant. In the interim period, the excess 40,000 t/a phosphoric acid output will be sold as merchant phosphoric acid into the local Chinese market.
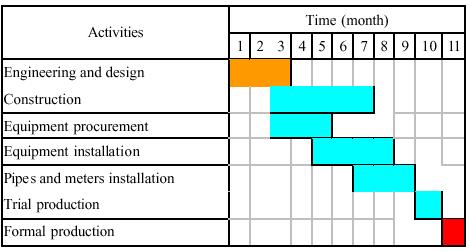
The engineering and construction period for the phosphoric acid plant is 10 months. The activities and time schedule are detailed in the chart below:
60,000 t/a Phosacid Plant Construction Schedule
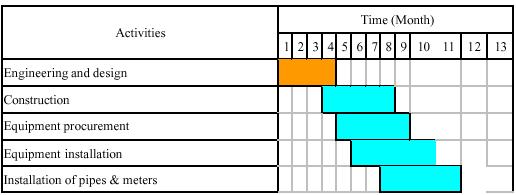
The engineering and construction period for an additional the 200,000 t/a NPK plant is 12 months. The time schedule is shown in the chart below:
200,000 t/a NPK Plant Construction Schedule
11

The engineering and construction period to expand the NPK chemical complex from 300,000 t/a to 1,000,000 t/a NPK is 23 months. The time schedule is shown in the chart below:
Construction Schedule for a 0.7Mt/a NPK complex

7. Capital Cost Estimates
Initial investment provides the capital for development and contracting, land acquisition, engineering, procurement, construction, working capital, plus training and commissioning. Estimates of initial capital investments to expand 100,000 t/a NPK facilities to 300,000 t/a are s ummarized in the table below:
Capital cost estimate for expanding from 100,000 t/a NPK to 300,000 t/a NPK
| | Description | Capital cost
(million yuan) | Capital cost
(million US$) |
| 1 | Fixed Assets | 81.70 | 9.88 |
| | Including: 60kt/a phosacid plant | 21.32 | 2.58 |
| | 200kt/a NPK complex | 28.33 | 3.42 |
12
| | Tanks and gypsum disposal | 10.88 | 1.32 |
| | Infrastructure | 14.58 | 1.76 |
| | Engineering, training, others | 6.58 | 0.80 |
| 2 | Contingency | 7.44 | 0.90 |
Note: The exchange rate between RMB and US dollar is US$1 = RMB 8.27.
The expansion from 300,000 t/a NPK capacity to 1,000,000 t/a NPK capacity can be achieved in a single stage or take another intermediate stage at 600,000 t/a. For simplicity of the analysis, a single stage is assumed.
The Phase 2 expansion project includes a 900,000 t/a sulfuric acid plant with cogeneration, a 120,000 t/a phosphoric acid plant, and a 700,000 t/a sulfur -based compound fertilizer plant. The capital costs for the expansion are summarized in the table below:
Theadditional capital costs for expansion from 300,000 t/a to 1,000,000 t/a NPK
| | Description | Capital cost
Million yuan | Capital cost
Million US$ |
| | | | |
| 1 | Fixed Assets | 405.70 | 49.07 |
| | Including: 120kt/a phosacid plant | 48.03 | 5.81 |
| | 900,000 t/a sulfuric acid plant | 158.90 | 19.20 |
| | 700,000 t/a NPK complex | 69.66 | 8.42 |
| | Tanks, gypsum disposal and others | 48.37 | 5.85 |
| | Infrastructure | 63.26 | 7.65 |
| | Engineering, training, others | 24.07 | 2.14 |
| 2 | Contingency | 48.74 | 5.89 |
8. Operating Costs
Raw materials are the most significant component of operating costs. Sulfur and potash are purchased from local distributors of imports from Canada, Russia and Middle East. Sulfuric acid for the 300,000 t/a NPK facility will be purchased externally from Tongling Smelter and Daye Smelter, both on the Yangtze River. After expansion to 1,000,000 t/a, the fertilizer facilities will use captive sulfuric acid produced using imported sulfur. Ammonia is sourced from local ammonia producers, including Yichang Chemical Fertilizer Co., Sanning Chemicals Co. and Dangyang Chemicals Co. Potash, sulfur, sulfuric acid will be shipped to the chemical complex using barges, while ammonia will be shipped with both trucking and barging.
Phosphate rock required in the first two years of the fertilizer production will be purchased from local phosphate rock miners, until Yichang Maple Leaf Chemicals Ltd
13
brings its own mine into operation. Yichang Maple Leaf will determine its mine development schedule and rock output according to the requirement by Yichang Spur, so that the rock production matches with Yichang Spur’s rock requirement
The prices of raw materials, power and energy used in the economic evaluation are based on the average prices for the last four years between 2000 and 2003, and listed in the table below:
| Raw materials | Price (RMB/t) | Price (US$/t) |
| Phosphate rock | 150 | 18.14 |
| Sulfuric acid | 350 | 42.32 |
| Sulfur | 550 | 66.50 |
| Ammonia | 1530 | 185.0 |
| Potash | 1210 | 146.3 |
| Urea | 1250 | 151.1 |
| Packing bags (bag) | 2.35 | 0.284 |
| Coal | 315 | 38.09 |
| Water | 0.35 | 0.042 |
| Electricity (RMB/kWhr) | 0.37 | 0.045 |
The operating costs for NPK production were calculated by allocating the cash costs of P2O5 according to its consumption.
The excessive phosphoric acid produced will be sold as merchant phosphoric acid. The operating costs for by-product hydrochloric acid are not prorated, and assumed to be zero. The revenues generated in the sales of merchant phosphoric acid and hydrochloric acid are used as credits against the operating costs of NPK. The current selling price of byproduct hydrochloric acid is RMB 280/t (US$33.86/t), which is used in this study. For phosphoric acid, the plant gate price of RMB1850 (US$223.70/t) is used.
These operating costs exclude debt service, depreciation, value added tax, and sales, general and administration costs. The operating costs are broken down and tabulated below.
The operating costs for NPK production at 100,000 t/a NPK and 60,000 t/a phosphoric acid are summarized in the table below. In the table, it is assumed that an excess amount of 32,000 t/a phosphoric acid is produced as merchant acid and sold in the local market.
| | Annual operating cost
(in million RMB) | Annual operating cost
(in million US$) |
| Raw materials | 171.70 | 20.76 |
| Power and energy | 8.77 | 1.06 |
| Salary and benefit | 1.66 | 0.20 |
14
| Maintenance | 2.08 | 0.25 |
| By Product Credit | -82.96 | -10.03 |
| Phosphoric acid | -74.00 | -8.95 |
| Hydrochloric acid | -8.96 | -1.08 |
| Total | 101.25 | 12.24 |
| Unit operating cost RMB/t, US$/t | 1012.5 | 122.4 |
The excess phosphoric acid in the above plant configuration can only be marketed in the local market, as the acid concentration is very low at around 20% P2O5 versus 51% P2O5 for the phosphoric acid sold in the international markets. The high transportation cost due to the 80% water content limits its market radius.
The operating costs for NPK production at 300,000 t/a NPK with captive phosphoric acid and purchased sulfuric acid are summarized in the table below:
| Total operating cost
(in million RMB) | Total operating cost
(in million US$) |
| Raw materials | 310.51 | 37.55 |
| Power and energy | 19.07 | 2.31 |
| Salary and benefit | 1.67 | 0.20 |
| Maintenance | 4.55 | 0.55 |
| By Product Credit | -26.88 | -3.25 |
| Hydrochloric acid | -26.88 | -3.25 |
| Total | 308.92 | 37.36 |
| Unit operating cost RMB/t, US$/t | 1029.7 | 124.53 |
The operating costs for NPK production at 1,000,000 t/a NPK with capt ive sulfuric acid and phosphoric acid are summarized in the table below:
| | Annual operating cost
(in million RMB) | Annual operating cost
(in million US$) |
| Raw materials | 907.56 | 109.74 |
| Power and energy | 47.41 | 5.73 |
| Salary and benefit | 5.64 | 0.68 |
| Maintenance | 21.73 | 2.63 |
| By Product Credit | -89.60 | -10.83 |
| Hydrochloric acid | -89.60 | -10.83 |
| Total | 892.74 | 107.95 |
| Unit operating cost RMB/t, US$/t | 892.74 | 107.95 |
15
9. Taxes
The joint venture is qualified to apply for corporate income tax concessions from the Chinese government. When granted, the joint venture shall pay no income tax in the first two years of operation. Between year 3 to 5, the income tax is 16.5%. The income tax reverts to the normal rate of 33% from year 6.
10. Gross Margin Analysis
For purposes of this study, gross margin has been defined as the difference between product selling price and cash operating cost. The revenues generated from the sale of excess phosphoric acid and from the sale of byproduct hydrochloric acid are used as credit against the cash operating costs. The cash operating costs for NPK are US$123.20/t at 300,000 t/a and US$107.65/t at 1,000,000 t/a, respectively.
A foreign controlled enterprise in China normally enjoys a quality and creditability premium on its product prices. This is especially the case in fertilizer business, in which the impact of fertilizer quality on crop yield cannot be ascertained quickly enough to take remedy measures until it is too late. As a result, the farmers in China are very conscious about brand name quality and are willing to pay a price premium. The S-NPK product produced by Yichang Spur is intended as import replacement. Currently, the imported NPK sells for RMB 1500/t to 1600/t (US$181.38 to 193.47/t). China currently has only one major foreign joint venture NPK producer, Sino-Arab Chemical Fertilizer Co. with a capacity of 600,000 t/a. This facility is used as a reference to determine the project’s product selling price. Currently, its plant gate NPK price is RMB1560/t (US$188.63/t).
In its three years of operation, Xinyuan has made efforts to establish its product brand names, which are being gradually recognized in the market. However, Xinyuan’s local ownership, low capacity utilization rate and small output (50,000 t/a) due to the bottleneck in phosphoric acid supply have made it unable to command a premium price. The current selling price for Xinyuan Chemicals’ S-NPK as a local no-name product is RMB 1400/t or US$169.29/t. However, with foreign investment and increased production capacity, Yichang Spur should command the same price as imported NPK or domestic brand name NPK at RMB 1560/t (US$188.63/t).
The following table shows the projected gross margins for the fertilizer operation at 300,000 t/a capacity and 1,000,000 t/a capacity, respectively.
| Items | Case | Value (RMB) | Value (US$) |
| Selling price | 300,000 t/a | 1560 | 188.63 |
| | 1,000,000 t/a | 1560 | 188.63 |
16
| Operating cost | 300,000 t/a | 1030 | 124.53 |
| | 1,000,000t/a | 893 | 107.95 |
| Gross margin | 300,000t/a | 530 | 64.10 |
| | 1,000,000t/a | 667 | 80.68 |
Gross margin for NPK produced with captive phosphoric acid and purchased sulfuric acid at a capacity of 300,000 t/a is projected at US$64.10 per tonne or US$19.23 million per year. Gross margin for NPK produced with both captive sulfuric acid and phosphoric acid at a capacity of 1,000,000 t/a is projected at US$80.68/t or US$80.68 million per year.
17