Growing with China
Spur Ventures Inc. • Annual Report 2004

Spur Ventures will be the leading foreign-owned fertilizer company in China by partnering with local Chinese firms to fully integrate raw material supplies with production and marketing.
 Phosphates in China: Quick Facts
China is the largest consumer of phosphate fertilizers in the world with 26.5% of world demand or 10.2 million tonnes of P2O5in 2004.
China has the second largest reserves of phosphates (2,100 million mt) or 30% of world supply.
Domestic production is increasing while imports have decreased by 53% (from 2.88 to 1.36 million mt) from 1999 to 2004 because of supportive government policies.
Higher quality phosphates such as those found in Spur’s NPK’s are replacing the low nutrient content phosphates.
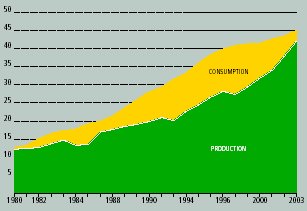
China: Fertilizer Production vs. Consumption 1980-2003
in Millions of tonnes
Source: Statistics Year Book 2004, National Bureau of Statistics of China

YSC is the fertilizer manufacturing arm of Spur Ventures. To implement its strategy of integration from raw materials supply to fertilizer production, Spur originally planned to construct a new NPK complex close to its proposed phosphate mines. However, in late 2003 Spur had the opportunity to invest in an existing facility thus accelerating its plans and a new Sino-foreign joint venture, YSC emerged.
The YSC plant was built in 1999, and has a rated capacity of 100,000 tonnes per year. YSC has the mandate to build an integrated 300,000 tonne per year NPK operation. This will be accomplished in stages to ensure that raw materials inputs are balanced with NPK production needs and market demands.
YSC successfully completed construction and commissioning of a 60,000 tonnes per annum phosphoric acid plant on March 31, 2005 thus reducing its dependence on purchased phosphoric acid. This phosphoric acid plant produces enough acid for 300,000 tonnes per annum of NPK production.
Yichang Maple Leaf Chemicals Ltd. (YMC) is the phosphate mining arm of Spur Ventures. YMC is in the initial phases of developing our mining operations.
YMC owns the rights to five phosphate deposits, two of which, (the Dianziping and Shukongping deposits) have sufficient phosphate rock to supply 1,000,000 tonne per annum of NPK production for 30 years.
YMC has plans to produce 700,000 mt at Dianziping and 500,000 mt at Shukongping for a total annual production of 1.2 million mt per year. YSC is preparing a mine plan for the first Dianziping mine with 150,000 mt/year capacity and subsequent increases.
Spur’s strategy is to be integrated from phosphate mining to production of high analysis compound fertilizers. Spur Ventures is developing its business through two Sino-foreign joint venture companies with a 72.18% interest in Yichang Spur Chemicals Ltd. (YSC) and a 78.72% interest in Yichang Maple Leaf Chemicals Ltd (YMC).
| | S P U R V E N T U R E S I N C . • A N N U A L R E P O R T 2 0 0 4 | 1 |
Competitive Advantages
| • | Spur owns a long-term supply of high quality phosphate rock, eliminating uncertainty in supply. Phosphate rock prices have increased dramatically in 2004, emphasizing the security advantage of our own source of phosphate rock. |
| | |
| • | Spur’s facilities are located in the heart of China’s agricultural district, minimizing freight charges from the plant to the customers. Our facility is on the Yangtze river, which further enables efficient transportation of products, as well as reducing import costs. |
| | |
| • | China has good quality engineering and construction capability allowing Spur to construct high quality, efficient facilities at lower cost than in other countries. |
| | |
| • | Spur strives to meet or exceed the current and future needs of its wholesale, retail and farm customers by providing timely, high quality products and services that meet or exceed the expectations of our customers and the standards of the Government of China. |
| | |
| • | Spur is a leader in China in environmental health and safety for its employees, customers and facilities, and we ensure that we exceed all Chinese standards and approach international standards in a financially responsible manner. Our employees and customers deserve to work in a safe and healthy environment and our shareholders expect no less. |
| | |
| • | Spur works in partnership with leading Chinese companies and business leaders to create a company that will achieve the best of both of the Canadian and Chinese cultures and business experiences. |
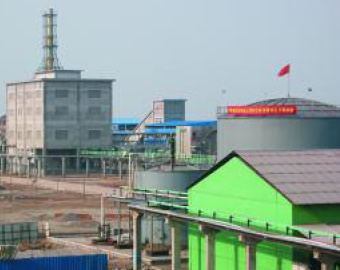
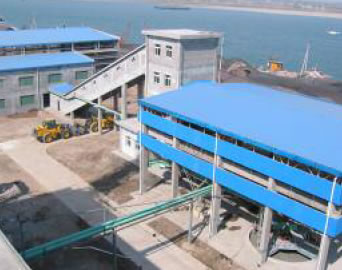
YSC's NPK plant in Yidu.
| 2 | S P U R V E N T U R E S I N C . • A N N U A L R E P O R T 2 0 0 4 | |
Report to Shareholders
It is my great pleasure to present my first report to the shareholders of Spur Ventures as CEO. Canada is world renowned for its “junior” oil and gas, and mining companies which operate with great success both in Canada and abroad. Spur will set another precedent for Canada, becoming the first “junior” fertilizer company operating in China. I was attracted to Spur by three key fundamentals: Spur’s strategy for China, China’s strong agricultural and thus fertilizer growth and the quality of the Spur team. | 
Rob Rennie
CEO of Spur Ventures Inc. | Chinais the world’s largest consumer of phosphate fertilizers with 26.5% of global demand. China recognizes that agriculture is critical to its economic success and its government agricultural policies are focused on making China both competitive and self sufficient in agriculture and in fertilizers. And the “majors” have yet to get their hands around China. It is easier for a “junior” to enter and work in emerging markets. Spur’s teamis second to none. Spur has a very strong Board of Directors who have operated in the big leagues of mining, fertilizer and investment finance on a global level and now bring their expertise to guiding Spur in China. |
Spur’s strategyis “Growing with China.” Spur’s focus on being in-country, in the world’s fastest growing fertilizer market and working with knowledgeable Chinese partners, will set the stage for our success. In the fertilizer business, four countries (China, India, Brazil and the USA) determine the global fertilizer demand. The USA is a large but mature market. The Brazilian market has already attracted significant global fertilizer investment by fertilizer majors such as Bunge and Mosaic. | | My senior management team is equally strong. All are Chinese Canadian, fluent in both the language and the culture of China and Canada. No one can be successful in China without speaking the language and understanding the culture. |
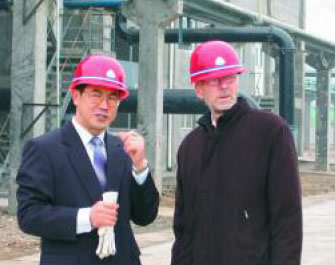
President Ian He and CEO Rob Rennie at the YSC facility in Yidu.
| | S P U R V E N T U R E S I N C . • A N N U A L R E P O R T 2 0 0 4 | 3 |
Report to Shareholders
Spur knows how to do business in China. And Spur knows the fertilizer business.
2004was an extraordinary year for Spur. Spur President Ian He and his team fulfilled all of his commitments to the shareholders as listed in the 2003 Annual Report.
Our NPK production company, Yichang Spur Chemicals Ltd (YSC) was created through the acquisition of an already existing facility and production bottlenecks largely removed. Our phosphate mining company (Yichang Maple Leaf Chemicals Ltd., or YMC) revised its capital plan and signed a restructuring agreement with our joint venture partner, YPCC.
The Board of Directors and Senior Management recruiting was completed with the addition of Agrium’s retired CEO, John Van Brunt as Vice Chairman of the Board, Michael Chen as Spur’s new CFO and myself in 2005 as CEO.
Spur also raised C$16.5 million in a private placement to ensure that we had the financial resources to implement the first stages our growth strategy.
2005will be a pivotal year for the implementation of Spur’s strategy in China.
The Chinese government is continuing to focus on agriculture and the welfare of its 900 million farmers. All taxes on agriculture will now be eliminated by the end of 2006, two years ahead of the original plan. To date, twenty-six of China’s thirty-one provinces have already eliminated agricultural taxes. The eleven percent rebate of Value Added Tax on fertilizer exports has been removed thus ensuring more domestic urea supply. Fertilizer manufacturers are favoured by controls on electricity and coal prices.
The fertilizer supply/demand balance is expected to be tight in 2005 and prices for both raw materials and fertilizers have already risen. These raw material cost increases will not impact Spur’s NPK sales because, unlike urea sales where China imposes a price ceiling, we have the ability to pass on cost increases to our customers.
At YSC, Spur has already invested C$6 million to complete construction of a 60 thousand tonne per year phosphoric acid plant setting the stage for tripling our current manufacturing capability. And at YMC we have invested a further C$9.7 million towards our contractual commitment for Registered Capital.
Spur will lead by example in its focus on environmental quality and workforce safety. On the mining side, YMC will begin the first planning stages of its phosphate rock mining operation. YSC will finalize the design and engineering for construction of either upstream sulphuric acid production, downstream, MAP production or both. MAP can either be used as fertilizer directly or as a precursor to the manufacture of NPK.
We plan to continue to identify suitable joint venture partners in order to increase our fertilizer production, marketing and distribution capability in China.
Thank you again for your patient support as Spur has taken the time to build a firm foundation for its house in China. It has been time well spent, and now Spur is ready to grow with China.
| |  |
| | Rob Rennie
CEO of Spur Ventures Inc. |
2005 will be a pivotal year for the implementation of Spur’s strategy in China.
| 4 | S P U R V E N T U R E S I N C . • A N N U A L R E P O R T 2 0 0 4 | |
Spur’s Priorities for Year 2005
YMC: Regulatory Processes
Spur complies with all Chinese laws and processes.
Under the terms of our joint venture agreement, as approved by the Chinese authorities, Spur has reached the milestone of contributing 15% of the Registered Capital of YMC and thus triggered the transfer process of the mining licenses for the Dianzinping and Shukongping deposits from our joint venture partner YPCC to YMC. In anticipation of this transfer, YMC is preparing a mine plan for the first 150,000 tonnes per annum of phosphate from the Dianzinping mine.
Business plans need to respond to the realities of the market. The formation of YSC eliminated the need for YMC to build its own NPK production facility. And the high quality of Chinese engineering and construction capability allowed for a reduction of the capital required to develop the mine. Accordingly in 2005 Spur will steward the approval of the re-structuring of the YMC Sino-foreign joint venture through the Chinese system.
YSC: Continued Production Growth
With the successful commissioning of the phosphoric acid plant, YSC is no longer reliant on purchased phosphoric acid. YSC must now determine the next steps to expand our NPK capacity. There are “upstream” options such as eliminating our dependence of sulphuric acid by construction a 300,000 tonne per annum sulphuric acid plant. And there are downstream options such as construction of a MAP plant to set the stage for producing 300,000 tpa of NPK’s. Or both.
YSC has completed its engineering and environmental assessments for the various options.
Increasing Plant Availability
Fertilizer plants are not capable of running 365 days a year. The number of days they can run is termed “availability.” In March, YSC reached a daily production record of 295 mt of NPK’s which, if the plant could run at 100% availability, would exceed its name-plate capacity. In mid-year 2005, we will invest C$ 270,000 to optimize the KCl and sulphuric acid reaction and to replace anti-corrosion materials to maximize the plant’s sustainable availability.

Spur's Hi-Jiawang brand at a retailer in Henan Province
| | S P U R V E N T U R E S I N C . • A N N U A L R E P O R T 2 0 0 4 | 5 |
2004 Highlights
| • | Acquisition of Xinyuan Chemicals Ltd. to form Yichang Spur Chemicals Ltd |
| • | Restructuring of Yichang Maple Leaf Chemicals Ltd. |
| • | C$16.5 million equity financing |
| • | Michael Chen joined Spur as CFO |
| • | John Van Brunt, retired CEO of Agrium Inc., joined Spur as Vice Chairman of the Board of Directors |
| | | |
| Early in 2005 |
| | | |
| • | Robert Rennie appointed as Spur’s first CEO |
| • | Yichang Spur Chemicals: |
| | – | 60,000 tpa phosphoric acid plant successfully commissioned |
| | – | new daily production record of 295 mt of NPK’s. |
| | – | first profitable quarter in its corporate history |
| • | Yichang Maple Leaf Chemicals Ltd. fulfilled all requirements for transfer of mining licenses |
Fertilizer 101
Spur’s business is to develop its rich phosphate mines to produce phosphate including high analysis, compound fertilizers called NPK’s. To understand our business, it is important to understand our customers, both the farmers and the crops they grow.
Crops require nutrients for growth. The four major nutrients in fertilizers are nitrogen (N), phosphorus (P), potassium (K) and sulphur (S). Micronutrients needed include iron (Fe), molybdenum (Mo) and copper (Cu). Crops require levels of nutrients in different N:P:K:S ratios in the same manner that human nutritional requirements differ with individuals, level of activity and age. Micronutrients, by virtue of their name, are required in minute quantities just as humans require vitamins.
The fertilizer requirements of a crop are determined by the ability of the soil to supply the various nutrients. Crops “mine” the soil of its natural richness and balanced fertilization is critical both to maintaining soil quality and to growing sufficient food to feed the world. From soil test results, the fertilizer type and application rate is determined varying with the crop to be grown (eg. corn differs from soybean) and the climatic conditions.
P is involved in enzymatic activity and energy balances in plants. P helps plants resist disease and cold temperature and is critical for root growth, cell division and fruit and seed growth. Once mined, phosphates are chemically formulated into a wide variety of fertilizer types. Only NPK’s have all three required nutrients. MAP, which can be a part of NPK’s, is more available to the plant in the calcareous soils of Hubei Province and in western Canada.
Marketing
Spur currently has two brands of NPK’s, the high value added “Spur” brand (15-15-15) for which farmers pay a premium and the Hi-Jiawang brand sold as two different formulations, 13:17:15 for vegetable, fruit and some grain crops and 10:10:20 sold exclusively for tobacco. These brands are distributed in 15 provinces through 90 independent dealers.
| Phosphate Type | Acronym | %N | %P2O5 | %K2O | %S |
| Single super phosphate | SSP | 0 | 16-20 | 0 | 12 |
| Triple super phosphate | TSP | 0 | 46 | 0 | 0 |
| Monoammonium phosphate | MAP | 11-12 | 48-52 | 0 | 0 |
| Diammonium phosphate | DAP | 16-18 | 42-48 | 0 | 0 |
| Compound fertilizers | NPK | 5-26 | 5-35 | 5-26 | |
| Nitro phosphates | NP | 20-26 | 6-34 | | |
| Fused magnesium phosphate | FMP | 0 | 19-20 | 0 | |
| Nutrients are expressed in nutrient rather than elemental metric tonnes. |
| 6 | S P U R V E N T U R E S I N C . • A N N U A L R E P O R T 2 0 0 4 | |
Fertilizer Outlook for 2005
The Fertilizer Industry in China Today
China is evolving from a centrally planned to a market oriented economy in a thoughtful and deliberate manner. Many fertilizer plants in China were built to serve local markets, and are therefore smaller and lack economies of scale.
Over 500 small sized nitrogen factories account for 90% of the enterprises and 53% of current production. While world scale urea plants now exceed 1.2 million tonnes per year, the newest in China is 800,000 tonnes per year, with most NPK facilities varying between 100,000 and 300,000 tonnes per annum. Production costs are often high relative to imported fertilizers.
China Tomorrow
China recognizes the importance of agriculture and thus of fertilizers to its future economic growth. Its 1.3 billion population will continue to grow (the “one child per family” law has now been repealed) and food self-sufficiency and security are critical to China’s political strategy.
Because counterfeiting of brands occur and nutrient analysis content may not be reliable, the Chinese government is initiating laws regulating fertilizer quality. Any controls in this regard will benefit Spur, as we produce high quality products and strive for brand recognition.
With increased concern about water and air quality, manufacturers like Spur who lead with good environmental and safety standards will grow while others may be fined or closed.
As more government entities become privatized, those that are not self-sufficient will continue to close and larger ones will be built to serve larger geographic areas. Transportation infrastructure, which now focuses East to West, must develop more in a North-South direction. Spur is ideally situated on the Yangtze River.
YSC's plant on the Yangtze river.
| | S P U R V E N T U R E S I N C . • A N N U A L R E P O R T 2 0 0 4 | 7 |
Directors and Management
In 2004 and early 2005, Spur significantly strengthened both its Board and its Senior Management Team, with the addition of John Van Brunt to the board of Directors, Michael Chen joining the Company as CFO, and Dr. Robert Rennie joining Spur as its first CEO after electing early retirement from his position as Vice President of South America and VP of Corporate Relations for Agrium.
Steven G. Dean,Age 45
Director and Chairman of the Board since June 2003.
Mr. Dean is a Fellow of the Institute of Chartered Accountants of Australia, a Fellow of the Australasian Institute of Mining and Metallurgy and a Member of the Canadian Institute of Mining, Metallurgy and Petroleum. He has extensive experience in mining, most recently as President of Teck Cominco Limited to July, 2002. He was an Executive Director and Chief Financial Officer of the Normandy Mining Ltd. Group during 1987 to 1994, and Founding Chairman and Chief Executive Officer of PacMin Mining Corporation from 1995 to 1999. He is currently Chairman of Amerigo Resources Ltd., a company listed on the TSX and a director of GRD Limited, a company listed on the Australian Stock Exchange.
Robert J. Rennie,Age 55
Chief Executive Office and Director since March 2005
Dr. Rennie joined Spur as its first CEO in March of 2005 after taking early retirement from Agrium Inc. He served in several roles in Agrium including VP of New Products R&D and finally as VP of South American and VP of Corporate Affairs. He led Agrium’s entry into Argentina building the world’s largest single train urea plant, a joint venture with Spain’s Repsol-YPF. He also brought Agrium’s retail business in Argentina, Agroservicios Pampeanos, to profitability so that it could be integrated with Agrium’s North American Retail. When he retired, the South American wholesale operations accounted for 20% of Agrium’s profitability. Dr. Rennie serves as Vice Chairman of the Agriculture Committee and Chairman of the Biotechnology Watch Group of IFA. He also is on the Board of the Alberta Agriculture Research Institute and the Latin American Research Centre of the University of Calgary.
John Van Brunt,Age 63
Director and Vice Chairman since July 2004
Mr. Van Brunt was CEO of Agrium the world’s largest producer of nitrogen fertilizers until his retirement in 2003. He did the initial IPO of Cominco Fertilizers in 1993 building the company through mergers and acquisitions from US$250M sales to US$3.0B as it became known as Agrium Inc. At the time of his retirement he was Vice Chairman of the Agrium Board. Mr. Van Brunt is currently the Chairman of Paris-based International Fertilizer Industry Association (IFA) and Chairman of the Board of Directors of The Fertilizer Institute in Washington.
Robert G. Atkinson,Age 65
Director since March 1996, Vice Chairman since June 2003
Mr. Atkinson has been in the investment industry for over 30 years. He is former President and CEO of Loewen Ondaatje McCutcheon & Co Ltd., a Canadian investment dealer. He now serves as Director of Trimin Capital Inc., a Toronto Stock Exchange listed holding company. Mr. Atkinson also serves as a Director of Quest Capital Corp, a Toronto Stock Exchange listed company whose business emphasis is in merchant banking. Quest Capital Corp. is the Company’s largest shareholder. Mr. Atkinson received a B.Comm. degree from the University of British Columbia in 1963.
David Cohen,Age 43
Director since June 2003
He is the President and CEO of Northern Orion Explorations Inc. and a director of a number of public and private international companies. He started his professional career in 1981 with Anglo American Corporation in operations on the diamond and gold mines in South Africa. After a period in chemical plant design and project management he joined Fluor Daniel in 1991, a leading international engineering and construction firm as Director, Business Development, leading international business development activities in the petroleum and mining sectors from the Fluor Daniel offices in California and Colorado. Mr. Cohen is a chemical engineer by training with an MBA in international corporate finance.
| 8 | S P U R V E N T U R E S I N C . • A N N U A L R E P O R T 2 0 0 4 | |
Directors and Management
David Black,Age 64
Director since June 2000
Mr. Black is a retired corporate and securities lawyer and an associate of DuMoulin Black, a law firm established in 1966 providing corporate, securities and finance services to natural resource and commercial/industrial companies.
Michael Chen,Age 35
CFO since October 2004
Mr. Chen has more than 10 years of financial management experience with large multi-national corporations in the United States and Canada, principally with Honeywell International Inc. and Goodrich Corporation, two U.S. Fortune 500 companies. Mr. Chen is a Certified Public Accountant in the U.S. and has a degree in International Finance from Beijing University and an MBA in Finance from the University of Arizona.
Ruston Goepel,Age 62
Director since June 2003
Mr. Goepel is Senior Vice President at Raymond James Ltd. He entered the investment business in 1968 specializing in institutional sales with Ryan Investments and Pemberton Securities Ltd. In 1989 he was a founding partner and CEO of Goepel Shields & Partners, a national securities dealer which was acquired by Raymond James Inc.—the 8th largest U.S. brokerage firm—in January 2001. Mr. Goepel is Chairman of the Business Council of British Columbia and a Director and Chairman of the Nominating and Governance Committee of the Vancouver 2010 Olympic Organizing Committee. Mr. Goepel is a past member of the Executive Committee of the Investment Dealers Association of Canada and a Past Governor of the Vancouver Stock Exchange. He is also a Director of a number of Canadian companies. Mr. Goepel was the recipient of the Queen's Jubilee Medal for Business Leadership and Community Service.
Y.B. Ian He,Age 43
President and Director since August 1995
Dr. He joined the Company in 1995 serving as President and leading the Company into the Chinese mineral and fertilizer industries. Dr. He started his career in 1982 as a university lecturer and research engineer. Prior to joining Spur, Dr. He served as a Senior Process Metallurgist with Process Research Associates Ltd. in Vancouver. He also serves as a Director of Jinshan Gold Mines Inc., a mineral exploration company listed on TSX Venture Exchange. Dr. He obtained a Ph.D. degree from the University of British Columbia.
Dongdong Huang,Age 47
Vice President, Corporate Relations and Director since May 2004
Dr. Huang is a qualified lawyer in China and British Columbia, Canada, with extensive experience in negotiating, structuring and managing joint ventures between North American and Chinese interests by working with some of the largest law firms in Canada such as Tory Tory, Fasken Martineau, and Smith Lyons since 1986. He is recognized as an authority on Chinese law in Canada and represents many public companies from North America in their business transactions in China. Dr. Huang obtained his B.A. from Wuhan University, LL.B. from York University, and LL.M. and LL.D. from University of Ottawa.
| | S P U R V E N T U R E S I N C . • A N N U A L R E P O R T 2 0 0 4 | 9 |
Management Discussion and Analysis
For the Year Ended December 31, 2004 • All figures expressed in Canadian dollars
This Management’s Discussion and Analysis (“MD&A”) has been prepared as at April 29, 2005, and should be read in conjunction with the audited consolidated financial statements with accompanying notes of Spur Ventures Inc. (the “Company”) of the year ended December 31, 2004 which have been prepared in accordance with Canadian Generally Accepted Accounting Principles.
This MD&A contains certain statements that may be deemed to be “forward-looking statements” regarding the timing and content of upcoming programs. Although Spur Ventures believes the expectations expressed in such forward-looking statements are based on reasonable assumptions, such statements are not guarantees of future performance and actual results or developments may differ materially from those in the forward-looking statements. Factors that could cause actual results to differ materially from those in forward-looking statements include phosphate and potash prices, exploitation and exploration successes, continued availability of capital and financing, and general economic, market or business conditions.
All amounts are reported in Canadian dollars, unless otherwise indicated. Additional information on the Company can be found in the filings with Canadian regulators on SEDAR at www.sedar.com and in the Company’s Form 20-F with the United States Securities and Exchange Commission at www.sec.gov.
1. Overall Performance
• Operation
The company continues to focus on developing an integrated fertilizer business at planned stages and has been able to achieve operating cash breakeven and retain a key customer base while operating at 30% of current production capacity and facing challenges including rising raw material costs, pre-expansion maintenance and remediation costs and electricity shortage.
• Phosphoric Acid Plant
The construction and commissioning of a 60,000 tonnes per annum phosphoric acid plant was successfully completed in March 2005. The original budget for the phosphoric acid plant and related infrastructure was $5.57 million. In the course of detailed engineering it was determined that significant additional plant foundation was required due to poor soil conditions. In addition, the continued rapid growth in the Chinese economy has resulted in significant increases in the price of raw materials including steel and cement.The final estimated construction cost is $6.85 million, bringing the project within 23% of the original budget under difficult conditions. Construction took approximately 6 months, a substantially shorter timeframe than forecast, and significantly shorter than what would have been achievable in North America.
• Phosphate mineral deposits mining license
The restructuring of the YMC joint venture was completed on April 20, 2004. Although the Company has received the restructuring approval from the Yichang municipal government and Hubei provincial government, the Company is still working on getting the final approvals from the Chinese central government. In the mean time, the company has made several significant cash contributions to YMC registered capital account. According to the original agreement, once the Company meets the first 15% capital requirement, the government is obligated to transfer the mining licenses to YMC. With all the cash contributions and pre-YMC investments, the Company believes it has met the first 15% capital requirement under the original agreement. The Company is currently pursuing the transfer of mining licenses.
• Cash Position
As of March 31, 2005, the Company had cash and cash equivalents of $12.3 million, of which is held in a Canadian bank and in banks in China for YSC and YMC operation.There is $10.9 million held in YMC registered capital account in China. The Company has complete control of the usage of the YMC registered capital account.
2. Selected Annual Information
Selected annual information from the Company’s three most recently completed financial years is summarized as follows:
| | | 2004 | | | 2003 | | | 2002 | |
| Total revenues | $ | 4,810,302 | | $ | Nil | | $ | Nil | |
| Net income (loss) | | (2,425,755 | ) | | (1,310,054 | ) | | (245,872 | ) |
| Earnings (loss) per share | | (0.07 | ) | | (0.06 | ) | | (0.01 | ) |
| Diluted earnings (loss) per share | | (0.07 | ) | | (0.06 | ) | | (0.01 | ) |
| Total Assets | | 28,114,960 | | | 7,194,380 | | | 2,884,113 | |
| Total long-term liabilities | | Nil | | | Nil | | | Nil | |
| Cash dividends declared | | Nil | | | Nil | | | Nil | |
The significant change in the results of operation and financial position in 2004 is the result of the acquisition of YSC and a private placement of $15.4 million.
Results of Operations—Full Year
During the year ended December 31, 2004, the Company focused on developing an integrated fertilizer business in China. The phosphoric acid supply has been not reliable, because of limited availability. The company was working on the solution to build a 60,000 tonnes phosphoric acid plant for captive phosphoric acid supply. In the meantime, the company operates at a low capacity to keep operating cash flow breakeven and maintain a key customer base. Operating performance has been squeezed by rising raw materials prices and electricity shortage experienced in Yichang area in winter; however, the company’s cash basis continues to be breakeven and it has been able to increase its fertilizer product prices to the extent to which the market will bear.
During the year ended December 31, 2004, the loss of $2,425,755 increased from $1,310,054 during the year of 2003 primarily due to $1,257,040 in the non-cash stock-based compensation expenses during the period in accordance with new Stock Based Compensation Accounting Standards, and an increase in consulting fees from $255,243 in 2003 to $355,112 in 2004. The increase in consulting fees is due to the acquisition of YSC and the renegotiation of the YMC joint venture and the engagement of additional officers and directors as the Company expands towards its objectives. The increase in other expenses was mainly due to the incorporation of the operational results of YSC since the date of acquisition. The Company’s earnings from interest income increased to $183,608 in 2004 from $38,845 in 2003.
The operational results of YSC, which was acquired on April 20, 2004, attributable to Spur Ventures Inc. from the date of acquisition (April 20, 2004) to December 31, 2004 are summarized as follows:
| Sales | 4,810,302 | |
| Cost of sales | 4,904,589 | |
| | (94,287 | ) |
| Expenses | | |
| Loss on disposal of fixed assets | 12,806 | |
| Office and miscellaneous | 171,216 | |
| Professional fees | 77,041 | |
| Rent | 18,151 | |
| Repairs and maintenance | 17,364 | |
| Selling expenses | 134,127 | |
| Travel, advertising and promotion | 125,640 | |
| Wages and benefits | 85,454 | |
| | 641,800 | |
| Operating loss | (736,087 | ) |
| Other income and expenses | | |
| Interest income | (6,946 | ) |
| Interest expenses | 191,268 | |
| Other income | (90,661 | ) |
| Foreign exchange gain | (82,953 | ) |
| | 10,708 | |
| Loss for the period | (746,795 | ) |
| 10 | S P U R V E N T U R E S I N C . • A N N U A L R E P O R T 2 0 0 4 | |
4. Summary of Quarterly Results(Expressed in Canadian dollars)
| | Qtr ended | | Qtr ended | | Qtr ended | | Qtr ended | | Qtr ended | | Qtr ended | | Qtr ended | | Qtr ended | | Qtr ended | |
| | Dec.31, 2004 | | Sept.30, 2004 | | Jun.30, 2004 | | Mar.31, 2004 | | Dec.31, 2003 | | Sept.30, 2003 | | Jun.30, 2003 | | Mar.31, 2003 | | Dec.31, 2002 | |
| Total revenues | $2,317,372 | | $1,495,141 | | $997,789 | | $ — | | $ — | | $ — | | $ — | | $ — | | $ — | |
| Net income (loss) | (869,733 | ) | 986,142 | | (299,849 | ) | (270,031 | ) | (980,665 | ) | (137,670 | ) | (101,590 | ) | (90,129 | ) | (101,780 | ) |
| Earnings (loss) per share | (0.02 | ) | (0.03 | ) | (0.01 | ) | (0.01 | ) | (0.03 | ) | (0.01 | ) | — | | (0.01 | ) | (0.01 | ) |
| Diluted earnings (loss) per share | (0.02 | ) | (0.03 | ) | (0.01 | ) | (0.01 | ) | (0.03 | ) | (0.01 | ) | — | | (0.01 | ) | (0.01 | ) |
Prior to the first quarter of 2004, some other income was recorded as revenues. These amounts have been reclassified from revenues to other income.
5. Liquidity and Capital Resources
The Company has financed its operations principally through the sale of common shares and warrants. Starting from Q2 2004, the Company generates revenue through phosphate fertilizer production. In June 2004, the Company raised $15,446,084 net cash through a brokered private placement. The Company’s management expect that the amount of interest or dividend income will be decreased as the Company continues investment in its joint ventures in China, unless 1): the Company is able to obtain additional funds through the sales of its equity securities. 2): the Company’s joint ventures start making positive cash flow from productions and sales.
As of December 31, 2004, the Company had a net working capital of $10,973,792, compared to $5,283,056 at December 31, 2003. During the period, a capital contribution of $2,316,430 was made to the YMC joint venture, which, together with the contribution of $500,000 made in prior periods, is consolidated in the attached balance sheet. Depending upon the timing of expansion plans for its projects and the receipt of approval for the restructuring of YMC and the availability of bank financing in China, the current working capital and cash position of the Company will provide sufficient liquidity to meet the Company’s year 2005 operating requirements. See “Outlook”.
6. Transactions with Related Parties
During the year ended December 31, 2004, the Company paid a total of $310,112 to a director and companies controlled by 4 directors (2003 - $255,243).The Company also paid consulting fees of $22,500 (2003: $nil) to an ex-officer. The Company paid management fees of $nil (2003: $27,833) to a company controlled by a director and legal fees of $25,542 (2003: $nil) to two officers and one legal firm associated with a director.
The increase in consulting fees is due to the acquisition of YSC and the renegotiation of the YMC joint venture and the engagement of additional officers and directors as the Company expands towards its objectives.
During due diligence work in the preparation of financial statements for YSC, the Company was made aware that YSC is party to a loan facility of RMB 7,400,000 ($1,075,960) from the Agricultural Bank of China with its former parent company YPCC.There had been no previous disclosure of this potential liability by YPCC or accounting staff of YSC. It is understood that the proceeds of this loan were used in YPCC’s business, and YSC has not benefited from this loan. YPCC is the guarantor of this loan and the Company is advised that YPCC has been paying the interest to the bank. The Company has had discussions with YPCC and the Agricultural Bank of China and YPCC has provided the Company a written guarantee that they will take the responsibility for this liability and intend to repay this loan facility in full.
As part of the documentation for the purchase of the Company’s interest in YSC, the Company received an indemnity from YPCC that there were no liabilities that had not been fully disclosed to the Company. In addition, prior to the Company’s involvement in YSC, YPCC made a working capital loan to YSC of RMB 4,475,375 ($650,720), and YPCC has recently requested repayment of this loan.This liability has been reflected in the consolidated balance sheet of the Company as a related party loan since the acquisition of YSC. YPCC has agreed that YSC can apply the payables to YPCC of RMB4,475,375 ($650,720) to offset the receivables from YPCC of RMB 6,900,000 ($1,003,260), should YPCC fail to repay the remaining loan of RMB 6,900,000 to the bank. In the case of YPCC not being able to repay the loan of RMB 6,900,000 ($1,003,260) and the Company repaying the loan for YPCC, the Company will apply the loan of RMB4,475,375 ($650,720) owed to YPCC to offset the receivables of RMB6,900,000 from YPCC. In December 2004,YPCC paid back RMB 500,000 ($72,700) to the bank. The loan amount outstanding as of December 31, 2004 was RMB 6,900,000 ($1,003,260) and net monetary exposure to the Company is RMB 2,424,625 ($352,540). The Company is still in discussion with YPCC and the Agricultural Bank of China regarding the full payment of the loan. The Company believes that the net exposure of RMB 2,424,625 ($352,540) is fully recoverable from YPCC, however the ultimate collection of this amount is subject to some uncertainty.
This loan was not paid in full as of the end of 2004, because YSC,YPCC and the Agricultural Bank are still in discussion on repaying the loan in full. YPCC has provided written representation that it is fully responsible for repaying the loan and did pay back RMB 500,000 ($72,700) prior to the end of 2004. Because of YPCC’s guarantee and payment, the Agricultural Bank has verbally advised the Company that no penalty will be charged on the loan and allowed until June 26, 2005 to resolve the loan issue.
Although the company expects a practical solution to be worked out among the three parties by Q2 2005 and the company believes it has sufficient legal protection to remedy this issue, should it be necessary to proceed to litigation, the Company has recognized a liability to the bank of RMB 6,900,000 according to the accounting standards and a receivable from YPCC of RMB2,424,625, net of the receivable of RMB6,900,000m from YPCC and the payable of RMB4,475,375 ($650,720) to YPCC.
7. Fourth Quarter
During the three months ended December 31, 2004, the loss of $869,733 during the period decreased from $980,665 during Q4 2003 mainly due to the non-cash stock-based compensation expenses of $444,552 in Q4 2004, as required by Canadian accounting standards as of this year, offset by a one time write-down of mineral properties of $760,490 in Q4 2003.The increase in other expenses was mainly due to the incorporation of the operational results of YSC since date of acquisition. The Company’s earnings from interest income increased from $13,290 in Q4 2003 to $85,338 in Q4 2004
Q4 showed an operating loss of $63K, due to the reclassification of machinery maintenance and repairs costs from general expenses into Cost of Sales and an inventory write-off, as they are directly related to production.The Q4 operation results were affected unfavorably by operation interruption caused by electricity shortage, rising raw materials costs and some one-time items such as audit fees of $65K and inventory provision of $17K.
The operational results of YSC, which was acquired on April 20, 2004, attributable to Spur Ventures Inc. for the three months ended December 31, 2004 are summarized as follows:
| Sales | 2,317,372 | |
| Cost of sales | 2,377,516 | |
| | (60,144 | ) |
| Expenses | | |
| Loss on disposal of fixed assets | 12,806 | |
| Office and miscellaneous | 101,191 | |
| Professional fees | 72,941 | |
| Rent | (10,556 | ) |
| Repairs and maintenance | (29,564 | ) |
| Selling expenses | 77,213 | |
| Travel, advertising and promotion | 51,773 | |
| Wages and benefits | 2,831 | |
| | 278,636 | |
| Operating loss | (338,780 | ) |
| Other income and expenses | | |
| Interest income | (1,765 | ) |
| Interest | 61,678 | |
| Other income | (25,573 | ) |
| Foreign exchange gain | (2,976 | ) |
| | 31,364 | |
| Loss for the period | (370,144 | ) |
| | S P U R V E N T U R E S I N C . • A N N U A L R E P O R T 2 0 0 4 | 11 |
Management Discussion and Analysis
For the Year Ended December 31, 2004 • All figures expressed in Canadian dollars
8. Changes in Accounting Policies Including Initial Adoption
Effective January 1, 2004, the Company adopted the new requirements of the Canadian Institute of Chartered Accountants Standard 3870 which requires an expense to be recognized in the financial statements for all forms of employee stock-based compensation, including stock options. Previously, the Company did not record any compensation cost on the granting of stock options to employees and directors as the exercise price was equal to or greater than the market price at the date of the grants.
Accordingly, the opening deficit was restated on a retroactive basis to show the effect of compensation expense associated with stock option grants to employees and directors from January 1, 2002 to December 31, 2003, which amounted to $1,405,432, and an increase of $94,600 to share capital and $1,310,832 to stock options.
9. Outstanding Share Data
As of April 29, 2005, the Company had the following shares, warrants and options outstanding:
| | Number | Exercise Price | Expiry Date |
| Common Shares | 40,231,828 | n/a | n/a |
| Stock Options | 50,000 | $ 0.90 | 18-Oct-05 |
| Stock Options | 700,000 | $ 0.90 | 19-Jun-06 |
| Stock Options | 2,100,000 | $ 0.60 | 6-May-08 |
| Stock Options | 635,000 | $ 1.20 | 19-Jun-08 |
| Stock Options | 1,650,000 | $ 1.50 | 23-Jul-09 |
| Stock Options | 200,000 | $ 1.50 | 12-Oct-09 |
| Stock Options | 500,000 | $ 1.80 | 1-Mar-10 |
| Warrants | 300,000 | $ 1.10 | 15-Jul-05 |
| Warrants | 5,687,500 | $ 1.50 | 23-Jun-06 |
| Agent’s Warrants | 330,000 | $ 1.50 | 23-Jun-06 |
| TOTAL | 52,384,328 | | |
10. Phosphoric Acid Plant Construction
The construction and commissioning of a 60,000 tonnes phosphoric acid plant is successfully completed in March 2005.At the time of acquisition of the Yichang Spur Chemicals Ltd. (YSC) plant, there was a shortage of phosphoric acid that has caused the joint venture NPK fertilizer plant to operate below capacity. The acid plant has a design capacity of 60,000 tonnes per annum (tpa), enough to enable the production of a NPK fertilizer plant at approximately 300,000 tonnes per annum and will provide a captive source of phosphoric acid. It is planned that this plant in the future will be supplied with phosphorous rock from the Company’s YMC joint venture which has rights to the Yichang phosphate deposit.
Spur Ventures acquired 72% of YSC interest in 2004, and agreed to invest a minimum of US$2.5 million for construction of the phosphoric acid plant, and has agreed to undertake the future construction of an additional plant module with 200,000 tpa of NPK fertilizer capacity. No decision as to timing of the future fertilizer plant expansion has yet been made, but the Company did decide to increase the size of certain equipment and infrastructure in the phosphoric acid plant to accommodate the prospective construction of the additional 200,000 tpa NPK fertilizer module.
Based on independent engineering studies completed in late 2003, the original budget for the phosphoric acid plant and related infrastructure was $5.57 million. In the course of detailed engineering it was determined that significant additional plant foundation was required due to poor soil conditions. In addition, the continued rapid growth in the Chinese economy has resulted in significant increases in the price of raw materials including steel and concrete. The final estimated construction cost is $6.85 million, bringing the project within 23% of the original budget under difficult conditions.
Commencement of project construction was also delayed until September, 2004 as a result of the delay in handover of the project site from the Chinese authorities. Construction took approximately 6 months, a substantially shorter timeframe than forecast, and significantly shorter than what would have been achievable in North America, in a booming and at times challenging Chinese domestic economy.
11. Yichang Phosphate Mineral Properties
The following is an outline of all the developments of the Yichang Phosphate project and the joint venture Yichang Maple Leaf Chemicals (YMC) up to the date of this MD&A.
| • | In 1996, the Company entered into a preliminary agreement with Yichang Phosphorous Chemical Industries Group Co. (“YPCC”). Under the agreement, the Company has obtained an exclusive right to develop the Yichang phosphate deposit, which is located in Hubei province in China.The Company can earn a 90% interest in the property by taking the property to production. The Chinese government will earn a 10% interest by contributing land and the mineral rights. |
| | |
| • | In 1999, the Company completed the preliminary feasibility study report conducted jointly by major chemical and mining research and design institutes. Final project approval was also received from the Chinese government. |
| | |
| • | During 2001, the China Environment Protection Bureau approved the environmental study of the Yichang project. Letters of intent were signed with major Chinese banks for bank loans and working capital line to finance the project. |
| | |
| • | In early 2002, the Company commenced its application for a mining permit through its joint venture partner, YPCC. Preliminary approval (stage one) of the application has been received from the Chinese Ministry of Land and Resources. Stage two of the application is in progress. |
| | |
| • | In December 2002, the Company and its joint venture partner YPCC signed a joint venture contract that will result in the setting up of a joint venture company YMC, which is to undertake the development of the Yichang phosphate project. |
| | |
| • | On April 20, 2004, the Company acquired a 72.18% controlling interest in a joint venture company, Yichang Spur Chemicals Ltd., that owns a 100,000 tpa fertilizer facility in the City of Yichang, Hubei Province. (See Note 10 “Acquisition of YSC”) |
| | |
| • | Since a fertilizer plant has been acquired and expanded under YSC, the terms of the original YMC joint venture were re-negotiated. Under the new terms of the YMC joint venture, the Company is required to make a US$3,834,000 capital contribution into YMC within three months of receipt of Chinese government approval for the restructuring. This amount represents the estimated cost of commissioning a mining facility capable of producing sufficient phosphate rock to supply at least a 100,000 tpa NPK fertilizer facility. By December 31, 2004, The Company has already made cash contribution of $2,816,430 directly to YMC for costs associated with the issue of the mining license, engineering and design work. |
| | |
| • | The total investment to be made by the Company in YMC is US$25,561,000 million over 5 years, of which only the initial US$3,834,000 is a firm commitment. The balance of the US$25,561,000 is to be invested over five years on a best efforts basis, as follows: |
| | 1. | a cumulative total of US$8,946,000 within two years of receipt of approval for the restructured agreement; |
| | 2. | a cumulative total of US$16,614,000 within four years; |
| | 3. | the balance of US$25,561,000 within five years. |
The US$25,561,000 represents the estimated minimum equity required to finance the total investment over the next five years to develop the phosphate mine and to expand the fertilizer plant from 300,000 tpa to 1 million tpa, estimated at US$93 million. The Company plans to fund the project through a combination of equity, bank loan and operating cash flow.
| • | During the year ended December 31, 2004, the Company incurred exploration and development costs of $62,204 (2003: $53,951) in relation to the YMC joint venture. As of December 31, 2004, the Company has capitalized exploration and development expenses of $2,108,249 in relation to the YMC joint venture. |
| | |
| • | While the Company is still working on getting the approval from the Chinese central government, the Company has made several significant cash contributions in February and March 2005 to bring YMC registered capital above 15% of total capital requirement based on the original agreement with YPCC. Under the original agreement, the government |
| 12 | S P U R V E N T U R E S I N C . • A N N U A L R E P O R T 2 0 0 4 | |
| | is obligated to transfer the mining license to YMC once the first 15% capital requirement is met. The Company is currently pursuing the mining licenses transfer. Both the funds the Company contributed to YMC and the ownership in the phosphate deposits may be at risk, should the Company not get the approval from the Chinese government. |
| | |
| • | Although YMC is still waiting for the final approval of its restructuring from the Chinese government, the Company has decided to consolidate YMC into its 2004 financial statements, due to the significant investments it has made to YMC in the last quarter of 2004 and first quarter of 2005. |
12. Acquisition of YSC
In December 2003, the Company entered into a letter of intent with YPCC to acquire approximately a 65% interest in an existing fertilizer facility owned by Xinyuan Chemicals Ltd. in Yichang.The Xinyuan plant has the capacity to produce 100,000 tonnes per annum (“tpa”) of sulphate-based NPK fertilizer. On April 20, 2004, the Company acquired a 72.18% controlling interest in Xinyuan and formed a joint venture company called Yichang Spur Chemicals Ltd. (“YSC”), that owns a 100,000 tpa fertilizer facility in the City of Yichang, Hubei Province. The Company made a contribution of $3,351,934 (US$2.5 million) to YSC to acquire its interest. These funds are to be applied to finance the construction of a 60,000 tpa phosphoric acid plant, which was still under construction at the end of 2004. The Company has agreed to undertake an expansion of the existing fertilizer facility from 100,000 to 300,000 tpa. The estimated cost of this expansion is US$8.2 million, based on a preliminary scoping study prepared for the Company by the Nanjing Chemical Industrial Design Institute.
This acquisition has been accounted for using the purchase method and results of operations have been consolidated since the date of acquisition.
13. Outlook
The key focus of 2005 is to bring YSC profit to at least breakeven level while continue to expand the fertilizer facilities at stages to 300,000 tpa and to get the mining license transferred into YMC and start the mining of the phosphate deposits.
Activities of YSC will be centered on operation improvement which includes a) continuing to strengthen the leadership team; b) re-alignment of company resources to customer needs; c) debottlenecking of production processes; d) better supply-chain management. The Company is also taking concrete steps to complete the environmental studies and detailed engineering studies for the expansion of the YSC fertilizer plant to 300,000 tpa.
The Company is working closely with all levels of Chinese governments to get the mining license transferred into YMC. The mining of the phosphate deposits will start soon after the mining license is transferred. It is planned that YMC will supply phosphorous rock to YSC fertilizer production.
With respect to the agriculture sector in China, the Chinese Government is expected to continue to work out agriculture-friendly policies to boost the rural economy and increase farmers' income. Policies already announced include agricultural taxes exemption in 2006 which is two years ahead of schedule, direct subsidies for grain growers and more subsidies for farmers to buy improved crop strains, agricultural machinery and tools.
14. Risk Factors
The Company’s business is in China, which despite recent government policy changes carries high risk for foreign owned operations.
China has an evolving legal structure.Many laws and regulations dealing with economic matters in general, and foreign investment in particular, have been promulgated, including changes to the Constitution of China to authorize foreign investment and to guarantee "the lawful rights and interests" of foreign investors in China. Nevertheless, China does not have a comprehensive system of laws, and the legal and judicial systems in China in respect of commercial laws are rudimentary. In addition, enforcement of existing laws may be uncertain and sporadic, and may be subject to domestic politics.
China has a volatile economy.Although the Chinese economy has experienced significant growth in the recent past, such growth has been uneven among various sectors of the economy and geographic regions. The central government has recently implemented measures to control inflation, which is intended to have the effect of significantly restraining economic expansion. Consequently, there can be no assurance that the government’s pursuit of economic reforms will not be curtailed. It is also possible that inflation in China will cause the cost of the Company’s products to be uneconomic for the rural farming community making up the Company’s market.
Investment in China can be adversely affected by significant political, economic and social uncertainties.Any change in laws and policies by the Chinese government could adversely affect the Company’s investment in China. The Chinese Government has been pursuing economic reform and open door policies since 1978. The general development pattern in the last 25 years shows that the political environment in China has been improving gradually. Circumstances such as a change in leadership, social or political disruption or unforeseen circumstances may affect significantly or encumber the Chinese government's abilities to pursue such policies.
Mineral and fertilizer prices have historically fluctuated substantially, and are affected by numerous factors beyond the Company’s control, including international, economic and political trends, expectations for inflation, currency exchange fluctuations, interest rates, global or regional consumption patterns, speculative activities and world wide production levels.The effects of these factors can not be accurately predicted.The economics of mining and fertilizer production are also affected by operating costs, variation in the grade of mined mineralized material and fluctuation in the price of fertilizer products.
Need to Obtain Permits and Licenses. The operations of the Company require licenses and permits from various government agencies. The revision of the original YMC joint venture contract, for example, requires the approval of the Ministry of Commerce and the NDRC. Funds wired to YMC and ownership in the YMC phosphate deposits may be at risk, should the company not get the final approval from the government.
Raw materials costs and transportation costs are rising. The continued rapid growth in the Chinese economy and the recovery of U.S. economy are driving up the prices of international commodities and transportation costs world wide. The profit of fertilizer producers are affected by rising raw material costs, increasing ocean freight and transportation costs within China.
Additional risk factors can be found in the Company’s Form 20-F, and filed with Canadian regulators on SEDAR at www.sedar.com and with the United States Securities and Exchange Commission at www.sec.gov.
| | S P U R V E N T U R E S I N C . • A N N U A L R E P O R T 2 0 0 4 | 13 |
Management’s Responsibility for Financial Reporting
The accompanying consolidated financial statements of the company have been prepared by management in accordance with Canadian generally accepted accounting principles and include a summary prepared by management reconciling significant differences between Canadian and United States generally accepted accounting principles as they affect these financial statements. The financial statements contain estimates based on management’s judgement. Management maintains an appropriate system of internal controls to provide reasonable assurance that transactions are authorized, assets safeguarded, and proper records maintained.
The Audit Committee of the Board of Directors has met with the company’s independent auditors to review the scope and results of the annual audit and to review the consolidated financial statements and related financial reporting matters prior to submitting the consolidated financial statements to the Board for approval.
The company’s independent auditors, PricewaterhouseCoopers LLP, are appointed by the shareholders to conduct an audit of the annual financial statements, and their report follows.
| "Robert J. Rennie" | "Michael G. Chen" | |
| Robert J. Rennie | Michael G. Chen | |
| Chief Executive Officer | Chief Financial Officer | |
| | | |
| March 30, 2005 | | |
Independent Auditors’ Report
To the Shareholders of Spur Ventures Inc.
We have audited the consolidated balance sheets ofSpur Ventures Inc.as at December 31, 2004 and 2003 and the consolidated statements of operations and deficit and cash flows for the years ended December 31, 2004, 2003 and 2002. These financial statements are the responsibility of the company’s management. Our responsibility is to express an opinion on these financial statements based on our audits.
We conducted our audits in accordance with generally accepted auditing standards in Canada and the standards of the Public Company Accounting Oversight Board (United States). Those standards require that we plan and perform an audit to obtain reasonable assurance whether the financial statements are free of material misstatement. An audit includes examining, on a test basis, evidence supporting the amounts and disclosures in the financial statements. An audit also includes assessing the accounting principles used and significant estimates made by management, as well as evaluating the overall financial statement presentation.
In our opinion, these consolidated financial statements present fairly, in all material respects, the financial position of the company as at December 31, 2004 and 2003 and the results of its operations and its cash flows for the years ended December 31, 2004, 2003 and 2002 in accordance with Canadian generally accepted accounting principles.
Comments by Auditors for U.S. Readers on Canada-U.S. Reporting Difference
In the United States, reporting standards for auditors require the addition of an explanatory paragraph (following the opinion paragraph) when there is a change in accounting principles that has a material effect on the comparability of the company's financial statements, such as the change described in note 2 to the financial statements. Our report to the shareholders dated March 24, 2005 (except for notes 12 and 20, which are as at March 30, 2005) is expressed in accordance with Canadian reporting standards which do not require a reference to such a change in accounting principles in the auditor's report when the change is properly accounted for and adequately disclosed in the financial statements.
"PricewaterhouseCoopers LLP"Chartered Accountants
Vancouver, British Columbia
April 24, 2005 (except for notes 12 and 20, which are as at March 30, 2005)
| 14 | S P U R V E N T U R E S I N C . • A N N U A L R E P O R T 2 0 0 4 | |
Consolidated Balance Sheets
As at December 31, 2004 and 2003 (expressed in Canadian dollars)
| | 2004 | | 2003 | |
| | $ | | $ | |
| | | | | |
| Assets | | | | |
| | | | | |
| Current assets | | | | |
| Cash and cash equivalents (note 3) | 9,484,991 | | 4,965,571 | |
| Short-term investments (note 4) | 5,510,500 | | — | |
| Marketable securities (note 6) | — | | 98,500 | |
| Accounts receivable | 188,415 | | 57,601 | |
| Inventory (note 5) | 1,125,024 | | — | |
| Prepaid expenses | 96,034 | | — | |
| Due from YPCC (note 11) | 371,103 | | — | |
| | 16,776,067 | | 5,121,672 | |
| Fixed assets- net (note 7) | 8,748,005 | | 26,663 | |
| Land use rights- net (note 8) | 482,639 | | — | |
| Mineral properties(note 9) | 2,108,249 | | 2,046,045 | |
| | 28,114,960 | | 7,194,380 | |
| | | | | |
| Liabilities | | | | |
| | | | | |
| Current liabilities | | | | |
| Accounts payable and accrued liabilities | 1,181,390 | | 38,616 | |
| Customer deposits | 494,632 | | —- | |
| Other payable | 228,863 | | — | |
| Due to Yuanfeng (note 11) | 44,290 | | — | |
| Bank loans (note 12) | 3,853,100 | | — | |
| | 5,802,275 | | 38,616 | |
| Minority interest | 971,098 | | — | |
| | | | | |
| Shareholders’ Equity | | | | |
| | | | | |
| Capital stock(note 13) | | | | |
| Authorized | | | | |
| Unlimited common shares without par value | | | | |
| Unlimited preferred shares without par value | | | | |
| Issued | | | | |
| 39,889,328 common shares (2003 - 28,289,328) | 27,550,651 | | 11,846,776 | |
| | | | | |
| Stock options and warrants(note 13) | 2,763,003 | | 41,680 | |
| Cumulative translation adjustment | (408,187 | ) | — | |
| Deficit | (8,563,880 | ) | (4,732,692 | ) |
| | 21,341,587 | | 7,155,764 | |
| | 28,114,960 | | 7,194,380 | |
Commitments (note 19)
Subsequent events (note 20)
Approved by the Board of Directors

The accompanying notes are an integral part of these consolidated financial statements.
| | S P U R V E N T U R E S I N C . • A N N U A L R E P O R T 2 0 0 4 | 15 |
Consolidated Statements of Operations and Deficit
For the years ended December 31, 2004, 2003 and 2002 (expressed in Canadian dollars)
| | 2004 | | 2003 | | 2002 | |
| | $ | | $ | | $ | |
| | | | | | | |
| Sales | 4,810,302 | | — | | — | |
| Cost of sales | 4,860,560 | | — | | — | |
| Amortization and depreciation | 58,027 | | — | | — | |
| | (108,285 | ) | — | | — | |
| | | | | | | |
| Expenses | | | | | | |
| Consulting fees | 355,112 | | 255,243 | | 126,629 | |
| Loss on disposal of fixed assets | 12,806 | | 9,082 | | — | |
| Management fees | — | | 27,833 | | 50,000 | |
| Office and miscellaneous | 224,021 | | 50,730 | | 24,011 | |
| Printing and mailing | 31,785 | | 13,582 | | (4,916 | ) |
| Professional fees | 180,725 | | 123,361 | | 68,416 | |
| Rent | 49,317 | | 31,009 | | 29,669 | |
| Repairs and maintenance | 18,134 | | — | | — | |
| Selling expenses | 134,127 | | — | | — | |
| Stock based compensation expenses | 1,257,040 | | — | | — | |
| Transfer agent and filing fees | 38,991 | | 21,501 | | 7,702 | |
| Travel, advertising and promotion | 227,910 | | 68,190 | | 6,735 | |
| Wages and benefits | 164,295 | | 3,235 | | — | |
| Writedown of mineral properties | — | | 760,490 | | — | |
| Writedown of marketable securities | — | | 6,000 | | 7,000 | |
| | 2,694,263 | | 1,370,256 | | 315,246 | |
| Operating loss | (2,802,548 | ) | (1,370,256 | ) | (315,246 | ) |
| | | | | | | |
| Other income and expense | | | | | | |
| Interest income | 183,608 | | 38,845 | | 3,259 | |
| Interest expense | (191,300 | ) | (997 | ) | — | |
| Investment income | 825 | | 10,867 | | 37,750 | |
| Foreign exchange gain | 82,908 | | 1,147 | | — | |
| Other income | 90,661 | | — | | — | |
| Net gain on disposal of marketable securities | 2,333 | | 10,340 | | 28,365 | |
| | 169,035 | | 60,202 | | 69,374 | |
| | | | | | | |
| Loss before minority interest | (2,633,513 | ) | (1,310,054 | ) | (245,872 | ) |
| Minority interest | 207,758 | | — | | — | |
| Loss for the year | (2,425,755 | ) | (1,310,054 | ) | (245,872 | ) |
| | | | | | | |
| Deficit - Beginning of year | | | | | | |
| As previously reported | (4,732,692 | ) | (3,422,638 | ) | (3,176,766 | ) |
| Stock based compensation (note 2) | (1,405,433 | ) | — | | — | |
| As restated | (6,138,125 | ) | (3,422,638 | ) | (3,176,766 | ) |
| Deficit - End of year | (8,563,880 | ) | (4,732,692 | ) | (3,422,638 | ) |
| Basic and diluted loss per common share | (0.07 | ) | (0.06 | ) | (0.01 | ) |
| Weighted average number of common shares outstanding | 34,667,716 | | 22,265,095 | | 17,949,328 | |
The accompanying notes are an integral part of these consolidated financial statements.
| 16 | S P U R V E N T U R E S I N C . • A N N U A L R E P O R T 2 0 0 4 | |
Consolidated Statements of Cash Flows
For the years ended December 31, 2004, 2003 and 2002 (expressed in Canadian dollars)
| | 2004 | | 2003 | | 2002 | |
| | $ | | $ | | $ | |
| | | | | | | |
| Cash flows used in operating activities | | | | | | |
| Cash received from customers | 4,960,493 | | — | | — | |
| Investment income | 825 | | 10,867 | | 37,750 | |
| Interest received | 157,778 | | 38,845 | | 3,312 | |
| Other income received | 63,813 | | — | | — | |
| Interest paid | (161,724 | ) | (997 | ) | (81 | ) |
| Cash paid to suppliers and employees | (5,310,931 | ) | (620,645 | ) | (334,960 | ) |
| | (289,746 | ) | (571,930 | ) | (293,979 | ) |
| | | | | | | |
| Cash flows from investing activities | | | | | | |
| Feasibility study, project development | (62,204 | ) | (43,782 | ) | (311,185 | ) |
| Purchase of fixed assets | (4,445,159 | ) | (40,922 | ) | — | |
| Purchase of marketable securities | — | | (100,000 | ) | (236,250 | ) |
| Purchase of short term investments | (5,510,500 | ) | — | | — | |
| Amount due from related parties | 13,526 | | — | | — | |
| Amounts due from joint venture partner | — | | — | | (200,000 | ) |
| Acquisition of YSC - net of cash acquired | (572,255 | ) | — | | — | |
| Disposal of marketable securities | 100,833 | | 100,840 | | 655,565 | |
| | (10,475,759 | ) | (83,864 | ) | (91,870 | ) |
| | | | | | | |
| Cash flows from financing activities | | | | | | |
| Issue of common shares | 15,784,724 | | 5,635,456 | | — | |
| Repayment of bank loans | (130,860 | ) | — | | — | |
| | 15,653,864 | | 5,635,456 | | — | |
| | | | | | | |
| Effect of exchange rate changes | (368,939 | ) | — | | — | |
| Increase (decrease) in cash and cash equivalents | 4,519,420 | | 4,979,662 | | (385,849 | ) |
| Cash and cash equivalents (bank overdraft) - Beginning of year | 4,965,571 | | (14,091 | ) | 371,758 | |
| Cash and cash equivalents (bank overdraft) - End of year | 9,484,991 | | 4,965,571 | | (14,091 | ) |
The accompanying notes are an integral part of these consolidated financial statements.
| | S P U R V E N T U R E S I N C . • A N N U A L R E P O R T 2 0 0 4 | 17 |
Notes to Consolidated Financial Statements
December 31, 2004, 2003 and 2002 (expressed in Canadian dollars)
| 1. | Nature of operations |
| |
| | Spur Ventures Inc. (the company) is in the business of developing an integrated fertilizer business in the People’s Republic of China (China). The recoverability of the amounts shown as mineral properties is dependent upon the existence of economically recoverable reserves, the ability of the company to obtain the necessary financing to complete the development of the properties, and upon future profitable production or proceeds from the sale of fertilizer products. |
| |
| | Management acknowledges that if the Yichang phosphate property proves to be successful then it will require significant equity and/or debt financing. Management has successfully raised financing in the past for the early stages of this project; however, there is no assurance that the company will be successful in raising this financing in the future. Management considers that the company has sufficient funding to meet its obligations and maintain administrative and operational expenditures for at least the next 12 months. |
| |
| | In addition, the company has entered into agreements to secure the title of the mineral properties, and has formed a 78.72% controlled Joint Venture Company, Yichang Maple Leaf Chemicals Ltd. (YMC), with Hubei Yichang Phosphorous Chemical Co. Ltd. (YPCC) in December 2003 to undertake the development of the phosphate mines. YMC has not yet commenced active operations. Although these arrangements are in accordance with industry standards for the stage of exploration of such properties, these procedures do not guarantee the company’s title. Property title may also be subject to unregistered prior agreements and regulatory requirements. |
| |
| | To develop an integrated fertilizer business, the company acquired Xinyuan Chemicals Ltd. and formed a Joint Venture Company called Yichang Spur Chemicals Ltd. (YSC) (with a 72.18% controlling interest), which owns a 100,000 tonnes per annum (tpa) fertilizer facility in the City of Yichang, Hubei Province (see note 10). |
| |
| 2. | Significant accounting policies |
| |
| | Accounting principles |
| | These consolidated financial statements are prepared in accordance with Canadian generally accepted accounting principles (GAAP).These consolidated financial statements differ in certain material respects from the requirements of United States. GAAP, as disclosed in note 17. |
| |
| | Principles of consolidation |
| | These consolidated financial statements include the accounts of the company, its 72.18% owned Joint Venture Company, Yichang Spur Chemicals Ltd. (YSC), since the date of acquisition, its 78.72% owned Joint Venture Company which is awaiting approval of the Chinese authorities and which was consolidated commencing in the fourth quarter of 2004,Yichang Maple Leaf Chemicals Ltd. (YMC) and its wholly owned subsidiaries, Spur Chemicals (BVI) Inc. and International Phosphate Mining Corporation (International Phosphate). International Phosphate was incorporated to carry out mineral exploration and development programs in China.All significant intercompany transactions and accounts have been eliminated. |
| |
| | Use of estimates |
| | The preparation of financial statements in conformity with generally accepted accounting principles requires management to make estimates and assumptions that affect the reported amounts of assets and liabilities and disclosure of contingent liabilities at the date of the financial statements, and the reported amounts of revenues and expenditures during the reporting period. Items subject to significant management estimates include the amounts recorded for stock based compensation and the assessment of recoverable values. Actual results could differ from those reported. |
| |
| | Marketable securities |
| | Marketable securities are carried at the lower of cost and market value. |
| |
| | Cash and cash equivalents |
| | Cash and cash equivalents consist of cash and short term deposits maturing within 90 days of the original date of acquisition.To limit its exposure, the company deposits its funds with large financial institutions. |
| | |
| | Fixed Assets
Fixed assets are recorded at cost less accumulated depreciation. Depreciation is computed using the straight line method at the following rates calculated to depreciate the cost of the assets less their residual values over their estimated useful lives: |
| | Building | 5.00% |
| | Machinery and equipment | 8.33% - 10.00% |
| | Motor vehicle | 20.00% |
| | Office equipment and furniture | 20.00% |
| | Computer equipment | 33.33% |
| | Leasehold improvement | 50% |
| | Land use right
The land use right is for 50 years. It is amortized on a straight line basis over the initial term of the YSC business license of 30 years. Mineral properties
The company records its interest in mineral properties at cost. Exploration and development expenditures relating to properties that have economically recoverable reserves or significant mineralization requiring additional exploration, as well as interest and costs incurred to finance those expenditures, are deferred and will be amortized against future production following commencement of commercial production, or written off if the properties are sold, allowed to lapse, abandoned or if impairment is evident. The acquisition of title to mineral properties is a detailed and time-consuming process. The company has taken steps, in accordance with industry standards, to verify title to mineral properties in which it has an interest. Although the company has taken every precaution to ensure that legal title to its properties is properly recorded in the name of the company, there can be no assurance that such title will ultimately be secured. Inventory
Inventory is valued at the lower of cost and net realizable value. Net realizable value represents the estimated selling price in the ordinary course of business less the estimated costs of completion and the estimated costs necessary to make the sale. Cost was calculated using the weighted average method comprising all costs of purchases, costs of conversion and other costs incurred in bringing the inventories to their present location and condition. Asset retirement obligations
According to current Chinese environmental regulation and contracts of the company, there is no obligation for the company to dismantle and remove plant and equipment or to remediate sites upon the cessation of operations. The company pays an annual environmental fee to the local government as the cost of operating a chemical site.This fee is calculated as a percentage of the annual revenues and is expensed as incurred. Impairment of long-lived assets
Management of the company regularly reviews the net carrying value of each long lived asset.Where information is available and conditions suggest impairment, estimated future net cash flows are calculated using estimated future prices, proven and probable reserves, selling prices for fertilizer products,and operating,capital and reclamation costs on an undiscounted basis. Reductions in the carrying value of long lived assets would be recorded to the extent the net book value of the related assets exceeds the estimated future cash flows. Where estimates of future net cash flows are not available and where other conditions suggest impairment, management assesses if carrying value can be recovered. Management’s estimates of mineral prices, recoverable proven and probable reserves, selling prices for fertilizer products, and operating, capital and reclamation costs are subject to certain risks and uncertainties which may affect the recoverability of long lived assets.Although management has made its best estimate of these factors, it is possible that changes could occur in the near term, which could adversely affect management’s estimate of the net cash flow to be generated from its assets. Loss per common share
The basic loss per share is computed by dividing the net loss by the weighted average number of common shares outstanding during the year. The diluted loss per share reflects the potential dilution of common share equivalents, such as outstanding stock options and share purchase warrants, in the weighted average number of common shares outstanding during the year, if dilutive. For this purpose, the “treasury stock method” is used whereby |
| 18 | S P U R V E N T U R E S I N C . • A N N U A L R E P O R T 2 0 0 4 | |
| | the assumed proceeds upon the exercise of stock options and warrants are used to purchase common shares at the average market price during the year. |
| |
| | Income taxes |
| | The company follows the asset and liability method for accounting for income taxes. Under this method, future income tax assets and liabilities are determined based on the differences between the tax basis of assets and liabilities and the amounts reported in the financial statements. The future tax assets or liabilities are calculated using the tax rates for the periods in which the differences are expected to be settled. Future tax assets are recognized to the extent that they are considered more likely than not to be realized. |
| |
| | Foreign currency translations |
| | Monetary assets and liabilities denominated in foreign currencies are translated at the exchange rate in effect at the balance sheet date and non monetary assets and liabilities at the exchange rates in effect at the time of acquisition or issue.Revenues and expenses are translated at the average exchange rate in effect during the period or at the historical rate for the related non monetary asset or liability. Realized and unrealized foreign exchange gains and losses are included in earnings. |
| |
| | The consolidated financial statements are presented in Canadian dollars and the functional currency of YSC and YMC is Chinese Yuan Renminbi (RMB).The assets and liabilities of YSC and YMC are translated into Canadian dollars at period end exchange rates and resulting translation adjustments are reflected as a separate component of shareholders’ equity.Revenues and expenses of YSC and YMC are translated at exchange rates in effect on the transaction dates.Transaction gains or losses that arise from exchange rate fluctuations on transactions denominated in a currency other than the functional currency are included in the income statement of YSC and YMC as they occur. |
| |
| | Financial instruments |
| | The carrying values of cash and cash equivalents, short term investments, accounts receivable, and accounts payable and accrued liabilities approximate their fair values due to the short periods to maturity.The fair value of marketable securities is disclosed in note 6. Bank loans are carried at current value, due to maturity within a year, as discussed in notes 11 and 12. |
| |
| | Stock-based compensation |
| | Effective January 1, 2004, the company adopted the new requirements of the Canadian Institute of Chartered Accountants (CICA) Standard 3870, which requires an expense to be recognized in the financial statements for all forms of employee stock based compensation. Previously, the company did not record any compensation cost on the granting of stock options to employees and directors as the exercise price was equal to or greater than the market price at the date of the grants. |
| |
| | Accordingly, the opening deficit was restated on a retroactive basis to show the effect of compensation expense associated with stock option grants to employees and directors from January 1, 2002 to December 31, 2003, which amounted to $1,405,433, and an increase of $94,600 to share capital and $1,310,833 to stock options. |
| |
| | Revenue recognition |
| | The company recognizes revenues to external customers when the product is shipped and title passes along with the risks and rewards of ownership, provided collectibility is reasonably assured. |
| |
| 3. | Cash and cash equivalents |
| |
| | Cash and cash equivalents include banker’s acceptances of $2,499,545 maturing on March 3, 2005 and two discount notes of $2,522,188 and $2,499,985 maturing on January 7, 2005 and January 26, 2005, respectively. Interest receivable of $29,739 has been accrued as at December 31, 2004. Included in cash balances is a balance of approximately $1,109,000 held in accounts in the Chinese subsidiaries, the repatriation of which is subject to certain restrictions. |
| |
| 4. | Short-term investments |
| |
| | Short-term investments consist of five redeemable Guaranteed Investment Certificates (GIC) totalling $5,510,500 maintained at a local Canadian bank with an interest rate of 2.10% per annum maturing on September 13, 2005. Interest receivable of $34,874 has been accrued as at December 31, 2004. |
| | |
| 5. | Inventory |
| | | | 2004 | | | 2003 |
| | | | | | | |
| | Raw materials | $ | 421,922 | | $ | — |
| | Finished goods | | 613,753 | | | — |
| | Other consumables | | 89,349 | | | — |
| | | | 1,125,024 | | | — |
| | In the last quarter of 2004, the company wrote off the unrealizable value of certain finished goods inventory in the amount of $52,256, which has been included in cost of sales. |
| | |
| 6. | Marketable securities |
| | | | 2004 | | | 2003 |
| | | | | | | |
| | Energy trust units | $ | — | | $ | 98,500 |
| | The company initially acquired energy trust units in 2001, and during 2002 and 2003 both acquired and disposed of a number of these units.At December 31, 2004, the remaining units held had a cost of $nil (2003 - $101,100) and, consistent with its accounting policy, the company has recognized a loss of $nil (2003 - $1,500) as a result of writing these investments down to their market value during the year. The trust units were sold in January 2004. |
| | |
| 7. | Fixed assets |
| | | | | 2004 | 2003 |
| | | | Accumulated | | |
| | | Cost | depreciation | Net | Net |
| | | | | | |
| | Building | $ 1,657,698 | $ 60,073 | $ 1,597,625 | $ — |
| | Construction in progress | 4,744,650 | — | 4,744,650 | — |
| | Machinery and equipment | 2,487,541 | 171,182 | 2,316,359 | — |
| | Motor vehicle | 43,709 | 6,151 | 37,558 | — |
| | Office equipment and | | | | |
| | furniture | 56,849 | 11,668 | 45,181 | 10,081 |
| | Leasehold improvements | 19,898 | 13,266 | 6,632 | 16,582 |
| | | 9,010,345 | 262,340 | 8,748,005 | 26,663 |
| | Construction in progress comprises a phosphoric acid plant which was completed and commissioned subsequent to December 31, 2004. |
| | |
| 8. | Land use rights |
| | | | | 2004 | 2003 |
| | | | Accumulated | | |
| | | Cost | depreciation | Net | Net |
| | | | | | |
| | Land use rights | $ 492,365 | $ 9,726 | $ 482,639 | $ — |
| | Land use rights refer to the ability of the company to operate a fertilizer and phosphoric acid facility on the Yidu property for a period of 50 years.These land use rights are provided by the municipal government and are being amortized over the initial 30 year term of YSC’s business license as this is currently believed to approximate the estimated useful life. |
| | |
| 9. | Mineral properties Yichang phosphate project |
| | | $ | |
| | | | |
| | Exploration and development costs | | |
| | Balance - December 31, 2002 | 2,752,584 | |
| | Consulting | 37,633 | |
| | Travel | 16,318 | |
| | Amount written off | (760,490 | ) |
| | Balance - December 31, 2003 | 2,046,045 | |
| | Consulting | 53,309 | |
| | General and administration | 1,025 | |
| | Travel | 7,870 | |
| | Balance - December 31, 2004 | 2,108,249 | |
| | S P U R V E N T U R E S I N C . • A N N U A L R E P O R T 2 0 0 4 | 19 |
Notes to Consolidated Financial Statements
December 31, 2004, 2003 and 2002 (expressed in Canadian dollars)
| | In 1996, the company entered into an agreement with YPCC for the exclusive right to develop the Yichang phosphate deposit, which is located in Hubei province in China. The company can earn a 90% interest in the property by taking the property to production. The Chinese government will earn a 10% interest by contributing land and the mineral rights. In 1999, the company completed the preliminary feasibility study report conducted jointly by the Northern China Chemical Mine Planning and Design Institute and China Wuhuan Chemical Engineering Corp.Final project approval was also received from the Chinese government. In November 2000, a feasibility study and an environmental impact assessment study were completed. During 2001, the China Environment Protection Bureau approved the environmental study of the Yichang project. In April 2002, the feasibility study was updated by Jacobs Engineering Corporation. In early 2002, the company commenced its application for a mining permit through YPCC. Preliminary approval (stage one) of the application has been received from the Chinese Ministry of Land and Resources. Stage two of the application is in progress. In 2003, the company and YPCC formed a Joint Venture Company, YMC, to undertake the development of the project. During 2003, $760,490 of deferred mineral property expenditures was written off, being the amount deferred in relation to the Jacobs Engineering Corporation study on the development of a plant, as the construction of the facility will no longer be required due to the purchase of the existing fertilizer facility which was completed in 2004. |
| | |
| 10. | Acquisition of YSC In December 2003, the company entered into a letter of intent with YPCC to acquire approximately a 65% interest in an existing fertilizer facility owned and operated by Xinyuan Chemicals Ltd. (Xinyuan) in Yichang. On April 20, 2004, the company formed a 72.18% controlled Joint Venture Company called YSC.The remaining 27.82% of YSC is held by YPCC and Yidu Yuanfeng Chemical Industrial Company Limited (Yuanfeng). YSC owns the 100,000 tpa fertilizer facility in the City of Yichang, Hubei Province. The company made a contribution of $3,351,934 (US$2.5 million) to YSC to acquire its interest. These funds are to be applied to finance the construction of a 60,000 tpa phosphoric acid plant, which was under construction at the end of 2004 and completed and commissioned subsequent to December 31, 2004.The company has also agreed to undertake an expansion of the existing fertilizer facility from 100,000 to 300,000 tpa.The estimated cost of this expansion is approximately US$8.2 million, based on a preliminary scoping study prepared for the company by the Nanjing Chemical Industrial Design Institute. This acquisition of the fertilizer facility and operations has been accounted for as the acquisition of a business using the purchase method and results of operations have been consolidated since the date of acquisition. The following table summarizes the purchase price allocation based on estimates of the fair values of the assets acquired and liabilities assumed: |
| | | $ | |
| | | | |
| | Cash and short-term deposits | 2,779,623 | |
| | Accounts receivable | 259,550 | |
| | Sundry receivables | 22,125 | |
| | Prepaid expenses | 479,576 | |
| | Due from related parties | 1,179,488 | |
| | Inventory | 831,685 | |
| | Fixed assets | 4,935,548 | |
| | Land use right | 538,933 | |
| | Bank loan | (1,171,420 | ) |
| | Accounts payable and accrued liabilities | (979,781 | ) |
| | Other payables | (323,679 | ) |
| | Long term loan | (3,166,000 | ) |
| | Due to related parties | (743,689 | ) |
| | | 4,641,959 | |
| | Less: Minority interest | (1,290,025 | ) |
| | Cash paid by the company | 3,351,934 | |
| 11. | Amounts outstanding with minority shareholders As of December 31, 2004, the company has the following amounts outstanding with minority shareholders of YSC. |
| | | RMB | | $ | |
| | | | | | |
| | Bank loan for the benefit of YPCC | 6,900,000 | | 1,003,260 | |
| | Loan from YPCC | (4,475,375 | ) | (650,720 | ) |
| | Net exposure of YSC (note 12) | 2,424,625 | | 352,540 | |
| | Advance to YPCC and its subsidiaries | 127,663 | | 18,562 | |
| | | 2,552,288 | | 371,102 | |
| | Following the formation of YSC and the acquisition of the fertilizer operations, the company was made aware that YSC became liable for a loan facility of RMB7,400,000 ($1,075,960) from the Agricultural Bank of China (ABC), the funds of which were advanced directly to YPCC prior to the date of acquisition. The company understands that the proceeds of this loan were used in YPCC's business and YSC has received no benefits from this loan. YPCC has guaranteed repayment of this loan to the company and the bank and the company is advised that YPCC has been paying the related interest to the bank. Prior to December 31, 2004,YPCC repaid RMB500,000 of the loan balance, accordingly at December 31, 2004, RMB6,900,000 ($1,003,260) was outstanding on this facility. The company has recorded an amount receivable from YPCC of RMB6,900,000 ($1,003,260) at December 31, 2004, being the amount due from YPCC required for the repayment of the remaining outstanding loan balance. YSC has also received a working capital loan from YPCC of RMB4,475,375 ($650,720) and YPCC has requested repayment of this loan.YSC has received a written authorization for YPCC to apply this amount to offset the amount receivable from YPCC should YPCC fail to repay the bank loan and YSC is required to make payment of the loan directly to the bank. Accordingly, the company has accounted for the amount receivable from YPCC and the amount payable to YPCC on a net basis. The company believes the net exposure of RMB2,424,625 ($352,540) to be fully recoverable from YPCC, however, the ultimate collection of this amount remains uncertain and it is possible that the amount may not be fully recoverable. The company is still in discussion with YPCC and the Agricultural Bank of China regarding the full repayment of the bank loan, which came due in December 2004 (note 12). |
| | |
| 12. | Bank loans The company has three bank loans totalling RMB19,600,000 ($2,849,840) (December 31, 2003 - $nil) from a local Chinese bank, in addition to the loan mentioned in note 11. Each of these bank loans is renewed annually and interest is payable monthly. As at December 31, 2004, information about the bank loans is as follows: |
| | Principal amount | Annual | |
| | RMB | $ | interest rate | Maturity Date |
| | | | | |
| | 5,000,000 | 727,000 | 5.49% | December 16, 2004 |
| | 11,900,000 | 1,730,260 | 5.84% | October 27, 2005 |
| | 2,700,000 | 392,580 | 5.58% | November 3, 2005 |
| | 6,900,000 | 1,003,260 | 6.588% (note 11) | December 27, 2004 |
| | 26,500,000 | 3,853,100 | | |
| | As mentioned in note 11, the bank loan of RMB6,900,000 ($1,003,260) was incurred in YSC’s name for the benefit of YPCC. This loan was not paid in full as of the end of 2004, because YSC, YPCC and the Agricultural Bank of China were still in discussions on repaying the loan in full. The Agricultural Bank of China has verbally advised the company that no penalty will be charged on the loan and allowed until June 26, 2005 to resolve the loan issue. The bank loan of RMB5,000,000 ($727,000) with Industrial & Commerce Bank of China (ICBC) became due in December 2004. The company was in discussion with ICBC regarding renewing the loan facility during the first quarter of 2005 and the loan was paid in full on March 30, 2005. |
| 20 | S P U R V E N T U R E S I N C . • A N N U A L R E P O R T 2 0 0 4 | |
| 13. | Capital stock |
| |
| | (a) | Authorized |
| |
| | | Unlimited common shares without par value |
| | | Unlimited preferred shares without par value, issuable in series and with special rights and restrictions to be determined on issuance |
| |
| | (b) | Issued and outstanding |
| | | Number of | | |
| | | common | | |
| | | shares | Amount | |
| | | | | |
| | Balance - December 31, 2001 and 2002 | 17,949,328 | $ 6,231,555 | |
| | Issued for exercise of options | 300,000 | 210,000 | |
| | Issued for cash under private placement | 5,370,000 | 2,800,000 | |
| | Issued for exercise of warrants | 4,670,000 | 2,802,000 | |
| | Commission and finder’s fee for private placement | — | (196,779 | ) |
| | Balance - December 31, 2003 | 28,289,328 | 11,846,776 | |
| | Issued for exercise of warrants | 400,000 | 240,000 | |
| | Issued for exercise of options | 200,000 | 150,000 | |
| | Issued for cash under private placement | 11,000,000 | 15,372,725 | |
| | Fair value of warrants issued to brokers for | | | |
| | private placement services | — | (224,400 | ) |
| | Reallocation from stock options and warrants account | | | |
| | Prior year | — | 94,600 | |
| | Current year | — | 70,950 | |
| | Balance - December 31, 2004 | 39,889,328 | 27,550,651 | |
| | On June 22, 2004, the company completed a brokered private placement of 11 million units at a price of $1.50 per unit; each unit comprises one common share and one half share purchase warrant. Each whole warrant is exercisable for two years to acquire a common share at $1.50 per share. Commissions of $990,000, direct costs of $115,275 and 330,000 share purchase warrants with a value of $224,400 were incurred. Stock options Under the 2004 Employee Stock Option Plan,the company may grant options to its directors, officers, and service providers for up to 5,700,000 common shares or such additional amount as may be approved from time to time by the shareholders of the company. Under the plan, the exercise price of each option is not less than the market price of the company’s stock on the date of grant and an option’s maximum term is 5 years. The directors of the company may determine and impose terms upon which each option shall become vested in respect of option shares. A summary of the company’s options at December 31, 2004, 2003 and 2002 and the changes for the years then ended is presented below: |
| | | | | Weighted |
| | | | | average |
| | | Option | | exercise |
| | | outstanding | | price $ |
| | | | | |
| | Balance - January 1, 2002 | 1,325,000 | | 0.90 |
| | Cancelled/expired | (325,000 | ) | 0.90 |
| | Balance - December 31, 2002 | 1,000,000 | | 0.90 |
| | Granted | 3,185,000 | | 0.79 |
| | Exercised | (300,000 | ) | 0.75 |
| | Balance - December 31, 2003 | 3,885,000 | | 0.77 |
| | Granted | 1,850,000 | | 1.50 |
| | Exercised | (200,000 | ) | 0.75 |
| | Balance - December 31, 2004 | 5,535,000 | | 1.02 |
| | On July 23, 2004, the company granted incentive stock options for 1,650,000 shares at a price of $1.50 per share exercisable up to July 23, 2009, to six directors. 25% of the options become vested on the date of grant and 12.5% of the options vest every three months after the date of grant, becoming fully vested after 18 months. On October 12, 2004, the company granted incentive stock options for 200,000 shares at a price of $1.50 per share exercisable up to October 12, 2009, to an officer. 25% of the options become vested on the date of grant and 12.5% of the options vest every three months after the date of grant, becoming fully vested after 18 months. The fair value of each option granted is estimated on the date of grant using the Black Scholes option pricing model with the following assumptions: |
| | Risk-free interest rate | 3.46% - 4.00% |
| | Expected life of options in years | 5 years |
| | Expected volatility | 47% - 57% |
| | Dividend per share | $nil |
| | Pro forma information determined under the fair value method of accounting for stock options is as follows: |
| | | | 2003 | | | 2002 | |
| | | | | | | | |
| | Loss for the year | | | | | | |
| | As reported | $ | (1,310,054 | ) | $ | (245,872 | ) |
| | Compensation expense | | (1,405,433 | ) | | — | |
| | Pro forma loss for the year | | (2,715,487 | ) | | (245,872 | ) |
| | Basic and diluted loss per share | | | | | | |
| | As reported | | (0.06 | ) | | (0.01 | ) |
| | Pro forma | | (0.14 | ) | | (0.01 | ) |
| | On January 1, 2004, the company adopted the new requirements of the CICA Standard 3870, which requires an expense to be recognized in the financial statements for all forms of employee stock based compensation, including stock options. There is no difference between earnings reported and pro forma earnings in 2004 and going forward. The following table summarizes information about the options outstanding and exercisable at December 31, 2004: |
| | | | Options outstanding | | Options exercisable |
| | | | Weighted | | | |
| | | Number | average | Weighted | Number | Weighted |
| | Range of | outstanding | remaining | average | exercisable | average |
| | exercise | at Dec. 31, | contractual | exercise | at Dec. 31, | exercise |
| | prices | 2004 | life | price | 2004 | price |
| | $ | | (years) | $ | | $ |
| | 0.60 | 2,200,000 | 3.42 | 0.60 | 2,200,000 | 0.60 |
| | 0.90 | 850,000 | 1.45 | 0.90 | 850,000 | 0.90 |
| | 1.20 | 635,000 | 3.50 | 1.20 | 635,000 | 1.20 |
| | 1.50 | 1,850,000 | 4.53 | 1.50 | 668,750 | 1.50 |
| | 0.35 to 0.96 | 5,535,000 | 3.35 | 1.02 | 4,353,750 | 0.88 |
| | In the year ended December 31, 2003, the company elected not to follow the fair value method of accounting for stock options granted to employees and directors.Accordingly, no compensation expense is recorded on the grant of share options to employees and directors where the exercise price is equal to the market price at the date of grant. In accordance with the new accounting policy as stated in note 2, the opening deficit was restated on a retroactive basis to show the effect of compensation expense associated with stock option grants to employees and directors from January 1, 2002 to December 31, 2003, which amounted to $1,405,433, and an increase of $94,600 to share capital and $1,310,833 to stock options. |
| | S P U R V E N T U R E S I N C . • A N N U A L R E P O R T 2 0 0 4 | 21 |
Notes to Consolidated Financial Statements
December 31, 2004, 2003 and 2002 (expressed in Canadian dollars)
| | Warrants
The following is a summary of warrants transactions during the year ended December 31, 2004: |
| | | | | Weighted |
| | | | | average |
| | | Number of | | exercise |
| | | warrants | | price $ |
| | | | | |
| | Balance - December 31, 2002 | — | | — |
| | Granted | 5,370,000 | | 0.63 |
| | Exercised | (4,670,000 | ) | 0.60 |
| | Balance - December 31, 2003 | 700,000 | | 0.81 |
| | Granted | 5,830,000 | | 1.50 |
| | Exercised | (400,000 | ) | 0.60 |
| | Balance - December 31, 2004 | 6,130,000 | | 1.48 |
| | Of the outstanding warrants at December 31, 2003, 400,000 had an exercise price of $0.60 which expire in May 2005, all of which have been exercised in 2004, and 300,000 had an exercise price of $1.10 which expire in July 2005. As part of the consideration of arranging the private placement that was closed on June 22, 2004, 330,000 share purchase warrants were granted to the agent.These warrants are exercisable until June 23, 2006 at a price of $1.50 per share.A fair value of $224,400 has been recorded as cost of the private placement, which is estimated on the date of grant using the Black Scholes option pricing model with the following assumptions: |
| | Risk free interest rate | 3.36% |
| | Expected life | 2 years |
| | Expected volatility | 81% |
| | Dividend per share | $nil |
| | The following table summarizes information about warrants outstanding at December 31, 2004: |
| | Number of warrants | | Exercise price | | Expiry date |
| | | | | | |
| | 300,000 | $ | 1.10 | | July 15, 2005 |
| | 5,830,000 | | 1.50 | | June 23, 2006 |
| | 6,130,000 | | | | |
| | | | | | |
| 14. | Related party transactions Included in expenses are the following amounts paid to companies with common directors: |
| | | | 2004 | | | 2003 | | | 2002 |
| | | | | | | | | | |
| | Consulting fees (a) | $ | 310,112 | | $ | 255,243 | | $ | 76,129 |
| | Management fees (b) | | — | | | 27,833 | | | 50,000 |
| | Legal fees (c) | | 25,542 | | | 27,511 | | | 13,549 |
| | | | 335,645 | | | 310,587 | | | 139,678 |
| | a) | Directors of the company receive consulting fees for their management services. A total of $310,112 was paid in 2004 to a director and companies controlled by four directors (2003 - $255,243; 2002 - $76,129). |
| |
| | b) | Management fees of $nil (2003 - $27,833; 2002 - $50,000) were paid to companies owned by a director. |
| |
| | c) | Legal fees of $25,542 (2003 - $27,511; 2002 - $13,549) and consulting fees of $34,000 (2003 - $nil; 2002 - $nil) were paid to two officers and a law firm affiliated with a director of the company. |
| |
| | d) | Included in accounts payable and accrued liabilities, there are $3,333 and $20,000 due to two directors for the consulting services provided and salaries payable, respectively and $12,065 due to a director and an officer for expenses incurred on behalf of the company. |
| | e) | Included in accounts receivable is $6,857 due from a director in relation to a travel advance. |
| |
15. | Segmented information |
| |
| | Management considers developing an integrated fertilizer business including the development of the phosphate project in China to be the company’s principal activity.All revenues are earned from sales to customers located in China. |
| | | | | | | | | | 2004 |
| | | | Canada | | | China | | | Consolidated |
| | | | | | | | | | |
| | Current assets | $ | 15,931,184 | | $ | 844,883 | | $ | 16,776,067 |
| | Fixed assets - net | | 18,694 | | | 8,729,311 | | | 8,748,005 |
| | Land use rights | | — | | | 482,639 | | | 482,639 |
| | Mineral properties | | — | | | 2,108,249 | | | 2,108,249 |
| | | | 15,949,878 | | | 12,165,082 | | | 28,114,960 |
| | | | | | | | | | |
| | | | | | | | | | 2003 |
| | | | Canada | | | China | | | Consolidated |
| | | | | | | | | | |
| | Current assets | $ | 5,121,672 | | $ | — | | $ | 5,121,672 |
| | Fixed assets - net | | 26,663 | | | — | | | 26,663 |
| | Mineral properties | | — | | | 2,046,045 | | | 2,046,045 |
| | | | 5,148,335 | | | 2,046,045 | | | 7,194,380 |
| 16. | Income taxes A reconciliation of the combined Canadian federal and provincial income taxes at statutory rates and the company’s effective income tax expense is as follows: |
| | | | 2004 | | | 2003 | |
| | | | | | | | |
| | Income tax provision at statutory rates | $ | (864,053 | ) | $ | (492,842 | ) |
| | Increase in taxes from: | | | | | | |
| | Non deductible items | | 449,094 | | | 2,882 | |
| | Foreign losses subject to different tax rates | | 14,123 | | | — | |
| | Losses not recognized | | 400,836 | | | 489,960 | |
| | | | —- | | | — | |
| | The company’s controlled Joint Venture Company YSC, has a future income tax liability associated with its capital assets and land use right. It has a potential future income tax asset related to its tax losses, inventory and accounts receivable.The future potential future income tax asset related to its tax losses more than offset its future income tax liability associated with its capital assets. Given the losses incurred by YSC and its history, management has determined that it would not be appropriate to recognize a net future income tax asset.As a Joint Venture Company with foreign parties,YSC has a tax exemption during its first two profitable years and a 50% tax exemption in the third year. What effect this will have on the future taxes payable is unknown at this time since it its dependant on what the profit will be in those low tax years. The company in Canada has significant loss carryforwards with no revenue generating operations (other than interest income). Therefore, management has determined that it is appropriate that no future income tax asset is recorded for the Canadian entity. Temporary differences related to the following assets and tax loss carryforwards that give rise to potential future income assets as at December 31, 2004 and 2003 are described below: |
| | | | 2004 | | | 2003 | |
| | | | | | | | |
| | Tax loss carryforwards and other amounts | $ | 3,361,197 | | $ | 607,337 | |
| | Fixed assets | | (88,280 | ) | | (2,452 | ) |
| | Land use right | | (116,062 | ) | | — | |
| | Material properties | | 254,107 | | | 254,107 | |
| | | | 3,410,962 | | | 858,992 | |
| | Valuation allowance | | (3,410,962 | ) | | (858,992 | ) |
| | Future income tax assets | | — | | | — | |
| 22 | S P U R V E N T U R E S I N C . • A N N U A L R E P O R T 2 0 0 4 | |
| | At December 31, 2004, the company has the following unused tax losses available for application against taxable income of future years, and they expire as follows: |
| | 2005 | $ | 862,675 |
| | 2006 | | 1,815,492 |
| | 2007 | | 3,709,388 |
| | 2008 | | 981,091 |
| | 2009 | | 1,048,665 |
| | 2010 | | 611,015 |
| | 2011 | | 916,171 |
| | | | 9,944,497 |
| 17. | Differences between Canadian and U.S. generally accepted accounting principles |
| |
| | a) | The company’s consolidated financial statements have been prepared in accordance with generally accepted accounting principles in Canada.The material measurement differences between GAAP in Canada and the United States that would have an effect on these financial statements are as follows: |
| | | | 2004 | | | 2003 | | | 2002 | |
| | | | | | | | | | | |
| | Mineral properties -under Canadian GAAP | $ | 2,108,249 | | $ | 2,046,045 | | $ | 2,752,584 | |
| | Feasibility study/technical evaluation | | (2,108,249 | ) | | (2,046,045 | ) | | (2,752,584 | ) |
| | Mineral properties - under U.S. GAAP | | — | | | — | | | — | |
| | Marketable securities - under | | | | | | | | | |
| | Canadian GAAP | | — | | | 98,500 | | | 95,000 | |
| | Adjustment for fair market value | | — | | | 3,600 | | | — | |
| | Marketable securities - under U.S. GAAP | | — | | | 102,100 | | | 95,000 | |
| | Capital stock - under Canadian GAAP | | 27,550,651 | | | 11,846,776 | | | 6,231,555 | |
| | Compensatory escrow release value | | 697,500 | | | 697,500 | | | 697,500 | |
| | Flow-through share premium | | (135,000 | ) | | (135,000 | ) | | (135,000 | ) |
| | Pro rata allocation of units value | | | | | | | | | |
| | to warrants | | (2,840,612 | ) | | — | | | — | |
| | Capital stock - under U.S. GAAP | | 25,272,539 | | | 12,409,276 | | | 6,794,055 | |
| | Stock options and warrants - | | | | | | | | | |
| | under Canadian GAAP | | 2,763,003 | | | 41,680 | | | — | |
| | Pro rata allocation of units value | | | | | | | | | |
| | of warrants | | 2,840,612 | | | — | | | — | |
| | Stock-based compensation | | (1,405,433 | ) | | — | | | — | |
| | Stock options and warrants - | | | | | | | | | |
| | under U.S. GAAP | | 4,198,182 | | | 41,680 | | | — | |
| | Deficit - under Canadian GAAP | | (8,563,880 | ) | | (4,732,692 | ) | | (3,422,638 | ) |
| | Feasibility study/technical evaluation | | (2,108,249 | ) | | (2,046,045 | ) | | (2,752,584 | ) |
| | Compensatory escrow release value | | (697,500 | ) | | (697,500 | ) | | (697,500 | ) |
| | Deferred taxes | | 135,000 | | | 135,000 | | | 135,000 | |
| | Fair market value of marketable securities | | — | | | 3,600 | | | — | |
| | Stock-based compensation | | 1,405,433 | | | — | | | — | |
| | Deficit - under U.S. GAAP | | (9,829,196 | ) | | (7,337,637 | ) | | (6,737,722 | ) |
| | The impact on the consolidated statements of operations and deficit would be as follows: |
| | | | 2004 | | | 2003 | | | 2002 | |
| | | | | | | | | | | |
| | Loss for the year - under Canadian GAAP | $ | (2,425,755 | ) | $ | (1,310,054 | ) | $ | (245,872 | ) |
| | Feasibility study/technical evaluation | | (62,204 | ) | | (43,782 | ) | | (311,185 | ) |
| | Mineral property written off in year | | — | | | 760,490 | | | — | |
| | Interest expenses related to construction | | 49,823 | | | — | | | — | |
| | Loss for the year - under U.S. GAAP before | | | | | | | | | |
| | comprehensive income adjustments | | (2,438,136 | ) | | (593,346 | ) | | (557,057 | ) |
| | Adjustment to arrive at comprehensive income | | | | | | | | | |
| | Marketable securities | | (3,600 | ) | | 3,600 | | | — | |
| | Cumulative translation adjustment | | 408,187 | | | — | | | — | |
| | Comprehensive loss | | (2,033,549 | ) | | (589,746 | ) | | (557,057 | ) |
| | Loss per common share - under U.S. | | | | | | | | | |
| | GAAP before comprehensive income | | | | | | | | | |
| | adjustments | | (0.07 | ) | | (0.02 | ) | | (0.03 | ) |
| b) | Income taxes |
| |
| | Under U.S. GAAP, the sale of flow through shares results in a deferred credit being recognized for the excess of the purchase price paid by investors over the fair value of common shares without the flow through feature. The fair value of the shares is recorded as equity. When the tax deductibility of the qualifying expenditures is renounced, a temporary difference arises with the natural gas interests. A deferred tax liability is established in the amount of the tax benefit foregone, and tax expense is recorded for the difference between the deferred tax liability and the premium received upon issuance of the flow through shares. This deferred tax liability reverses due to loss carry forwards available. |
| |
| c) | Accounting for stock-based compensation |
| |
| | Effective January 1, 2004 for Canadian GAAP, the company adopted CICA 3870, “Stock based Compensation and Other Stock based Payments” which requires an expense to be recognized in the financial statements for all forms of employee stock-based compensation.Adoption of CICA 3870 was applied retroactively, without restatement, as permitted by the standard. For U.S. GAAP purposes, the company adopted FAS 148, “Accounting for Stock based Compensation Transition and Disclosure”. FAS 148 provides alternative methods of transition for a voluntary change to the fair value based method of accounting for stock based employee compensation. For U.S. GAAP, effective January 1, 2004, the company applied the modified prospective method of adoption included in FAS 148 which recognizes stock based employee compensation for 2004 as if the fair value based accounting method in this statement had been used to account for all employee awards granted, modified or settled in fiscal years beginning after December 14, 1994. Since all stock options granted from that date to January 1, 2004 vested immediately, application of the modified prospective method for U.S. GAAP purposes in 2004 did not have any additional impact on the stock based compensation charge for 2004 or on total shareholders’ equity under U.S. GAAP. |
| |
| d) | Mineral property expenditures |
| |
| | Mineral property expenditures are accounted for in accordance with Canadian GAAP as disclosed in note 2. For U.S. GAAP purposes, the company expenses exploration or property maintenance expenditures relating to mineral properties as they are incurred. When proven and probable reserves are indicated by a bankable feasibility study for a property, subsequent development costs of the property are capitalized. The capitalized costs of such properties would then be measured periodically to ensure that the carrying value can be recovered on an undiscounted cash flow basis. If the carrying value cannot be recovered on this basis, the mineral properties would be written down to fair value using a discounted cash flow basis. |
| |
| | Under U.S. GAAP, capitalization of interest is calculated for certain qualifying assets that require a period of time to get them ready for their intended use. Under Canadian GAAP, capitalization of interest is permitted, but not required. In 2004, the company’s interest expense related to construction in progress is $49,823, which has been expensed for Canadian GAAP purposes. |
| |
| e) | Issue of escrow shares |
| |
| | U.S. GAAP requires that compensation expense be recorded for the excess of the quoted market price over the price granted to employees and directors under escrow share agreements that are based on more than mere passage of time and require performance.The compensation expense is recorded when the shares become eligible for release. Under Canadian GAAP, no compensation expense is recorded for such escrow share agreements. |
| |
| f) | Supplemental cash flow information |
| |
| | Under U.S. GAAP, the direct method of presenting the consolidated statements of cash flows for 2004, 2003 and 2002 would not show exploration expenditures under investing activities. These balances of $62,204, $43,782 and $311,185, respectively, would instead be included in cash paid to suppliers and employees under operating activities. This would result in totals for 2004, 2003 and 2002 for cash paid to suppliers and employees of $5,373,135, $664,427 and $646,145, respectively. |
| | S P U R V E N T U R E S I N C . • A N N U A L R E P O R T 2 0 0 4 | 23 |
Notes to Consolidated Financial Statements
December 31, 2004, 2003 and 2002 (expressed in Canadian dollars)
| g) | Marketable securities |
| |
| | For U.S. GAAP purposes, unrealized gains and losses for available for sale securities are included in comprehensive income, a separate component of shareholders’ equity, except where the decline in value is other than temporary in which case Canadian and U.S. GAAP are the same. |
| |
| h) | Issue of units |
| |
| | Canadian GAAP allows the allocation of proceeds on the issue of units to be applied firstly to the fair value of the common shares component, with the remainder applied to the warrants. Under U.S. GAAP, the proceeds are allocated to each instrument on a pro rata basis using the total fair value to determine the pro rata allocation. |
| |
| i) | Recent accounting pronouncements |
| |
| | Accounting standards that the company expects to adopt subsequent to December 31, 2004 on a prospective basis when applicable include the following: |
| |
| | Financial instruments-recognition and measurement, hedges, and comprehensive income |
| |
| | Financial instruments other than trade receivables, trade payables and certain other financial liabilities including long term debt must be recorded at fair value, not historical cost. If a financial instrument is measured at fair value, changes in its fair value are recognized in operations in the period in which they occur except for investments, and possibly certain other assets, designated as being “available for sale”. Changes in the fair value should be recorded directly in shareholders’ equity in a special account called “other comprehensive income” until the asset disappears or is impaired. At that time, the gains and losses are recycled to the income statement. The result of applying this standard is that income from these investments will be reported in the income statement as if the assets were accounted for at historical cost. |
| |
| | These new Canadian standards are effective for fiscal years starting on or after October 1, 2006 and can be adopted earlier but only at the beginning of a financial year and only if the company has not already issued interim financial statements that cover part of the year. The company does not foresee any significant effects on implementation. |
| |
| | Whether mineral rights are tangible or intangible assets |
| |
| | Effective for reporting periods beginning after April 29, 2004, the United States Emerging Issues Task Force (EITF) released Issue 04 2, “Whether Mineral Rights are Tangible or Intangible Assets.” The consensus was that mineral rights acquired on a business combination are tangible assets and should be recorded as a separate component of property, plant and equipment either on the face of the financial statements or in the notes. The company will comply with the issue in the future as required. |
| |
| | Mining assets - impairment in business combinations |
| |
| | Effective for reporting periods beginning after March 31, 2004, the EITF released Issue No. 04 3, “Mining Assets: Impairment and Business Combinations.”The EITF reached consensus that an entity should include value beyond proven and probable reserves in the value allocated to mining assets in a purchase price allocation to the extent a market participant would include such value in determining the fair market value of the asset. The EITF also reached consensus that an entity should include the effects of anticipated changes in market prices of minerals when determining the fair market value of mining assets in a purchase price equation in a manner consistent with expectations of the marketplace. |
| |
| | An entity should also include cash flows associated with value beyond proven and probable reserves in estimates of future cash flows for determining if a mining asset is impaired under SFAS 144. An entity should also anticipate fluctuations in market prices when determining these cash flows. |
| |
| | The company will comply with this issue for any future business combination. |
| | |
| 18. | Financial instruments and concentration of risk Fair values
The company’s financial instruments include cash and cash equivalents, marketable securities, accounts receivable, customer deposits, accounts payable and accrued liabilities and income and resource taxes payable. The fair values of these financial instruments approximate their carrying values. Credit risk
The company maintains substantially all of its cash and cash equivalents with major financial institutions in Canada. Financial instruments that potentially subject the company to concentration of credit risk are primarily receivables. Management is of the opinion that any risk of loss is significantly reduced due to the financial strength of the company’s major customers. Foreign currency risk
A substantial portion of the company’s business is carried out in Chinese Renminbi, and the company maintains Renminbi denominated bank accounts. Fluctuations in exchange rates between the Canadian dollar and PRC Renminbi could have a material effect on the business, results of operations and financial condition of the company. |
| | |
| 19. | Commitments During the upcoming years, the company has the following rental commitments: |
| 20. | Subsequent events On March 3, 2005, the company granted incentive stock options for 500,000 shares at a price of $1.80 per share exercisable up to March 1, 2010, to a director. 50% of the options become vested on March 1, 2006 and the remaining 50% become vested on March 1, 2007. On March 29, 2005, a former director exercised 50,000 shares of stock options at a price of $0.90 per share and the company received proceeds of $45,000. |
| 24 | S P U R V E N T U R E S I N C . • A N N U A L R E P O R T 2 0 0 4 | |
Corporate Data
| DIRECTORS: | SHARES LISTED: | TRANSFER AGENT: |
| | | |
| Steven G. Dean | TSX Venture Exchange | Computershare Trust Company |
| Robert J. Rennie | (Symbol SVU) | Vancouver, British Columbia |
| John Van Brunt | Shares Issued: 39,889,328 million | |
| Robert G. Atkinson | | LEGAL COUNSEL: |
| David Black | Fully Diluted: 51,554,328 million | |
| David Cohen | (at December 31, 2004) | DuMoulin Black |
| Ruston Goepel | | Vancouver, British Columbia |
| Y.B. Ian He | HEAD OFFICE: | |
| Dongdong Huang | | |
| | 2684 Four Bentall Centre | AUDITORS: |
| | Box 49298 | |
| | 1055 Dunsmuir Street | PricewaterhouseCoopers LLP |
| OFFICERS: | Vancouver BC V7X 1L3 | Vancouver, British Columbia |
| | | |
| Steven G. Dean | | |
| Chairman | CONTACT: | ANNUAL GENERAL MEETING: |
| | | |
| Robert J. Rennie | Robert J. Rennie | The Annual General Meeting of the |
| Chief Executive Officer | Chief Executive Officer | Shareholders will be held at: |
| | 604.697.6205 | |
| Y.B. Ian He | rrennie@spur-ventures.com | The Kitsilano Room |
| President | | Vancouver Marriott Pinnacle Hotel |
| | Lucy Ana van Egmond | 1128 West Hastings Street |
| Dongdong Huang | 604.697.6200 | Vancouver, British Columbia |
| Vice President, Corporate and Legal | info@spur-ventures.com | on June 22, 2005 at 10:30 A.M. |
| | | |
| Michael Chen | WEBSITE: | |
| Chief Financial Officer | www.spur-ventures.com | |
| | | |
| | | |
| | | |
| | | |
| | CAUTIONARY NOTES | |
These materials include a review of Spur Ventures Inc.’s operations in China. Readers are cautioned that certain statements regarding expansions of the operations are based on estimates and projections and are not definitive. No representation or prediction is intended as to the results of the expansions, all of which is subject to fertilizer margins sufficient to justify any expansions.
These materials include certain “forward-looking statements” within the meaning of the Private Securities Litigation Reform Act of 1995. Other than statements of historical fact, all statements in this material, including, without limitation, statements regarding potential mineralization and resources, estimated or potential future production, and future plans and objectives of the Company, are forward-looking statements that involve various known and unknown risks, uncertainties and other factors. There can be no assurance that such statements will prove to be accurate. Actual results and future events could differ materially from those anticipated in such statements. Readers are cautioned not to place undue reliance on these forward-looking statements that speak only as of the date of these materials. Important factors that could cause actual results to differ materially from the Company’s expectations include, among others, the availability of financing, availability of raw materials such as potash and phosphate rock, fertilizer prices, conclusions of any scoping, pre-feasibility or feasibility studies and changes in project parameters, as well as those factors discussed under the heading “Risk Factors” and elsewhere in the Company’s documents filed from time to time with the TSX Venture Exchange, Canadian or U.S. securities regulators and other regulatory authorities. All subsequent written and oral forward-looking statements attributable to the Company or persons acting on its behalf are expressly qualified in their entirety by this notice.
Certain information referenced in this Annual Report is based on a feasibility study prepared by Jacobs Engineering Inc. of Lakeland, Florida dated October, 2000, the executive summary of which is available on the Company’s website. Readers are encouraged to review that report for detail on the phosphate deposit held by the Company through the YMC joint venture. In addition, certain information relating to the YSC phosphate fertilizer plant is based on a scoping study prepared by Najing Chemical Industrial Design Institute dated December, 2003, the executive summary of which is available on SEDAR and on the Company’s website. Readers are encouraged to review that report for detail on the projected cost, timing and operating costs of the phased expansion of the YSC joint venture fertilizer plant.
| | S P U R V E N T U R E S I N C . • A N N U A L R E P O R T 2 0 0 4 | 25 |

www.spur-ventures.com
SVU:TSX-V