G R O W I N G W I T H C H I N A

Spur Ventures Inc. Annual Report 2005
G R O W I N G W I T H C H I N A
China is the world’s largest fertilizer market
representing almost a third of the global demand
in nitrogen, phosphate and potash.
2005 ANNUAL REPORT SPUR VENTURES INC.
Y E A R I N R E V I E W
Yichang Spur Chemicals (YSC) NPK Plant
| • | New General Manager |
| | | |
| • | 60,000 mt phosphoric acid plant commissioned in March |
| | | |
| • | 78% increase in production to 33,422 mt of NPK’s |
| » | Average daily production of 186 mt or 68% of capacity |
| » | Daily production record of 309 mt |
| » | Monthly production record of 5,311 mt |
| | | |
| • | Marketing plan simplified from four to one product |
| » | Focusing on Hejiawang brand (13-17-15) |
| » | 47% increase in sales volume to 29,819 mt |
| | | |
| • | Advanced announced growth of the facility |
| » | Phase I growth for MAP and Sulphuric Acid plants engineering design completed |
| » | Phase II preliminary design for 600,000 mt compound fertilizer plant completed |
Yichang Maple Leaf Chemicals (YMC) Phosphate Mining
| • | All requirements met for transfer of Dianziping and Shukongping mines triggering transfer process |
| | |
| • | MOU signed with Yichang City clarifying the process for the mining license transfers |
| | |
| • | Preliminary engineering designs for the mine completed. |
PHOTO: View of Yichang.

Corporate
| • | Entered into agreement to acquire the fertilizer assets of Hubei Tianren Chemical Corporation |
| | |
| • | Management team strengthened with the appointment of new CEO, Vice President of Corporate Development, General Manager of YSC, General Counsel and Corporate Secretary and new Manager of Government and Public Relations |
| | |
| • | First Phase of ERP successfully implemented |
| | |
| • | Grant Thorton engaged to assist in SOX404 compliance |
F I N A N C I A L H I G H L I G H T S
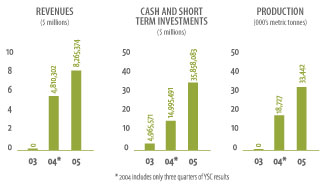
| • | 72% increase in revenues to $8.3 M |
| | | |
| • | Earnings per share of ($.0.07) unchanged from 2004 |
| | | |
| • | EBIDTA of ($2,487,000) and Net Earnings of ($3,332,000) |
| » | $954,000 Foreign Exchange loss due to strengthening Canadian dollar |
| | | |
| • | Gross proceeds of $30 million raised in a successful private placement |
| | | |
| • | Strong balance sheet with $54 million in assets and $6 million in liabilities |
S P U R ’ S P R I O R I T I E S F O R 2 0 0 6
| • | Phosphate mining |
| » | Progress mining license transfer to YMC |
| | | |
| • | Grow the company |
| » | Complete the merger with Tianren to immediately increase NPK production from 100,000 to 300,000 mt and to market 1.5 million mt of NPK’s |
| » | Increase NPK production either by acquisition or greenfields |
| | | |
| • | Continuous Improvement |
| » | Improve the operating rate of NPK production at YSC to reduce costs and maximize margins |
| » | Continue building the Integrated Phosphate Project Leadership and team on the ground in China |
3
R E P O R T T O S H A R E H O L D E R S
2005 was a year of change for China, for Chinese agriculture and for Spur.
The Chinese economy continued to grow, with GDP increasing by 9% as the government advanced opening of its markets to foreign investors, improved the integrity and functioning of its financial institutions and stock markets and cautiously initiated a more flexible exchange rate policy.
China’s 11th Five-Year Plan targets the imbalance between China’s urban and rural populations by focusing resources on the new socialist countryside. Education, health and the wealth of China’s over 800 million rural citizens will be emphasized with a view to a better balance between economic growth and environmental quality. A better educated, healthier and financially strong farmer is key to the sustainable growth of China’s agricultural sector.
The 11th Five Year Plan also identified the need to increase China’s grain production by 25% to 640 million tonnes to meet increased population levels and the trend to more meat and poultry in the Chinese diet. The national authorities recognize that higher crop yields can only be achieved by proper use of balanced fertilization together with increased knowledge at the farm level on the use of all agricultural inputs including fertilizers. Spur’s compound phosphate fertilizers are the best available products to achieve this balanced fertilization.
China is focusing on the sustainable development of its non-renewable natural resources such as phosphates. It wants to ensure an orderly market where only competent companies with proven track records are investing and growing.
As a result, the fundamentals for sustained growth of food production and fertilizer use in China are better than ever. China has the largest fertilizer market in the world with 42 million mt of use representing 25% of global demand. It has 4.0 billion mt of phosphate reserves, 25% of the world’s supply, but in the future demand will exceed supply because the rock quality is generally low. Spur is indeed fortunate to have the rights to two high quality phosphate mines in Hubei Province. Spur’s market, compound phosphate fertilizers called NPK’s, is a 12.0 million mt/yr market with 2.3 million mt imported in 2005 due to insufficient domestic production capacity and quality control issues with many domestic producers.
But the Chinese fertilizer market remains an undisciplined, emerging market based on centralized planning. The result is a phosphate mining and fertilizer industry that continues to operate inefficiently and below capacity. China needs high quality management leadership in this critical sector. The existence of so many State Owned Enterprises which compete on the basis of creating local employment rather than serving customers and investors creates many challenges but also opportunities for free market companies like Spur.
Chinese fertilizer production lacks economies of scale. China has over 400 companies mining phosphates producing 42 million mt each year but only five mine more than 1.0 million mt per annum. Recoveries are often less than 30%. In the USA eight companies mine 35 million mt each year. Over 400 companies manufacture NPK’s in China but the average productivity is less than 50% because of lack of raw materials, particularly phosphate rock.
China is a vast and complex country, and from an agricultural market viewpoint is more like the European Union than Canada or the USA. Foreign investors in particular must understand the subtleties of the local markets. In the five provinces (Guizhou, Yunnan, Hubei, Sichuan and Hunan) which have 87% of China’s phosphate reserves, NPK production is increasing by companies, like Spur, who want to integrate from raw materials to production of compound fertilizers. But a majority of China’s production of NPK’s is in the North East or the western regions and these facilities are reliant on imported phosphates. Their future survival is uncertain.
Fertilizer demand in 2005 was soft due to a combination of increased raw material prices, customer resistance to higher fertilizer prices, and inclement weather. The result was reduced margins for producers of commodity fertilizers. It was a year where disciplined leadership responsive to the realities of market demand made a difference.
Spur continued to develop its management and operational teams. Our NPK production facility, Yichang Spur Chemicals (YSC), learned how to block operate in the face of a 47% increase in the price of rock phosphates. While we improved our operational efficiency and set new daily and monthly production records, we produced only 33,000 mt of product and sold 29,000 mt. Running our plant in response to market demand rather than at its full capability allowed Spur to show its team how to make a modest gross profit in a market where many of our competitors lost money.
We made less progress than planned on the transfer of the mining licenses for the Dianziping and Shukongping deposits from our Joint Venture partner, YPCC, to our 78% controlled Yichang Maple Leaf Chemicals (YMC) joint venture. Spur
4
RIGHT: Zhai Jidong of Tianren and Rob Rennie at merger agreement signing in Beijing.
FAR RIGHT: Rob Rennie and Hubei Vice Govenor Lui in Wuhan. | | 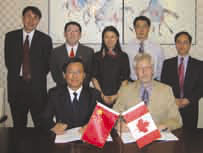 | |  |
fulfilled all of the requirements for the transfer but as a foreign investor had to submit to thorough and time-consuming reviews of all aspects of its business including engineering, environmental, foreign exchange controls and future investment commitments. Spur’s challenge is less the slowness of the process than the uncertainty as to what the process is and which department can make decisions. The only solution to these challenges is time and working closely on a daily basis with Chinese authorities.
A critical component of Spur’s strategy in China is to work in partnership with leading Chinese companies who know how to be successful in China. In June we announced our intent to acquire and merge four companies of Hubei Tianren with Spur to create a new Spur China. Much of 2005 was spent dealing with due diligence and pursuing government approvals for the transaction in an environment where the usual standards and transparency required in the North American stock market are not the norm. There was strong goodwill on Tianren’s part and in typical Chinese business fashion, Tianren seconded a new General Manager to YSC and full technical teams to Spur during this interim time period.
We now anticipate a staged acquisition to ensure that our merger is in full compliance with China’s requirements for WTO accession.
Spur successfully raised $C30 million in July and is now in a strong financial position to implement its announced strategy in China.
We have continued to build our team and thus our capability. Michael Kuta joined Spur as General Counsel and Corporate Secretary in August of 2005. Zhao Huitian of Tianren was appointed General Manager of YSC in November of 2005 and Joel Jeangrand came on board in December as a consultant and in March of 2006 was appointed Vice President of Corporate Development. Dong Dong Huang our VP of Government Relations stepped down from his position and from the Spur Board in January of 2006 and we thank him for his dedication to Spur. We are building in good business and operational processes and investing in our people
As we look towards 2006 we continue to believe in the opportunities in the fertilizer market in China, but where and when to invest is critical. We will only invest where Spur has a sustainable competitive advantage, when we are comfortable with the market demand, when we have all of the government permits and approvals and where we see a trend of continued growth and profitability.
Clearly, whether it is the mining license transfer or the Tianren merger, working in China requires a dedicated leadership team on the ground working with the government authorities. It also requires a largely unpredictable amount of time.
We believe the ultimate rewards for our efforts will be real and sustainable, and we want to thank our employees for their dedication and our investors and the Board for their continued support.
 |  |
| | |
| Rob Rennie | Steven G. Dean |
| CEO of Spur Ventures Inc. | Chairman |
A critical component of Spur’s strategy in China is to work in partnership with leading Chinese companies who know how to be successful in China.
5
B U S I N E S S S E G M E N T U P D A T E S
Yichang Spur Chemicals (YSC)
The Company’s NPK compounds fertilizer Joint Venture Company based in Yidu produced 33,442 mt of NPK’s in 2005, compared to 18,727 mt in 2004.The plant was shut down for 185 days for routine maintenance and to match inventory with slow demand. YSC manages its production by focusing on profitabily and rapidly responding to changes in demand.
Sales were $8,265,374, a 72% increase over the sales of $4,810,302 in 2004 (three quarters), with sales volume of 29,819 mt and 20,342 mt respectively. Gross profit was $99,953 versus ($50,258) in 2004 reflecting the benefits of YSC’s improved operating efficiencies despite raw materials price increases which exceeded 30%. EBITDA was ($536,391) for the year ended December 31, 2005, compared to ($312,660) in 2004.
The Company successfully completed the construction and commissioning of a 60,000 metric tonnes (mt) per annum phosphoric acid plant in March 2005 and started to supply phosphoric acid for its own NPK production
Mr. Zhao Huitian from Tianren was appointed General Manager of YSC in November of 2005 and initiated improvements which resulted in almost 5,000 mt of production in December of 2005.
Mid-year, Spur announced its intention to expand its NPK production capacity in stages to meet market demand. The first challenge was to identify a suitable site and YSC began negotiations with both Yidu City and Yichang City to identify the best site. Wuhuan Chemical Engineering Corporation began detailed designs for the announced MAP and Sulphuric Acid plants for each of the potential new project sites. The same company completed a preliminary design and analysis of the second phase for an integrated 600,000 mt/a phosphate fertilizer complex. This study includes the design of product mix, selection of chemical process, plant layout and land requirement, pollutant emissions and discharges, and capital cost estimates and economic analysis.
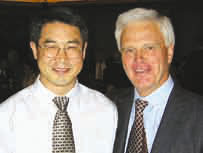
PHOTO: Retiring President Ian He and Vice Chairman of the Board John Van Brunt.
YSC manages its production by focusing on profitabily and rapidly responding to changes in demand.
6
RIGHT: Raymond James’ Eric Zaunsherb at mine site. FAR RIGHT: Spur President Ian He, and Ian Soutar of Pembroke Management, Montreal with Spur CEO Rob Rennie and James Soutar. | | 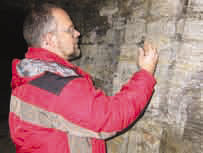 | |  |
Yichang Maple Leaf Chemicals (YMC)
YMC, Spur’s phosphate mining operation, is going through approval application in order to formally transfer the mining licenses for the Dianziping and Shukongping phosphate deposits from our joint venture partner, YPCC, to the YMC Joint Venture Company which the Company controls.
In March and August, the Company completed its required cash contributions of $13 million to YMC’s registered capital account. This fulfilled the Company’s portion of the first 15% capital requirement which initiated the government mining licenses transfer process as agreed in the original YMC Joint Venture contract.
The Northern China Design Institute has been engaged to finalize the staged mine development plans at the Dianziping and Shukongping sites. The Company is recruiting a senior management team for YMC and taking steps to ensure that we are ready to mine once the licenses have been formally transferred.
7
 T H E C H I N E S E A G R I C U L T U R E S E C T O R
(Source: FAO, USDA and YARA Websites)
Since 2000 China has been drawing on its stocks and, after a long period of de-stocking, became a net importer of grain in 2005. The consumption and production of grain have been stable over the past decade but there is a renewed attention given to this situation. China’s 11th 5-year plan (2006-2010) has identified a need to produce 500 million tonnes of grain by 2010 and 640 million tonnes by 2030 to feed its increasing population and to satisfy the increasing demand for more meat and poultry in the diet. This 25% increase in yield will be difficult to achieve without balanced fertilization and a strong technology transfer program to ensure that farmers know how to adopt the latest technology and use the best products on the farm.
Soybean consumption
While wheat and rice consumption have lost popularity, the consumption of soybeans has increased substantially. Soybean production, however, has remained stable. China has chosen to import the required balance.
High Value Crops
Given the competitiveness of its labour force and the limited land availability due to increased industrialization, China has rightly chosen to grow high value crops. Vegetables and fruits such as watermelons, cabbages, cucumbers or tomatoes have become very popular crops among farmers. This recent development will create a strong demand for high grade fertilizers such as the one produced by SPUR.
R E V I E W O F T H E C H I N E S E P H O S P H A T E F E R T I L I Z E R I N D U S T R Y
Fertilizer 101: Fertilizer Phosphate in Agriculture
Plants need three key nutrients for their development: nitrogen (N) phosphorus (P) and potassium (K). Phosphorus stimulates root development which allows plants to resist diseases, drought and cold temperatures. Phosphorus is also critical for photosynthesis, cell division, fruit and seed growth.
The Chinese Fertilizer Phosphate market
China is the world’s largest fertilizer market representing almost a third of the global demand in nitrogen, phosphate and potash (Fig. 1). China, Brazil and India are the markets with the greatest growth potential while North America is a mature market and fertilizer sales in the European Union are actually decreasing.
Rates of fertilizer phosphate application, particularly MAP, DAP and NPK’s have grown substantially (Fig. 2) while lower value phosphates such as SSP, Nitro Phosphates (NP) and Fused Magnesium Phosphate (FMP) have decreased significantly.
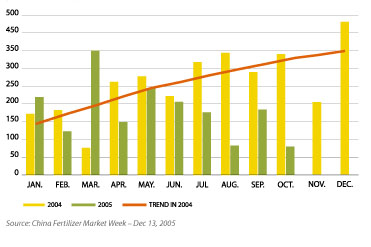
2005 was a challenging year for the phosphate fertilizer market in China. After the boom of 2003 and 2004, raw material prices increased but fertilizer prices did not keep up (Fig. 3), and much new capacity came on stream.
The Chinese Fertilizer industry
The Central government has a policy of food self-sufficiency and also desires to be self sufficient in all major crop nutrients. China is already self sufficient in nitrogen, is approaching self-sufficiency in phosphate but without new discoveries will never be self sufficient in potash which will continue to be imported from Canada and Russia.
Only 5 of China’s 29 provinces have significant phosphate resources (Fig. 4). 62% of all phosphate resources are in Guizhou, Yunnan and Hubei provinces.
FIG. 1: Global Fertilizer Markets (2004)
Million nutrient tonnes
| Nutrient | Global | China | China’s share |
| N | 90 | 24 | 27% |
| P2O5 | 37 | 11 | 29% |
| K2O | 27 | 6 | 24% |
| Total | 154 | 41 | |
Source: IFA, 2005; 10th Fertilizer China Guiyang Symposium 2005
FIG. 2: Growth of high analysis phosphate fertilizer capacity
(MILLION TONNES PRODUCT)
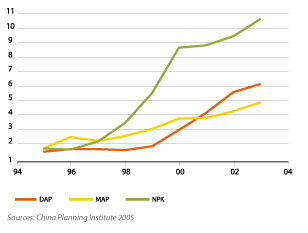
FIG. 3: Wholesale price of 15-15-15 NPK’s in South China
(RMB/mt)

9

| | 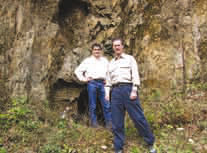 | | LEFT: Spur Chairman Steven Dean and Board member David Cohen at mine. FAR LEFT: Former Director Dong Dong Huang, CEO Robert Rennie, CFO Michael Chen. |
FIG. 4: Phosphate rock resources in China
| Province | Resources | % |
| | (billion tonnes) | |
| Guizhou | 3.20 | 24 |
| Yunnan | 2.94 | 22 |
| Hubei | 2.10 | 16 |
| Sichuan | 1.79 | 14 |
| Hunan | 1.66 | 13 |
| Others | 1.40 | 11 |
| Total Resource | 13.09 | 100 |
| Total Reserve | 3.90 | |
Source: China Fertilizer Market Week, Jan 17 2006; China National Resources Summary 2001FIG. 5: China’s phosphate reserves in a global context
| C O U N T R Y | Reserve | (%) |
| | (million tonnes) | |
| Morocco | 5,700 | 37% |
| C H I N A | 3,900 | 25% |
| South Africa | 1,500 | 10% |
| United States | 1,000 | 7% |
| Jordan | 900 | 6% |
| Brazil | 330 | 2% |
| Other countries | 1,570 | 10% |
| W O R L D T O T A L | 15,330 | 100% |
Source: US Geological Survey, 2001; Mineral Commodity Summaries, February 2000; 10th Fertilizer China Symposium, 2005, Proceedings of China Phos Sulf Conference May 2005FIG. 6: China Phosphate Rock Exports per month 2004 & 2005
(MILLION TONNES PRODUCT)
China has the world’s second largest reserves of phosphate rock (Fig. 5) with 3.9 billion tonnes.
China mines 41.9 million tonnes of rock phosphate each year, more than any other country (Fig. 7). Most of China’s 43 million tonnes of annual phosphate rock demand for 2004 was for fertilizers. This demand could not be met by the domestic supply. China also imported approximately 2.0 million tonnes of DAP and 2.3 million tonnes of NPK in 2005.
Clearly the supply and demand of rock phosphate for the fertilizer industry is not in balance. Despite shortage of supply, some provinces rich in phosphate reserves continue to export internationally but this trend has slowed during the second half of 2005 (Fig. 6).
The Chinese phosphate mining industry is highly fragmented (Fig. 8/9). Over 400 companies mined phosphates in 2004 but only five mined more than one million tons per year. By comparison, in the USA eight companies mined a total of 34 million tons of rock phosphate.
Although China has a very large theoretical production capacity of P2O5, the capacity utilization is low at 50 to 60% on average. The reasons are often lack of supply of rock phosphate coupled with the uncertainties of other inputs such as electricity. By contrast, the USA has nine companies that produce 12.2 million tonnes of P2O5 annually, compared to more than 400 in China that produce 12.5 million tonnes annually.
Challenges Facing our Industry
China needs to consolidate both its phosphate mining and its phosphate fertilizer producing industries to achieve economies of scale, production efficiency and thus profitability.
China’s 3.9 billion tonnes of rock phosphate reserves are not of uniform quality, and the high levels of manganese in much of the rock make it difficult to manufacture the high analysis phosphate fertilizers commonly used in the western world. As an example in China there is very little difference in nutrient content between MAP and DAP.
10
RIGHT: International Fertiliser Association President Wu Sihai and International Fertilizer
Association immediate past President John Van Brunt FAR RIGHT: Former Yichang Mayor, Zheng Guang Yu, Chairman Steven Dean and Vice Chairman Robert Atkinson at mine site. | | 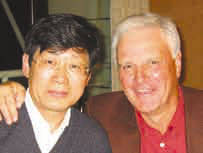 | |  |
In the future, increasing emphasis on balanced fertilization (the correct N:P:K:S ratios) will result in China efficiently managing its phosphate mining industry. Otherwise it will be forced to import phosphate fertilizers or rock phosphate. This possible trend to further imports should create a domestic market where prices are set based on “import parity.”
However, the biggest constraint to China attaining its goals of food and fertilizer self sufficiency will not be from the agronomic science but rather from conflicting government policies.
The central government is creating an orderly market where only large players with proven competency and capability can participate. Provincial governments, however, want big projects that give local employment with little consideration given to the needs of the customers and the investors.
Both governments want the limited non-renewable phosphate resources to be developed both economically and in an environmentally sound manner. The coal mining situation is a fine example of just how difficult this is to achieve.
Demand will continue to grow for rock phosphates. Demand for phosphate fertilizers is already tapering off but there is abundant opportunity within the phosphate fertilizer sector. As farmers understand the benefits of high analysis phosphates (MAP, DAP, NPK’s), sales of NP, FMP and SSP are decreasing rapidly. Thus although total fertilizer phosphate demand may grow only a few percent, NPK’s continue to grow at 10% each year and over two million tonnes of NPK’s were imported in 2005.
In conclusion, the Chinese phosphate industry, despite being very large, is highly fragmented with too many players, many of which are owned by the State. Individual facilities are small, lacking economies of scale. Far too few are able to integrate raw materials into fertilizer manufacturing.
FIG. 7: Phosphate rock mining countries
| Country | Rock | P2O5 | % |
| | (Million tonnes) | (Million tonnes) | |
| China (2004) | 41.86 | 12.56 | 27.51 |
| major mines | 24.47 | 7.34 | |
| small mines | 17.39 | 5.22 | |
| USA (2004) | 35.00 | 9.37 | 20.53 |
| Morocco (2004) | 26.00 | 6.96 | 15.25 |
| Russia | 10.53 | 4.04 | 8.85 |
| Tunisia | 8.11 | 2.43 | 5.32 |
| Other | 31.81 | 10.29 | 22.54 |
| Grand Total | 153.31 | 45.65 | 100.0 |
Source: IFA, May 2002, China Chemical Planning Institute 2005
FIG. 8: Phosphate mining in China
| Number of mining companies | 429 |
| Including: | Large scale (>1Mt/a) | 5 |
| | Medium (0.3-1.0Mt/a) | 13 |
| | Small scale (<0.3Mt/a) | 411 |
Source: China Chemical Mining Industry Association, 2004FIG. 9: Phosphate fertilizer industry in China
| Number of phosphate fertilizer companies | 431 |
| Including: | DAP producers | 26 |
| | MAP producers | 56 |
| | NPK producers | >80 |
Sources: 10th FertiChina Symposium Guiyang 2005, China Chemical Planning Institute, 200511
MANAGEMENT DISCUSSION & ANALYSIS| For the year ended December 31, 2005 | March 28, 2006
This Management’s Discussion and Analysis (“MD&A”) has been prepared as at March 28, 2006, and should be read in conjunction with the audited consolidated financial statements with accompanying notes of Spur Ventures Inc. (the “Company”) for the year ended December 31, 2005 which have been prepared in accordance with Canadian Generally Accepted Accounting Principles.
This MD&A contains certain statements that may be deemed to be “forward-looking statements” regarding the timing and content of upcoming programs. Although the Company believes the expectations expressed in such forward-looking statements are based on reasonable assumptions, such statements are not guarantees of future performance and actual results or developments may differ materially from those in the forward-looking statements. Factors that could cause actual results to differ materially from those in forward-looking statements include, but are not limited to, future prices of nitrogen, phosphate and potash, exploitation and exploration successes, continued availability of capital and financing, the exchange rates for Canadian, US and Chinese currencies, Chinese policies on fertilizer and agriculture, and general economic, market or business conditions. The Company disclaims any intention or obligation to update or revise any forward-looking information as a result of new information or future events.
All amounts are reported in Canadian dollars, unless otherwise stated. Additional information on the Company can be found in the filings with Canadian security commissions on SEDAR at www.sedar.com and in the Company’s Form 20-F with the United States Securities and Exchange Commission on EDGAR at www.sec.gov/edgar.
1. Overall Performance
Yichang Spur Chemicals (YSC)
The company continues to develop an integrated fertilizer business in planned stages. YSC has been able to adjust NPK (Nitrogen, Phosphate, Potassium) fertilizer production in response to market demand with the goal of retaining its key customer base while minimizing losses. In 2005, YSC’s production and sales volume were both near record highs in the plant’s six-year history. The Company successfully completed the construction and commissioning of a 60,000 metric tonnes (mt) per annum phosphoric acid plant in March 2005 and started to supply phosphoric acid for its own NPK production
Mr. Zhao Huitian from Tianren was appointed General Manager of YSC in November of 2005 and initiated improvements which resulted in almost 5,000 mt of production in December of 2005.
Yichang Maple Leaf Chemicals (YMC)
The Company is going through approval application in order to formally transfer the mining licenses for the Dianziping and Shukongping phosphate deposits from the joint venture partner, YPCC, to the YMC Joint Venture Company which the Company controls.
In March and August, the company completed its required cash contributions to YMC’s registered capital account to fulfill the company portion of the first 15% capital requirement which initiated the government mining licenses transfer process as provided in the original YMC Joint Venture contract.
Cash and Short Term Investments
The Company successfully completed a private placement of 17,142,858 units for gross proceeds of $30 million in July 2005. As of December 31, 2005, the Company had cash & cash equivalents and short term investments of $35.9 million, of which $24.7 million is held in Canadian banks. There is $10.6 million held in a YMC registered capital account in Canadian dollars in China. The Company has complete control over the YMC registered capital account.
2. Selected Annual Information
Selected annual information from the Company’s three most recently completed financial years is summarized as follows:
| | | 2005 | | | 2004* | | | 2003 | |
| Total revenues | $ | 8,265,374 | | $ | 4,810,302 | | $ | Nil | |
| Net income (loss) | | (3,332,038 | ) | | (2,425,755 | ) | | (1,310,054 | ) |
| Earnings (loss) per share | | (0.07 | ) | | (0.07 | ) | | (0.06 | ) |
| Diluted earnings (loss) per share | | (0.07 | ) | | (0.07 | ) | | (0.06 | ) |
| Total Assets | | 54,334,748 | | | 28,114,960 | | | 7,194,380 | |
| Total long-term liabilities | | Nil | | | Nil | | | Nil | |
| Cash dividends declared | | Nil | | | Nil | | | Nil | |
*All 2004 figures are the results of three quarters of YSC operation after the acquisition of Xinyuan in April 2004.
3. Results of Operations – Full Year
Yichang Spur Chemicals (YSC)
The Company’s NPK compounds fertilizer Joint Venture Company produced 33,442 mt of NPK’s in the year of 2005, compared to 18,727 mt in 2004 following the formation of the YSC Joint Venture Company with the acquisition of Xinyuan in April 2004. The plant was shut down for a total of 185 days for routine maintenance and to match inventory with slow demand. YSC manages its production by being a market driven company and rapidly responding to changes in demand.
Sales for year ended December 31, 2005 were $8,265,374, a 72% increase over the sales of $4,810,302 in 2004 (three quarters), with sales volume of 29,819 mt and 20,342 mt respectively. Cost of product sold reflected the fact that most raw material inputs costs have increased over 30% and rock phosphate increased 47% since the beginning of 2005. Gross profit was $99,953 versus ($50,258) in 2004 reflecting the benefits of YSC’s improved operating efficiencies despite raw materials price increases. EBITDA was ($536,391) for the year ended December 31, 2005, compared to ($312,660) in 2004.
The following table illustrates the operation results at YSC.
| | | Q1/2005 | | | Q2/2005 | | | Q3/2005 | | | Q4/2005 | | | Total 2005 | |
| Production Volume (mt) | | 5,571 | | | 9,486 | | | 11,961 | | | 6,424 | | | 33,442 | |
| Sales Volume (mt) | | 7,302 | | | 9,311 | | | 7,462 | | | 5,741 | | | 29,816 | |
| Net Sales (($)) | | 2,116,867 | | | 2,609,072 | | | 2,083,218 | | | 1,456,217 | | | 8,265,374 | |
| Cost of product (($)) | | 1,770,829 | | | 2,544,973 | | | 1,993,120 | | | 1,856,499 | | | 8,165,421 | |
| Total Gross Profit (($)) | | 346,038 | | | 64,099 | | | 90,098 | | | (400,282 | ) | | 99,953 | |
| Selling price/mt (($)) | | 290 | | | 280 | | | 279 | | | 254 | | | 277 | |
| Cost of Product/mt (($)) | | 318 | | | 268 | | | 167 | | | 289 | | | 244 | |
| | | | | | | | | | | | | | | | |
| | | Q1/2004 | | | Q2/2004 | | | Q3/2004 | | | Q4/2004 | | | Total 2004 | |
| Production Volume (mt) | | | | | 5,261 | | | 3,873 | | | 9,593 | | | 18,727 | |
| Sales Volume (mt) | | | | | 5,011 | | | 7,086 | | | 8,245 | | | 20,342 | |
| Net Sales ($) | | | | | 997,789 | | | 1,495,141 | | | 2,317,372 | | | 4,810,302 | |
| Cost of product ($) | | | | | 876,451 | | | 1,566,432 | | | 2,417,677 | | | 4,860,560 | |
| Total Gross Profit ($) | | | | | 121,338 | | | (71,291 | ) | | (100,305 | ) | | (50,258 | ) |
| Selling price/mt ($) | | | | | 199 | | | 211 | | | 281 | | | 236 | |
| Cost of Product/mt ($) | | | | | 167 | | | 404 | | | 252 | | | 260 | |
Yichang Maple Leaf Chemicals (YMC)
The mining licenses for the Dianziping and Shukongping deposits were issued by China’s Ministry of Land and Resources to the Company’s joint venture partner YPCC in February and October of 2004 respectively. The licenses were issued under the contractual condition that YPCC holds these licenses in escrow for the purpose of their equity contribution to the YMC joint venture. The Company is undertaking a transfer of these mining licenses to YMC to ensure that the formal title for the two deposits is in YMC’s name in order to obtain the full benefit of Chinese joint venture contractual law.
The increase in YMC costs reflected the stepped up efforts to work with various levels of Chinese government on the mining licenses transfer. The Northern China Design Institute has been engaged to finalize the staged mine development plans at the Dianziping and Shukongping sites. The Company is recruiting a senior management team for YMC and taking steps to ensure that we are ready to mine once the licenses have been formally transferred.
12
Spur Consolidated Results
Total expenses were $3,384,587 for the year ended December 31, 2005 versus $2,943,590 in 2004. This $440,997 increase was due to the engagement of a full time management team as the Company recognized the need for continuity in leadership on the ground in China. Selling expenses were $322,987 in 2005 compared to $134,127 in 2004 reflecting increased sales volume and additional efforts to promote sales in a more competitive NPK market. Professional fees increased to $275,806 in 2005 from $180,725 in 2004 mostly attributable to higher audit related fees as Spur established better internal controls, Sarbanes Oxley Act implementation preparation and quarterly financial reviews. The increases in expenses were partially offset by the decrease of $178,919 in consulting fees and $492,719 in stock based compensation. The short-term investments and Guaranteed Investment Certificates generated interest income in the year of 2005 increased to $438,209 versus $183,608 in 2004. EBITDA was ($2,487,365) for the year ended December 31, 2005, compared to ($1,977,590) in 2004. The 2005 Loss per Share remained at $0.07, unchanged from 2004.
The Company’s cash and cash equivalents significantly strengthened during the year of 2005 due to the private placement completed in July. The Inventory balance increased to $3,036,798 at the end of 2005 compared to $1,125,024 at the end of 2004 in anticipation of 2006 spring sales and also because of higher raw materials prices resulting in higher cost of goods sold. Accounts Receivable increased to $468,443 at the end 2005 from $188,415 in 2004. The Company granted credits to some longtime customers to promote sales and overcome intense competition in NPK market. The increase of $230,730 in Prepaid Expenses at the end of 2005 from the balance of $96,034 at the end of 2004 reflected the increased production activities.
Foreign Exchange Loss
The unrealized foreign exchange loss was $953,508 for the year ended December 31, 2005, compared to a foreign exchange gain of $82,908 for 2004. Included in the 2005 translation loss is an amount of $276,370 foreign translation loss from YMC by using temporal method which requires the gain or loss on translation to be charged to the statement of operation.
The Company’s functional currency is the Chinese Renminbis with most costs and revenues occurring in China but with some Canadian dollar costs in the Vancouver head office. However, the Company also holds significant amounts in US dollar denominated short term investments and Guarantee Investment Certificate (GIC) accounts ranging from one to three months. The Canadian dollar strengthened against the US dollar by 2.7% from the date of investment in US dollars to December 31, 2005
Foreign exchange losses or gains are dependent upon the Canadian dollar exchange rates in relationship with other currencies. It is anticipated that the Canadian exchange rates will be volatile over the coming quarters. This may result in foreign exchange fluctuations between gains or losses on a quarterly basis. The Company maintains a certain amount of cash resources in Renminbis in order to meet its obligations in China. The Company does not yet use derivatives to hedge against exposures to foreign currency arising from the Company’s balance sheet liabilities and therefore, the Company is exposed to future fluctuations in the Canadian / US dollar and Canadian dollar / Chinese Renminbi exchange rates.
4. Summary of Quarterly Results
| | | Qtr ended | | | Qtr ended | | | Qtr ended | | | Qtr ended | |
| | | Dec. 31, | | | Sep. 30, | | | Jun. 30, | | | Mar. 31, | |
| | | 2005 | | | 2005 | | | 2005 | | | 2005 | |
| Total revenues | | 1,456,217 | | | 2,083,218 | | | 2,609,072 | | | 2,116,867 | |
| Net income (loss) | | (752,396 | ) | | (1,333,483 | ) | | (883,393 | ) | | (362,767 | ) |
| Earnings (loss) per share | | (0.01 | ) | | (0.03 | ) | | (0.02 | ) | | (0.01 | ) |
| Diluted earnings (loss) per share | | (0.01 | ) | | (0.03 | ) | | (0.02 | ) | | (0.01 | ) |
| | | Qtr ended | | | Qtr ended | | | Qtr ended | | | Qtr ended | | | Qtr ended | |
| | | Dec. 31, 2004 | | | Sept. 30, 2004 | | | Jun. 30, 2004 | | | Mar. 30, 2004 | | | Dec. 31, 2003 | |
| | | | | | | | | | | | | | | | |
| Total revenues | | 2,317,372 | | | 1,495,141 | | | 997,789 | | | - | | | - | |
| Net income (loss) | | (869,733 | ) | | (986,142 | ) | | (299,849 | ) | | (270,031 | ) | | (980,665 | ) |
| Earnings (loss) per share | | (0.02 | ) | | (0.03 | ) | | (0.01 | ) | | (0.01 | ) | | (0.03 | ) |
| Diluted earnings (loss) per share | | (0.02 | ) | | (0.03 | ) | | (0.01 | ) | | (0.01 | ) | | (0.03 | ) |
Prior to the first quarter of 2004, some other income was recorded as revenues. These amounts have been reclassified from revenues to other income.
The Sales were down in the fourth quarter of 2005, compared to the fourth quarter of 2004, due to a softening NPK fertilizer market, particularly in the fourth quarter. The demand for NPK fertilizer was reduced by a combination of inclement weather and farmer resistance to higher fertilizer prices.
5. Liquidity and Capital Resources
The Company successfully completed a private placement of 17,142,858 units for gross proceeds of $30 million in July 2005. Each unit was priced at $1.75, and consisted of one share and one-half of one warrant to purchase an additional share for a period of two years at a price of $2.00. The Company paid a 6% commission on the proceeds of the private placement. The net proceeds are being used to fund the Company’s development projects in China and for general corporate purposes.
As of December 31, 2005, the Company maintained a balance of cash and cash equivalents of $29.1 million, of which $18.0 million is held in two major Canadian banks. There is $11.1 million held in YMC and YSC accounts with two major banks in China, of which $10.6 million is deposited in Canadian dollars and $0.5 is operation working capital in Chinese Renminbi. The Company has complete control over the disbursements from the YMC registered capital accounts. The Company also has US dollar denominated short-term investments of $6.7 million, which have more than 90 days maturity periods, with two major Canadian financial institutions.
The Company did not have any off-balance sheet arrangements as of the end of 2005.
6. Transactions with Related Parties
During the year ended December 30, 2005, some directors and officers of the company received consulting fees for the services rendered. A total of $236,489 was paid in 2005 to companies controlled by three directors and two officers (2004 - $335,654; 2003 - $282,754). A total of $236,489 was paid in 2005 to companies controlled by three directors and two officers (2004 - $335,654; 2003 - $282,754). Account payables to these companies for the consulting services were $11,334 at the end of 2005. Except the account receivable of RMB2,552,287 ($368,806) from YPCC, there was no other account receivables from the related party.
On November 22, 2004, the Company became aware that the Agricultural Bank of China (the “Bank”) had made a RMB7,400,000 ($1,069,302) working capital loan (the “Xinyuan Loan”) to Xinyuan Chemicals (“Xinyuan”) for the purchase of raw materials. Xinyuan made a loan of the same amount to YPCC (the Company’s joint venture partner) the next day, more than a year before the date of the Company’s investment in Xinyuan to create YSC. YPCC made a loan of RMB4,475,375 ($646,693) to YSC (the “YSC Loan”) in January 2004.
The Xinyuan loan was exclusively for YPCC’s use and until the end of 2004 YPCC had been repaying both the principal and interest. The Company received a formal letter from YPCC on November 26, 2004 guaranteeing that YPCC would not hold the Company accountable for this loan. YSC has neither benefited from this loan nor made any payment to the Bank with respect to this loan. The principle now stands at RMB 6,900,000 ($997,052) and is due.
The Company continues to work with the three parties toward a resolution. In the mean time, the Company has accounted for the debt to the Bank of RMB6,900,000 ($997,052) as a liability and has recorded a receivable in the same amount from YPCC. The Company also owes YPCC for advances in the amount of RMB 4,475,375 ($646,693), leaving a net exposure to YPCC of RMB2,424,625 ($350,359).
In addition, the Company owes the third YSC Joint Venture partner Yuanfeng $119,358 for the acquisition of additional land use right acquisition from Yuanfeng. The amount owed to Yuanfeng was $44,290 in 2004.
7. Fourth Quarter
Yichang Spur Chemicals (YSC)
YSC produced 6,424 mt of NPK’s in the quarter ended December 31, 2005, a decrease of 33 % over the fourth quarter 2004 (9,593mt) due exclusively to lower market demand. Plant availability was only 39 days as management responded to the changes in NPK demand and managed inventory levels by shutting down the plant for 53 days from October to mid-November after the fall season in northern China ended early. This resulted in a production rate of 156 mt per day. YSC had robust production of 4,930 mt in December
13
MANAGEMENT DISCUSSION & ANALYSIS| For the year ended December 31, 2005 | March 28, 2006
resulting in 6,191 mt of inventory on December 31, and is well positioned for the upcoming 2006 spring sales season.
Sales for the three months ended December, 2005 were $1,456,217 versus $2,317,372 in 2004, a 36% decrease. While 2004 was a strong year for the entire fertilizer industry, starting from the first quarter of 2005, an excess of imported phosphate fertilizers, coupled with inclement weather, softened market demand. Gross profit was ($400,282) in the quarter ended December 31, 2005 vs. ($100,305) in the fourth quarter 2004. The increase in gross loss was attributable to the combination of a reserve for inventory write-down of $300,114 in preparation of NPK price decrease and significant increase in most raw material prices. EBITDA was ($623,143) in the quarter ended December 31, 2005 compared to ($224,182) in the same period in 2004.
Spur Consolidated Results
Although the gross loss increased by $299,977 in the fourth quarter of 2005 compared to the same period in 2004, the net loss for the three months ended December 31, 2005 decreased by $117,338 to $752,395 due to the decrease in total expenses and the increase in interest income. During the three months ended December 31, 2005, total expenses decreased by $260,872 to $725,324 versus $986,196 of the fourth quarter of 2004. This is mainly attributable to the decrease in stock based compensation to $145,660 in the fourth quarter of 2005 compared to $444,552 of the same period 2004. The increase in director & officer insurance and bad debt reserves were offset by the reclassification of several management costs to mineral property, as those costs are related to pursuing the YMC mining license transfer. The interest income increased to $233,656 in the three months ended December 2005 from $85,338 for the same period in 2004.
8. Changes in Accounting Policies
Effective January 1, 2005, the Company adopted Accounting Guideline AcG-15, Consolidation of Variable Interest Entities, which establishes when a company should consolidate a variable interest entity in its financial statements. AcG-15 provides the definition of a variable interest entity to be consolidated if a company is at risk of absorbing the variable interest entity’s expected losses, or is entitled to receive a majority of the variable interest entity’s returns or both. The Company has determined that it has no variable interest entities.
Effective January 1, 2004, the Company adopted the requirements of the Canadian Institute of Chartered Accountants Standard 3870 which requires an expense to be recognized in the financial statements for all forms of employee stock-based compensation, including stock options. Previously, the Company did not record any compensation cost on the granting of stock options to employees and directors as the exercise price was equal to or greater than the market price at the date of the grants. Accordingly, the opening deficit was restated on a retroactive basis to show the effect of compensation expense associated with stock option grants to employees and directors from January 1, 2002 to December 31, 2003, which amounted to $1,405,432, and an increase of $94,600 to share capital and $1,310,832 to stock options.
9. Outstanding Share Data
As of March 28, 2006, the Company had the following shares, warrants and options outstanding:
| | Number | Exercise Price | Expiry Date |
| | | | |
| Common Shares | 58,090,520 | n/a | n/a |
| Stock Options | 700,000 | $0.90 | 19-Jun-06 |
| Stock Options | 2,000,000 | $0.60 | 6-May-08 |
| Stock Options | 635,000 | $1.20 | 19-Jun-08 |
| Stock Options | 1,650,000 | $1.50 | 23-Jul-09 |
| Stock Options | 200,000 | $1.50 | 12-Oct-09 |
| Stock Options | 500,000 | $1.80 | 1-Mar-10 |
| Stock Options | 200,000 | $1.50 | 16-Sep-10 |
| Stock Options | 200,000 | $1.50 | 14-Mar-11 |
| Warrants | 5,091,666 | $1.50 | 23-Jun-06 |
| Agent’s Warrants | 330,000 | $1.50 | 23-Jun-06 |
| Warrants | 8,571,429 | $2.00 | 28-Jul-07 |
| TOTAL | 78,168,615 | | |
10. Proposed Tianren Acquisition
On June 29, 2005, the Company entered into an agreement to acquire the fertilizer related assets of Hebei Tianren Chemical Corporation (“Tianren”), a Chinese holding company, and to merge the management teams and assets of both companies.
Assets to be acquired include:
| 1. | A 51% interest in Xinjiang Tianren Chemicals Ltd. (“Xinjiang”) which has a 100,000 tonne per annum (“tpa”) compound NPK plant in Xinjiang Uigur Autonomous Region. |
| | |
| 2. | A 75% interest in Tianding Chemical Company (“Tianding”) which has a 100,000 tpa compound NPK plant in Qinhuangdao, Hebei Province. Tianding also has one of the largest fertilizer bagging facilities in China with current production under contract of over 28 million bags per annum for Tianren and other large fertilizer producers with long-term stable distribution contracts. The bagging plant generates a positive EBITDA and is a key part of the logistics of distributing fertilizers within the country. |
| | |
| 3. | An 80% direct interest in Tianren Agriculture Franchise Company (“TAFC”), a large fertilizer marketing company based in Qinhuangdao, Hebei Province. In addition the Company will acquire a further 15% indirect interest through Tianding’s ownership of TAFC. |
| | |
| 4. | A 60% interest in Hubei Yichang Tianlong Industry Company, a raw materials sourcing and fertilizer trading company based in Yichang, Hubei Province where the Company’s current facilities are also located. |
The Company will acquire these assets in consideration for the issue to Tianren of approximately 15.5 million shares of the Company. These shares will be subject to an escrow period of 24 months and voting rights for those shares which at any one time exceed 19.9% of the issued shares of the Company will be restricted.
The transaction was negotiated at arm’s length and is subject to due diligence, TSX Venture Exchange and all other regulatory approvals, and standard closing conditions.
The Company substantially completed the due diligence late in the fourth quarter and is now negotiating with Tianren on the final agreement terms and partnering with Hebei to work with the Chinese authorities on the approval processes.
11. Outlook
Based on the strong long-term fundamentals of agricultural sector in China, the Company is continuing its mining and NPK expansion plans in 2006.
YSC is investing $250,000 as sustaining capital to ensure a consistently high level of product quality and to ensure maximum levels of production. The company will also complete its ERP implementation for a cost of $52,000. Planned capital expenditures on the mine development and NPK engineering will total approximately $300,000.
12. Disclosure Controls and Procedures
During the year ended December 31, 2005, the Company’s General Counsel and Corporate Secretary completed an evaluation of the effectiveness of the Company’s existing disclosure controls and procedures, undertook extensive research and made recommendations to the Company’s CEO and Board of Directors. Based on those recommendations, a draft corporate disclosure policy was presented to the Company’s board and adopted in late December 2005.
With the new disclosure policy in place, management is reasonably confident that material information relating to the Company, including its consolidated subsidiaries, will be made known to senior management in a timely manner, and that the Company’s disclosure controls and procedures will be effective not only with respect to the Company’s annual filing requirements but on an ongoing basis.
14
13. Risk Factors
The Company’s business is in China, which despite recent government policy changes carries risk for foreign owned operations.
China has an evolving legal structure. Many laws and regulations dealing with economic matters in general, and foreign investment in particular, have been promulgated, including changes to the Constitution of China to authorize foreign investment and to guarantee “the lawful rights and interests” of foreign investors in China. Nevertheless, China does not have a comprehensive system of laws, and the legal and judicial systems in China in respect of commercial laws are rudimentary. In addition, enforcement of existing laws may be uncertain and sporadic, and may be subject to domestic politics.
China is an emerging economy.Although the Chinese economy has experienced significant growth in the recent past, such growth has been uneven among various sectors of the economy and geographic regions. The central government and even provincial and municipal governments continue to play a significant role in the planning of the economy, not always in a coordinated fashion.
Investment in China can be affected by significant political, economic and social uncertainties. Any change in laws and policies by the Chinese government could affect the Company’s investment in China. Circumstances such as a change in leadership, social or political disruption may benefit or limit the Chinese government’s abilities to pursue such policies.
Need to Obtain Permits and Licenses. Although China is progressing towards a market-oriented economy, it is still a centrally planned economy. The operations of the Company require government review, licenses and permits from various government agencies.
Chinese Costs. There continues to be “made in China” pricing for raw materials, minerals and fertilizers which differs from international prices. The continued rapid growth in the Chinese economy is affecting both fertilizer input prices and international freight rates for imports.
Additional risk factors can be found in the Company’s Form 20-F, and filed with Canadian security commissions on SEDAR at www.sedar.com and with the United States Securities and Exchange Commission at www.sec.gov/edgar.
15
Management’s Responsibility for Financial Reporting
The accompanying consolidated financial statements of the company have been prepared by management in accordance with Canadian generally accepted accounting principles and include a summary prepared by management reconciling significant differences between Canadian and United States generally accepted accounting principles as they affect these financial statements. The financial statements contain estimates based on management’s judgement. Management maintains an appropriate system of internal controls to provide reasonable assurance that transactions are authorized, assets safeguarded, and proper records maintained.
The Audit Committee of the Board of Directors has met with the company’s independent auditors to review the scope and results of the annual audit and to review the consolidated financial statements and related financial reporting matters prior to submitting the consolidated financial statements to the Board for approval.
The company’s independent auditors, PricewaterhouseCoopers LLP, are appointed by the shareholders to conduct an audit of the annual financial statements, and their report follows.
 |  |
| Robert J. Rennie | (Michael) Gong Chen |
| Chief Executive Officer | Chief Financial Officer |
| | |
| March 17, 2006 | |
Independent Auditors’ Report
To the Shareholders of Spur Ventures Inc.
We have audited the consolidated balance sheets of Spur Ventures Inc. as at December 31, 2005 and 2004 and the consolidated statements of operations and deficit and cash flows for each of the three years in the period ended December 31, 2005. These financial statements are the responsibility of the company’s management. Our responsibility is to express an opinion on these financial statements based on our audits.
We conducted our audits in accordance with Canadian generally accepted auditing standards and the standards of the Public Company Accounting Oversight Board (United States). Those standards require that we plan and perform an audit to obtain reasonable assurance whether the financial statements are free of material misstatement. An audit includes examining, on a test basis, evidence supporting the amounts and disclosures in the financial statements. An audit also includes assessing the accounting principles used and significant estimates made by management, as well as evaluating the overall financial statement presentation.
In our opinion, these consolidated financial statements present fairly, in all material respects, the financial position of the company as at December 31, 2005 and 2004 and the results of its operations and its cash flows for each of the three years in the period ended December 31, 2005 in accordance with Canadian generally accepted accounting principles.
Comments by Auditors for U.S. Readers on Canada-U.S. Reporting Difference
In the United States, reporting standards for auditors require the addition of an explanatory paragraph (following the opinion paragraph) when there is a change in accounting principles that has a material effect on the comparability of the company’s financial statements, such as the change described in note 2 to the financial statements. Our report to the shareholders dated March 17, 2006 is expressed in accordance with Canadian reporting standards which do require a reference to such a change in accounting principles in the auditor’s report when the change is properly accounted for and adequately disclosed in the financial statements.

Chartered Accountants
Vancouver, British Columbia
March 17, 2006
16
CONSOLIDATED BALANCE SHEETS| As at December 31, 2005 and 2004 | Expressed in Canadian dollars
| | | 2005 | | | 2004 | |
| | | $ | | | $ | |
| Assets | | | | | | |
| Current assets | | | | | | |
| Cash and cash equivalents (note3) | | 29,133,624 | | | 9,484,991 | |
| Short-term investments (note 4) | | 6,724,459 | | | 5,510,500 | |
| Accounts receivable | | 468,443 | | | 188,415 | |
| Inventory (note 5) | | 3,036,798 | | | 1,125,024 | |
| Prepaid expenses | | 326,764 | | | 96,034 | |
| Due from YPCC (note 11) | | 368,806 | | | 371,103 | |
| | | | | | | |
| | | 40,058,894 | | | 16,776,067 | |
| Property, plant and equipment (note 6) | | 9,996,868 | | | 8,438,916 | |
| Land use rights - net (note 7) | | 806,318 | | | 482,639 | |
| Mineral properties (note 8) | | 2,981,975 | | | 2,417,338 | |
| Other assets (note 9) | | 490,693 | | | - | |
| | | 54,334,748 | | | 28,114,960 | |
| | | | | | | |
| Liabilities | | | | | | |
| Current liabilities | | | | | | |
| Accounts payable and accrued liabilities | | 2,456,221 | | | 1,181,390 | |
| Customer deposits | | 163,182 | | | 494,632 | |
| Other payable | | 319,004 | | | 273,153 | |
| Bank loans (note 12) | | 3,106,757 | | | 3,853,100 | |
| | | 6,045,164 | | | 5,802,275 | |
| Minority interest | | 503,203 | | | 971,098 | |
| | | | | | | |
| Shareholders’ Equity | | | | | | |
| Capital stock (note 13(b)) | | | | | | |
| Authorized | | | | | | |
| Unlimited common shares without par value | | | | | | |
| Unlimited number preferred shares without par value | | | | | | |
| Issued | | | | | | |
| 58,090,520 common shares (2004 - 39,889,328) | | 56,513,439 | | | 27,550,651 | |
| Stock options and warrants (note 13(c) and (d)) | | 3,463,750 | | | 2,763,003 | |
| Cumulative translation adjustment | | (294,890 | ) | | (408,187 | ) |
| Deficit | | (11,895,918 | ) | | (8,563,880 | ) |
| | | 47,786,381 | | | 21,341,587 | |
| | | 54,334,748 | | | 28,114,960 | |
Nature of operations (note 1)
Commitments (note 19)
Subsequent events (note 20)
Approved by the Board of Directors
 | | |
| Robert Atkinson, Director | Robert J. Rennie, Director | |
The accompanying notes are an integral part of these consolidated financial statements.
17
CONSOLIDATED STATEMENTS OF OPERATIONS AND DEFICIT| For the years ended December 31, 2005, 2004 and 2003 | Expressed in Canadian dollars
| | | 2005 | | | 2004 | | | 2003 | |
| | | $ | | | $ | | | $ | |
| Sales | | 8,265,374 | | | 4,810,302 | | | - | |
| Cost of sales | | 8,165,421 | | | 4,860,560 | | | - | |
| | | 99,953 | | | (50,258 | ) | | - | |
| | | | | | | | | | |
| Expenses | | | | | | | | | |
| Consulting fees | | 176,193 | | | 355,112 | | | 255,243 | |
| Depreciation and amortization on administration | | 129,190 | | | 58,027 | | | - | |
| Interest | | 210,543 | | | 191,300 | | | 997 | |
| Management fees | | - | | | - | | | 27,833 | |
| Office and miscellaneous | | 492,868 | | | 236,827 | | | 59,812 | |
| Printing and mailing | | 50,404 | | | 31,785 | | | 13,582 | |
| Professional fees | | 275,806 | | | 180,725 | | | 123,361 | |
| Rent | | 101,807 | | | 49,317 | | | 31,009 | |
| Repairs and maintenance | | 52,757 | | | 18,134 | | | - | |
| Selling expenses | | 322,987 | | | 134,127 | | | - | |
| Stock-based compensation expenses | | 764,321 | | | 1,257,040 | | | - | |
| Transfer agent and filing fees | | 29,568 | | | 38,991 | | | 21,501 | |
| Travel, advertising and promotion | | 290,788 | | | 227,910 | | | 68,190 | |
| Wages and benefits | | 487,355 | | | 164,295 | | | 3,235 | |
| Writedown of mineral properties | | - | | | - | | | 760,490 | |
| Writedown of marketable securities | | - | | | - | | | 6,000 | |
| | | 3,384,587 | | | 2,943,590 | | | 1,371,253 | |
| Operating loss | | (3,284,634 | ) | | (2,993,848 | ) | | (1,371,253 | ) |
| | | | | | | | | | |
| Other income and expense | | | | | | | | | |
| Gain on disposal of marketable securities | | - | | | 2,333 | | | 10,340 | |
| Interest income | | 438,209 | | | 183,608 | | | 38,845 | |
| Investment income | | - | | | 825 | | | 10,867 | |
| Other income | | - | | | 90,661 | | | - | |
| Foreign exchange (loss) gain | | (953,508 | ) | | 82,908 | | | 1,147 | |
| | | (515,299 | ) | | 360,335 | | | 61,199 | |
| | | | | | | | | | |
| Loss before minority interest | | (3,799,933 | ) | | (2,633,513 | ) | | (1,310,054 | ) |
| Minority interest | | 467,895 | | | 207,758 | | | - | |
| Loss for the year | | (3,332,038 | ) | | (2,425,755 | ) | | (1,310,054 | ) |
| | | | | | | | | | |
| Deficit - Beginning of year | | | | | | | | | |
| As previously reported | | (8,563,880 | ) | | (4,732,692 | ) | | (3,422,638 | ) |
| Stock-based compensation | | - | | | (1,405,433 | ) | | - | |
| As restated | | (8,563,880 | ) | | (6,138,125 | ) | | (3,422,638 | ) |
| Deficit - End of year | | (11,895,918 | ) | | (8,563,880 | ) | | (4,732,692 | ) |
| Basic and diluted loss per common share | | (0.07 | ) | | (0.07 | ) | | (0.06 | ) |
| Weighted average number of common shares outstanding | | 47,857,350 | | | 34,667,716 | | | 22,265,095 | |
The accompanying notes are an integral part of these consolidated financial statements.
18
CONSOLIDATED STATEMENTS OF CASH FLOWS| For the years ended December 31, 2005, 2004 and 2003 | Expressed in Canadian dollars
| | | 2005 | | | 2004 | | | 2003 | |
| | | $ | | | $ | | | $ | |
| Cash flows from operating activities | | | | | | | | | |
| Loss for the year | | (3,332,038 | ) | | (2,425,755 | ) | | (1,310,054 | ) |
| Items not affecting cash | | | | | | | | | |
| Depreciation and amortization | | 634,130 | | | 256,865 | | | 5,178 | |
| Writedown of mineral properties | | - | | | - | | | 760,490 | |
| Stock-based compensation | | 764,321 | | | 1,257,040 | | | 21,445 | |
| Unrealized foreign exchange (gain) loss | | 953,508 | | | (82,908 | ) | | (1,147 | ) |
| Loss on the disposal of fixed assets | | 17,748 | | | 12,806 | | | 9,082 | |
| Gain of marketable securities | | - | | | (2,333 | ) | | (4,340 | ) |
| Minority interest | | (467,895 | ) | | 971,098 | | | - | |
| Other operating | | 27,334 | | | (1,149,729 | ) | | (7,935 | ) |
| | | | | | | | | | |
| | | (1,402,892 | ) | | (1,162,916 | ) | | (527,281 | ) |
| Changes in non-cash working capital | | | | | | | | | |
| Accounts receivable | | (280,028 | ) | | 150,861 | | | (37,140 | ) |
| Inventory | | (1,911,774 | ) | | (293,339 | ) | | - | |
| Prepaid expenses | | (230,730 | ) | | 383,542 | | | - | |
| Accounts payable and accrued liabilities | | 1,274,831 | | | 162,993 | | | (16,590 | ) |
| Customer deposits | | (331,450 | ) | | 482,639 | | | - | |
| | | (2,882,043 | ) | | (276,220 | ) | | (581,011 | ) |
| | | | | | | | | | |
| Cash flows from investing activities | | | | | | | | | |
| Capital expenditures | | (3,185,677 | ) | | (4,507,363 | ) | | (75,623 | ) |
| Acquisition of other assets | | (491,215 | ) | | (572,255 | ) | | - | |
| Purchase of marketable securities/short-term investments - net of proceeds | | (1,213,959 | ) | | (5,409,667 | ) | | 840 | |
| | | (4,890,851 | ) | | (10,489,285 | ) | | (74,783 | ) |
| | | | | | | | | | |
| Cash flows from financing activities | | | | | | | | | |
| Issuance of shares for cash - net of issue costs | | 28,850,554 | | | 15,784,724 | | | 5,635,456 | |
| Bank indebtedness repayment | | (744,000 | ) | | (130,860 | ) | | - | |
| | | 28,106,554 | | | 15,653,864 | | | 5,635,456 | |
| Effect of exchange rate changes | | (685,027 | ) | | (368,939 | ) | | - | |
| Increase in cash and cash equivalents | | 19,648,633 | | | 4,519,420 | | | 4,979,662 | |
| Cash and cash equivalents (bank overdraft) - Beginning of year | | 9,484,991 | | | 4,965,571 | | | (14,091 | ) |
| Cash and cash equivalents - End of year | | 29,133,624 | | | 9,484,991 | | | 4,965,571 | |
| | | | | | | | | | |
| Supplemental cash flow disclosure | | | | | | | | | |
| Interest received | | 371,050 | | | 157,778 | | | 38,845 | |
| Interest paid | | (171,577 | ) | | (161,724 | ) | | (997 | ) |
19
NOTES TO CONSOLIDATED FINANCIAL STATEMENTS| December 31, 2005, 2004 and 2003 | Expressed in Canadian dollars
1. Nature of operations
Spur Ventures Inc. (the company) is developing a fully integrated fertilizer business in the People’s Republic of China (China). The recoverability of the amounts shown as mineral properties is dependent upon the existence of economically recoverable reserves, the ability of the company to obtain the necessary financing to complete the development of the properties, and future profitable production or proceeds from the sale of fertilizer products.
Management acknowledges that for the Yichang Phosphate Project to be successful it will require significant equity and/or debt financing. Management has successfully raised financing in the past for the early stages of this project; however, there is no assurance that the company will be successful in raising this financing in the future. Management considers that the company has sufficient funding to meet its obligations and maintain administrative and operational expenditures for at least the next 12 months.
In addition, the company has entered into agreements securing the title of the mineral properties, by forming a 78.72% controlled Joint Venture Company, Yichang Maple Leaf Chemicals Ltd. (YMC), with Hubei Yichang Phosphorous Chemical Co. Ltd. (YPCC) in December 2003 to undertake the development of the phosphate mines and to build compound phosphate fertilizer production facilities. YMC has not yet commenced active operations. The titles to the two primary mining properties are legally in the possession of our Joint Venture partner, YPCC, and are in the process of being formally transferred to YMC. Although these arrangements are in accordance with industry standards for the stage of development of such properties, these procedures do not guarantee the company’s title. Property title may also be subject to unregistered prior agreements and regulatory requirements.
To accelerate the production of compound fertilizers, the company acquired Xinyuan Chemicals Ltd. in 2004 and formed a 72.18% controlled Joint Venture Company called Yichang Spur Chemicals Ltd. (YSC), which owns a 100,000 tonnes per annum (tpa) NPK (Nitrogen, Phosphate, Potassium), The other two minority partners are YPCC which owns 16.69% and Yichang Yuanfeng Chemical (Yuanfeng) which owns 11.13%.
2. Significant Accounting Policies
Principles of consolidation and preparation of financial statements
These consolidated financial statements are prepared in accordance with Canadian generally accepted accounting principles (GAAP) and differ in certain material respects from the requirements of United States GAAP, as disclosed in note 17).
These consolidated financial statements include the accounts of the company, its two sino-foreign Joint Venture companies, YSC and YMC, which are controlled by the company, and its wholly owned subsidiaries, Spur Chemicals (BVI) Inc. and International Phosphate Mining Corporation (International Phosphate). International Phosphate was incorporated to carry out mineral exploration and development programs in China. All significant intercompany transactions and accounts have been eliminated. Certain comparative figures have been reclassified to conform to the current period’s presentation.
Use of estimates
The preparation of financial statements in conformity with generally accepted accounting principles requires management to make estimates and assumptions that affect the reported amounts of assets and liabilities and disclosure of contingent liabilities at the date of the financial statements, and the reported amounts of revenues and expenditures during the reporting period. Items subject to significant management estimates include the amounts recorded for stock-based compensation and the assessment of recoverable values. Actual results could differ from those reported.
Cash and cash equivalents
Cash and cash equivalents consist of cash and short-term deposits maturing within ninety days of the original date of acquisition and are stated at cost, which approximates fair value. To limit its exposure, the company deposits its funds with large financial institutions in either US dollars or Canadian dollars.
Marketable securities & Short Term Investments
Marketable securities are carried at the lower of cost and market value. Short term investments with an original maturity of greater than 90 days and less than 1 year are stated at cost, which approximates fair value.
Inventory
Inventory, consisting primarily of fertilizers and raw materials, is valued at the lower of cost and net realizable value. Net realizable value represents the estimated selling price in the ordinary course of business less the estimated costs of completion and the estimated costs necessary to make the sale. Cost is calculated using the weighted average method comprising all costs of purchases, costs of conversion and other costs incurred, including overhead allocation, in bringing the inventories to their present location and condition.
Property, plant and equipment
Property, plant and equipment assets are recorded at cost less accumulated depreciation. Depreciation is computed using the straight-line method at the following rates calculated to depreciate the cost of the assets less their residual values over their estimated useful lives:
| Building | 5.00% |
| Machinery and equipment | 8.33% - 10.00% |
| Motor vehicle | 20.00% |
| Office equipment and furniture | 20.00% |
| Computer equipment | 33.33% |
| Leasehold improvement | 50% |
Land use right
The land use right is for 500 years. It is amortized on a straight-line basis over the initial term of the YSC business license of 30 years.
Impairment of long-lived assets
Management of the company regularly reviews the net carrying value of each long-lived asset. Where information is available and conditions suggest impairment, estimated future net cash flows are calculated using estimated future prices, proven and probable reserves, selling prices for fertilizer products, and operating, capital and reclamation costs on an undiscounted basis. Reductions in the carrying value of long-lived assets would be recorded to the extent the net book value of the related assets exceeds the estimated future cash flows.
Where estimates of future net cash flows are not available and where other conditions suggest impairment, management assesses if the carrying value can be recovered.
Management’s estimates of mineral prices, recoverable proven and probable reserves, selling prices for fertilizer products, and operating, capital and reclamation costs are subject to certain risks and uncertainties which may affect the recoverability of long-lived assets. Although management has made its best estimate of these factors, it is possible that changes could occur in the near term, which could adversely affect management’s estimate of the net cash flow to be generated from its assets.
Mineral properties
The company records its interest in mineral properties at cost. Exploration and development expenditures relating to properties with mineralization are deferred and will be amortized against future production following commencement of commercial production, or written off if the properties are sold, allowed to lapse, abandoned or if impairment is evident.
The acquisition of title to mineral properties is a detailed and time-consuming process. The titles of the mining properties have been issued to our Joint Venture Company partner, YPCC, for the exclusive use of YPCC’s equity contribution to the YMC Joint Venture. In Canada, our sino-foreign joint venture agreement with YPCC would be sufficient protection to proceed with mining but in China, for greater certainty, we are ensuring the formal transfer of the titles from YPCC to the YMC joint venture. This is a time-consuming process required only for foreign investors in China.
Asset retirement obligations
The accounting for asset retirement obligation encompasses the accounting for legal obligation associated with the retirement of a tangible long-lived asset that results from the acquisition, construction or development and/or the normal operation of a long-lived asset. The retirement of a long-lived asset is its other than temporary removal from service, including its sale, abandonment, recycling or disposal in some other manner.
According to current Chinese environmental regulations and contracts of the company, there is no obligation for the company to dismantle and remove plant and equipment or to remediate sites upon the cessation of operations. The company pays an annual environmental fee to the local government as the cost of operating a chemical site. This fee is calculated as a percentage of the annual revenues and is expensed as incurred. Future changes to Chinese environmental regulation may have a material impact on the assessment of asset retirement obligations.
Loss per common share
The basic loss per share is computed by dividing the net loss by the weighted average number of common shares outstanding during the year. The diluted loss per share reflects the potential dilution of common share equivalents, such as outstanding stock options and share purchase warrants, in the weighted average number of common shares outstanding during the year, if dilutive. For this purpose, the “treasury stock method” is used whereby the assumed proceeds upon the exercise of stock options and warrants are used to purchase common shares at the average market price during the year.
20
Income taxes
The company follows the asset and liability method for accounting for income taxes. Under this method, future income tax assets and liabilities are determined based on the differences between the tax basis of assets and liabilities and the amounts reported in the financial statements. The future tax assets or liabilities are calculated using the tax rates for the periods in which the differences are expected to be settled. Future tax assets are recognized to the extent that they are considered more likely than not to be realized.
Revenue recognition
The company recognizes revenues to external customers when the product is shipped and title passes along with the risks and rewards of ownership, provided collection is reasonably assured. Transportation costs are recovered from the customer through product pricing.
Foreign currency translations
The consolidated financial statements are presented in Canadian dollars (CAD) and the functional currency of YSC and YMC is Chinese Yuan Renminbi (RMB). YSC is considered a self-sustaining operation and is translated into Canadian dollars using current rate method. Under this method, assets and liabilities are translated at period-end exchange rates and items included in the statements of operations and deficit and cash flows are translated at the rates in effect at the time of the transaction. The gain or loss on translation is charged to cumulative translation adjustment in shareholders’ equity.
YMC is considered an integrated operation and is translated into Canadian dollars using the temporal method. Under this method, monetary assets and liabilities are translated at year-end exchange rates and items included on the statements of operations and cash flows are translated at rates in effect at the time of the transaction. Non-monetary assets and liabilities are translated at historical rates. The gain or loss on translation is charged to the statement of operations.
Financial instruments
The carrying values of cash and cash equivalents, short-term investments, accounts receivable, and accounts payable and accrued liabilities approximate their fair values due to the short periods to maturity. Bank loans are carried at current value, as discussed in notes 11 and 12.
Stock-based compensation
Effective January 1, 2004, the company adopted the new requirements of the Canadian Institute of Chartered Accountants (CICA) Standard 3870, which requires an expense to be recognized in the financial statements for all forms of employee stock-based compensation. Previously, the company did not record any compensation cost on the granting of stock options to employees and directors as the exercise price was equal to or greater than the market price at the date of the grants.
Accordingly, the opening deficit for 2004 was restated on a retroactive basis to show the effect of compensation expense associated with stock option grants to employees and directors from January 1, 2002 to December 31, 2003, which amounted to $1,405,433, and an increase of $94,600 to share capital and $1,310,833 to stock options.
Variable Interest Entities
Effective January 1, 2005, the company adopted Accounting Guideline AcG-15, Consolidation of Variable Interest Entities, which establishes when a company should consolidate a variable interest entity in its financial statements. AcG-15 provides the definition of a variable interest entity to be consolidated if a company is at risk of absorbing the variable interest entity’s expected losses, or is entitled to receive a majority of the variable interest entity’s returns or both. The company has determined that it has no variable interest entities.
3. Cash and cash equivalents
Cash and cash equivalents of $29,133,624 include US Treasury Bills and Guaranteed Investment Certificates (GIC’s) with major Canadian financial institutions. Included in cash balances is a balance of approximately $11,105,852 held in accounts in the Chinese subsidiaries, the repatriation to Canada of which is subject to certain restrictions.
4. Short-term investments
Short-term investments of $6,724,459 consist of GIC’s and US Treasury Bills, with more than 90 days maturity periods.
5. Inventory
| | | 2005 | | | 2004 | |
| | | $ | | | $ | |
| Raw materials | | 1,046,689 | | | 421,922 | |
| Finished goods | | 1,865,614 | | | 613,753 | |
| Other consumables | | 124,495 | | | 89,349 | |
| | | 3,036,798 | | | 1,125,024 | |
In the last quarter of 2005, the company recorded $300,114 in Cost of Sales for an inventory write-down due to the decrease in NPK fertilizer price.
6. Property, plant and equipment
| | | | | | | | | 2005 | |
| | | | | | Accumulated | | | | |
| | | Cost | | | depreciation | | | Net | |
| | | $ | | | $ | | | $ | |
| Building | | 3,933,238 | | | 220,312 | | | 3,712,926 | |
| Construction in progress | | 583,654 | | | - | | | 583,654 | |
| Machinery and equipment | | 6,136,133 | | | 639,524 | | | 5,496,609 | |
| Motor vehicle | | 120,298 | | | 27,579 | | | 92,719 | |
| Office equipment and furniture | | 105,923 | | | 30,802 | | | 75,121 | |
| Leasehold improvement | | 37,725 | | | 1,886 | | | 35,839 | |
| | | 10,916,971 | | | 920,103 | | | 9,996,868 | |
| | | | | | | | | | |
| | | | | | | | | 2004 | |
| | | | | | Accumulated | | | | |
| | | Cost | | | depreciation | | | Net | |
| | | $ | | | $ | | | $ | |
| Building | | 1,657,698 | | | 60,073 | | | 1,597,625 | |
| Construction in progress | | 4,435,561 | | | - | | | 4,435,561 | |
| Machinery and equipment | | 2,487,541 | | | 171,182 | | | 2,316,359 | |
| Motor vehicle | | 43,709 | | | 6,151 | | | 37,558 | |
| Office equipment and furniture | | 56,849 | | | 11,668 | | | 45,181 | |
| Leasehold improvement | | 19,898 | | | 13,266 | | | 6,632 | |
| | | 8,701,256 | | | 262,340 | | | 8,438,916 | |
7. Land use rights
| | | | | | | | | 2005 | |
| | | | | | Accumulated | | | | |
| | | Cost | | | amortization | | | Net | |
| | | $ | | | $ | | | $ | |
| Land use rights | | 843,087 | | | 36,769 | | | 806,318 | |
| | | | | | | | | | |
| | | | | | | | | 2004 | |
| | | | | | Accumulated | | | | |
| | | Cost | | | amortization | | | Net | |
| | | $ | | | $ | | | $ | |
| Land use rights | | 492,365 | | | 9,726 | | | 482,639 | |
Land use rights refer to the ability of the company to operate a fertilizer and phosphoric acid facility on the YSC property for a period of 500 years. These land use rights are provided by the municipal government and are being amortized over the initial 30-year term of YSC’s business license as this is currently believed to approximate the estimated useful life.
8. Mineral properties
| | | $ | |
| Exploration and development costs | | | |
| Balance - December 31, 2003 | | 2,046,045 | |
| Care and maintenance for YMC | | 310,114 | |
| Consulting | | 53,309 | |
| Travel | | 7,870 | |
| Balance - December 31, 2004 | | 2,417,338 | |
| Care and maintenance for YMC | | 352,078 | |
| Consulting | | 64,041 | |
| Travel | | 148,518 | |
| Balance - December 31, 2005 | | 2,981,975 | |
In 1996, the company entered into an agreement with YPCC for the exclusive right to develop the Yichang phosphate deposit, which is located in Hubei province in China. The company can earn a 90% interest in the property by taking the property to production. The Chinese government will earn a 10% interest by contributing land and the mineral rights. In 1999, the company completed the preliminary feasibility study report conducted jointly by the Northern China Chemical Mine Planning and Design Institute and China Wuhan Chemical Engineering Corp. Final project approval was also received from the Chinese government. In November 2000, a feasibility study and an environmental impact assessment study were completed. During 2001, the China Environment Protection Bureau approved the environmental study of the Yichang project. In April 2002, a feasibility study was updated by Jacobs Engineering Corporation.
In early 2002, the company commenced its application for a mining permit through YPCC. In 2003, the company and YPCC formed a Joint Venture Company, YMC, to undertake the development of the project. Since inception, all activities
21
NOTES TO CONSOLIDATED FINANCIAL STATEMENTS| December 31, 2005, 2004 and 2003 | Expressed in Canadian dollars
at YMC have been centered on the mining license transfer, with costs incurred in engineering studies, coordination of government relations and public relations activities. All YMC costs have been classified as mining exploration costs and capitalized to mineral properties.
During 2003, $760,490 of deferred mineral property expenditures was written off. The amount related to the Jacobs Engineering Corporation study on the development of a plant, as the construction of the facility will no longer be required due to the purchase of the existing fertilizer facility which was completed in 2004.
9. Other assets
Included in Other Assets, is an amount of $394,364 related to due diligence and legal opinions costs in connection with the proposed Tianren acquisition. In June 2005, the company signed a binding agreement to acquire the fertilizer related businesses of Hebei Tianren Chemical Corporation, a Chinese holding company and to merge the management teams and assets of both companies. Commercial and legal due diligence was completed late in the fourth quarter. The company continues at the negotiation stage with Hebei Tianren and is working with the Chinese authorities on the approval processes. If the acquisition is closed, these costs will be allocated to the identifiable assets acquired and liabilities assumed. If the negotiation indicates the transaction will most likely not be closed, the company will expense all the expenditures related to the proposed acquisition at that time.
10. Acquisition of YSC
On April 20, 2000, the company formed YSC, a 72.18% controlled Joint Venture Company. The remaining 27.82% of YSC is held by YPCC and Yidu Yuanfeng Chemical Industrial Company Limited (Yuanfeng). YSC owns the 100,000 tpa fertilizer facility near the City of Yidu, Hubei Province. The company made a contribution of $3,351,934 (US$2.5 million) to YSC to acquire its interest. These funds were applied to finance the construction of a 60,000 tpa phosphoric acid plant, which was completed and commissioned in the first quarter of 20050.
The acquisition of the fertilizer facility and operations has been accounted for as an acquisition of a business using the purchase method and results of operations have been consolidated since the date of acquisition. The following table summarizes the purchase price allocation based on the fair values of the assets acquired and liabilities assumed:
| | | $ | |
| Cash and short-term deposits | | 2,779,623 | |
| Inventory | | 831,685 | |
| Other current assets | | 1,940,739 | |
| Fixed assets | | 4,935,548 | |
| Land use right | | 538,933 | |
| Long-term loan | | (3,166,000 | ) |
| Current liabilities | | (3,218,569 | ) |
| | | 4,641,959 | |
| Less: Minority interest | | (1,290,025 | ) |
| Cash paid by the company | | 3,351,934 | |
11. Amounts outstanding with minority shareholders
As of December 31, 2005, the company has the following amounts outstanding with minority shareholders of YSC:
| | | | | | 2005 | | | | | | | | 2004 | |
| | | RMB | | | $ | | | | | RMB | | | $ | |
| Bank loan for the benefit of YPCC (note 12) | | 6,900,000 | | | 997,052 | | | | | 6,900,000 | | | 1,003,260 | |
| Loan from YPCC | | (4,475,375 | ) | | (646,693 | ) | | | | (4,475,375 | ) | | (650,720 | ) |
| Net exposure of YSC on loans | | 2,424,625 | | | 350,359 | | | | | 2,424,625 | | | 352,540 | |
| Other amounts due from YPCC and its subsidiaries | | 127,662 | | | 18,447 | | | | | 127,663 | | | 18,563 | |
| Total due from YPCC | | 2,552,287 | | | 368,806 | | | | | 2,552,288 | | | 371,103 | |
Following the formation of YSC and the acquisition of the fertilizer operations, the company discovered that YSC was liable for a loan facility of RMB7,400,000($1,069,302) from the Agricultural Bank of China (ABC), the funds of which were advanced directly to YPCC prior to the date of acquisition. The company understands that the proceeds of this loan were used in YPCC’s business and YSC has received no benefits from this loan. YPCC has guaranteed repayment of this loan to the company and the bank and the company is advised that YPCC has been paying the related interest to the bank. Prior to December 31, 2004, YPCC repaid RMB500,000 of the loan balance, accordingly at December 31, 2005, RMB6,900,000 ($997,052) was outstanding on this facility. The company has recorded an amount receivable from YPCC of RMB500,000 ($997,052) at December 31, 2005, being the amount due from YPCC required for the repayment of the remaining outstanding loan balance.
YSC has also received a working capital loan from YPCC of RMB4,475,375 ($646,693) and YPCC has requested repayment of this loan. YSC has received a written authorization for YPCC to apply this amount to offset the amount receivable from YPCC should YPCC fail to repay the bank loan and YSC is required to make payment of the loan directly to the bank. Accordingly, the company has accounted for the amount receivable from YPCC and the amount payable to YPCC on a net basis.
The company believes the net exposure of RMB2,424,625 ($350,359) to be fully recoverable from YPCC, however, the ultimate collection of this amount remains uncertain and it is possible that the amount may not be fully recoverable. The company is still in discussion with YPCC and the ABC regarding the full repayment of the bank loan, which came due in December 2004 (note 12).
The company also owes the third YSC Joint Venture partner Yuanfeng $119,358 due to additional land use right acquisition from Yuanfeng. The amount owed to Yuanfeng was $44,290 in 2004.
12. Bank loans
The company has two bank loans totalling RMB14,600,000 ($2,109,705) (December 31. 2004 - $2,849,840) from Industry & Commerce Bank of China (ICBC), in addition to the loan mentioned in note 11.
As at December 31, 20050, information about the bank loans is as follows:
| Principal amount | | |
| RMB | CA$ | Annual interest rate | Maturity date |
| 11,900,000 | 1,719,554 | 5.84% | October 27, 2005 |
| 2,700,000 | 390,151 | 5.58% | November 3, 2005 |
| | | 6.588% | |
| 6,900,000 | 997,052 | | December 27, 2004 |
| | | (note 11) total | |
| 21,500,000 | 3,106,757 | | |
As mentioned in note 11, the bank loan of RMB6,900,000 ($991,052) was incurred in YSC’s name for the benefit of YPCC. This loan was not paid in full as of the end of 20050, because YSC, YPCC and the ABC were still in discussions on repaying the loan in full. ABC has verbally advised the company that no penalty will be charged on the loan.
The company has held discussions with ICBC bank on the two loans due in late October and early November. The company and the bank are in discussion on a renewal agreement or a schedule to repay the bank loans over a period of next 12 months.
13. Shareholders’ equity
a) Authorized capital stock
Unlimited common shares without par value
Unlimited number of preferred shares without par value, issuable in series and with special rights and restrictions to be determined on issuance
b) Issued and outstanding capital stock
| | | Number of common | | | Amount | |
| | | shares | | | $ | |
| Balance - December 31, 2002 | | 17,949,328 | | | 6,231,555 | |
| Issued for exercise of options | | 300,000 | | | 210,000 | |
| Issued for cash under private placement | | 5,370,000 | | | 2,800,000 | |
| Issued for exercise of warrants | | 4,670,000 | | | 2,802,000 | |
| Commission and finder’s fee for private placement | | - | | | (196,779 | ) |
| Balance - December 31, 2003 | | 28,289,328 | | | 11,846,776 | |
| Issued for exercise of warrants | | 400,000 | | | 240,000 | |
| Issued for exercise of options | | 200,000 | | | 150,000 | |
| Issued for cash under private placement | | 11,000,000 | | | 15,372,725 | |
| Fair value of warrants issued to brokers for private placement services | | - | | | (224,400 | ) |
| Reallocation from stock options and warrants account | | | | | | |
| Prior year | | - | | | 94,600 | |
| Current year | | - | | | 70,950 | |
| Balance - December 31, 2004 | | 39,889,328 | | | 27,550,651 | |
| Exercise of options | | | | | | |
| Cash received | | 350,000 | | | 255,000 | |
| Reclassification from stock options/warrant account | | - | | | 112,235 | |
| Issued for exercise of warrants | | 708,334 | | | 942,501 | |
| Issued for cash under private placement | | 17,142,858 | | | 30,000,001 | |
| Commission and related issuance costs for private placement | | - | | | (2,346,949 | ) |
| Balance - December 31, 2005 | | 58,090,520 | | | 56,513,439 | |
On July 28, 2005, the company completed a private placement of 17,142,858 units at a price of $1.75 per unit; each unit comprises one common share and one half share purchase warrant. Each whole warrant is exercisable for two years to acquire a common share at ($)2.00 per share. All shares and warrants had a hold period expiring on November 28, 2005. The brokers received a 6% commission, or $1,800,000, and the company has incurred direct costs of $546,949. The net proceeds will be used to fund the company’s development projects in China and for general corporate purposes.
22
c) Stock options
Under the 2005 Employee Stock Option Plan, the company may grant options to its directors, officers, and service providers for up to 8,000,000 common shares or such additional amount as may be approved from time to time by the shareholders of the company. Under the plan, the exercise price of each option is not less than the market price of the company’s stock on the date of grant and an option’s maximum term is 5 years. The directors of the company may determine and impose terms upon which each option shall become vested in respect of option shares.
A summary of the company’s options at December 31, 2005, 2004 and 2003 and the changes for the years then ended is presented below:
| | | | | | | | | Weighted average | |
| | | | | | | | | exercise | |
| | | Options outstanding | | | Amount | | | price | |
| | | | | | $ | | | $ | |
| Balance - December 31, 2002 | | 1,000,000 | | | 21,445 | | | 0.90 | |
| Granted | | 3,185,000 | | | 1,405,434 | | | 0.79 | |
| Exercised | | (300,000 | ) | | (94,600 | ) | | 0.75 | |
| Balance - December 31, 2003 | | 3,885,000 | | | 1,332,279 | | | 0.77 | |
| Granted | | 1,850,000 | | | 1,257,040 | | | 1.50 | |
| Exercised | | (200,000 | ) | | (92,395 | ) | | 0.75 | |
| Balance - December 31, 2004 | | 5,535,000 | | | 2,496,924 | | | 1.02 | |
| Granted | | 700,000 | | | 834,426 | | | 1.71 | |
| Exercised | | (350,000 | ) | | (92,000 | ) | | 0.73 | |
| Balance - December 31, 2005 | | 5,885,000 | | | 3,239,350 | | | 1.12 | |
On March 3, 2005, the company granted incentive stock options to a director to purchase 500,000 shares at a price of $1.80 per share exercisable up to March 1, 2010. 50% of the options become vested on March 1, 2006 and the remaining 50% become vested on March 1, 2007.
On September 16, 2005, the Company granted incentive stock options to an officer to purchase 200,000 shares at a price of $1.50 per share exercisable up to September 16, 2010. 100,000 of the options will vest on August 29, 2006 and the remainder 100,000 will vest on August 29, 2007.
The fair value of each option granted is estimated on the date of grant using the Black-Scholes option pricing model with assumptions for the grant as follows:
| Risk-free interest rate | 3.41% - 3.64% |
| Expected life of options in years | 2 to 5 years |
| Expected volatility | 367% - 57% |
| Dividend per share | $nil |
The following table summarizes information about the options outstanding and exercisable at December 31, 2005:
| | | Options outstanding | | | Options exercisable |
Range of
exercise prices
$
| Number
outstanding at
December 31,
2005
| Weighted
average
remaining
contractual
life (years) | Weighted
average exercise
price
$ | | Number
exercisable at
December 31,
2005
|
Weighted
average exercise
price
$ |
| | | | | | | |
| 0.60 | 2,000,000 | 2.35 | 1.60 | | 2,000,000 | 0.60 |
| | | | | | | |
| 0.90 | 700,000 | 0.46 | 0.90 | | 700,000 | 0.90 |
| | | | | | | |
| 1.20 | 635,000 | 2.47 | 1.20 | | 635,000 | 1.20 |
| | | | | | | |
| 1.50 | 2,050,000 | 3.69 | 1.50 | | 1,668,750 | 1.50 |
| | | | | | | |
| 1.80 | 500,000 | 4.16 | 1.80 | | - | 1.80 |
| | | | | | | |
| 0.60 to 1.80 | 5,885,000 | 2.76 | 1.12 | | 5,003,750 | 1.02 |
In the year ended December 31, 2003, the company elected not to follow the fair value method of accounting for stock options granted to employees and directors. Accordingly, no compensation expense is recorded on the grant of share options to employees and directors where the exercise price is equal to the market price at the date of grant. In accordance with the new accounting policy as stated in note 2, the opening deficit was restated on a retroactive basis to show the effect of compensation expense associated with stock option grants to employees and directors from January 1, 2002 to December 31, 2003, which amounted to $1,405,433 and an increase of $94,600 to share capital and $1,310,833 to stock options.
Pro forma information determined under the fair value method of accounting for stock options is as follows:
| | | 2003 | |
| | | $ | |
| Loss for the year | | | |
| As reported | | (1,310,054 | ) |
| Compensation expense | | (1,405,433 | ) |
| Pro forma loss for the year | | (2,715,487 | ) |
| Basic and diluted loss per share | | | |
| As reported | | (0.06 | ) |
| Compensation expense | | (0.14 | ) |
d) Warrants
The following is a summary of warrant transactions at December 31, 2005, 2004 and 2003 and the changes for the years the ended:
| | | | | | | | | Weighted average | |
| | | | | | | | | exercise | |
| | | Number of warrants | | | Amount | | | price | |
| | | | | | $ | | | $ | |
| | | | | | | | | | |
| Balance - December 31, 2002 | | - | | | - | | | - | |
| Granted | | 5,370,000 | | | 20,235 | | | 0.63 | |
| Exercised | | (4,670,000 | ) | | - | | | 0.60 | |
| Balance - December 31, 2003 | | 700,000 | | | 20,235 | | | 0.81 | |
| Granted | | 5,830,000 | | | 224,000 | | | 1.50 | |
| Exercised | | (400,000 | ) | | - | | | 0.60 | |
| Balance - December 31, 2004 | | 6,130,000 | | | 244,235 | | | 1.48 | |
| Granted | | 8,571,429 | | | - | | | 2.00 | |
| Exercised | | (708,334 | ) | | (20,235 | ) | | 1.33 | |
| Balance - December 31, 2005 | | 13,993,095 | | | 224,000 | | | 1.81 | |
Of the outstanding warrants at December 31, 2005, 5,421,666 had an exercise price of $1.50 with an expiry date in June 2006, and 8,571,429 had an exercise price of $2.00, with an expiry date in July 2007.
There were 8,571,429 warrants granted on July 28, 2005, as part of the private placement. No warrants were cancelled during the year ended December 31, 2005. 408,334 warrants at $1.50 each and 300,000 warrants at $1.10 each were exercised during the year ended December 31, 2005. The following table summarizes information about warrants outstanding at December 31, 2005:
| Number of | | |
| warrants | Exercise price | Expiry date |
| | $ | |
| 5,421,666 | 1.50 | June 22, 2006 |
| 8,571,429 | 2.00 | July 28, 2007 |
| 13,993,095 | | |
14. Related party transactions
Included in expenses are the following amounts paid to companies controlled by directors:
| | | 2005 | | | 2004 | | | 2003 | |
| | | $ | | | $ | | | $ | |
| Consulting fees | | 236,489 | | | 335,654 | | | 282,754 | |
| Management fees | | - | | | - | | | 27,833 | |
| | | 236,489 | | | 335,654 | | | 310,587 | |
Directors of the company receive consulting fees for their services. A total of $236,489 was paid in 2005 to companies controlled by three directors and two officers (2004 - $335,654; 2006 - $282,754). Account payables to these companies for the consulting services were $11,334 at the end of 2005. Except for the account receivable of RMB2,424,625 ($350,359) from YPCC related to the YSC loan (note 11), there was no other account receivables from the related party.
15. Segmented information
Management considers developing an integrated fertilizer business, which includes the development of the phosphate project in China, to be the company’s principal activity. All revenues are earned from sales to customers located in China.
23
NOTES TO CONSOLIDATED FINANCIAL STATEMENTS| December 31, 2005, 2004 and 2003 | Expressed in Canadian dollars
| | | | | | | | | 2005 | |
| | | | | | | | | | |
| | | Canada | | | China | | | Consolidated | |
| | | $ | | | $ | | | $ | |
| Current assets | | 24,947,059 | | | 15,111,835 | | | 40,058,894 | |
| Property, plant and equipment - net | | 49,724 | | | 9,947,144 | | | 9,996,868 | |
| Land used right - net | | - | | | 806,318 | | | 806,318 | |
| Mineral properties | | - | | | 2,981,975 | | | 2,981,975 | |
| Other assets | | 396,364 | | | 94,329 | | | 490,693 | |
| | | 25,393,147 | | | 28,941,601 | | | 54,334,748 | |
| | | | | | | | | | |
| | | | | | | | | 2004 | |
| | | | | | | | | | |
| | | Canada | | | China | | | Consolidated | |
| | | $ | | | $ | | | $ | |
| Current assets | | 15,931,184 | | | 844,883 | | | 16,776,067 | |
| Property, plant and equipment - net | | 18,694 | | | 8,420,222 | | | 8,438,916 | |
| Land used right - net | | - | | | 482,639 | | | 482,639 | |
| Mineral properties | | - | | | 2,417,338 | | | 2,417,338 | |
| | | 15,949,878 | | | 12,165,082 | | | 28,114,960 | |
16. Income taxes
A reconciliation of the combined Canadian federal and provincial income taxes at statutory rates and the company’s effective income tax expense is as follows:
| | | 2005 | | | 2004 | |
| | | $ | | | $ | |
| Income tax provision at statutory rates | | (1,161,548 | ) | | (864,053 | ) |
| Increase in taxes from: | | | | | | |
| Non-deductible items | | 421,387 | | | 449,094 | |
| Foreign losses subject to different tax rates | | 24,013 | | | 14,123 | |
| Losses not recognized | | 716,148 | | | 400,836 | |
| | | - | | | - | |
The company’s controlled Joint Venture Company YSC, has a future income tax liability associated with its capital assets and land use right. It has a potential future income tax asset related to its tax losses, inventory and accounts receivable. The potential future income tax asset related to its tax losses more than offset its future income tax liability associated with its capital assets. Given the losses incurred by YSC and its history, management has determined that it would not be appropriate to recognize a net future income tax asset. As a Joint Venture Company with foreign parties, YSC has a tax exemption during its first two profitable years and a 50% tax exemption in the third year. What effect this will have on the future taxes payable is unknown at this time since it its dependant on what the profit will be in those reduced tax years.
The company has significant Canadian loss carryforwards with no revenue generating operations (other than interest income) in Canada. Therefore, management has determined that it is appropriate that no future income tax asset is recorded for the Canadian entity.
Temporary differences related to the following assets and tax loss carryforwards that may rise to potential future income assets as at December 31, 2005 and 2004 are described below:
| | | 2005 | | | 2004 | |
| | | $ | | | $ | |
| Tax loss carryforwards and other amounts | | 4,297,869 | | | 3,361,197 | |
| Fixed assets | | (157,551 | ) | | (88,280 | ) |
| Land use right | | (134,084 | ) | | (116,062 | ) |
| Mineral properties | | 172,669 | | | 254,107 | |
| | | 4,178,903 | | | 3,410,962 | |
| Valuation allowance | | (4,178,903 | ) | | (3,410,962 | ) |
| Future income tax assets | | - | | | - | |
At December 31, 20050, the company has the following unused tax losses available for application against taxable income of future years, and they expire as follows:
| | | $ | | | | |
| 2006 | | 1,566,593 | | | | |
| 2007 | | 2,132,467 | | | | |
| 2008 | | 927,382 | | | | |
| 2009 | | 999,224 | | | | |
| 2010 | | 1,693,875 | | | | |
| 2014 | | 1,020,332 | | | | |
| 2014 | | 907,596 | | | | |
| Total | | 9,247,469 | | | | |
17. Differences between Canadian and U.S. generally accepted accounting principles
| a) | The company’s consolidated financial statements have been prepared in accordance with generally accepted accounting principles in Canada. The material measurement differences between GAAP in Canada and the United States that would have an effect on these financial statements are as follows: |
| | | 2005 | | | 2004 | | | 2003 | |
| | | $ | | | $ | | | $ | |
| Mineral properties - under Canadian GAAP | | 2,981,975 | | | 2,417,338 | | | 2,046,045 | |
| Feasibility study/technical evaluation | | (2,981,975 | ) | | (2,417,338 | ) | | (2,046,045 | ) |
| Mineral properties - under U.S. GAAP | | - | | | - | | | - | |
| Marketable securities - under Canadian GAAP | | - | | | - | | | 98,500 | |
| Adjustment for fair market value | | - | | | - | | | 3,600 | |
| Marketable securities - under U.S. GAAP | | - | | | - | | | 102,100 | |
| Total shareholders’ equity | | | | | | | | | |
| Capital stock - under Canadian GAAP | | 56,513,439 | | | 27,550,651 | | | 11,846,776 | |
| Compensatory escrow release value | | 697,500 | | | 697,500 | | | 697,500 | |
| Flow-through share premium | | (135,000 | ) | | (135,000 | ) | | (135,000 | ) |
| Pro rata allocation of units value to warrants | | (5,678,151 | ) | | (2,840,612 | ) | | - | |
| Capital stock - under U.S. GAAP | | 51,397,788 | | | 25,272,539 | | | 12,409,276 | |
| Stock options and warrants - under Canadian GAAP | | 3,463,750 | | | 2,763,003 | | | 41,680 | |
| Pro rata allocation of units value of warrants | | 5,678,151 | | | 2,840,612 | | | - | |
| Stock-based compensation | | (1,405,433 | ) | | (1,405,433 | ) | | - | |
| Stock options and warrants - under U.S. GAAP | | 7,736,468 | | | 4,198,182 | | | 41,680 | |
| Deficit - under Canadian GAAP | | (11,895,918 | ) | | (8,563,880 | ) | | (4,732,692 | ) |
| Interest expenses related to construction | | 118,874 | | | 49,823 | | | (2,046,045 | ) |
| Feasibility study/technical evaluation | | (2,981,975 | ) | | (2,417,338 | ) | | (697,500 | ) |
| Compensatory escrow release value | | (697,500 | ) | | (697,500 | ) | | 13,5000 | |
| Deferred taxes | | 135,000 | | | 135,000 | | | - | |
| Stock-based compensation | | 1,405,433 | | | 1,405,433 | | | - | |
| Deficit - under U.S. GAAP | | (13,916,086 | ) | | (10,088,462 | ) | | (7,341,237 | ) |
| | | | | | | | | | |
| Cumulative other comprehensive income | | - | | | - | | | - | |
| - under Canadian GAAP | | | | | | | | | |
| Fair market value of marketable securities | | - | | | - | | | 3,600 | |
| Cumulative translation adjustment | | 294,890 | | | 408,187 | | | - | |
| Cumulative other comprehensive income - under U.S. GAAP | | 294,890 | | | 408,187 | | | 3,600 | |
| Total shareholders’ equity - under U.S. GAAP | | (13,621,196 | ) | | (9,680,275 | ) | | (7,337,637 | ) |
The impact on the consolidated statements of operations and deficit would be as follows:
| | | 2005 | | | 2004 | | | 2003 | |
| | | $ | | | $ | | | $ | |
| Loss for the year - under Canadian GAAP | | (3,332,038 | ) | | (2,425,755 | ) | | (1,310,054 | ) |
| Feasibility study/technical evaluation | | (564,637 | ) | | (371,293 | ) | | (53,951 | ) |
| Mineral property written off in year | | - | | | - | | | 760,490 | |
| Interest expenses related to construction | | 69,052 | | | 49,823 | | | - | |
| Loss for the year - under U.S. GAAP | | (3,827,623 | ) | | (2,747,225 | ) | | (603,515 | ) |
| Other comprehensive income | | | | | | | | | |
| Marketable securities | | - | | | (3,600 | ) | | 3,600 | |
| Cumulative translation adjustment | | (113,297 | ) | | 408,187 | | | - | |
| Comprehensive loss | | (3,940,920 | ) | | (2,342,638 | ) | | (599,915 | ) |
| Basic and diluted loss per common share - under U.S. GAAP | | (0.08 | ) | | (0.08 | ) | | (0.03 | ) |
b) Income taxes
Under U.S. GAAP, the sale of flow-through shares resulted in a deferred credit being recognized for the excess of the purchase price paid by investors over the fair value of common shares without the flow-through feature. The fair value of the shares was recorded as equity. When the tax deductibility of the qualifying expenditures is renounced, a temporary difference arises. A deferred tax liability was established in the amount of the tax benefit foregone, and tax expense was recorded for the difference between the deferred tax liability and the premium received upon issuance of the flow-through shares. This deferred tax liability reversed due to loss carry-forwards available.
c) Accounting for stock-based compensation
Effective January 1, 2004 for Canadian GAAP, the company adopted CICA 3870, Stock-based Compensation and Other Stock-based Payments which requires an expense to be recognized in the financial statements for all forms of employee stock-based compensation. Adoption of CICA 3870 was applied retroactively, without restatement, as permitted by the standard. For U.S. GAAP purposes, the company adopted FAS 148, “Accounting for Stock based Compensation Transition-and Disclosure”. FAS 148 provides alternative methods of transition for a voluntary change to the fair value based method of accounting for stock-based employee compensation. For U.S. GAAP, effective January 1, 2004, the company applied the modified prospective method of adoption included in FAS 148 which recognizes stock-based employee
24
compensation for 2004 as if the fair value based accounting method in this statement had been used to account for all employee awards granted, modified or settled in fiscal years beginning after December 31, 1994. Since all stock options granted from that date to January 1, 2004 vested immediately, application of the modified prospective method for U.S. GAAP purposes in 2004 did not have any additional impact on the stock-based compensation charge for 2004 or on total shareholders’ equity under U.S. GAAP.
d) Mineral property expenditures
Mineral property expenditures are accounted for in accordance with Canadian GAAP as disclosed in note 2. For U.S. GAAP purposes, the company expenses exploration or property maintenance expenditures relating to mineral properties as they are incurred. When proven and probable reserves are indicated by a bankable feasibility study for a property, subsequent development costs of the property are capitalized. The capitalized costs of such properties would then be measured periodically to ensure that the carrying value can be recovered on an undiscounted cash flow basis. If the carrying value cannot be recovered on this basis, the mineral properties would be written down to fair value using a discounted cash flow basis.
e) Capitalization of interest
Under U.S. GAAP, capitalization of interest is calculated for certain qualifying assets that require a period of time to get them ready for their intended use. Under Canadian GAAP, capitalization of interest is permitted, but not required. The company’s interest expense related to construction in progress was $69,052 and $49,823 respectively in 2005 and 2004, which has been expensed for Canadian GAAP purposes.
f) Comprehensive income
Under US GAAP, comprehensive income is recognized and measured in accordance with FASB Statement No. 130 “Reporting Comprehensive Income”. Comprehensive income includes all changes in equity other than those resulting from investments by owners and distributions to owners. Comprehensive income includes two components, net income and other comprehensive income. Other comprehensive income includes amounts that are recorded as an element of shareholders’ equity but are excluded from net income as these transactions or events were attributable to changes from non-owner sources. These items include minimum pension liability adjustments, holding gains and losses on certain investments, gains and losses on certain derivative instruments and foreign currency gains and losses related to self-sustaining foreign operations (cumulative translation adjustment). A standard for comprehensive income and other comprehensive income is not yet effective under Canadian GAAP.
g) Issue of escrow shares
U.S. GAAP requires that compensation expense be recorded for the excess of the quoted market price over the price granted to employees and directors under escrow share agreements that are based on more than mere passage of time and require performance. The compensation expense was recorded under US GAAP when the shares became eligible for release. Under Canadian GAAP, no compensation expense was recorded for these escrow share agreements.
h) Supplemental cash flow information
Under U.S. GAAP, the consolidated statements of cash flows for 2005, 2004 and 2003 would not show exploration expenditures under investing activities. These balances of $564,637, $371,293 and $53,951, respectively, would instead be included in cash flow from operating activities. This would result in cash flow from operating activities for 20050, 2004 and 2003 of ($3,446,678), $647,513) and ($634,962), respectively.
i) Marketable securities
For U.S. GAAP purposes, unrealized gains and losses for available-for-sale securities are included in comprehensive income, a separate component of shareholders’ equity, except where the decline in value is other than temporary in which case Canadian and U.S. GAAP are the same.
j) Issue of units
Under U.S. GAAP, the proceeds on the sale of units comprising shares and warrants are allocated to each instrument on a pro rata basis using the total fair value to determine the pro rata allocation.
k) Cash flow from operating activities
Under U.S. GAAP, cash flow from operating activities must be presented as the amount calculated after taking into effect the changes in non-cash working capital items. The disclosure of a subtotal referring to the amount of cash flow from operating activities before changes to working capital items is not permitted.
l) Recent accounting pronouncements
Accounting standards that the company expects to adopt subsequent to December 31, 2005 on a prospective basis when applicable include the following:
- Financial instruments-recognition and measurement, hedges, and comprehensive income In January 2005, the CICA issued three new standards:“Financial instruments-recognition and measurement, hedges, and comprehensive income.” The main consequences of implementing standards are described below. The new standards will be effective for interim and annual financial statement commencing in 2007. Earlier adoption is permitted. Most significantly for the company, the new standards will require presentation of a separate statement of comprehensive income. Investment in marketable securities will be recorded in the consolidated balance sheet at fair value. Changes in the fair value of marketable securities will be recorded in income and changes in the fair value of investments reported in comprehensive income. The company is undertaking analysis of the impact of the new standards.
- Deferred stripping costs
In June 2005, the Emerging Issues Task Force issued EITF 04-06 – Accounting for Post-Production Stripping Costs in the Mining Industry. The EITF requires that stripping costs incurred during the production phase of a mine are variable production costs that should be included in the costs of the inventory produced during the period that the stripping costs are incurred. The company has not yet reached the production phase of the YMC properties and as such, has no inventory in which to include any stripping costs. Once the company goes into production, it will account for stripping costs as per EITF 04-06 for U.S. GAAP purposes. However, this may result in GAAP differences based on the proposed Canadian EIC D56 - Accounting for Deferred Stripping costs in the mining industry. - Accounting for changes and error corrections
During June 20050, the FASB issued SFAS No. 154, Accounting for Changes and Error Corrections. The new standard requires that entities which make a voluntary change in accounting principle apply that change retroactively to prior period financial statements, unless this would be impracticable. For changes in methods of depreciation, amortization or depletion for long-lived assets, the change must be accounted for prospectively, as a change in estimate. SFAS No. 154 is effective for the company’s 2006 financial statements.
18. Financial instruments and concentration of risk
Fair values
The company’s financial instruments include cash and cash equivalents, short term investments, accounts receivable, customer deposits, accounts payable and accrued liabilities, other payable, bank loans, and amount due from YPCC. The fair values of these financial instruments approximate their carrying values.
Credit risk
The company maintains a substantial portion of its cash and cash equivalents with major financial institutions in Canada and China. Financial instruments that potentially subject the company to concentration of credit risk are primarily receivables. Management believes that any risk of loss is reduced due to the financial strength of the company’s major customers.
Foreign currency risk
A substantial portion of the company’s business is carried out in Chinese Renminbi, and the company maintains Renminbi denominated bank accounts. The company also has short-term investments in US dollars. Fluctuations in exchange rates between the Canadian dollar and PRC Renminbi and US dollar could have a material effect on the business, results of operations and financial condition of the company.
19. Commitments
During the upcoming years, the company has the following contractual commitments:
| | | 2006 | | | 2007 | |
| | | $ | | | $ | |
| Vancouver rental commitment | | 87,600 | | | 87,600 | |
| Engineering study - | | 462,401 | | | - | |
| Nanjing Chemical Engineering Design Institute | | | | | | |
| | | 550,001 | | | 87,600 | |
20. Subsequent events
In March, 2006, the company granted options to a new officer to purchase 200,000 common shares of the company at the exercise price of $1.50 per share. 50% of the options become vested on March 14th, 2007 and the remaining 50% become vested on March 14th, 2008.
25
SPUR VENTURES INC. 2005 ANNUAL REPORT
C O R P O R A T E D A T A
| DIRECTORS: | CORPORATE GOVERNANCE | TRANSFER AGENT: |
| Steven G. Dean | Ruston Goepel,Chairman | Computershare Trust Company |
| Robert J. Rennie | John Van Brunt | Vancouver, British Columbia |
| John Van Brunt | Robert Atkinson | |
| Y.B. Ian He | David Cohen | LEGAL COUNSEL: |
| Robert G. Atkinson | David Black | DuMoulin Black |
| David Cohen | | Vancouver, British Columbia |
| Ruston Goepel | SHARES LISTED: | |
| David Black | TSX Venture Exchange: (Symbol SVU) | AUDITORS: |
| | | |
| OFFICERS: | Shares Issued: 58,090,520 million | PricewaterhouseCoopers LLP |
| | Fully Diluted: 77,968,615 million | Vancouver, British Columbia |
| Steven G. Dean,Chairman | (at December 31, 2005) | |
| Robert J. Rennie,Chief Executive Officer | | ANNUAL GENERAL MEETING: |
| Y.B. Ian He,President | HEAD OFFICE: | |
| Joel Jeangrand,Vice President, Corporate Development | | The Annual General Meeting of the Shareholders will be held at the Cypress Room, Hyatt Regency Vancouver, 655 Burrard Street, Vancouver British Columbia on June 21, 2006 at 2:30 P.M. |
| Michael Chen,Chief Financial Officer | Suite 3083, Three Bentall Centre |
| Michael Kuta,Corporate Secretary | 595 Burrard Street |
| | PO Box 49298 |
| | Vancouver BC V7X 1L3 | |
| AUDIT COMMITTEE | | |
| Robert Atkinson,Chairman | CONTACT: | |
| David Black | Robert J. Rennie,Chief Executive Officer | |
| David Cohen | 604.697.6205 | |
| | rrennie@spur-ventures.com | |
| COMPENSATION COMMITTEE | Michael J. Kuta | |
| John Van Brunt,Chairman | 604.697.6201 | |
| Steven Dean | questions@spur-ventures.com | |
| | | |
| Robert Atkinson | WEBSITE: | |
| | | |
| | www.spur-ventures.com | |
CAUTIONARY NOTES
These materials include a review of Spur Ventures Inc.’s operations in China. Readers are cautioned that certain statements regarding expansions of the operations are based on estimates and projections and are not definitive. No representation or prediction is intended as to the results of the expansions, all of which is subject to fertilizer margins sufficient to justify any expansions.
These materials include certain “forward-looking statements” within the meaning of the Private Securities Litigation Reform Act of 1995. Other than statements of historical fact, all statements in this material, including, without limitation, statements regarding potential mineralization and resources, estimated or potential future production, and future plans and objectives of the Company, are forward-looking statements that involve various known and unknown risks, uncertainties and other factors. There can be no assurance that such statements will prove to be accurate. Actual results and future events could differ materially from those anticipated in such statements. Readers are cautioned not to place undue reliance on these forward-looking statements that speak only as of the date of these materials. Important factors that could cause actual results to differ materially from the Company’s expectations include, among others, the availability of financing, availability of raw materials such as potash and phosphate rock, fertilizer prices, conclusions of any scoping, pre-feasibility or feasibility studies and changes in project parameters, as well as those factors discussed under the heading “Risk Factors” and elsewhere in the Company’s documents filed from time to time with the TSX Venture Exchange, Canadian or U.S. securities regulators and other regulatory authorities. All subsequent written and oral forward-looking statements attributable to the Company or persons acting on its behalf are expressly qualified in their entirety by this notice.
Certain information referenced in this Annual Report is based on a feasibility study prepared by Jacobs Engineering Inc. of Lakeland, Florida dated October, 2000, the executive summary of which is available on the Company’s website. Readers are encouraged to review that report for detail on the phosphate deposit held by the Company through the YMC joint venture. In addition, certain information relating to the YSC phosphate fertilizer plant is based on a scoping study prepared by Najing Chemical Industrial Design Institute dated December, 2003, the executive summary of which is available on SEDAR and on the Company’s website. Readers are encouraged to review that report for detail on the projected cost, timing and operating costs of the phased expansion of the YSC joint venture fertilizer plant.
26

TERRAIN DESIGN INC.©2006 - PRINTED IN CANADA BY GENERATION PRINTING
W W W . S P U R - V E N T U R E S . C O M
S V U : T S X - V