GROWING WITH CHINA

2006 ANNUAL REPORT
 | SPUR VENTURES INC. |
REPORT TO SHAREHOLDERS
SPUR AT THE FORK IN THE ROAD
In 2006 the Chinese Central Government rolled out its strategy for the “socialist countryside” in its 11th Five Year Plan. At the same time, Hubei Province advanced its strategy to become a leading producer of phosphate fertilizers.
China recognizes that its natural phosphate resources are limited, are non renewable and have to be developed in a sustainable fashion.
China currently has over 400 companies mining phosphate rocks but only five which mine over 1million tonnes each year. Similarly China has over 400 companies producing phosphate fertilizers but most have production capacities less than 100,000 tonnes per year and many are running at utilization rates of 50% or less. By comparison, the USA with similar mining and fertilizer production has 8 companies. The Chinese planning agencies recognize that this situation is not sustainable and that major changes have to be made.
Five provinces (Hubei, Sichuan, Hunan, Yunnan and Guizhou) control 90% of China’s rock phosphate reserves. Each province is encouraging upgrading of the rock P in its own province, thus reducing exports to other parts of China. Many of northeast China’s NPK facilities will either have to import from abroad or shut down.
Hubei Province, where Spur has its NPK plant and its two deposits, introduced a new strategy to force the integration of phosphate mining and phosphate fertilizer production companies. The Government reinforced this strategy by assessing a variable surtax on phosphate rock sales. At the same time they increased the rock P price by 15%. This makes it difficult for any “traders” who served as intermediaries between phosphate miners and fertilizer producers to survive.
This strategy of integration is entirely aligned with Spur’s strategy and is a common business model for international fertilizer companies which produce phosphates.
This was also a year where stress on the electrical generating capability of western Hubei Province limited production in all industries. The region experienced a combination of extended drought which hurt hydro-electrical generation plus a shortage of coal for coal-fired generation. The authorities prioritized electricity for urban and exporting industries so many in the fertilizer industry, including Spur, had to run their plants at less than normal capacity in November, December and into the first quarter of 2007.
It was not an easy year to do business in Hubei Province.
Despite these challenges, Spur’s Yichang Chemical NPK plant set new daily and monthly production and sales records. Production and sales were up 19% and 16.4% respectively while revenues were up 13.1% . However forced plant interruptions coupled with higher raw material costs and lower sales prices resulted in the third consecutive year of losses at YSC.
1
Spur decided to take a conservative approach to its accounting treatment of YSC as a long-term asset and booked a $4.33M impairment charge, equivalent to 51% of YSC’s book value. Although YSC can be a fully sustainable enterprise when production reaches 70,000 mt annually, a series of one-time events have prevented meeting this target.
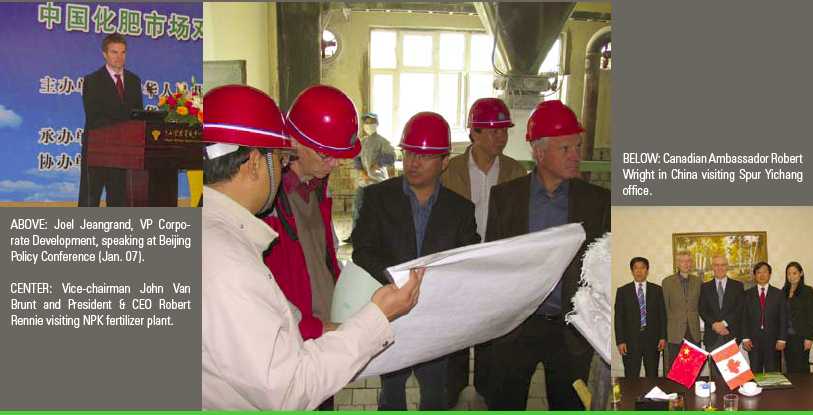
Spur also made progress in the transfer of the mining licenses from our Joint Venture Partner, YPCC, to our Yichang Maple Leaf Chemicals (YMC) joint venture which we control. Yiling County and Xinshang District which are home to each of our two mines, officially approved the transfer of the mining licenses. Yichang City has completed its review and we anticipate working on the transfer at the Hubei Province level in the near future.
Spur received excellent support from the Government of Canada late in 2006. Minister Commercial Ken Lewis and Ambassador Robert Wright both visited top officials in Hubei Province and Yichang City to emphasize the importance of Spur’s project to the Canadian government.
Although it may appear that Spur’s foray into China has been a long 10 years, in reality the clock started ticking on mining about two years ago when the mining licenses were officially issued from Central Land and Resources. This is not an unusually long time in the Chinese context.
SPUR IS CHANGING
The Spur Board has approved a new strategy and Vision for Spur
The Fastest Growing Integrated Supplier of Plant Nutrients for the Chinese Farmer
There are some important words in Spur’s new Vision.
The First leg of Spur’s strategy remains the Yichang Integrated Phosphate Project. Spur will be fully integrated from mining through flexible manufacturing to the market place. Flexible manufacturing means that Spur may produce MAP or NPK’s. MAP can be sold directly to other domestic NPK producers or exported.
| FLEXIBILITY IN MANUFACTURING IN RESPONSE
TO CHANGING MARKET NEEDS |
|
The second and third legs emphasize that Spur is a supplier of “Plant Nutrients” to the Chinese farmer. Spur’s marketing team will be implementing Spur’s “bundling” approach. Instead of simply bringing high quality, balanced fertilization to the Chinese farmer, we will be bringing all of the products and information the farmer needs. These products, which may include plant protection products, biotech seeds, soil testing, specialty fertilizers and biological plant growth stimulants, will be both sourced locally and imported by Spur. All products will be evaluated for agronomic and economic performance at the farm level together with Chinese agronomists.
2

| BUNDLING PROPRIETARY PRODUCTS TO
CREATE A ONE STOP SHOP FOR THE
CHINESE FARMER |
|
Perhaps most important is embodied in the focus on the Chinese farmer. Spur is changing from being a production to a market oriented company. If our products and services do not bring value in the eyes of our farm customers, we will not sell them.
| MARKET-ORIENTED
CUSTOMER-FOCUSED |
|
LOOKING AHEAD
Spur will still have its base in the original Integrated Phosphate Project in Yichang.
But Spur will be viewed as an innovative marketer of products that meet all of the needs of the Chinese farmer, a one stop shop for the farm customer.
It has been a challenging year for our shareholders and for our senior management team. But our Board of Directors and our team remain committed to doing business in China and believe that in the near future, we will be starting our mining operations.

| Robert J. Rennie | Steven G. Dean |
| President & CEO | Chairman |
3
YEAR IN REVIEW
YICHANG SPUR CHEMICALS (YSC) NPK PLANT
| 19.1% increase in production to 39,844 mt |
| - | Average daily production of 159.38 mt or 39.8% of capacity |
| - | New daily production record of 313 mt |
| - | New monthly production record of 6,161 mt |
| Major turn around successfully completed in Q1 06 |
| - | Significant improvement in quality. Off spec now 5% vs 20% previously |
| New monthly sales volume record of 7,500 mt |
| Introduced new NPK product (14-16-15) for post emer- gence market |
| Resolved outstanding issues regarding two bank loans |
YICHANG MAPLE LEAF CHEMICALS (YMC)
(Integrated Phosphate Project)
| Mining License Transfer progressing |
| - | Yiling County (Dianziping mine) and Xinshang District (Shukongping mine) approved Mining License Transfer from YPCC to YMC |
| - | Yichang City completed its due diligence and review for the formal transfer process |
| YMC Business License extended |
| Two potential sites identified for mega plant (Xiaoting City and Zhijiang City) |
FINANCIAL HIGHLIGHTS
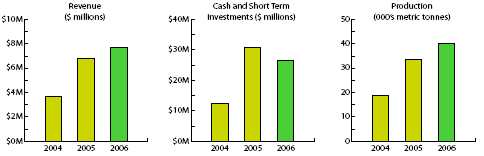
| 13.1% increase in Revenues to $ 7.70M |
| Earnings per share of ($0.11) as compared with ($0.06) in 2005 due to a $4.33M impairment charge of long-lived as- sets at YSC. Without the impairment charge, earnings per share would have been ($0.04), a significant improvement from ($0.06) in 2005 |
| EBITDA of ($5.46M) and Net Earnings of ($6.47M), includ- ing the impairment charge. |
| Strong Working Capital Position of $26.5M cash and cash equivalents, of which $21M is in Canada |
| Strong Balance Sheet with $39M in assets and $3.7M in liabilities |
SPUR’S PRIORITIES FOR 2007
| YMC |
| - | Obtain approval from Yichang City, Hubei Province and Central Land & Resources for YMC to start mining rock phosphates |
| - | Acquire new land for the Integrated Project |
| - | Start mining our first 150K mt of high grade rock phos- phate |
| YSC |
| - | Become cash flow positive by YE07 |
| Corporate |
| - | Successfully complete merger between Spur and Hebei Tianren |
| - | Transform Spur from a mining and production driven company to a market-oriented, customer-focused com- pany |
| - | Generate cash from new products and services |
4
NEW RECORDS AT YSC |
| Yichang Spur Chemicals started its turnaround in 2006 and achieved a new plant record in monthly sales and production. |
|
5

BUSINESS SEGMENTS UPDATE
YICHANG SPUR CHEMICALS (YSC)
Spur’s NPK compound fertilizer plant produced 39,844 mt of NPK’s, a 19.1% increase over 2005. The plant was shut down for 69 days in midsummer due to a dispute with the Agricultural Bank of China and then intermittently in November and December due to shortages of electricity.
Sales were 34,695 mt, a 16.4% increase over 2005, while gross profit was 158.8% higher at $174,381. Revenues were $7.70M, a 13.1% increase over 2005. EBITDA was ($4.91M) and Net Income ($5.86M), due to the recognition of an impairment charge in respect of YSC of $4.33M. Management is required on an ongoing basis to determine if the undis-counted cash flows of each asset are less than its carrying value and, if so, to estimate and record an impairment charge. The carrying cost of YSC would be justified if YSC production levels were approximately 70,000 mt/yr. YSC’s production has averaged less than 40,000 mt each of the last three years due to a series of one-time events including interruptions in electrical supply, slowness in the transfer of the mining licenses, an undisclosed loan by YSC’s joint venture partner, YPCC, and plant down time for the Q1-2006 debottlenecking project. Spur management therefore decided to take a conservative approach and booked this non-cash impairment charge, which roughly equates to 51% of YSC’s book value. Without the impairment charge, EBITDA would have been ($1.15M) and net income ($2.16M) respectively.
The phosphoric acid plant ran at 21% of capacity due to the lower NPK production levels.
YICHANG MAPLE LEAF CHEMICALS (YMC)
The mining licenses for the Shukongping and Dianziping mines were issued by Central Land and Resources Department in February and No-vember of 2004, respectively, to Spur’s JV partner, YPCC. In March of 2005 the official transfer process from YPCC to YMC began when Spur contributed its first 15% ($10.5M) of Registered Capital to YMC.
After very thorough due diligence, in December 2006 Yiling County (the Dianziping mine site) and Xinshang County (Shukongping) officially approved the transfer. This allowed Yichang City to complete its own due diligence on the transfer and to be in a position to finalize all procedures in order to recommend the transfer to Hubei Province Land and Resources.
However, Yichang City cannot transfer the mining licenses to a corporate entity whose business license has not been formally renewed.
YMC BUSINESS LICENSE RENEWAL
Hubei Administration for Industry and Commerce (AIC) extended YMC’s Business License until March 31, 2007 by the direction of Central Ministry of Commerce based on a strong letter of support from the City of Yichang. This extension gave YPCC time to complete its first Registered Capital Contribution. The authorities have acknowledged that Spur has been in compliance since March of 2005, at which time Spur’s Registered Capital Contribution totaled $15.32M in cash. YPCC made its first required Registered Capital contribution valued at $3.69M for prior R&D expenses and $1.05M of other expenses in February of 2007. YPCC’s contribution has recently been approved by Hubei AIC, thus completing the requirements for the renewal of the YMC Business License which should be issued in the near future. If there is further delay, Spur anticipates that the authorities will grant another extension. YPCC’s next and last Registered Capital contribution will be the two Mining licenses.
HEBEI TIANREN-SPUR VENTURES MERGER
On May 31, 2006, Spur and Hebei Tianren signed a Final Agreement for a share for share exchange for the acquisition of Hebei Tianren’s equity positions in two NPK production facilities, a trading company and a large Marketing company.
The transaction originally included the acquisition of a 95% interest in Tianren Agriculture Franchise Company, China’s largest marketer of compound NPK fertilizers with annual revenues exceeding $250 million; a 75% interest in Tianding Chemical Company, which has a
100,000 mt NPK plant in Qinhuangdao, Hebei Province and also sells in excess of 28 million fertilizer bags each year; a 60% interest in Hubei Yichang Tianlong Industry Company, a raw Materials sourcing and fertilizer trading company based in Yichang, Hubei Province, and a 51% interest in Xinjiang Tianren Ltd., which has a 100,000 mt NPK plant in Xinjiang Uygur Autonomous Region in northwest China.
In exchange for these interests, Spur agreed to issue approximately 15.5M Spur shares subject to a 24 month escrow period commencing on the date of the signing of the final agreement. In accordance with the agreement, Spur is entitled to retain the profits of the 2006 fiscal year dating from June 1, 2006 and onwards.
The Chinese government implemented new regulations for share for share purchases in September of 2006 which clarified the process but required Spur and Hebei Tianren to commence a new application pro-
6
cedure. Spur knew this would be a pioneering approval process and it has turned out to be just that.
Formal applications have now been approved by the Qinhuangdao
City and Hebei Province Ministry of Commerce for Tianding Chemical Company and Tianren Agriculture Franchise Company and by Yichang City and Hubei Province Ministry of Commerce for Hubei Yichang Tian-long Industry Company (“Tianlong”), and all are now being reviewed by the relevant central authorities.
The parties have subsequently agreed that the Xinjiang Tianren Chemical Company and its 100,000 mt NPK plant in northwest China will no longer be part of the transaction, and the Spur share allocation has been reduced from 15.5M to 13.3M shares as a result. New government policies in Xinjiang Uygur Autonomous Region dictating a switch from natural gas to coal to produce nitrogen for the NPK plant have made this entity no longer economically attractive to Spur.
Additional approvals under China’s WTO accession guidelines (which came into effect on December 11, 2006) will also be required for Tianlong because it has a sulphuric acid import license, and for the Ag Franchise Company because it has distribution and sales rights in China.
To accommodate the additional time required for these Chinese approvals, the parties agreed to extend the merger deadline until Sep-tember 30, 2007.
Approvals at the Central Ministry of Commerce levels are anticipated to be completed by mid-year.
7

8
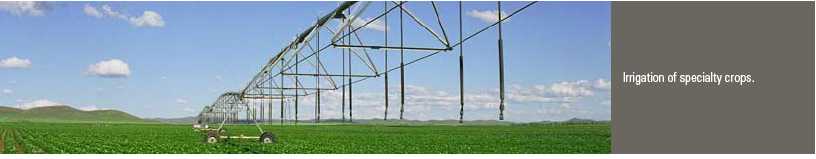
SPECIALTY FERTILIZER PRODUCTS
A balanced supply of essential plant nutrients is critical for successful crop production. Traditionally, farmers use a combination of conventional fertilizers such as urea for nitrogen, DAP (diammonium phosphate) or MAP (monoammonium phosphate) for phosphate, MOP (muriate of potash, i.e. KCl), SOP (sulphate of potash, i.e. K2SO4) for potash, or compound fertilizers such as NPK’s, for all three nutrients to grow their crops
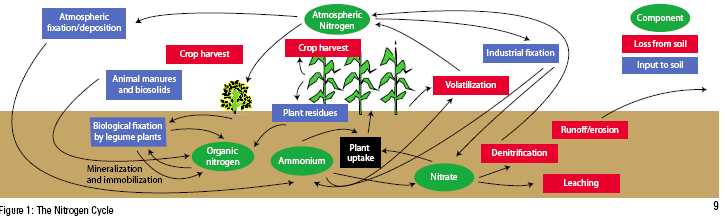
During the crop season, however, nutrients can be lost to the ground-water, to the air and into the soil’s organic matter as a result of biological and physical activity in the soil.
These losses mean that farmers don’t always fully benefit from the application of their fertilizers. Generally less than 50% of applied nitrogen, 20% of phosphate and 10% of sulphur reach the crop in the first year of application.
The fertilizer industry knows this and it has been the task of agronomists to develop specialty fertilizers to avoid or reduce such nutrient losses for higher nutrient efficiency (see Figure 1).
CURRENT MARKET FOR SPECIALTY FERTILIZERS
In 1995/96, total worldwide consumption of controlled release fertilizers was estimated to be 562,000 mt. The number increased to 700,000 mt in 1999, to 850,000 mt in 2001 and to about 1 million mt in 2005.
About two thirds of all controlled release fertilizers are consumed in the USA, predominately in Florida, California, Arizona and the Pacific Northwest where the high value of the horticultural crops, golf turf, nurseries and greenhouses justifies the additional costs of these fertil-
izers. Only 8-10% of such fertilizers are being used for high-value cash crops, such as vegetables and fruits, and almost none for commodity crops such as wheat, corn, soybeans and rice.
The main limitation of the use of these fertilizers in large hectare commodity crops has been the high cost of the fertilizer coatings.
Currently, China has the capacity to produce about 500,000 mt of controlled release fertilizers for agricultural crops, although actual production is well below production capacity. It is estimated that China produces about 150-200,000 mt each year of various types of controlled release fertilizers. This represents only 1% of the total amount of fertilizers consumed in China.
WHAT ARE SPECIALTY FERTILIZERS?
Specialty fertilizers can be classified into three general categories:
1. Slow-release fertilizers where release rates are difficult to predict;
2. Controlled release fertilizers where release rates are predictable; and
3. Fertilizers associated with inhibitors of enzymatic processes.
All three of these technologies have the potential to increase efficien-cy of the nutrients applied, generally resulting in higher crop yields.
| 1. | SLOW RELEASE FERTILIZERS |
The majority of slow-release fertilizers are materials with either sulphur or synthetic plastic coatings on the granular surface. The com-
monly used coated fertilizers are:
Sulphur-Coated Ureas (SCU). SCU has long been popular and economical for incorporation and top-dressing of soils for high cash value specialty crops. The release rate is controlled primarily by the thickness of the coating and the surrounding temperature. The sulphur in the coating is often an advantage because it lowers the pH of the medium.
SCU’s have two disadvantages:
1. The thickness of the sulphur coating means less fertilizer nutrient is delivered per tonne of product. eg. Urea is 45-0-0, i.e. it is 45% urea by weight. SCU is 35-0-0, i.e. it is 35% urea. The difference is the weight of the sulphur coating.
2. It is difficult to predict the release rate so these fertilizers have generally been used in the ornamental and turf market, i.e. for flowers and grasses rather than for commodity crops such as wheat and corn.
| 2. | CONTROLLED RELEASE (CR) FERTILIZERS |
CR fertilizers use sophisticated polymer-coating technologies to carefully manipulate nutrient release characteristics and meet the specific nutrient uptake needs of each crop. CR fertilizers can thus be “designer” fertilizers targeted to the specific crop and the particular climatic conditions. A golf course in Florida needs nutrients faster than one in the Rocky Mountains of Alberta simply because of the warmer temperature and different day length.
To initiate release from polymer-coated materials, moisture must first diffuse through the coating and solubilize the fertilizer inside. Temperature is the key factor in the nutrient release from all of these products.
The key benefit of CR over slow release fertilizers is the predictability of their nutrient release curve therefore these have the most potential for large hectare crops. Another key benefit is the thinness of the coating, resulting in much higher nutrient content per tonne of fertilizer product.
ADVANTAGES OF SLOW AND CONTROLLED RELEASE FERTILIZERS
In the Northern Hemisphere we plant seeds in the cool, wet spring. Plants then grow slowly over the next three to four months, requiring different nutrients at different times during their growth period until the fall harvest.
Spring applied nitrogen fertilizers can be 100% available to the plant within weeks of planting but, of course, the plant is too young to take advantage. This exposes the nitrogen fertilizers to losses setting the stage for a lower plant yield and environmental contamination.
Slow and controlled release fertilizers are a great advantage over conventional soluble fertilizers because they can offer a complete nutritional package for a season or longer. Release rates vary from weeks to years depending upon the types of fertilizers and the environment where the crop grows.
- The planned release of nutrient from controlled release fertilizers better coincides with plant needs, minimizes nutrient losses and improves fertilizer use efficiency.
- Fertilizers need only be applied once at seeding instead of split applications over the growing season. This reduces labour, fuel and equipment costs and reduces compaction of the soil.
- Seedling toxicity, caused through high ionic concentrations re- sulting from the quick dissolution of conventional fertilizers, is reduced
- Larger fertilizer application rates are possible because of the re- duced toxicity and lower salt content.
- Evaporation losses of ammonia are reduced, thus minimizing greenhouse gas problems.
| 3. | NITRIFICATION AND UREASE INHIBITORS |
Nitrification inhibitors are compounds that delay bacterial oxidation of the ammonium-ion (NH4) and nitrite (NO2) by depressing over a certain period of time the activities ofNitrosomonasandNitrobacterbacteria in the soil.Nitrosomonasoxidizes ammonia to nitrite whileNitrobactercompletes the oxidation of nitrite to nitrate (NO3) which is highly mobile in soils and the most available to the growing plant. The objective of using nitrification inhibitors is, therefore, to control leaching of nitrate by keeping nitrogen in the ammonia form longer, to prevent denitrification of nitrate-N and to increase the efficiency of nitrogen applied
Urease inhibitors prevent or depress over a certain period of time the transformation of amide-N in urea to ammonium hydroxide and ammonium. They do so by slowing down the rate at which urea hydrolyzes in the soil, thus avoiding or reducing volatilization losses of ammonia to the air (as well as further leaching losses of nitrate).
10
Urease inhibitors increase the efficiency of urea and nitrogen fertilizers containing urea (e.g. Urea ammonium nitrate solution UAN), thereby inhibiting for a certain period of time the enzymatic hydrolysis of urea, which depends on the enzyme urease.
Commercial urease inhibitors such as N-ServeTM were first commercialized by Dow Chemical in the mid-1990s but their use is not wide spread.
Advantages of nitrification inhibitors and urease inhibitors:
- Nitrification inhibitors, through inhibition of nitrification of ammonia, significantly reduce leaching losses of nitrogen and movement of nitrate into water supplies, while maintaining N availability to crops
- They also reduce emissions of N20and NOX
- Nitrification inhibitors - indirectly - improve the mobilization and the uptake of phosphate in the rhizosphere
- Urease inhibitors may reduce ammonia volatilization losses par- ticularly from top-dressed agricultural fields as well as under re- duced tillage when urea is used as a source of nitrogen
- Urease inhibitors furthermore reduce seedling damage when seed-placed levels of urea/urea containing fertilizers are too high.
FUTURE OUTLOOK FOR SPECIALTY FERTILIZERS IN CHINA
In China, the government, research institutions and the fertilizer industry are making tremendous efforts in the research and development of controlled release fertilizer and other specialty products.
The consumption of controlled release fertilizers and other specialty products in China is growing by 8-10% each year. The steady increase is driven partially by farmers’ desire to improve nutrient utilization ef-ficiency and partially by government initiatives to protect the quality of the environment.
The potential for increased use of controlled release fertilizers and other specialty products is tremendous considering their advantages, including:
- Labour and time saving because fertilizers need to be applied only once
- Increased nutrient recovery resulting in a higher Return on Investment for applying fertilizers
- Improved yields, and
- Reduced negative environmental impacts
However it is important to keep these fertilizers in perspective. The 500k tonnes of such fertilizers consumed in China represents less than 1% of the total fertilizer market in China.
Where in the western world, the high cost of labour is a key factor in the use of such fertilizers, in contrast, China uses its low cost of labour as a competitive advantage.
Further, good specialty fertilizers cost considerably more than normal fertilizers. For Chinese farmers to adopt such fertilizers on a broad scale will require a significant economic benefit in the eyes of the farmer rather than in the eyes of the national planning organizations.
11

| Steven G. Dean - Director & Chairman
| Robert J. Rennie
Director, President & CEO | Robert G. Atkinson
Director & Vice Chairman |
MANAGEMENT AND BOARD OF DIRECTORS
STEVEN G. DEAN
Director & Chairman
Steven Dean was most recently President of Teck Cominco Limited, a Canadian based diversified mining and refining company with world class assets in zinc, metallurgical coal, copper, gold and industrial minerals. In 1995, Mr. Dean founded PacMin Mining Corporation. Mr. Dean was a member of the founding management of the Normandy Poseidon Group, which became Normandy Mining Limited, one of the largest Australian based diversified miners producing gold, base metals and industrial minerals. His roles included Group General Manager, Chief Financial Officer, and Executive Director. Mr. Dean is a Fellow of the Australian Institute of Mining and Metallurgy, the Australian Institute of Chartered Accountants, a member of the Canadian Institute of Mining, Metallurgy and Petroleum, and was a founding Director of the Australian Gold Council. Mr. Dean is Chairman of Amerigo Resources Ltd., a Canadian company with copper and molybdenum production operations near Santiago, Chile.
ROBERT J. RENNIE
Director, President & Chief Executive Officer
Dr. Rennie has over 20 years of experience in the fertilizer business first in R&D with Esso Chemical and then with Agrium Inc. and since 1998 leading the successful growth of Agrium’s retail and wholesale investments in Argentina. Dr. Rennie retired from Agrium as Vice President, South America and Vice President, Corporate Affairs and as Chairman of the Board of Profertil S.A., Agrium’s wholesale joint venture with Spain’s Repsol-YPF, and as Chairman of the Board of Agroservicios Pampeanos, Agrium’s wholly-owned retail operation in Argentina. Prior to working in industry Dr. Rennie worked as a scientist for the United Nation’s International Atomic Energy Agency in Vienna, Austria and for the Research Branch of Agriculture Canada.
Dr. Rennie earned a BSA (Honours) from the University of Saskatch-ewan, a MSc from Université Laval and a PhD from the University of Minnesota. He serves as Chairman of the Board of the Alberta Life Sciences Institute, and is Vice Chairman of the Agricultural Committee of the Paris-based International Fertilizer Industry Association.
ROBERT G. ATKINSON
Director & Vice Chairman
Mr. Atkinson has been in the investment industry for over 30 years. He is former President and CEO of Loewen Ondaatje McCutcheon & Co Ltd., one of Canada’s most respected investment dealers. He now
serves as Director of Trimin Capital Inc., Quest Capital Corp. and a number of other public companies. Mr. Atkinson received a B.Comm. degree from the University of British Columbia.
JOHN VAN BRUNT
Director & Vice Chairman
Mr. Van Brunt joined Spur as Vice Chairman in July 2004 after approximately 40 years at Agrium, which included being Agrium’s Chief Executive Officer for almost 11 years until his retirement in 2003. Mr. Van Brunt was instrumental in building Agrium into a successful integrated fertilizer enterprise with annual sales of approximately $3 billion by mergers and acquisitions, as well as internal growth initiatives. Mr. Van Brunt was President of the International Fertilizer Industry Association, and of the Fertilizer Institute, and has developed an extensive worldwide contact base in the fertilizer industry and various government agencies. Mr. Van Brunt provides overall industry guidance to the Spur management team, assists with evaluating and pursuing opportunities and represents the company in interactions at the highest levels of government and the fertilizer industry.
DAVID BLACK
Director
Mr. Black is a senior partner of DuMoulin Black, a law firm he co-founded in 1966 that provides corporate, securities and finance services to natural resource and commercial/industrial companies. He is a founding director of Southwestern Resources Corp. and sits on the board of several public companies.
RUSTON GOEPEL
Director
Mr. Goepel is Senior Vice President, Raymond James Ltd. He entered the investment business in 1968 specializing in institutional sales with Pemberton Securities Ltd. and Dominion Securities. In 1989 he was a founding partner and CEO of Goepel Shields & Partners, a national securities dealer which was acquired by Raymond James Inc. Tampa, Florida, the 8th largest U.S. brokerage firm, in January, 2001. Mr. Goepel is a Governor and Executive Committee Member of the B.C. Business Council, Director and Member of the Investment Policy Committee for the Canadian Olympic Committee, Director, Executive Committee and Chairman of the Nominating & Governance Committee for the Vancouver 2010 Bid Corp. Mr. Goepel is a past member of the Investment Dealers Association of Canada and a Past Governor of the Vancouver Stock Exchange. He is a Director of a number of Cana-
12

| | John Van Brunt | David Black | Ruston Goepel | Wu Sihai | |
| | Director & Vice-Chairman | Director | Director | Director | |
dian companies. Mr. Goepel was the recipient of the Queen’s Jubilee
Medal for Business Leadership and Community Service.
WU SIHAI
Director
Mr. Wu is currently the President of the International Fertilizer Industry Association (IFA) and his appointment to that leadership position represented a milestone in recognizing the importance of China in the global fertilizer market. He has many years experience in fertilizer industry companies holding various positions from technical manager, production manager, CEO and Chairman. Mr. Wu is Vice Director of the China Petroleum and Chemical Industry Association and since 2003 has been a Member of the China National People’s Congress. In 2006 Mr. Wu was appointed Vice Chairman of the Party Consultative Committee of Hebei Province.
ZHAI JIDONG
Chief Operating Officer
Mr. Zhai comes to Spur with over 19 years experience in fertilizers business management, including production and marketing. He was formerly Director and President of Qinhuangdao Huaying Phosphoric Acid Co. Ltd. (a joint venture between a Chinese state-owned company and Japan’s ITOCHU) and Chief Economist of Sino Arab Chemical Fertilizers Co. Ltd. (a joint venture between CNOOC of China and GCT of Tunisia).
Mr. Zhai currently is Vice Chairman of the China Phosphate Industry Association, a director of the China Sulphuric Acid Industry Association and a member of both the Agriculture Committee of the International Fertilizer Industry Association and of the Hebei Committee of the Chinese People’s Political Consultative Conference. Mr. Zhai holds a B.Sc. degree from Tianjin Nankai University and a Masters degree in economics from Hebei University.
JOEL JEANGRAND
VP Corporate Development
Mr. Jeangrand comes to Spur with over 15 years experience in Business Development most of which he spent in the greater China region. Joel worked for 12 years with Eramet in its Mining and Metallurgical Group in various capacities of increasing responsibility. He was Vice President - Eramet International in Hong Kong and Asian Sales Manager of Comilog Far East from 1998 to 2003. His most recent position was at Coleman Associates Consulting in Vancouver where he was Senior Consultant in Business Strategy. Joel holds an Executive Masters of Business Administration, from Simon Fraser University, Vancouver.
MICHAEL KUTA
Corporate Secretary
Mr. Kuta has an HBA from the University of Western Ontario and an LLB from the University of British Columbia. Mr. Kuta has more than 20 years of experience in corporate, commercial and tax law, both in private practice and with public and private corporations.
| | Zhai Jidong | Joel Jeangrand | Michael Kuta | |
| | Chief Operating Officer | VP Corporate Development | Corporate Secretary | |
13
MANAGEMENT DISCUSSION & ANALYSIS
FOR THE YEAR ENDED DECEMBER 31, 2006
This Management’s Discussion and Analysis (“MD&A”) has been prepared as at March 30, 2007, and should be read in conjunction with the audited consolidated financial statements with accompanying notes of Spur Ventures Inc. (the “Company”) for the year ended December 31, 2006 which have been prepared in accordance with Canadian Generally Accepted Accounting Principles.
This MD&A contains certain statements that may be deemed to be “forward-looking statements” regarding the timing and content of upcoming programs. Although the Company believes the expectations expressed in such forward-looking statements are based on reasonable assumptions, such statements are not guarantees of future performance and actual results or developments may differ materially from those in the forward-looking statements. Factors that could cause actual results to differ materially from those in forward-looking statements include, but are not limited to, future prices of nitrogen, phosphate and potash, exploitation and exploration successes, continued availability of capital and financing, the exchange rates for Canadian, US and Chinese currencies, Chinese policies on fertilizer and agriculture, and general economic, market or business conditions. The Company disclaims any intention or obligation to update or revise any forward-looking information as a result of new information or future events.
All amounts are reported in U.S. dollars, unless otherwise stated. Additional information on the Company can be found in the filings with Ca-nadian security commissions on SEDAR at www.sedar.com and in the Company’s Form 20-F with the United States Securities and Exchange Commission on EDGAR at www.sec.gov/edgar.
Spur Ventures Inc. (the “Company”) is developing a fully integrated fertilizer business in the People’s Republic of China (China). The recoverability of the amounts shown as mineral properties is dependent upon the existence of economically recoverable reserves, the ability of the Company to obtain the necessary financing to complete the development of the properties, and future profitable production or proceeds from the sale of fertilizer products.
The Company has entered into agreements securing the title of the mineral properties, by forming a 78.72% controlled Joint Venture Company, Yichang Maple Leaf Chemicals Ltd. (YMC), with Hubei Yichang Phosphorous Chemical Co. Ltd. (YPCC) in December 2003 to undertake the development of the phosphate mines and to build compound phosphate fertilizer production facilities. YMC has not yet commenced active operations. The titles to the two primary mining properties are legally in the possession of our Joint Venture partner, YPCC, and are in the process of being formally transferred to YMC. Although these arrangements are in accordance with industry standards for the stage of development of such properties, these procedures do not guarantee the Company’s title. Property title may also be subject to unregistered prior agreements and regulatory requirements.
To accelerate the production of compound fertilizers, the Company acquired Xinyuan Chemicals Ltd. in 2004 and formed a 72.18% controlled Joint Venture Company called Yichang Spur Chemicals Ltd. (YSC), which owns a 100,000 tonnes per annum (tpa) NPK (Nitrogen, Phosphate, Potassium) fertilizer facility, The other two minority partners are YPCC which owns 16.69% and Yichang Yuanfeng Chemical (Yuanfeng) which owns 11.13% .
Non-GAAP Measures
In this MD&A, the Company has reported EBITDA (Earning Before Interest, Tax, Depreciation & Amortization). This is a non-GAAP measure, which is used to determine the Company’s ability to generate cash flows and returns for investing and other activities. The non-GAAP measure does not have a standardized meaning prescribed by GAAP and is therefore unlikely to be comparable to similar measures presented by other issuers.
The following table shows the calculation of EBITDA
| | | 2006 | | | 2005 | | | 2004 | |
| Y S C | | | | | | | | | |
| Earnings | | (5,860,284 | ) | | (838,963 | ) | | (414,167 | ) |
| | | | | | | | | | |
| Interest Exp | | 207,341 | | | 173,789 | | | 146,960 | |
| Tax | | - | | | - | | | | |
| Depreciation | | 746,590 | | | 485,085 | | | 194,490 | |
| Amortization | | | | | | | | | |
| | | | | | | | | | |
| E B IT D A | | (4,906,353 | ) | | (180,089 | ) | | (72,717 | ) |
| | | | | | | | | | |
| Y M C | | | | | | | | | |
| Earnings | | 273,391 | | | (235,570 | ) | | | |
| | | | | | | | | | |
| Interest Exp | | - | | | | | | | |
| Tax | | | | | | | | | |
| Depreciation | | 42,916 | | | | | | | |
| Amortization | | | | | | | | | |
| | | | | | | | | | |
| E B IT D A | | 316,307 | | | (235,570 | ) | | - | |
| | | | | | | | | | |
| Spur Consolidated | | | | | | | | | |
| Earnings | | (6,469,804 | ) | | (2,818,806 | ) | | (1,864,038 | ) |
| | | | | | | | | | |
| Interest Exp | | 207,364 | | | 173,842 | | | 146,985 | |
| Tax | | | | | | | | | |
| Depreciation | | 801,006 | | | 497,559 | | | 205,247 | |
| Amortization | | | | | | | | | |
| | | | | | | | | | |
| E B IT D A | | (5,461,434 | ) | | (2,147,405 | ) | | (1,511,806 | ) |
14
Yichang Spur Chemicals (YSC)
The Company continues to develop an integrated fertilizer business in planned stages. YSC has been able to adjust NPK (Nitrogen, Phosphate, Potassium) fertilizer production in response to market demand with the goal of retaining its key customer base while minimizing losses. In 2006, YSC’s production and sales volume were both higher than the previous year. The Company successfully completed the construction and commissioning of a 60,000 metric tonnes (mt) per annum phosphoric acid plant in March 2005 and started to supply phosphoric acid for its own NPK production
Yichang Maple Leaf Chemicals (YMC)
The Company is going through approval application in order to formally transfer the mining licenses for the Dianziping and Shukongping phosphate deposits from the joint venture partner, YPCC, to the YMC Joint Venture Company which the Company controls.
The Company completed its required cash contributions to YMC’s registered capital account to fulfill the Company portion of the first 15% capital requirement which initiated the government mining licenses transfer process as provided in the original YMC Joint Venture contract.
Cash and Short Term Investments
As of December 31, 2006, the Company had cash & cash equivalents and short term investments of US$26.5 million, of which US$21.0 million is held in Canadian banks. There is US$4.5 million held in a YMC registered capital account in Canadian dollars in China. The Company has complete control over the YMC registered capital account, the repatriation to Canada of which is subject to the approval of the State Administration of Foreign Exchange.
| 2. | SELECTED ANNUAL INFORMATION |
| Selected annual information from the Company’s three most recently completed financial years is summarized as follows: |
| | | 2006 | | | 2005 | | | 2004* | | | 2003 | |
| Total revenues ($) | | 7,697,039 | | | 6,802,849 | | | 3,695,981 | | | Nil | |
| Net income (loss) ($) | | (6,469,804 | ) | | (2,818,806 | ) | | (1,864,038 | ) | | (935,085 | ) |
| Earnings (loss) per share ($) | | (0.11 | ) | | (0.06 | ) | | (0.05 | ) | | (0.04 | ) |
| Diluted earnings (loss) per share ($) | | (0.11 | ) | | (0.06 | ) | | (0.05 | ) | | (0.04 | ) |
| | | | | | | | | | | | | |
| Total Assets ($) | | 39,042,671 | | | 46,603,259 | | | 23,359,001 | | | 5,566,682 | |
| Total long-term liabilities ($) | | Nil | | | Nil | | | Nil | | | Nil | |
| Cash dividends declared ($) | | Nil | | | Nil | | | Nil | | | Nil | |
| 3. | RESULTS OF OPERATIONS – FULL YEAR |
*All 2004 figures are the results of three quarters of YSC operation after the acquisition of Xinyuan in April 2004 and as a result, 2004 results are not directly comparable to 2005 and 2006.
The Company’s NPK compounds fertilizer Joint Venture Company produced 39,844 mt (metric tons) of NPK’s in the year of 2006, compared to 33,442 mt in 2005 as the Company had a new plant manager and had invested $200,000 in sustaining capital in spring to ensure that the plant could operate sustainably at maximum capacity.
During 2006 the plant was shut down for 30 days for maintenance and 69 days due to a dispute with the Agricultural Bank of China and then again for a total 199 hours due to shortages of electricity.
Sales for year ended December 31, 2006 were $7,697,039, a 13% increase over the sales of $6,802,849 in 2005, with sales volume of 34,695 mt and 29,816 mt respectively as the Company hired a new sales manager in the fall. Cost of product sold amounted to $7,522,658 as compared to $6,735,427 in 2005 due to higher volume. Gross profit was $174,381 versus $67,422 in 2005 reflecting the benefits of YSC’s improved operating efficiencies and higher volume despite raw materials price increases. Unit cost of production was $217/mt in 2006 as compared with $226/mt in 2005 as the Company now is able to supply phosphoric acid for its own NPK production. EBITDA was ($4,906,353) for the year ended December 31, 2006, compared to ($180,089) in 2005. The increase in losses was due to the recognition of an impairment charge in 2006 of long-lived assets in the amount of $4,328,622.
The following table illustrates the operation results at YSC.
15
| (Unaudited) | Q1/2006 | Q2/2006 | Q3/2006 | Q4/2006 | T otal 2006 |
| Production Volume (mt) | 15,308 | 7,359 | 7,294 | 9,883 | 39,844 |
| Sales Volume (mt) | 12,557 | 4,833 | 6,583 | 10,721 | 34,695 |
| Net Sales ($) | 2,820,850 | 1,020,136 | 1,474,175 | 2,381,878 | 7,697,039 |
| Cost of sales ($) | 2,624,090 | 1,171,584 | 1,476,988 | 2,249,996 | 7,522,658 |
| Total Gross Profit ($) | 196,760 | (151,448) | (2,813) | 131,882 | 174,381 |
| Selling price/mt ($) | 225 | 211 | 224 | 222 | 222 |
| Cost of Product/mt ($) | 209 | 242 | 224 | 210 | 217 |
| (Unaudited) | Q1/2005 | Q2/2005 | Q3/2005 | Q4/2005 | T otal 2005 |
| Production Volume (mt) | 5,571 | 9,486 | 11,961 | 6,424 | 33,442 |
| Sales Volume (mt) | 7,302 | 9,311 | 7,462 | 5,741 | 29,816 |
| Net Sales ($) | 1,725,674 | 2,099,865 | 1,736,150 | 1,241,160 | 6,802,849 |
| Cost of sales ($) | 1,443,583 | 2,049,960 | 1,659,556 | 1,582,328 | 6,735,427 |
| Total Gross Profit ($) | 282,091 | 49,905 | 76,594 | (341,168) | 67,422 |
| Selling price/mt ($) | 236 | 226 | 233 | 216 | 228 |
| Cost of Product/mt ($) | 198 | 220 | 222 | 276 | 226 |
| (Unaudited) | Q1/2004 | Q2/2004 | Q3/2004 | Q4/2004 | T otal 2004 |
| Production Volume (mt) | | 5,261 | 3,873 | 9,593 | 18,727 |
| Sales Volume (mt) | | 5,011 | 7,086 | 8,245 | 20,342 |
| Net Sales ($) | | 745,522 | 1,131,666 | 1,818,793 | 3,695,981 |
| Cost of sales ($) | | 654,862 | 1,184,641 | 1,895,093 | 3,734,596 |
| Total Gross Profit ($) | | 90,660 | (52,975) | (76,300) | (38,615) |
| Selling price/mt ($) | | 149 | 160 | 221 | 182 |
| Cost of Product/mt ($) | | 131 | 167 | 230 | 184 |
Yichang Maple Leaf Chemicals (YMC)
In 2006 YMC has been focusing on the mining license transfer. The mining licenses for the Shukongping and Dianziping mines were issued by Central Land and Resources Department to Spur’s JV partner YPCC in February and October of 2004 respectively. In March of 2005 the official transfer process from YPCC to YMC began when Spur contributed its first 15% of Registered Capital ($10.5M) to YMC.
Spur is pleased to report that after very thorough due diligence the first approval stage was finally completed in late December 2006 when Yiling County (Dianziping mine site) and Xinshang County (Shukongping mine site) officially approved the transfer to the Yichang City level. Yichang City has now also completed its own due diligence on the transfer and is in a position to recommend the transfer to Hubei Province Land and Resources. Under today’s regulations in China, Hubei L&R has the legal right to make the final decision on the transfer but it could also require subsequent review in Bejing.
The key to Yichang City recommending the Mining License Transfer to Hubei Province Land and Resources is now the formal renewal of the YMC Business License.
Hubei Administration for Industry and Commerce (AIC) extended YMC’s Business License until March 31, 2007 by the direction of Central Ministry of Commerce based on a strong letter of support from the City of Yichang. This extension gave YPCC time to complete its first Registered Capital Contribution. The authorities have acknowledged that Spur has been in compliance since March of 2005 at which time Spur’s Registered Capital Contribution totaled $15.32 M in cash. YPCC made its first required Registered Capital contribution valued at $3.69M for prior R&D expenses and $1.05M of other expenses in February of 2007. YPCC’s contribution has recently been approved by Hubei AIC thus completing the requirements for the renewal of the YMC Business License which should be issued in the near future. If there is further delay, Spur anticipates that the authorities will grant another extension. YPCC’s next and last Registered Capital contribution will be the two mining licenses.
Spur Consolidated Results
Total expenses were $4,040,124 for the year ended December 31, 2006 versus $2,790,506 in 2005. This $1,249,618 increase was among other things primarily due to the engagement of a full time management team as the Company recognized the need for continuity in leadership on the ground in China. Depreciation and amortization increased to $332,760 in 2006 from $106,128 in 2005. Rent increased from $84,616 in 2005 to $238,593 as the Company moved into a larger office in Vancouver and expanded office space in Yichang. Selling expenses were $331,938 in 2006 compared to $266,506 in 2005 reflecting increased sales volume and additional efforts to promote sales in a more competitive NPK market. Professional fees increased to $621,795 in 2006 from $227,600 in 2005 mostly attributable to higher audit related fees, Sarbanes Oxley Act implementation preparation and quarterly financial reviews. Transfer agent and filing fees increased to $141,831 from $24,361 in 2005 resulting from the change in the listing of the Company’s shares to the TSX from the TSX Ventures exchange. The increases in expenses were partially offset by the decrease of $277,124 in stock based compensation as previously granted stock options are fully vested. The short-term investments and Guaranteed Investment Certificates generated interest income in the year of 2006 increased to $1,168,316 versus $366,266 in 2005 as the financial position of the Company was stronger in 2006. The Company recognized an impairment
16
loss of $4,328,622 on its long-lived assets during the year. EBITDA was ($5,461,434) for the year ended December 31, 2006, compared to ($2,147,405) in 2005 due to an impairment charge on YSC’s long-lived assets in the amount of $4,328,622. The 2006 Loss per Share was at $0.11 as compared with $0.06 in 2005.
The Company’s cash and cash equivalents and short-term investments at the end of 2006 amounted to $26,497,945 as compared with $30,755,711 at the end of 2005, the decrease resulting from funding required for the Company’s operations. The Company believes that it has sufficient funding to meet its obligations and to maintain administrative and operational expenditures for the next 12 months. The Inventory balance decreased to $2,429,443 at the end of 2006 from $2,604,680 at the end of 2005. Accounts Receivable increased to $1,247,384 at the end of 2006 from $401,787 in 2005, due to higher sales and the Company granting credits to some longtime customers to promote sales and overcome intense competition in the NPK market. The increase of $318,848 in Prepaid Expenses at the end of 2006 from the balance of $280,268 at the end of 2005 reflected the increased production activities.
Foreign Exchange Loss
The foreign exchange gain was $93,939 for the year ended December 31, 2006, compared to a foreign exchange loss of $785,345 for 2005 when the Company reported in Canadian Dollars. The unrealized foreign exchange gain was mainly a result of the translation of the Company’s integrated joint ventures YMC and YSC using the temporal method. YSC was considered a self-sustaining operation prior to March 31, 2006, but is now considered an integrated operation due to a significant change in its financial condition. As a result, the foreign currency translation of YSC was prospectively changed from the current rate method to temporal method. Under the temporal method, monetary assets and liabilities are translated at period-end exchange rates and items included on the statements of operations and cash flows are translated at rates in effect at the time of the transaction. Non-monetary assets and liabilities are translated at historical rates. The gain or loss on translation is charged to the statement of operations.
The Company conducts business in China, with most costs and revenues in Chinese Renminbi. Its Vancouver head office incurs expenses in Canadian dollars. The Company also holds a significant amount in US dollar denominated Guarantee Investment Certificate (GIC) accounts ranging from one to four months. The Company’s functional currency is Canadian dollar. Foreign exchange losses or gains are dependent upon the Canadian dollar exchange rates in relationship with other currencies. It is anticipated that the Canadian exchange rates will be volatile over the coming quarters. This may result in foreign exchange fluctuations between gains or losses on a quarterly basis. The Company maintains a certain amount of cash resources in Renminbis in order to meet its obligations in China. The Company does not yet use derivatives to hedge against exposures to foreign currency arising from the Company’s balance sheet liabilities and therefore, the Company is exposed to future fluctuations in the Canadian / US dollar and Canadian dollar / Chinese Renminbi exchange rates.
| 4. | SUMMARY OF QUARTERLY RESULTS (UNAUDITED) |
| | Qtr ended | Qtr ended | Qtr ended | Qtr ended | Qtr ended | Qtr ended | Qtr ended | Qtr ended |
| | Dec. 31, | Sep. 30, | Jun. 30, | Mar. 31, 2006 | Dec. 31, | Sep. 30, | Jun. 30, | Mar. 31, |
| | 2006 | 2006 | 2006 | | 2005 | 2005 | 2005 | 2005 |
| Total revenues ($) | 2,381,878 | 1,474,175 | 1,020,136 | 2,820,850 | 1,241,160 | 1,736,150 | 2,099,865 | 1,725,674 |
| Net income (loss) ($) | (4,764,608) | (647,577) | (818,156) | (239,463) | (711,477) | (1,098,682) | (713,013) | (295,636) |
| Earnings (loss) per share ($) | (0.08) | (0.01) | (0.01) | (0.00) | (0.01) | (0.02) | (0.02) | (0.01) |
| Diluted earnings (loss) per share ($) | (0.08) | (0.01) | (0.01) | (0.00) | (0.01) | (0.02) | (0.02) | (0.01) |
Sales were higher in the fourth quarter of 2006, compared to the fourth quarter of 2005 as YSC hired a new sales manager in the fall. The net loss increased substantially from $711,477 to $4,764,608, however, as the Company recognized an impairment loss of $4,328,622 on its long-lived assets. In addition, January and February are traditionally slower periods due to the Chinese New Year holiday. After continued electrical interruptions in January and the traditional shut down during the Chinese New Year festivities in February, YSC is now back at full operational capacity and is on track to produce and sell in excess of 6,000 mt in March. For the remainder of the year, production and sales will depend on market conditions. If market conditions remain favourable, YSC’s production should exceed 50,000 mt this year, a 20% increase over 2006.
| 5. | LIQUIDITY AND CAPITAL RESOURCES |
As of December 31, 2006, the Company maintained a balance of cash and cash equivalents of $11.0 million, of which $5.5 million is held in two major Canadian banks. There is $5.5 million held in YMC and YSC accounts with major banks in China, of which $4.5 million is deposited in Canadian dollars and $1.0 million is operation working capital in Chinese Renminbi. The Company has complete control over the disbursements from the YMC registered capital accounts.
The Company also has short-term investments of $15.5 million, which have more than 90 days maturity periods, with two major Canadian financial institutions. $15.1 million of the short-term investments are U.S. dollar denominated and $0.4 million is in Canadian dollar.
The following are commitments of the Company:
C apital commitments - contracted but not accounted for
| | | As at December 31, 2006 | |
| | | R M B | | | $ | |
| MAP project | | 2,960,000 | | | 379,241 | |
The Company entered into a construction contract for MAP project to manufacture MAP, a major intermediate material in fertilizer production in 2006. The total contracted amount is RMB 3.2 million, of which RMB 0.24 million was paid during 2006.
17
| Operating lease commitments | | | | | | |
| | | As at December 31, 2006 | |
| | | R M B | | | $ | |
| Within 1 year | | 111,657 | | | 14,306 | |
Lease commitment mainly represents the rental contracts signed for the lease of offices and apartments.
| Operating lease commitments | | | | | | |
| | | As at December 31, 2006 | |
| | | R M B | | | $ | |
| Within 1 year | | 75,633 | | | 9,690 | |
Lease commitment represents the rental contracts signed for the lease of 4 warehouses.
The Company did not have any off-balance sheet arrangements as of the end of 2006.
| 6. | TRANSACTIONS WITH RELATED PARTIES |
During the year ended December 31, 2006, some directors and officers of the Company received consulting fees for services rendered. A total of $141,377 was paid in 2006 to companies controlled by a director and an officer (2005 - $195,554; 2004 - $368,686). Account payable to these companies for the reimbursement of expenses were $1,807 at the end of 2006. Except the account receivable of RMB2,080,818 ($266,599) from YPCC, there was no other account receivables from the related parties.
On November 22, 2004, the Company became aware that the Agricultural Bank of China (the “Bank”) had made a RMB7,400,000 ($948,103) working capital loan (the “Xinyuan Loan”) to Xinyuan Chemicals (“Xinyuan”) for the purchase of raw materials. Xinyuan made a loan of the same amount to YPCC (the Company’s joint venture partner) the next day, more than a year before the date of the Company’s investment in Xinyuan to create YSC. YPCC made a loan of RMB4,475,375 ($554,673) to YSC (the “YSC Loan”) in January 2004.
The Xinyuan loan was exclusively for YPCC’s use and until the end of 2004 YPCC had been repaying both the principal and interest. The Company received a formal letter from YPCC on November 26, 2004 guaranteeing that YPCC would not hold the Company accountable for this loan. YSC has not benefited from this loan.
The three party YPCC-YSC-Agricultural Bank loan situation has now been resolved. YPCC cancelled the loan of RMB 4,370,508 ($541,676) owed to YPCC by YSC as at December 31, 2005. YSC applied this loan as a credit against the RMB 6,900,000 ($855,178) owed by YPCC to the Agricultural Bank. YSC made repayments to the Agricultural Bank of RMB 6,880,000 ($881,479) up to the end of December 2006. As at the end of 2006, the amount owed by YPCC and its subsidiaries was RMB 2,080,818 ($266,599).
In addition, the Company owes the third YSC Joint Venture partner Yuanfeng $19,642 for the acquisition of additional land use rights from Yuanfeng. The amount owed to Yuanfeng was $102,374 in 2005.
Yichang Spur Chemicals (YSC)
YSC produced 9,883 mt of NPK’s in the quarter ended December 31, 2006, an increase of 54% over the fourth quarter 2005 (6,424 mt) as the plant was closed for 53 days from October to mid-November in 2005 due to low demand.
Sales for the three months ended December, 2006 were $2,381,878 versus $1,241,160 in 2005, a 92% increase due to higher demand in 2006. Gross profit was $131,882 in the quarter ended December 31, 2006 vs. ($341,168) in the fourth quarter 2005 as there was a reserve for inventory written down of $255,793 in 2005. EBITDA was ($4,837,554) in the quarter ended December 31, 2006 compared to ($322,433) in the same period in 2005 as the Company recognized an impairment loss of $4,328,622 on its long-lived assets.
Spur Consolidated Results
The gross profit increased by $473,050 in the fourth quarter of 2006 compared to the same period in 2005 due to increased sales and reduced cost of production while the net loss for the three months ended December 31, 2006 increased by $4,053,131 to $4,764,608 due to the recognition of an impairment loss of $4,328,622. During the three months ended December 31, 2006, total expenses increased by $651,882 to $1,270,101 versus $618,219 of the fourth quarter of 2005. This is mainly attributable to the increase in depreciation and amortization to $88,509 in the fourth quarter of 2006 from $14,525 of the same period 2005 as the Company recognized depreciation in YMC to expense. Professional fees increased from $55,184 during the fourth quarter of 2005 to $237,300 in 2006 as the Company recognized some of its professional fees in YMC as expense. Rent increased from $34,965 in the fourth quarter of 2005 to $97,755 in 2006 as the Company recognized rent in YMC as expense. Wages and benefits increased to $213,587 during the fourth quarter of 2006 from $52,548 in 2005 as the Company engaged more people as compared with 2005. Interest income increased to $440,577 in the three months ended December 2006 from $199,162 for the same period in 2005 as the Company recognized some interest income in YMC as income. The foreign exchange gain was $105,151 in the fourth quarter of 2006, compared to a foreign exchange loss of $153,873 for the same period of 2005 when the Company reported in Canadian Dollars. The unrealized foreign exchange gain was mainly a result of the translation of the Company’s integrated joint ventures YMC and YSC using the temporal method.
18
| 8. | CHANGES IN ACCOUNTING POLICIES |
Effective January 1, 2006, Spur Ventures Inc. (the “Company”) changed its reporting currency to the U.S. dollar (USD). The change in reporting currency is to better reflect the Company’s business activities and to improve investors’ ability to compare the Company’s financial results with other publicly traded businesses in the industry. The Company holds most of its cash balances in USD deposits and conducts its Chinese operations in Chinese Renminbi (RMB). China revalued the RMB against the USD by 2.1% in July 2005 and introduced a managed float. Furthermore, the international currency of the agribusiness and mining industries is the USD. Prior to January 1, 2006, the Company reported its annual and quarterly consolidated balance sheets and the related consolidated statements of operations and shareholders’ equity and cash flows in the Canadian dollar (CAD). The related financial statements and corresponding notes prior to January 1, 2006 have been restated to USD for comparison to the 2006 financial results.
These previous consolidated financial statements have been translated to the USD in accordance with EIC 130 “Translation Method when the Reporting Currency Differs from the Measurement Currency or There is a Change in the Reporting Currency”. These guidelines require that the financial statements be translated into the reporting currency using the current rate method. Under this method, the income statement and the cash flow items for each year are translated into the reporting currency using the average rate in effect for the period, and assets and liabilities are translated using the exchange rate at the period end. All resulting exchange differences are reported as a separate component of shareholders’ equity titled Cumulative Translation Adjustment.
In January 2005, the CICA issued three new standards: “Financial instruments-recognition and measurement, hedges, and comprehensive income.” The main consequences of implementing standards are described below. The new standards will be effective for interim and annual financial statement commencing in 2007. Earlier adoption is permitted. Most significantly for the Company, the new standards will require presentation of a separate statement of comprehensive income. Investment in marketable securities will be recorded in the consolidated balance sheet at fair value. Changes in the fair value of marketable securities will be recorded in income and changes in the fair value of investments reported in comprehensive income.
| 9. | OUTSTANDING SHARE DATA |
| As of March 30, 2007, the Company had the following shares, warrants and options outstanding: |
| | Number | Exercise Price | Expiry Date |
| Common Shares | 58,740,520 | n/a | n/a |
| Stock Options | 1,700,000 | $0.60 | 6-May-08 |
| Stock Options | 435,000 | $1.20 | 19-Jun-08 |
| Stock Options | 1,250,000 | $1.50 | 23-Jul-09 |
| Stock Options | 200,000 | $1.50 | 31-Dec-08 |
| Stock Options | 500,000 | $1.80 | 1-Mar-10 |
| Stock Options | 200,000 | $1.50 | 16-Sep-10 |
| Stock Options | 200,000 | $1.50 | 14-Mar-11 |
| Stock Options | 625,000 | $1.03 | 3-Jul-11 |
| Stock Options | 350,000 | $0.64 | 3-Jan-12 |
| Warrants | 8,571,429 | $2.00 | 28-Jul-07 |
| TOTAL | 72,771,949 | | |
Under the 2005 Employee Stock Option Plan, the Company may grant options to its directors, officers, and service providers for up to 8,000,000 common shares or such additional amount as may be approved from time to time by the shareholders of the Company. Under the plan, the exercise price of each option is not less than the market price of the Company’s stock on the date of grant and an option’s maximum term is 5 years. The directors of the Company may determine and impose terms upon which each option shall become vested in respect of option shares. The stock based compensation relating to the options for the year ended December 31, 2006 amounted to $352,433.
The fair value of each option granted is estimated on the date of grant using the Black-Scholes option pricing model with assumptions for the grants as follows:
| | | 2006 | | | 2005 | | | 2004 | |
| Risk free interest rate | | 4.00% - 4.50% | | | 3.40% - 3.70% | | | 3.40% - 4.00% | |
| Expected life of options in years | | 5 years | | | 5 years | | | 5 years | |
| Expected volatility | | 49% - 51% | | | 48% - 52% | | | 47% - 58% | |
| Dividend per share | | $0.00 | | | $0.00 | | | $0.00 | |
On June 29, 2005, the Company entered into an agreement to acquire the fertilizer related assets of Hebei Tianren Chemical Corporation (“Tianren”), a Chinese holding company, and to merge the management teams and assets of both companies.
Assets to be acquired include:
| 1. | A 51% interest in Xinjiang Tianren Chemicals Ltd. (“Xinjiang”) which has a 100,000 tonne per annum (“tpa”) compound NPK plant in Xinjiang Uigur Autonomous Region. |
| 2. | A 75% interest in Tianding Chemical Company (“Tianding”) which has a 100,000 tpa compound NPK plant in Qinhuangdao, Hebei |
19
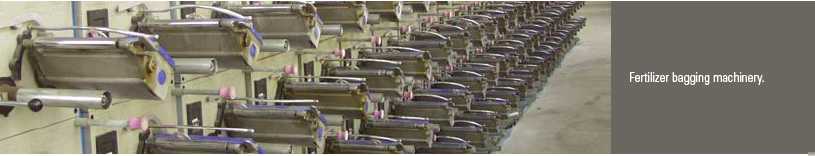
| Province. Tianding also has one of the largest fertilizer bagging facilities in China with current production under contract of over 28 million bags per annum for Tianren and other large fertilizer producers with long-term stable distribution contracts. The bagging plant generates a positive EBITDA and is a key part of the logistics of distributing fertilizers within the country. |
| 3. | An 80% direct interest in Tianren Agriculture Franchise Company (“TAFC”), a large fertilizer marketing company based in Qinhuangdao, |
| Hebei Province. In addition the Company will acquire a further 15% indirect interest through Tianding’s ownership of TAFC. |
| 4. | A 60% interest in Hubei Yichang Tianlong Industry Company, a raw materials sourcing and fertilizer trading company based in Yichang, Hubei Province where the Company’s current facilities are also located. |
The Company will acquire these assets in consideration for the issue to Tianren of approximately 15.5 million shares of the Company. These shares will be subject to an escrow period of 24 months and voting rights for those shares which at any one time exceed 19.9% of the issued shares of the Company will be restricted.
The transaction was negotiated at arm’s length and is subject to due diligence, TSX and all other regulatory approvals, and standard closing conditions.
The Chinese government implemented new regulations for share for share purchases in September of 2006 which clarified the process but required Spur and Hebei Tianren to commence a new application procedure. Spur knew this would be a pioneering approval process and it has turned out to be just that.
Formal applications have now been approved by the Qinhuangdao City Ministry of Commerce for Tianding Chemical Company and Tianren
Agriculture Franchise Company and by Yichang City for Hubei Yichang Tianlong Industry Company (“Tianlong”) and all are being reviewed by the relevant provincial authorities.
Xinjiang Tianren Chemical Company and its 100,000 mt NPK plant in northwest China will no longer be part of our transaction and the share allocation has been reduced accordingly from 15.5 M to 13.3M shares. New government policies in Xinjiang Uygur Autonomous Region dictating a switch from natural gas to coal to produce nitrogen for the NPK plant have made this entity no longer economically attractive to Spur.
Additional approvals under China’s WTO accession guidelines (which came into effect on December 11, 2006) will also be required for Tian-long, because it has a sulphuric acid import license, and for the Ag Franchise because it has distribution and sales rights in China.
To accommodate the additional time required for these Chinese approvals the merger deadline has been extended until September 30, 2007.
Approvals at the provincial and then central Ministry of Commerce levels are anticipated to be completed by mid-year.
Spur will retain earnings for the four Tinaren companies from June 01, 2006 until the merger is finally approved. However, because of a significant down turn in the commodity fertilizer cycle in China, 2006 and 2007 earnings will be less than 50% compared to 2005 when the merger process began. These lower earnings are a disappointment to Spur and are being reviewed in the context of the original perceived value of the merger.
Spur firmly believes that only those firms that control of their own raw materials, have production facilities with economies of scale and that can deliver their products effectively to the market, will be successful. Because of these first two criteria Spur is focusing on the YMC Project and the latter criterion is the reason for the merger with Hebei Tianren.
Spur is exploring new territory accessing a natural resource in China and seeking approval for a share for share purchase under new Chinese guidelines.
The clock started ticking for the mining licence transfer in early 2005 after the two mining licenses had been formally issued and Spur made its first Registered Capital contribution. It has been two years since the mining license transfer process was initiated, and that is not a long time for the transfer of a natural resource anywhere in the world and certainly not in China.
The key drivers for the YMC Project remain the continued growth of the 12 million mt/yr NPK market in China. NPK demand has been growing at approximately 10% each year but still represents only 20% of the compound fertilizers sold in China. The Chinese government wants this to increase to 50% by 2010 to ensure a 25% increase in crop production to feed China’s growing population. In 2006 China imported 1.95 million mt of NPK’s at an average price 15% higher than domestic NPK product so there is another growth opportunity through import substitution.
Both the trend towards higher quality and analysis fertilizers and the import substitution opportunity are viewed as strong justification for Spur continuing its work at both YSC and YMC.
In addition, global fertilizer markets had a very strong showing in 2006 with today’s DAP prices up from 35% (fob Morocco) to 60% (fob Tampa) and urea up approximately 45% year over year. Because of these strong international prices Chinese DAP producers are exporting more DAP which is resulting in stronger NPK demand in China in 2007.
The focus of Spur’s strategy remains the Yichang Integrated Phosphate Project of YMC. Spur will be fully integrated from mining through flexible manufacturing to the market place. Flexible manufacturing means that Spur may produce MAP rather than NPK’s because MAP can be sold directly to other NPK producers or exported to SE Asia. MAP represents 90% of the phosphate source for NPK production.
After continued electrical interruptions in January and the traditional shut down during the Chinese New Year festivities in February, YSC is now back at full operational capacity and is on track to produce and sell in excess of 6,000 mt in March. If market conditions remain favour-
20
able, YSC’s production should exceed 50,000 mt this year, a 20% increase over 2006.
While Spur continues to work on the YMC Project, we are also advancing our vision to be “The Fastest Growing Integrated Supplier of Plant Nutrients for the Chinese Farmer.” In January, David Zeng joined Spur to lead our drive to supply specialty plant nutrient products as Spur develops its “bundling” concepts and drives down the value chain.
Spur is continuing its transition from being a mining company to being fully integrated from mining through production into the market place, with an emphasis on being a market driven and customer focused company.
| 12. | DISCLOSURE CONTROLS AND PROCEDURES |
During the year ended December 31, 2005, the Company’s General Counsel and Corporate Secretary completed an evaluation of the effectiveness of the Company’s existing disclosure controls and procedures, undertook extensive research and made recommendations to the Company’s CEO and Board of Directors. Based on those recommendations, a draft corporate disclosure policy was presented to the Company’s board and adopted in late December 2005.
With the new disclosure policy in place, management is reasonably confident that material information relating to the Company, including its consolidated subsidiaries, will be made known to senior management in a timely manner, and that the Company’s disclosure controls and procedures will be effective not only with respect to the Company’s annual filing requirements but on an ongoing basis.
The Company’s business is in China, which despite recent government policy changes carries risk for foreign owned operations.
China Has an Evolving Legal Structure
Many laws and regulations dealing with economic matters in general, and foreign investment in particular, have been promulgated, including changes to the Constitution of China to authorize foreign investment and to guarantee “the lawful rights and interests” of foreign investors in China. Nevertheless, China does not have a comprehensive system of laws, and the legal and judicial systems in China in respect of commercial laws are rudimentary. In addition, enforcement of existing laws may be uncertain and sporadic, and may be subject to domestic politics.
China is an Emerging Economy
Although the Chinese economy has experienced significant growth in the recent past, such growth has been uneven among various sectors of the economy and geographic regions. The central government and even provincial and municipal governments continue to play a signifi-cant role in the planning of the economy, not always in a coordinated fashion.
Investment in China Can Be Affected By Significant Political, Economic and Social Uncertainties
Any change in laws and policies by the Chinese government could affect the Company’s investment in China. Circumstances such as a change in leadership, social or political disruption may benefit or limit the Chinese government’s abilities to pursue such policies.
Need to Obtain Permits and Licenses
Although China is progressing towards a market-oriented economy, it is still a centrally planned economy. The operations of the Company require government review, licenses and permits from various government agencies.
Chinese Costs
There continues to be “made in China” pricing for raw materials, minerals and fertilizers which differs from international prices. The continued rapid growth in the Chinese economy is affecting both fertilizer input prices and international freight rates for imports.
Additional risk factors can be found in the Company’s Form 20-F, and filed with Canadian security commissions on SEDAR at www.sedar. com and with the United States Securities and Exchange Commission at www.sec.gov/edgar.
21
MANAGEMENT’S RESPONSIBILITY FOR FINANCIAL REPORTING
The accompanying consolidated financial statements of the company have been prepared by management in accordance with Canadian generally accepted accounting principles and include a summary prepared by management reconciling significant differences between Canadian and United States generally accepted accounting principles as they affect these financial statements. The financial statements contain estimates based on management’s judgement. Management maintains an appropriate system of internal controls to provide reasonable assurance that transactions are authorized, assets safeguarded, and proper records maintained.
The Audit Committee of the Board of Directors has met with the company’s independent auditors to review the scope and results of the annual audit and to review the consolidated financial statements and related financial reporting matters prior to submitting the consolidated financial statements to the Board for approval.
The company’s independent auditors, PricewaterhouseCoopers LLP, are appointed by the shareholders to conduct an audit of the annual financial statements, and their report follows.
Robert J. Rennie
President & CEO
March 30, 2007
22
INDEPENDENT AUDITORS’ REPORT
We have audited the consolidated balance sheets of Spur Ventures Inc. as at December 31, 2006 and 2005 and the consolidated statements of operations and deficit and cash flows for each of the three years in the period ended December 31, 2006. These financial statements are the responsibility of the company’s management. Our responsibility is to express an opinion on these financial statements based on our audits.
We conducted our audits in accordance with Canadian generally accepted auditing standards and the standards of the Public Company Accounting Oversight Board (United States). Those standards require that we plan and perform an audit to obtain reasonable assurance whether the financial statements are free of material misstatement. An audit includes examining, on a test basis, evidence supporting the amounts and disclosures in the financial statements. An audit also includes assessing the accounting principles used and significant estimates made by management, as well as evaluating the overall financial statement presentation. We believe our audits provide a reasonable basis for our opinion.
In our opinion, these consolidated financial statements present fairly, in all material respects, the financial position of the company as at December 31, 2006 and 2005 and the results of its operations and its cash flows for each of the three years in the period ended December 31, 2006 in accordance with Canadian generally accepted accounting principles.

Chartered Accountants
Vancouver, British Columbia
March 30, 2007
Comments by Auditors for U.S. Readers on Canada-U.S. Reporting Difference
In the United States, reporting standards for auditors require the addition of an explanatory paragraph (following the opinion paragraph) when there is a change in accounting principles that has a material effect on the comparability of the company’s financial statements, such as the change described in note 2 to the financial statements. Our report to the shareholders dated March 30, 2007 is expressed in accordance with Canadian reporting standards which do require a reference to such a change in accounting principles in the auditor’s report when the change is properly accounted for and adequately disclosed in the financial statements.
23
CONSOLIDATED BALANCE SHEETS
AS AT DECEMBER 31, 2006 AND 2005 (EXPRESSED IN U.S. DOLLARS)
| | | 2006 | | | 2005 | |
| | | | | | | |
| ASSETS | | | | | | |
| Current | | | | | | |
| Cash and cash equivalents (note 3) | $ | 10,994,262 | | $ | 24,988,099 | |
| Short-term investments (note 4) | | 15,503,683 | | | 5,767,612 | |
| Accounts receivable | | 1,247,384 | | | 401,787 | |
| Inventory (note 5) | | 2,429,443 | | | 2,604,680 | |
| Prepaid expenses | | 599,116 | | | 280,268 | |
| Due from YPCC (Note 10) | | 266,599 | | | 316,327 | |
| | | 31,040,487 | | | 34,358,773 | |
| Property, plant & equipment - net (Note 6) | | 4,056,955 | | | 8,574,372 | |
| Land use right - net (Note 7) | | 340,608 | | | 691,583 | |
| Mineral properties (Note 8) | | 3,112,768 | | | 2,557,660 | |
| Deferred acquisition costs (note 9) | | 447,834 | | | 339,964 | |
| Other assets | | 44,019 | | | 80,907 | |
| | | | | | | |
| | $ | 39,042,671 | | $ | 46,603,259 | |
| LIABILITIES | | | | | | |
| Current | | | | | | |
| Accounts payable and accrued liabilities | $ | 1,526,529 | | $ | 2,106,716 | |
| Customer deposits | | 682,709 | | | 139,963 | |
| Other payables | | 189,484 | | | 273,611 | |
| Bank loans (Note 11) | | 1,270,970 | | | 2,664,684 | |
| | | 3,669,692 | | | 5,184,974 | |
| Minority interest | | - | | | 506,671 | |
| SHAREHOLDERS' EQUITY | | | | | | |
| Capital stock (Note 12) | | | | | | |
| Authorized - | | | | | | |
| Unlimited number of Common shares without par value | | | | | | |
| Unlimited number of Preferred shares without par value | | | | | | |
| Issued - | | | | | | |
| 58,740,520 Common shares (2005: 58,090,520) | | 39,822,134 | | | 39,256,667 | |
| Stock options and warrants (note 12 (c) and (d)) | | 7,293,323 | | | 7,039,072 | |
| Cumulative translation adjustment | | 3,712,546 | | | 3,601,095 | |
| Deficit | | (15,455,024 | ) | | (8,985,220 | ) |
| | | 35,372,979 | | | 40,911,614 | |
| | $ | 39,042,671 | | $ | 46,603,259 | |
Nature of operations (note 1)
Commitments (note 18)
Subsequent events (note 19)
Approved by the Board of Directors

| Robert J. Rennie, | Robert G. Atkinson, |
| Director | Director |
The accompanying notes are an integral part of these consolidated financial statements.
24
CONSOLIDATED STATEMENTS OF OPERATIONS AND DEFICIT
FOR THE YEARS ENDED DECEMBER 31, 2006, 2005 AND 2004 (EXPRESSED IN U.S. DOLLARS)
| | | 2006 | | | 2005 | | | 2004 | |
| | | | | | | | | | |
| | | | | | | | | | |
| Sales | $ | 7,697,039 | | $ | 6,802,849 | | $ | 3,695,981 | |
| Cost of sales | | 7,522,658 | | | 6,735,427 | | | 3,734,596 | |
| Gross Profit / (Loss) | | 174,381 | | | 67,422 | | | (38,615 | ) |
| | | | | | | | | | |
| Expenses | | | | | | | | | |
| Consulting fees | | 172,566 | | | 144,847 | | | 272,890 | |
| Depreciation and amortization | | 332,760 | | | 106,128 | | | 44,587 | |
| Loss on disposal of fixed assets | | 41,633 | | | 3,061 | | | 9,840 | |
| Interest | | 207,364 | | | 173,842 | | | 146,985 | |
| Office and miscellaneous | | 518,401 | | | 407,727 | | | 172,132 | |
| Printing and mailing | | 41,368 | | | 41,341 | | | 24,426 | |
| Professional fees | | 621,795 | | | 227,600 | | | 138,871 | |
| Rent | | 238,593 | | | 84,616 | | | 37,896 | |
| Repairs and maintenance | | 32,102 | | | 43,217 | | | 13,933 | |
| Selling expenses | | 331,938 | | | 266,506 | | | 103,056 | |
| Stock-based compensation expenses | | 352,433 | | | 629,557 | | | 965,988 | |
| Transfer agent and filing fees | | 141,831 | | | 24,361 | | | 29,963 | |
| Travel, advertising and promotion | | 247,253 | | | 237,400 | | | 175,126 | |
| Wages and benefits | | 760,087 | | | 400,303 | | | 126,244 | |
| | | 4,040,124 | | | 2,790,506 | | | 2,261,937 | |
| | | | | | | | | | |
| Operating loss | | (3,865,743 | ) | | (2,723,084 | ) | | (2,300,552 | ) |
| | | | | | | | | | |
| Other income and expenses | | | | | | | | | |
| Gain on disposal of marketable securities | | | | | | | | 1,793 | |
| Interest income | | 1,168,316 | | | 366,266 | | | 141,095 | |
| Energy trust income | | | | | | | | 634 | |
| Other income | | | | | | | | 69,659 | |
| Impairment of long-lived a ssets (Note 6 & 7) | | (4,328,622 | ) | | | | | | |
| Foreign exchange gain (loss) | | 93,939 | | | (785,345 | ) | | 63,702 | |
| | | (3,066,367 | ) | | (419,079 | ) | | 276,883 | |
| | | | | | | | | | |
| Loss before minority interest | | (6,932,110 | ) | | (3,142,163 | ) | | (2,023,669 | ) |
| Minority interest | | 462,306 | | | 323,357 | | | 159,631 | |
| Loss for the year | | (6,469,804 | ) | | (2,818,806 | ) | | (1,864,038 | ) |
| | | | | | | | | | |
| Deficit, Beginning of year, restated (Note 2) | | (8,985,220 | ) | | (6,166,414 | ) | | (3,299,212 | ) |
| Stock -based compensation expenses | | | | | | | | (1,003,164 | ) |
| Deficit, Beginning of year, restated (Note 2) | | (8,985,220 | ) | | (6,166,414 | ) | | (4,302,376 | ) |
| | | | | | | | | | |
| Deficit, End of year | $ | (15,455,024 | ) | $ | (8,985,220 | ) | $ | (6,166,414 | ) |
| | | | | | | | | | |
| Basic and diluted loss per common share | $ | (0.11 | ) | $ | (0.06 | ) | $ | (0.05 | ) |
| | | | | | | | | | |
| Weighted average number of common shares outstanding | | 58,480,520 | | | 47,857,350 | | | 34,267,111 | |
The accompanying notes are an integral part of these consolidated financial statements.
25
CONSOLIDATED STATEMENT OF CASH FLOWS
FOR THE YEARS ENDED DECEMBER 31, 2006, 2005, 2004
| | | 2006 | | | 2005 | | | 2004 | |
| | | | | | | | | | |
| | | | | | | | | | |
| Cash flows from operating activities | | | | | | | | | |
| Net loss | $ | (6,469,804 | ) | $ | (2,818,806 | ) | $ | (1,864,038 | ) |
| Items not affecting cash | | | | | | | | | |
| Depreciation and amortization | | 801,320 | | | 475,364 | | | 223,102 | |
| Stock-based compensation | | 352,433 | | | 629,557 | | | 965,988 | |
| Foreign exchange (gain)/loss | | (543,354 | ) | | 785,345 | | | - | |
| Loss on disposal of fixed assets | | 41,633 | | | 14,590 | | | (9,840 | ) |
| Impairment of long-lived assets | | 4,328,622 | | | | | | | |
| Net changes in non-cash working capital | | | | | | | | | |
| Accounts receivable | | (851,653 | ) | | (169,325 | ) | | 108,268 | |
| Inventory | | 240,145 | | | (1,772,227 | ) | | (340,224 | ) |
| Prepaid expenses | | (307,893 | ) | | (191,631 | ) | | 287,125 | |
| Accounts payable and accrued liabilities | | (625,268 | ) | | 1,071,475 | | | 276,597 | |
| Customers deposits | | 552,643 | | | (282,439 | ) | | 275,439 | |
| Minority interest | | (335,193 | ) | | (318,549 | ) | | (159,631 | ) |
| Other Operating | | (33,579 | ) | | 258,296 | | | 40,151 | |
| | | (2,849,948 | ) | | (2,318,350 | ) | �� | (197,063 | ) |
| Cash flows from investing activities | | | | | | | | | |
| Investment in subsidiaries | | | | | | | | (522,854 | ) |
| Capital expenditures | | (771,636 | ) | | (2,663,290 | ) | | (3,738,802 | ) |
| Acquisition of other assets | | (113,064 | ) | | (414,768 | ) | | - | |
| Proceeds from disposal of assets and investments | | 1,208,228 | | | 4,501,531 | | | 90,326 | |
| Purchase of short-term investments | | (11,093,962 | ) | | (5,731,725 | ) | | (4,234,612 | ) |
| | | (10,770,434 | ) | | (4,308,252 | ) | | (8,405,942 | ) |
| Cash flows from financing activities | | | | | | | | | |
| Issuance of shares for cash - net of issue costs | | 461,275 | | | 23,569,778 | | | 12,113,060 | |
| Bank indebtedness repayment | | (1,461,304 | ) | | (607,696 | ) | | (48,329 | ) |
| | | (1,000,029 | ) | | 22,962,082 | | | 12,064,731 | |
| | | | | | | | | | |
| Effect of exchange rate changes | | 626,575 | | | 772,107 | | | 576,654 | |
| | | | | | | | | | |
| Increase (decrease) in cash and cash equivalents | | (13,993,836 | ) | | 17,107,587 | | | 4,038,380 | |
| | | | | | | | | | |
| Cash and cash equivalents, beginning of period | | 24,988,099 | | | 7,880,512 | | | 3,842,132 | |
| | | | | | | | | | |
| Cash and cash equivalents, end of period | | 10,994,263 | | | 24,988,099 | | | 7,880,512 | |
| | | | | | | | | | |
| Supplemental cash flow disclosure | | | | | | | | | |
| Interest received | | 1,119,807 | | | 310,371 | | | 141,095 | |
| Interest paid | | (322,162 | ) | | (141,773 | ) | | (122,408 | ) |
26
Spur Ventures Inc. (the company) is developing a fully integrated fertilizer business in the People’s Republic of China (China). The recoverability of the amounts shown as mineral properties is dependent upon the existence of economically recoverable reserves, the ability of the company to obtain the necessary financing to complete the development of the properties, and future profitable production or proceeds from the sale of fertilizer products.
Management acknowledges that for the Yichang Phosphate Project to be successful it will require significant equity and/or debt financing. Management has successfully raised financing in the past for the early stages of this project; however, there is no assurance that the company will be successful in raising this financing in the future. Management considers that the company has sufficient funding to meet its obligations and maintain administrative and operational expenditures for at least the next 12 months.
In addition, the company has entered into agreements securing the title of the mineral properties, by forming a 78.72% controlled Joint Venture Company, Yichang Maple Leaf Chemicals Ltd. (YMC), with Hubei Yichang Phosphorous Chemical Co. Ltd. (YPCC) in December 2003 to undertake the development of the phosphate mines and to build compound phosphate fertilizer production facilities. YMC has not yet commenced active operations. The titles to the two primary mining properties are legally in the possession of our Joint Venture partner, YPCC, and are in the process of being formally transferred to YMC. Although these arrangements are in accordance with industry standards for the stage of development of such properties, these procedures do not guarantee the company’s title. Property title may also be subject to unregistered prior agreements and regulatory requirements.
To accelerate the production of compound fertilizers, the company acquired Xinyuan Chemicals Ltd. in 2004 and formed a 72.18% controlled Joint Venture Company called Yichang Spur Chemicals Ltd. (YSC), which owns a 100,000 tonnes per annum (tpa) NPK (Nitrogen, Phosphate, Potassium) fertilizer facility, The other two minority partners are YPCC which owns 16.69% and Yichang Yuanfeng Chemical (Yuanfeng) which owns 11.13% .
| 2. | SIGNIFICANT ACCOUNTING POLICIES |
Change In Reporting Currency To The U.S. Dollar
Effective January 1, 2006, Spur Ventures Inc. (the “Company”) changed its reporting currency to the U.S. dollar (USD). The change in reporting currency is to better reflect the company’s business activities and to improve investors’ ability to compare the Company’s financial results with other publicly traded businesses in the industry. The Company holds most of its cash balances in USD deposits and conducts its Chinese operations in Chinese Renminbi (RMB). China revalued the RMB against the USD by 2.1% in July 2005 and introduced a managed float. Furthermore, the international currency of the agribusiness and mining industries is the USD. Prior to January 1, 2006, the Company reported its annual and quarterly consolidated balance sheets and the related consolidated statements of operations and shareholders’ equity and cash flows in the Canadian dollar (CAD). The related financial statements and corresponding notes prior to January 1, 2006 have been restated to USD for comparison to the 2006 financial results.
These previous consolidated financial statements have been translated to the USD in accordance with EIC 130 “Translation Method when the Reporting Currency Differs from the Measurement Currency or There is a Change in the Reporting Currency”. These guidelines require that the financial statements be translated into the reporting currency using the current rate method. Under this method, the income statement and the cash flow items for each year are translated into the reporting currency using the average rate in effect for the period, and assets and liabilities are translated using the exchange rate at the period end. All resulting exchange differences are reported as a separate component of shareholders’ equity titled Cumulative Translation Adjustment.
Principles of Consolidation and Preparation of Financial Statements
These consolidated financial statements are prepared in accordance with Canadian generally accepted accounting principles (GAAP) and differ in certain material respects from the requirements of United States GAAP, as disclosed in note 16.
These consolidated financial statements include the accounts of the company, its two sino-foreign Joint Venture companies, YSC and YMC, which are controlled by the company, and its wholly owned subsidiary, Spur Chemicals (BVI) Inc. All significant inter-company transactions and accounts have been eliminated. YSC is dependent on Spur’s cash injections for working capital and repayments of loans, to which some of YSC’s assets are pledged as collateral at September 30, 2006 (Note 11). Certain comparative figures have been reclassified to conform to the current period’s presentation.
Use of Estimates
The preparation of financial statements in conformity with generally accepted accounting principles requires management to make estimates and assumptions that affect the reported amounts of assets and liabilities and disclosure of contingent liabilities at the date of the financial statements, and the reported amounts of revenues and expenditures during the reporting period. Items subject to significant management estimates include the amounts recorded for stock based compensation and the assessment of recoverable values. Actual results could differ from those reported.
Cash and Cash Equivalents
Cash and cash equivalents consist of cash and short term deposits maturing within ninety days of the original date of acquisition and are stated at cost, which approximates fair value. To limit its foreign exchange and credit exposure, the company deposits its funds with large financial institutions in either US dollars or Canadian dollars.
Short Term Investments
Short term investments with an original maturity of greater than 90 days and less than 1 year are stated at cost, which approximates fair value.
Inventory
Inventory, consisting primarily of fertilizers and raw materials, is valued at the lower of cost and net realizable value. Net realizable value represents the estimated selling price in the ordinary course of business less the estimated costs of completion and the estimated costs necessary to make the sale. Cost is calculated using the weighted average method comprising all costs of purchases, costs of conversion
27
and other costs incurred, including overhead allocation, in bringing the inventories to their present location and condition.
Property, Plant and Equipment
Property, plant and equipment assets are recorded at cost less accumulated depreciation. Depreciation is computed using the straight line method at the following rates calculated to depreciate the cost of the assets less their residual values over their estimated useful lives:
| Building | 5.00% |
| Machinery and equipment | 8.33% - 10.00% |
| Motor vehicle | 20.00% |
| Office equipment and furniture | 20.00% |
| Computer equipment | 33.33% |
| Leasehold improvement | 20.00% |
Land Use Right
The land use right is for 50 years. It is amortized on a straight line basis over the initial term of the YSC business license of 30 years.
Impairment of Long Lived Assets
Management of the company regularly reviews the net carrying value of each long lived asset. Where information is available and conditioned losses suggest impairment, estimated future net cash flows are calculated using estimated future prices, proven and probable reserves, selling prices for fertilizer products, and operating, capital and reclamation costs on an undiscounted basis to determine if the carrying amount is not recoverable. If the carrying amount exceeds the sum of the undiscounted cash flows expected to result from its use and eventual disposal, reductions in the carrying value of long lived assets would be recorded to the extent the net book value of the related assets exceeds its fair value estimated by the net present value of expected future net cash flows.
Where estimates of future net cash flows are not available and where other conditions suggest impairment, management assesses if the carrying value can be recovered.
Management’s estimates of mineral prices, recoverable proven and probable reserves, selling prices for fertilizer products, and operating, capital and reclamation costs are subject to certain risks and uncertainties which may affect the recoverability of long lived assets. Although management has made its best estimate of these factors, it is possible that changes could occur in the near term, which could adversely affect management’s estimate of the net cash flow to be generated from its assets.
Mineral Properties
The company records its interest in mineral properties at cost. Exploration and development expenditures relating to properties with mineralization are deferred and will be amortized against future production following commencement of commercial production, or written off if the properties are sold, allowed to lapse, abandoned or if impairment is evident.
The acquisition of title to mineral properties is a detailed and time-consuming process. The titles of the mining properties have been issued to our Joint Venture Company partner, YPCC, for the exclusive use of YPCC’s equity contribution to the YMC Joint Venture. In Canada, our sino-foreign joint venture agreement with YPCC would be sufficient protection to proceed with mining but in China, for greater certainty, we are ensuring the formal transfer of the titles from YPCC to the YMC joint venture. This is a time-consuming process required only for foreign investors in China.
Asset Retirement Obligations
The accounting for asset retirement obligations encompasses the accounting for the Company’s legal obligations associated with the retirement of a tangible long-lived asset that results from the acquisition, construction or development and/or the normal operation of a long-lived asset. The retirement of a long-lived asset is its other than temporary removal from service, including its sale, abandonment, recycling or disposal in some other manner.
According to current Chinese environmental regulations and contracts of the company, there is no obligation for the company to dismantle and remove plant and equipment or to remediate sites upon the cessation of operations. The company pays an annual environmental fee to the local government as the cost of operating a chemical site. This fee is calculated as a percentage of the annual revenues and is expensed as incurred. Future changes to Chinese environmental regulation may have a material impact on the assessment of asset retirement obligations.
Loss Per Common Share
The basic loss per share is computed by dividing the net loss by the weighted average number of common shares outstanding during the year. The diluted loss per share reflects the potential dilution of common share equivalents, such as outstanding stock options and share purchase warrants, in the weighted average number of common shares outstanding during the year, if exercised. For this purpose, the “treasury stock method” is used whereby the assumed proceeds upon the exercise of stock options and warrants are used to purchase common shares at the average market price during the year.
For the years ended December 31, 2006, 2005 and 2004, the company excluded potential common share equivalents from the loss per share calculation as they were considered anti-dilutive.
28
Income Taxes
The company follows the asset and liability method for accounting for income taxes. Under this method, future income tax assets and liabilities are determined based on the differences between the tax basis of assets and liabilities and the amounts reported in the financial statements. The future tax assets or liabilities are calculated using the tax rates for the periods in which the differences are expected to be settled. Future tax assets are recognized to the extent that they are considered more likely than not to be realized.
Revenue Recognition
The company recognizes revenues to external customers when the product is shipped and title passes along with the risks and rewards of ownership, provided collection is reasonably assured. The above conditions are met when persuasive evidence of an arrangement exists, delivery has occurred, and the price is fixed or determinable. Transportation costs are recovered from the customer through product pricing.
Foreign Currency Translations
The consolidated financial statements are presented in U.S. dollars (USD).
While the Company’s fertilizer subsidiary YSC was considered a self-sustaining operation prior to March 31, 2006, it is now considered an integrated operation due to a significant change in the financial condition of YSC. Foreign currency translation of YSC was prospectively changed from the current rate method to the temporal method. Under the temporal method, monetary assets and liabilities are translated at period-end exchange rates and items included on the statements of operations and cash flows are translated at rates in effect at the time of the transaction. Non-monetary assets and liabilities are translated at historical rates. The gain or loss on translation is charged to the statement of operations.
YMC is considered an integrated operation and is translated into Canadian dollars using the temporal method. Under this method, monetary assets and liabilities are translated at year-end exchange rates and items included on the statements of operations and cash flows are translated at rates in effect at the time of the transaction. Non-monetary assets and liabilities are translated at historical rates. The gain or loss on translation is charged to the statement of operations.
Financial Instruments
The carrying values of cash and cash equivalents, short term investments, accounts receivable, and accounts payable and accrued liabilities approximate their fair values due to the short periods to maturity. Bank loans are carried at current value, as discussed in notes 10 and 11.
Stock Based Compensation
Effective January 1, 2004, the company adopted the new requirements of the Canadian Institute of Chartered Accountants (CICA) Standard 3870, which requires an expense to be recognized in the financial statements for all forms of employee stock based compensation. Previously, the company did not record any compensation cost on the granting of stock options to employees and directors as the exercise price was equal to or greater than the market price at the date of the grants.
Accordingly, the opening deficit for 2004 was restated on a retroactive basis to show the effect of compensation expense associated with stock option grants to employees and directors from January 1, 2002 to December 31, 2003, which amounted to $1,003,164, and an increase of $73,197 to share capital and $935,641 to stock options.
Variable Interest Entities
Effective January 1, 2005, the company adopted Accounting Guideline AcG-15, Consolidation of Variable Interest Entities, which establishes when a company should consolidate a variable interest entity in its financial statements. AcG 15 provides the definition of a variable interest entity to be consolidated if a company is at risk of absorbing the variable interest entity’s expected losses, or is entitled to receive a majority of the variable interest entity’s returns or both. The company has determined that it has no variable interest entities.
| 3. | CASH AND CASH EQUIVALENTS |
Cash and cash equivalents of $10,994,262 includes Guaranteed Investment Certificates (GIC’s) with major Canadian financial institutions. Included in cash balances is a balance of approximately $5,498,000 held in accounts in the Chinese subsidiaries, the repatriation to Canada of which is subject to the approval of the State Administration of Foreign Exchange.
| 4. | SHORT-TERM INVESTMENTS |
Short-term investments of $15,503,683 consist of GIC’s and US Treasury Bills, with more than 90 days maturity periods.
| | | 2006 | | | 2005 | |
| | | $ | | | $ | |
| Raw materials | | 578,122 | | | 897,751 | |
| Finished goods | | 1,740,663 | | | 1,600,149 | |
| Other consumables | | 110,658 | | | 106,780 | |
| | | 2,429,443 | | | 2,604,680 | |
29
In the year 2006, the company recorded $33,578 in Cost of Sales for an inventory write-down due to the decrease in NPK fertilizer price.
| 6. | PROPERTY, PLANT AND EQUIPMENT |
| | December 31, 2006 | | December 31, 2005 |
| | | | Net Book | | Net Book | | | | |
| | | Accumulated | Value before | | Value after | | | Accumulated | Net Book |
| | Cost | Amortization | impairment | Impairment | impairment | | Cost | Amortization | Value |
| | | | | | | | | | |
| Building | $ 3,649,129 | $ 366,800 | $ 3,282,329 | $ 1,686,001 | $ 1,596,328 | | $ 3,373,561 | $ 188,963 | $ 3,184,598 |
| Construction in progress | 283,412 | - | 283,412 | 68,312 | 215,100 | | 500,604 | - | 500,604 |
| Machinery and equipment | 5,288,130 | 1,011,040 | 4,277,090 | 2,196,972 | 2,080,118 | | 5,262,997 | 548,523 | 4,714,474 |
| Motor vehicle | 136,446 | 41,284 | 95,162 | 5,763 | 89,399 | | 103,180 | 23,655 | 79,525 |
| Office equipment and furniture | 111,305 | 47,643 | 63,662 | 11,933 | 51,729 | | 90,851 | 26,419 | 64,432 |
| Leasehold improvement | 32,374 | 8,093 | 24,281 | - | 24,281 | | 32,357 | 1,618 | 30,739 |
| | | | | | | | | | |
| Total PP& E | $ 9,500,796 | $ 1,474,860 | $ 8,025,936 | $ 3,968,981 | $ 4,056,955 | | $ 9,363,550 | $ 789,178 | $ 8,574,372 |
An impairment loss of property, plant and equipment was recognized during the year as the carrying amount exceeded the sum of the un-discounted cash flows expected to result from its use and eventual disposition and exceeded its fair value which was determined by taking into account an estimate of the series of future cash flows at different times, expectations about possible variations in the amount or timing of those cash flows, the time value of money, represented by the risk-free rate of interest, and the price for bearing the uncertainty inherent in the asset.
| | December 31, 2006 | | December 31, 2005 |
| | | | Net B ook | | Net Book | | | | |
| | | Accumulated | Value befor e | | Value after | | | Accumulated | Net Book |
| | Cost | Amor tization | Impair ment | Impair ment | Impair ment | | Cost | Amor tization | Value |
| | | | | | | | | | |
| Land Use Rights | $ 758,643 | $ 58,394 | $ 700,249 | $ 359,641 | $ 340,608 | | $ 723,121 | $ 31,538 | $ 691,583 |
Land use rights refer to the ability of the company to operate a fertilizer and phosphoric acid facility on the YSC property for a period of 50 years. These land use rights are provided by the municipal government and are being amortized over the initial 30 year term of YSC’s business license as this is currently believed to approximate the estimated useful life.
An impairment loss of land use rights was recognized during the year as the carrying amount exceeded the sum of the undiscounted cash flows expected to result from its use and eventual disposition and exceeded its fair value which was determined by taking into account an estimate of the series of future cash flows at different times, expectations about possible variations in the amount or timing of those cash flows, the time value of money, represented by the risk-free rate of interest, and the price for bearing the uncertainty inherent in the asset.
| | | $ | |
| Exporation and development costs | | | |
| Balance - December 31, 2004 | | 2,008,422 | |
| Mining licence transfer cost | | 549,238 | |
| | | | |
| Balance - December 31, 2005 | | 2,557,660 | |
| Mining licence transfer cost | | 555,108 | |
| | | | |
| Balance - December 31, 2006 | | 3,112,768 | |
In 1996, the company entered into an agreement with YPCC for the exclusive right to develop the Yichang phosphate deposit, which is located in Hubei province in China. The company can earn a 90% interest in the property by taking the property to production. The Chinese government will earn a 10% interest by contributing land and the mineral rights.
In 1999, the company completed the preliminary feasibility study report conducted jointly by the Northern China Chemical Mine Planning and Design Institute and China Wuhan Chemical Engineering Corp. Final project approval was also received from the Chinese government. In November 2000, a feasibility study and an environmental impact assessment study were completed. During 2001, the China Environment Protection Bureau approved the environmental study of the Yichang project. In April 2002, a feasibility study was updated by Jacobs Engineering Corporation.
In early 2002, the company commenced its application for a mining permit through YPCC. In 2003, the company and YPCC formed a Joint
30
Venture Company, YMC, to undertake the development of the project. The mining licenses for the Shukongping and Dianziping mines were issued by Central Land and Resources Department to Spur’s JV partner YPCC in February and October of 2004 respectively. In March of 2005 the official transfer process from YPCC to YMC began when Spur contributed its first 15% of Registered Capital to YMC.
Since inception, all activities at YMC have been centered on the mining license transfer, with costs incurred in engineering studies, coordination of government relations and public relations activities. All YMC costs have been classified as mining exploration costs and capitalized to mineral properties.
| 9. | DEFERRED ACQUISITION COSTS |
The amount of $447,834 in deferred acquisition costs related to due diligence, legal opinions, and other costs in connection with the proposed Tianren acquisition. In June 2005, the company signed a binding agreement to acquire the fertilizer related businesses of Hebei Tianren Chemical Corporation, a Chinese holding company and to merge the management teams and assets of both companies. Commercial and legal due diligence was completed late in the fourth quarter. The company continues to work with Hebei Tianren and the Chinese authorities on the approval processes. If the acquisition is closed, these costs will be allocated to the identifiable assets acquired and liabilities assumed. If the negotiation indicates the transaction will most likely not be closed, the company will expense all the expenditures related to the proposed acquisition at that time.
| 10. | AMOUNTS OUSTANDING TO MINORITY SHAREHOLDERS |
As of December 31, 2006, the company has the following amounts outstanding with minority shareholders of YSC:
| | | December 31, 2006 | | | December 31, 2005 | |
| | | R M B | | | $ | | | R M B | | | $ | |
| Ag Bank loan (Note 11) | | - | | | - | | | 6,900,000 | | | 855,178 | |
| Receivables/(payable) from YPCC | | 2,182,469 | | | 279,623 | | | (4,370,508 | ) | | (541,676 | ) |
| | | | | | | | | | | | | |
| Net exposure of YSC on loans | | 2,182,469 | | | 279,623 | | | 2,529,492 | | | 313,502 | |
| Other amounts due (to)/from YPCC and related companies | | (101,651 | ) | | (13,024 | ) | | 22,796 | | | 2,825 | |
| Total due from YPCC | | 2,080,818 | | | 266,599 | | | 2,552,288 | | | 316,327 | |
Following the formation of YSC and the acquisition of the fertilizer operations, the company discovered that YSC was liable for a loan facility of RMB7,400,000 ($948,103) from the Agricultural Bank of China, the funds of which were advanced directly to YPCC prior to the date of acquisition. The company understands that the proceeds of this loan were used in YPCC’s business and YSC has received no benefits from this loan. YPCC has guaranteed repayment of this loan to YSC and the bank and YSC was advised that YPCC has been paying the related interest to the bank. Prior to December 31, 2004, YPCC repaid RMB500,000 of the loan balance, accordingly at December 31, 2005, RMB6,900,000 ($855,178) was outstanding on this facility. The company has recorded an amount receivable from YPCC of RMB6,900,000 ($855,178) at December 31, 2005, being the amount due from YPCC required for the repayment of the remaining outstanding loan balance.
YSC also received a working capital loan from YPCC of RMB 4,370,508 ($541,676). YPCC requested repayment of this loan. YSC received a written authorization for YPCC to apply this amount to offset the amount receivable from YPCC should YPCC fail to repay the bank loan and YSC was required to make payment of the loan directly to the bank. Accordingly, the company has accounted for the amount receivable from YPCC and the amount payable to YPCC on a net basis.
The three party YPCC-YSC-Agricultural Bank loan situation has now been resolved during 2006. YPCC cancelled the loan of RMB 4,370,508 ($541,676) owed to YPCC by YSC as at December 31, 2005. YSC applied this loan as a credit against the RMB 6,900,000 ($855,178) owed by YPCC to the Agricultural Bank. YSC made repayments to the Agricultural Bank of RMB 6,880,000 ($881,479) up to the end of December 2006. The net amount receivable from YPCC after offsetting the loan from YPCC and Agricultural Bank’s loan was RMB 2,080,818 ($266,599) as at December 31, 2006
The company has a bank loan of RMB9,900,000 ($1,268,408) (December 31, 2005 - $1,809,506) from Industry & Commerce Bank of China (ICBC), in addition to the balance of RMB 20,000 ($2,562) of the Agricultural Bank loan mentioned in note 10.
As at December 31, 2006 and 2005, information about the bank loans is as follows:
| | 2006 | | 2005 |
| | | | | Annual | | | | | | Annual | |
| Lender | Pr incipal Amount | interest | | | Principal Amount | interest | |
| | R M B | | $ | rate | M aturity date | | R M B | | $ | rate | Maturity date |
| | | | | | | | | | | | |
| ICBC | 9,900,000 | | $ 1,268,408 | 5.84% | Septem ber 20, 2007 | | 11,900,000 | | $ 1,474,871 | 5.84% | October 27, 2005 |
| ICBC | | | | | | | 2,700,000 | | 334,635 | 5.58% | Novem ber 3, 2005 |
| Agricultural Bank | 20,000 | | 2,562 | 5.83% | December 20, 2006 | | 6,900,000 | | 855,178 | 6.59% | Decem ber 27, 2004 |
| | 9,920,000 | | $ 1,270,970 | Total | | | $ 21,500,000 | | $ 2,664,684 | Total | |
31
The ICBC bank (Industrial & Commerce Bank of China) loan of RMB 9,900,000 was due in late October 2005. YSC signed an agreement with ICBC bank on August 14, 2006, whereby it will make monthly repayments of RMB 1,000,000 and repay the remaining balance of RMB 9,900,000 ($1,268,408) by September 20, 2007. Collateral for the ICBC loan includes 9 YSC buildings, land use rights for 13,563 square meters of land and 353 machines at the Xinyuan plant acquired in 2004, the principal place of business of YSC. The loan with Agricultural Bank was due on December 20, 2006. The remaining balance of the Agricultural Bank loan of RMB 20,000 ($2,562) was settled in January 2007.
| a) | Authorized Capital Stock |
Unlimited common shares without par value
Unlimited number of preferred shares without par value, issuable in series and with special rights and restrictions to be determined on issuance
| b) | Issued and Outstanding Capital Stock |
| | | Number of | | | | |
| | | common shares | | | Amount US$ | |
| | | | | | | |
| Balance - December 31, 2004 | | 39,889,328 | | | 18,073,161 | |
| Exercise of options | | | | | | |
| Cash received | | 350,000 | | | 207,915 | |
| Reclassification from stock option/warrant account | | | | | 92,421 | |
| Issued for exercise of warrants | | 708,334 | | | 760,071 | |
| Issued for cash under private placement | | 17,142,858 | | | 24,325,321 | |
| Commission and related issuance costs for private placement | | | | | (1,902,440 | ) |
| Reclassification of fair value of warrants granted in 2005 | | | | | (2,299,782 | ) |
| Balance as at December 31, 2005 | | 58,090,520 | | | 39,256,667 | |
| Exercise of options | | | | | | |
| Cash received | | 650,000 | | | 447,035 | |
| Reclassification from stock option/warrant account | | | | | 98,184 | |
| Refund of issuance costs for private placement | | | | | 20,812 | |
| Issuance costs for private placement | | | | | (564 | ) |
| Balance as at December 31, 2006 | | 58,740,520 | | | 39,822,134 | |
On July 28, 2005, the company completed a private placement of 17,142,858 units at a price of C$1.75 per unit; each unit comprises one common share and one half share purchase warrant. Each whole warrant is exercisable for two years to acquire a common share at C$2.00 per share. All shares and warrants had a hold period expiring on November 28, 2005. The brokers received a 6% commission, or C$1,800,000 ($1,458,671), and the company has incurred direct costs of $443,770. The net proceeds will be used to fund the company’s development projects in China and for general corporate purposes.
Under the 2005 Employee Stock Option Plan, the company may grant options to its directors, officers, and service providers for up to 8,000,000 common shares or such additional amount as may be approved from time to time by the shareholders of the company. Under the plan, the exercise price of each option is not less than the market price of the company’s stock on the date of grant and an option’s maximum term is 5 years. The directors of the company may determine and impose terms upon which each option shall become vested in respect of option shares.
32
A summary of the company’s options at December 31, 2006, 2005 and 2004 and the changes for the years then ended is presented below
| | | Options | | | | | | Weighted average | |
| | | outstanding | | | Amount | | | exercise price C A D | |
| Balance - December 31, 2003 | | 3,885,000 | | | 997,165 | | | 0.77 | |
| Granted | | 1,850,000 | | | 984,836 | | | 1.50 | |
| Exercised | | (200,000 | ) | | (121,679 | ) | | 0.75 | |
| Balance - December 31, 2004 | | 5,535,000 | | | 1,860,322 | | | 1.01 | |
| Granted | | 700,000 | | | 697,016 | | | 1.71 | |
| Exercised | | ( 350,000 | ) | | (75,065 | ) | | 0.73 | |
| Balance - December 31, 2005 | | 5,885,000 | | | 2,482,273 | | | 1.11 | |
| Granted | | 825,000 | | | 352,434 | | | 1.14 | |
| Exercised | | (650,000 | ) | | (98,184 | ) | | 0.76 | |
| Expired | | (950,000 | ) | | - | | | 1.22 | |
| Balance - December 31, 2006 | | 5,110,000 | | | 2,736,523 | | | 1.14 | |
On March 14, 2006, the company granted incentive stock options to an officer to purchase 200,000 common shares of the Company at the exercise price of C$1.50 per share exercisable up to March 14, 2011. 50% of the options become vested on March 14, 2007 and the remaining 50% become vested on March 14, 2008.
On July 4, 2006, the Company granted options to each of the independent directors of the Company to purchase 75,000 common shares in the capital of the Company, and to the Company’s President and CEO, Dr. Robert Rennie, to purchase 250,000 common shares. These options are exercisable at a price of C$1.03 per share up until the date that is 5 years following the date of grant, and vest over a three-year period with one-third of the options vesting one year after the date of grant, one-third two years after the date of grant, and the remaining one-third three years after the date of grant.
The fair value of each option granted is estimated on the date of grant using the Black-Scholes option pricing model with assumptions for the grants as follows:
| | 2006 | 2005 | 2004 |
| Risk free interest rate | 4.00% - 4.50% | 3.40% - 3.70% | 3.40% - 4.00% |
| Expected life of options in years | 5 years | 5 years | 5 years |
| Expected volatility | 49% - 51% | 48% - 52% | 47% - 58% |
| Dividend per share | $0.00 | $0.00 | $0.00 |
The Following Table Summarizes Information About The Weighted Average Grant-Date Fair Value Of Options Granted During The Year Ended December 31, 2006:
| Grant | | Options | Fair value | Fair value | Weighted aver age |
| date | | granted | per option | C A D | fair value C A D |
| 2006 | | | | | |
| 14-Mar -06 | | 200,000 | 0.72 | 144,000 | |
| 4-Jul -06 | | 625,000 | 0.50 | 312,500 | |
| | | 825,000 | | 456,500 | 0.55 |
33
The following table summarizes information about the weighted average grant-date fair value of options granted during the year ended December 31, 2006:
| | Options outstanding | | Options exercisable |
| | | Weighted | | | |
| | Number | average | Weighted | Number | Weighted |
| Range of | outstanding | remaining | average | exercisable | average |
| exercise | at December 31, | contractual | exercise | at December 31, | exercise |
| prices | 2006 | life | price | 2006 | price |
| C A D | | (years) | C A D | | C A D |
| 0.60 | 1,700,000 | 1.35 | 0.60 | 1,700,000 | 0.60 |
| 1.03 | 625,000 | 4.50 | 1.03 | - | 1.03 |
| 1.20 | 435,000 | 1.47 | 1.20 | 435,000 | 1.20 |
| 1.50 | 1,850,000 | 2.85 | 1.50 | 1,625,000 | 1.50 |
| 1.80 | 500,000 | 3.16 | 1.80 | 250,000 | 1.80 |
| 0.60 to 1.80 | 5,110,000 | 2.44 | 1.16 | 4,010,000 | 1.13 |
The following is a summary of warrant transactions at December 31, 2006, 2005 and 2004 and the changes for the years the ended:
| | | Number of | | | | | | Weighted average | |
| | | warrants | | | Amount | | | exercise price C A D | |
| Balance - December 31, 2003 | | 700,000 | | | - | | | 0.81 | |
| Granted | | 5,830,000 | | | 167,413 | | | 1.50 | |
| Exercised | | (400,000 | ) | | - | | | 0.60 | |
| Reclassification of fair value of warrants granted in 2004 | | | | | 2,089,605 | | | | |
| Balance - December 31, 2004 | | 6,130,000 | | | 2,257,018 | | | 1.48 | |
| Granted | | 8,571,429 | | | - | | | 2.00 | |
| Exercised | | (708,334 | ) | | - | | | 1.33 | |
| Reclassification of fair value of warrants granted in 2005 | | | | | 2,299,782 | | | | |
| Balance - December 31, 2005 | | 13,993,095 | | | 4,556,800 | | | 1.81 | |
| Expired | | (5,421,666 | ) | | - | | | 1.50 | |
| Balance - December 31, 2006 | | 8,571,429 | | | 4,556,800 | | | 2.00 | |
The outstanding warrants at December 31, 2006 had an exercise price of $2.00, with an expiry date in July 2007.
No warrants were granted during the year ended December 31, 2006. 5,421,666 warrants expired on June 22, 2006. The following table summarizes information about warrants outstanding at December 31, 2006:
| Number of warrants | | Exercise price
C A D | | Expiry date |
| | | | | |
| 8,571,429 | | $ 2.00 | | July 28, 2007 |
| 8,571,429 | | Total | | |
| 13. | RELATED PARTY TRANSACTIONS |
Included in expenses are the following amounts paid to companies controlled by directors and officers:
| | | 2006 | | | 2005 | | | 2004 | |
| Consulting fees | | 141,377 | | | 195,554 | | | 368,686 | |
34
Directors of the company may receive consulting fees for their services. A total of $141,377 was paid in 2006 to companies controlled by one director and one officer (2005 - $195,554; 2004 - $368,686). Accounts payable to these companies for expenses incurred were $1,807 at the end of 2006. Except for the account receivable of RMB2,080,818 ($266,599) from YPCC related to the YSC loan (note 10), there were no other accounts receivables from the related parties.
| 14. | SEGMENTED INFORMATION |
Management considers developing an integrated fertilizer business, which includes the development of the phosphate project in China, to be the company’s principal activity. All revenues are earned from sales to customers located in China.
| Geographic Segments | | | | | D ecember 31, 2006 | |
| | | Canada | | | China | | | Consolidated | |
| | | | | | | | | | |
| Current assets | $ | 21,185,955 | | $ | 9,854,532 | | $ | 31,040,487 | |
| Property, plant & equipment - net | | 32,953 | | | 4,024,002 | | | 4,056,955 | |
| Land used right - net | | - | | | 340,608 | | | 340,608 | |
| Mineral properties | | - | | | 3,112,768 | | | 3,112,768 | |
| Deferred acquisition costs | | 447,834 | | | - | | | 447,834 | |
| Other assets | | - | | | 44,019 | | | 44,019 | |
| Total assets | $ | 21,666,742 | | $ | 17,375,929 | | $ | 39,042,671 | |
| | | | | | | | | | |
| | | | | | D ecember 31, 2005 | |
| | | Canada | | | China | | | Consolidated | |
| Current assets | $ | 21,397,256 | | $ | 12,961,517 | | $ | 34,358,773 | |
| Property, plant & equipment - net | | 42,649 | | | 8,531,723 | | | 8,574,372 | |
| Land used right - net | | - | | | 691,583 | | | 691,583 | |
| Mineral properties | | - | | | 2,557,660 | | | 2,557,660 | |
| Deferred acquisition costs | | 339,964 | | | - | | | 339,964 | |
| Other assets | | - | | | 80,907 | | | 80,907 | |
| Total assets | $ | 21,779,869 | | $ | 24,823,390 | | $ | 46,603,259 | |
YSC had sales to one customer amounted to RMB 8,082,242 ($1,013,904) during the year ended December 31, 2006.
An impairment loss of property, plant and equipment, and land use right in China was recognized during the year as the carrying amount exceeds the sum of the undiscounted cash flows expected to result from its use and eventual disposition and exceeds its fair value which was determined by taking into account an estimate of the series of future cash flows at different times, expectations about possible variations in the amount or timing of those cash flows, the time value of money, represented by the risk-free rate of interest, and the price for bearing the uncertainty inherent in the asset.
A reconciliation of the combined Canadian federal and provincial income taxes at statutory rates and the company’s effective income tax expense is as follows:
| | | 2006 | | | 2005 | | | 2004 | |
| | | | | | | | | | |
| Income tax provision at statutory rates | | (2,231,848 | ) | | (982,636 | ) | | (663,970 | ) |
| | | | | | | | | | |
| Non-deductible and other items | | (37,428 | ) | | 371,437 | | | 345,053 | |
| | | | | | | | | | |
| Foreign losses subject to different tax rates | | 63,373 | | | 19,829 | | | 10,941 | |
| | | | | | | | | | |
| Losses not recognized | | 2,205,903 | | | 591,370 | | | 307,976 | |
| Income tax expense | | - | | | - | | | - | |
35
Temporary differences related to the following assets and tax loss carry forwards that may rise to potential future income assets as at De-cember 31, 2006, 2005, and 2004 are described below:
| | | 2006 | | | 2005 | | | 2004 | |
| | | | | | | | | | |
| Tax loss carryforwards and other amounts | | 3,612,644 | | | 3,686,310 | | | 2,792,620 | |
| | | | | | | | | | |
| Fixed Assets | | 1,222,435 | | | (135,132 | ) | | (73,347 | ) |
| | | | | | | | | | |
| Land use right | | 6,082 | | | (115,005 | ) | | (96,429 | ) |
| | | | | | | | | | |
| Mineral properties | | (70,065 | ) | | 148,099 | | | 211,122 | |
| | | | | | | | | | |
| | | 4,771,096 | | | 3,584,272 | | | 2,833,966 | |
| | | | | | | | | | |
| Valuation allowance | | (4,771,096 | ) | | (3,584,272 | ) | | (2,833,966 | ) |
| | | | | | | | | | |
| Future income tax assets | | - | | | - | | | - | |
At December 31, 2006, the company has the following unused tax losses available for application against taxable income of future years, and they expire as follows:
| 2007 | 1,841,001 |
| 2008 | 800,027 |
| 2009 | 861,420 |
| 2011 | 1,653,061 |
| 2010 | 1,347,774 |
| 2014 | 860,444 |
| 2015 | 945,302 |
| 2026 | 1,143,785 |
| | |
| Total | 9,452,814 |
| 16. | DIFFERENCES BETWEEN CANADIAN AND U.S. GENERALLY ACCEPTED ACCOUNTING PRINCIPLES |
a) The company’s consolidated financial statements have been prepared in accordance with generally accepted accounting principles in Canada. The material measurement differences between GAAP in Canada and the United States that would have an effect on these financial statements are as follows:
| | | 2006 | | | 2005 | | | 2004 | |
| Mineral Properties - under Canadian GAAP | | 3,112,768 | | | 2,557,659 | | | 2,008,422 | |
| Feasibility study/technical evaluation | | (3,112,768 | ) | | (2,557,659 | ) | | (2,008,422 | ) |
| | | | | | | | | | |
| Mineral Properties - under US GAAP | | - | | | - | | | - | |
| | | | | | | | | | |
| Total shareholders ' equity | | | | | | | | | |
| Capital Stock - under CDN GAAP | | 39,822,134 | | | 39,256,667 | | | 18,073,162 | |
| Compensatory escrow release value | | 501,318 | | | 501,318 | | | 501,318 | |
| Flow-through share premium | | (99,010 | ) | | (99,010 | ) | | (99,010 | ) |
| Pro rata allocation of units value to warrants | | 0 | | | 0 | | | (0 | ) |
| | | | | | | | | | |
| Capital Stock - under US GAAP | | 40,224,442 | | | 39,658,975 | | | 18,475,470 | |
| | | | | | | | | | |
| Stock options and warrants - | | | | | | | | | |
| under Canadian GAAP | | 7,293,323 | | | 7,039,072 | | | 4,153,089 | |
| Pro rata allocation of units value | | | | | | | | | |
| of warrants | | (0 | ) | | (0 | ) | | 0 | |
| Stock based compensation | | (1,003,164 | ) | | (1,003,164 | ) | | (1,003,164 | ) |
| | | | | | | | | | |
| Stock options and warrants - under U.S. GAAP | | 6,290,159 | | | 6,035,908 | | | 3,149,925 | |
| | | | | | | | | | |
| Deficit - under Canadian GAAP | | (15,526,394 | ) | | (8,985,220 | ) | | (6,166,414 | ) |
| Interest Expenses related to construction | | 95,289 | | | 95,289 | | | 38,287 | |
| Feasibility study/technical evaluation | | (3,112,768 | ) | | (2,557,659 | ) | | (2,008,422 | ) |
| Compensatory escrow release value | | (501,318 | ) | | (501,318 | ) | | (501,318 | ) |
| Deferred Taxes | | 99,010 | | | 99,010 | | | 99,010 | |
| Stock based compensation | | 1,003,164 | | | 1,003,164 | | | 1,003,164 | |
| Deficit - under US GAAP | | (17,943,017 | ) | | (10,846,734 | ) | | (7,535,693 | ) |
| | | | | | | | | | |
| Cumulative other comprehensive income | | | | | | | | | |
| - under Canadian GAAP | | | | | | | | | |
| Fair market value of marketable securities | | - | | | - | | | - | |
| Cumulative translation adjustment | | 3,783,916 | | | 3,601,095 | | | 1,671,602 | |
| Cumulative other comprehensive income - under US GAAP | | 3,783,916 | | | 3,601,095 | | | 1,671,602 | |
| | | | | | | | | | |
| Deficit - under US GAAP | | (14,159,101 | ) | | (7,245,639 | ) | | (5,864,091 | ) |
| Total shareholders' equity - under US GAAP | | 32,355,500 | | | 38,449,244 | | | 15,761,304 | |
| | | | | | | | | |
36
The impact on the consolidated statements of operations and deficit would be as follows:
| | | 2006 | | | 2005 | | | 2004 | |
| Loss for the year - | | | | | | | | | |
| under Canadian GAAP | | (6,469,804 | ) | | (2,818,806 | ) | | (1,864,038 | ) |
| Feasibility study/technical evaluation | | (555,109 | ) | | (549,237 | ) | | (425,286 | ) |
| Mineral property written off in year | | | | | | | | | |
| Interest Expenses related to construction | | - | | | 57,002 | | | 38,287 | |
| Deferred taxes | | | | | | | | | |
| Loss for the year - | | | | | | | | | |
| under U.S. GAAP before | | | | | | | | | |
| comprehensive income adjustments | | (7,024,913 | ) | | (3,311,041 | ) | | (2,251,037 | ) |
| Adjustments to arrive at | | | | | | | | | |
| comprehensive income | | | | | | | | | |
| Marketable securities | | | | | | | | (2,786 | ) |
| Unrealized gain on marketable securities | | | | | | | | | |
| Cumulative translation adjustment | | 111,451 | | | 1,929,493 | | | 1,459,146 | |
| Comprehensive income | | 111,451 | | | 1,929,493 | | | 1,456,360 | |
| | | | | | | | | | |
| Loss for the year - under US GAAP | | (6,913,462 | ) | | (1,381,548 | ) | | (794,677 | ) |
| Basic and Diluted Loss per common share - | | | | | | | | | |
| under U.S. GAAP before | | | | | | | | | |
| comprehensive income adjustments | | (0.12 | ) | | (0.07 | ) | | (0.06 | ) |
b) Income Taxes
Under U.S. GAAP, the sale of flow through shares resulted in a deferred credit being recognized for the excess of the purchase price paid by investors over the fair value of common shares without the flow through feature. The fair value of the shares was recorded as equity. When the tax deductibility of the qualifying expenditures is renounced, a temporary difference arises. A deferred tax liability was established in the amount of the tax benefit foregone, and tax expense was recorded for the difference between the deferred tax liability and the premium received upon issuance of the flow through shares. This deferred tax liability reversed due to loss carry forwards available.
c) Accounting for Stock Based Compensation
Effective January 1, 2004 for Canadian GAAP, the company adopted CICA 3870, Stock based Compensation and Other Stock based Payments which requires an expense to be recognized in the financial statements for all forms of employee stock-based compensation. Adoption of CICA 3870 was applied retroactively, without restatement, as permitted by the standard. For U.S. GAAP purposes, the company adopted FAS 148, “Accounting for Stock based Compensation Transition and Disclosure”. FAS 148 provides alternative methods of transition for a voluntary change to the fair value based method of accounting for stock based employee compensation. For U.S. GAAP, effective Janu-ary 1, 2004, the company applied the modified prospective method of adoption included in FAS 148 which recognizes stock based employee compensation for 2004 as if the fair value based accounting method in this statement had been used to account for all employee awards granted, modified or settled in fiscal years beginning after December 14, 1994. Since all stock options granted from that date to January 1, 2004 vested immediately, application of the modified prospective method for U.S. GAAP purposes in 2004 did not have any additional impact on the stock based compensation charge for 2004 or on total shareholders’ equity under U.S. GAAP.
d) Mineral Property Expenditures
Mineral property expenditures are accounted for in accordance with Canadian GAAP as disclosed in note 2. For U.S. GAAP purposes, the company expenses exploration or property maintenance expenditures relating to mineral properties as they are incurred. When proven and probable reserves are indicated by a bankable feasibility study for a property, subsequent development costs of the property are capitalized. The capitalized costs of such properties would then be measured periodically to ensure that the carrying value can be recovered on an undiscounted cash flow basis. If the carrying value cannot be recovered on this basis, the mineral properties would be written down to fair value using a discounted cash flow basis.
e) Capitalization of Interest
Under U.S. GAAP, capitalization of interest is calculated for certain qualifying assets that require a period of time to get them ready for their intended use. Under Canadian GAAP, capitalization of interest is permitted, but not required. The company’s interest expense related to construction in progress was $57,002 and $38,287 respectively in 2005 and 2004, which has been expensed for Canadian GAAP purposes.
f) Comprehensive Income
Under US GAAP, comprehensive income is recognized and measured in accordance with FASB Statement No. 130 “Reporting Comprehensive Income”. Comprehensive income includes all changes in equity other than those resulting from investments by owners and distributions to owners. Comprehensive income includes two components, net income and other comprehensive income. Other comprehensive income includes amounts that are recorded as an element of shareholders’ equity but are excluded from net income as these transactions or events were attributable to changes from non-owner sources. These items include minimum pension liability adjustments, holding gains and losses on certain investments, gains and losses on certain derivative instruments and foreign currency gains and losses related to self-sustaining foreign operations (cumulative translation adjustment). A standard for comprehensive income and other comprehensive income is not effective under Canadian GAAP until the Company’s year ending December 31, 2007.
37
g) Issue of Escrow Shares
U.S. GAAP requires that compensation expense be recorded for the excess of the quoted market price over the price granted to employees and directors under escrow share agreements that are based on more than mere passage of time and require performance. The compensation expense was recorded under US GAAP when the shares became eligible for release. Under Canadian GAAP, no compensation expense was recorded for these escrow share agreements.
h) Supplemental Cash Flow Information
Under U.S. GAAP, the consolidated statements of cash flows for 2006, 2005 and 2004 would not show exploration expenditures under investing activities. These balances of $591,101, $419,546 and $298,084, respectively, would instead be included in cash flow from operating activities. This would result in cash flow from operating activities for 2006, 2005 and 2004 to be ($3,441,049), ($2,737,896) and ($495,147), respectively.
i) Issue of Units
Under U.S. GAAP, the proceeds on the sale of units comprising shares and warrants are allocated to each instrument on a pro rata basis using the total fair value to determine the pro rata allocation.
j) Cash Flow From Operating Activities
Under U.S. GAAP, cash flow from operating activities must be presented as the amount calculated after taking into effect the changes in non-cash working capital items. The disclosure of a subtotal referring to the amount of cash flow from operating activities before changes to working capital items is not permitted.
k) Deferred Stripping Costs
In June 2005, the Emerging Issues Task Force issued EITF 04-06 – Accounting for Post-Production Stripping Costs in the Mining Industry. The EITF requires that stripping costs incurred during the production phase of a mine are variable production costs that should be included in the costs of the inventory produced during the period that the stripping costs are incurred. The company has not yet reached the production phase of the YMC properties and as such, has no inventory in which to include any stripping costs. Once the company goes into production, it will account for stripping costs as per EITF 04-06 for U.S. GAAP purposes. However, this may result in GAAP differences based on the proposed Canadian EIC D56 - Accounting for Deferred Stripping costs in the mining industry.
l) Accounting for Changes and Error Corrections
During June 2005, the FASB issued SFAS No. 154, Accounting for Changes and Error Corrections. The new standard requires that entities which make a voluntary change in accounting principle apply that change retroactively to prior period financial statements, unless this would be impracticable. For changes in methods of depreciation, amortization or depletion for long-lived assets, the change must be accounted for prospectively, as a change in estimate. SFAS No. 154 is effective for the company’s 2006 financial statements and it has no impact on the company’s financial statements for the year ended December 31, 2006.
m) Defined Benefit Pension and Other Post-Retirement Benefit Plans
In September 2006, the FASB issued SFAS No. 158, “Employers’ Accounting for Defined Benefit Pension and Other Post retirement Benefit Plans, an amendment of FASB Statements No. 87, 88, 106, and 132(R)”. SFAS No. 158 requires an entity to: (1) recognize the over-funded or under-funded status of a benefit plan as an asset or liability in the statement of financial position; (2) recognize the existing unrecognized net gains and losses, unrecognized prior service costs and credits, and unrecognized net transition assets or obligations in OCI; and (3) measure defined benefit plan assets and obligations as of the year-end date. The guidance is effective for the company’s December 31,2006 consolidated financial statements and does not apply to the company’s consolidated financial statements.
n) Inventory Costs
In November 2004, the Financial Accounting Standards Board (“FASB”) issued SFAS No. 151, “Inventory Costs”, to clarify that abnormal amounts of idle facility expense, freight, handling costs and wasted materials (spoilage) should be recognized as current period charges, and to require the allocation of fixed production overheads to inventory based on the normal capacity of the production facilities. The guidance was effective for inventory costs incurred during 2006 and did not have a material impact on the company’s consolidated financial statements.
o) Recent Accounting Pronouncements
Accounting standards that the company expects to adopt subsequent to December 31, 2006 on a prospective basis when applicable include the following:
| | i) | Financial Instruments-Recognition and Measurement, Hedges, and Comprehensive Income |
| | | |
| | | In January 2005, the CICA issued three new standards: “Financial instruments-recognition and measurement, hedges, and compre- hensive income.” The main consequences of implementing standards are described below. The new standards will be effective for interim and annual financial statement commencing in 2007. Earlier adoption is permitted. Most significantly for the company, the new standards will require presentation of a separate statement of comprehensive income. Investment in marketable securities will be recorded in the consolidated balance sheet at fair value. Changes in the fair value of marketable securities will be recorded in income and changes in the fair value of investments reported in comprehensive income. The company is undertaking analysis of the impact of the new standards. |
| | | |
| | iii) | Fair Value Measurements |
| | | |
| | | In September 2006, the FASB issued SFAS No. 157, “Fair Value Measurements”, which establishes a framework for measuring fair value. It also expands disclosures about fair value measurements and is effective for the first quarter of 2008. The company is cur- rently reviewing the guidance to determine the potential impact, if any, on its consolidated financial statements. |
| | | |
| | v) | Uncertainty in Income Taxes |
| | | |
| | | In July 2006, the FASB issued FIN No. 48, “Accounting for Uncertainty in Income Taxes”. FIN No. 48 prescribes a comprehensive model for how a company should recognize, measure, present and disclose in its consolidated financial statements uncertain tax |
38
positions that it has taken or expects to take on a tax return (including a decision whether to file or not to file a return in a particular jurisdiction).Under the model, the consolidated financial statements will reflect expected future income tax consequences of such positions presuming the taxing authorities’ full knowledge of the position and all relevant facts, but without considering time values. The evaluation of tax positions under FIN No. 48 will be a two-step process whereby: (1) the company determines whether it is more likely than not that the tax positions will be sustained based on the technical merits of the position; and (2) for those tax positions that meet the more-likely-than-not recognition threshold, the company would recognize the largest amount of tax benefit that is greater than50 percent likely of being realized upon ultimate settlement with the taxing authority. FIN No. 48 also revises disclosure requirements and introduces a prescriptive, annual, tabular roll-forward of the unrecognized tax benefits. The company is reviewing the guidance (which is effective for the first quarter of 2007) to determine the potential impact, if any, on its consolidated financial statements.
| 17. | FINANCIAL INSTRUMENTS AND CONCENTRATION OF RISK Fair Values |
Fair Values
The company’s financial instruments include cash and cash equivalents, short term investments, accounts receivable, customer deposits, accounts payable and accrued liabilities, other payable, bank loans, and amount due from YPCC. The fair values of these financial instruments approximate their carrying values.
Credit Risk
The company maintains a substantial portion of its cash and cash equivalents with major financial institutions in Canada and China. Financial instruments that potentially subject the company to concentration of credit risk are primarily receivables. Management believes that any risk of loss is reduced due to the financial strength of the company’s major customers.
Foreign Currency Risk
A substantial portion of the company’s business is carried out in Chinese Renminbi, and the company maintains Renminbi denominated bank accounts. The company also has short-term investments in US dollars. Fluctuations in exchange rates between the Canadian dollar and PRC Renminbi and US dollar could have a material effect on the business, results of operations and financial condition of the company.
| Capital commitments - contracted but not accounted for | | | | | | |
| | | As at December 31, 2006 | |
| | | R M B | | | $ | |
| MAP project | | 2,960,000 | | | 379,241 | |
The Company entered into a construction contract for MAP project to manufacture MAP, a major intermediate material in fertilizer production in 2006. The total contracted amount is RMB 3.2 million, of which RMB 0.24 million was paid during 2006.
Operating lease commitments
| | | As at December 31, 2006 | |
| | | R M B | | | $ | |
| Within 1 year | | 111,657 | | | 14,306 | |
Lease commitment mainly represents the rental contracts signed for the lease of offices and apartments.
| O perating lease commitments | | | | | | |
| | | As at December 31, 2006 | |
| | | R M B | | | $ | |
| Within 1 year | | 75,633 | | | 9,690 | |
Lease commitment represents the rental contracts signed for the lease of 4 warehouses.
Tianren Acquisition Final Agreement
The Company signed the final agreement to acquire the fertilizer related business of Hebei Tianren Chemical Corporation (“Tianren”) in Beijing on June 18, 2006.
The interests being acquired include a:
| | 1. | 95% interest (80% direct and 15% indirect) in Tianren Agriculture Franchise Company (“Ag Franchise”), China’s largest marketer of compound NPK fertilizers. Ag Franchise sells over 1.5 Million tonnes per annum (“tpa”) of NPK (Nitrogen, Phosphate, Potassium) fertilizer as a commissioned sales agent for Sino Arab Chemical Fertilizer Company (SACF) and Dayukou Chemical Fertilizer Com- pany (“Dayukou”). |
| | | |
| | 2. | 75% interest in Tianding Chemical Company (“Tianding”), which has a 100,000 tpa NPK plant in Qinhuangdao, Hebei Province. Tianding also has one of the largest fertilizer bag manufacturing facilities in China with current production under contract of in |
39
| | excess of 28 million bags per annum for Tianren, SACF, Dayukou and others. The bagging facility is a key part of the logistics for distribution of 50 kg bags of fertilizer within China. |
| | | |
| | 3. | 60% interest in Hubei Yichang Tianlong Industry Company (“Tianlong”), a raw materials sourcing and fertilizer trading company based in Yichang, Hubei Province, where Spur’s current facilities are located. Tianlong has an import license for sulphuric and phosphoric acid and will be eligible to apply for more import permits in the near future |
Xinjiang Tianren Chemical Company and its 100,000 mt NPK plant in northwest China which was part of the original Tianren agreement will no longer be part of our transaction and the share allocation has been reduced accordingly from 15.5 M to 13.3M shares.
a) YMC’s Business License
Hubei Administration for Industry and Commerce (AIC) extended YMC’s Business License until March 31, 2007 by the direction of Central Ministry of Commerce based on a strong letter of support from the City of Yichang. This extension gave YPCC time to complete its first Registered Capital Contribution. The authorities have acknowledged that Spur has been in compliance since March of 2005 at which time Spur’s Registered Capital Contribution totalled $15.32 M in cash. YPCC made its first required Registered Capital contribution valued at $3.69M for prior R&D expenses and $1.05M of other expenses in February of 2007. YPCC’s contribution has recently been approved by Hubei AIC thus completing the requirements for the renewal of the YMC Business License which should be issued in the near future. If there is further delay, Spur anticipates that the authorities will grant another extension. YPCC’s next and last Registered Capital contribution will be the two mining licenses.
b) Stock Options
On January 3, 2007, the company granted options to an officer to purchase 200,000 common shares of the company, a new officer to purchase 100,000 common shares of the company, and an officer to purchase 50,000 common shares of the company at the exercise price of C$0.64 per share. The options become vested over a three-year period with one-third of the options vesting one year after the date of grant, one-third two years after the date of grant, and the remaining one-third three years after the date of grant.
c) Contribution of Capital by YPCC
Directors of YSC agreed to YPCC contributing its scientific achievement and previous expenses for the registered capital. YPCC’s scientific achievement is valued as RMB 28.8086 million ($3.69 million), and the previous expenses are valued as RMB 8.2337 Million ($1.05 million). YPCC will transfer its scientific achievement as contribution to YMC and as at the end of 2006 the contribution was in the process of verifica-tion and registration at AIC.
40
CORPORATE DATA| DIRECTORS | HEAD OFFICE |
| Steven G. Dean | Suite 3083, Three Bentall Centre |
| Robert J. Rennie | 595 Burrard Street |
| Robert G. Atkinson | PO Box 49298 |
| John Van Brunt | Vancouver, BC V7X 1L3 |
| Ruston Goepel | |
| David Black | CONTACT |
| Wu Sihai | Robert J. Rennie |
| | President & Chief Executive Officer |
| OFFICERS | rrennie@spur-ventures.com |
| Steven G. Dean | |
| Chairman | Michael J. Kuta |
| | 604.697.6201 |
| Robert J. Rennie | mkuta@spur-ventures.com |
| President & Chief Executive Officer | |
| | WEBSITE |
| Zhai Jidong | www.spur-ventures.com |
| Chief Operating Officer | |
| | TRANSFER AGENT |
| Joel Jeangrand | Computershare Trust Company |
| Vice President, Corporate Development | Vancouver, British Columbia |
| | |
| Michael Kuta | LEGAL COUNSEL |
| Corporate Secretary | DuMoulin Black |
| | Vancouver, British Columbia |
| SHARES LISTED | |
| Toronto Stock Exchange (Symbol SVU) | AUDITORS |
| | PricewaterhouseCoopers LLP |
| SHARES ISSUED (AS AT DECEMBER 31, 2006) | Vancouver, British Columbia |
| 58,740,520 | |
| Fully Diluted: 72,821,949 million | ANNUAL GENERAL MEETING |
| | The Annual General Meeting of the Shareholders will be held |
| | at the Cypress Room, Hyatt Regency Vancouver, 655 Burrard |
| | Street, Vancouver, British Columbia on June 27, 2007 at 2:30 |
| | P.M. |
41
www.spur-ventures.com
SVU:TSX