ANNUAL SHAREHOLDER MEETING May 20, 2020
SAFE HARBOR STATEMENTS ABOUT GUARANTY BANCSHARES, INC. Guaranty Bancshares, Inc. (“GNTY”, “Guaranty” or the “Company”) is a bank holding company, headquartered in Addison, Texas, that conducts banking activities through its wholly-owned subsidiary, Guaranty Bank & Trust, N.A., a national banking association (“Guaranty Bank & Trust” or the “Bank”) throughout East Texas, Central Texas, the Houston MSA and the Dallas/Fort Worth MSA. For more information, visit www.gnty.com. NO OFFER OR SOLICITATION This communication does not constitute an offer to sell, a solicitation of an offer to sell, the solicitation of an offer to buy any securities or a solicitation of any vote or approval. There will be no sale of securities in any jurisdiction in which such an offer, solicitation or sale would be unlawful prior to registration or qualification under the securities laws of any such jurisdiction. No offer of securities shall be made except by means of a prospectus meeting the requirements of Section 10 of the Securities Act of 1933, as amended. NON-GAAP FINANCIAL MEASURES Guaranty reports its results in accordance with United States generally accepted accounting principles (“GAAP”). However, management believes that certain non-GAAP performance measures used in managing its business may provide meaningful information about underlying trends in its business. Non-GAAP financial measures should be viewed in addition to, and not as an alternative for, Guaranty’s reported results prepared in accordance with GAAP. Please see “Reconciliation of Non-GAAP Measures” at the end of this presentation for a reconciliation to the nearest GAAP financial measure.
“Safe Harbor” Statement under the Private Securities Litigation Reform Act of 1995. This presentation contains forward-looking statements within the meaning of section 27A of the Securities Act of 1933 (the “Securities Act”) and 21E of the Securities Exchange Act of 1934. These forward-looking statements reflect our current views with respect to, among other things, future events and our financial performance. These statements are often, but not always, made through the use of words or phrases such as “may,” “should,” “could,” “predict,” “potential,” “believe,” “will likely result,” “expect,” “continue,” “will,” “anticipate,” “seek,” “estimate,” “intend,” “plan,” “projection,” “would” and “outlook,” or the negative version of those words or other comparable of a future or forward-looking nature. Annualized, pro forma, project and estimated numbers are used for illustrative purposes only, are not forecast and may not reflect actual results. These forward-looking statements are not historical facts, and are based on current expectations, estimates and projections about our industry, leadership’s beliefs and certain assumptions made by our leadership team, many of which, by their nature, are inherently uncertain and beyond our control. Accordingly, we caution you that any such forward-looking statements are not guarantees of future performance and are subject to risks, assumptions and uncertainties that are difficult to predict. Although we believe that the expectations reflected in these forward-looking statements are reasonable as of the date made, actual results may prove to be materially different from the results expressed or implied by the forward-looking statements. Actual results will be significantly impacted by the effects of the ongoing COVID-19 pandemic, including, among other effects: the impact of the public health crisis; the extent and duration of closures of businesses, including our branches, vendors and customers; the operation of financial markets; employment levels; market liquidity; the impact of various actions taken in response by the U.S. federal government, the Federal Reserve, other banking regulators, state and local governments; the adequacy of our allowance for loan losses in relation to potential losses in our loan portfolio; and the impact that all of these factors have on our borrowers, other customers, vendors and counterparties. There are or will be important factors that could cause our actual results to differ materially from those indicated in these forward-looking statements. For discussion of these and other risk that may cause actual results to differ from expectation, please refer to “Special Cautionary Note Regarding Forward-Looking Statements” and “Risk Factors” contained in the Annual Report on Form 10-K for the year ended December 31, 2019 and the updates to those risk factors set forth in Guaranty’s Quarterly Report on Form 10-Q for the three months ended March 31, 2020. If one or more events related to these risks or uncertainties materialize, or if our underlying assumptions prove to be incorrect, actual results may differ materially from what we anticipate. Accordingly, you should not place undue reliance on any such forward-looking statements. Any forward-looking statement speaks only as of the date on which it is made, and we do not undertake any obligation to publicly update or review any forward-looking statement, whether as a result of new information, future developments or otherwise. In addition, we cannot assess the impact of each factor on our business or the extent to which any factor, or combination of factors, may cause actual results to differ materially from those contained in any forward-looking statements. All forward-looking statements, expressed or implied, included in this communication are expressly qualified in their entirety by this cautionary statement. This cautionary statement should also be considered in connection with any subsequent written or oral forward-looking statements that Guaranty or persons acting on Guaranty’s behalf may issue. FORWARD-LOOKING STATEMENTS
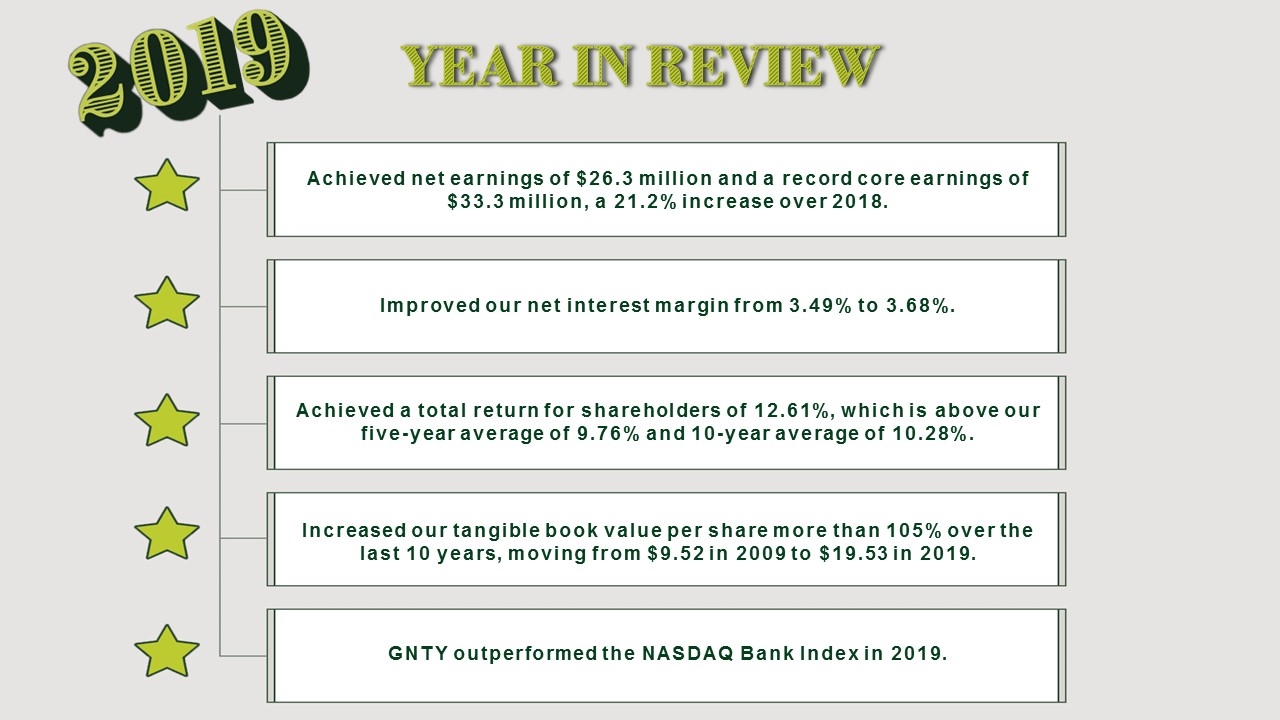
YEAR IN REVIEW Achieved net earnings of $26.3 million and a record core earnings of $33.3 million, a 21.2% increase over 2018. Improved our net interest margin from 3.49% to 3.68%. Achieved a total return for shareholders of 12.61%, which is above our five-year average of 9.76% and 10-year average of 10.28%. Increased our tangible book value per share more than 105% over the last 10 years, moving from $9.52 in 2009 to $19.53 in 2019. GNTY outperformed the NASDAQ Bank Index in 2019.
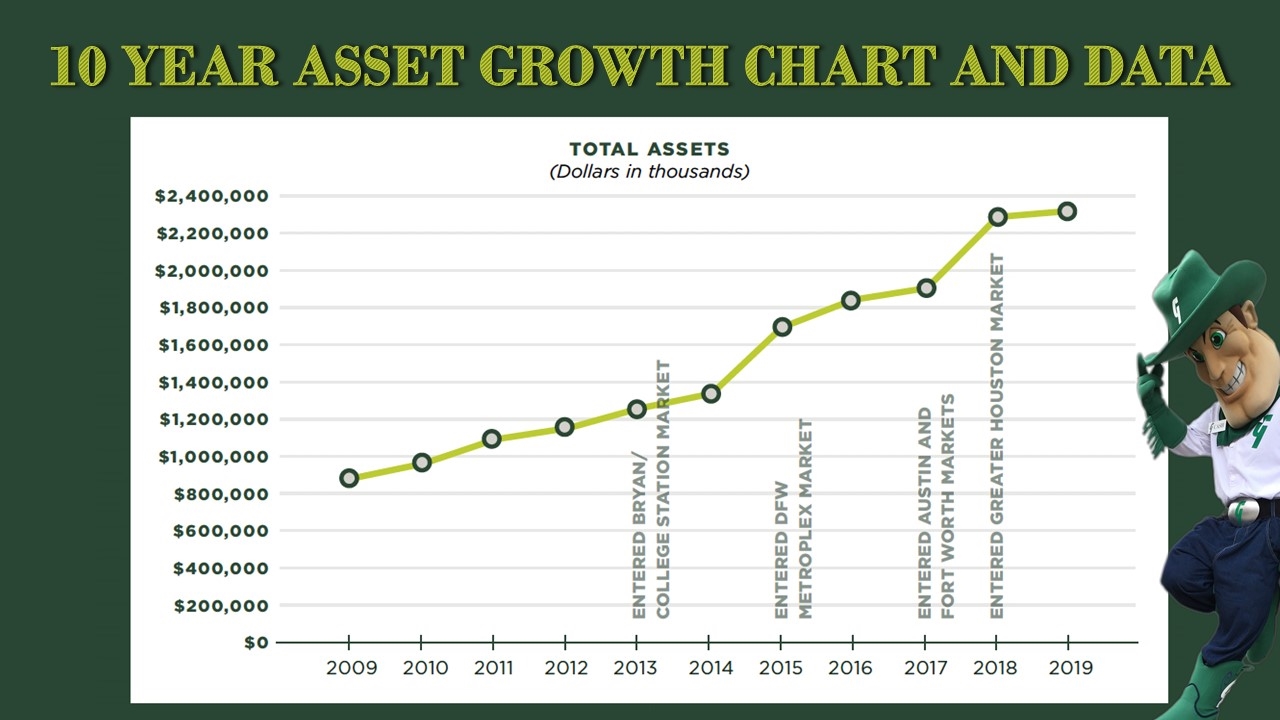
10 YEAR ASSET GROWTH CHART AND DATA
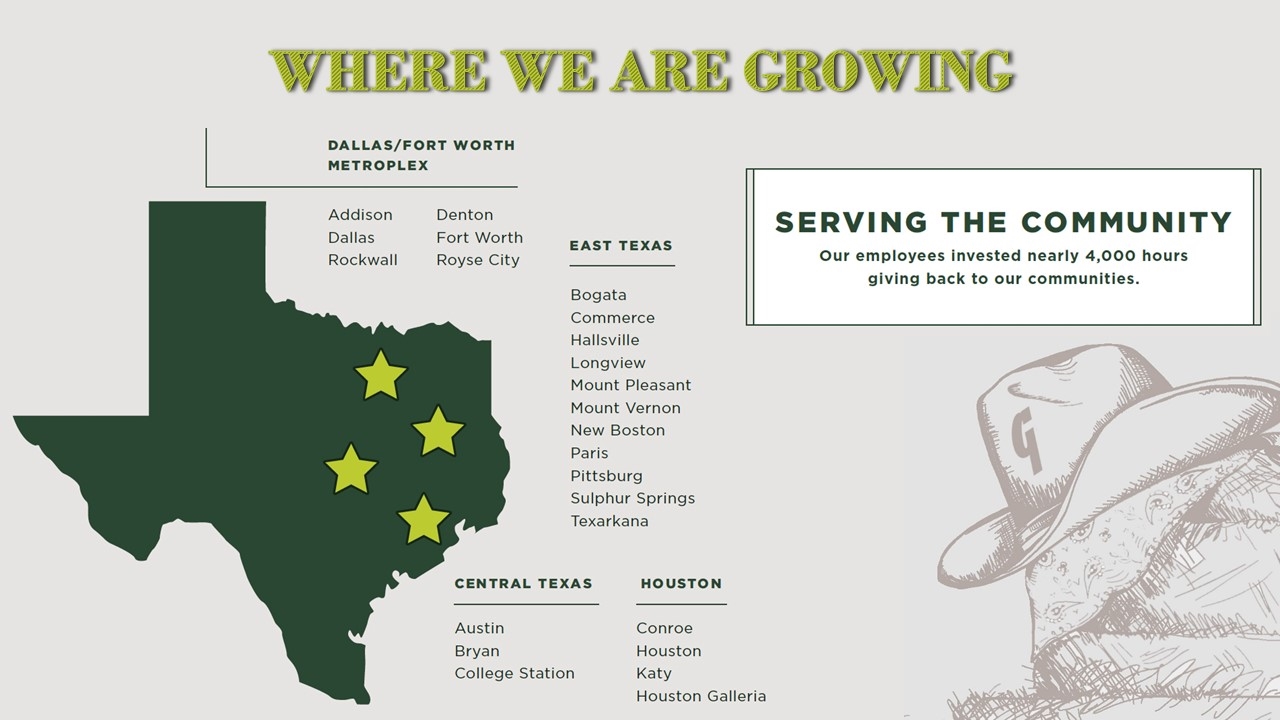
WHERE WE ARE GROWING
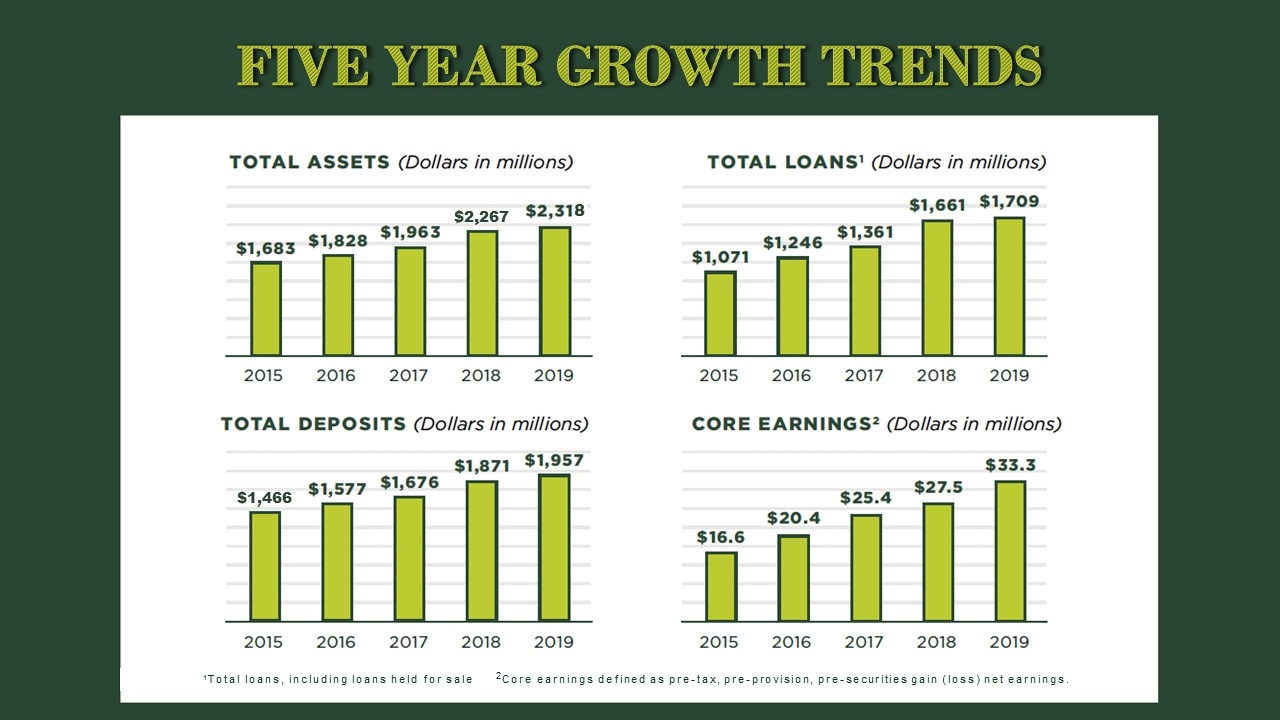
FIVE YEAR GROWTH TRENDS 1Total loans, including loans held for sale 2Core earnings defined as pre-tax, pre-provision, pre-securities gain (loss) net earnings. $2,267 8 $1,466
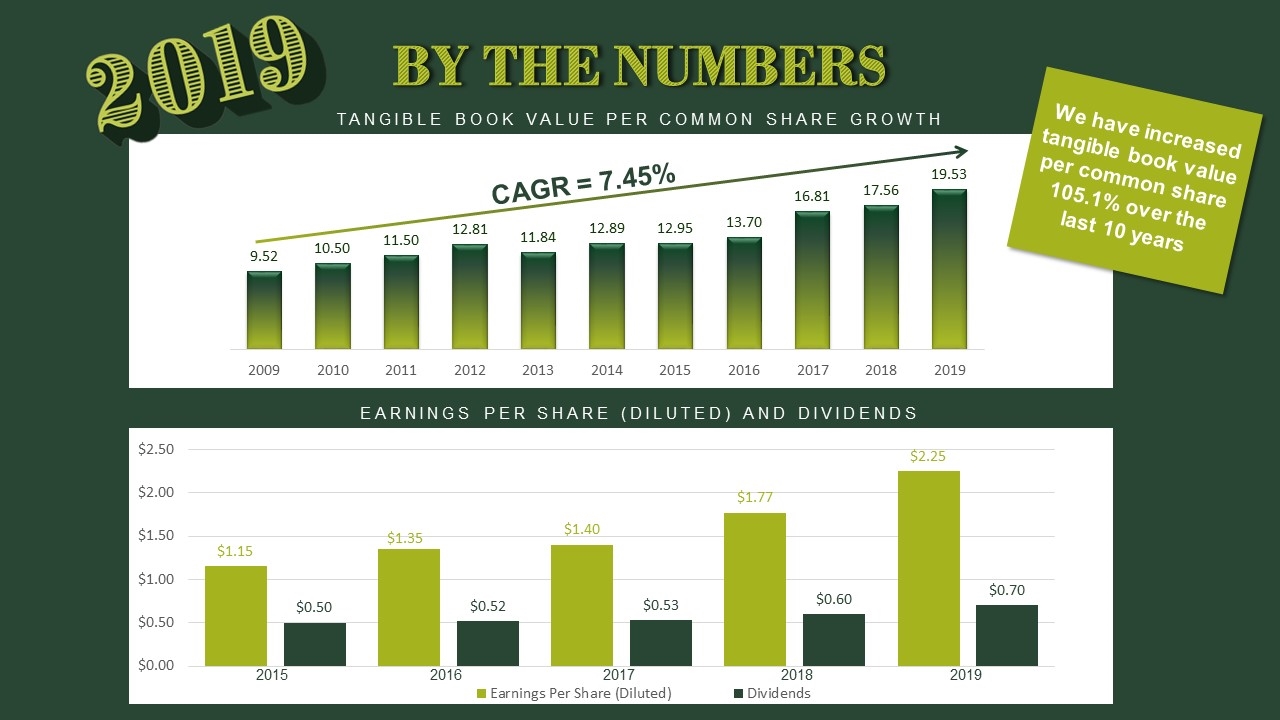
BY THE NUMBERS EARNINGS PER SHARE (DILUTED) AND DIVIDENDS We have increased tangible book value per common share 105.1% over the last 10 years CAGR = 7.45% 2015 TANGIBLE BOOK VALUE PER COMMON SHARE GROWTH
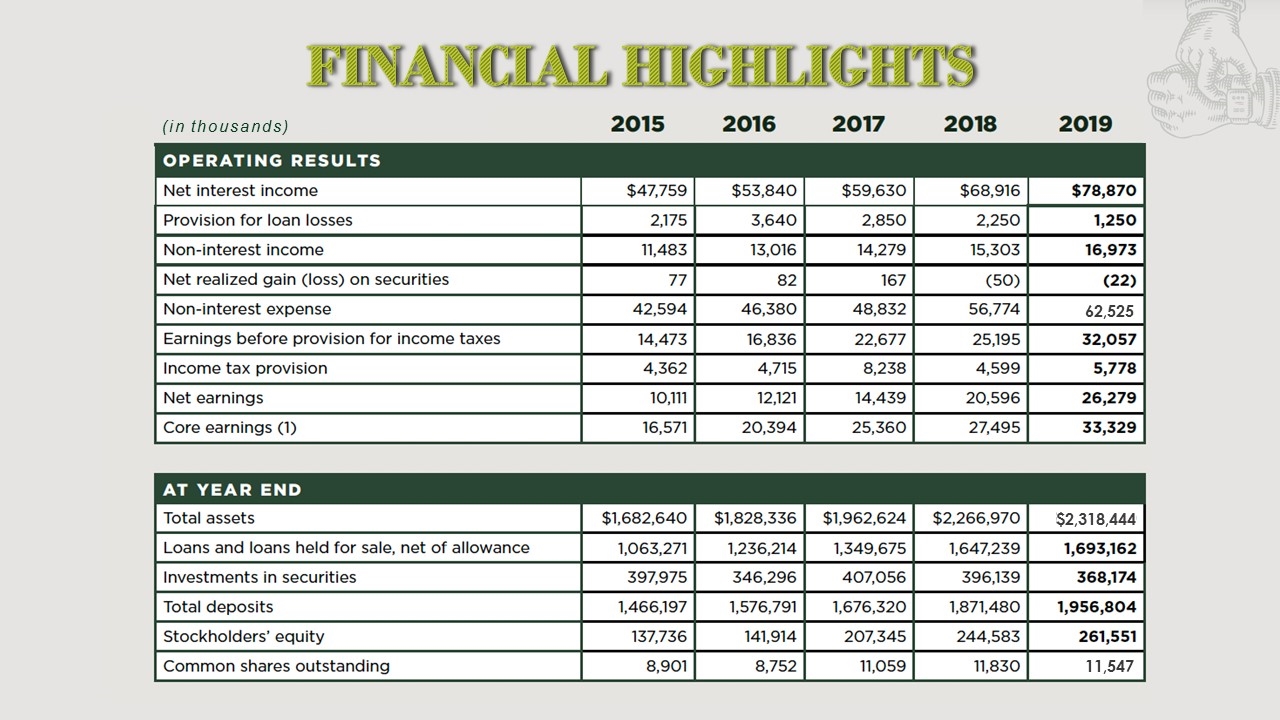
FINANCIAL HIGHLIGHTS (in thousands) 62,525 11,547 $2,318,444
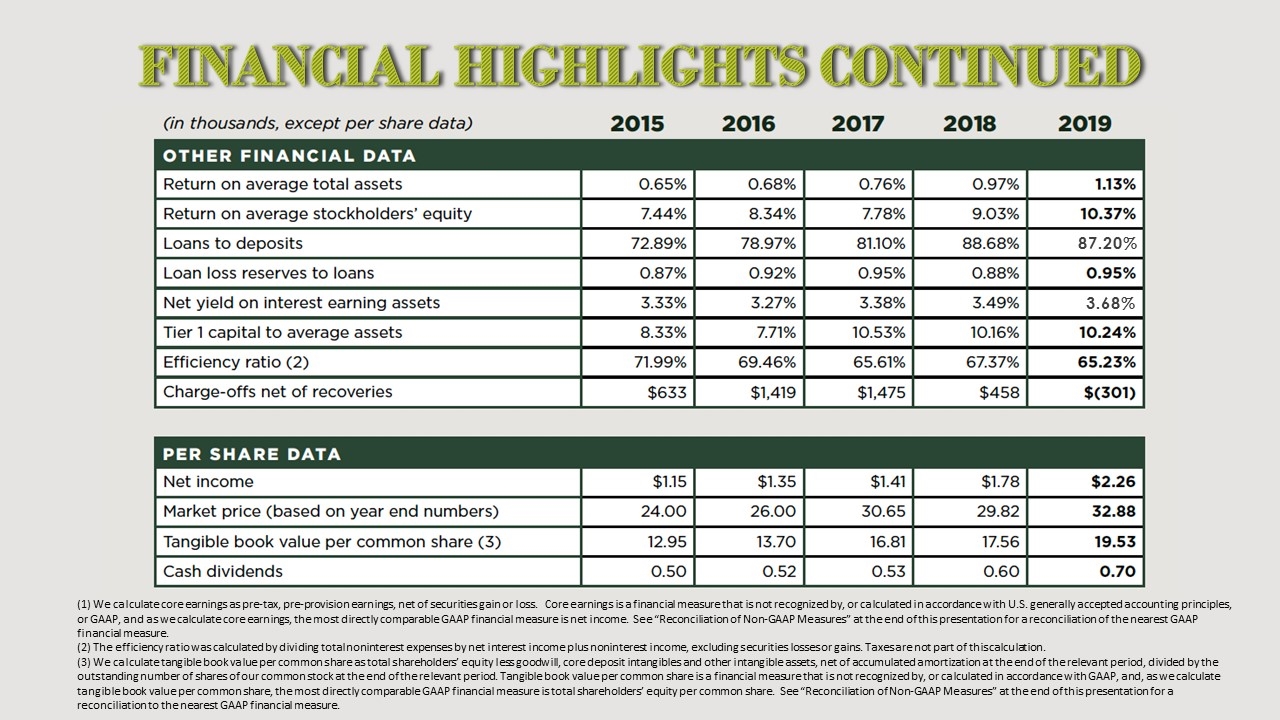
FINANCIAL HIGHLIGHTS CONTINUED (1) We calculate core earnings as pre-tax, pre-provision earnings, net of securities gain or loss. Core earnings is a financial measure that is not recognized by, or calculated in accordance with U.S. generally accepted accounting principles, or GAAP, and as we calculate core earnings, the most directly comparable GAAP financial measure is net income. See “Reconciliation of Non-GAAP Measures” at the end of this presentation for a reconciliation of the nearest GAAP financial measure. (2) The efficiency ratio was calculated by dividing total noninterest expenses by net interest income plus noninterest income, excluding securities losses or gains. Taxes are not part of this calculation. (3) We calculate tangible book value per common share as total shareholders’ equity less goodwill, core deposit intangibles and other intangible assets, net of accumulated amortization at the end of the relevant period, divided by the outstanding number of shares of our common stock at the end of the relevant period. Tangible book value per common share is a financial measure that is not recognized by, or calculated in accordance with GAAP, and, as we calculate tangible book value per common share, the most directly comparable GAAP financial measure is total shareholders’ equity per common share. See “Reconciliation of Non-GAAP Measures” at the end of this presentation for a reconciliation to the nearest GAAP financial measure. 87.20% 3.68%
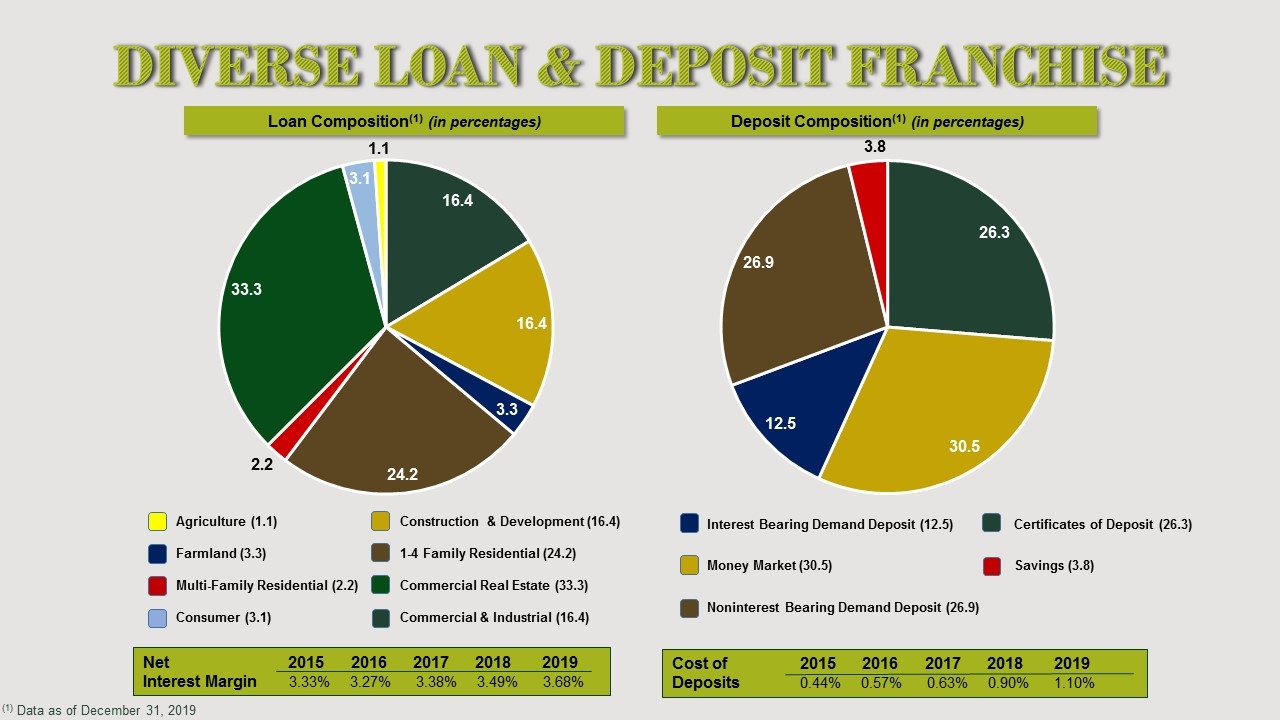
DIVERSE LOAN & DEPOSIT FRANCHISE Interest Bearing Demand Deposit (12.5) Money Market (30.5) Noninterest Bearing Demand Deposit (26.9) Agriculture (1.1) Farmland (3.3) Multi-Family Residential (2.2) Consumer (3.1) Certificates of Deposit (26.3) Savings (3.8) Construction & Development (16.4) 1-4 Family Residential (24.2) Commercial Real Estate (33.3) Commercial & Industrial (16.4) Loan Composition(1) (in percentages) (1) Data as of December 31, 2019 Deposit Composition(1) (in percentages) Net 2015 2016 2017 2018 2019 Interest Margin 3.33% 3.27% 3.38% 3.49% 3.68% Cost of2015 2016 2017 2018 2019 Deposits 0.44% 0.57% 0.63% 0.90% 1.10%
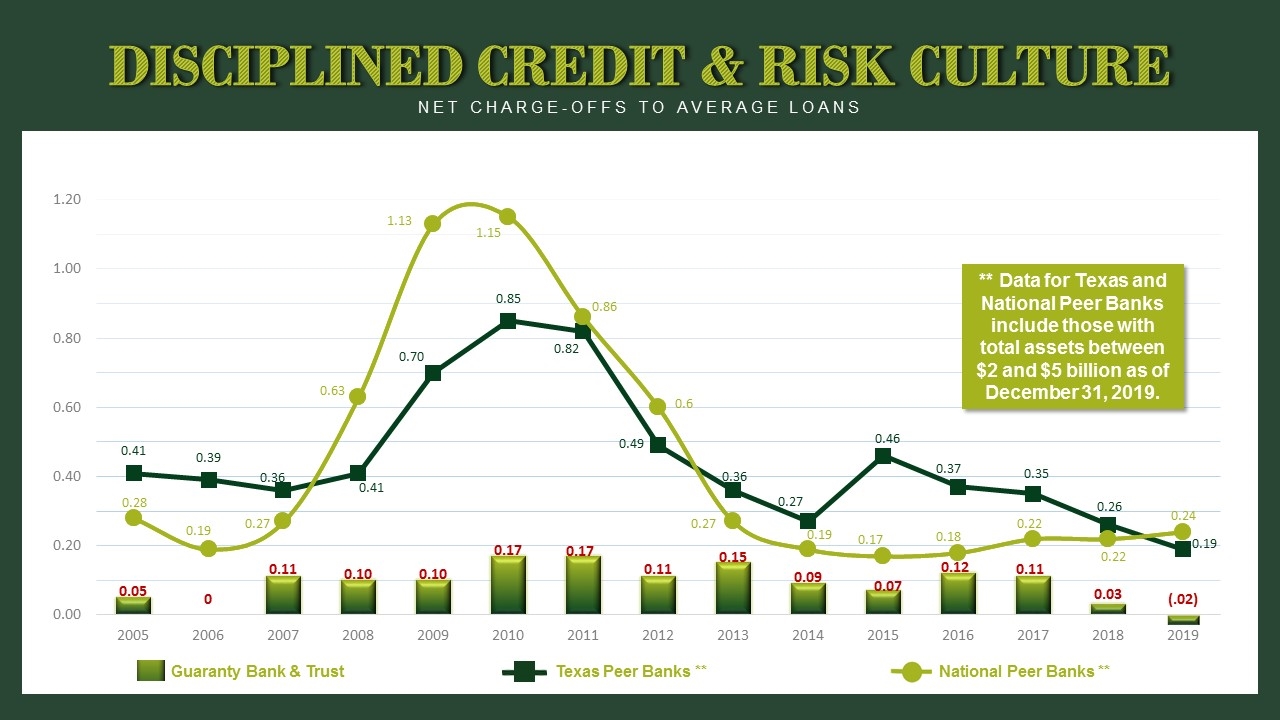
DISCIPLINED CREDIT & RISK CULTURE NET CHARGE-OFFS TO AVERAGE LOANS
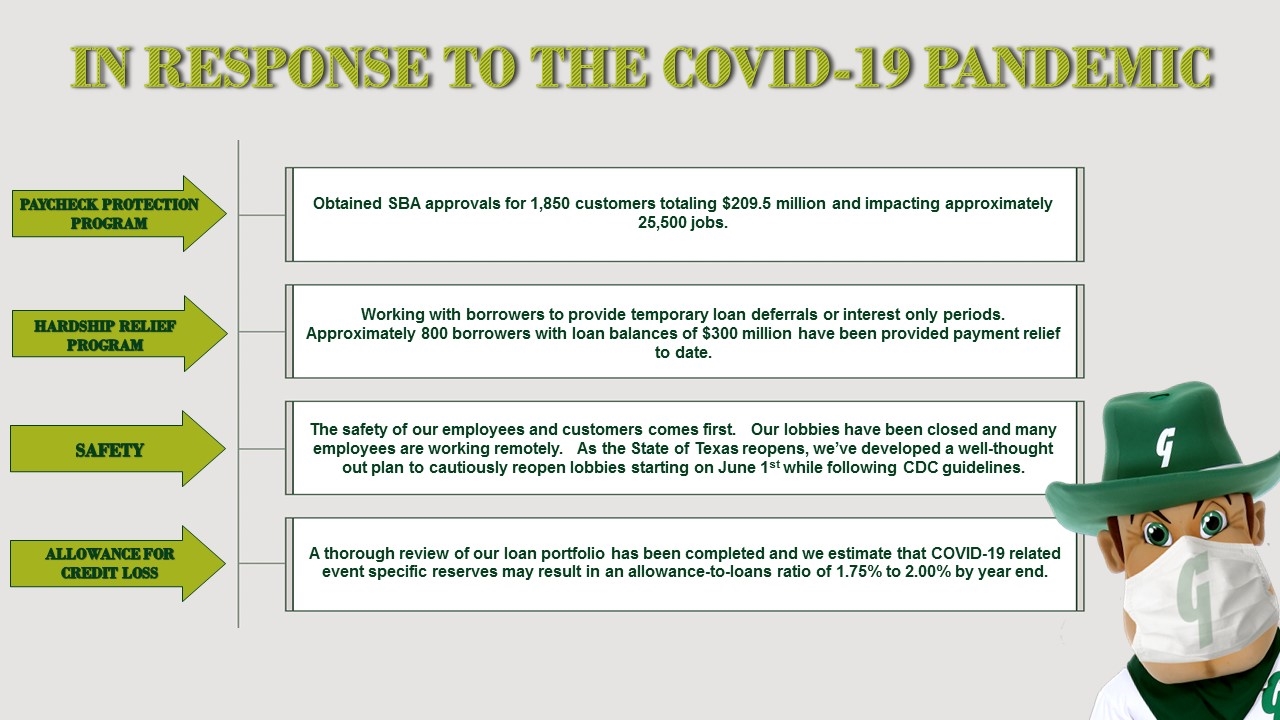
IN RESPONSE TO THE COVID-19 PANDEMIC Obtained SBA approvals for 1,850 customers totaling $209.5 million and impacting approximately 25,500 jobs. Working with borrowers to provide temporary loan deferrals or interest only periods. Approximately 800 borrowers with loan balances of $300 million have been provided payment relief to date. The safety of our employees and customers comes first. Our lobbies have been closed and many employees are working remotely. As the State of Texas reopens, we’ve developed a well-thought out plan to cautiously reopen lobbies starting on June 1st while following CDC guidelines. A thorough review of our loan portfolio has been completed and we estimate that COVID-19 related event specific reserves may result in an allowance-to-loans ratio of 1.75% to 2.00% by year end. SAFETY ALLOWANCE FOR CREDIT LOSS PAYCHECK PROTECTION PROGRAM HARDSHIP RELIEF PROGRAM
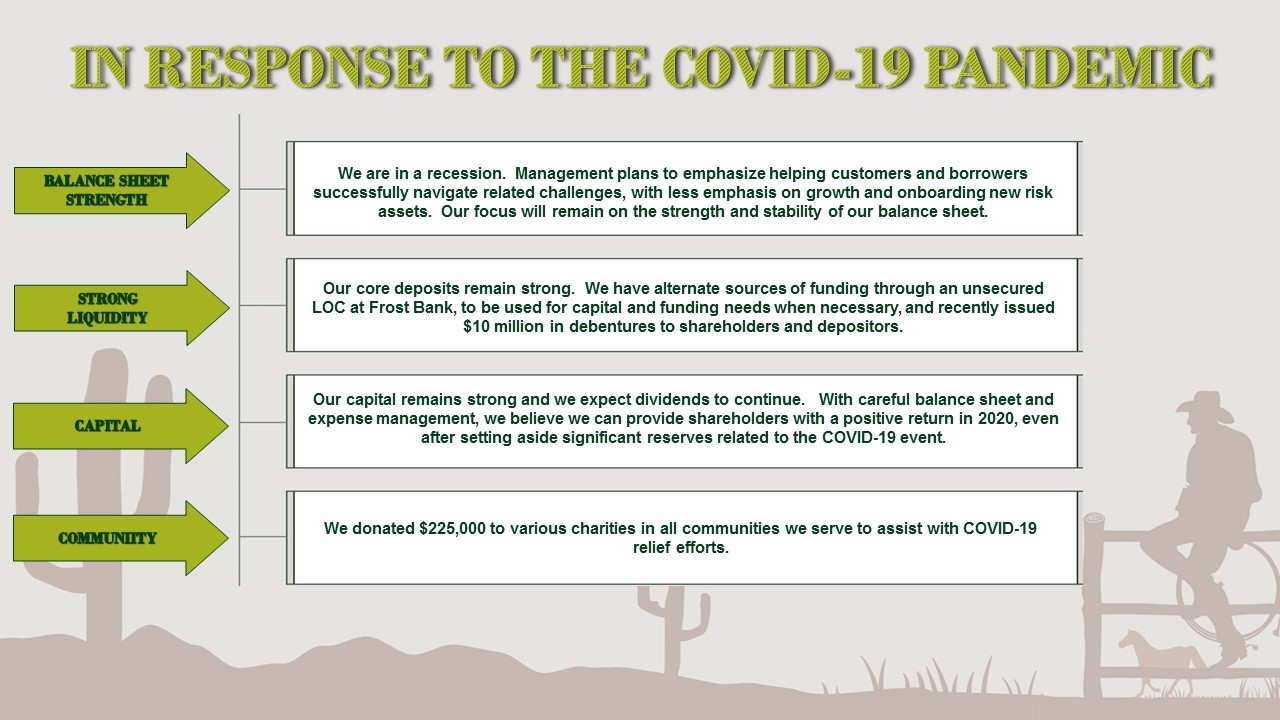
IN RESPONSE TO THE COVID-19 PANDEMIC We are in a recession. Management plans to emphasize helping customers and borrowers successfully navigate related challenges, with less emphasis on growth and onboarding new risk assets. Our focus will remain on the strength and stability of our balance sheet. Our core deposits remain strong. We have alternate sources of funding through an unsecured LOC at Frost Bank, to be used for capital and funding needs when necessary, and recently issued $10 million in debentures to shareholders and depositors. Our capital remains strong and we expect dividends to continue. With careful balance sheet and expense management, we believe we can provide shareholders with a positive return in 2020, even after setting aside significant reserves related to the COVID-19 event. BALANCE SHEET STRENGTH STRONG LIQUIDITY CAPITAL We donated $225,000 to various charities in all communities we serve to assist with COVID-19 relief efforts. COMMUNIITY
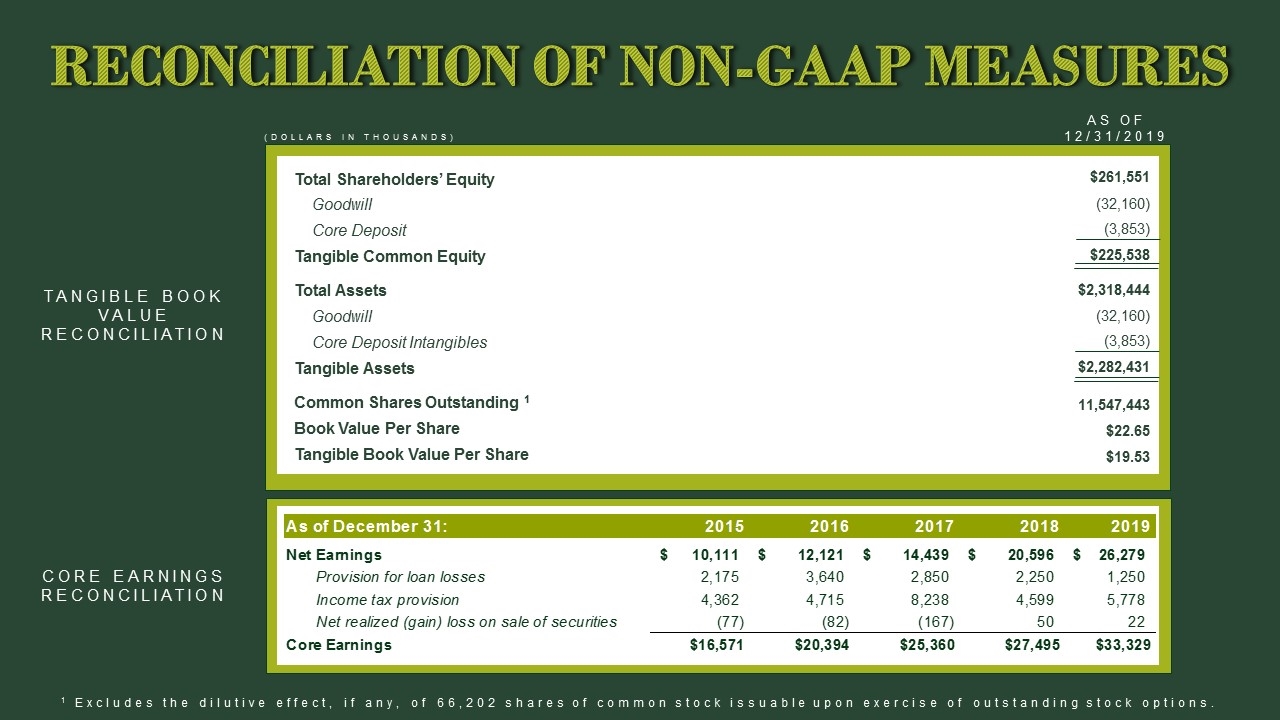
TANGIBLE BOOK VALUE RECONCILIATION RECONCILIATION OF NON-GAAP MEASURES (DOLLARS IN THOUSANDS) $261,551 (32,160) (3,853) $225,538 $2,318,444 (32,160) (3,853) $2,282,431 11,547,443 $22.65 $19.53 Total Shareholders’ Equity Goodwill Core Deposit Tangible Common Equity Total Assets Goodwill Core Deposit Intangibles Tangible Assets Common Shares Outstanding 1 Book Value Per Share Tangible Book Value Per Share CORE EARNINGS RECONCILIATION AS OF 12/31/2019 1 Excludes the dilutive effect, if any, of 66,202 shares of common stock issuable upon exercise of outstanding stock options. As of December 31: 2015 2016 2017 2018 2019 Net Earnings $10,111 $12,121 $14,439 $20,596 $26,279 Provision for loan losses 2175 3640 2850 2250 1250 Income tax provision 4362 4715 8238 4599 5778 Net realized (gain) loss on sale of securities -77 -82 -167 50 22 Core Earnings $16,571 $20,394 $25,360 $27,495 $33,329
ANNUAL SHAREHOLDER MEETING May 20, 2020


