Exhibit 99.1
| |
| Supplemental Financial Report for the |
| Quarter Ended March 31, 2022 |
AMERICA FIRST MULTIFAMILY INVESTORS, L.P.
All statements in this document other than statements of historical facts, including statements regarding our future results of operations and financial position, business strategy and plans and objectives of management for future operations, are forward-looking statements. When used, statements which are not historical in nature, including those containing words such as “anticipate,” “estimate,” “should,” “expect,” “believe,” “intend,” and similar expressions, are intended to identify forward-looking statements. We have based forward-looking statements largely on our current expectations and projections about future events and financial trends that we believe may affect our business, financial condition and results of operations. This document may also contain estimates and other statistical data made by independent parties and by us relating to market size and growth and other industry data. This data involves a number of assumptions and limitations, and you are cautioned not to give undue weight to such estimates. We have not independently verified the statistical and other industry data generated by independent parties contained in this supplement and, accordingly, we cannot guarantee their accuracy or completeness. In addition, projections, assumptions and estimates of our future performance and the future performance of the industries in which we operate are necessarily subject to a high degree of uncertainty and risk due to a variety of factors, including those described under the headings “Item 1A Risk Factors” in our 2021 Annual Report on Form 10-K for the year ended December 31, 2021. These forward-looking statements are subject to various risks and uncertainties and America First Multifamily Investors, L.P. (“ATAX” or “Partnership”) expressly disclaims any obligation to publicly update or revise any forward-looking statements, whether as a result of new information, future events or otherwise.
Most, but not all, of the selected financial information furnished herein is derived from the America First Multifamily Investors, L.P.’s consolidated financial statements and related notes prepared in conformity with generally accepted accounting principles in the United States of America (“GAAP”) and management’s discussion and analysis of financial condition and results of operations included in the Partnership’s reports on Forms 10-K and 10-Q. The Partnership’s annual consolidated financial statements were subject to an independent audit, dated February 24, 2022.
On April 1, 2022, the Partnership effected a one-for-three reverse unit split (“Reverse Unit Split”) of its outstanding Beneficial Unit Certificates ("BUCs"). As a result of the Reverse Unit Split, holders of BUCs received one BUC for every three BUCs owned at the close of business on April 1, 2022. All fractional BUCs created by the Reverse Unit Split were rounded to the nearest whole BUC, with any fraction equal to or above 0.5 BUC rounded up to the next higher BUC, as provided by the First Amended and Restated Agreement of Limited Partnership dated September 15, 2015, as further amended. Immediately prior to the Reverse Unit Split, there were 66,049,908 BUCs issued and outstanding, and immediately after the Reverse Unit Split the number of issued and outstanding BUCs decreased to approximately 22,016,636. The BUCs continue to trade on the Nasdaq Global Select Market under the trading symbol “ATAX.” The one-for-three Reverse Unit Split has been applied retroactively to all net income per BUC, distributions per BUC and similar per BUC disclosures for all periods presented in the Partnership’s supplemental financial report for the quarter ended March 31, 2022.
Disclosure Regarding Non-GAAP Measures
This document refers to certain financial measures that are identified as non-GAAP. We believe these non-GAAP measures are helpful to investors because they are the key information used by management to analyze our operations. This supplemental information should not be considered in isolation or as a substitute for the related GAAP measures.
Please see the consolidated financial statements we filed with the Securities and Exchange Commission on Forms 10-K and 10-Q. Our GAAP consolidated financial statements can be located upon searching for the Partnership’s filings at www.sec.gov.
PARTNERSHIP FINANCIAL INFORMATION
TABLE OF CONTENTS
| | |
| Pages |

| Letter from the CEO | 4 |

| Quarterly Fact Sheet | 6 |

| Financial Performance Trend Graphs | 7-12 |

| Other Partnership Information | 13 |

| Partnership Financial Measures | 14-15 |
| | |
AMERICA FIRST MULTIFAMILY INVESTORS, L.P.
LETTER FROM THE CEO
I am pleased to report ATAX’s operating results for the first quarter of 2022. We reported the following financial results as of and for the three months ended March 31, 2022:
•Total revenues of $19.2 million
•Net income, basic and diluted, of $1.03 per BUC
•Cash Available for Distribution (“CAD”) of $0.98 per BUC
•Total assets of $1.4 billion
•Total Mortgage Revenue Bond (“MRB”) and Governmental Issuer Loan (“GIL”) investments of $936.6 million
We reported the following notable transactions during the first quarter of 2022:
•Received proceeds from the sale of Vantage at Murfreesboro in Tennessee totaling $29.3 million on the Partnership’s initial investment commitment of $12.2 million in September 2018. The Partnership realized investment income and a gain on sale totaling $17.0 million upon sale.
•Advanced funds for six GIL investment commitments totaling $16.9 million and five related property loan investment commitments totaling $38.4 million. Such investments were partially funded with additional Tender Option Bond (“TOB”) trust financing proceeds of $48.6 million.
•Completed a restructuring of the outstanding debt of the Live 929 Apartments in Baltimore, MD. The restructuring transaction provided additional funds to resolve certain accounts payable at the property, fund a debt service reserve, perform repairs and capital improvements, and improve the property’s debt service coverage going forward. The Partnership’s two existing MRB investments with principal totaling $61.1 million were redeemed at par plus accrued interest and the Partnership purchased a new MRB and taxable MRB with principal totaling $70.0 million, which was partially funded with $56.0 million of proceeds from a new TOB trust financing with Mizuho.
•Advanced equity totaling $12.8 million for five joint venture equity investments
•Executed two interest rate swap agreements to synthetically fix the Partnership’s interest rate on TOB trust financings in notional amounts totaling $103.8 million.
We continue to strategically invest in the affordable multifamily MRB and GIL asset classes where we believe we can earn attractive leveraged returns. We also continue to see consistent operating results from our affordable multifamily MRBs and GILs, with all such investments being current on contractual principal and interest payments as of March 31, 2022.
Additional updates regarding our investment portfolio include the following:
•Five Vantage properties have completed construction, with four properties having achieved at least 90% physical occupancy and one property having achieved 89% physical occupancy as of March 31, 2022. One additional property will complete construction during the second quarter of 2022 and has already commenced leasing operations. Six additional Vantage properties are under construction or in development and none have experienced material supply chain disruptions for either construction materials or labor to date. As we have seen
| |
| 4 |
in the past, the Vantage group, as the managing member of each property-owning entity, will position a property for sale upon stabilization and to maximize return on investment.
•Our two owned student housing properties, The 50/50 MF Property (near the University of Nebraska-Lincoln) and the Suites on Paseo MF Property (near San Diego State University), continue to meet all direct mortgage and operating obligations with cash flows from operations. The 50/50 MF Property is 88% occupied and the Suites on Paseo MF Property is 93% occupied as of March 31, 2022.
Management continually assesses ATAX's exposure to changes in market interest rates, particularly given the recent market volatility and recent announcements by the Federal Reserve. Of ATAX's current debt financings, approximately one-third is variable-rate debt associated with variable-rate assets and another one-third is fixed rate debt associated with fixed rate assets. ATAX's net spread on these categories is not significantly impacted by increases in short-term interest rates. The remaining one-third of our debt financing is variable-rate debt associated with fixed-rate assets, and where ATAX is most exposed to rising short-term interest rates. We may implement hedges on such positions when considered appropriate, such as the two interest rate swap transactions we executed in the first quarter of 2022 with total notional amounts of $103.5 million.
Affiliates of Greystone continue to assist in our growth by introducing new investment opportunities. An affiliate of Greystone has forward committed to purchase seven of our GIL investments to date. We will continue to strategically work with our strongest sponsors on new investment opportunities where traditional sources of capital may not currently be available and to develop new relationships, particularly with those sponsors that are existing clients of Greystone and its affiliates.
Thank you for your continued support of ATAX!
Kenneth C. Rogozinski
Chief Executive Officer
| |
| 5 |
FIRST QUARTER 2022 FACT SHEET
| | | | | | | |
PARTNERSHIP DETAILS | | ATAX was formed for the primary purpose of acquiring a portfolio of MRBs that are issued to provide construction and/or permanent financing of affordable multifamily residential and commercial properties. We also invest in GILs, which are similar to MRBs, to provide construction financing for affordable multifamily properties. We continue to expect most of the interest paid on the MRBs and GILs to be excludable from gross income for federal income tax purposes. In addition, we have invested in equity interests in multifamily, market rate properties throughout the U.S. We have also acquired interests in multifamily properties (“MF Properties”) until the “highest and best use” can be determined. We continue to pursue a business strategy of acquiring additional MRBs and GILs on a leveraged basis, and other investments. |
(As of March 31, 2022) | |
| |
Symbol (NASDAQ) | | | ATAX | |
Most Recent Quarterly Distribution per BUC1 | $ | 0.33 | |
| | | |
BUC Price | $ | 18.15 | |
Year to Date Annualized Yield | | 7.3% | |
| | | | |
BUCs Outstanding | | | 22,016,636 | |
Market Capitalization | | $ | 399,601,943 | |
52-week BUC price range | | $16.50 to $21.21 | |
| | | | |
| | | | |
Partnership Financial Information for Q1 2022 ($’s in 000’s, except per BUC amounts) | |
| 3/31/2022 | | 12/31/2021 | |
| | | | |
Total Assets | $1,395,902 | | $1,385,909 | |
Leverage Ratio2 | 69% | | 69% | |
| | | | |
| Q1 2022 | | | |
| | | | |
Total Revenue | $19,206 | | | |
Net Income | $26,264 | | | |
Cash Available for Distribution (“CAD”)3 | $21,658 | | | |
Distributions Declared per BUC1 | $0.33 | | | |
(1)The distribution was paid on April 29, 2022 for BUC holders of record as of March 31, 2022. The distribution is payable to BUC holders of record as of the last business day of the quarter end and ATAX trades ex-dividend one day prior to the record date, with a payable date of the last business day of the subsequent month.
(2)Our overall leverage ratio is calculated as total outstanding debt divided by total assets using cost adjusted for paydowns and allowances for MRBs, Governmental Issuer Loans, property loans, taxable MRBs and taxable GILs, and initial cost for deferred financing costs and real estate assets.
(3)Management utilizes a calculation of Cash Available for Distribution (“CAD”) to assess the Partnership’s operating performance. This is a non-GAAP financial measure and a reconciliation of our GAAP net income (loss) to CAD is provided on page 14 of the Supplement herein.
| |
| 6 |
ATAX ASSET PROFILE
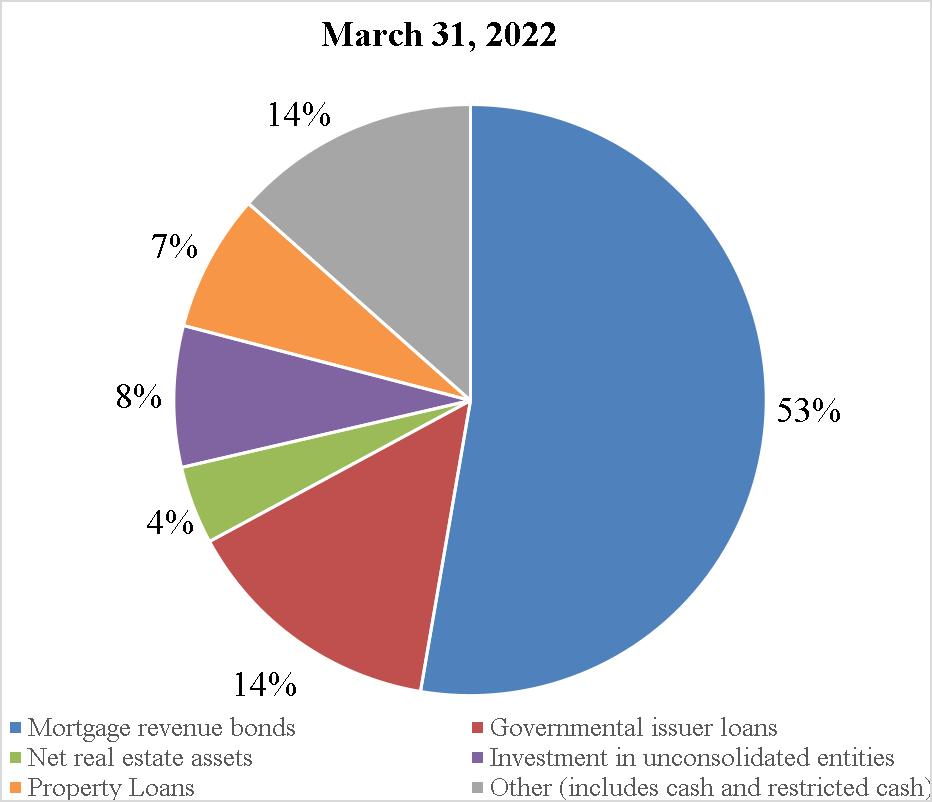
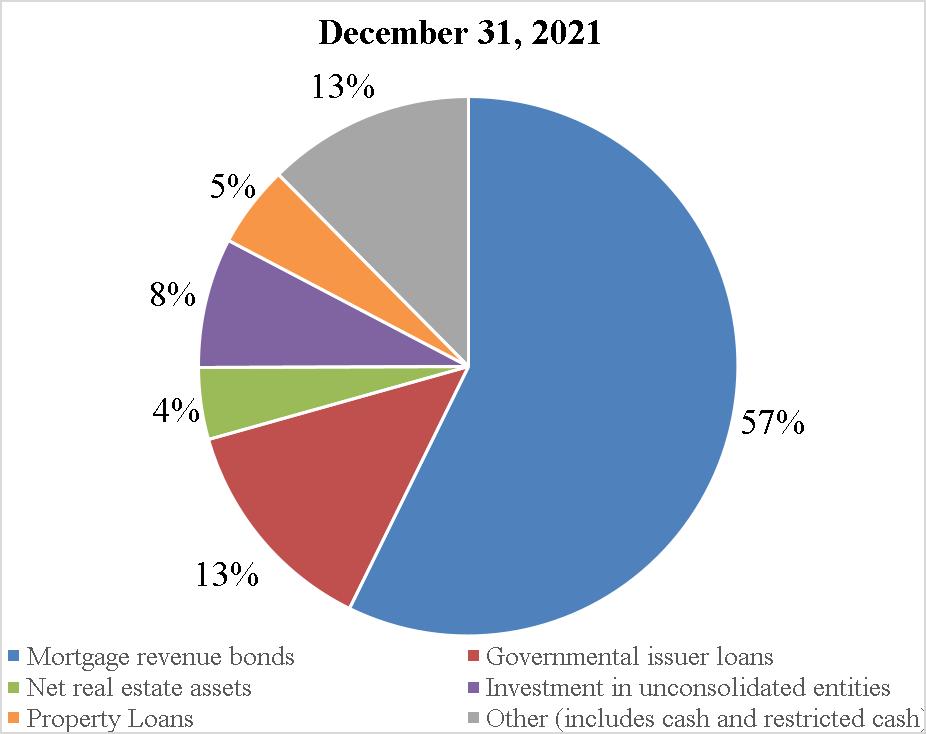
| |
| 7 |
ATAX MORTGAGE INVESTMENT PROFILE
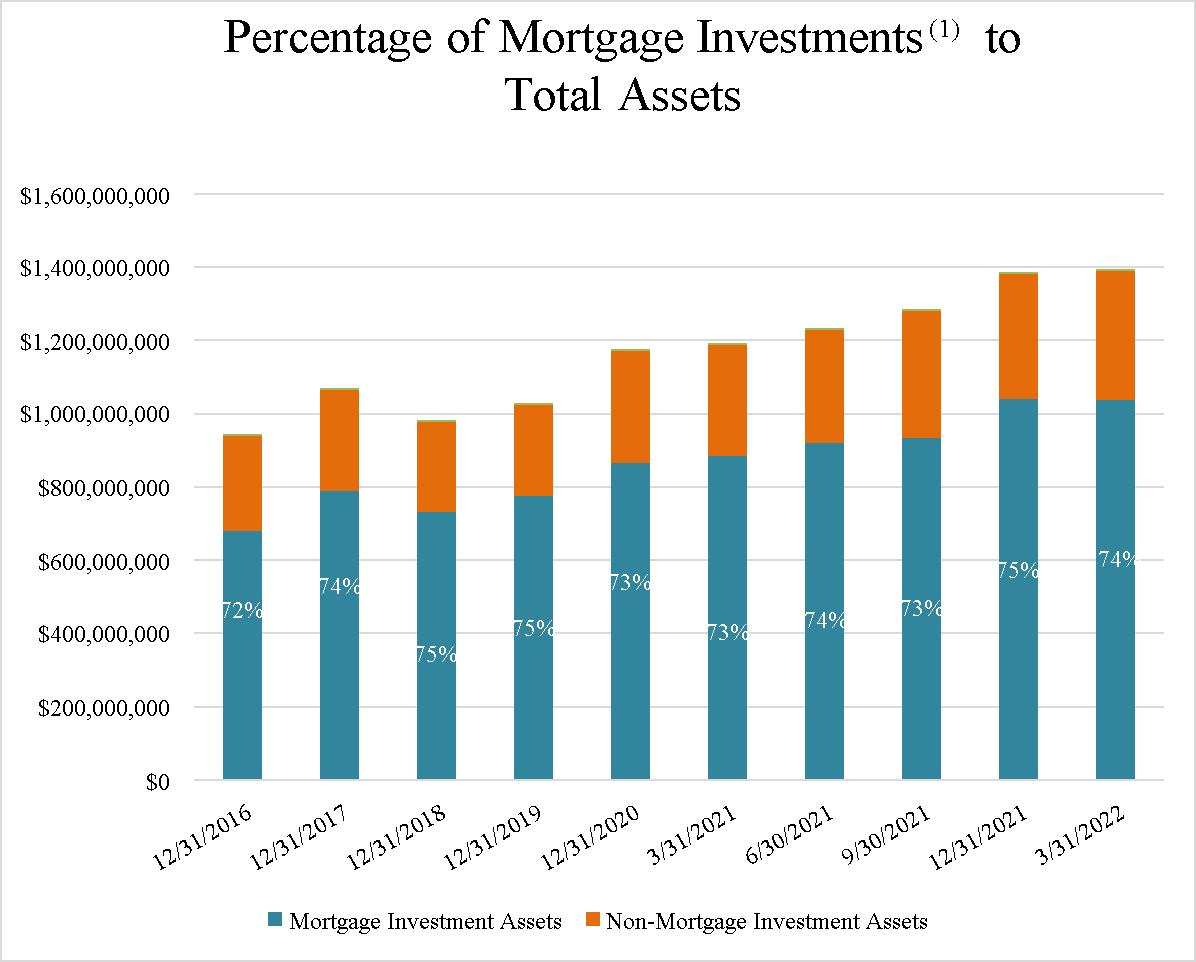
(1)Mortgage Investments include the Partnership’s Mortgage Revenue Bonds, Governmental Issuer Loans and Property Loans that share a first mortgage lien with the Governmental Issuer Loans.
| |
| 8 |
ATAX DEBT AND EQUITY PROFILE
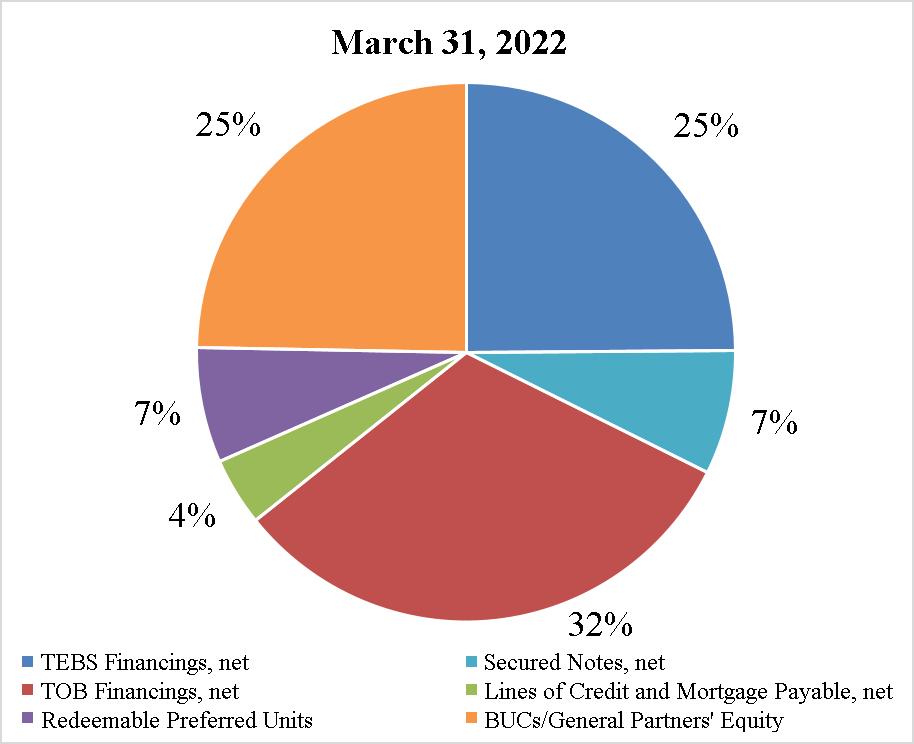
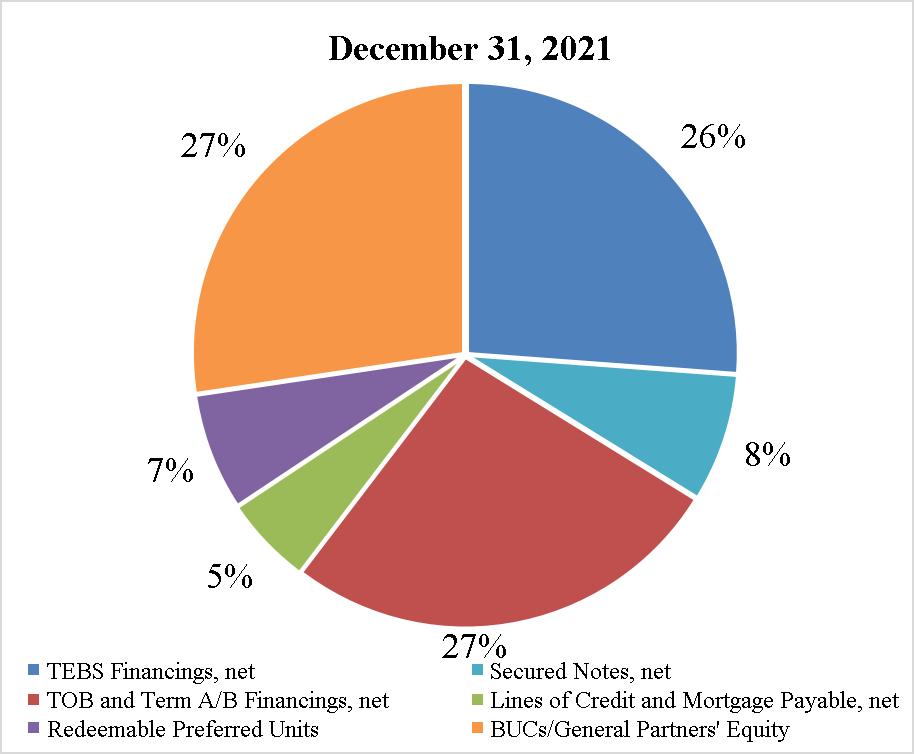
| |
| 9 |
DEBT FINANCING ($’s in 000’s)
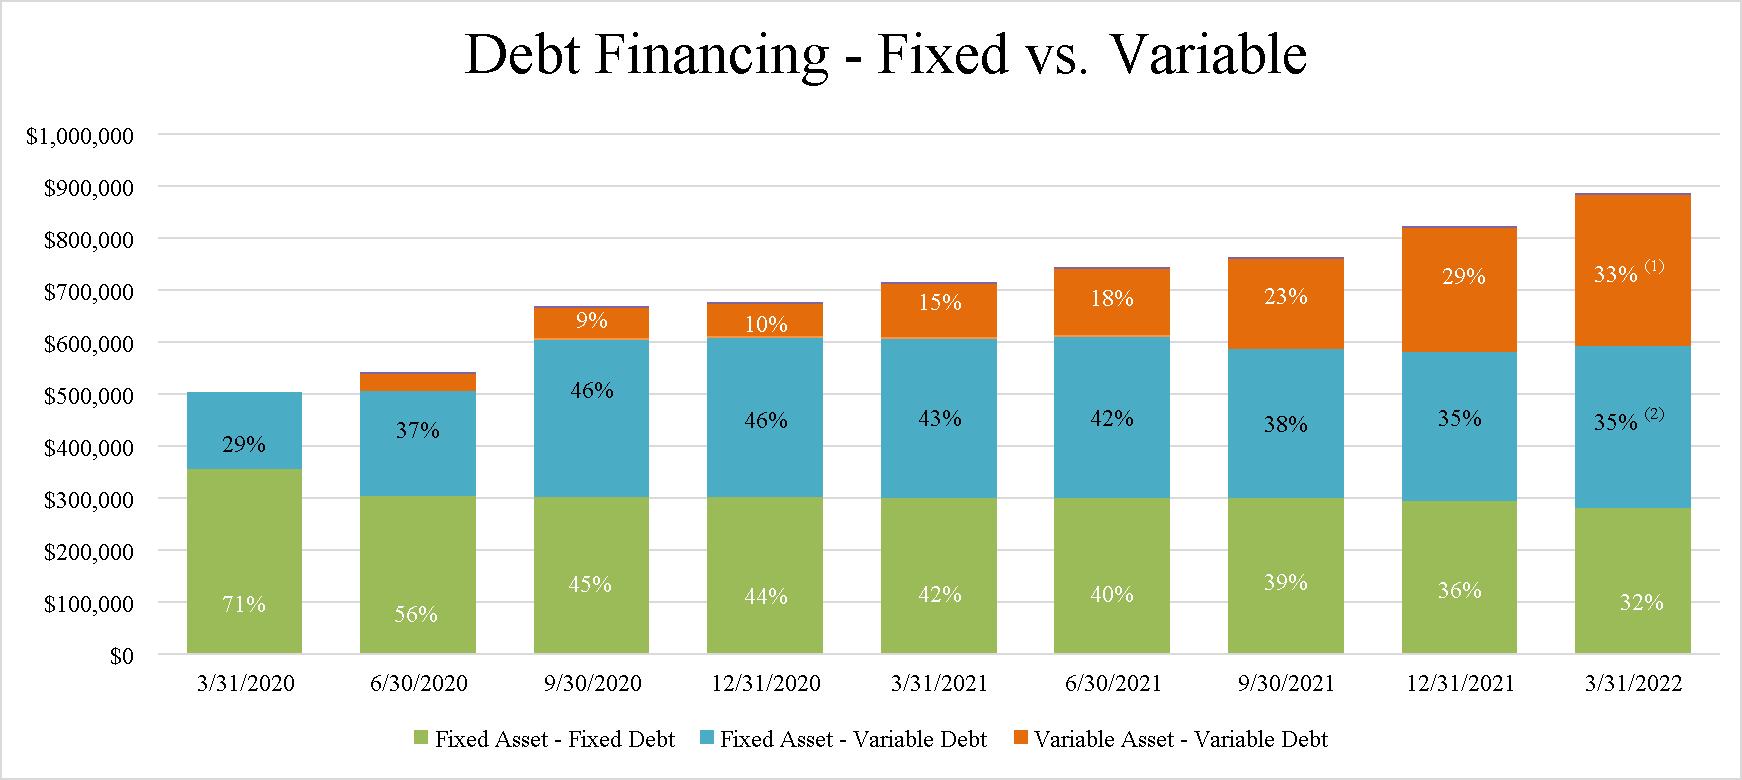
(1)The securitized assets and related debt financings each have variable interest rates, though the variable rate indices may differ. As such, the Partnership is at least partially hedged against rising interest rates.
(2)As of March 31, 2022, we have two interest rate swaps indexed to SOFR with notional amounts totaling $103.8 million with terms through 2024 and 2027. These interest rate swaps essentially fix the interest rate on $103.8 million of debt financing principal.
INTEREST RATE SENSITIVITY ANALYSIS (1)
| | | | | | | | | | | | | | | | | | | | |
Description | | - 25 basis points | | | + 50 basis points | | | + 100 basis points | | | + 150 basis points | | | + 200 basis points | |
TOB Debt Financings | | $ | 1,131,993 | | | $ | (2,263,986 | ) | | $ | (4,527,972 | ) | | $ | (6,791,959 | ) | | $ | (9,055,945 | ) |
TEBS Debt Financings | | | 127,391 | | | | (254,781 | ) | | | (509,562 | ) | | | (764,343 | ) | | | (1,019,124 | ) |
Other Investment Financings | | | (17,763 | ) | | | 34,578 | | | | 69,157 | | | | 103,735 | | | | 138,314 | |
Variable Rate Investments | | | (892,975 | ) | | | 1,892,160 | | | | 3,827,651 | | | | 5,774,873 | | | | 7,722,104 | |
Total | | $ | 348,646 | | | $ | (592,029 | ) | | $ | (1,140,726 | ) | | $ | (1,677,694 | ) | | $ | (2,214,651 | ) |
(1)The interest rate sensitivity table above represents the change in interest income from investments, net of interest on debt and settlement payments for interest rate derivatives over the next twelve months, assuming an immediate parallel shift in the LIBOR yield curve and the resulting implied forward rates are realized as a component of this shift in the curve and assuming management does not adjust its strategy in response.
| |
| 10 |
TOTAL REVENUE & GAIN ON SALE TRENDS
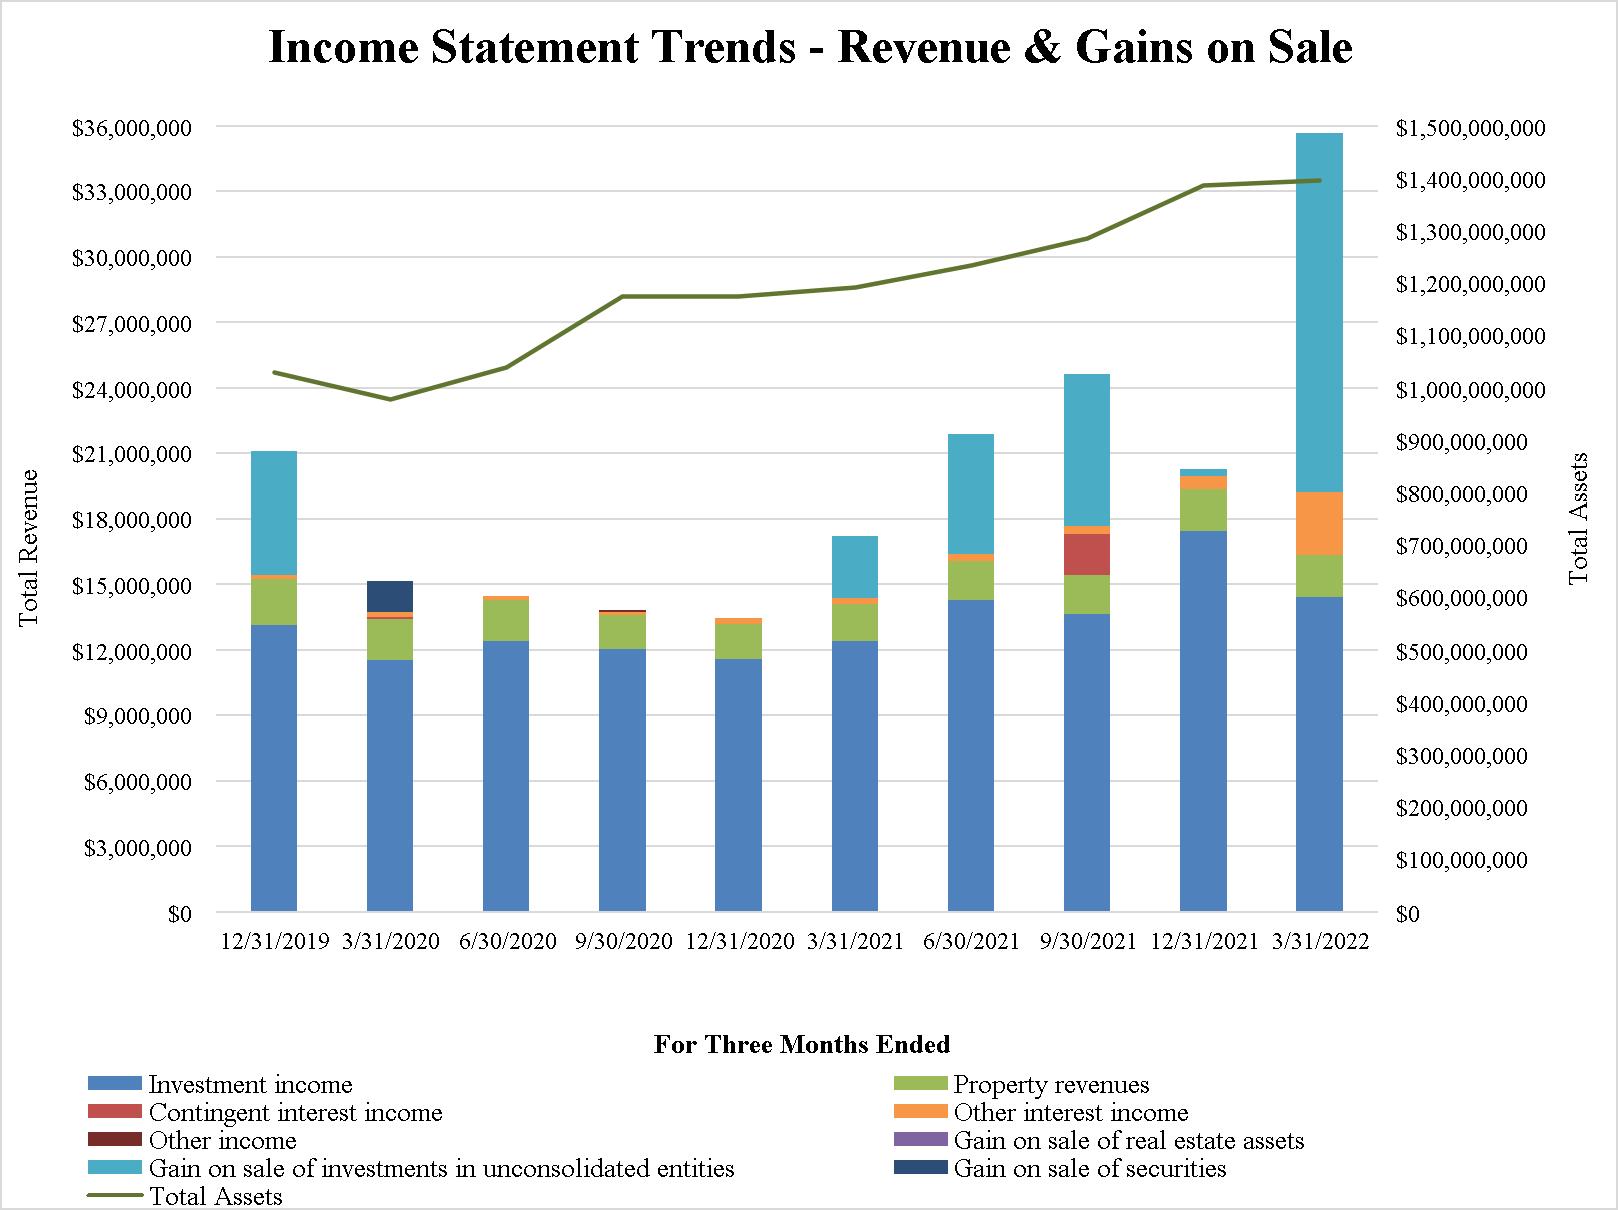
| |
| 11 |
OPERATING EXPENSE TRENDS
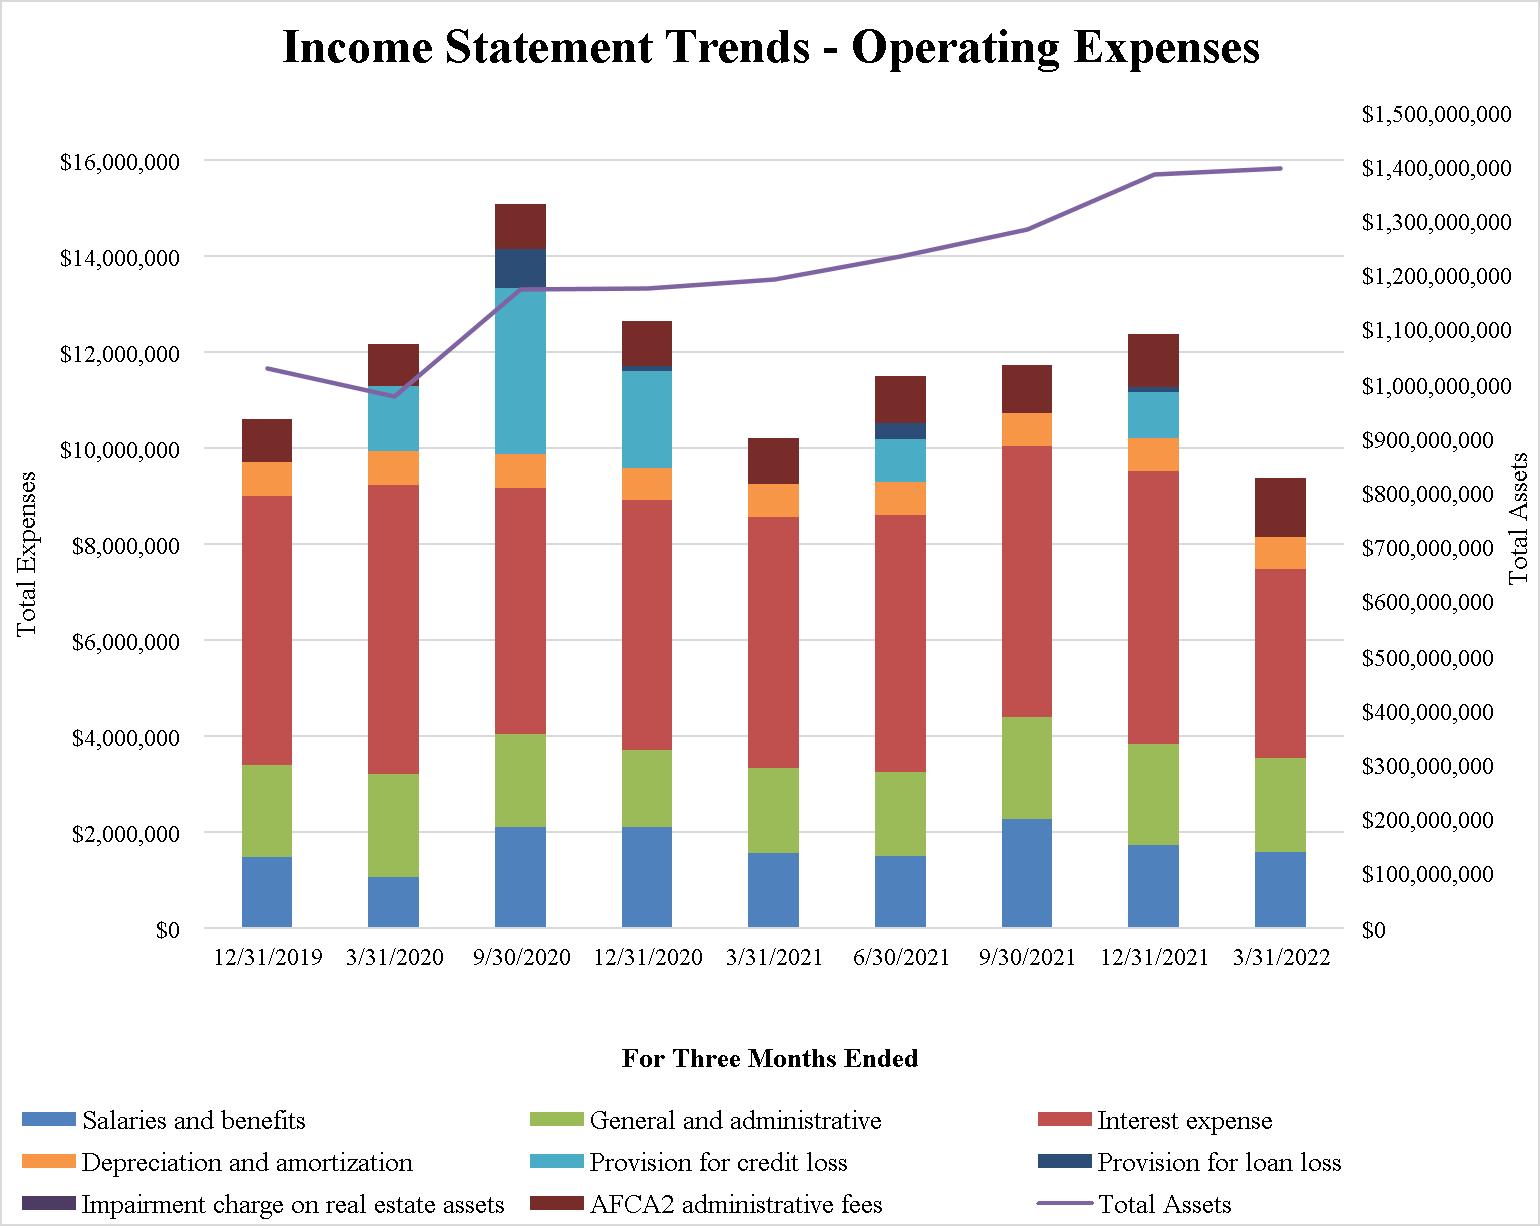
•Since April 1, 2020, the ratio of “Salaries and benefits” and “General and administrative” expenses to Total assets has averaged approximately 0.29% per quarter.
| |
| 12 |
| | | | |
OTHER PARTNERSHIP INFORMATION |
| | | |
Corporate Office: | | | Transfer Agent: |
14301 FNB Parkway | | | American Stock Transfer & Trust Company |
Suite 211 | | | 59 Maiden Lane |
Omaha, NE 68154 | | | Plaza Level |
Phone: | 402-952-1235 | | New York, NY 10038 |
Investor & K-1 Services: | 855-4AT-AXK1 | | | Phone: 718-921-8124 |
Web Site: | www.ataxfund.com | | | 888-991-9902 |
K-1 Services Email: | k1s@ataxfund.com | | | |
Ticker Symbol: | ATAX | | | |
| | |
Corporate Counsel: | | Independent Accountants: |
Barnes & Thornburg LLP | | PwC |
11 S. Meridian Street | | 1 North Wacker Drive |
Indianapolis, IN 46204 | | Chicago, Illinois 60606 |
| | |
Board of Managers of Greystone AF Manager LLC: |
(acting as the directors of ATAX) |
| | |
Stephen Rosenberg | | Chairman of the Board |
Curtis A. Pollock | | Manager |
Jeffrey M. Baevsky | | Manager |
Drew C. Fletcher | | Manager |
Steven C. Lilly | | Manager |
W. Kimball Griffith | | Manager |
Deborah A. Wilson | | Manager |
| | |
Corporate Officers: |
Chief Executive Officer – Kenneth C. Rogozinski |
Chief Financial Officer – Jesse A. Coury |
| |
| 13 |
AMERICA FIRST MULTIFAMILY INVESTORS, L.P.
CASH AVAILABLE FOR DISTRIBUTION (CAD) AND OTHER PERFORMANCE MEASURES
The following table contains reconciliations of the Partnership’s GAAP net income to its CAD:
| | | |
| For the Three | |
| Months Ended | |
| March 31, 2022 | |
Net income | $ | 26,264,018 | |
Change in fair value of derivatives | | (2,475,131 | ) |
Depreciation and amortization expense | | 683,662 | |
Amortization of deferred financing costs | | 451,472 | |
Restricted unit compensation expense | | 173,898 | |
Deferred income taxes | | 7,266 | |
Redeemable Preferred Unit distributions and accretion | | (717,744 | ) |
Tier 2 Income allocable to the General Partner | | (2,645,979 | ) |
Recovery of prior credit loss | | (5,279 | ) |
Bond purchase premium (discount) amortization (accretion), net of cash received | | (78,375 | ) |
Total CAD | $ | 21,657,808 | |
| | |
Weighted average number of BUCs outstanding, basic | | 22,016,636 | |
| | |
Net income per BUC, basic | $ | 1.03 | |
Total CAD per BUC, basic | $ | 0.98 | |
Distributions declared per BUC | $ | 0.33 | |
| |

| 14 |
AMERICA FIRST MULTIFAMILY INVESTORS, L.P.
TAX INCOME INFORMATION RELATED TO BENEFICIAL UNIT CERTIFICATES
The following table summarizes tax-exempt and taxable income as percentages of total income allocated to the Partnership’s BUCs on Schedule K-1 for tax years 2019 to 2021. This disclosure relates only to income allocated to the Partnership’s BUCs and does not consider an individual unitholder’s basis in the BUCs or potential return of capital as such matters are dependent on the individual unitholders’ specific tax circumstances. Such amounts are for all BUC holders in the aggregate during the year. Income is allocated to individual investors monthly and amounts allocated to individual investors may differ from these percentage due to, including, but not limited to, BUC purchases and sales activity and the timing of significant transactions during the year.
| | | | | |
| 2021 | | 2020 | | 2019 |
Tax-exempt income | 32% | | 215% | | 37% |
Taxable income (loss) | 68% | | -115% | (1) | 63% |
| 100% | | 100% | | 100% |
| | | | | |
(1)The taxable loss in 2020 is due primarily to net rental real estate losses that exceeded gains on sale for tax purposes during the year related to the Partnership’s investment in unconsolidated entities.
| |
| 15 |