Table of Contents
SECURITIES AND EXCHANGE COMMISSION
WASHINGTON, D.C. 20549
FORM 10-K
(Mark One)
| [X] | ANNUAL REPORT PURSUANT TO SECTION 13 OR 15(d) OF THE SECURITIES EXCHANGE ACT OF 1934 |
For the Fiscal Year Ended December 30, 2001
OR
| [ ] | TRANSITION REPORT PURSUANT TO SECTION 13 OR 15(d) OF THE SECURITIES EXCHANGE ACT OF 1934 |
For the transition period from to .
Commission File Number: 333-49821
MSX INTERNATIONAL, INC.
(Exact name of registrant as specified in its charter)
| Delaware (State or other jurisdiction of incorporation or organization) | 38-3323099 (I.R.S. Employer Identification No.) | |
| 275 Rex Boulevard, Auburn Hills, Michigan (Address of principal executive offices) | 48326 (Zip Code) |
(248) 299-1000
(Registrant’s telephone number, including area code)
Securities registered pursuant to Section 12(b) of the Act: None
Securities registered pursuant to Section 12(g) of the Act: None
Indicate by check mark whether the registrant (1) has filed all reports required to be filed by Section 13 or 15(d) of the Securities and Exchange Act of 1934 during the preceding 12 months (or for such shorter period that the registrant was required to file such reports), and (2) has been subject to such filing requirements for the past 90 days.
Yes [X] No [ ]
Indicate by check mark if disclosure of delinquent filers pursuant to Item 405 of Regulation S-K is not contained herein, and will not be contained, to the best of registrant’s knowledge, in definitive proxy or information statements incorporated by reference in Part III of this Form 10-K or any amendment to this Form 10-K. [X]
None of the registrant’s common stock is held by non-affiliates of the registrant.
Number of shares outstanding of each of the registrant’s classes of common stock at March 4, 2002:
20,054,000 shares of Class A Common Stock, $0.01 par value.
TABLE OF CONTENTS
Table of Contents
TABLE OF CONTENTS
| Item | Page | |||||||
PART I | ||||||||
| 1. | Business | 2 | ||||||
| 2. | Properties | 9 | ||||||
| 3. | Legal Proceedings | 9 | ||||||
| 4. | Submission of Matters to a Vote of Security Holders | 9 | ||||||
PART II | ||||||||
| 5. | Market for Registrant's Common Equity and Related Stockholder Matters | 10 | ||||||
| 6. | Selected Financial Data | 11 | ||||||
| 7. | Management's Discussion and Analysis of Financial Condition and Results | |||||||
| of Operations | 12 | |||||||
| 7A. | Quantitative and Qualitative Disclosures about Market Risk | 19 | ||||||
| 8. | Financial Statements and Supplementary Data | 21 | ||||||
| 9. | Changes in and Disagreements with Accountants on Accounting and Financial | |||||||
| Disclosure | n/a | |||||||
PART III | ||||||||
| 10. | Directors and Executive Officers of the Registrant | 47 | ||||||
| 11. | Executive Compensation | 48 | ||||||
| 12. | Security Ownership of Certain Beneficial Owners and Management | 50 | ||||||
| 13. | Certain Relationships and Related Transactions | 51 | ||||||
PART IV | ||||||||
| 14. | Exhibits, Financial Statement Schedules, and Reports on Form 8-K | 52 | ||||||
| Signatures | 54 | |||||||
1
Table of Contents
PART I
Item 1. Business.
General
MSX International, Inc. (“MSXI”), headquartered in Auburn Hills, Michigan, combines innovative people, standardized processes and today’s technologies to deliver collaborative enterprise services on a global basis. We are a single source provider of these services at our facilities, at our customers’ facilities, and through web-based and other commerce networks. With both scalable and customized solutions, our people offer broad-based knowledge and experience that adds value to various phases in the life cycle of our customers’ products and services. We currently employ more than 10,000 professional staff at over 100 operating locations in 26 countries.
Since our formation, we have pursued both internal development and complementary acquisitions that have expanded our geographic and customer reach, increased our technical service capabilities and leveraged our corporate services. More recently, we have worked to refine and package our many capabilities and resources into fewer, more scalable service offerings. We have increased our market penetration of existing customers and the global automotive market, while expanding further into non-automotive markets. A strategic imperative is to expand our customer base beyond the automotive industry to demonstrate the universal applicability and economic value of our business services while continuing to grow our automotive business. Over the last three years we have increased our sales to non-automotive customers from 11.3% of net sales in fiscal 1999 to 24.1% in fiscal 2001.
Collaborative Service Offerings
We provide a broad range of collaborative enterprise services to our customers and group our offerings under three types of services: collaborative engineering management, human capital management, and other collaborative services. The following table sets forth, for the three fiscal years ended December 30, 2001, a summary of our net sales by type of service.
| Fiscal Year Ended | |||||||||||||
| January 2, | December 31, | December 30, | |||||||||||
| 2000 | 2000 | 2001 | |||||||||||
| (in thousands) | |||||||||||||
| Collaborative Engineering Management | $ | 279,028 | $ | 298,206 | $ | 270,424 | |||||||
| Human Capital Management Services | 322,342 | 469,773 | 401,212 | ||||||||||
| Other Collaborative Services | 158,472 | 267,244 | 257,621 | ||||||||||
| Total net sales | $ | 759,842 | $ | 1,035,223 | $ | 929,257 | |||||||
By leveraging competencies from each of our services, we believe we are positioned to compete in large and growing areas of the global economy. Our scalable solutions and customized offerings are adapted to customer needs that have emerged in recent years due to the convergence of digital communication technologies and business process improvement initiatives. Our net sales are based principally on fees charged for resources provided to support development, manufacturing and distribution of customer products and services. Our customers increasingly rely on outside vendors with combined intellectual capital and service delivery resources to provide them with these essential services, allowing them to improve operating efficiency by focusing on core competencies.
Our domestic and foreign markets are highly competitive. In some cases, our global competitors include a number of other well-established vendors, as well as customers with their own internal capabilities. Although a number of companies of varying size compete with us, no single competitor is substantially in competition with respect to all of our services. The following is a summary of our offerings through each of our collaborative services.
2
Table of Contents
Collaborative Engineering Management
We provide a complete range of engineering and design services to transportation related industries. Our solutions, which can be delivered at any or substantially all points of the product development cycle, include:
| • | Total product solutions— total engineering solutions spanning from product viability and concept development to validation, product launch, and performance measurement for continuous improvement | ||
| • | Custom engineering solutions— designed to meet any combination of specific customer engineering needs during the product development cycle | ||
| • | Single point solutions— services designed to meet specific needs of customers by delivering “turn-key” solutions to fit into each customer’s unique design processes |
Our services include computer-aided design, analysis and engineering, product and manufacturing engineering, assembly tooling, program management, engineering training through MSX International University and specialty vehicle support for the marketing programs of original equipment manufacturers (“OEMs”) and for non-automotive vehicle applications. Our capabilities are also enhanced by our human capital management services that support our engineering resource needs as well as the temporary/permanent staffing needs of our customers. As of January 2002, about $167 million of our collaborative engineering sales are either “booked” or recurring based on long-term relationships, compared to approximately $239 million in January 2001. The decrease reflects a decline in automotive design work due to the current economic environment.
Competition among engineering services vendors is based on the types of individual and bundled services offered and by the location of customers. The basis of competition includes the size of competing firms, global capability, relevant experience, prior relationships with customers and price. In the United States, we compete with Modern Engineering (a subsidiary of CDI), Rapid Design Services, Inc., Roush Industries, Inc., and Defiance, among others. European competition includes Bertrandt, Rücker, IVM, RLE, Magna-Steyr, Stola, Pininfarina, Italdesign, Engineering & Design AG and Hawtal Whiting, a subsidiary of Wagon plc.
Human Capital Management Services
We provide a broad range of services to help maximize the effectiveness, flow and utilization of human capital, particularly in technology-oriented environments. Through this practice we provide custom staffing solutions, including:
| • | Contingent staffing & direct placement— traditional temporary and/or permanent staffing solutions for information technology, engineering or other professional staff needs. Our staffing capabilities include design and production engineers, computer operators, database specialists, network administrators and specialists, PC support staff, software engineers, systems analysts and administrators, and technical support specialists | ||
| • | Retained search services— direct recruitment of middle and senior management talent on a “retained” basis | ||
| • | Vendor management services/master service provider— management of the entire contract staffing procurement and deployment process on a regional, national or global basis | ||
| • | Specialized training— training programs and virtual training courseware |
We currently provide these services to a wide variety of industries for both short and long-term assignments with international delivery, recruiting and training capability. We are a worldwide leader in automotive technical staffing, providing engineers, designers and technicians on a contract basis to support our customers’ product development efforts. We supply outsourced professional services based on our ability to identify, match and provide high quality personnel on an efficient basis and at a competitive price. We manage and compete with many companies in the technical staffing industry, which is highly competitive, fragmented, and historically has had limited barriers to entry. We use a variety of resources and techniques to support our recruiting capability, including support of a proprietary web-enabled recruiting system, licenses with web exchanges, internal training through MSX International University, international sourcing, and competitive benchmarking of compensation and benefits. Our competitors in human capital management services include Adecco International, CDI, Keane, kforce, TechAid, Manpower, Kelly Services Technical, Olsten, Randstad (in Europe only), Volt, and numerous regional information technology staffing firms. Other indirect competitors include Monster.com (a subsidiary of TMP Worldwide) and other internet-based staffing resources.
3
Table of Contents
Other Collaborative Services
We provide a broad range of technology-based business services to help support the objectives of our customers. Our service offerings include:
| • | Quality Relationship Management —We believe our quality relationship management programs give our customers a competitive edge by providing the actionable product, market and customer information they need to improve product quality, reduce costs and improve customer loyalty and satisfaction. Examples of our services include: | ||
| • | Warranty support programs — Management & operation of parts return centers, warranty process improvement consulting, claims assessment and analysis, and contract administration of extended warranty programs | ||
| • | Product quality improvement programs — Supplier quality assurance, technical call centers, and quality training and consulting programs | ||
| • | Retail support programs — Process improvement consulting, customer satisfaction program management, and training programs | ||
| • | Supply Chain Management —Through supply chain management, we work with our customers to streamline their procurement process, reduce procurement systems costs, and reduce fixed costs in the process. We do this by providing personnel with the required expertise, access and recommended process improvements to apply technology solutions as required to yield the desired results. In addition to internally developed technology, we have formed strategic partnerships with companies such as Commerce One and IBM to support our ability to deliver technology responsively while minimizing cost to the customer. Our services include the following: | ||
| • | Outsourced purchasing services — management of the procurement process from initial requisition to supplier payment | ||
| • | eProcurement services | ||
| • | Contract manufacturing — supply chain management services that provide full product life cycle support, from concept/design to shipment of product | ||
| • | Supply chain management consulting to meet specific customer needs | ||
| • | Custom Communication Services —Offers a full spectrum of solutions to provide our customers with a competitive advantage in facilitating communications through creating, maintaining and delivering information. Our services include the following: | ||
| • | Technical and consumer publishing — assists our customers in reducing cost and cycle time by facilitating the reuse and repurposing of content in technical writing, translation, print and distribution | ||
| • | Integrated marketing support and research services — supports the development and implementation of personalized marketing programs including copy and design, translation, printing and distribution | ||
| • | Integrated document management — assists our customers in facilitating the internal development and distribution of knowledge across their organizations. Our services include document imaging and on-site document centers |
There is a high degree of competition among suppliers of the outsourced business services we provide. In many cases, our principal competition is the customer’s in-house operations. For certain of our services there are numerous outside competitors, many of whom presently have greater name recognition and resources than we do. For quality relationship management and supply chain management services we compete with other global service companies such as EDS, IBM, ICG Commerce and other consulting firms in addition to certain companys’ in-house operations. In the custom communications area we compete with companies such as Valley Forge/SPX, Bowne, Xerox, Budco and Lason.
4
Table of Contents
Significant Customers and Supply Relationships
| We currently have sales to more than 1,000 customers. These include the major United States and European automotive OEMs and automotive suppliers. Ford, Fiat, S.p.A. (“Fiat”), DaimlerChrysler AG (“DaimlerChrysler”), and General Motors Corporation (“General Motors”), including their automotive subsidiaries, together accounted for 58.9%, of our net sales for the fiscal year ended December 30, 2001. |  |
A substantial portion of our sales to selected large customers were made pursuant to multi-year supply agreements and purchase orders with open terms. Although dependent on actual market demand, such agreements permit a degree of forward revenue visibility. They also allow us to expand existing customer relationships by providing cross-selling opportunities for our other collaborative enterprise services.
A significant portion of our $322.2 million in sales to Ford during 2001 were made pursuant to the Ford Master Vendor Agreement and the Ford Master Supply Agreement, which were entered into for five-year terms when we acquired Geometric Results, Inc. in August 1997. To date, we have generally met or exceeded the standards of performance and competitiveness as required by these agreements. Both Ford and MSXI have verbally agreed to extend the term of the Ford Master Vendor Agreement. The extension includes provisions to expand our services to additional Ford subsidiaries not covered by the original agreement. Ford and MSXI have also agreed to maintain an advisory board comprised of executives from both companies to monitor and enhance the on-going relationship between the companies.
A significant portion of our $82.0 million in sales to Fiat during 2001 were made pursuant to purchase orders with Fiat’s principal manufacturing companies, which were modified when we acquired Satiz S.r.l. in December 1999. These agreements were extended to five-year terms and include exclusivity provisions for selected services which are subject to agreed quality benchmarking procedures. Beginning January 1, 2001, the services are subject to annual price reductions based on the volume of sales. Contractual price reductions during 2001 as a result of this agreement did not have a significant impact on our business.
Sales to Johnson Controls, Inc. (“JCI”), a “top ten” customer, were made pursuant to a supply agreement that was executed when we acquired MegaTech Engineering, Inc. in December 1998. The five-year agreement designates MSXI as JCI’s exclusive supplier on a worldwide basis for specified engineering and design services. The agreement includes specific growth objectives, price benchmarking, an agreement to negotiate in 2003 to extend the agreement for an additional five years, and an advisory board of executives from both MSXI and JCI to support the relationship.
We believe we have developed strong relationships with our customers and have a reputation for quality, reliability and service that has been recognized through Ford’s Q1 and DaimlerChrysler’s Pentastar awards, among others. In addition, most of our operations are certified to the ISO 9001 or 9002 international quality standards, which requires a determination by an independent assessor that the operation is in compliance with a documented quality management system.
Except as noted above, no material portion of our business is dependent upon any one customer or is subject to contractual renegotiation of prices. In general, equipment and technologies required to support our service offerings are obtainable from various sources in the quantities desired.
5
Table of Contents
Global Capabilities
| Our international presence is an important competitive advantage in winning and retaining new business and meeting the global sourcing, quality and engineering requirements of many of our customers. We are currently providing services in 26 countries. We believe we are the only company currently providing such a broad range of services to the automotive industry on a worldwide basis. Foreign operations are subject to political, monetary, economic and other risks associated with international businesses. Additional information about market risks is included under Item 7A of this report. For the fiscal year ended December 30, 2001, 35% of our net sales were generated outside of the United States. Our global capabilities have continued to grow and strengthen our product offerings as a result of acquisitions completed in recent years. | 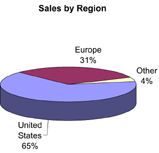 |
Our UK engineering and human capital management capabilities grew in 1998 through the acquisition of Gold Arrow Contract Services, Ltd. (“Gold Arrow”), an information technology and technical staffing company headquartered in Basildon, Essex, England. Future joint-engineering projects utilizing the combined resources of Cadform-MSX Engineering Gmbh are expected to strengthen our positioning with German automotive manufacturers and their suppliers. We further expanded our presence in Europe during 1999 through the acquisition of 75% of the outstanding common stock of Satiz S.r.l., effective December 31, 1999, and the acquisition of QR Quandoccorre S.r.l. and Quandoccorre Interinale S.p.A., effective January 3, 2000. The acquisition of Satiz is complementary to several of our service offerings and gives us a platform for custom communication services in Europe. The acquisition of the Quandoccorre companies provides us with a basis to expand our human capital management services in Italy. The acquisition of Australian-based Radial Pacific Pty. Ltd. in December 2000 enhanced our capabilities in Australia and strengthened our ability to support collaborative engineering opportunities across multiple time zones.
Additional financial information concerning our geographical coverage is set forth in Note 14 to our consolidated financial statements included under Item 8 of this report.
Organizational Development
We made several key appointments to our executive team in recent years, including the appointment of Thomas Stallkamp as Vice Chairman and Chief Executive Officer. Other recent changes were undertaken to align our management structure with our collaborative enterprise service offerings. The changes include the creation of a centralized sales organization and product development champions to support the rollout of our services to new vertical markets. The objective of these recent management changes is to enhance our responsiveness to key customers and to further commercialize our service offerings, especially to support the growth of our non-automotive customer base. Additional information on our executive officers appears in Item 10 of this report.
The following table sets forth certain recent information regarding our employees by region:
| Region | Number of Employees | ||||
| North America | 6,643 | ||||
| Italy | 1,405 | ||||
| United Kingdom | 869 | ||||
| Germany | 566 | ||||
| Rest of Europe | 363 | ||||
| Other | 296 | ||||
| Total | 10,142 | ||||
A small portion of our employees in the United States are members of unions. We believe our current relations with our employees and their unions are good.
6
Table of Contents
We depend upon our ability to attract, retain and develop personnel, particularly technical personnel, who possess the skills and experience necessary to meet the needs of our customers. Competition for individuals with proven technical or professional skills is intense. We compete with other staffing companies, as well as customers and other employers for qualified personnel.
We are committed to improving the professional development of our employees. In April 2000, we combined and expanded several existing training resources to launch MSX International University. This is a global learning resource that focuses on providing market-driven education to support both our internal needs and our customers’ strategic and operational training needs. The university uses web-based administration and embraces all forms of technologies and learning delivery methods. It delivers courses through two schools: the School of Technology and the School of Business and Leadership Education. It has also formed alliances with academic institutions in the United States, the United Kingdom and Germany which allow employees to pursue Bachelor of Science and Master of Science degrees in engineering and other technical disciplines.
Formation and Growth through Acquisitions and Corporate Development
MSXI is a holding company owned by Citicorp affiliates and certain members of management. MSXI was incorporated and owned by Citicorp Venture Capital, Ltd., MascoTech, Inc. (“MascoTech”), and management under the laws of Delaware in late 1996 to pursue growth opportunities in technology-driven collaborative enterprise services. On November 28, 2000, MascoTech sold its equity interest in MSXI to a subsidiary of Citicorp. On the same date Citicorp Venture Capital, Ltd. sold its equity interest in MSXI to the same subsidiary.
On January 3, 1997, we acquired (the “TSG Acquisition”) selected assets and operations of the former engineering and technical business service units of MascoTech Automotive Systems Group, Inc. (“MASG”) and MascoTech. Through the consummation of the TSG Acquisition, we also acquired the net assets of APX International, which previously had been acquired by MASG as of November 6, 1996.
Since our formation, corporate investments have complemented our internal growth. Specifically, we have completed numerous strategic acquisitions, made several strategic investments and participated as a minority investor in the formation of a minority-certified venture. These transactions have expanded our geographic coverage, our service offerings, and our reach to customers outside the automotive industry. As we pursue additional strategic acquisitions, alliances and other corporate development activities, we intend to continue to rationalize our cost structure through the elimination of redundant back office activities, operating facilities, management and administrative offices.
7
Table of Contents
Businesses acquired since January of 1997 include the following:
| NAME | MONTH ACQUIRED | SERVICES | GEOGRAPHIC COVERAGE | MARKETS | ||||
| Geometric Results Incorporated | August 1997 | Human capital management and other collaborative services | North America and Europe | Automotive | ||||
| Gold Arrow Contract Services, Ltd. | August 1998 | Information technology and technical staffing | United Kingdom, Northern Europe | Automotive, financial services and other commercial markets | ||||
| Lexstra International, Inc. | October 1998 | Information technology staffing | Mid-Atlantic Region | Financial services and other commercial markets | ||||
| Lexus Temporaries, Inc. | October 1998 | Network support staffing | Mid-Atlantic Region | Telecommunications | ||||
| Pilot Computer Services, Inc. | December 1998 | Information technology staffing | California | Government, health care and other commercial markets | ||||
| MegaTech Engineering, Inc. | December 1998 | Technical staffing and product development services | Michigan | Automotive original equipment manufacturers and suppliers | ||||
| Rice Cohen International, Inc. | April 1999 | Permanent staff placement | Mid-Atlantic Region | Selected services markets | ||||
| Management Resources International, Inc. | June 1999 | Training services and courseware in quality systems | Midwest | Quality systems | ||||
| Chelsea Computer Consultants, Inc. | September 1999 | Information technology staffing | Mid-Atlantic Region | Financial services, telecommunications and manufacturing | ||||
| Satiz S.r.l | December 1999 | Commercial and technical publishing | Italy, Other Europe, Brazil | Automotive and original equipment manufacturers and suppliers | ||||
| Quandoccorre Interinale S.p.A. and QR Quandoccorre S.r.l | January 2000 | Staffing and consulting services | Italy | Automotive and non-automotive manufacturing and other industries | ||||
| Intranational Computer Consultants, Inc. | February 2000 | Information technology consulting services | California | Financial services and non-automotive manufacturing Financial services, | ||||
| Programming Management & Systems, Inc. | February 2000 | Information technology consulting services | Missouri | telecommunications and non-automotive manufacturing | ||||
| CMS Management Services | February 2000 | Information technology, accounting and technical staffing | Midwest Region | Services and non-automotive manufacturing | ||||
| Ascend | February 2000 | Information technology staffing and permanent placement | Midwest Region | Financial and other services markets | ||||
| Radial Pacific Pty Ltd. | December 2000 | Engineering and design services | Australia | Automotive, aerospace and component manufacturers |
In addition to the above, during 1999 we acquired a 49% interest in CADFORM-MSX Engineering GmbH (formerly Cadform Engineering GmbH). Cadform is based in Homberg (Ohm), Germany and provides design and tooling services to the automotive industry. See “Recent Developments” included under Item 7 of this report for additional information on Cadform and other investments subsequent to 2001. In October 2000, we invested in a certified minority provider of human capital management services to a large automotive supplier. We provide technology solutions, sub-contract labor and selected administrative support services to this company. In November 2000, we entered into a technical cooperation agreement with Prototipo Holding B.V. Prototipo has operations in Europe and Brazil and provides testing, prototyping, styling and other development services for transportation and industrial manufacturing customers, including automotive, truck, and tire manufacturers. In support of the relationship, we completed a modest minority investment in Prototipo.
In March 2001, we acquired a minority interest in MTE Groups L.L.C. MTE is a minority supplier of tooling, design, and prototype services, primarily to the automotive industry. The investment was completed to strengthen our ability to support the tooling and prototype needs of mutual customers. In September 2001, we completed a small investment in itiliti, Inc., which provides a web-enabled solution that complements our human capital management practice.
For additional information on acquisitions, including pro forma financial results, see Note 3 to our consolidated financial statements included under Item 8 of this report.
8
Table of Contents
Seasonality of our Business
Our quarterly operating results are affected primarily by the number of billing days in the period and the seasonality of our customers’ businesses. Demand for some of our services has historically been lower during the year-end holidays.
Environmental
Compliance with foreign, federal, state and local environmental protection laws and regulations is not expected to result in material capital expenditures or have a material adverse effect on our financial condition, results of operations, cash flows or competitive position.
Patents and Trademarks
We hold a number of United States and foreign patents, licenses, copyrights, tradenames and trademarks. Although we regard our intellectual property to be valuable, we do not believe that there is any reasonable likelihood of the loss of any rights that would have a material effect on our operating units, services or present business as a whole.
Item 2. Properties.
The following table sets forth the current number of facilities we operate by region. We believe that substantially all of our property and equipment is in good condition and that we have sufficient capacity to meet our current and projected operating needs. The number of facilities in any region is dictated by the local demographics and requirements to support our customers’ needs. Our facilities are utilized to provide all or any combination of our service offerings.
| Region | Number of Facilities | ||||
| North America | 45 | ||||
| Italy | 28 | ||||
| Germany | 11 | ||||
| United Kingdom | 8 | ||||
| Rest of Europe | 7 | ||||
| Other | 3 | ||||
| Total | 102 | ||||
All of our facilities are leased. We believe that the termination of any one lease would not have a material adverse affect on our business.
Item 3. Legal Proceedings.
We are involved in various proceedings incidental to the ordinary conduct of our business. We believe that none of these proceedings will have a material adverse effect on our financial condition, results of operations or cash flows.
Item 4. Submission of Matters to a Vote of Security Holders.
The following matters were ratified and approved by the consent of a majority of our stockholders in lieu of a stockholder meeting:
| • | Adoption of the Amended and Restated By-laws of MSXI, filed as Exhibit 3.2 to the Form 10-K | ||
| • | The re-election of the existing Board of Directors |
9
Table of Contents
PART II
Item 5. Market for Registrant’s Common Equity and Related Stockholder Matters.
MSXI is privately owned and there is no current public trading market for our equity securities. See “Item 12. Security Ownership of Certain Beneficial Owners and Management”. For further information related to ownership aspects of our common stock, see the discussion under “Amended and Restated Stockholders’ Agreement” contained under “Item 13. Certain Relationships and Related Transactions”.
During 1998 and 1999, we completed offers to exchange new senior subordinated notes that had been registered under the Securities Act of 1933 for similar notes that had not been registered. We may not declare or pay any dividends or other distributions with respect to any common stock or other class or series of stock ranking junior to our Series A Preferred Stock without first complying with restrictions specified in the Amended and Restated Stockholders’ Agreement. See Note 10 to our consolidated financial statements included under Item 8 of this report.
10
Table of Contents
Item 6. Selected Financial Data.
The selected historical consolidated financial data as of and for the five fiscal years ended December 30, 2001 have been derived from the audited historical financial statements of MSXI. The results of operations for the periods presented include the results of operations of acquired companies from the effective date of their acquisition. As a result, our financial performance for each fiscal year is not directly comparable without taking into account the impact of acquisitions. The selected financial and other data should be read in conjunction with “Management’s Discussion and Analysis of Financial Condition and Results of Operations” and the consolidated financial statements and notes thereto included elsewhere in this Form 10-K.
| Fiscal Year Ended | |||||||||||||||||||||
| December 28, | January 3, | January 2, | December 31, | December 30, | |||||||||||||||||
| 1997 | 1999 | 2000 | 2000 | 2001 | |||||||||||||||||
| (dollars in thousands) | |||||||||||||||||||||
| Statement of Operations Data: | |||||||||||||||||||||
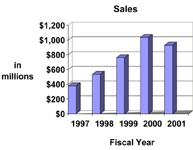
| Net sales | $ | 378,014 | $ | 533,942 | $ | 759,842 | $ | 1,035,223 | $ | 929,257 | |||||||||||
| Cost of sales | 327,487 | 449,914 | 653,274 | 889,286 | 812,221 | ||||||||||||||||
| Gross profit | 50,527 | 84,028 | 106,568 | 145,937 | 117,036 | ||||||||||||||||
| Selling, general and administrative expenses | 37,983 | 59,083 | 65,082 | 83,238 | 78,775 | ||||||||||||||||
| Amortization of goodwill and other intangibles | 892 | 1,690 | 3,156 | 5,583 | 6,222 | ||||||||||||||||
| Restructuring costs | 2,000 | — | — | — | — | ||||||||||||||||
| Operating income | 9,652 | 23,255 | 38,330 | 57,116 | 32,039 | ||||||||||||||||
| Interest expense, net | 12,400 | 17,416 | 21,141 | 30,119 | 27,881 | ||||||||||||||||
| Income (loss) before income taxes, minority interests and equity in net losses of affiliates | (2,748 | ) | 5,839 | 17,189 | 26,997 | 4,158 | |||||||||||||||
| Income tax provision | 225 | 3,068 | 6,995 | 11,340 | 1,712 | ||||||||||||||||
| Less minority interests and equity in net losses of affiliates, net of taxes | — | — | — | 766 | 1,943 | ||||||||||||||||
| Net income (loss) | $ | (2,973 | ) | $ | 2,771 | $ | 10,194 | $ | 14,891 | $ | 503 | ||||||||||
| Balance Sheet Data (at period end): | |||||||||||||||||||||
| Cash and cash equivalents | $ | 11,575 | $ | 4,248 | $ | 6,879 | $ | 4,686 | $ | 4,924 | |||||||||||
| Accounts receivable, net | 178,938 | 208,451 | 306,978 | 317,458 | 252,008 | ||||||||||||||||
| Total assets | 287,176 | 356,724 | 524,190 | 577,029 | 514,382 | ||||||||||||||||
| Total debt and capital lease obligations | 153,246 | 185,081 | 245,924 | 266,859 | 246,666 | ||||||||||||||||
| Redeemable Series A Preferred Stock | 36,000 | 36,000 | 36,000 | 36,000 | 36,000 | ||||||||||||||||
| Shareholders’ deficit | (26,364 | ) | (26,105 | ) | (20,579 | ) | (15,462 | ) | (15,487 | ) | |||||||||||
| Other Data: | |||||||||||||||||||||
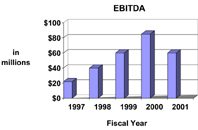
| EBITDA (A) | $ | 22,379 | $ | 40,152 | $ | 60,803 | $ | 85,293 | $ | 59,944 | |||||||||||
| Capital expenditures | 11,518 | 11,559 | 16,692 | 18,168 | 19,243 | ||||||||||||||||
| Depreciation and amortization | 9,859 | 14,109 | 17,535 | 23,587 | 24,426 | ||||||||||||||||
| Ratio of earnings to fixed charges (B) | — | 1.2x | 1.6x | 1.7x | 1.1x | ||||||||||||||||
| (A) | EBITDA represents income (loss) before income taxes, minority interests and equity in net losses of affiliates plus net interest expense, depreciation, amortization, and Michigan Single Business Tax and similar taxes. EBITDA is presented as additional information because management believes it to be a useful indicator of the company’s ability to meet debt service and capital expenditure requirements. It is not, however, intended as an alternative measure of operating results or cash flow from operations (as determined in accordance with generally accepted accounting principles). | |
| (B) | For purposes of computing the ratio of earnings to fixed charges, earnings represent net income (loss) before income taxes, minority interests, equity in net losses of affiliates, and fixed charges. Fixed charges consist of interest expense, the interest component of operating leases and amortization of deferred financing costs. For the fiscal year ended December 28, 1997, earnings were inadequate to cover fixed charges by approximately $2.7 million. |
 |  |
11
Table of Contents
Item 7. Management’s Discussion and Analysis of Financial Condition and Results of Operations.
General
The following analysis of our results of operations and liquidity and capital resources should be read in conjunction with our consolidated financial statements and the related notes thereto included under Item 8 of this report. The results of operations for the fiscal years ended December 30, 2001, December 31, 2000 and January 2, 2000 include the results of operations of acquired companies from the effective date of their acquisition. As a result, our financial performance for each fiscal year is not directly comparable without taking into account the impact of acquisitions.
Significant Accounting Policies
Our significant accounting policies are more fully described in Note 1 to our consolidated financial statements. Certain accounting policies applied require management’s judgment in selecting the appropriate assumptions for calculating financial estimates. By their nature, these judgments are subject to a degree of uncertainty. Management judgments are based on historical experience, information from our customers, market and regional trends, and other information. Significant accounting policies include:
| • | Valuation of Goodwill and other intangibles— we evaluate the carrying value of goodwill when events or circumstances warrant such a review. An evaluation includes comparing anticipated undiscounted future cash flows from operating activities with the carrying amount of the excess of cost over net assets of companies acquired. While we believe that our estimates and assumptions in this area are valid, different assumptions could result in a different outcome. In addition, we will adopt Statement of Financial Accounting Standards No. 142 during the first quarter of 2002. We are still evaluating the impact this adoption will have on our results. However, given the current economic climate and market valuations of technology-based companies, adoption of SFAS 142 could result in a charge during the first quarter of 2002. | ||
| • | Deferred income taxes— at December 30, 2001, our consolidated balance sheet includes net deferred tax assets of $6.4 million. About $6.0 million of the net deferred tax asset is related to net operating losses of certain MSXI subsidiaries. Realization of the net deferred tax asset is dependent primarily on profitable operations within certain regions. Although realization cannot be assured, we believe that it is more likely than not that such benefits will be realized through the generation of future taxable income. In addition, we intend to utilize our tax planning strategies to help ensure realization of these assets. |
Results of Operations
Fiscal Year Ended December 31, 2000 Compared with the Fiscal Year Ended December 30, 2001
Net Sales.Consolidated net sales were $929.3 million during fiscal 2001 compared to $1,035.2 million during fiscal 2000, a decrease of $105.9 million, or 10.2%. Comparable fiscal 2001 sales continue to be negatively impacted by depressed foreign currency exchange rates in certain countries in which we operate. The net impact of year over year exchange rate changes was to reduce consolidated net sales by about $13.4 million for the fiscal 2001 year. Excluding the impact of foreign exchange rate changes, consolidated fiscal 2001 net sales decreased $92.5 million, or 8.9%, compared to 2000.
After adjusting for the impact of foreign exchange rates, the $92.5 million decrease in sales during fiscal 2001 is comprised of a $21.5 million decrease in sales of collaborative engineering services, a $66.1 million decrease in sales of human capital management services, and a $5.0 million decrease in sales of other collaborative services. The decrease in engineering sales reflects price reduction pressures and reduced volumes of engineering services in North America and Europe as our automotive customers have delayed their engineering programs due to current economic conditions. Sales of human capital management services decreased during fiscal 2001 due to reduced demand in North American markets for IT development, automotive engineering, and permanent placement services. Reductions in human capital management sales volumes, on a year to date basis, were partially offset by the impact of businesses acquired during the first quarter of fiscal 2000. Sales of our other collaborative services decreased as a result of lower volumes due to declines in our automotive business and the divestiture of a non-core business during fiscal 2000.
12
Table of Contents
Operating Profit.Our consolidated gross profit and operating income for the periods presented were:
| Fiscal Year Ended | |||||||||||||||||
| Change | |||||||||||||||||
| December 31, | December 30, | ||||||||||||||||
| 2000 | 2001 | $ | % | ||||||||||||||
| (dollars in thousands) | |||||||||||||||||
| Gross profit | $ | 145,937 | $ | 117,036 | $ | (28,901 | ) | (19.8 | %) | ||||||||
| % of net sales | 14.1 | % | 12.6 | % | n/a | n/a | |||||||||||
| Operating income | $ | 57,116 | $ | 32,039 | $ | (25,077 | ) | (43.9 | %) | ||||||||
| % of net sales | 5.5 | % | 3.4 | % | n/a | n/a | |||||||||||
Gross profit, as a percentage of sales, decreased to 12.6% during fiscal 2001 compared to 14.1% during fiscal 2000. The decrease in gross profit reflects the pricing pressures and unfavorable volumes in our engineering and human capital management operations, particularly in the second half of 2001, resulting in less favorable absorption of fixed and indirect operating costs. Overall, operating income decreased during 2001 due to reduced sales volumes, pricing pressures and costs incurred to position the company for growth and expansion into new vertical markets. The overall decline in our operating results is attributable to the general economic downturn, which has impacted demand for technical services in the automotive and telecommunications sectors.
We cannot predict with certainty when economic conditions will improve and have taken steps to reduce our cost structure commensurate with the current levels of business. As a result, we recorded about $1.3 million of one-time severance costs during the fourth quarter of 2001, which are included in selling, general and administrative expenses, and took other steps to reduce our cost structure. We expect to begin realizing annual benefits in excess of $25 million from our cost reduction efforts starting in the first quarter of fiscal 2002. In addition, we are also taking steps to further diversify our business to other markets and customers.
Selling, general and administrative expenses, as a percentage of net sales, were 8.5% during fiscal 2001 compared to 8.0% during fiscal 2000. The increase as a percentage of sales reflects the impact of lower volumes during fiscal 2001, particularly in the second half of the year. Overall, selling, general and administrative expenses decreased in comparison to 2000 reflecting reductions in incentive compensation totaling $7.7 million. After adjusting for reductions in incentive compensation, selling, general and administrative expenses increased on a year over year basis. The increase reflects one time severance costs, as discussed above, and costs incurred to develop our service offerings and sales efforts within our developing vertical markets.
Interest Expense.Interest expense decreased $2.2 million, from $30.1 million during fiscal 2000 to $27.9 million during fiscal 2001. Average daily borrowings outstanding increased slightly during fiscal 2001 in order to fund investments in businesses and product development. However, the impact of increased borrowings was more than offset by declines in the interest rates on our variable rate debt. Additional information on interest rate market risk is included under Item 7A of this report.
Net Income.Net income during fiscal 2001 was $0.5 million, compared to net income of $14.9 million in fiscal 2000. The decrease reflects lower operating earnings and increased equity losses during the year. Our effective income tax rate during fiscal 2001 was 41.1% versus 42.0% during fiscal 2000. The improvement resulted from certain legal reorganization changes that took effect in 2001 combined with a favorable mix of earnings compared to fiscal 2000. Minority interests and equity losses increased $1.2 million compared to fiscal 2000 primarily as a result of losses reported by our equity investees during 2001. Our equity investees are experiencing the same pricing pressures and volume reductions that are impacting our business.
13
Table of Contents
Fiscal Year Ended January 2, 2000 Compared with the Fiscal Year Ended December 31, 2000
Net Sales.Consolidated net sales increased $275.4 million, or 36.2%, from $759.8 million in fiscal 1999 to $1,035.2 million in fiscal 2000. The increase in consolidated net sales resulted from both internal growth from existing businesses and incremental sales from acquired businesses. The total increase in net sales is comprised of:
| Fiscal Year | |||||||||
| Ended | % | ||||||||
| Increase From | December 31, 2000 | Increase | |||||||
| (dollars in thousands) | |||||||||
| Internal growth | $ | 77,575 | 10.2 | % | |||||
| Acquired businesses | 197,806 | 26.0 | % | ||||||
| Total | $ | 275,381 | 36.2 | % | |||||
All of our service lines continued to grow sales volume from existing businesses while generating incremental sales from businesses acquired during 1999 and 2000. Overall, sales generated by existing businesses during fiscal 2000 were negatively impacted by the softening of foreign currency exchange rates in many of the countries in which we operate. The net impact of foreign currency exchange rate fluctuations during fiscal 2000 was to reduce net sales by about $16.3 million, or 2.1%, compared to 1999. Before the impact of foreign exchange rate fluctuations, net sales from existing businesses increased about 12.3% during fiscal 2000 compared to 1999.
Sales of our collaborative engineering services during fiscal 2000 increased $26.6 million, or 9.5%, before the impact of acquisitions and foreign exchange rate changes, compared to fiscal 1999. The improvement primarily reflects increased demand for design and engineering services in North America. Sales of our human capital management services during fiscal 2000 increased $56.2 million, or 17.4%, before the impact of acquisitions and foreign exchange rate changes, compared to the fiscal 1999. The internal growth reflects improved IT staffing volumes with non-automotive customers and increased automotive engineering services, primarily in North America. Sales of our other collaborative services during fiscal 2000 improved $11.1 million, or 7.0%, before the impact of acquisitions and foreign exchange rate changes, compared to fiscal 1999.
Operating Profit.Our consolidated gross profit and operating income for the fiscal years presented were:
| Fiscal Year Ended | Increase | ||||||||||||||||
| January 2, | December 31, | ||||||||||||||||
| 2000 | 2000 | $ | % | ||||||||||||||
| (dollars in thousands) | |||||||||||||||||
| Gross profit | $ | 106,568 | $ | 145,937 | $ | 39,369 | 36.9 | % | |||||||||
| % of net sales | 14.0 | % | 14.1 | % | n/a | n/a | |||||||||||
| Operating income | $ | 38,330 | $ | 57,116 | $ | 18,786 | 49.0 | % | |||||||||
| % of net sales | 5.0 | % | 5.5 | % | n/a | n/a | |||||||||||
Overall, operating income increased during fiscal 2000 due to the improved performance of our existing businesses and the incremental impact of businesses acquired during 1999 and 2000. Operating income generated by existing businesses during 2000 increased $8.8 million, or 23.0%, compared to 1999. Declines in foreign currency exchange rates during fiscal 2000 caused a net reduction in operating income of about $0.5 million compared to fiscal 1999. Gross profit increased $39.4 million, or 36.9%, compared to 1999. Gross profit, as a percentage of sales, improved slightly from 14.0% in fiscal 1999 to 14.1% in fiscal 2000. The improvement in gross profit reflects increased sales volumes by existing businesses in North America and the impact of cost reduction efforts in our European operations. Selling, general and administrative expenses, as a percentage of net sales, were 8.0% during fiscal 2000, compared to 8.6% during fiscal 1999. The improvement reflects the continued consolidation of administrative services resulting from the successful integration of acquired companies.
Interest Expense.Interest expense increased 42.5%, from $21.1 million during fiscal 1999 to $30.1 million during fiscal 2000. The increase reflects the impact of incremental borrowings outstanding during fiscal 2000 to fund acquisitions and increases in the floating rates of interest on borrowings under our credit facility.
14
Table of Contents
Net Income.Net income increased $4.7 million, or 46.1%, from $10.2 million in fiscal 1999 to $14.9 million in fiscal 2000. The increase in net income reflects improved earnings from operations partially offset by an increase in our effective tax rate and increased interest expense. Our effective tax rate was 42.0% during fiscal 2000 compared to 40.7% during fiscal 1999, reflecting changes in the mix of our earnings between tax jurisdictions and an increase in the ratio of non-deductible expenses to pretax income primarily related to acquisition activity. Minority interests and equity in net losses of affiliates primarily represents the portion of Satiz S.r.l. earnings, which was acquired on December 31, 1999, attributable to the minority owner and equity in the net losses of CADFORM-MSX Engineering GmbH.
Liquidity and Capital Resources
Cash Flows
General.Our principal capital requirements are for the acquisition of businesses, capital expenditures and working capital to support internal growth and development of new vertical markets. These requirements have been met through a combination of bank debt, the issuance of senior subordinated notes and cash generated from operations. We typically pay our employees on a weekly basis and receive payment from our customers within invoicing terms, which is generally a 60-day period after the invoice date. However, in connection with certain of our master vendor and supply chain management programs, we collect related receivables at approximately the same time we make payment to suppliers.
| Operating Activities.Net cash provided by operating activities during fiscal 2001 decreased $0.7 million from $59.1 million in fiscal 2000 to $58.4 million in fiscal 2001. Cash from operations during fiscal 2000 includes significant improvements in accounts receivable collections resulting from the transition of Satiz S.r.l. into our cash management system. The reduction in Satiz accounts receivable resulted in a one-time improvement in cash from operations of about $12 million during fiscal 2000. Excluding the one-time improvements during fiscal 2000, cash provided by operations increased about $11 million during fiscal 2001 despite reduced profits during the year. The improvement resulted from our efforts to maximize working capital through accounts receivable collections and management of vendor payments. | 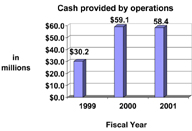 |
Net cash provided by operating activities for fiscal 2000 increased $28.9 million compared to fiscal 1999, including the one-time improvements in Satiz’s accounts receivable collections. Improvements in accounts receivable balances were offset by an increase in the volume of pass-through billings for our master vendor and supply chain management services. Excluding the one-time improvement in Satiz accounts receivable, cash provided by operations was about $47.1 million, which represents a 56.0% increase over fiscal 1999. The increase in cash from operations reflects increased earnings before depreciation and amortization along with further improvements in our managed working capital.
| Investing Activities. Net cash used for investing activities decreased $40.3 million, from $75.4 million during fiscal 2000 to $35.1 million during fiscal 2001. The decrease includes a reduction in funds used to acquire businesses of $43.6 million. Cash used to acquire businesses during fiscal 2001 included investments in MTE Groups L.L.C. and itiliti, Inc. totaling about $6.6 million as well as the payment of contingent consideration related to certain prior acquisitions. For additional information on acquisitions/investments during fiscal 2001, see “Corporate Development” below. The increase of $1.1 million in capital expenditures during fiscal 2001 reflects an increase in capital invested for future programs and services while capital required to maintain current programs declined year over year. Proceeds from the sale/disposal of property and equipment during fiscal 2000 include proceeds from the sale of certain non-core assets, primarily real estate and equipment, associated with our offset printing business. | 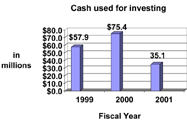 |
Net cash used for investing activities for fiscal 2000 increased $17.5 million from $57.9 million to $75.4 million, as compared to fiscal 1999. This included an increase in cash used for business acquisitions of $5.4 million. Cash used to acquire businesses includes funding of acquisitions closed during fiscal 2000 and the payment of contingent consideration related to certain prior year acquisitions. For additional information on acquisitions during fiscal 2000, see “Corporate
15
Table of Contents
Development” below. Proceeds from the sale/disposal of property and equipment include a sale-leaseback transaction during fiscal 1999 and the sale of certain non-core business assets during fiscal 2000, as discussed above. During fiscal 1999, we entered into a sale-leaseback transaction related to certain property and facilities acquired as part of the MegaTech Engineering, Inc. acquisition in December 1998. The sale proceeds of $15 million were used to settle a contractual acquisition obligation related to the acquisition of MegaTech.
| Financing Activities.Net cash used for financing activities was $23.8 million during fiscal 2001 compared to net cash provided by financing activities of $21.8 million in 2000, a decrease of $45.6 million. Financing requirements decreased consistent with the reduction in funds required to acquire companies. Therefore, cash generated from operations in excess of investing requirements were utilized to reduce revolving debt and make scheduled term loan repayments. During the first quarter of fiscal 2001, a subsidiary of MSX International, Inc. completed a sale of unregistered securities to certain directors and members of management. The securities were sold in units with each unit comprised of MSX International Inc.’s Series A Preferred Stock, par value $0.01 per share, and Class A Common Stock, par value $0.01 per share. In total, 9,936 shares of Series A Preferred Stock and 482,400 shares of Class A Common Stock were sold. The shares of Series A Preferred Stock and Class A Common Stock, which comprised the units sold, were acquired from Citicorp, our majority stockholder, at a price equal to the price at which the units were sold to management. The entire proceeds of $3.6 million were used to pay the purchase price of the shares acquired from Citicorp. | 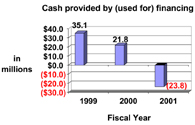 |
Net cash provided by financing activities for fiscal 2000 decreased $13.3 million from fiscal 1999. Our increased investing requirements during fiscal 2000 were primarily met with strong operating cash flow. Additional borrowings were used to support the acquisition of businesses and included the issuance of an additional $25 million in term notes as discussed below.
Debt Arrangements and Available Financing
Our total indebtedness consists of our senior subordinated notes, borrowings under our credit facilities and borrowings under various short-term arrangements. Additional information regarding these obligations is set forth in Note 7 and Note 14 to our consolidated financial statements included under Item 8 of this report.
Senior Subordinated Notes.On January 22, 1998, we issued, in a private placement, $100 million aggregate principal amount of 11-3/8% unsecured senior subordinated notes maturing January 15, 2008 (the “Series A Notes”). The net proceeds of $93.2 million were used to retire bridge loans to Citicorp and MascoTech, retire senior subordinated notes payable to MascoTech and repay a portion of the amounts outstanding under our credit facility. On August 20, 1998, we completed an offer to exchange 11-3/8% unsecured senior subordinated notes, registered under the Securities Act of 1933, for any and all outstanding Series A notes.
On May 18, 1999, we issued, in a private placement, an additional $30 million aggregate principal amount of 11-3/8% unsecured senior subordinated notes maturing January 15, 2008 (the “Series B Notes”). The net proceeds of $27.6 million were used to repay amounts previously outstanding under our credit facility. On September 10, 1999, we completed an offer to exchange 11-3/8% unsecured senior subordinated notes, registered under the Securities Act of 1933, for any and all outstanding Series B Notes.
Credit Facility.In December 1999, we completed an amended and restated credit facility with commercial banks and institutional lenders led by Bank One N.A. The amended and restated credit facility replaced our existing credit facility. The revolving credit portion of the amended and restated agreement expires December 7, 2004. The credit facility, as amended and restated, provides for revolving credit up to $100 million and five and seven year term loans up to $105 million under terms specified in the agreement. At closing, we borrowed $80 million under the term loan portion of the credit facility and additional amounts under the revolver. We increased the term loan syndication to $105 million, under the terms of the agreement, in early 2000. Available borrowings under the revolving credit portion of the credit facility are subject to adequate accounts receivable balance requirements. As of December 30, 2001, $87.9 million was available for future borrowing while $43.1 million was available for immediate borrowing based on our current level of accounts receivable. Under the terms of the agreement, we are also subject to mandatory partial prepayments of the term loans if we generate excess cash flows, as defined, on an annual basis, or other defined cash proceeds. If required, such prepayments may reduce our long term availability under the credit facility.
16
Table of Contents
Effective September 30, 2001, we completed the first amendment to the amended and restated credit facility. The result of the amendment was to relax certain financial covenants through the end of fiscal 2002 in response to recent economic events, and to clarify certain definitions and calculations included in the credit facility. Beginning in the first quarter of fiscal 2003, the financial covenant requirements will return to their original levels. Based upon our current operating performance, we would not comply with the covenant requirements that are effective in 2003. No changes were made to the length of the agreement, available borrowings, or terms for repayment. As part of the amendment, the applicable spread over benchmark interest rates, applicable when the ratio of debt to EBITDA is above specified levels, was increased.
Satiz Facility. Satiz S.r.l., which was acquired effective December 31, 1999, maintains a financing arrangement that provides for lines of credit up to 100% of its eligible accounts receivable, as defined in the agreement. As of December 30, 2001, about $13 million was available for borrowing under this arrangement. The original term of the agreement expired on December 12, 2001 and was renewed for an additional 12-month period. The agreement will automatically be renewed for additional 12-month periods unless terminated by either party.
Fluctuations in our operating cash flows are impacted by our ability to collect receivables from our customers within reasonable and customary terms and manage related payments to vendors. We rely on our credit facilities to provide sufficient flexibility to fund fluctuations in our operating cash requirements, fund required capital to grow the business, and to fund investment opportunities. Availability under our credit facilities is subject to meeting our debt service obligations and financial covenant requirements and is dependent upon the future performance of MSXI. Our future performance will be impacted by general economic conditions and other factors, which may be outside of our control. We believe that our current financing arrangements provide us with sufficient financial flexibility to fund these requirements during the next 12 — 24 months, although there can be no assurance that will be the case. Our term loans require scheduled quarterly payments of principle over the next 4 years with the balance of $70.7 million payable in 2006. Financing requirements over the longer term may require additional access to capital markets. Our ability to access additional capital in the long term may be adversely affected by pricing and availability of capital markets as well as our credit profile at the time we are seeking funds.
Corporate Development
Acquisitions
We have significantly expanded our business through acquisitions while continuing to grow our existing service lines. Our acquisitions have expanded our geographic coverage, increased our service offerings to existing customers and increased our reach to customers outside of the automotive industry. These acquisitions along with our existing businesses provide us with a solid platform to grow our business globally and into a variety of industries in the future. Acquisitions during the last three fiscal years include:
| • | During 1999 we acquired Rice Cohen International, Inc., a permanent placement staffing company based in Yardley, Pennsylvania with historical annual sales of about $5.0 million and Management Resources International, Inc., a provider of training services and courseware in quality systems based in Ann Arbor, Michigan with historical annual sales of about $3.5 million. | ||
| • | Effective September 17, 1999, we acquired 100% of the outstanding common stock of Chelsea Computer Consultants, Inc. Chelsea is a provider of information technology professionals in the areas of application development, networking, database design, enterprise and data modeling and hardware engineering with historical annual sales in excess of $30 million. Chelsea is headquartered in New York, New York and provides consulting and technical staff augmentation services to customers in the financial services, communications and manufacturing industries throughout North America. The purchase price was about $19.9 million at closing and was funded with borrowings under our credit facility. | ||
| • | Effective December 31, 1999, we acquired 75% of the outstanding common stock of Satiz S.r.l., a subsidiary of Fiat, S.p.A. Satiz is headquartered in Turin, Italy and specializes in commercial and technical publishing including translation services, graphics, document systems, warehouse and distribution services, and events. Satiz employs over 500 people and has historical annual sales in excess of $120 million. The purchase price, upon settlement of certain contractual matters, of about $10.0 million was funded with borrowings under our credit facility. Satiz had about $8.9 million of debt outstanding at closing. The remaining 25% of the outstanding common stock of Satiz was retained by Fiat. |
17
Table of Contents
| • | In May 1999, we purchased a 30% interest in QR Quandoccorre S.r.l. and Quandoccorre Interinale S.p.A., two affiliated Italian companies with combined historical annual sales of about $18 million. QR Quandoccorre S.r.l. provides consulting services on a project basis and Quandoccorre Interinale S.p.A. provides staffing services to various industries. Effective January 3, 2000, we acquired the remaining 70% of the outstanding common stock of both companies. The cumulative purchase price of about $11.4 million was funded with a combination of borrowings under our credit facility and borrowings under the Satiz credit facility. | ||
| • | On February 23, 2000, we acquired the professional staffing operations of Corporate Staffing Resources, Inc. of South Bend, Indiana. Specifically, we acquired 100% of the outstanding common stock of Intranational Computer Consultants, Inc. and Programming Management and Systems, Inc. and selected assets and liabilities of CMS Management Services and Ascend for a total purchase price of about $31.8 million at closing. The purchase price was funded with borrowings under our credit facility. These companies provide information technology and technical professional staffing throughout the United States with combined historical annual sales over $57 million. |
Investments
In addition to the above acquisitions, we have completed certain investment transactions to further strengthen our global position and service offerings. Such investments for each of the last three fiscal years include:
| • | Fiscal 1999 —On January 8, 1999, we acquired a 24.5% interest in CADFORM-MSX Engineering GmbH (formerly Cadform Engineering GmbH), a provider of product design and tooling services to the automotive industry. Based in Homberg (Ohm), Germany, Cadform specializes in automotive interior systems and cast aluminum products with historical annual sales of about $12 million. In November 1999 we acquired an additional 24.5% interest in Cadform by contributing selected assets of our German engineering operations. See “Recent Developments” for additional information on Cadform. | ||
| • | Fiscal 2000 —In November 2000, we completed a minority investment and entered into a technical cooperation agreement with Prototipo Holding B.V. Prototipo has operations in Europe and Brazil and provides testing, prototyping, styling and other development services for transportation and industrial manufacturing customers, including automotive, truck and tire manufacturers. | ||
| • | Fiscal 2001 —In March 2001, we acquired a minority interest in MTE Groups L.L.C. MTE is a certified minority supplier of tooling, design, and prototype services, among other services. The partnership provides expanded capabilities to support the tooling and prototype needs of mutual customers. A substantial portion of the purchase price is held in escrow and will be refunded if MTE does not meet certain operational results. As of December 30, 2001, the refundable amount is included in the cost of the investment. In September 2001, we completed a strategic investment in itiliti, Inc., in the form of a bridge loan convertible to preferred stock. itiliti provides a web-enabled human capital management solution in a hosted environment for customers and master service providers. |
Recent Developments
In January 2002, we exercised our option to acquire an additional 16% of the outstanding common stock of CADFORM-MSX Engineering GmbH for about $0.3 million. As of December 30, 2001 we owned 49% of the outstanding common stock of Cadform. We are currently in the process of merging our existing German engineering operations with Cadform. The merger of these operations should strengthen our engineering capabilities and result in future operational efficiencies once complete.
In February 2002, we completed the acquisition of selected assets and liabilities of Draupner Associates AB for a total purchase price of about $2.4 million. The results of Draupner will be included in our consolidated results as of January 2002. Draupner’s principal business is digital documentation and translation services for the automotive and related industries with offices in Europe, Australia and the Pacific Rim. Financing for the transaction was provided through our credit facility.
18
Table of Contents
Inflation
Although we cannot anticipate future inflation, we do not believe that inflation has had, or is likely in the foreseeable future to have, a material impact on our results of operations. While our contracts typically do not include automatic adjustments for inflation, the Ford Master Vendor Agreement does provide for automatic adjustments for inflation for services provided under the Master Vendor Program.
Seasonality
Our quarterly operating results are affected primarily by the number of billing days in the period and the seasonality of our customers’ businesses. Demand for our services has historically been lower during the year-end holidays.
Eurocurrency
On January 1, 1999, the member states of the European Economic and Monetary Union agreed to adopt the Euro as their common legal currency. The existing member state currencies are scheduled to remain legal tender as denominations of the Euro until at least January 1, 2002 but not later than July 1, 2002. During this transition period, monetary transactions may be settled using either the Euro or the existing member state currencies. We have operations in substantially all European Economic and Monetary Union participating countries, as well as in the United Kingdom, which has elected not to participate in the Euro conversion at this time. During fiscal 2001, combined sales from operations that are adopting the Euro were about 19.0% of our total net sales. All of our affected operations have transitioned to make the Euro their functional currency as of December 30, 2001.
We have not experienced any significant operational disruptions to date and do not expect the continued implementation of the Euro to cause any significant future operational disruptions. In addition, we have not incurred and do not expect to incur any significant adverse effects from the continued implementation of the Euro, including currency risk, which could affect our liquidity or capital resources.
Forward Looking Statements
This report on Form 10-K contains statements that constitute “forward-looking statements” within the meaning of the Private Securities Litigation Reform Act of 1995. Such statements can be identified by the use of forward-looking terminology such as “believes,” “expects,” “may,” “estimates,” “will,” “should,” “plans” or “anticipates” or the negative thereof or other variations thereon or comparable terminology, or by discussions of strategy. Such forward-looking statements are not guarantees of future performance and involve significant risks and uncertainties. Actual results may vary materially from those in the forward-looking statements as a result of any number of factors, many of which are beyond the control of management. These factors include, but are not limited to, MSXI’s leverage, its reliance on major customers in the automotive industry, the degree and nature of competition, our ability to recruit and place qualified personnel, risks associated with our acquisition strategy, and employment liability risk.
Item 7A. Quantitative and Qualitative Disclosures about Market Risk.
We are exposed to certain market risks, including interest rate and currency exchange rate risks. Risk exposures relating to these market risks are summarized below. This information should be read in connection with the consolidated financial statements and the related notes thereto included elsewhere in this Form 10-K.
Currency Rate Management
For fiscal 2001, about 35% of our net sales were from markets outside of the United States. To date, the majority of our exposure has been naturally hedged since our foreign operation’s revenues and operating costs are typically denominated in the same currency. We may periodically hedge specific transactions or obligations in non-functional currencies in order to mitigate any additional risk. However, we do not enter into financial instruments for trading or speculative purposes. For the fiscal years ended December 31, 2000 and December 30, 2001, adjustments from the translation of the financial results of our foreign operations reduced equity by about $9.8 million and $38 thousand, respectively.
We currently have operations in Argentina, which has recently experienced economic stagnation and political unrest resulting in a significant currency devaluation of the Argentine peso relative to the U.S. dollar. Due to the size our Argentina operations, relative to our consolidated results, the recent currency devaluation has not had, and is not expected to have, a material impact on our financial condition, results of operations, or cash flows.
19
Table of Contents
Interest Rate Management
We manage interest cost using a combination of fixed and variable rate debt. As of December 30, 2001, we had $130 million of senior subordinated notes outstanding at a fixed interest rate of 11-3/8% with a remaining duration of 6 years. In addition, we have a $205 million credit facility and other short-term facilities at variable rates of interest. As of December 30, 2001, $107.2 million was outstanding under our credit facility at short-term interest rates ranging from 4.23% to 7.00%. A 1% increase in the credit facility’s applicable interest rate would result in additional interest expense of approximately $1.3 million per year.
As of December 30, 2001 the fair value of the senior subordinated notes was $102.2 million compared to its carrying value of $130 million.
Sales to Major Markets/Customers
Our current business is heavily reliant on the domestic and foreign automotive industries. Ford, DaimlerChrysler, General Motors, and Fiat, including their automotive subsidiaries, accounted for approximately 35.6%, 9.3%, 8.5%, and 5.5% of our consolidated net sales, respectively, for fiscal 2001. Significant future price or volume reductions from these customers could adversely affect our earnings and financial condition. We are confident we can expand our services to other less cyclical industries and have had recent success in doing so. However, there can be no assurance that our diversification efforts will fully offset the impact of any further declines in our automotive markets..
20
Table of Contents
Item 8. Financial Statements and Supplementary Data.
Report of Independent Accountants
To the Board of Directors and Shareholders
of MSX International, Inc.
In our opinion, the consolidated financial statements listed in the index appearing under Item 14(a)(1) present fairly, in all material respects, the financial position of MSX International, Inc. and its subsidiaries at December 30, 2001 and December 31, 2000, and the results of their operations and their cash flows for each of the three fiscal years in the period ended December 30, 2001, in conformity with accounting principles generally accepted in the United States of America. In addition, in our opinion, the financial statement schedule listed in the index appearing under Item 14(a)(2) presents fairly, in all material respects, the information set forth therein when read in conjunction with the related consolidated financial statements. These financial statements and financial statement schedule are the responsibility of the Company’s management; our responsibility is to express an opinion on these financial statements and financial statement schedule based on our audits. We conducted our audits of these statements in accordance with auditing standards generally accepted in the United States of America, which require that we plan and perform the audit to obtain reasonable assurance about whether the financial statements are free of material misstatement. An audit includes examining, on a test basis, evidence supporting the amounts and disclosures in the financial statements, assessing the accounting principles used and significant estimates made by management, and evaluating the overall financial statement presentation. We believe that our audits provide a reasonable basis for our opinion.
/s/ PRICEWATERHOUSECOOPERS LLP
Detroit, Michigan
February 25, 2002
21
Table of Contents
MSX INTERNATIONAL, INC.
CONSOLIDATED BALANCE SHEETS
as of December 31, 2000 and December 30, 2001
| December 31, | December 30, | |||||||||||
| 2000 | 2001 | |||||||||||
| (dollars in thousands) | ||||||||||||
ASSETS | ||||||||||||
| Current assets: | ||||||||||||
| Cash and cash equivalents | $ | 4,686 | $ | 4,924 | ||||||||
| Accounts receivable, net (Note 4) | 317,458 | 252,008 | ||||||||||
| Inventory | 7,464 | 6,916 | ||||||||||
| Prepaid expenses and other assets | 8,578 | 8,011 | ||||||||||
| Deferred income taxes, net (Note 13) | 3,209 | 3,477 | ||||||||||
| Total current assets | 341,395 | 275,336 | ||||||||||
| Property and equipment, net (Note 5) | 40,959 | 42,977 | ||||||||||
| Goodwill and other intangibles, net of accumulated amortization of $11,395 and $17,618, respectively (Note 3) | 172,091 | 170,491 | ||||||||||
| Other assets | 18,774 | 22,608 | ||||||||||
| Deferred income taxes, net (Note 13) | 3,810 | 2,970 | ||||||||||
| Total assets | $ | 577,029 | $ | 514,382 | ||||||||
LIABILITIES AND SHAREHOLDERS’ DEFICIT | ||||||||||||
| Current liabilities: | ||||||||||||
| Notes payable and current portion of long-term debt (Note 7) | $ | 13,170 | $ | 15,785 | ||||||||
| Accounts payable and drafts (Note 8) | 176,569 | 153,645 | ||||||||||
| Accrued payroll and benefits | 30,561 | 23,946 | ||||||||||
| Other accrued liabilities (Note 6) | 71,017 | 55,450 | ||||||||||
| Total current liabilities | 291,317 | 248,826 | ||||||||||
| Long-term debt (Note 7) | 253,676 | 230,869 | ||||||||||
| Long-term deferred compensation liabilities and other (Note 12) | 10,406 | 12,977 | ||||||||||
| Total liabilities | 555,399 | 492,672 | ||||||||||
| Commitments and contingencies (Note 9) | — | — | ||||||||||
| Minority interests | 1,092 | 1,197 | ||||||||||
| Redeemable Series A Preferred Stock (Note 10) | 36,000 | 36,000 | ||||||||||
| Shareholders’ deficit (Note 11): | ||||||||||||
| Common Stock, $.01 par value, 200,000,000 aggregate shares of each of Class A and Class B Common Stock authorized; 20,400,600 and 20,080,800 shares of Class A Common Stock issued and outstanding, respectively | 204 | 201 | ||||||||||
| Additional paid-in-capital | (21,705 | ) | (21,769 | ) | ||||||||
| Note receivable from officer | (3,000 | ) | (3,000 | ) | ||||||||
| Accumulated other comprehensive loss | (15,641 | ) | (15,603 | ) | ||||||||
| Retained earnings | 24,680 | 24,684 | ||||||||||
| Total shareholders’ deficit | (15,462 | ) | (15,487 | ) | ||||||||
| Total liabilities and shareholders’ deficit | $ | 577,029 | $ | 514,382 | ||||||||
The accompanying notes are an integral part of the consolidated financial statements
22
Table of Contents
MSX INTERNATIONAL, INC.
CONSOLIDATED STATEMENTS OF INCOME
for the three fiscal years ended December 30, 2001
| Fiscal Year | Fiscal Year | Fiscal Year | |||||||||||
| Ended | Ended | Ended | |||||||||||
| January 2, | December 31, | December 30, | |||||||||||
| 2000 | 2000 | 2001 | |||||||||||
| (in thousands) | |||||||||||||
| Net sales (Note 14) | $ | 759,842 | $ | 1,035,223 | $ | 929,257 | |||||||
| Cost of sales | 653,274 | 889,286 | 812,221 | ||||||||||
| Gross profit | 106,568 | 145,937 | 117,036 | ||||||||||
| Selling, general and administrative expenses | 65,082 | 83,238 | 78,775 | ||||||||||
| Amortization of goodwill and other intangibles | 3,156 | 5,583 | 6,222 | ||||||||||
| Operating income | 38,330 | 57,116 | 32,039 | ||||||||||
| Interest expense, net (Note 7) | 21,141 | 30,119 | 27,881 | ||||||||||
| Income before income taxes, minority interests and equity in net losses of affiliates | 17,189 | 26,997 | 4,158 | ||||||||||
| Income tax provision (Note 13) | 6,995 | 11,340 | 1,712 | ||||||||||
| Less minority interests and equity in net losses of affiliates, net of taxes | — | 766 | 1,943 | ||||||||||
| Net income | $ | 10,194 | $ | 14,891 | $ | 503 | |||||||
The accompanying notes are an integral part of the consolidated financial statements
23
Table of Contents
MSX INTERNATIONAL, INC.
CONSOLIDATED STATEMENTS OF CASH FLOWS
for the three fiscal years ended December 30, 2001
| Fiscal Year | Fiscal Year | Fiscal Year | |||||||||||||
| Ended | Ended | Ended | |||||||||||||
| January 2, | December 31, | December 30, | |||||||||||||
| 2000 | 2000 | 2001 | |||||||||||||
| (in thousands) | |||||||||||||||
| Cash flows from operating activities: | |||||||||||||||
| Net income | $ | 10,194 | $ | 14,891 | $ | 503 | |||||||||
| Adjustments to reconcile net income to net cash provided by operating activities: | |||||||||||||||
| Minority interests and equity in net losses of affiliates | — | 766 | 1,943 | ||||||||||||
| Depreciation | 13,683 | 16,925 | 16,988 | ||||||||||||
| Amortization | 3,852 | 6,662 | 7,438 | ||||||||||||
| Deferred taxes | 1,176 | 2,542 | 573 | ||||||||||||
| (Gain) loss on sale/disposal of property and equipment | 1,271 | (54 | ) | 154 | |||||||||||
| (Increase) decrease in receivables, net | (32,397 | ) | (403 | ) | 65,451 | ||||||||||
| (Increase) decrease in inventory | 103 | 902 | 819 | ||||||||||||
| (Increase) decrease in prepaid expenses and other assets | (2,329 | ) | 108 | 567 | |||||||||||
| Increase (decrease) in current liabilities | 35,600 | 17,034 | (37,217 | ) | |||||||||||
| Other, net | (969 | ) | (291 | ) | 1,218 | ||||||||||
| Net cash provided by operating activities | 30,184 | 59,082 | 58,437 | ||||||||||||
| Cash flows from investing activities: | |||||||||||||||
| Capital expenditures | (16,692 | ) | (18,168 | ) | (19,243 | ) | |||||||||
| Acquisition of businesses, net of cash acquired | (54,735 | ) | (60,106 | ) | (16,536 | ) | |||||||||
| Proceeds from sale/disposal of property and equipment | 16,264 | 2,308 | 263 | ||||||||||||
| Other, net | (2,761 | ) | 583 | 422 | |||||||||||
| Net cash used for investing activities | (57,924 | ) | (75,383 | ) | (35,094 | ) | |||||||||
| Cash flows from financing activities: | |||||||||||||||
| Proceeds from issuance of debt | 79,404 | 25,000 | — | ||||||||||||
| Repayment of debt | — | (3,814 | ) | (3,938 | ) | ||||||||||
| Debt issuance costs | (3,292 | ) | (251 | ) | (653 | ) | |||||||||
| Changes in revolving debt, net | (28,954 | ) | (2,259 | ) | (16,254 | ) | |||||||||
| Changes in book overdrafts, net | 2,881 | 3,148 | (2,385 | ) | |||||||||||
| Payment of contractual acquisition obligation | (15,000 | ) | — | — | |||||||||||
| Repurchase of Common and Preferred Stock | — | — | (4,178 | ) | |||||||||||
| Sale of Common and Preferred Stock | — | — | 3,612 | ||||||||||||
| Other, net | 59 | — | — | ||||||||||||
| Net cash provided by (used for) financing activities | 35,098 | 21,824 | (23,796 | ) | |||||||||||
| Effect of foreign exchange rate changes on cash and cash equivalents | (4,727 | ) | (7,716 | ) | 691 | ||||||||||
| Cash and cash equivalents: | |||||||||||||||
| Increase (decrease) for the period | 2,631 | (2,193 | ) | 238 | |||||||||||
| Balance, beginning of period | 4,248 | 6,879 | 4,686 | ||||||||||||
| Balance, end of period | $ | 6,879 | $ | 4,686 | $ | 4,924 | |||||||||
| Supplemental disclosure of cash flow information: | |||||||||||||||
| Cash paid for interest | $ | 21,621 | $ | 30,519 | $ | 26,223 | |||||||||
| Cash paid for income taxes | 1,963 | 9,908 | 2,677 | ||||||||||||
| Non-cash investing and financing activities: | |||||||||||||||
| Equity investment in CADFORM-MSX (Note 3) | 3,306 | — | — | ||||||||||||
The accompanying notes are an integral part of the consolidated financial statements
24
Table of Contents
MSX INTERNATIONAL, INC.
CONSOLIDATED STATEMENTS OF SHAREHOLDERS’ DEFICIT
for the three fiscal years ended December 30, 2001
| Accumulated | Retained | ||||||||||||||||||||||||
| Other | Earnings | Total | |||||||||||||||||||||||
| Common | Additional | Note Receivable | Comprehensive | (Accumulated | Shareholders' | ||||||||||||||||||||
| Stock | Paid-In-Capital | From Officer | Loss | Deficit) | Deficit | ||||||||||||||||||||
| (in thousands) | |||||||||||||||||||||||||
| Balance at January 3, 1999 | $ | 1 | $ | (24,764 | ) | $ | — | $ | (1,140 | ) | $ | (202 | ) | $ | (26,105 | ) | |||||||||
| Comprehensive income: | |||||||||||||||||||||||||
| Net income | 10,194 | 10,194 | |||||||||||||||||||||||
| Foreign currency translation | (4,727 | ) | (4,727 | ) | |||||||||||||||||||||
| Total comprehensive income | 5,467 | ||||||||||||||||||||||||
| Sale of Common Stock | — | 59 | — | — | — | 59 | |||||||||||||||||||
| Balance at January 2, 2000 | 1 | (24,705 | ) | — | (5,867 | ) | 9,992 | (20,579 | ) | ||||||||||||||||
| Comprehensive income: | |||||||||||||||||||||||||
| Net income | 14,891 | 14,891 | |||||||||||||||||||||||
| Foreign currency translation | (9,774 | ) | (9,774 | ) | |||||||||||||||||||||
| Total comprehensive income | 5,117 | ||||||||||||||||||||||||
| Sale of Common Stock | — | 3,000 | (3,000 | ) | — | — | — | ||||||||||||||||||
| 200 for one stock split | 203 | — | — | — | (203 | ) | — | ||||||||||||||||||
| Balance at December 31, 2000 | 204 | (21,705 | ) | (3,000 | ) | (15,641 | ) | 24,680 | (15,462 | ) | |||||||||||||||
| Comprehensive income: | — | ||||||||||||||||||||||||
| Net income | 503 | 503 | |||||||||||||||||||||||
| Foreign currency translation | 38 | 38 | |||||||||||||||||||||||
| Total comprehensive income | 541 | ||||||||||||||||||||||||
| Repurchase of Common Stock | (8 | ) | (2,042 | ) | — | — | (499 | ) | (2,549 | ) | |||||||||||||||
| Sale of Common Stock | 5 | 1,978 | — | — | — | 1,983 | |||||||||||||||||||
| Balance at December 30, 2001 | $ | 201 | $ | 21,769 | $ | (3,000 | ) | $ | (15,603 | ) | $ | 24,684 | $ | (15,487 | ) | ||||||||||
The accompanying notes are an integral part of the consolidated financial statements
25
Table of Contents
MSX INTERNATIONAL, INC.
NOTES TO CONSOLIDATED FINANCIAL STATEMENTS
(dollars in thousands unless stated otherwise)
| 1. | Organization and Basis of Presentation: |
The accompanying financial statements present the assets, liabilities and results of operations of MSX International, Inc. and its consolidated subsidiaries (“MSXI”). MSXI is a holding company owned by Citicorp and affiliates and certain members of management. Since our formation we have completed numerous acquisitions as disclosed in Note 3. The results of operations of acquired companies have been included in the results of operations of MSXI from the effective date of each transaction. Our financial statements for each fiscal year are not directly comparable without taking into account the impact of acquisitions.
We are principally engaged in providing collaborative enterprise services to automobile manufacturers and suppliers and other industries primarily in North America and Europe.
| 2. | Summary of Significant Accounting Policies: |
a. Principles of Consolidation: The accompanying financial statements include the accounts of MSX International, Inc. and all majority owned subsidiaries. Significant intercompany transactions have been eliminated. Companies that are 20 to 50 percent owned by MSX International, Inc. or its wholly owned subsidiaries are accounted for by the equity method of accounting. We use a 52-53 week fiscal year that ends on the Sunday nearest December 31.
b. Cash and Cash Equivalents: All highly liquid investments with an original maturity of three months or less are considered to be cash equivalents.
c. Receivables: Receivables are presented net of aggregate allowances for doubtful accounts of $2.0 million and $2.7 million at December 31, 2000 and December 30, 2001, respectively.
d. Inventory: Inventory is comprised of raw materials, parts and supplies which are stated at the lower of cost or net realizable value, with cost determined using the first-in, first-out method.
e. Property and Equipment: Property and equipment, including significant betterments to leased facilities, are recorded at cost. Upon retirement or disposal of property and equipment, the cost and accumulated depreciation are removed from the accounts, and any gain or loss is included in income. Maintenance and repair costs are charged to expense as incurred.
Under the provisions of Statement of Position 98-1, costs associated with software developed or obtained for internal use are capitalized when both the preliminary project stage is complete and management has authorized funding of the development program. Such costs are included in computers, peripherals and software. Capitalized costs include both external costs of software and consulting as well as payroll and payroll related costs of MSXI personnel working directly on the development project. Internal costs capitalized are not material to the consolidated balance sheet at December 31, 2000 and December 30, 2001.
f. Goodwill and Other Intangibles: The excess of the purchase price, including direct costs of acquisition, over the estimated fair value of acquired assets and assumed liabilities is being amortized using the straight-line method over the period estimated to be benefited, ranging from 20 to 30 years.
Management evaluates the carrying value of goodwill when events or circumstances warrant such a review. When required, an evaluation is performed comparing anticipated undiscounted future cash flows from operating activities with the carrying amount of the excess of cost over net assets of acquired companies. The factors considered by management in performing this assessment include current operating results, business prospects, market trends, competitive activities and other economic factors. To date, there have been no permanent impairments related to goodwill.
26
Table of Contents
MSX INTERNATIONAL, INC.
NOTES TO CONSOLIDATED FINANCIAL STATEMENTS — (continued)
(dollars in thousands unless stated otherwise)
In June 2001, the Financial Accounting Standards Board (“FASB”) issued Statement of Financial Accounting Standards (“SFAS”) No. 141, Business Combinations, and No. 142, Goodwill and Other Intangible Assets. SFAS 141 addresses accounting and reporting for business combinations initiated after June 30, 2001. SFAS 142 addresses accounting and reporting for goodwill and other intangible assets and is effective for fiscal years beginning after December 15, 2001. Under SFAS 142, goodwill and intangible assets deemed to have indefinite lives will no longer be amortized but will be subject to annual impairment tests in accordance with the statements. Other intangible assets will continue to be amortized over their useful lives. Amortization expense related to goodwill during fiscal 2001 was $6.2 million. We are still evaluating the impact that adopting SFAS 142 during fiscal 2002 will have on our consolidated results of operations and balance sheet.
g. Fair Value of Financial Instruments: The estimated fair value of cash and cash equivalents, accounts receivable, accounts payable, and short-term debt approximate their carrying amounts. The estimated fair value and carrying amounts of long-term debt borrowings are reported in Note 7.
h. Foreign Currency Translation and Transactions: Net assets of operations outside of the United States are translated into U.S. dollars using current exchange rates with the effects of translation adjustments included in shareholders’ deficit as a separate component of comprehensive income. Revenues and expenses of operations outside of the United States are translated at the average rates of exchange during the period. Gains and losses arising from transactions denominated in currencies other than the functional currency of a particular entity are included in income. Net transaction gains and losses were not material to our results of operations during the periods presented.
i. Revenue Recognition: Our revenue is primarily comprised of revenue from fixed price contracts and time and material contracts. Revenues from fixed price contracts are recognized using the percentage of completion method, measured by comparing the percentage of labor costs incurred to date to the estimated total labor costs for each contract. Revenues from time and material contracts are valued at selling price based on contractual billing rates. Revenues from certain master vendor and supply chain management programs are recorded, net of billings from sub-suppliers, at the completion of each individual service.
Contract costs include all direct material and labor costs and indirect costs such as indirect labor, supplies, tools and repairs. Provisions for estimated losses on uncompleted contracts are made in the period in which such losses are determined. Changes in fixed price contracts may result in revisions to estimates of costs and revenues and are recognized in the period in which the revisions are determined.
j. Depreciation: Depreciation is computed using the straight-line method over the estimated useful lives of assets as follows:
| Useful Lives | ||||
| In Years | ||||
| Leasehold improvements | 5-40 | |||
| Machinery and equipment | 3-12 | |||
| Computers, peripherals and software | 2 - 5 | |||
| Automobiles and trucks | 3 - 5 | |||
Leasehold improvements are amortized on a straight-line basis over their estimated useful lives or the term of the lease, whichever is shorter.
k. Income Taxes: Deferred income taxes are recorded to reflect the differences between the tax basis and financial reporting basis of assets and liabilities and are measured using the enacted tax rates and laws that will be in effect when the differences are expected to reverse.
l. Foreign Currency Contracts: MSXI has significant operations outside of the United States that are subject to foreign currency exchange risk. We may periodically hedge transactions or obligations in non-functional currencies in order to mitigate this risk. During the fiscal year ended December 31, 2000, we entered into forward foreign currency contracts to hedge certain foreign currency financing transactions. Unrealized gains/losses on the forward contracts are recognized as an adjustment to the gains/losses recognized on the underlying hedged transaction to the extent they are correlated. The uncorrelated net losses on such contracts were not material to our results of operations during fiscal 2000.
27
Table of Contents
MSX INTERNATIONAL, INC.
NOTES TO CONSOLIDATED FINANCIAL STATEMENTS — (continued)
(dollars in thousands unless stated otherwise)
m. Reclassifications: Certain prior year amounts have been reclassified to conform to the presentation adopted during fiscal 2001.
n. Use of Estimates: The preparation of financial statements in conformity with generally accepted accounting principles requires management to make estimates and assumptions that affect the reported amounts of assets and liabilities and the disclosure of contingent assets and liabilities at the date of the financial statements. Such estimates and assumptions also affect the reported amounts of revenues and expenses during the reporting periods. Actual results may differ from such estimates and assumptions.
o. Recently Adopted Accounting Pronouncements:In June 1998, the FASB issued SFAS No. 133, “Accounting for Derivative Instruments and Hedging Activities.” SFAS No. 133 requires recognition of all derivative financial instruments as either assets or liabilities at fair value and determines the method(s) of gain/loss recognition. The adoption of SFAS No. 133 during fiscal 2001 did not have any material impact on our consolidated financial statements.
| 3. | Acquisition of Businesses: |
Rice Cohen and Management Resources Acquisitions. During 1999 we acquired Rice Cohen International, Inc., a permanent placement staffing company based in Yardley, Pennsylvania with historical annual sales of about $5.0 million and Management Resources International, Inc., a provider of training services and courseware in quality systems based in Ann Arbor, Michigan with historical annual sales of about $3.5 million. The Rice Cohen and Management Resources Acquisitions were accounted for under the purchase method of accounting.
Chelsea Acquisition.Effective September 17, 1999, we acquired 100% of the outstanding common stock of Chelsea Computer Consultants, Inc. (“Chelsea”) from Staff Builders, Inc. The total purchase price of about $19.9 million at closing was funded with borrowings under our credit facility. Chelsea is a provider of information technology professionals in the areas of application development, networking, database design, enterprise and data modeling and hardware engineering with historical annual sales in excess of $30 million. Chelsea is headquartered in New York, New York and provides consulting and technical staff augmentation services to customers in the financial services, communications and manufacturing industries in the United States. The acquisition of Chelsea was accounted for under the purchase method of accounting, resulting in goodwill of $15.7 million at closing.
Satiz Acquisition.Effective December 31, 1999, we acquired 75% of the outstanding common stock of Satiz S.r.l. (“Satiz”), a subsidiary of Fiat S.p.A. Satiz is headquartered in Turin, Italy and specializes in commercial and technical publishing including translation services, graphics, document systems, warehouse and distribution services, and events. Satiz employs over 500 people and had historical annual revenues in excess of $120 million. The total purchase price, upon settlement of certain contractual matters, of about $10.0 million was funded with borrowings under our credit facility. At closing, Satiz had about $8.9 million of debt outstanding pursuant to the Satiz credit facility. The remaining 25% of the outstanding common stock of Satiz is retained by Fiat S.p.A. The acquisition of Satiz was accounted for under the purchase method of accounting, resulting in goodwill of $9.1 million.
Quandoccorre Acquisition. In May 1999, we purchased a 30% interest in QR Quandoccorre S.r.l. and Quandoccorre Interinale S.p.A. (“QR/QI”), two affiliated Italian companies with combined historical annual sales of about $18 million. QR Quandoccorre S.r.l. provides consulting services on a project basis and Quandoccorre Interinale S.p.A. provides temporary staffing services to various industries. Effective January 3, 2000, we acquired the remaining 70% of the outstanding common stock of both companies. The cumulative purchase price of about $11.4 million was funded with a combination of borrowings under our credit facility and borrowings under the Satiz credit facility. The acquisition was accounted for under the purchase method of accounting, resulting in goodwill of $10.5 million upon closing of the 70% acquisition.
28
Table of Contents
MSX INTERNATIONAL, INC.
NOTES TO CONSOLIDATED FINANCIAL STATEMENTS — (continued)
(dollars in thousands unless stated otherwise)
CSR Acquisition. On February 23, 2000 we acquired the professional staffing operations of Corporate Staffing Resources, Inc. (the “CSR Acquisition”). Specifically, we acquired 100% of the outstanding common stock of Intranational Computer Consultants, Inc. and Programming Management and Systems, Inc. and selected assets and liabilities of CMS Management Services and Ascend. The total purchase price, upon settlement of certain contractual matters, of about $31.8 million was funded with borrowings under our credit facility. These companies provide information technology and technical professional staffing services throughout the United States with combined historical annual sales in excess of $57 million. The CSR Acquisition was accounted for under the purchase method of accounting, resulting in goodwill of $26.9 million.
Adjustments to the preliminary allocation of purchase price may occur up to one year from the date of acquisition as a result of obtaining new or revised information regarding the value of assets acquired and liabilities assumed. Any such adjustments change recorded goodwill and are amortized over the remaining goodwill amortization period. Management believes the resolution of these matters will not have a material effect on the results of operations, financial position or cash flows of MSXI.
The terms of certain of our acquisition agreements provide for additional contingent consideration to be paid over a period of up to two years if the acquired entity’s future operating results exceed targeted levels. Contingent consideration is earned when the acquired entity’s financial performance grows in excess of the targeted levels established at the time of acquisition. Such additional consideration is recorded, when earned, as additional purchase price. In this regard, we recorded additional liabilities for consideration during 1999, 2000 and 2001, related to prior year acquisitions, which resulted in additional goodwill capitalization of about $21.9 million, $15.4 million and $2.1 million, respectively. Additional goodwill is amortized to expense, once payment is made, over the remaining amortization period.
Pro Forma Results.The following unaudited pro forma condensed financial data are presented as if the above acquisitions had been made at the beginning of the fiscal 1999 year. The unaudited pro forma information is not necessarily indicative of either the results of operations that would have occurred had the acquisitions been made during the period presented or the future results of the combined operations. There were no significant acquisitions completed during fiscal 2001 that would cause our results to be materially different from our reported results.
| Fiscal Year | Fiscal Year | |||||||
| Ended | Ended | |||||||
| January 2, | December 31, | |||||||
| 2000 | 2000 | |||||||
| (Unaudited) | (Unaudited) | |||||||
| Net sales | $ | 995,062 | $ | 1,041,861 | ||||
| Net income | 13,155 | 14,702 | ||||||
In addition to the above, we completed several investment transactions during the last three fiscal years. The aggregate purchase price of these investments was about $11.1 million in cash and $3.3 million of contributed assets. Funding for cash investments was provided with borrowings under our credit facility. The investments included:
| • | In January 1999, we purchased a 24.5% interest in CADFORM-MSX Engineering GmbH (formerly Cadform Engineering GmbH), a German company that provides product design and tooling services with historical annual sales of about $12 million. Cadform specializes in automotive interior systems and cast aluminum products. In November 1999, we increased our ownership of Cadform to about 49% by contributing certain assets of our German operations. We are currently engaging in joint projects with Cadform and will exercise an option to acquire additional interests in the company in early 2002. | ||
| • | In November 2000, we purchased a 2% investment in Prototipo Holding B.V. and entered into a technical cooperation agreement as part of the purchase. As part of this investment, we obtained two seats on Prototipo’s Board of Directors. Prototipo has operations in Europe and Brazil and provides testing, prototyping, styling and other development services for transportation and industrial manufacturing customers, including automotive, truck, and tire manufacturers. The investment is accounted for under the cost method. |
29
Table of Contents
MSX INTERNATIONAL, INC.
NOTES TO CONSOLIDATED FINANCIAL STATEMENTS — (continued)
(dollars in thousands unless stated otherwise)
| • | In March 2001, we acquired a 49% interest in MTE Groups L.L.C. MTE is a certified minority supplier of tooling, design, and prototype services. A substantial portion of the purchase price is held in escrow and will be refunded if MTE does not meet certain operational results. As of December 30, 2001, the refundable amount is included in the cost of the investment. In September 2001, we completed a strategic investment in itiliti, Inc., in the form of a bridge loan convertible to preferred stock. itiliti is a strategic partner in our human capital management practice. |
| 4. | Accounts Receivable, Net: |
A significant portion of our sales are made to manufacturers in the automotive and transportation related industries. Sales to significant automotive customers, including their automotive subsidiaries, as a percent of total net sales were:
| Percent of Total Sales | ||||||||||||
| Sales to: | 1999 | 2000 | 2001 | |||||||||
| Ford | 42.6 | % | 33.9 | % | 35.6 | % | ||||||
| DaimlerChrysler | 15.2 | % | 11.0 | % | 9.3 | % | ||||||
| General Motors | 13.5 | % | 9.5 | % | 8.5 | % | ||||||
| Fiat | — | 10.6 | % | 5.5 | % | |||||||
| Total | 71.3 | % | 65.0 | % | 58.9 | % | ||||||
Receivables arise from services provided pursuant to contracts or agreements with customers for such services. At January 2, 2000, December 31, 2000, and December 30, 2001 the foregoing four customers and their subsidiaries accounted for approximately 62%, 64% and 52%, respectively, of the billed accounts receivable balance.
Accounts receivable includes both billed and unbilled receivables. Unbilled receivables amounted to $116.8 million and $98.3 million at December 31, 2000 and December 30, 2001, respectively. All such billings are expected to be collected within the ensuing year. Accounts receivable also include the portion of our billings for certain master vendor and supply chain management services attributable to services provided by our vendors, which are passed on to our customers. These amounts totaled $82.5 million as of December 31, 2000 and $49.7 million as of December 30, 2001. A corresponding liability to our vendors for these amounts is recorded in accounts payable at the time related receivables are recorded.
| 5. | Property and Equipment, Net: |
Property and equipment, net includes the following:
| At December 31, | At December 30, | ||||||||
| 2000 | 2001 | ||||||||
| Cost: | |||||||||
| Leasehold improvements | $ | 12,424 | $ | 10,205 | |||||
| Machinery and equipment | 50,524 | 56,232 | |||||||
| Computers, peripherals and software | 34,636 | 42,466 | |||||||
| Automobiles and trucks | 1,657 | 1,960 | |||||||
| 99,241 | 110,863 | ||||||||
| Less accumulated depreciation | (58,282 | ) | (67,886 | ) | |||||
| Property and equipment, net | $ | 40,959 | $ | 42,977 | |||||
30
Table of Contents
MSX INTERNATIONAL, INC.
NOTES TO CONSOLIDATED FINANCIAL STATEMENTS — (continued)
(dollars in thousands unless stated otherwise)
| 6. | Other Accrued Liabilities: |
Other accrued liabilities include the following:
| At December 31, | At December 30, | |||||||
| 2000 | 2001 | |||||||
| Income and other taxes (including VAT taxes) | $ | 7,267 | $ | 3,730 | ||||
| Deferred income/advance payments | 33,405 | 24,088 | ||||||
| Contingent consideration liabilities | 18,033 | 10,470 | ||||||
| Interest | 7,202 | 7,644 | ||||||
| Other | 5,110 | 9,518 | ||||||
| $ | 71,017 | $ | 55,450 | |||||
Deferred income/advance payments represent both payments from customers received in advance of revenues recognized under the percentage of completion method and payments received in advance of billings from sub-contract vendors.
| 7. | Debt: |
Debt is comprised of the following:
| Outstanding at | |||||||||||||
| Interest Rates at | |||||||||||||
| December 30, | December 31, | December 30, | |||||||||||
| 2001 | 2000 | 2001 | |||||||||||
| Senior Subordinated Notes | 11.375 | % | $ | 130,000 | $ | 130,000 | |||||||
| Credit Facility, as amended and restated: | |||||||||||||
| Revolving line of credit notes | n/a | 19,964 | — | ||||||||||
| Swingline notes | 4.23-7.00 | % | 7,712 | 9,931 | |||||||||
| Term notes | 5.34-6.10 | % | 101,250 | 97,313 | |||||||||
| Satiz Facility | 4.55 | % | 6,392 | 8,750 | |||||||||
| Other | 7.00-7.25 | % | 1,528 | 660 | |||||||||
| 266,846 | 246,654 | ||||||||||||
| Less current portion | 13,170 | 15,785 | |||||||||||
| Total long-term debt | $ | 253,676 | $ | 230,869 | |||||||||
Senior Subordinated Notes
On January 22, 1998, we issued, in a private placement, $100 million aggregate principal amount of 11-3/8% unsecured senior subordinated notes maturing January 15, 2008 (the “Series A Notes”). The net proceeds were used to retire bridge loans to Citicorp and MascoTech, Inc., retire senior subordinated notes payable to MascoTech, Inc. and repay amounts outstanding under our credit facility. On August 20, 1998, we completed an offer to exchange 11-3/8% unsecured senior subordinated notes, registered under the Securities Act of 1933 for any and all outstanding Series A Notes. Interest on the notes is payable semi-annually at 11-3/8% per annum and commenced July 15, 1998. The notes may be redeemed subsequent to January 15, 2003 at premiums that begin at 105.6875% and decline each year to face for redemptions taking place after January 15, 2006. Upon the occurrence of a Change of Control, as defined in the bond indenture, the notes may be redeemed at the option of the noteholders at a premium of one percent, plus accrued and unpaid interest, if any. The notes contain covenants which, among others, limit the incurrence of additional indebtedness and restrict capital transactions, distributions and asset dispositions of certain subsidiaries.
31
Table of Contents
MSX INTERNATIONAL, INC.
NOTES TO CONSOLIDATED FINANCIAL STATEMENTS — (continued)
(dollars in thousands unless stated otherwise)
On May 18, 1999, we issued, in a private placement, an additional $30 million aggregate principal amount of 11-3/8% unsecured senior subordinated notes maturing January 15, 2008 (the “Series B Notes”). The Series B Notes are substantially identical to, and rank equally in right of payment with, our $100 million aggregate principal amount of 11-3/8% unsecured senior subordinated notes issued during 1998. The net proceeds from the issuance of the Series B Notes were used to repay amounts previously outstanding under our credit facility. On September 10, 1999, we completed an offer to exchange 11-3/8% unsecured senior subordinated notes, registered under the Securities Act of 1933, for any and all outstanding Series B Notes.
In connection with the $130 million of senior subordinated notes, each of our significant domestic restricted subsidiaries, as defined in the bond indenture (the “Guarantor Subsidiaries”), irrevocably and unconditionally guarantees MSXI’s performance under the notes as primary obligors. See Note 16 for additional information.
Credit Facility
Effective on November 30, 1999, we completed an amended and restated credit facility with commercial banks and institutional lenders led by Bank One N.A., as agent. The facility provides borrowing capacity on a senior-secured basis of up to $205 million, as defined, to replace our prior credit facility, which provided borrowing capacity of $130 million. The credit facility includes an amended and restated $30 million five-year term loan, an amended and restated $100 million five-year revolving credit facility and an additional $75 million seven-year institutional term loan. Both the revolving credit and term loan borrowings are subject to satisfaction of borrowing base requirements, based on accounts receivable balances, and financial reporting and operating covenants. The revolving credit portion of the facility provides for borrowings as revolving credit loans, letters of credit and swingline loans. The revolving credit portion of the facility expires December 7, 2004. Revolving credit loans, swingline loans and letters of credit (collectively “Revolving Debt”) are payable on demand. Interest on loans under the credit facility is payable quarterly or, if earlier, at the end of each interest period and accrues at an annual rate equal to a floating rate, as defined, except for swingline loans which accrue at an annual rate equal to a fixed or floating rate as negotiated at the time of borrowing.
The $30 million term loan, as amended and restated, matures on December 7, 2004 with principal payments due quarterly, on a graduated basis, until maturity. The additional $75 million senior secured institutional term loan matures on December 7, 2006. Principal payments of 0.25% of the $75 million institutional term loan are payable quarterly in years one through six with the balance payable in year seven. The term loans may also be subject to mandatory prepayments if MSXI generates excess cash flows, as defined, during any fiscal year. The scheduled maturities of term loans, as of December 30, 2001, during the next five fiscal years are:
| Fiscal Year | Amount | |||
| 2002 | 6,375 | |||
| 2003 | 7,875 | |||
| 2004 | 9,375 | |||
| 2005 | 3,000 | |||
| 2006 | 70,687 |
Each of our significant domestic subsidiaries and selected other subsidiaries guarantee all obligations of MSXI under the credit facility. In addition, MSXI has pledged the stock of such domestic subsidiaries and 65% of the stock of significant foreign subsidiaries. Additionally, a first lien exists on substantially all assets of such domestic subsidiaries. Pursuant to the agreement, we also provide a first lien on the assets of our United Kingdom subsidiaries through a debenture. The obligations of MSXI under the credit facility rank senior to all other indebtedness, including the senior subordinated notes.
The credit facility contains certain reporting covenants, customary affirmative covenants and various negative covenants including, but not limited to, certain limitations on mergers, sales of assets, acquisitions, liens, investments, capital expenditures, indebtedness, contingent obligations, dividends, subsidiaries’ ability to agree to dividend restrictions, affiliate transactions and changes of business. The credit facility also contains certain covenants with respect to employee benefit arrangements and environmental matters and certain financial covenants. As of December 30, 2001, $9.9 million was outstanding under the revolving credit portion of our credit facility and has been classified as long-term debt as we have both the ability and intent to refinance such amounts under the credit facility.
32
Table of Contents
MSX INTERNATIONAL, INC.
NOTES TO CONSOLIDATED FINANCIAL STATEMENTS — (continued)
(dollars in thousands unless stated otherwise)
Effective September 30, 2001, our lending group approved the first amendment to our amended and restated credit facility. The result of the amendment was to relax certain financial covenants through the end of the fiscal 2002, and to clarify certain definitions and calculations included in the credit facility. Specifically, the required ratios of total debt to EBITDA, fixed charge coverage, and interest coverage were relaxed from their previous levels. Beginning in the first quarter of fiscal 2003, these ratio requirements will return to their original levels.
Satiz Credit Facility
As of December 31, 2000 and December 30, 2001, Satiz S.r.l., which was acquired on December 31, 1999, maintained a financing arrangement with Fidis S.p.A. that provides for borrowings up to 100% of its eligible accounts receivable, as defined in the agreement. Borrowings under the arrangement bear interest at the Euribor rate plus 1.25% and are collateralized by the underlying accounts receivable. The original term of the agreement expired on December 12, 2001 and was renewed for an additional 12-month period. The agreement will automatically be renewed for additional 12-month periods unless terminated by either party. Fidis S.p.A. is a subsidiary of Fiat S.p.A., who owns a minority interest in Satiz.
Other Debt
Certain of our foreign subsidiaries maintain lines of credit with local banks to provide backup liquidity or to finance operational cash flows as needed. In general, interest accrues on the lines of credit at floating rates, as determined by the applicable bank, with amounts outstanding payable on demand. Agreements are subject to termination at any time with proper notice provided by the bank.
Fair Value of Debt
The estimated fair values and carrying amounts of debt outstanding are as follows:
| At December 31, 2000 | At December 30, 2001 | ||||||||||||||||
| Fair Value | Book Value | Fair Value | Book Value | ||||||||||||||
| Senior Subordinated Notes | $ | 114,400 | $ | 130,000 | $ | 102,213 | $ | 130,000 | |||||||||
| Credit Facilities | 136,846 | 136,846 | 116,654 | 116,654 | |||||||||||||
| Total | $ | 251,246 | $ | 266,846 | $ | 218,867 | $ | 246,654 | |||||||||
The fair value of senior subordinated notes was determined based on quoted market prices. The fair values of amounts outstanding under the credit facilities approximate their carrying amounts as the variable rates inherent in the related financial instruments reflect changes in the overall market interest rates.
| 8. | Book Overdrafts: |
Book overdrafts represent checks drawn on zero balance accounts that have not yet been presented to our banks for funding. Such overdrafts are funded when the related checks are presented and are not subject to finance charges. There were aggregate book overdrafts of $20.0 million and $17.6 million at December 31, 2000 and December 30, 2001, respectively. Such balances are included in accounts payable and drafts in the consolidated balance sheets.
33
Table of Contents
MSX INTERNATIONAL, INC.
NOTES TO CONSOLIDATED FINANCIAL STATEMENTS — (continued)
(dollars in thousands unless stated otherwise)
| 9. | Commitments and Contingencies: |
MSXI is from time to time subject to various legal actions and claims incidental to our business. Litigation is subject to many uncertainties and the outcome of individual litigated matters is not predictable with assurance. It is the opinion of management that the outcome of such matters will not have a material adverse impact on the consolidated financial position, results of operations or cash flows of MSXI.
MSXI and its subsidiaries have leases for real estate and equipment utilized in its business. In most cases, management expects that in the normal course of business these leases will be renewed or replaced by other leases. Future minimum rental payments required under leases that have an initial or remaining non-cancelable lease term in excess of one year are as follows:
| Total | |||||
| Fiscal year ended: | |||||
| 2002 | $ | 26,448 | |||
| 2003 | 19,750 | ||||
| 2004 | 13,989 | ||||
| 2005 | 9,741 | ||||
| 2006 | 7,426 | ||||
| Thereafter | 22,469 | ||||
| $ | 99,823 | ||||
Rental expense was about $18.3 million, $22.6 million and $24.1 million, net of rental reimbursements, in each of fiscal 1999, 2000, and 2001, respectively.
| 10. | Redeemable Series A Preferred Stock: |
As of December 31, 2000 and December 30, 2001 there are 360,000 shares of 12% Series A Cumulative Redeemable Preferred Stock (the “Preferred Stock”) outstanding with a stated value and redemption value of $100 per share or $36 million in total. We are authorized to issue up to 1,500,000 shares of Preferred Stock, divided into two classes: 500,000 shares of Redeemable Series A Preferred Stock, par value $0.01, and 1,000,000 shares of New Preferred Stock, par value $0.01.
Dividends on the Preferred Stock are payable in cash at the rate per annum equal to 12% of the stated value plus an amount equal to any accumulated and unpaid dividends. As of December 30, 2001, we have not declared any dividends. Accordingly, no dividends have been paid or accrued. Dividends accumulated, but not declared, aggregate approximately $28.6 million as of December 30, 2001. We may not declare or pay any dividends or other distribution with respect to any common stock or other class or series of stock ranking junior to the Preferred Stock without first complying with restrictions specified in the Amended and Restated Stockholders’ Agreement. The Preferred Stock, which has no voting rights, is mandatorily redeemable at the earlier of December 31, 2008 or the date on which a sale transaction, as defined, occurs. We may redeem any or all of the Preferred Stock at our election prior to December 31, 2008. We may also elect to acquire shares of the Preferred Stock from time to time without redeeming or otherwise acquiring all or any other issued shares of the Preferred Stock pursuant to the terms of the Amended and Restated Stockholders’ Agreement. As of December 30, 2001, we have not redeemed or acquired any Preferred Stock.
| 11. | Stockholders’ Deficit: |
Effective December 28, 2000, the Board of Directors approved an increase in the number of authorized shares of Common Stock from 2,000,000 shares to 400,000,000 shares (consisting of 200,000,000 shares of each of Class A and Class B Common Stock, respectively). Effective on the same day, the Board of Directors approved a 200-for-one stock split on all issued and outstanding Common Stock in the form of a stock dividend. Accordingly, all share amounts have been restated to reflect the stock split.
34
Table of Contents
MSX INTERNATIONAL, INC.
NOTES TO CONSOLIDATED FINANCIAL STATEMENTS — (continued)
(dollars in thousands unless stated otherwise)
During the first quarter of fiscal 2001, a subsidiary of MSX International, Inc. completed a sale of unregistered securities to certain directors and members of management. The securities were sold in units with each unit comprised of MSX International Inc.’s Series A Preferred Stock, par value $0.01 per share, and Class A Common Stock, par value $0.01 per share. In total, 9,936 shares of Series A Preferred Stock and 482,400 shares of Class A Common Stock were sold. The shares of Series A Preferred Stock and Class A Common Stock, which comprised the units sold, were acquired from Citicorp, our majority stockholder, at a price equal to the price at which the units were sold to management. The entire proceeds of $3.6 million were used to pay the purchase price of the shares acquired from Citicorp.
Included in additional paid-in-capital at December 31, 2000 and December 30, 2001 is $(28.7) million related to the acquisition of selected assets and operations from MascoTech Automotive Systems Group, Inc. and MascoTech, Inc. on January 3, 1997. As this acquisition did not involve a change in control, it was recorded at carry-over basis with amounts paid to MascoTech, Inc. in excess of book value reducing additional paid-in-capital.
As of December 31, 2000 and December 30, 2001, MSXI held a $3.0 million note receivable from an officer of the company. The loan bears interest at 6.77% per year and matures on February 28, 2015. Interest accrues annually with the principal amount due upon maturity or the occurrence of certain events. The loan is collateralized by a pledge to MSXI of shares of our Class A Common Stock. Interest income related to this note was about $0.2 million during both fiscal 2000 and 2001.
| 12. | Employee Benefit Plans: |
We maintain a qualified cash or deferred compensation plan under Section 401(k) of the Internal Revenue Code. Participation in this plan is available to substantially all salaried employees and to certain groups of hourly employees. Under the plan, employees may elect to defer up to 20 percent of their annual wages, subject to the limitations of the Internal Revenue Code. For the periods presented, MSXI contributed matching contributions, at varying rates, for all participating employees. Effective December 1, 2001, substantially all matching contributions were suspended until a future date to be determined by MSXI. The annual cost to administer the plan and fund matching contributions was $0.7 million in fiscal 1999, $2.1 million in fiscal 2000 and $1.7 million in fiscal 2001.
Contributions to union-sponsored, multi-employer pension plans were about $0.6 million in each of fiscal 1999, 2000, and 2001. These plans are not administered by MSXI and contributions are determined in accordance with provisions of negotiated labor contracts. Effective in August 2001, we withdrew our participation in these multi-employer pension plans. The pension liability assigned to MSXI upon withdrawal of $0.8 million is being funded on a quarterly basis over a period of 5 years.
We also have an unfunded deferred compensation plan for certain salaried employees. Individual participants make pre-tax contributions to the plan and MSXI matches up to 5 percent of the individual’s annual salary. MSXI contributions vest over a period of time. Individuals may elect to receive a lump sum or defined payments of vested balances upon retirement or termination. The deferred compensation plan liability was $3.9 million at both December 31, 2000 and December 30, 2001. This deferred compensation plan liability is an unfunded and unsecured obligation of MSXI. However, MSXI has, through deposits to a grantor trust, restricted certain corporate assets having a fair value of $1.1 million and $0.9 million at December 31, 2000 and December 30, 2001, respectively, that are intended to be used to settle a portion of the obligation.
Included in deferred compensation liabilities at December 31, 2000 and December 30, 2001 is $6.5 million and $8.0 million, respectively, of deferred employee termination indemnities. The accrued indemnities are obligations of Satiz, which was acquired effective December 31, 1999. Under Italian labor laws and regulations all employees are entitled to an indemnity upon termination of their employment relationship. The benefit accrues to the employees on a pro-rata basis during their employment period and is based upon individual salaries. The vested benefit payable accrues interest, and employees can receive advances thereof, in certain specified situations, all defined in the applicable labor contract regulations. The liability at December 31, 2000 and December 30, 2001 reflects the total amount of the indemnities, net of any advances taken, that applicable employees would be entitled to receive if termination were to occur as of that date.
35
Table of Contents
MSX INTERNATIONAL, INC.
NOTES TO CONSOLIDATED FINANCIAL STATEMENTS — (continued)
(dollars in thousands unless stated otherwise)
With the acquisition of APX International during 1997, we acquired certain obligations with respect to a frozen defined benefit pension plan. The plan was frozen in 1988 and covers certain union and non-union employees who were formerly employed by Autodynamics Corporation of America, Inc., a company acquired previously by one of the companies that comprised APX International. This plan is not administered by MSXI. Contributions are determined in accordance with provisions of the plan. This plan is not material to our financial position, results of operations or cash flows.
13. Income Taxes:
| Fiscal Year | Fiscal Year | Fiscal Year | |||||||||||||
| Ended | Ended | Ended | |||||||||||||
| January 2, | December 31, | December 30, | |||||||||||||
| 2000 | 2000 | 2001 | |||||||||||||
| Income before income taxes, minority interests and equity in net losses of affiliates for U.S and foreign operations was: | |||||||||||||||
| Domestic | $ | 16,539 | $ | 11,487 | $ | 1,562 | |||||||||
| Foreign | 650 | 15,510 | 2,596 | ||||||||||||
| $ | 17,189 | $ | 26,997 | $ | 4,158 | ||||||||||
| The provision for income taxes was: | |||||||||||||||
| Currently payable: | |||||||||||||||
| Federal | $ | 2,513 | $ | 2,105 | $ | 155 | |||||||||
| Foreign | 3,026 | 5,309 | 1,006 | ||||||||||||
| State | 280 | 1,384 | 33 | ||||||||||||
| Deferred: | |||||||||||||||
| Federal | 3,628 | 1,796 | 1,297 | ||||||||||||
| Foreign | (2,452 | ) | 746 | (779 | ) | ||||||||||
| $ | 6,995 | $ | 11,340 | $ | 1,712 | ||||||||||
| Deferred tax assets (liabilities) included: | |||||||||||||||
| Amortizable goodwill | $ | 4,003 | $ | 50 | $ | (1,867 | ) | ||||||||
| Accrued interest expense | 1,537 | — | — | ||||||||||||
| Accrued liabilities and deferred compensation | 1,114 | 2,975 | 2,936 | ||||||||||||
| Net operating losses | 2,391 | 3,244 | 6,044 | ||||||||||||
| Depreciation | 3,168 | 3,282 | (299 | ) | |||||||||||
| Accounts receivable | (606 | ) | (587 | ) | (716 | ) | |||||||||
| Valuation allowance | (920 | ) | — | — | |||||||||||
| Unrealized foreign gain/(loss) | (569 | ) | (1,749 | ) | 235 | ||||||||||
| Other, net | 801 | (196 | ) | 114 | |||||||||||
| Net deferred tax asset | $ | 10,919 | $ | 7,019 | $ | 6,447 | |||||||||
As of January 2, 2000 a valuation allowance had been provided for specific items where management had determined that the likelihood of realization was not sufficient to allow for recognition of the asset. Realization of deferred tax assets is dependent on various limitations as provided within current tax laws, including generation of sufficient taxable income. Although realization is not assured, management believes that it is more likely than not that deferred tax assets will be realized as of December 31, 2000 and December 30, 2001. Net operating losses can be used to offset income of certain foreign subsidiaries and can be carried forward indefinitely. Additionally, we intend to utilize our tax planning strategies to ensure utilization of net operating losses that are available.
36
Table of Contents
MSX INTERNATIONAL, INC.
NOTES TO CONSOLIDATED FINANCIAL STATEMENTS — (continued)
(dollars in thousands unless stated otherwise)
The following is a reconciliation of taxes at the U.S. federal statutory rate to the provision for income taxes:
| Fiscal Year | Fiscal Year | Fiscal Year | ||||||||||
| Ended | Ended | Ended | ||||||||||
| January 2, | December 31, | December 30, | ||||||||||
| 2000 | 2000 | 2001 | ||||||||||
| U.S statutory rate | 35 | % | 35 | % | 35 | % | ||||||
| Tax at U.S. statutory rate | $ | 6,016 | $ | 9,449 | $ | 1,455 | ||||||
| Valuation allowance | 184 | (920 | ) | — | ||||||||
| Effect of foreign tax rates | 161 | 1,548 | (682 | ) | ||||||||
| State and local taxes | 182 | 899 | 22 | |||||||||
| Non-deductible goodwill | 203 | 437 | 530 | |||||||||
| Other, net | 249 | (73 | ) | 387 | ||||||||
| $ | 6,995 | $ | 11,340 | $ | 1,712 | |||||||
For the three fiscal years ended December 30, 2001, a provision has not been made for United States or additional foreign taxes on approximately $0.6 million, $15.5 million and $2.6 million, respectively, of undistributed earnings of foreign subsidiaries, as those earnings were intended to be permanently reinvested. Generally, such earnings become taxable upon the remittance of dividends and under certain other circumstances. It was not practicable to estimate the amount of deferred tax liability on such undistributed earnings.
| 14. | Segment Information: |
MSXI is a leading, global provider of collaborative enterprise services to the automotive and other industries. We group our services by type of service as follows: collaborative engineering management, human capital management, and other collaborative services. Due to the similar characteristics of our service lines, including the nature of our service offerings, processes supporting the delivery of our services, our customers, and our marketing and sales processes, our operations have been aggregated following the provisions of SFAS No. 131 for segment reporting purposes.
The following is a summary of our net sales by type of service:
| Fiscal Year Ended | |||||||||||||
| January 2, 2000 | December 31, 2000 | December 30, 2001 | |||||||||||
| Collaborative Engineering Management | $ | 279,028 | $ | 298,206 | $ | 270,424 | |||||||
| Human Capital Management Services | 322,342 | 469,773 | 401,212 | ||||||||||
| Other Collaborative Services | 158,472 | 267,244 | 257,621 | ||||||||||
| Total net sales | $ | 759,842 | $ | 1,035,223 | $ | 929,257 | |||||||
37
Table of Contents
MSX INTERNATIONAL, INC.
NOTES TO CONSOLIDATED FINANCIAL STATEMENTS — (continued)
(dollars in thousands unless stated otherwise)
We evaluate performance based on earnings before interest and taxes (EBIT), including the Michigan Single Business Tax and other similar taxes. A reconciliation of consolidated EBIT to consolidated income before income taxes, minority interests and equity in net losses of affiliates is as follows:
| Fiscal Year Ended | Fiscal Year Ended | Fiscal Year Ended | ||||||||||
| January 2, | December 31, | December 30, | ||||||||||
| 2000 | 2000 | 2001 | ||||||||||
| Total EBIT before minority interests and equity in net losses of affiliates | $ | 43,964 | $ | 62,785 | $ | 36,734 | ||||||
| Interest expense | (21,141 | ) | (30,119 | ) | (27,881 | ) | ||||||
| Michigan Single Business Tax and other similar taxes | (5,634 | ) | (5,669 | ) | (4,695 | ) | ||||||
| Consolidated income before taxes, minority interests and equity in net losses of affiliates | $ | 17,189 | $ | 26,997 | $ | 4,158 | ||||||
Sales and long-lived asset information by geographic area are as follows:
| Sales | Long-Lived Assets | ||||||||||||||||||||||||
| Fiscal Year | Fiscal Year | Fiscal Year | |||||||||||||||||||||||
| Ended | Ended | Ended | As of | As of | As of | ||||||||||||||||||||
| January 2, | December 31, | December 30, | January 2, | December 31, | December 30, | ||||||||||||||||||||
| 2000 | 2000 | 2001 | 2000 | 2000 | 2001 | ||||||||||||||||||||
| United States | $ | 552,142 | $ | 697,879 | $ | 606,721 | $ | 144,131 | $ | 181,588 | $ | 186,127 | |||||||||||||
| Europe | 191,232 | 311,349 | 291,162 | 41,977 | 48,717 | 48,482 | |||||||||||||||||||
| All other | 16,468 | 25,995 | 31,374 | 671 | 1,519 | 1,467 | |||||||||||||||||||
| Total | $ | 759,842 | $ | 1,035,223 | $ | 929,257 | $ | 186,779 | $ | 231,824 | $ | 236,076 | |||||||||||||
38
Table of Contents
MSX INTERNATIONAL, INC.
NOTES TO CONSOLIDATED FINANCIAL STATEMENTS — (continued)
(dollars in thousands unless stated otherwise)
| 15. | Stock Option Plan: |
During the fourth quarter of fiscal 2000, we approved the MSXI 2000 Stock Option Plan (the “Stock Option Plan”). Under the terms of the Stock Option Plan, officers, directors and certain employees may be granted both incentive and non-qualified options to purchase our common stock. Incentive stock options may not be issued at less than 100% of the estimated market price on the date the option is granted. Options generally vest over a five-year period and have a maximum term of ten years. We may grant up to one million shares of stock under the Stock Option Plan. Also during fiscal 2000, we approved a one-time grant of 400,000 non-qualified stock options to an officer of MSXI. The 400,000 non-qualified stock options were not issued under the MSXI 2000 Stock Option Plan.
The following summarizes stock option activity during the two most recent fiscal years:
| Number of | |||||||||
| Stock | Weighted average | ||||||||
| Options | exercise price | ||||||||
| Outstanding at January 2, 2000 | — | $ | — | ||||||
| Granted | 805,000 | 5.70 | |||||||
| Forfeited | — | ||||||||
| Outstanding at December 31, 2000 | 805,000 | 5.70 | |||||||
| Granted | 190,000 | 7.50 | |||||||
| Forfeited | 150,000 | 5.83 | |||||||
| Outstanding at December 30, 2001 | 845,000 | $ | 6.08 | ||||||
Stock options outstanding and exercisable at December 30, 2001 are as follows:
| Weighted | |||||||||||||
| Weighted | Average | ||||||||||||
| Average | remaining | ||||||||||||
| Number of Stock | exercise price | contractual | |||||||||||
| Exercise Price | Options | per share | life in years | ||||||||||
| Outstanding: | |||||||||||||
| $4.50 - 7.50 per share | 845,000 | $ | 6.08 | 9.0 | |||||||||
| Exercisable: | |||||||||||||
| $4.50 - 7.50 per share | 133,000 | $ | 5.70 | N/A | |||||||||
Options outstanding at December 31, 2000 had exercise prices between $5.00 and $7.50, with a weighted average exercise price of $6.88 and a weighted average remaining contractual life of 9.7 years.
MSXI accounts for all stock options in accordance with Accounting Principles Board Opinion No. 25 (“APB 25”), “Accounting for Stock Issued to Employees”. Under APB 25, MSXI recognizes no compensation expense related to the Stock Option Plan, as no options have been granted at a price below the estimated market price on the day of grant. Had compensation cost for stock options issued during fiscal 2000 and 2001 been determined consistent with SFAS No. 123, “Accounting for Stock-Based Compensation”, our net income would have been $14,867 and $451 during the fiscal 2000 and 2001, respectively. The weighted average fair value of options granted during fiscal 2000 and 2001 was $0.65 and zero, respectively. The fair value of each option grant is estimated on the date of grant using the Black-Scholes option pricing model with the following weighted average assumptions:
| 2000 | 2001 | |||||||
| Risk free interest rate | 5.54 | % | 5.00 | % | ||||
| Expected option lives | 7 years | 7 years | ||||||
| Expected volatility | 0.0 | % | 0.0 | % | ||||
39
Table of Contents
MSX INTERNATIONAL, INC.
NOTES TO CONSOLIDATED FINANCIAL STATEMENTS — (continued)
(dollars in thousands unless stated otherwise)
| 16. | Guarantor and Non-Guarantor Subsidiaries: |
In connection with our $130 million of senior subordinated notes outstanding, each of our significant domestic restricted subsidiaries, as defined in the related bond indenture (the “Guarantor Subsidiaries”), irrevocably and unconditionally guarantee MSXI’s performance as primary obligor. The following condensed consolidating financial data provides information regarding the financial position, results of operations and cash flows of the Guarantor Subsidiaries as set forth below. Separate financial statements of the Guarantor Subsidiaries are not presented because management has determined those would not be material to the holders of the senior subordinated notes.
The Guarantor Subsidiaries account for their investments in the non-guarantor subsidiaries, if any, on the equity method. The principal elimination entries are to eliminate the investments in subsidiaries and intercompany balances and transactions. Certain prior year amounts have been reclassified to conform to the current year presentation.
40
Table of Contents
| 16. | Guarantor and Non-Guarantor Subsidiaries: — (continued) |
MSX INTERNATIONAL, INC.
CONDENSED CONSOLIDATING BALANCE SHEET
as of December 31, 2000
| MSXI | Guarantor | Non-Guarantor | MSXI | |||||||||||||||||||
| (Issuer) | Subsidiaries | Subsidiaries | Eliminations | Consolidated | ||||||||||||||||||
| (in thousands) | ||||||||||||||||||||||
ASSETS | ||||||||||||||||||||||
| Current assets: | ||||||||||||||||||||||
| Cash and cash equivalents | $ | — | $ | 569 | $ | 4,117 | $ | — | $ | 4,686 | ||||||||||||
| Accounts receivable, net | 171 | 194,128 | 123,159 | — | 317,458 | |||||||||||||||||
| Inventory | — | 6,142 | 1,322 | — | 7,464 | |||||||||||||||||
| Prepaid expenses and other assets | 262 | 4,837 | 3,479 | — | 8,578 | |||||||||||||||||
| Deferred income taxes, net | — | 2,770 | 439 | — | 3,209 | |||||||||||||||||
| Total current assets | 433 | 208,446 | 132,516 | — | 341,395 | |||||||||||||||||
| Property and equipment, net | — | 19,770 | 21,189 | — | 40,959 | |||||||||||||||||
| Goodwill and other intangibles, net | — | 132,914 | 39,177 | — | 172,091 | |||||||||||||||||
| Investment in subsidiaries | 145,970 | 79,309 | 5,523 | (223,333 | ) | 7,469 | ||||||||||||||||
| Other assets | 6,569 | 4,252 | 484 | — | 11,305 | |||||||||||||||||
| Deferred income taxes, net | — | 1,635 | 2,175 | — | 3,810 | |||||||||||||||||
| Total assets | $ | 152,972 | $ | 446,326 | $ | 201,064 | $ | (223,333 | ) | $ | 577,029 | |||||||||||
LIABILITIES AND SHAREHOLDERS’ EQUITY (DEFICIT) | ||||||||||||||||||||||
| Current liabilities: | ||||||||||||||||||||||
| Notes payable and current portion of long-term debt | $ | 5,250 | $ | — | $ | 7,920 | $ | — | $ | 13,170 | ||||||||||||
| Accounts payable and drafts | — | 126,198 | 50,371 | — | 176,569 | |||||||||||||||||
| Accrued liabilities | 6,431 | 65,340 | 29,807 | — | 101,578 | |||||||||||||||||
| Total current liabilities | 11,681 | 191,538 | 88,098 | — | 291,317 | |||||||||||||||||
| Long-term debt | 230,554 | 10,196 | 12,926 | — | 253,676 | |||||||||||||||||
| Intercompany accounts | (109,801 | ) | 94,682 | 15,119 | — | — | ||||||||||||||||
| Long-term deferred compensation liabilities and other | — | 3,940 | 6,466 | — | 10,406 | |||||||||||||||||
| Total liabilities | 132,434 | 300,356 | 122,609 | — | 555,399 | |||||||||||||||||
| Minority interests | — | — | 1,092 | — | 1,092 | |||||||||||||||||
| Redeemable Series A Preferred Stock | 36,000 | — | — | — | 36,000 | |||||||||||||||||
| Shareholders’ equity (deficit) | (15,462 | ) | 145,970 | 77,363 | (223,333 | ) | (15,462 | ) | ||||||||||||||
| Total liabilities and shareholders’ equity (deficit) | $ | 152,972 | $ | 446,326 | $ | 201,064 | $ | (223,333 | ) | $ | 577,029 | |||||||||||
41
Table of Contents
| 16. | Guarantor and Non-Guarantor Subsidiaries: — (continued) |
MSX INTERNATIONAL, INC.
CONDENSED CONSOLIDATING BALANCE SHEET
as of December 30, 2001
| MSXI | Guarantor | Non-Guarantor | MSXI | |||||||||||||||||||
| (Issuer) | Subsidiaries | Subsidiaries | Eliminations | Consolidated | ||||||||||||||||||
| (in thousands) | ||||||||||||||||||||||
ASSETS | ||||||||||||||||||||||
| Current assets: | ||||||||||||||||||||||
| Cash and cash equivalents | $ | — | $ | 638 | $ | 4,286 | $ | — | $ | 4,924 | ||||||||||||
| Accounts receivable, net | 171 | 137,694 | 114,143 | — | 252,008 | |||||||||||||||||
| Inventory | — | 5,885 | 1,031 | — | 6,916 | |||||||||||||||||
| Prepaid expenses and other assets | 134 | 5,118 | 2,759 | — | 8,011 | |||||||||||||||||
| Deferred income taxes, net | — | 2,836 | 641 | — | 3,477 | |||||||||||||||||
| Total current assets | 305 | 152,171 | 122,860 | — | 275,336 | |||||||||||||||||
| Property and equipment, net | — | 23,447 | 19,530 | — | 42,977 | |||||||||||||||||
| Goodwill and other intangibles, net | — | 131,909 | 38,582 | — | 170,491 | |||||||||||||||||
| Investment in subsidiaries | 155,563 | 83,439 | 6,342 | (232,783 | ) | 12,561 | ||||||||||||||||
| Other assets | 6,006 | 3,824 | 217 | — | 10,047 | |||||||||||||||||
| Deferred income taxes, net | 1,373 | (748 | ) | 2,345 | — | 2,970 | ||||||||||||||||
| Total assets | $ | 163,247 | $ | 394,042 | $ | 189,876 | $ | (232,783 | ) | $ | 514,382 | |||||||||||
LIABILITIES AND SHAREHOLDERS’ EQUITY (DEFICIT) | ||||||||||||||||||||||
| Current liabilities: | ||||||||||||||||||||||
| Notes payable and current portion of long-term debt | $ | 6,375 | $ | — | $ | 9,410 | $ | — | $ | 15,785 | ||||||||||||
| Accounts payable and drafts | — | 102,910 | 50,735 | — | 153,645 | |||||||||||||||||
| Accrued liabilities | 7,604 | 50,844 | 20,948 | — | 79,396 | |||||||||||||||||
| Total current liabilities | 13,979 | 153,754 | 81,093 | — | 248,826 | |||||||||||||||||
| Long-term debt | 225,187 | — | 5,682 | — | 230,869 | |||||||||||||||||
| Intercompany accounts | (96,432 | ) | 79,771 | 16,661 | — | — | ||||||||||||||||
| Long-term deferred compensation liabilities and other | — | 4,959 | 8,018 | — | 12,977 | |||||||||||||||||
| Total liabilities | 142,734 | 238,484 | 111,454 | — | 492,672 | |||||||||||||||||
| Minority interests | — | — | 1,197 | — | 1,197 | |||||||||||||||||
| Redeemable Series A Preferred Stock | 36,000 | — | — | — | 36,000 | |||||||||||||||||
| Shareholders’ equity (deficit) | (15,487 | ) | 155,558 | 77,225 | (232,783 | ) | (15,487 | ) | ||||||||||||||
| Total liabilities and shareholders’ equity (deficit) | $ | 163,247 | $ | 394,042 | $ | 189,876 | $ | (232,783 | ) | $ | 514,382 | |||||||||||
42
Table of Contents
| 16. | Guarantor and Non-Guarantor Subsidiaries: — (continued) |
MSX INTERNATIONAL, INC.
CONDENSED CONSOLIDATING STATEMENTS OF INCOME
for the three fiscal years ended December 30, 2001
| MSXI | Guarantor | Non-Guarantor | MSXI | ||||||||||||||||||
| (Issuer) | Subsidiaries | Subsidiaries | Eliminations | Consolidated | |||||||||||||||||
| (in thousands) | |||||||||||||||||||||
Fiscal Year Ended January 2, 2000 | |||||||||||||||||||||
| Net sales | $ | — | $ | 540,886 | $ | 231,102 | $ | (12,146 | ) | $ | 759,842 | ||||||||||
| Cost of sales | — | 460,286 | 205,134 | (12,146 | ) | 653,274 | |||||||||||||||
| Gross profit | — | 80,600 | 25,968 | — | 106,568 | ||||||||||||||||
| Selling, general and administrative expenses | — | 43,028 | 22,054 | — | 65,082 | ||||||||||||||||
| Amortization of goodwill and other intangibles | — | 2,767 | 389 | — | 3,156 | ||||||||||||||||
| Operating income | — | 34,805 | 3,525 | — | 38,330 | ||||||||||||||||
| Interest income (expense), net | (19,934 | ) | 1,412 | (2,619 | ) | — | (21,141 | ) | |||||||||||||
| Income (loss) before income taxes, minority interests and equity in net losses of affiliates | (19,934 | ) | 36,217 | 906 | — | 17,189 | |||||||||||||||
| Income tax provision (benefit) | (7,126 | ) | 13,383 | 738 | — | 6,995 | |||||||||||||||
| Minority interests and equity in net losses of affiliates, net of taxes | 23,002 | 168 | — | (23,170 | ) | — | |||||||||||||||
| Net income | $ | 10,194 | $ | 23,002 | $ | 168 | $ | (23,170 | ) | $ | 10,194 | ||||||||||
Fiscal Year Ended December 31, 2000 | |||||||||||||||||||||
| Net sales | $ | — | $ | 651,036 | $ | 400,213 | $ | (16,026 | ) | $ | 1,035,223 | ||||||||||
| Cost of sales | — | 549,981 | 355,331 | (16,026 | ) | 889,286 | |||||||||||||||
| Gross profit | — | 101,055 | 44,882 | — | 145,937 | ||||||||||||||||
| Selling, general and administrative expenses | — | 59,475 | 23,763 | — | 83,238 | ||||||||||||||||
| Amortization of goodwill and other intangibles | — | 4,238 | 1,345 | — | 5,583 | ||||||||||||||||
| Operating income | — | 37,342 | 19,774 | — | 57,116 | ||||||||||||||||
| Interest expense, net | (1,117 | ) | (23,470 | ) | (5,532 | ) | — | (30,119 | ) | ||||||||||||
| Income (loss) before income taxes, minority interests and equity in net losses of affiliates | (1,117 | ) | 13,872 | 14,242 | — | 26,997 | |||||||||||||||
| Income tax provision (benefit) | (357 | ) | 5,848 | 5,849 | — | 11,340 | |||||||||||||||
| Minority interests and equity in net losses of affiliates, net of taxes | 15,651 | 7,627 | (766 | ) | (23,278 | ) | (766 | ) | |||||||||||||
| Net income | $ | 14,891 | $ | 15,651 | $ | 7,627 | $ | (23,278 | ) | $ | 14,891 | ||||||||||
Fiscal Year Ended December 30, 2001 | |||||||||||||||||||||
| Net sales | $ | — | $ | 560,391 | $ | 384,795 | $ | (15,929 | ) | $ | 929,257 | ||||||||||
| Cost of sales | — | 469,777 | 358,373 | (15,929 | ) | 812,221 | |||||||||||||||
| Gross profit | — | 90,614 | 26,422 | — | 117,036 | ||||||||||||||||
| Selling, general and administrative expenses | — | 57,791 | 20,984 | — | 78,775 | ||||||||||||||||
| Amortization of goodwill and other intangibles | — | 4,794 | 1,428 | — | 6,222 | ||||||||||||||||
| Operating income | — | 28,029 | 4,010 | — | 32,039 | ||||||||||||||||
| Interest income (expense), net | 14,113 | 11,649 | 2,119 | — | 27,881 | ||||||||||||||||
| Income (loss) before income taxes, minority interests and equity in net losses of affiliates | (14,113 | ) | 16,380 | 1,891 | — | 4,158 | |||||||||||||||
| Income tax provision (benefit) | (5,056 | ) | 6,625 | 143 | — | 1,712 | |||||||||||||||
| Minority interests and equity in net losses of affiliates, net of taxes | 9,560 | (195 | ) | (1,144 | ) | (10,164 | ) | (1,943 | ) | ||||||||||||
| Net income | $ | 503 | $ | 9,560 | $ | 604 | $ | (10,164 | ) | $ | 503 | ||||||||||
43
Table of Contents
| 16. | Guarantor and Non-Guarantor Subsidiaries: — (continued) |
MSX INTERNATIONAL, INC.
CONDENSED CONSOLIDATING STATEMENT OF CASH FLOWS
for the fiscal year ended January 2, 2000
| MSXI | Guarantor | Non-Guarantor | MSXI | |||||||||||||||||||
| (Issuer) | Subsidiaries | Subsidiaries | Eliminations | Consolidated | ||||||||||||||||||
| (in thousands) | ||||||||||||||||||||||
| Cash flows from operating activities: | ||||||||||||||||||||||
| Net income | $ | 10,194 | $ | 23,002 | $ | 168 | $ | (23,170 | ) | $ | 10,194 | |||||||||||
| Adjustments to reconcile net income to net cash provided by (used for) operating activities: | ||||||||||||||||||||||
| Equity in earnings of affiliates | (23,002 | ) | (168 | ) | — | 23,170 | — | |||||||||||||||
| Depreciation | — | 9,154 | 4,529 | — | 13,683 | |||||||||||||||||
| Amortization | 695 | 2,767 | 390 | — | 3,852 | |||||||||||||||||
| Deferred taxes | 911 | 1,955 | (1,690 | ) | — | 1,176 | ||||||||||||||||
| (Gain) loss on sale/disposal of property and equipment | — | 530 | 741 | — | 1,271 | |||||||||||||||||
| (Increase) decrease in receivables, net | — | (32,605 | ) | 208 | — | (32,397 | ) | |||||||||||||||
| (Increase) decrease in inventory | — | 78 | 25 | — | 103 | |||||||||||||||||
| (Increase) decrease in prepaid expenses and other assets | 141 | (626 | ) | (1,844 | ) | — | (2,329 | ) | ||||||||||||||
| Increase (decrease) in current liabilities | (5,411 | ) | 33,282 | 7,729 | — | 35,600 | ||||||||||||||||
| Other, net | — | (1,162 | ) | 267 | (74 | ) | (969 | ) | ||||||||||||||
| Net cash provided by (used for) operating activities | (16,472 | ) | 36,207 | 10,523 | (74 | ) | 30,184 | |||||||||||||||
| Cash flows from investing activities: | ||||||||||||||||||||||
| Capital expenditures | — | (8,511 | ) | (8,181 | ) | — | (16,692 | ) | ||||||||||||||
| Acquisition of businesses, net of cash acquired | — | (34,342 | ) | (20,393 | ) | — | (54,735 | ) | ||||||||||||||
| Proceeds from buildings held for sale and disposal of equipment | — | 15,693 | 571 | — | 16,264 | |||||||||||||||||
| Other, net | — | (2,761 | ) | — | — | (2,761 | ) | |||||||||||||||
| Net cash used for investing activities | — | (29,921 | ) | (28,003 | ) | — | (57,924 | ) | ||||||||||||||
| Cash flows from financing activities: | ||||||||||||||||||||||
| Intercompany | (28,329 | ) | 13,467 | 14,788 | 74 | — | ||||||||||||||||
| Transactions with subsidiaries | 5,739 | (1,201 | ) | 5,574 | (10,112 | ) | — | |||||||||||||||
| Proceeds from issuance of debt | 79,415 | (11 | ) | — | — | 79,404 | ||||||||||||||||
| Debt issuance costs | (3,292 | ) | — | — | — | (3,292 | ) | |||||||||||||||
| Changes in revolving debt, net | (31,403 | ) | (1,520 | ) | 3,969 | — | (28,954 | ) | ||||||||||||||
| Changes in book overdrafts, net | — | 1,462 | 1,419 | — | 2,881 | |||||||||||||||||
| Payment of contractual acquisition obligation | — | (15,000 | ) | — | — | (15,000 | ) | |||||||||||||||
| Other, net | 59 | — | — | — | 59 | |||||||||||||||||
| Net cash provided by (used for) financing activities | 22,189 | (2,803 | ) | 25,750 | (10,038 | ) | 35,098 | |||||||||||||||
| Effect of foreign exchange rate changes on cash and cash equivalents | (5,717 | ) | (4,300 | ) | (4,822 | ) | 10,112 | (4,727 | ) | |||||||||||||
| Cash and cash equivalents: | ||||||||||||||||||||||
| Increase (decrease) for the period | — | (817 | ) | 3,448 | — | 2,631 | ||||||||||||||||
| Balance, beginning of period | — | 1,690 | 2,558 | — | 4,248 | |||||||||||||||||
| Balance, end of period | $ | — | $ | 873 | $ | 6,006 | $ | — | $ | 6,879 | ||||||||||||
44
Table of Contents
| 16. | Guarantor and Non-Guarantor Subsidiaries: — (continued) |
MSX INTERNATIONAL, INC.
CONDENSED CONSOLIDATING STATEMENT OF CASH FLOWS
for the fiscal year ended December 31, 2000
| MSXI | Guarantor | Non-Guarantor | MSXI | |||||||||||||||||||
| (Issuer) | Subsidiaries | Subsidiaries | Eliminations | Consolidated | ||||||||||||||||||
| (in thousands) | ||||||||||||||||||||||
| Cash flows from operating activities: | ||||||||||||||||||||||
| Net income | $ | 14,891 | $ | 15,651 | $ | 7,627 | $ | (23,278 | ) | $ | 14,891 | |||||||||||
| Adjustments to reconcile net income to net cash provided by operating activities: | ||||||||||||||||||||||
| Equity in earnings of affiliates | (15,651 | ) | (7,627 | ) | 766 | 23,278 | 766 | |||||||||||||||
| Depreciation | — | 9,414 | 7,511 | — | 16,925 | |||||||||||||||||
| Amortization | 1,079 | 4,239 | 1,344 | — | 6,662 | |||||||||||||||||
| Deferred taxes | — | 1,117 | 1,425 | — | 2,542 | |||||||||||||||||
| (Gain) loss on sale/disposal of property and equipment | — | (72 | ) | 18 | — | (54 | ) | |||||||||||||||
| (Increase) decrease in receivables, net | (171 | ) | (13,423 | ) | 13,191 | — | (403 | ) | ||||||||||||||
| (Increase) decrease in inventory | — | 328 | 574 | — | 902 | |||||||||||||||||
| (Increase) decrease in prepaid expenses and other assets | 126 | (160 | ) | 142 | — | 108 | ||||||||||||||||
| Increase (decrease) in current liabilities | 11,147 | 18,183 | (12,329 | ) | 33 | 17,034 | ||||||||||||||||
| Other, net | — | 474 | (765 | ) | — | (291 | ) | |||||||||||||||
| Net cash provided by operating activities | 11,421 | 28,124 | 19,504 | 33 | 59,082 | |||||||||||||||||
| Cash flows from investing activities: | ||||||||||||||||||||||
| Capital expenditures | — | (7,632 | ) | (10,536 | ) | — | (18,168 | ) | ||||||||||||||
| Acquisition of businesses, net of cash acquired | (1,161 | ) | (40,654 | ) | (18,291 | ) | — | (60,106 | ) | |||||||||||||
| Proceeds from sale/disposal of property and equipment | — | 2,195 | 113 | — | 2,308 | |||||||||||||||||
| Other, net | — | 583 | — | — | 583 | |||||||||||||||||
| Net cash used for investing activities | (1,161 | ) | (45,508 | ) | (28,714 | ) | — | (75,383 | ) | |||||||||||||
| Cash flows from financing activities: | ||||||||||||||||||||||
| Intercompany | (26,321 | ) | 56,276 | (29,955 | ) | — | — | |||||||||||||||
| Transactions with subsidiaries | 11,532 | (45,711 | ) | 39,740 | (5,561 | ) | — | |||||||||||||||
| Proceeds from issuance of debt | 25,000 | — | — | — | 25,000 | |||||||||||||||||
| Repayment of debt | (3,750 | ) | (64 | ) | — | — | (3,814 | ) | ||||||||||||||
| Debt issuance costs | (251 | ) | — | — | — | (251 | ) | |||||||||||||||
| Changes in revolving debt, net | (6,696 | ) | 10,196 | (5,759 | ) | — | (2,259 | ) | ||||||||||||||
| Changes in book overdrafts, net | — | 6,157 | (3,009 | ) | — | 3,148 | ||||||||||||||||
| Net cash provided by (used for) financing activities | (486 | ) | 26,854 | 1,017 | (5,561 | ) | 21,824 | |||||||||||||||
| Effect of foreign exchange rate changes on cash and cash equivalents | (9,774 | ) | (9,773 | ) | 6,303 | 5,528 | (7,716 | ) | ||||||||||||||
| Cash and cash equivalents: | ||||||||||||||||||||||
| Decrease for the period | — | (303 | ) | (1,890 | ) | — | (2,193 | ) | ||||||||||||||
| Balance, beginning of period | — | 873 | 6,006 | — | 6,879 | |||||||||||||||||
| Balance, end of period | $ | — | $ | 570 | $ | 4,116 | $ | — | $ | 4,686 | ||||||||||||
45
Table of Contents
| 16. | Guarantor and Non-Guarantor Subsidiaries: — (continued) |
MSX INTERNATIONAL, INC.
CONDENSED CONSOLIDATING STATEMENT OF CASH FLOWS
for the fiscal year ended December 30, 2001
| MSXI | Guarantor | Non-Guarantor | MSXI | |||||||||||||||||||
| (Issuer) | Subsidiaries | Subsidiaries | Eliminations | Consolidated | ||||||||||||||||||
| (in thousands) | ||||||||||||||||||||||
| Cash flows from operating activities: | ||||||||||||||||||||||
| Net income | $ | 503 | $ | 9,560 | $ | 604 | $ | (10,164 | ) | $ | 503 | |||||||||||
| Adjustments to reconcile net income to net cash provided by (used for) operating activities: | ||||||||||||||||||||||
| Equity in earnings of affiliates | (9,560 | ) | 195 | 1,144 | 10,164 | 1,943 | ||||||||||||||||
| Depreciation | — | 8,324 | 8,664 | — | 16,988 | |||||||||||||||||
| Amortization | 1,216 | 4,794 | 1,428 | — | 7,438 | |||||||||||||||||
| Deferred taxes | (1,373 | ) | 2,270 | (324 | ) | — | 573 | |||||||||||||||
| (Gain) loss on sale/disposal of property and equipment | — | 148 | 6 | — | 154 | |||||||||||||||||
| (Increase) decrease in receivables, net | — | 57,080 | 8,371 | — | 65,451 | |||||||||||||||||
| (Increase) decrease in inventory | — | 257 | 562 | — | 819 | |||||||||||||||||
| (Increase) decrease in prepaid expenses and other assets | 127 | (273 | ) | 713 | — | 567 | ||||||||||||||||
| Increase (decrease) in current liabilities | 1,173 | (29,686 | ) | (8,704 | ) | — | (37,217 | ) | ||||||||||||||
| Other, net | — | 725 | 493 | — | 1,218 | |||||||||||||||||
| Net cash provided by (used for) operating activities | (7,914 | ) | 53,394 | 12,957 | — | 58,437 | ||||||||||||||||
| Cash flows from investing activities: | ||||||||||||||||||||||
| Capital expenditures | — | (11,906 | ) | (7,337 | ) | — | (19,243 | ) | ||||||||||||||
| Acquisition of businesses, net of cash acquired | — | (11,450 | ) | (5,086 | ) | — | (16,536 | ) | ||||||||||||||
| Proceeds from sale/disposal of property and equipment | — | 189 | 74 | — | 263 | |||||||||||||||||
| Other, net | — | 422 | — | — | 422 | |||||||||||||||||
| Net cash used for investing activities | — | (22,745 | ) | (12,349 | ) | — | (35,094 | ) | ||||||||||||||
| Cash flows from financing activities: | ||||||||||||||||||||||
| Intercompany | 13,369 | (14,628 | ) | 1,259 | — | — | ||||||||||||||||
| Transactions with subsidiaries | (32 | ) | (3,589 | ) | 3,582 | 39 | — | |||||||||||||||
| Repayment of debt | (3,938 | ) | — | — | — | (3,938 | ) | |||||||||||||||
| Debt issuance costs | (653 | ) | — | — | — | (653 | ) | |||||||||||||||
| Changes in revolving debt, net | (304 | ) | (10,196 | ) | (5,754 | ) | — | (16,254 | ) | |||||||||||||
| Changes in book overdrafts | — | (2,200 | ) | (185 | ) | — | (2,385 | ) | ||||||||||||||
| Repurchase of common stock | (566 | ) | (3,612 | ) | — | — | (4,178 | ) | ||||||||||||||
| Sale of common stock, net | — | 3,612 | — | — | 3,612 | |||||||||||||||||
| Net cash provided by (used for) financing activities | 7,876 | (30,613 | ) | (1,098 | ) | 39 | (23,796 | ) | ||||||||||||||
| Effect of foreign exchange rate changes on cash and cash equivalents | 38 | 33 | 659 | (39 | ) | 691 | ||||||||||||||||
| Cash and cash equivalents: | ||||||||||||||||||||||
| Decrease for the period | — | 69 | 169 | — | 238 | |||||||||||||||||
| Balance, beginning of period | — | 569 | 4,117 | — | 4,686 | |||||||||||||||||
| Balance, end of period | $ | — | $ | 638 | $ | 4,286 | $ | — | $ | 4,924 | ||||||||||||
46
Table of Contents
PART III
Item 10. Directors and Executive Officers of the Registrant.
The following table sets forth certain information with respect to our directors and executive officers as of March 4, 2002.
| Name | Age | Position | ||||
| Erwin H. Billig | 75 | Chairman of the Board of Directors | ||||
| Thomas T. Stallkamp | 55 | Vice Chairman and Chief Executive Officer | ||||
| John Risk | 63 | President and Chief Operating Officer, Engineering Operations | ||||
| Frederick K. Minturn | 45 | Executive Vice President and Chief Financial Officer | ||||
| John C. Miller | 50 | Executive Vice President, Corporate Product Development and Chief Administrative Officer | ||||
| David E. Cole | 64 | Director | ||||
| Michael A. Delaney | 47 | Director | ||||
| Richard A. Manoogian | 65 | Director | ||||
| Charles E. Corpening | 36 | Director | ||||
Erwin H. Billigserved as Chief Executive Officer from April 28, 1998 until January 2000 and has been Chairman of the Board of Directors since January 3, 1997. He served as Vice Chairman of MascoTech from 1994 to 1997 and was President and Chief Operating Officer of MascoTech from 1986 to 1994. He is also the Chairman of the Board of Directors of Titan Wheel International, Inc., and a director and Vice Chairman of Delco Remy International, Inc.
Thomas T. Stallkampwas appointed Vice Chairman and Chief Executive Officer of MSX International effective January 2000. He also serves on the Board of Directors for Kmart Corporation, Metaldyne, Inc., bVertical.com and Baxter International. Prior to joining MSX International, Mr. Stallkamp was Vice Chairman for DaimlerChrysler Corporation and also served as President of Chrysler Corporation from 1998. Prior to becoming President, Mr. Stallkamp served in various executive level positions during his 20-year career with Chrysler Corporation.
John Riskhas been President of the Engineering Services Division since May 11, 1998. Mr. Risk retired from Ford Motor Company in 1997 where, during his 33-year career, he made major contributions to the company in a variety of key appointments. Prior to joining MSXI, Mr. Risk was Director of the Small Car Vehicle Lines at Ford. In this capacity, he was responsible for all aspects of the Small Car Program activities in both Europe and the U.S.
Frederick K. Minturnhas been Executive Vice President and Chief Financial Officer since January 3, 1997. Prior to joining MSX International, Mr. Minturn was a Vice President of MascoTech’s Automotive Operations group from 1994 through December 1996 and was a Group Controller of such operations since 1991.
John C. Millerjoined MSX International in July 2001 as Executive Vice President of Corporate Product Development and Chief Administrative Officer. Prior to joining MSX International, Mr. Miller was Executive Director, Product Development Operations at Ford Motor Company and was responsible for continuous improvement of Ford’s worldwide product development operations. Mr. Miller was also Vice President, Product Planning and Vice President-Large Car Platform at Daimler Chrysler where he was responsible for the development of Chrysler’s large and mid-size passenger cars. He joined the former Chrysler Corporation in 1987 when it merged with American Motors Corporation, where he began his career in 1976.
David E. Colehas been a director since January 3, 1997. Dr. Cole is currently the President of the Center for Automotive Research at the Altarium Institute (formerly ERIM). He was formerly the Director of the Office for the Study of Automotive Transportation (OSAT) at the University of Michigan’s Transportation Research Institute since 1978. Dr. Cole is a director of Mechanical Dynamics Inc., Thyssen North America, Inc., Saturn Electronics & Engineering, Inc., R.L. Polk, Inc., and Plastech Inc. Dr. Cole is also a director of the Automotive Hall of Fame and is on the Board of Trustees of Hope College.
Michael A. Delaneyhas been a director since January 3, 1997. Mr. Delaney has been a Managing Director of Citibank Venture Capital since 1997. Mr. Delaney is also a director of JAC Holding Corporation, ChipPAC, Inc., Palomar Technologies, Inc., Great Lakes Dredge & Dock, Inc., SC Processing, Inc., Fabri-Steel Products, Inc., Trianon Industries Corporation, Strategic Industries, Inc., and Delco Remy International, Inc.
47
Table of Contents
Richard A. Manoogianhas been a director since January 3, 1997. Mr. Manoogian served as Chairman, Chief Executive Officer and a director of MascoTech (now Metaldyne, Inc.) from 1984 to 1998, as Chairman from 1998 to November 2000, and continues to serve as a director. Mr. Manoogian is also Chairman of the Board and Chief Executive Officer of Masco Corporation and a director of Bank One Corporation, Detroit Renaissance and The American Business Conference.
Charles E. Corpeningjoined the Board of Directors in February 2002. Mr. Corpening is a Vice President at Citibank Venture Capital where he has worked since 1994. Prior to joining Citibank, Mr. Corpening was with Roundtree Capital Corporation, a private investment firm, the Rockefeller Group, and the investment banking department of Paine Webber, Inc. He received his BA from Princeton University and his MBA from Columbia Business School. Mr. Corpening serves on the board of directors of FastenTech Holdings, Chase Industries, Inc., and Royster-Clark group.
Each of our Directors holds office until a successor is elected and qualified or until such director’s earlier resignation or removal.
Item 11. Executive Compensation.
Summary of Cash and Certain Other Compensation
The following Summary Compensation Table sets forth certain information with respect to all compensation paid or earned for services rendered to MSXI for the last three fiscal years (except for certain bonus amounts, which are compensation for services rendered in the immediately preceding year) of (i) those persons who served as our Chief Executive Officer during fiscal 2001 and (ii) certain executive officers other than the Chief Executive Officer who were serving as executive officers of MSXI at the end of fiscal 2001 (collectively, the “Named Executive Officers”):
Summary Compensation Table
| Annual Compensation | Long-term Compensation | ||||||||||||||||||||||||
| Securities | |||||||||||||||||||||||||
| Other | Underlying | ||||||||||||||||||||||||
| Name and Principal Position | Fiscal Year Ended | Salary ($) | Bonus ($) | Compensation($) | Options (#) | ||||||||||||||||||||
| Erwin H. Billig | 1/2/00 | 246,666 | 120,000 | — | — | ||||||||||||||||||||
| Chairman of the Board of Directors | 12/31/00 | 252,000 | 156,240 | — | 400,000 | ||||||||||||||||||||
| 12/30/01 | 252,000 | 126,000 | — | — | |||||||||||||||||||||
| Thomas T. Stallkamp | 1/2/00 | — | — | — | — | ||||||||||||||||||||
| Vice Chairman and Chief Executive | 12/31/00 | 670,833 | — | — | — | ||||||||||||||||||||
| Officer | 12/30/01 | 700,000 | 203,100 | — | — | ||||||||||||||||||||
| John Risk | 1/2/00 | 276,000 | 121,764 | 13,800 | (1) | — | |||||||||||||||||||
| President and Chief Operating | 12/31/00 | 310,000 | 178,350 | 15,500 | (1) | 100,000 | |||||||||||||||||||
| Officer, Engineering Operations | 12/30/01 | 330,000 | 175,931 | 16,500 | (1) | — | |||||||||||||||||||
| Frederick K. Minturn | 1/2/00 | 237,500 | 148,162 | 89,075 | (2) | — | |||||||||||||||||||
| Executive Vice President and Chief | 12/31/00 | 267,500 | 155,000 | 112,996 | (2) | — | |||||||||||||||||||
| Financial Officer | 12/30/01 | 291,270 | 142,500 | 14,563 | (1) | — | |||||||||||||||||||
| John C. Miller | 1/2/00 | — | — | — | — | ||||||||||||||||||||
| Executive Vice President, Corporate | 12/31/00 | — | — | — | — | ||||||||||||||||||||
| Product Development and Chief | 12/30/01 | 155,000 | — | — | 85,000 | ||||||||||||||||||||
| Administrative Officer | |||||||||||||||||||||||||
| (1) | Company match of amounts of employee salary deferrals pursuant to our Deferred Compensation Plan. | |
| (2) | Company match of amounts of employee salary deferrals pursuant to our Deferred Compensation Plan totaling $11,875 in fiscal 1999 and $13,457 in fiscal 2000 combined with the value on the date of vesting of shares of common stock of MascoTech granted pursuant to MascoTech’s 1991 Stock Incentive Plan, being compensation for services prior to 1997. |
Pursuant to our Deferred Compensation Plan, certain of our management employees have the option of deferring salary and bonus amounts up to a maximum amount of 10% of salary. In addition, deferred discretionary bonuses may be awarded to participants in the Deferred Compensation Plan. Such deferred amounts and company matches are credited to an account on the books of MSXI, which is credited annually with earnings. In 1999, 2000 and 2001, we matched five percent of the amount of salary deferred by participants in the Deferred Compensation Plan. Effective January 1, 2002, the employer match under the deferred compensation plan was terminated until further notice.
48
Table of Contents
At December 31, 2000 and December 30, 2001, MSXI held a $3.0 million note receivable from Mr. Stallkamp. The loan has a 15-year term and bears interest at a rate of 6.77% per year. The loan accrues interest each year, with the principal due at maturity or the occurrence of certain events. The loan is secured by a pledge to MSXI of shares of our Class A Common Stock purchased by Mr. Stallkamp.
Options Granted During Fiscal 2000 and 2001
The following table shows the stock options granted during fiscal 2000 and 2001 to the executive officers named in the Summary Compensation Table. No options were granted under the MSX International, Inc. Stock Option Plan prior to fiscal 2000.
| Number of | Potential Realizable Value | ||||||||||||||||||||||||
| Securities | at Assumed Annual Rates | ||||||||||||||||||||||||
| Underlying Options | % of Total Options | Exercise | of Stock Price Appreciated | ||||||||||||||||||||||
| granted | Granted in Fiscal | Price | Expiration | for Option Term (2) | |||||||||||||||||||||
| Name | (#) (1) | Year | ($/Sh.) | Date | 5% | 10% | |||||||||||||||||||
| 2000: | |||||||||||||||||||||||||
| Erwin H. Billig | 400,000 | 49 | % | $ | 4.50 | 8/10/2010 | $ | 877,903 | $ | 2,464,113 | |||||||||||||||
| John Risk | 100,000 | 12 | % | $ | 7.50 | 10/1/2010 | — | 316,028 | |||||||||||||||||
| 2001: | |||||||||||||||||||||||||
| John C. Miller | 85,000 | 59 | % | $ | 7.50 | 7/1/2011 | — | 268,624 | |||||||||||||||||
| (1) | Non-qualified stock options granted during 2000 and 2001 vest over five years and expire ten years from the effective date of grant. Non-qualified stock options granted to Mr. Billig vest automatically upon his termination of directorship or service with MSXI or upon the occurrence of certain other events, as defined. For all other options issued during 2000 and 2001, if a grantee voluntarily terminates employment, their vested options continue to be exercisable for six months in the case of death or disability and for 30 days in all other cases. | |
| (2) | Securities and Exchange Commission regulations require information as to the potential realizable value of each of these option grants assuming that the fair value of our stock appreciates in value from the date of grant to the end of the option term at annualized rates of five percent and ten percent. These amounts are based on assumed rates of appreciation only. Actual gains, if any, on stock option exercises will depend on overall market conditions and the future performance of MSXI. There can be no assurance that the amounts reflected in this table will be realized. |
Director Compensation
Outside directors, who are not affiliated with MSXI or CVC, are entitled to receive $10,000 in annual compensation and $500 per meeting attended. For the year ended December 30, 2001, Dr. Cole was the only outside director compensated for his services.
Employment Agreement
Frederick K. Minturn.Effective as of January 3, 1997, MSXI entered into an employment agreement with Mr. Minturn to serve as Executive Vice President and Chief Financial Officer for an initial term of two years. The agreement automatically renews for successive one-year terms unless otherwise terminated in writing by either MSXI or Mr. Minturn. Mr. Minturn is entitled to an annual performance bonus pursuant to the Performance Incentive Plan described below. Mr. Minturn is also entitled to all other employee benefits maintained for officers and employees of the company. MSXI may terminate his employment upon death or disability. Either the company or Mr. Minturn may terminate the agreement, with or without cause (as defined therein). If the agreement is terminated without cause by the company or with good reason (as defined therein) by Mr. Minturn, MSXI will pay to Mr. Minturn the full base salary for the remainder of the term then in effect. The agreement also provides that, during the term of his employment, and thereafter for the greater of twelve months or the remainder of the then current term, Mr. Minturn will not, directly or indirectly, engage in certain activities competitive with the business of MSXI.
Compensation Committee Interlocks and Insider Participation
The members of the compensation committee are Messrs. Billig and Delaney. Messrs. Billig and Delaney also serve on the compensation committee of Delco Remy International, Inc. The compensation committee recommended adoption of our Performance Incentive Plan to reflect MSXI’s compensation policy.
49
Table of Contents
Performance Incentive Plan
We introduced the Performance Incentive Plan (“PIP”) in April 1998. Substantially all of our salaried employees, including most executive officers, are eligible to receive payments under PIP. PIP offers target awards based on a percentage of an employee’s annual base salary. Actual awards are based on individual as well as corporate and business unit performance. Under PIP, each of Mr. Minturn, Mr. Risk, and Mr. Miller may receive a discretionary annual performance bonus of up to 87.5% of his annual base salary, depending on the degree to which MSXI meets or exceeds its target performance. Mr. Billig is eligible to receive discretionary annual bonuses as determined by the Board of Directors.
Item 12. Security Ownership of Certain Beneficial Owners and Management.
The following table provides certain information regarding the beneficial ownership, as defined in Rule 13d-3 of the Securities Exchange Act of 1934 (the “Exchange Act”), of MSXI’s common stock as of March 4, 2002 by (i) each stockholder known to us to be the beneficial owner of 5% or more of any class of MSXI’s voting securities, (ii) each of our directors and executive officers and (iii) all directors and executive officers as a group. So far as is known to us, the persons named in the table below as beneficially owning the shares set forth therein have sole voting power and sole investment power with respect to such shares, unless otherwise indicated.
| Number of Shares | ||||||||||||||||
| Beneficially Owned | Percent of Class | |||||||||||||||
| Class | Series A | Class | Series A | |||||||||||||
| A | Preferred | A | Preferred | |||||||||||||
| Name of Beneficial Owner | Common | Stock | Common | Stock | ||||||||||||
| Citicorp and affiliates | 14,676,266* | 301,890 | 73.2 | % | 84.0 | % | ||||||||||
| 399 Park Avenue, 14th Floor | ||||||||||||||||
| New York, New York 10043 | ||||||||||||||||
| CCT Partners IV, L.P. | 1,093,534* | 22,495 | 5.5 | % | 6.3 | % | ||||||||||
| 399 Park Avenue, 14th Floor | ||||||||||||||||
| New York, New York 10043 | ||||||||||||||||
| Erwin H. Billig(1) | 633,500* | 690 | 3.2 | % | 0.2 | % | ||||||||||
| 275 Rex Blvd | ||||||||||||||||
| Auburn Hills, MI 48326 | ||||||||||||||||
| Thomas T. Stallkamp | 650,250* | 1,035 | 3.2 | % | 0.3 | % | ||||||||||
| 275 Rex Blvd | ||||||||||||||||
| Auburn Hills, MI 48326 | ||||||||||||||||
| Frederick K. Minturn | 303,350* | 69 | 1.5 | % | — | |||||||||||
| 275 Rex Blvd | ||||||||||||||||
| Auburn Hills, MI 48326 | ||||||||||||||||
| John Risk | 200,000* | — | 1.0 | % | — | |||||||||||
| 275 Rex Blvd | ||||||||||||||||
| Auburn Hills, MI 48326 | ||||||||||||||||
| Michael A. Delaney | 66,400* | 1,367 | 0.3 | % | 0.4 | % | ||||||||||
| 399 Park Avenue, 14th Floor | ||||||||||||||||
| New York, New York 10043 | ||||||||||||||||
| All directors and executive | ||||||||||||||||
| officers as a group (6 persons) | 1,853,500* | 3,161 | 9.2 | % | 0.9 | % | ||||||||||
| * | Consists of an equal number of shares of each of Series A-1 Common Stock, Series A-2 Common Stock, Series A-3 Common Stock and Series A-4 Common Stock (collectively, the “Class A Common Stock”) | |
| (1) | In name of Billig Family Limited Partnership. |
50
Table of Contents
Item 13. Certain Relationships and Related Transactions.
Amended and Restated Stockholders’ Agreement
In March 2001, as a result of the sale by MascoTech, Inc. of its interest in MSXI, we amended and restated our stockholder’s agreement (the “Stockholders’ Agreement”) with CVC and its permitted transferees (together with CVC, the “Institutional Stockholders”) and certain executive officers and directors of MSXI (the “Management Stockholders” and, together with the Institutional Stockholders, the “Stockholders”). The Stockholders’ Agreement imposes certain restrictions on, and rights with respect to, the transfer of shares of MSXI’s Common Stock (as defined) and Series A Preferred Stock held by the Stockholders. The Stockholders’ Agreement also entitles the Stockholders to certain rights regarding corporate governance of MSXI, and to CVC the right to purchase its pro rata share in connection with the issuance of any new shares of Common Stock.
The Stockholders’ Agreement sets forth conditions under which the parties may transfer their shares. The Stockholders’ Agreement provides for a right of first refusal in favor of MSXI in the event that any Stockholder (the “Selling Stockholder”) desires to transfer its shares of Common Stock pursuant to a bona fide third party offer or an involuntary transfer (as defined in the Stockholders’ Agreement). To the extent that we elect to purchase fewer than all of the shares proposed to be sold by such Selling Stockholder, the Stockholders’ Agreement provides for rights of first refusal on a pro rata basis in favor of the Institutional Stockholders. In the case of a bona fide third party offer, without the consent of the Selling Stockholders, neither MSXI nor the Institutional Stockholders may purchase any of the shares pursuant to the right of first refusal unless all such shares are purchased. If such Selling Stockholder is CVC, and such Selling Stockholder proposes to sell shares representing more than 25% of the outstanding shares of Common Stock on a fully diluted basis or if any Selling Stockholder proposes to transfer shares of Series A Preferred Stock, then such Selling Stockholder must also cause the buyer to give the other Stockholders an option to sell a pro rata number of their respective shares of the same class and on the same terms and conditions as the Selling Stockholder.
In the event that a Management Stockholder’s shares of capital stock are subject to an involuntary transfer (such as a seizure pursuant to a judgement item or in connection with any voluntary or involuntary bankruptcy proceeding), the Stockholders’ Agreement grants similar rights to purchase such shares first to MSXI and then to the Institutional Stockholders, pro rata.
If the Institutional Stockholders propose to sell or otherwise transfer for value to an unaffiliated third party 51% or more of their MSXI Common Stock or Series A Preferred Stock, the Institutional Stockholders have the right to require the other stockholders to sell or transfer a similar percentage of their Class A Common Stock, equity equivalents or Series A Preferred Stock, as applicable, to such party on the same terms. If the Institutional Stockholders propose the sale or other transfer for value of all or substantially all of the assets or business of MSX International to a third party, the Institutional Stockholders have the right to require the other stockholders to approve such transaction in their capacity as stockholders of MSXI. If the Institutional Stockholders propose to transfer Class A Common Stock representing 25% or more of the Class A Common Stock (on a fully-diluted basis), other than in a registered public offering or other permitted transactions, the other stockholders have the option to sell to the same offeree pursuant to tag-along rights a similar percentage of their Class A Common Stock or equity equivalents on the same terms. If any stockholder proposes to transfer any shares of Series A Preferred Stock, the other stockholders have the option to sell to the same offeree pursuant to tag along rights a similar percentage of their Series A Preferred Stock on the same terms.
The Stockholders’ Agreement provides that the Board of Directors of MSXI shall consist of seven members consisting of four nominees of CVC, one nominee of the Management Stockholders and two disinterested directors.
Amended and Restated Registration Rights Agreement
Pursuant to the Amended and Restated Registration Rights Agreement (the “Registration Rights Agreement”), the Institutional Stockholders are entitled to require MSXI to effect a public offering of Common Stock underwritten on a firmly committed basis which (taken together with all other similar previous offerings) raises at least $50 million of aggregate net proceeds to MSXI or results in at least 25% of the Common Stock on a fully-diluted basis being sold. The Institutional Stockholders (as a group) are entitled to three long-form registrations and unlimited short-form registrations on demand, in each case at the expense of MSXI (other than underwriting commissions and discounts). The other stockholders are entitled to include shares of Common Stock in these registrations, subject to a right of first priority in favor of the Institutional Stockholders and customary underwriters’ cutback rights. The Institutional Stockholders and all other stockholders are entitled to include, at the expense of MSXI, their shares of Common Stock in any primary registrations initiated by MSXI or any secondary registration on behalf of other stockholders requested by such stockholders on a pro-rata basis, subject to customary underwriters cutback rights.
51
Table of Contents
PART IV
Item 14. Exhibits, Financial Statement Schedules, and Reports on Form 8-K.
(a) Listing of Documents.
| (1) | Financial Statements.MSXI’s Consolidated Financial Statements included under Item 8 hereof, as required for the three fiscal years ended December 31, 2000, consist of the following: |
| Consolidated Balance Sheets Consolidated Statements of Income Consolidated Statements of Cash Flows Consolidated Statements of Shareholders’ Deficit Notes to Consolidated Financial Statements |
| (2) | Financial Statement Schedule. |
| (i) | The Financial Statement Schedule appended hereto, as required for the fiscal years ended January 3, 1999, January 2, 2000, and December 31, 2000 consists of the following: |
| II. Valuation and Qualifying Accounts |
| (3) | Exhibits. |
| 3.1 | Amended and Restated Certificate of Incorporation of MSXI. (8) | |
| 3.2 | Amended and Restated By-laws of MSXI | |
| 4.1 | Indenture dated as of January 15, 1998 by and between MSXI, the Subsidiary Guarantors and IBJ Schroder Bank & Trust Company, as trustee, in respect of the 11-3/8% Senior Subordinated Notes due 2008.(1) | |
| 4.2 | Form of Exchange Notes.(1) | |
| 4.3 | Registration Agreement dated as of January 16, 1998 by and among MSXI, the Subsidiary Guarantors and Salomon Brothers Inc, Lehman Brothers Inc. and First Chicago Capital Markets, Inc.(1) | |
| 10.1 | Amended and Restated Stockholders’ Agreement. (8) | |
| 10.2 | Amended and Restated Registration Rights Agreement. (8) | |
| 10.3 | Master Vendor Agreement dated as of August 31, 1997 between MSXI and Ford Motor Company (“Ford”).(1) | |
| 10.4 | Master Supply Agreement dated as of August 31, 1997 between MSXI and Ford.(1) | |
| 10.5 | CVC Subscription Agreement dated as of January 3, 1997 between MSXI and CVC.(1) | |
| 10.6 | Management Subscription Agreement dated as of January 3, 1997 between MSXI and certain executive officers of MSXI.(1) | |
| 10.7 | Deferred Compensation Plan.(1) | |
| 10.8 | MSX International, Inc. 2000 Stock Option Plan. (8) | |
| 10.9 | Employment Agreement dated as of January 3, 1997 between MSXI and Frederick K. Minturn.(1) | |
| 10.10 | Stock Purchase Agreement dated as of July 25, 1997 between MSX International (Holdings), Inc. and Ford.(1) | |
| 10.11 | Acquisition Agreement dated as of November 12, 1996 among MSXI, MascoTech and ASG Holdings Inc. (1) | |
| 10.12 | Asset Purchase Agreement dated as of October 23, 1998, between MSX International Engineering Services, Inc. and Lexstra International, Inc. and Lexus Temporaries, Inc.(2) | |
| 10.13 | Stock Purchase Agreement dated as of December 22, 1998 between MSX Engineering Services, Inc. and MegaTech Engineering, Inc. (3) | |
| 10.14 | Stock Purchase Agreement dated as of September 17, 1999 between MSX Engineering Services, Inc. and Chelsea Computer Consultants, Inc.(4) | |
| 10.15 | Amended and Restated Credit Agreement dated as of November 30, 1999 between MSX International, Inc., the Borrowing Subsidiaries, and Bank One NA. (5) |
52
Table of Contents
| 10.16 | Stock Purchase Agreement dated as of August 6, 1999 between MSX International Holding Ltd. and Satiz S.p.A. (6) | |
| 10.17 | First Amendment to Amended and Restated Credit Agreement (7) | |
| 12.1 | Statement re: Computation of Ratio of Earnings to Fixed Charges. | |
| 21.1 | Subsidiaries of MSXI. |
| (1) | Incorporated by reference to the Exhibits filed with MSX International’s Registration Statement on Form S-4 filed July 21, 1998 (Amendment No. 3). | ||
| (2) | Incorporated by reference to the Exhibits filed with MSX International’s Quarterly Report on Form 10-Q filed November 11, 1998. | ||
| (3) | Incorporated by reference to the Exhibits filled with MSX International’s Current Report on Form 8-K filed June 30, 1999. | ||
| (4) | Incorporated by reference to the Exhibits filed with MSX International’s Current Report on Form 8-K filed October 26, 1999. | ||
| (5) | Incorporated by reference to the Exhibits filed with MSX International’s Annual Report on Form 10-K filed March 24, 2000. | ||
| (6) | Incorporated by reference to the Exhibits filed with MSX International’s Current Report on Form 8-K filed March 14, 2000. | ||
| (7) | Incorporated by reference to the Exhibits filed with MSX International’s Quarterly Report on Form 10-Q filed November 14, 2001. | ||
| (8) | Incorporated by reference to the Exhibits filed with MSX International’s Annual Report on Form 10-K filed March 9, 2001. |
(b) Reports on Form 8-K.
| None. |
53
Table of Contents
SIGNATURES
Pursuant to the requirements of Section 13 or 15(d) of the Securities Exchange Act of 1934, the Registrant has duly caused this Report to be signed on its behalf by the undersigned, thereunto duly authorized.
| MSX INTERNATIONAL, INC. |
| By: | /s/ Frederick K. Minturn | |
| Frederick K. Minturn Executive Vice President and Chief Financial Officer |
March 4, 2002
Pursuant to the requirements of the Securities Exchange Act of 1934, this Report has been signed below by the following persons on behalf of the Registrant and in the capacities and on the date indicated.
| /s/ Thomas T. Stallkamp Thomas T. Stallkamp | Vice Chairman and Chief Executive Officer (Principal Executive Officer) | |||
| /s/ Frederick K. Minturn Frederick K. Minturn | Executive Vice President and Chief Financial Officer (Principal Financial Officer) | |||
| /s/ Erwin H. Billig Erwin H. Billig | Chairman of the Board of Directors | |||
| /s/ David E. Cole David E. Cole | Director | March 4, 2002 | ||
| /s/ Michael A. Delaney Michael A. Delaney | Director | |||
| /s/ Richard A. Manoogian Richard A. Manoogian | Director |
54
Table of Contents
FINANCIAL STATEMENT SCHEDULES
PURSUANT TO ITEM 14(a)(2) of Form 10-K
ANNUAL REPORT to the SECURITIES AND EXCHANGE COMMISSION
For the fiscal year ended December 30, 2001
Schedule, as required for the three fiscal years ended December 30, 2001:
| Page | ||||
| II. Valuation and Qualifying Accounts | F-2 | |||
F-1
Table of Contents
MSX INTERNATIONAL, INC.
SCHEDULE II. VALUATION AND QUALIFYING ACCOUNTS
For the Three Fiscal Years Ended December 30, 2001
| Column A | Column B | Column C | Column D | Column E | ||||||||||||||||
| Additions | ||||||||||||||||||||
| Charged | Charged | |||||||||||||||||||
| Balance at | (Credited) | (Credited) | Balance at | |||||||||||||||||
| Beginning of | to costs | to Other | End of | |||||||||||||||||
| Description | Period | and Expenses | Accounts | Deductions | Period | |||||||||||||||
| (A) | (B) | |||||||||||||||||||
| Allowance for doubtful accounts deducted from accounts receivable in the balance: | ||||||||||||||||||||
| 2001 | $ | 2,032,420 | $ | 2,267,224 | $ | — | $ | 1,639,326 | $ | 2,660,318 | ||||||||||
| 2000 | $ | 2,031,157 | $ | 1,005,876 | $ | 80,000 | $ | 1,084,613 | $ | 2,032,420 | ||||||||||
| 1999 | $ | 3,475,556 | $ | 964,494 | $ | 319,975 | $ | 2,728,868 | $ | 2,031,157 | ||||||||||
| (A) | Allowances of companies acquired in fiscal 1999 and 2000. | |
| (B) | Doubtful accounts charged off, net of recoveries. Deductions for fiscal 1999 include $2.1 million of reserves for receivables which were not acquired in certain 1997 and 1998 business combinations. |
F-2
Table of Contents
INDEX TO EXHIBITS
| EXHIBIT | ||
| NUMBER | DESCRIPTION | |
| 3.2 | Amended and Restated By-laws of MSXI. | |
| 12.1 | Statement re: Computation of Ratio of Earnings to Fixed Charges. | |
| 21.1 | Subsidiaries of MSXI. |