Exhibit 99.1
PETROHAWK ENERGY CORPORATION ANNOUNCES
FOURTH QUARTER AND FULL YEAR 2008 FINANCIAL RESULTS
2009 Production Target Raised to 40% Year Over Year Growth
Lease Operating Costs Guided Lower
Company Completes Early Redetermination of Revolving Credit Facility Borrowing Base
Haynesville Shale Reserve Estimates Increased
HOUSTON—February 25, 2009—Petrohawk Energy Corporation (“Petrohawk” or the “Company”) (NYSE:HK) today announced its fourth quarter and full year 2008 financial results, including detail on its year end proved reserves and hedging activities as well as production and cost guidance for 2009.
| | • | | The Company reported average production for the fourth quarter of 361 million cubic feet natural gas equivalent per day (Mmcfe/d), a 15% increase over third quarter 2008. Total production for the quarter was 33.2 billion cubic feet of natural gas equivalent (Bcfe), which includes 30.6 billion cubic feet (Bcf) of natural gas and 426 thousand barrels (MBbls) of oil. For the full year 2008, production averaged 305 Mmcfe/d and totaled 111.6 Bcfe, a 39% year over year increase excluding divestments. |
| | • | | Petrohawk generated revenues of $270.7 million for the quarter ended December 31, 2008, an increase of 19% over fourth quarter 2007. Revenues for the year ended December 31, 2008 were $1.1 billion, representing an increase of 24% over the prior year and a record for the Company. |
| | • | | Cash flows from operations before changes in working capital (cash flow from operations, a non-GAAP measure) were $120.5 million, or $0.48 per fully diluted common share for the quarter, and $600.6 million, or $2.74 per fully diluted common share, for the full year. |
| | • | | After adjusting for selected items, Petrohawk reported a net loss for the quarter of $0.04 per diluted common share, or $10.0 million, versus net income of $25.8 million, or $0.15 per diluted common share one year ago (see Selected Item Review and Reconciliation table for additional information). Several large items affected the fourth quarter net loss. These included 1) a non-cash impairment charge of the full cost pool, associated with full cost accounting and commodity prices at the end of the quarter, of approximately $950.8 million; 2) a hedging related non-cash mark-to-market gain of $173.3 million; and 3) an income tax benefit during the quarter primarily related to the full cost pool impairment. Before excluding selected items, a $545.1 million net loss was reported for the quarter, representing a $2.18 loss per share. For the full year 2008, and after adjusting for selected items, net income was $0.49 per diluted share, or $114.3 million. Before adjusting for selected items, the Company reported a net loss of $1.77 per diluted common share, or $388.1 million, for 2008. |
| | • | | During the fourth quarter, per unit lease operating costs were $0.45 per thousand cubic feet of natural gas equivalent (Mcfe), or $14.9 million. Lease operating expense for the year was $52.5 million, or $0.47 per Mcfe, compared to $64.7 million for full year 2007, or $0.56 per Mcfe, a 16% reduction on a per unit basis. Total cash operating costs, excluding marketing expense, were $1.82 per Mcfe for the fourth quarter, and $1.92 per Mcfe for the year. |
| | • | | Before the effect of derivatives, the Company realized $5.87 per Mcf of natural gas, or 85% of NYMEX, and $55.42 per barrel of oil, or 94% of NYMEX, during the fourth quarter, and $8.56 per Mcf of natural gas and $95.16 per barrel of oil for the full year. During the fourth quarter, price realizations in the Fayetteville Shale area were substantially reduced due to delays in completion of the Boardwalk pipeline. Petrohawk expects first quarter 2009 to reflect lower realizations from this area until the Boardwalk pipeline is fully operational. |
| | • | | A portion of the Company’s interest expense during the quarter was a result of a draw on its revolving credit facility above normal working capital needs during the first week of October 2008. The facility was partially drawn during a period of extreme uncertainly in the global capital markets. Proceeds were placed into short term securities. At year end, $450 million drawn on the facility was subsequently repaid with proceeds from a senior note offering in late January 2009. |
| | • | | For 2009, approximately 252 million British thermal unit (MMbtu) of natural gas per day and 750 Bbls of oil per day, or 60% of Petrohawk’s current expected annual production, is currently hedged at weighted average prices between $7.57 and $11.79 per MMbtu for natural gas and swapped at $77.00 per barrel for oil. Approximately 295 Mmcfe/d of natural gas is hedged for 2010, primarily with collars, with an average floor of $6.28 per MMbtu and an average ceiling of $9.28 per MMbtu. Approximately 750 barrels of oil per day is swapped at a rate of $75.28 per Bbl. A summary of Petrohawk’s derivative positions for 2009 and 2010 can be found on the Company’s website,www.petrohawk.com. |
“Petrohawk continues to build the company around high-value properties,” said Floyd C. Wilson, Chairman, President and Chief Executive Officer. “Our actions – acreage and property acquisitions, financing activities, arranging for significant hedging and product marketing, success in the exploitation of our large Haynesville Shale position, and posting significant proved reserve and production growth – have served to create enduring value. Further, our low operating cost structure, which we have guided even lower for 2009, and strong drilling results continue to provide impressive rates of return. For Petrohawk, growing proved reserves and cash flow will be key drivers in 2009 and beyond.”
Balance Sheet Summary
At December 31, 2008, Petrohawk had $450 million outstanding on its revolving credit facility with approximately $130 million in cash and marketable securities. On January 27, 2009, the Company received net proceeds of $535.7 million from a senior notes offering and repaid all outstanding borrowings on its senior revolving credit facility. Pursuant to the terms of its senior revolving credit agreement, the borrowing base was reduced at the closing of the senior notes offering from $1.1 billion to $950 million. Adjusted for this offering, Petrohawk’s debt to book capitalization was approximately 41%.
Petrohawk recently completed an early redetermination of the borrowing base under its senior revolving credit facility. The borrowing base of $950 million, along with terms and pricing, was reconfirmed. The lead syndicate bank of Petrohawk’s senior revolving credit facility is BNP Paribas.
Proved Reserves Summary
Petrohawk reported 1.418 Tcfe of proved reserves as of December 31, 2008, adding a record 465 Bcfe through drilling, resulting in 34% year-over-year reserve growth. The Company replaced 419% of production during 2008. Organic finding and development costs, excluding land and seismic costs, were $2.77 per Mcfe. Approximately 80% of the Company’s proved reserves are located in its four primary operating areas: Elm Grove field (685 Bcfe), Fayetteville Shale (173 Bcfe), the Haynesville Shale (163 Bcfe), and Terryville field (112 Bcfe).
Petrohawk’s estimated proved reserves at December 31, 2008 were prepared by the independent reserve engineering firm Netherland, Sewell & Associates, Inc., in accordance with SEC guidelines. Reserves were computed using unescalated year-end 2008 prices of $5.71 per MMbtu of natural gas and $41.00 per barrel of oil, with adjustments for quality and basis differentials.
The following table summarizes the changes in the Company’s estimated proved reserves during 2008:
| | | |
| | | Estimated Proved Reserves (Bcfe) | |
December 31, 2007 | | 1,062 | |
Discoveries, extensions and other additions | | 465 | |
Purchases of properties | | 95 | |
Production | | (112 | ) |
Sales of properties | | (3 | ) |
Revisions | | (89 | ) |
| | | |
December 31, 2008 | | 1,418 | |
| | | |
Total proved reserves of 1.418 Tcfe consist of 1.335 Bcf of natural gas and natural gas liquids and 13.8 million barrels of oil. The total proved reserves are 94% natural gas and 56% proved developed. Non-acquisition related oil and gas capital expenditures for the year totaled approximately $1.042 billion.
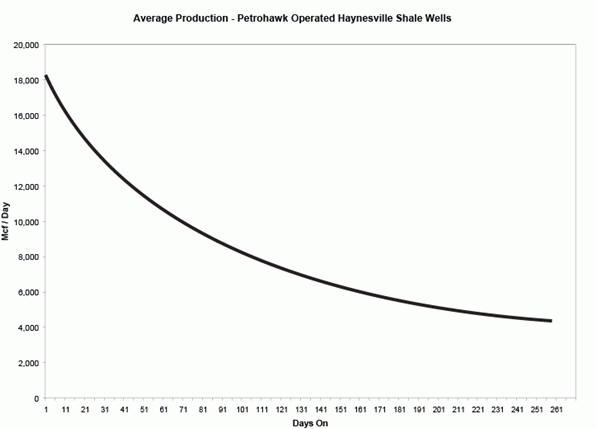
Additionally, Petrohawk increased its estimated ultimate recovery (EUR) in the Haynesville Shale to 7.5 Bcfe per well and confirmed the hyperbolic nature of its Haynesville Shale well production. The estimate is based on performance data from its first fourteen completed wells and excludes data from two previously reported wells with mechanical issues. The graph below is a time-zero production plot from these wells, which were all completed and put into sales according to common production practices. The increased EUR estimate increases Petrohawk’s total resource potential in the Haynesville Shale to 13.7 Tcfe.
2009 Guidance
In 2009, Petrohawk expects average daily production to be between 422 and 432 MMcfe/d, which is an increase from the previously announced range of 392 to 402 MMcfe/d. This represents an approximate 40% increase over the 2008 average daily production rate of 305 MMcfe/d. For the first quarter 2009, average daily production is expected to be between 400 and 410 MMcfe/d. Additional guidance for the full year 2009 is as follows:
| | | | | | | | | | |
Production (Mmcfe/d) | | | 422 | | | — | | | 432 | |
Lease Operating Expense ($/Mcfe) | | $ | 0.36 | | | — | | $ | 0.44 | |
Workover Expense and Other ($/Mcfe) | | $ | 0.04 | | | — | | $ | 0.08 | |
Production (Ad Valorem and Severance) Taxes ($/Mcfe) | | $ | 0.35 | | | — | | $ | 0.45 | |
Gathering, Transportation and Other ($/Mcfe) | | $ | 0.40 | | | — | | $ | 0.48 | |
General and Administrative ($/Mcfe) (1) | | $ | 0.40 | | | — | | $ | 0.50 | |
Income Taxes | | | Effective rate of 38%-41% | |
Natural Gas Price Realizations (2) | | | 92 | % | | — | | | 97 | % |
(1) | Excludes non-cash stock based compensation charges of $0.12 - $0.16 / Mcfe |
(2) | % of NYMEX, before effect of hedges |
Petrohawk Fourth Quarter and Full Year 2008 Earnings Conference Call
Petrohawk has scheduled a conference call for Wednesday, February 25, 2009 at 9:30 a.m. CDT (10:30 a.m. EDT) to discuss fourth quarter and full year 2008 financial and operating results. To access, dial 800-644-8607 five to ten minutes before the call begins. Please reference Petrohawk Energy Conference ID 81822729. International callers may also participate by dialing 706-679-8184. A replay of the call will be available approximately two hours after the live broadcast ends and will be accessible until March 11, 2009. To access the replay, please dial 800-642-1687 and reference conference ID 81822729. International callers may listen to a playback by dialing 706-645-9291. In addition, the call will be webcast live on Petrohawk’s website at http://www.petrohawk.com. A replay of the call will be available at that site through March 11, 2008.
Petrohawk Energy Corporation is an independent energy company engaged in the acquisition, production, exploration and development of natural gas and oil with properties concentrated in North Louisiana, Arkansas, East Texas, Oklahoma and the Permian basin.
For more information contact Joan Dunlap, Vice President—Investor Relations, at 832-204-2737 or jdunlap@petrohawk.com. For additional information about Petrohawk, please visit our website at www.petrohawk.com.
Additional Information for Investors
This press release contains forward-looking information regarding Petrohawk that is intended to be covered by the safe harbor “forward-looking statements” provided by of the Private Securities Litigation Reform Act of 1995, based on Petrohawk’s current expectations and includes statements regarding acquisitions and divestitures, estimates of future production, future results of operations, quality and nature of the asset base, the assumptions upon which estimates are based and other expectations, beliefs, plans, objectives, assumptions, strategies or statements about future events or performance (often, but not always, using words such as “expects”, “anticipates”, “plans”, “estimates”, “potential”, “possible”, “probable”, or “intends”, or stating that certain actions, events or results “may”, “will”, “should”, or “could” be taken, occur or be achieved). Statements concerning oil and gas reserves also may be
deemed to be forward-looking statements in that they reflect estimates based on certain assumptions that the resources involved can be economically exploited. Forward-looking statements are based on current expectations, estimates and projections that involve a number of risks and uncertainties, which could cause actual results to differ materially from those reflected in the statements. These risks include, but are not limited to: the risks of the oil and gas industry (for example, operational risks in exploring for, developing and producing crude oil and natural gas; risks and uncertainties involving geology of oil and gas deposits; the uncertainty of reserve estimates; the uncertainty of estimates and projections relating to future production, costs and expenses; potential delays or changes in plans with respect to exploration or development projects or capital expenditures; health, safety and environmental risks and risks related to weather such as hurricanes and other natural disasters); uncertainties as to the availability and cost of financing; fluctuations in oil and gas prices; risks associated with derivative positions; inability to realize expected value from acquisitions, inability of our management team to execute its plans to meet its goals, shortages of drilling equipment, oil field personnel and services, unavailability of gathering systems, pipelines and processing facilities and the possibility that government policies may change or governmental approvals may be delayed or withheld. Additional information on these and other factors which could affect Petrohawk’s operations or financial results are included in Petrohawk’s reports on file with the SEC. Investors are cautioned that any forward-looking statements are not guarantees of future performance and actual results or developments may differ materially from the projections in the forward-looking statements. Forward-looking statements are based on the estimates and opinions of management at the time the statements are made. Petrohawk does not assume any obligation to update forward-looking statements should circumstances or management’s estimates or opinions change.
# # #
PETROHAWK ENERGY CORPORATION
CONSOLIDATED STATEMENTS OF OPERATIONS (Unaudited)
(In thousands, except per share amounts)
| | | | | | | | | | | | | | | | |
| | | Three Months Ended
December 31, | | | Years Ended
December 31, | |
| | | 2008 | | | 2007 | | | 2008 | | | 2007 | |
Operating revenues: | | | | | | | | | | | | | | | | |
Oil and gas | | $ | 207,126 | | | $ | 227,343 | | | $ | 1,031,657 | | | $ | 883,405 | |
Marketing | | | 63,553 | | | | — | | | | 63,553 | | | | — | |
| | | | | | | | | | | | | | | | |
Total operating revenues | | | 270,679 | | | | 227,343 | | | | 1,095,210 | | | | 883,405 | |
Operating expenses: | | | | | | | | | | | | | | | | |
Marketing | | | 58,581 | | | | — | | | | 58,581 | | | | — | |
Production: | | | | | | | | | | | | | | | | |
Lease operating | | | 14,856 | | | | 14,138 | | | | 52,477 | | | | 64,666 | |
Workover and other | | | 2,142 | | | | 1,568 | | | | 5,624 | | | | 7,700 | |
Taxes other than income | | | 9,919 | | | | 15,225 | | | | 47,104 | | | | 58,347 | |
Gathering, transportation and other | | | 14,353 | | | | 9,727 | | | | 47,309 | | | | 33,015 | |
General and administrative: | | | | | | | | | | | | | | | | |
General and administrative | | | 19,204 | | | | 19,773 | | | | 62,500 | | | | 58,327 | |
Stock-based compensation | | | 3,242 | | | | 5,674 | | | | 12,310 | | | | 15,540 | |
Depletion, depreciation and amortization | | | 127,335 | | | | 98,001 | | | | 396,556 | | | | 395,161 | |
Full cost ceiling impairment | | | 950,799 | | | | — | | | | 950,799 | | | | — | |
| | | | | | | | | | | | | | | | |
Total operating expenses | | | 1,200,431 | | | | 164,106 | | | | 1,633,260 | | | | 632,756 | |
| | | | | | | | | | | | | | | | |
(Loss) income from operations | | | (929,752 | ) | | | 63,237 | | | | (538,050 | ) | | | 250,649 | |
Other income (expenses): | | | | | | | | | | | | | | | | |
Net gain (loss) on derivative contracts | | | 189,000 | | | | (28,006 | ) | | | 156,870 | | | | (35,011 | ) |
Interest expense and other | | | (49,116 | ) | | | (32,756 | ) | | | (151,825 | ) | | | (129,603 | ) |
| | | | | | | | | | | | | | | | |
Total other income (expenses) | | | 139,884 | | | | (60,762 | ) | | | 5,045 | | | | (164,614 | ) |
| | | | | | | | | | | | | | | | |
(Loss) income before income taxes | | | (789,868 | ) | | | 2,475 | | | | (533,005 | ) | | | 86,035 | |
Income tax benefit (provision) | | | 244,729 | | | | (2,589 | ) | | | 144,953 | | | | (33,138 | ) |
| | | | | | | | | | | | | | | | |
Net (loss) income available to common stockholders | | $ | (545,139 | ) | | $ | (114 | ) | | $ | (388,052 | ) | | $ | 52,897 | |
| | | | | | | | | | | | | | | | |
Net (loss) income per share of common stock: | | | | | | | | | | | | | | | | |
Basic | | $ | (2.18 | ) | | $ | (0.00 | ) | | $ | (1.77 | ) | | $ | 0.31 | |
| | | | | | | | | | | | | | | | |
Diluted | | $ | (2.18 | ) | | $ | (0.00 | ) | | $ | (1.77 | ) | | $ | 0.31 | |
| | | | | | | | | | | | | | | | |
Weighted average shares outstanding: | | | | | | | | | | | | | | | | |
Basic | | | 250,100 | | | | 168,986 | | | | 218,993 | | | | 168,006 | |
| | | | | | | | | | | | | | | | |
Diluted | | | 250,100 | | | | 168,986 | | | | 218,993 | | | | 171,248 | |
| | | | | | | | | | | | | | | | |
| | |
CONDENSED CONSOLIDATED BALANCE SHEETS (Unaudited) | | | | | | | | | |
(In thousands) | | | | | | | | | |
| | | December 31, | | | | | | | |
| | | 2008 | | | 2007 | | | | | | | |
Assets: | | | | | | | | | | | | | | | | |
Current assets | | $ | 648,432 | | | $ | 189,193 | | | | | | | | | |
Net oil and gas properties | | | 5,071,287 | | | | 3,155,672 | | | | | | | | | |
Other assets | | | 1,187,610 | | | | 1,327,574 | | | | | | | | | |
| | | | | | | | | | | | | | | | |
Total assets | | $ | 6,907,329 | | | $ | 4,672,439 | | | | | | | | | |
| | | | | | | | | | | | | | | | |
Liabilities and stockholders’ equity: | | | | | | | | | | | | | | | | |
Current liabilities | | $ | 726,312 | | | $ | 360,497 | | | | | | | | | |
Long-term debt | | | 2,283,874 | | | | 1,595,127 | | | | | | | | | |
Other noncurrent liabilities | | | 492,233 | | | | 707,918 | | | | | | | | | |
Stockholders’ equity | | | 3,404,910 | | | | 2,008,897 | | | | | | | | | |
| | | | | | | | | | | | | | | | |
Total liabilities and stockholders’ equity | | $ | 6,907,329 | | | $ | 4,672,439 | | | | | | | | | |
| | | | | | | | | | | | | | | | |
PETROHAWK ENERGY CORPORATION
CONSOLIDATED STATEMENTS OF CASH FLOWS (Unaudited)
(In thousands)
| | | | | | | | | | | | | | | | |
| | | Three Months Ended
December 31, | | | Years Ended
December 31, | |
| | | 2008 | | | 2007 | | | 2008 | | | 2007 | |
Cash flows from operating activities: | | | | | | | | | | | | | | | | |
Net (loss) income | | $ | (545,139 | ) | | $ | (114 | ) | | $ | (388,052 | ) | | | 52,897 | |
Adjustments to reconcile net (loss) income to net cash provided by operating activities: | | | | | | | | | | | | | | | | |
Depletion, depreciation and amortization | | | 127,335 | | | | 98,001 | | | | 396,556 | | | | 395,161 | |
Full cost ceiling impairment | | | 950,799 | | | | — | | | | 950,799 | | | | — | |
Income tax (benefit) provision | | | (244,729 | ) | | | 2,589 | | | | (144,953 | ) | | | 33,138 | |
Stock-based compensation | | | 3,242 | | | | 5,674 | | | | 12,310 | | | | 15,540 | |
Net unrealized (gain) loss on derivative contracts | | | (173,303 | ) | | | 30,949 | | | | (230,640 | ) | | | 79,011 | |
Net realized gain on derivative contracts acquired | | | — | | | | (502 | ) | | | — | | | | (3,615 | ) |
Other | | | 2,260 | | | | 1,406 | | | | 4,552 | | | | 5,664 | |
| | | | | | | | | | | | | | | | |
Cash flow from operations before changes in working capital | | | 120,465 | | | | 138,003 | | | | 600,572 | | | | 577,796 | |
Changes in working capital | | | (37,294 | ) | | | 14,054 | | | | 8,383 | | | | 27,249 | |
| | | | | | | | | | | | | | | | |
Net cash provided by operating activities | | | 83,171 | | | | 152,057 | | | | 608,955 | | | | 605,045 | |
| | | | | | | | | | | | | | | | |
Cash flows from investing activities: | | | | | | | | | | | | | | | | |
Oil and gas capital expenditures | | | (575,792 | ) | | | (553,296 | ) | | | (3,121,736 | ) | | | (1,253,180 | ) |
Acquisition of One Tec, LLC, net of cash acquired of $2,145 | | | — | | | | — | | | | — | | | | (39,910 | ) |
Proceeds received from sale of oil and gas properties | | | 1,944 | | | | 681,157 | | | | 109,268 | | | | 689,220 | |
Marketable securities purchased | | | (1,626,350 | ) | | | — | | | | (3,777,427 | ) | | | — | |
Marketable securities redeemed | | | 1,756,060 | | | | — | | | | 3,654,418 | | | | — | |
Increase in restricted cash | | | — | | | | (650,000 | ) | | | — | | | | (650,000 | ) |
Decrease in restricted cash | | | — | | | | 380,163 | | | | 269,837 | | | | 380,163 | |
Other operating property and equipment expenditures and other | | | (89,285 | ) | | | (487 | ) | | | (164,810 | ) | | | (2,989 | ) |
| | | | | | | | | | | | | | | | |
Net cash used in investing activities | | | (533,423 | ) | | | (142,463 | ) | | | (3,030,450 | ) | | | (876,696 | ) |
| | | | | | | | | | | | | | | | |
Cash flows from financing activities: | | | | | | | | | | | | | | | | |
Proceeds from exercise of options and warrants | | | 3,668 | | | | 3,096 | | | | 14,438 | | | | 6,058 | |
Proceeds from issuance of common stock | | | (1 | ) | | | — | | | | 1,831,950 | | | | — | |
Offering costs | | | (9 | ) | | | — | | | | (73,763 | ) | | | — | |
Proceeds from borrowings | | | 800,000 | | | | 168,000 | | | | 2,764,000 | | | | 950,000 | |
Repayment of borrowings | | | (350,000 | ) | | | (188,431 | ) | | | (2,086,266 | ) | | | (689,601 | ) |
Debt issue costs | | | (402 | ) | | | (834 | ) | | | (23,793 | ) | | | (834 | ) |
Net realized gain on derivative contracts acquired | | | — | | | | 502 | | | | — | | | | 3,615 | |
Other | | | — | | | | 84 | | | | — | | | | (1,368 | ) |
| | | | | | | | | | | | | | | | |
Net cash provided by (used in) financing activities | | | 453,256 | | | | (17,583 | ) | | | 2,426,566 | | | | 267,870 | |
| | | | | | | | | | | | | | | | |
Net increase (decrease) in cash | | | 3,004 | | | | (7,989 | ) | | | 5,071 | | | | (3,781 | ) |
Cash at beginning of period | | | 3,879 | | | | 9,801 | | | | 1,812 | | | | 5,593 | |
| | | | | | | | | | | | | | | | |
Cash at end of period | | $ | 6,883 | | | $ | 1,812 | | | $ | 6,883 | | | $ | 1,812 | |
| | | | | | | | | | | | | | | | |
PETROHAWK ENERGY CORPORATION
SELECTED OPERATING DATA (Unaudited)
(In thousands, except per share amounts)
| | | | | | | | | | | | | | | | |
| | | Three Months Ended
December 31, | | | Years Ended
December 31, | |
| | | 2008 | | | 2007 | | | 2008 | | | 2007 | |
Production: | | | | | | | | | | | | | | | | |
Natural gas—Mmcf | | | 30,636 | | | | 24,310 | | | | 102,273 | | | | 99,506 | |
Crude oil—MBbl | | | 426 | | | | 595 | | | | 1,554 | | | | 2,816 | |
Natural gas equivalent—Mmcfe | | | 33,192 | | | | 27,880 | | | | 111,597 | | | | 116,402 | |
Daily production—Mmcfe | | | 361 | | | | 303 | | | | 305 | | | | 319 | |
| | | | |
Average price per unit: | | | | | | | | | | | | | | | | |
Realized oil price—as reported | | $ | 55.42 | | | $ | 87.93 | | | $ | 95.16 | | | $ | 68.84 | |
Realized impact of derivatives | | | 6.50 | | | | (9.42 | ) | | | (20.34 | ) | | | (1.81 | ) |
| | | | | | | | | | | | | | | | |
Net realized oil price (Bbl) | | | 61.92 | | | | 78.51 | | | | 74.82 | | | | 67.03 | |
| | | | |
Realized gas price—as reported | | | 5.87 | | | | 7.16 | | | | 8.56 | | | | 6.92 | |
Realized impact of derivatives | | | 0.42 | | | | 0.35 | | | | (0.43 | ) | | | 0.49 | |
| | | | | | | | | | | | | | | | |
Net realized gas price (Mcf) | | | 6.29 | | | | 7.51 | | | | 8.13 | | | | 7.41 | |
| | | | |
Cash flow from operations(1) | | | 120,465 | | | | 138,003 | | | | 600,572 | | | | 577,796 | |
Cash flow from operations—per share (diluted) | | | 0.48 | | | | 0.82 | | | | 2.74 | | | | 3.37 | |
| | | | |
Average cost per Mcfe: | | | | | | | | | | | | | | | | |
Production: | | | | | | | | | | | | | | | | |
Lease operating | | | 0.45 | | | | 0.51 | | | | 0.47 | | | | 0.56 | |
Workover and other | | | 0.06 | | | | 0.06 | | | | 0.05 | | | | 0.07 | |
Taxes other than income | | | 0.30 | | | | 0.55 | | | | 0.42 | | | | 0.50 | |
Gathering, transportation and other | | | 0.43 | | | | 0.35 | | | | 0.42 | | | | 0.28 | |
General and administrative: | | | | | | | | | | | | | | | | |
General and administrative | | | 0.58 | | | | 0.71 | | | | 0.56 | | | | 0.50 | |
Stock-based compensation | | | 0.10 | | | | 0.20 | | | | 0.11 | | | | 0.13 | |
Depletion | | | 3.77 | | | | 3.47 | | | | 3.50 | | | | 3.35 | |
| | | | |
(1) Represents cash flow from operations before changes in working capital. See the Consolidated Statements of Cash Flows for a reconciliation from this non-GAAP financial measure to the most comparable GAAP financial measure. | | | | | | | | | | | | | | | | |
|
| SELECTED ITEM REVIEW AND RECONCILIATION (Unaudited) | |
| (In thousands, except per share amounts) | |
| | |
| | | Three Months Ended
December 31, | | | Years Ended
December 31, | |
| | | 2008 | | | 2007 | | | 2008 | | | 2007 | |
Unrealized (gain) loss on derivatives:(1) | | | | | | | | | | | | | | | | |
Natural gas | | $ | (142,396 | ) | | $ | 12,954 | | | $ | (193,507 | ) | | $ | 49,542 | |
Crude oil | | | (30,905 | ) | | | 17,995 | | | | (37,131 | ) | | | 29,469 | |
| | | | | | | | | | | | | | | | |
Total mark-to-market non-cash charge | | | (173,301 | ) | | | 30,949 | | | | (230,638 | ) | | | 79,011 | |
Full cost ceiling impairment | | | 950,799 | | | | — | | | | 950,799 | | | | — | |
Master limited partnership withdrawal | | | — | | | | — | | | | 3,352 | | | | — | |
Gulf Coast stock based compensation(2) | | | — | | | | 2,386 | | | | — | | | | 2,386 | |
Gulf Coast severance(3) | | | — | | | | 9,499 | | | | — | | | | 9,499 | |
Expense of deferred financing costs(4) | | | — | | | | 863 | | | | 782 | | | | 863 | |
| | | | | | | | | | | | | | | | |
Total selected items, before tax | | | 777,498 | | | | 43,697 | | | | 724,295 | | | | 91,759 | |
Income tax effect of selected items(5) | | | (242,334 | ) | | | (17,775 | ) | | | (221,952 | ) | | | (35,346 | ) |
| | | | | | | | | | | | | | | | |
Selected items, net of tax | | | 535,164 | | | | 25,922 | | | | 502,343 | | | | 56,413 | |
Net (loss) income available to common shareholders, as reported | | | (545,139 | ) | | | (114 | ) | | | (388,052 | ) | | | 52,897 | |
| | | | | | | | | | | | | | | | |
Net (loss) income available to common shareholders, excluding selected items | | $ | (9,975 | ) | | $ | 25,808 | | | $ | 114,291 | | | $ | 109,310 | |
| | | | | | | | | | | | | | | | |
Basic net (loss) income per share, as reported | | $ | (2.18 | ) | | $ | — | | | $ | (1.77 | ) | | $ | 0.31 | |
Impact of selected items | | | 2.14 | | | | 0.15 | | | | 2.29 | | | | 0.34 | |
| | | | | | | | | | | | | | | | |
Basic net (loss) income per share, excluding selected items | | $ | (0.04 | ) | | $ | 0.15 | | | $ | 0.52 | | | $ | 0.65 | |
| | | | | | | | | | | | | | | | |
Diluted net (loss) income per share, as reported | | $ | (2.18 | ) | | $ | — | | | $ | (1.77 | ) | | $ | 0.31 | |
Impact of selected items | | | 2.14 | | | | 0.15 | | | | 2.26 | | | | 0.33 | |
| | | | | | | | | | | | | | | | |
Diluted net (loss) income per share, excluding selected items | | $ | (0.04 | ) | | $ | 0.15 | | | $ | 0.49 | | | $ | 0.64 | |
| | | | | | | | | | | | | | | | |
(1) | Represents the unrealized (gain) loss associated with the mark-to-market valuation of outstanding derivative positions at December 31, 2008 and 2007. |
(2) | Represents non-cash charges related to vesting of stock based compensation for employees terminated with the Gulf Coast sale. |
(3) | Represents Gulf Coast sale severance, incentive bonus, and vacation payments. |
(4) | Represents non-cash charges related to the write off of debt issue costs in conjunction with decreases in the Company's borrowing base under its senior revolving credit facility. |
(5) | The 2008 amounts include a $64.8 million non-cash deferred income tax adjustment. |