MOODY'S CORPORATION REPORTS RESULTS FOR FOURTH QUARTER AND FULL YEAR 2022; SETS OUTLOOK FOR 2023
| | | | | | | | | | | | | | |
| FOURTH QUARTER AND FULL YEAR SUMMARY FINANCIALS |
| | | | |
Moody’s Corporation
(MCO) Revenue | | Moody’s Investors Service
(MIS) Revenue | | Moody’s Analytics
(MA) Revenue |
| 4Q 2022 | | 4Q 2022 | | 4Q 2022 |
$1.3 billion ⇓ 16% | | $576 million ⇓ 34% | | $714 million ⇑ 7% |
| FY 2022 | | FY 2022 | | FY 2022 |
$5.5 billion ⇓ 12% | | $2.7 billion ⇓ 29% | | $2.8 billion ⇑ 15% |
| | | | |
| MCO Diluted EPS | | MCO Adjusted Diluted EPS1 | | MCO FY 2023 Projected |
| 4Q 2022 | | 4Q 2022 | | Diluted EPS |
$1.34 ⇓ 41% | | $1.60 ⇓ 31% | | $8.05 - $8.55 |
| FY 2022 | | FY 2022 | | Adjusted Diluted EPS1 |
$7.44 ⇓ 37% | | $8.57 ⇓ 30% | | $9.00 - $9.50 |
NEW YORK, NY - January 31, 2023 - Moody's Corporation (NYSE: MCO) today announced results for the fourth quarter and full year 2022, and provided its outlook for full year 2023.
1
| | | | | |
“Throughout 2022, our data, analytics and insights helped our customers navigate one of the more challenging years in recent memory.” “Moody’s Analytics achieved its 60th consecutive quarter of revenue growth, expanded ARR by double-digits and improved its margin. While debt issuance was dampened amidst ongoing macroeconomic uncertainty, Moody’s Investors Service remains the agency of choice for both issuers and investors. For 2023, we project Moody’s revenue to grow in the mid-to-high-single-digit percent range and forecast adjusted diluted EPS in the range of $9.00 to $9.50.” |
Rob Fauber President and Chief Executive Officer |
1 Refer to the tables at the end of this press release for reconciliations of adjusted and organic measures to U.S. GAAP.
| | |
| Moody’s Corporation (MCO) |
| | | | | |
| Fourth Quarter 2022 | Full Year 2022 |
•Revenue declined 16% and 13% on a reported and organic constant currency basis1, respectively, from the prior-year period. •Foreign currency translation unfavorably impacted Moody's revenue by 3%. | •Revenue declined 12% and 13% on a reported and organic constant currency basis1, respectively, from the prior year. •Foreign currency translation unfavorably impacted Moody’s revenue by 3%. |
| | |
| Moody’s Investors Service (MIS) |
| | | | | |
| Fourth Quarter 2022 | Full Year 2022 |
•Revenue declined 34% against a record prior-year period. •Credit market activity remained muted across all sectors due to ongoing market uncertainty, central bank actions, high levels of corporate cash, as well as persistent inflationary and recessionary concerns. •Leveraged loan, high yield bond and structured finance issuance declined sharply from a strong prior-year comparable; revenue was also impacted by an unfavorable issuer mix given the decrease in opportunistic activity. •Foreign currency translation unfavorably impacted MIS revenue by 2%. | •Revenue declined 29% against a record prior year. •In contrast to the conducive issuance environment in 2021, inflationary concerns and geopolitical tensions significantly dampened issuance throughout 2022, particularly for leveraged finance.
•Revenue was also adversely affected by an unfavorable mix within both Corporate Finance and Financial Institutions as fewer infrequent issuers opportunistically came to market. •Foreign currency translation unfavorably impacted MIS revenue by 2%. |
| | | | | |
| Fourth Quarter 2022 | Full Year 2022 |
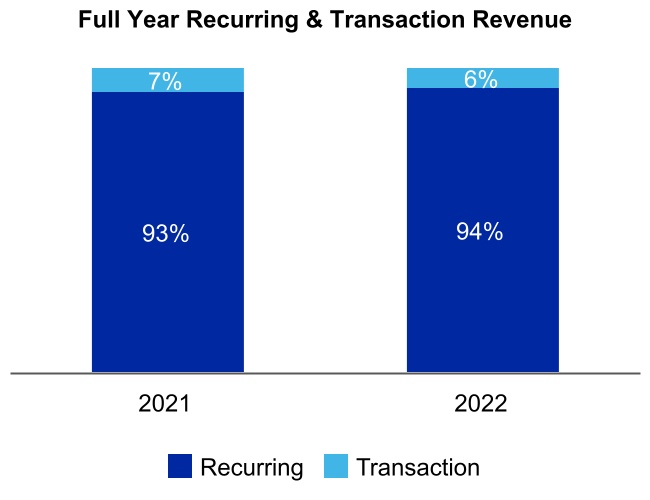
•Revenue and organic constant currency revenue1 growth of 7% and 11%, respectively, driven by strong demand for MA’s award-winning Know Your Customer solutions, as well as credit research, ratings data feeds and insurance actuarial modeling tools. •The impact of foreign currency translation reduced MA revenue growth by 5%. •ARR2 was $2.8 billion, up 10% on mid-90s retention rates, value-based pricing realization, as well as new product launches and enhancements. | •Revenue and organic constant currency revenue1 grew 15% and 10%, respectively. •MA’s recurring revenue now comprises 94% of total MA revenue, up from 93% in the prior year, as the business continues its strategic shift to subscription based solutions. •Mid-90s customer retention rate demonstrates the value proposition of MA’s mission-critical solutions, particularly in an evolving and increasingly complex risk environment. •Foreign currency translation unfavorably impacted MA revenue by 5%, with a notable impact in the Data & Information line of business of 7%. |
| | | | | |
2 Refer to Table 9 at the end of this press release for the definition of and further information on the Annualized Recurring Revenue (ARR) metric. |
Note: FY 2023F guidance as of January 31, 2023. Refer to Table 11 - “2023 Outlook” for a complete list of guidance, as well as assumptions used by the Company with respect to its guidance.
| | | | | |
| Full Year 2022 | Full Year 2023 Forecast |
•Operating expenses grew 6% from the prior year, including 7% from recent acquisitions, primarily RMS. •Recorded $114 million in charges related to personnel and real estate actions pursuant to the 2022 - 2023 Geolocation Restructuring Program. •Lower incentive compensation accruals and ongoing cost control initiatives offset expense growth from ongoing organic investments. •Foreign currency translation favorably impacted operating expenses by 4%. | •Operating expenses projected to increase in the low-single-digit percent range in 2023. •Operating growth includes the impact of employee compensation increases, as well as the reset of incentive compensation funding and ongoing organic investments. •Run-rate cost reductions achieved through the 2022 - 2023 Geolocation Restructuring Program and other expense efficiency initiatives provide incremental capacity for organic investments to capture customer demand in high-priority growth markets.
|
| | |
Operating Margin and Adjusted Operating Margin1 |
| | | | | |
| Fourth Quarter 2022 | Full Year 2022 |
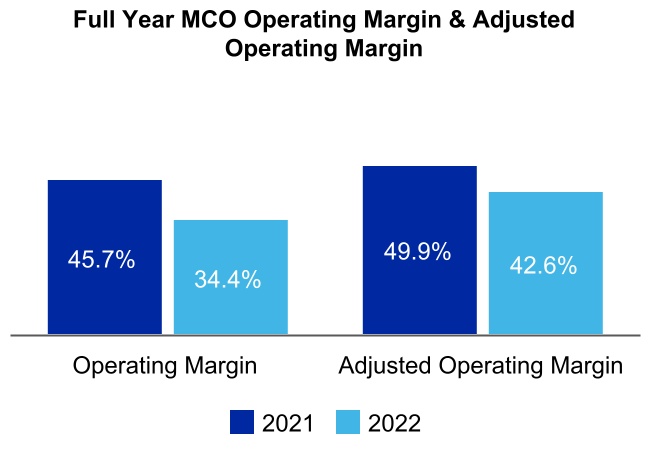
•MCO’s operating margin and adjusted operating margin1 both decreased from the prior-year period. •Decisive expense management actions across the firm and growth in MA’s operating income partially offset the decline in MIS’s revenue given significant issuance weakness, particularly in the leveraged finance markets. •Foreign currency translation had an immaterial impact on MCO’s and MIS’s adjusted operating margins, but unfavorably impacted MA’s adjusted operating margin1 by 70 basis points.
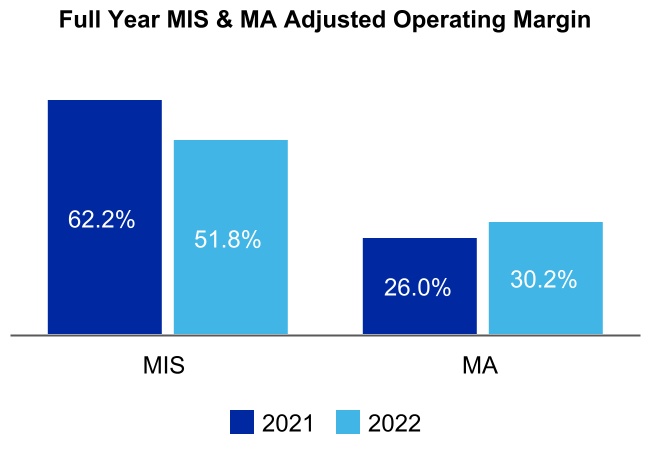
| •MCO’s operating margin and adjusted operating margin1 declined from the prior year as the volatile macroeconomic environment and geopolitical uncertainty significantly impacted global debt issuance. •Recent acquisitions3 and foreign currency translation lowered MA's adjusted operating margin1 by 190 and 80 basis points, respectively. |
| | | | | |
3 Recent acquisitions refers to acquisitions completed during 2021 and 2022. |
| | |
Diluted EPS and Adjusted Diluted EPS1 |
| | | | | |
| Fourth Quarter 2022 | Full Year 2022 |
•The EPS decline from the prior-year period was principally attributed to the decrease in MIS’s revenue, partially offset by continued and growing demand for MA’s global integrated risk assessment offerings and incremental MCO expense reduction initiatives. •The effective tax rate was 24.8%, up from 17.2% in the prior year. The increase was primarily due to the recognition of higher U.S. discrete tax benefits in the fourth quarter of 2021 compared to the current year period. | •Lower EPS than prior year reflected the 34% decline in operating income primarily associated with the decrease in MIS’s revenue, partially offset by growing demand for MA’s global integrated risk assessment offerings. •The effective tax rate was 21.9%, up from 19.6% in the prior year. The increase was primarily due to tax benefits realized upon resolution of uncertain tax positions during 2021 that did not recur to the same extent in 2022 and a non-deductible loss in 2022 associated with the Company no longer conducting commercial operations in Russia. |
| | |
| CAPITAL ALLOCATION AND LIQUIDITY |
| | |
Capital Returned to Shareholders & Free Cash Flow1 |
•Cash flow from operations for 2022 was $1,474 million and free cash flow1 was $1,191 million.
•The decline in free cash flow was driven by lower net income, primarily attributable to the combined impact of geopolitical and macroeconomic uncertainty on debt issuance markets.
•On January 30, 2023, the Board of Directors declared a regular quarterly dividend of $0.77 per share of MCO Common Stock, a 10% increase from the prior quarterly dividend of $0.70 per share. The dividend will be payable on March 17, 2023, to stockholders of record at the close of business on February 24, 2023.
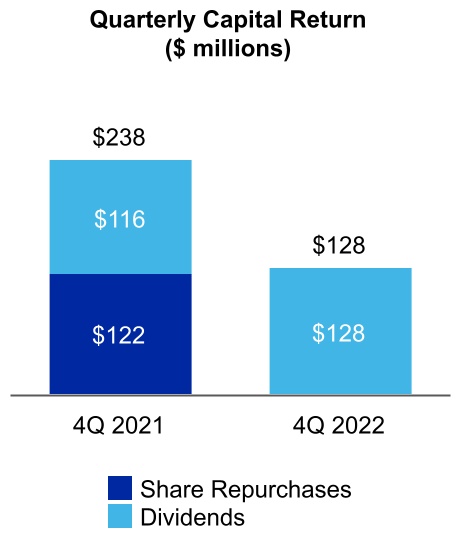
•During the fourth quarter of 2022, Moody’s did not repurchase any shares, and issued net 38,000 shares as part of its employee stock-based compensation programs. The net amount included shares withheld for employee payroll taxes.
•For the full year 2022, Moody’s repurchased 3.1 million shares at an average cost of $312.49 per share, and issued net 0.6 million shares as part of its employee stock-based compensation programs. The net amount included shares withheld for employee payroll taxes.
•As of December 31, 2022, Moody’s had 183.2 million shares outstanding, down 1% from December 31, 2021, and had approximately $848 million of share repurchase authority remaining.
•As of December 31, 2022, Moody's had $7.4 billion of outstanding debt and an undrawn $1.25 billion revolving credit facility.
Moody’s outlook for full year 2023, as of January 31, 2023, reflects assumptions about numerous factors that could affect its business and is based on currently available information reviewed by management through, and as of, today’s date. These assumptions include, but are not limited to, the effects of interest rates, inflation, foreign currency exchange rates, capital markets’ liquidity and activity in different sectors of the debt markets. This outlook also reflects assumptions about general economic conditions, including inflation and related monetary policy actions by governments in response to inflation, global GDP and the impacts resulting from changes in international conditions, including as a result of the conflict in Ukraine, as well as assumptions related to the Company’s own operations and personnel. These assumptions are subject to increased uncertainty due to the current inflationary environment and the conflict in Ukraine. Actual full year 2023 results could differ materially from Moody’s current outlook.
This outlook incorporates various specific macroeconomic assumptions, including:
| | | | | |
| Forecasted Item | Current assumption |
U.S. GDP(1) | 0.0% - 1.0% |
Euro area GDP(1) | (1.0%) - 0.0% |
| Global benchmark rates | Remain elevated, with U.S. Fed funds rate peaking above 5%, followed by rate cuts toward year-end |
| U.S. high yield spreads | Widen toward 600 bps in 1Q 2023, then moderate toward 500 bps by year-end,
with periodic volatility |
| U.S. inflation rate | Averages approximately 5% |
| Euro area inflation rate | Large economies average between 5% and 9%, with considerable variation
among countries |
| U.S. unemployment rate | Rise toward 5% by year-end |
| Global high yield default rate | Rise to approximately 5% by year-end |
| Global MIS rated issuance | Increase in the low-single-digit percent range |
| GBP/USD exchange rate | $1.20 for the full year |
| EUR/USD exchange rate | $1.07 for the full year |
Note: All current assumptions are as of January 31, 2023. (1) GDP represents rate of change in real GDP. |
A full summary of Moody's full year 2023 guidance as of January 31, 2023, is included in Table 11 – “2023 Outlook” at the end of this press release.
| | | | | | | | |
| Date and Time | January 31, 2023, at 12:30 p.m. Eastern Time (ET). |
| Webcast | The webcast and its replay can be accessed through Moody’s Investor Relations website, ir.moodys.com, within “Events & Presentations”. |
| Dial In | U.S. and Canada | ‘+1-888-330-2508 |
| Other callers | ‘+1-240-789-2735 |
| Passcode | 9302427 |
| Dial In Replay | A replay will be available immediately after the call on January 31, 2023, and until March 2, 2023. |
| U.S. and Canada | ‘+1-800-770-2030 |
| Other callers | ‘+1-647-362-9199 |
| Passcode | 9302427 |
| | |
| ABOUT MOODY’S CORPORATION |
Moody’s (NYSE: MCO) is a global integrated risk assessment firm that empowers organizations to make better decisions. Its data, analytical solutions and insights help decision-makers identify opportunities and manage the risks of doing business with others. We believe that greater transparency, more informed decisions, and fair access to information open the door to shared progress. With approximately 14,000 employees in more than 40 countries, Moody’s combines international presence with local expertise and over a century of experience in financial markets. Learn more at moodys.com/about.
| | |
| “SAFE HARBOR” STATEMENT UNDER THE PRIVATE SECURITIES LITIGATION REFORM ACT OF 1995 |
Certain statements contained in this document are forward-looking statements and are based on future expectations, plans and prospects for Moody’s business and operations that involve a number of risks and uncertainties. Such statements involve estimates, projections, goals, forecasts, assumptions and uncertainties that could cause actual results or outcomes to differ materially from those contemplated, expressed, projected, anticipated or implied in the forward-looking statements. Stockholders and investors are cautioned not to place undue reliance on these forward-looking statements. The forward-looking statements and other information in this document are made as of the date hereof, and Moody’s undertakes no obligation (nor does it intend) to publicly supplement, update or revise such statements on a going-forward basis, whether as a result of subsequent developments, changed expectations or otherwise, except as required by applicable law or regulation. In connection with the “safe harbor” provisions of the Private Securities Litigation Reform Act of 1995, Moody’s is identifying certain factors that could cause actual results to differ, perhaps materially, from those indicated by these forward-looking statements. Those factors, risks and uncertainties include, but are not limited to: the impact of general economic conditions, including inflation and related monetary policy actions by governments in response to inflation, on worldwide credit markets and economic activity and its effect on the volume of debt and other securities issued in domestic and/or global capital markets; the global impacts of each of the conflict in Ukraine and COVID-19 on volatility in world financial markets, on general economic conditions and GDP in the U.S. and worldwide, on global relations and on the Company's own operations and personnel; other matters that could affect the volume of debt and other securities issued in domestic and/or global capital markets, including regulation, credit quality concerns, changes in interest rates, inflation and other volatility in the financial markets, as well as the number of issuances of securities without ratings or securities which are rated or evaluated by non-traditional parties; the level of merger and acquisition activity in the U.S. and abroad; the uncertain effectiveness and possible collateral consequences of U.S. and foreign government actions affecting credit markets, international trade and economic policy, including those related to tariffs, tax agreements and trade barriers; the impact of MIS’s withdrawal of its credit ratings on Russian entities and of Moody’s no longer conducting commercial operations in Russia; concerns in the marketplace affecting our credibility or otherwise affecting market perceptions of the integrity or utility of independent credit agency ratings; the introduction of competing products or technologies by other companies; pricing pressure from competitors and/or customers; the level of success of new product development and global expansion; the impact of regulation as an NRSRO, the potential for new U.S., state and local legislation and regulations; the potential for increased competition and regulation in the EU and other foreign jurisdictions; exposure to litigation related to our rating opinions, as well as any other litigation, government and regulatory proceedings, investigations and inquiries to which Moody’s may be subject from time to time; provisions in U.S. legislation modifying the pleading standards and EU regulations modifying the liability standards applicable to credit rating agencies in a manner adverse to credit rating agencies; provisions of EU regulations imposing additional procedural and substantive requirements on the pricing of services and the expansion of supervisory remit to include non-EU ratings used for regulatory purposes; uncertainty regarding the future relationship between the U.S. and China; the possible loss of key employees and the impact of the global labor environment; failures or malfunctions of our operations and infrastructure; any vulnerabilities to cyber threats or other cybersecurity concerns; the timing and effectiveness of our restructuring programs, such as the 2022 - 2023 Geolocation Restructuring Program; currency and foreign exchange volatility; the outcome of any review by controlling tax authorities of Moody’s global tax planning initiatives; exposure to potential criminal sanctions or civil remedies if Moody’s fails to comply with foreign and U.S. laws and regulations that are applicable in the jurisdictions in which Moody’s operates, including data protection and privacy laws, sanctions laws, anti-corruption laws, and local laws prohibiting corrupt payments to government officials; the impact of mergers, acquisitions, such as our acquisition of RMS, or other business combinations and the ability of Moody’s to successfully integrate acquired businesses; the level of future cash flows; the levels of capital investments; and a decline in the demand for credit risk management tools by financial institutions. These factors, risks and uncertainties as well as other risks and uncertainties that could cause Moody’s actual results to differ materially from those contemplated, expressed, projected, anticipated or implied in the forward-looking statements are described in greater detail under “Risk Factors” in Part I, Item 1A of Moody’s annual report on Form 10-K for the year ended December 31, 2021, and in other filings made by the Company from time to time with the SEC or in materials incorporated herein or therein. Stockholders and investors are cautioned that the occurrence of any of these factors, risks and uncertainties may cause the Company’s actual results to differ materially from those contemplated, expressed, projected, anticipated or implied in the forward-looking statements, which could have a material and adverse effect on the Company’s business, results of operations and financial condition. New factors may emerge from time to time, and it is not possible for the Company to predict new factors, nor can the Company assess the potential effect of any new factors on it.
Table 1 - Consolidated Statements of Operations (Unaudited)
| | | | | | | | | | | | | | | | | | | | | | | |
| Three Months Ended December 31, | | Year Ended
December 31, |
| Amounts in millions, except per share amounts | 2022 | | 2021 | | 2022 | | 2021 |
| | | | | | | |
| Revenue | $ | 1,290 | | | $ | 1,539 | | | $ | 5,468 | | | $ | 6,218 | |
| | | | | | | |
| Expenses: | | | | | | | |
| Operating | 410 | | | 485 | | | 1,613 | | | 1,637 | |
| Selling, general and administrative | 403 | | | 465 | | | 1,527 | | | 1,480 | |
| Depreciation and amortization | 89 | | | 77 | | | 331 | | | 257 | |
| Restructuring | 82 | | | (2) | | | 114 | | | — | |
| Total expenses | 984 | | | 1,025 | | | 3,585 | | | 3,374 | |
| | | | | | | |
| Operating income | 306 | | | 514 | | | 1,883 | | | 2,844 | |
| Non-operating (expense) income, net | | | | | | | |
| Interest expense, net | (65) | | | (62) | | | (231) | | | (171) | |
| Other non-operating income, net | 16 | | | 64 | | | 38 | | | 82 | |
| Gain on extinguishment of debt | 70 | | | — | | | 70 | | | — | |
| Total non-operating (expense) income, net | 21 | | | 2 | | | (123) | | | (89) | |
| Income before provision for income taxes | 327 | | | 516 | | | 1,760 | | | 2,755 | |
| Provision for income taxes | 81 | | | 89 | | | 386 | | | 541 | |
| | | | | | | |
| | | | | | | |
| Net income attributable to Moody's Corporation | $ | 246 | | | $ | 427 | | | $ | 1,374 | | | $ | 2,214 | |
| | | | | | | |
| Earnings per share attributable to Moody's common shareholders |
| Basic | $ | 1.34 | | | $ | 2.30 | | | $ | 7.47 | | | $ | 11.88 | |
| Diluted | $ | 1.34 | | | $ | 2.28 | | | $ | 7.44 | | | $ | 11.78 | |
| | | | | | | |
| Weighted average number of shares outstanding |
| Basic | 183.2 | | | 185.8 | | | 183.9 | | | 186.4 | |
| Diluted | 183.9 | | | 187.4 | | | 184.7 | | | 187.9 | |
Table 2 - Condensed Consolidated Balance Sheet Data (Unaudited)
| | | | | | | | | | | |
| Amounts in millions | December 31, 2022 | | December 31, 2021 |
| ASSETS | | | |
| Current assets: | | | |
| Cash and cash equivalents | $ | 1,769 | | | $ | 1,811 | |
| Short-term investments | 90 | | | 91 | |
| Accounts receivable, net of allowance for credit losses of $40 in 2022 and $32 in 2021 | 1,652 | | | 1,720 | |
| Other current assets | 583 | | | 389 | |
| | | |
| Total current assets | 4,094 | | | 4,011 | |
| Property and equipment, net of accumulated depreciation of $1,123 in 2022 and $1,010 in 2021 | 502 | | | 347 | |
| Operating lease right-of-use assets | 346 | | | 438 | |
| Goodwill | 5,839 | | | 5,999 | |
| Intangible assets, net | 2,210 | | | 2,467 | |
| Deferred tax assets, net | 266 | | | 384 | |
| Other assets | 1,092 | | | 1,034 | |
| Total assets | $ | 14,349 | | | $ | 14,680 | |
| LIABILITIES AND SHAREHOLDERS' EQUITY |
| Current liabilities: | | | |
| Accounts payable and accrued liabilities | $ | 1,011 | | | $ | 1,142 | |
| Current portion of operating lease liabilities | 106 | | | 105 | |
| | | |
| | | |
| Deferred revenue | 1,258 | | | 1,249 | |
| | | |
| Total current liabilities | 2,375 | | | 2,496 | |
| Non-current portion of deferred revenue | 75 | | | 86 | |
| Long-term debt | 7,389 | | | 7,413 | |
| Deferred tax liabilities, net | 457 | | | 488 | |
| Uncertain tax positions | 322 | | | 388 | |
| Operating lease liabilities | 368 | | | 455 | |
| Other liabilities | 674 | | | 438 | |
| Total liabilities | 11,660 | | | 11,764 | |
| | | |
|
| | | |
| | | |
| | | |
| | | |
| | | |
| | | |
| | | |
| | | |
| Total Moody's shareholders' equity | 2,519 | | | 2,727 | |
| Noncontrolling interests | 170 | | | 189 | |
| Total shareholders' equity | 2,689 | | | 2,916 | |
| Total liabilities, noncontrolling interests and shareholders' equity | $ | 14,349 | | | $ | 14,680 | |
Table 3 - Non-Operating (Expense) Income, Net (Unaudited)
| | | | | | | | | | | | | | | | | | | | | | | |
| Three Months Ended December 31, | | Year Ended
December 31, |
| Amounts in millions | 2022 | | 2021 | | 2022 | | 2021 |
| Interest: | | | | | | | |
| Expense on borrowings | $ | (64) | | | $ | (56) | | | $ | (216) | | | $ | (185) | |
UTPs and other tax related liabilities (1) | (2) | | | (4) | | | (13) | | | 21 | |
| Net periodic pension costs - interest component | (5) | | | (4) | | | (17) | | | (16) | |
| Income | 6 | | | 2 | | | 15 | | | 9 | |
| Total interest expense, net | $ | (65) | | | $ | (62) | | | $ | (231) | | | $ | (171) | |
| Other non-operating (expense) income, net: | | | | | | | |
FX gain/(loss) (2) | $ | (1) | | | $ | 1 | | | $ | (10) | | | $ | (1) | |
Purchase Price Hedge Loss (3) | — | | | — | | | — | | | (13) | |
| Net periodic pension costs - other components | 6 | | | 4 | | | 24 | | | 9 | |
Income from investments in non-consolidated affiliates (4) | 3 | | | 45 | | | 17 | | | 60 | |
| Other | 8 | | | 14 | | | 7 | | | 27 | |
| Other non-operating income (expense), net | 16 | | | 64 | | | 38 | | | 82 | |
Gain on extinguishment of debt (5) | 70 | | | — | | | 70 | | | — | |
| Total non-operating (expense) income, net | $ | 21 | | | $ | 2 | | | $ | (123) | | | $ | (89) | |
| | |
(1) The amount for the year ended December 31, 2021 includes a $45 million benefit related to the reversal of tax-related interest accruals pursuant to the resolution of outstanding tax matters. (2) The amount for the year ended December 31, 2022 includes $20 million of foreign exchange translation losses reclassified to earnings resulting from the Company no longer conducting commercial operations in Russia. (3) Reflects a loss on a forward contract to hedge a portion of the RMS British pound-denominated purchase price in 2021. (4) The amount for the quarter and year ended December 31, 2021 reflects a $36 million non-cash gain relating to the exchange of Moody’s minority investment in VisibleRisk for shares of BitSight. (5) The gain on extinguishment of debt for the quarter and year ended December 31, 2022 relates to the early redemption of a portion of the 2.55% 2020 Senior Notes, Due 2060. |
Table 4 - Financial Information by Segment (Unaudited)
The table below shows revenue and Adjusted Operating Income by reportable segment. Adjusted Operating Income is a financial metric utilized by the Company’s chief operating decision maker to assess the profitability of each reportable segment.
| | | | | | | | | | | | | | | | | | | | | | | | | | | | | | | | | | | | | | | | | | | | | | | |
| Three Months Ended December 31, |
| 2022 |
| 2021 |
| Amounts in millions | MIS | | MA | | Eliminations | | Consolidated | | MIS | | MA | | Eliminations | | Consolidated |
| Total external revenue | $ | 576 | |
| $ | 714 | |
| $ | — | |
| $ | 1,290 | |
| $ | 871 | |
| $ | 668 | |
| $ | — | |
| $ | 1,539 | |
| Intersegment revenue | 45 | | | 3 | | | (48) | | | — | | | 41 | | | 1 | | | (42) | | | — | |
| Total revenue | 621 | | | 717 | | | (48) | | | 1,290 | | | 912 | | | 669 | | | (42) | | | 1,539 | |
| Operating, SG&A | 347 | | | 514 | | | (48) | | | 813 | | | 423 | | | 569 | | | (42) | |
| 950 | |
| Adjusted Operating Income | $ | 274 | | | $ | 203 | | | $ | — | | | $ | 477 | | | $ | 489 | | | $ | 100 | | | $ | — | | | $ | 589 | |
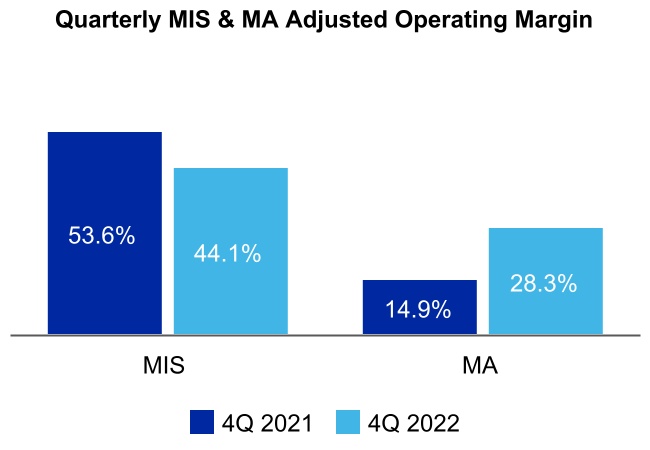
| Adjusted Operating Margin | 44.1 | % | | 28.3 | % | | | | 37.0 | % | | 53.6 | % | | 14.9 | % | | | | 38.3 | % |
| Depreciation and amortization | 21 | |
| 68 | |
| — | |
| 89 | |
| 19 | |
| 58 | |
| — | |
| 77 | |
| Restructuring | 50 | | | 32 | | | — | | | 82 | | | (1) | | | (1) | | | — | | | (2) | |
| Operating income | | | | | | | $ | 306 | | | | | | | | | $ | 514 | |
| Operating margin | | | | | | | 23.7 | % | | | | | | | | 33.4 | % |
| | | | | | | | | | | | | | | |
| Year Ended December 31, |
| 2022 | | 2021 |
| Amounts in millions | MIS | | MA | | Eliminations | | Consolidated | | MIS | | MA | | Eliminations | | Consolidated |
| Total external revenue | $ | 2,699 | | | $ | 2,769 | |
| $ | — | |
| $ | 5,468 | |
| $ | 3,812 | | | $ | 2,406 | | | $ | — | |
| $ | 6,218 | |
| Intersegment revenue | 174 | | | 8 | | | (182) | | | — | | | 165 | | | 7 | | | (172) | | | — | |
| Total revenue | 2,873 | | | 2,777 | | | (182) | | | 5,468 | | | 3,977 | | | 2,413 | | | (172) | | | 6,218 | |
| Operating, SG&A | 1,385 | | | 1,937 | | | (182) | | | 3,140 | | | 1,503 | | | 1,786 | | | (172) | |
| 3,117 | |
| Adjusted Operating Income | $ | 1,488 | | | $ | 840 | | | $ | — | | | $ | 2,328 | | | $ | 2,474 | | | $ | 627 | | | $ | — | | | $ | 3,101 | |
| Adjusted Operating Margin | 51.8 | % | | 30.2 | % | | | | 42.6 | % | | 62.2 | % | | 26.0 | % | | | | 49.9 | % |
| Depreciation and amortization | 81 | |
| 250 | |
| — | |
| 331 | |
| 72 | |
| 185 | |
| — | | | 257 | |
| Restructuring | 65 | | | 49 | | | — | | | 114 | | | (1) | | | 1 | | | — | | | — | |
| Operating income | | | | | | | $ | 1,883 | | | | | | | | | $ | 2,844 | |
| Operating margin | | | | | | | 34.4 | % | | | | | | | | 45.7 | % |
Table 5 - Transaction and Recurring Revenue (Unaudited)
The following tables summarize the split between transaction and recurring revenue. In the MIS segment, excluding MIS Other, transaction revenue represents the initial rating of a new debt issuance, as well as other one-time fees, while recurring revenue represents the recurring monitoring fees of a rated debt obligation and/or entities that issue such obligations, as well as revenue from programs such as commercial paper, medium-term notes and shelf registrations. In MIS Other, transaction revenue represents revenue from professional services and recurring revenue represents subscription-based revenue. In the MA segment, recurring revenue represents subscription-based revenue and software maintenance revenue. Transaction revenue in MA represents perpetual software license fees and revenue from software implementation services, risk management advisory projects, and training and certification services.
| | | | | | | | | | | | | | | | | | | | | | | | | | | | | | | | | | | | |
| | Three Months Ended December 31, |
| | 2022 | | 2021 |
| Amounts in millions | | Transaction | | Recurring | | Total | | Transaction | | Recurring | | Total |
| Corporate Finance | | $ | 127 | |
| $ | 126 | | | $ | 253 | | | $ | 320 | | | $ | 124 | | | $ | 444 | |
| | 50 | % | | 50 | % | | 100 | % | | 72 | % | | 28 | % | | 100 | % |
| Structured Finance | | $ | 45 | | | $ | 49 | | | $ | 94 | | | $ | 111 | | | $ | 50 | | | $ | 161 | |
| | 48 | % | | 52 | % | | 100 | % | | 69 | % | | 31 | % | | 100 | % |
| Financial Institutions | | $ | 52 | | | $ | 71 | | | $ | 123 | | | $ | 68 | | | $ | 69 | | | $ | 137 | |
| | 42 | % | | 58 | % | | 100 | % | | 50 | % | | 50 | % | | 100 | % |
| Public, Project and Infrastructure Finance | | $ | 52 | | | $ | 42 | | | $ | 94 | | | $ | 78 | | | $ | 40 | | | $ | 118 | |
| | 55 | % | | 45 | % | | 100 | % | | 66 | % | | 34 | % | | 100 | % |
| MIS Other | | $ | 1 | | | $ | 11 | | | $ | 12 | | | $ | 1 | | | $ | 10 | | | $ | 11 | |
| | 8 | % | | 92 | % | | 100 | % | | 9 | % | | 91 | % | | 100 | % |
| Total MIS | | $ | 277 | | | $ | 299 | | | $ | 576 | | | $ | 578 | | | $ | 293 | | | $ | 871 | |
| | 48 | % | | 52 | % | | 100 | % | | 66 | % | | 34 | % | | 100 | % |
| | | | | | | | | | | | |
| Decision Solutions | | $ | 44 | | | $ | 309 | | | $ | 353 | | | $ | 47 | | | $ | 267 | | | $ | 314 | |
| | 12 | % | | 88 | % | | 100 | % | | 15 | % | | 85 | % | | 100 | % |
| Research & Insights | | $ | 2 | | | $ | 179 | | | $ | 181 | | | $ | 2 | | | $ | 172 | | | $ | 174 | |
| | 1 | % | | 99 | % | | 100 | % | | 1 | % | | 99 | % | | 100 | % |
| Data & Information | | $ | — | | | $ | 180 | | | $ | 180 | | | $ | 1 | | | $ | 179 | | | $ | 180 | |
| | — | % | | 100 | % | | 100 | % | | 1 | % | | 99 | % | | 100 | % |
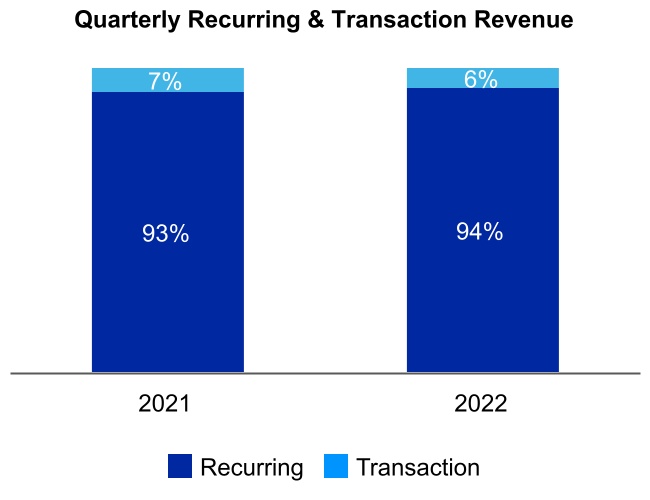
| Total MA | | $ | 46 | | | $ | 668 | | | $ | 714 | | | $ | 50 | | | $ | 618 | | | $ | 668 | |
| | 6 | % | | 94 | % | | 100 | % | | 7 | % | | 93 | % | | 100 | % |
| | | | | | | | | | | | |
| Total Moody's Corporation | | $ | 323 | | | $ | 967 | | | $ | 1,290 | | | $ | 628 | | | $ | 911 | | | $ | 1,539 | |
| | 25 | % | | 75 | % | | 100 | % | | 41 | % | | 59 | % | | 100 | % |
Table 5 - Transaction and Recurring Revenue (Unaudited) Continued
| | | | | | | | | | | | | | | | | | | | | | | | | | | | | | | | | | | | |
| | Year Ended December 31, |
| | 2022 | | 2021 |
| Amounts in millions | | Transaction | | Relationship | | Total | | Transaction | | Relationship | | Total |
| Corporate Finance | | $ | 772 | | | $ | 497 | | | $ | 1,269 | | | $ | 1,600 | | | $ | 487 | | | $ | 2,087 | |
| | 61 | % |
| 39 | % |
| 100 | % |
| 77 | % | | 23 | % | | 100 | % |
| Structured Finance | | $ | 262 | |
| $ | 200 | | | $ | 462 | | | $ | 362 | | | $ | 198 | | | $ | 560 | |
| | 57 | % | | 43 | % | | 100 | % | | 65 | % | | 35 | % | | 100 | % |
| Financial Institutions | | $ | 211 | |
| $ | 280 | | | $ | 491 | | | $ | 320 | | | $ | 282 | | | $ | 602 | |
| | 43 | % | | 57 | % | | 100 | % | | 53 | % | | 47 | % | | 100 | % |
| Public, Project and Infrastructure Finance | | $ | 263 | |
| $ | 168 | | | $ | 431 | | | $ | 354 | | | $ | 167 | | | $ | 521 | |
| | 61 | % | | 39 | % | | 100 | % | | 68 | % | | 32 | % | | 100 | % |
| MIS Other | | $ | 4 | |
| $ | 42 | | | $ | 46 | | | $ | 4 | | | $ | 38 | | | $ | 42 | |
| | 9 | % | | 91 | % | | 100 | % | | 10 | % | | 90 | % | | 100 | % |
| Total MIS | | $ | 1,512 | |
| $ | 1,187 | | | $ | 2,699 | | | $ | 2,640 | | | $ | 1,172 | | | $ | 3,812 | |
| | 56 | % | | 44 | % | | 100 | % | | 69 | % | | 31 | % | | 100 | % |
| | | | | | | | | | | | |
| Decision Solutions | | $ | 164 | | | $ | 1,160 | | | $ | 1,324 | | | $ | 158 | | | $ | 853 | | | $ | 1,011 | |
| | 12 | % | | 88 | % | | 100 | % | | 16 | % | | 84 | % | | 100 | % |
| Research & Insights | | $ | 6 | | | $ | 727 | | | $ | 733 | | | $ | 8 | | | $ | 689 | | | $ | 697 | |
| | 1 | % | | 99 | % | | 100 | % | | 1 | % | | 99 | % | | 100 | % |
| Data & Information | | $ | — | | | $ | 712 | | | $ | 712 | | | $ | 4 | | | $ | 694 | | | $ | 698 | |
| | — | % | | 100 | % | | 100 | % | | 1 | % | | 99 | % | | 100 | % |
| Total MA | | $ | 170 | |
| $ | 2,599 | | | $ | 2,769 | | | $ | 170 | | | $ | 2,236 | | | $ | 2,406 | |
| | 6 | % | | 94 | % | | 100 | % | | 7 | % | | 93 | % | | 100 | % |
| | | | | | | | | | | | |
| Total Moody's Corporation | | $ | 1,682 | | | $ | 3,786 | | | $ | 5,468 | | | $ | 2,810 | | | $ | 3,408 | | | $ | 6,218 | |
| | 31 | % | | 69 | % | | 100 | % | | 45 | % | | 55 | % | | 100 | % |
Table 6 - Adjusted Operating Income and Adjusted Operating Margin (Unaudited)
The Company presents Adjusted Operating Income and Adjusted Operating Margin because management deems these metrics to be useful measures to provide additional perspective on Moody's operating performance. Adjusted Operating Income excludes the impact of: i) depreciation and amortization; and ii) restructuring charges/adjustments. Depreciation and amortization are excluded because companies utilize productive assets of different estimated useful lives and use different methods of acquiring and depreciating productive assets. Restructuring charges/adjustments are excluded as the frequency and magnitude of these charges may vary widely across periods and companies.
Management believes that the exclusion of the aforementioned items, as detailed in the reconciliation below, allows for an additional perspective on the Company’s operating results from period to period and across companies. The Company defines Adjusted Operating Margin as Adjusted Operating Income divided by revenue.
| | | | | | | | | | | | | | | | | | | | | | | |
| Three Months Ended December 31, | | Year Ended December 31, |
| Amounts in millions | 2022 | | 2021 | | 2022 | | 2021 |
| Operating income | $ | 306 | | | $ | 514 | | | $ | 1,883 | | | $ | 2,844 | |
| Depreciation and amortization | 89 | | | 77 | | | 331 | | | 257 | |
| Restructuring | 82 | | | (2) | | | 114 | | | — | |
| Adjusted Operating Income | $ | 477 | | | $ | 589 | | | $ | 2,328 | | | $ | 3,101 | |
| Operating margin | 23.7 | % | | 33.4 | % | | 34.4 | % | | 45.7 | % |
| Adjusted Operating Margin | 37.0 | % | | 38.3 | % | | 42.6 | % | | 49.9 | % |
Table 7 - Free Cash Flow (Unaudited)
The Company defines Free Cash Flow as net cash provided by operating activities minus payments for capital additions. Management believes that Free Cash Flow is a useful metric in assessing the Company’s cash flows to service debt, pay dividends and to fund acquisitions and share repurchases. Management deems capital expenditures essential to the Company’s product and service innovations and maintenance of Moody’s operational capabilities. Accordingly, capital expenditures are deemed to be a recurring use of Moody’s cash flow. Below is a reconciliation of the Company’s net cash flows from operating activities to Free Cash Flow:
| | | | | | | | | | | |
| Year Ended December 31, |
| Amounts in millions | 2022 | | 2021 |
| Net cash provided by operating activities | $ | 1,474 | | | $ | 2,005 | |
| Capital additions | (283) | | | (139) | |
| Free Cash Flow | $ | 1,191 | | | $ | 1,866 | |
| Net cash used in investing activities | $ | (262) | | | $ | (2,619) | |
| Net cash used in financing activities | $ | (1,208) | | | $ | (122) | |
Table 8 - Organic Constant Currency Revenue Growth (Decline) /
Constant Currency Revenue Growth (Decline) (Unaudited)
Beginning in the second quarter of 2022, the Company began presenting organic constant currency revenue growth (decline) and constant currency revenue growth (decline) as its non-GAAP measure of revenue growth (decline). Previously, the Company presented organic revenue growth (decline), which excluded only the impact of certain acquisition activity. Management deems this revised measure to be useful in providing additional perspective in assessing the Company's revenue growth (decline) excluding both the inorganic revenue impacts from certain acquisition activity and the impacts of changes in foreign exchange rates. The Company calculates the dollar impact of foreign exchange as the difference between the translation of its current period non-USD functional currency results using comparative prior period weighted average foreign exchange translation rates and current year reported results.
Below is a reconciliation of the Company's reported revenue and growth (decline) rates to its organic constant currency revenue growth (decline) and constant currency revenue growth (decline) measures:
| | | | | | | | | | | | | | | | | | | | | | | | | | | | | | | | | | | | | | | | | | | | | | | | |
| | Three Months Ended December 31, | | Year Ended December 31, |
| Amounts in millions | | 2022 | | 2021 | | Change | | Growth | | 2022 | | 2021 | | Change | | Growth |
| MCO revenue | | $ | 1,290 | | | $ | 1,539 | | | $ | (249) | | | (16)% | | $ | 5,468 | | | $ | 6,218 | | | $ | (750) | | | (12)% |
| FX impact | | 51 | | | — | | | 51 | | | | | 193 | | | — | | | 193 | | | |
| Inorganic revenue from acquisitions | | (4) | | | — | | | (4) | | | | | (236) | | | — | | | (236) | | | |
| Organic constant currency MCO revenue | | $ | 1,337 | | | $ | 1,539 | | | $ | (202) | | | (13)% | | $ | 5,425 | | | $ | 6,218 | | | $ | (793) | | | (13)% |
| | | | | | | | | | | | | | | | |
| | | | | | | | | | | | | | | | |
| | | | | | | | | | | | | | | | |
| | | | | | | | | | | | | | | | |
| | | | | | | | | | | | | | | | |
| | | | | | | | | | | | | | | | |
| MA revenue | | $ | 714 | | | $ | 668 | | | $ | 46 | | | 7% | | $ | 2,769 | | | $ | 2,406 | | | $ | 363 | | | 15% |
| FX impact | | 32 | | | — | | | 32 | | | | | 113 | | | — | | | 113 | | | |
| Inorganic revenue from acquisitions | | (4) | | | — | | | (4) | | | | | (236) | | | — | | | (236) | | | |
| Organic constant currency MA revenue | | $ | 742 | | | $ | 668 | | | $ | 74 | | | 11% | | $ | 2,646 | | | $ | 2,406 | | | $ | 240 | | | 10% |
| | | | | | | | | | | | | | | | |
| | | | |
| | | | | | | | | | | | | | | | |
| Decision Solutions revenue | | $ | 353 | | | $ | 314 | | | $ | 39 | | | 12% | | $ | 1,324 | | | $ | 1,011 | | | $ | 313 | | | 31% |
| FX impact | | 12 | | | — | | | 12 | | | | | 40 | | | — | | | 40 | | | |
| Inorganic revenue from acquisitions | | (4) | | | — | | | (4) | | | | | (234) | | | — | | | (234) | | | |
| Organic constant currency Decision Solutions revenue | | $ | 361 | | | $ | 314 | | | $ | 47 | | | 15% | | $ | 1,130 | | | $ | 1,011 | | | $ | 119 | | | 12% |
| | | | | | | | | | | | | | | | |
| | | | |
| | | | | | | | | | | | | | | | |
| Research and Insights revenue | | $ | 181 | | | $ | 174 | | | $ | 7 | | | 4% | | $ | 733 | | | $ | 697 | | | $ | 36 | | | 5% |
| FX impact | | 6 | | | — | | | 6 | | | | | 21 | | | — | | | 21 | | | |
| | | | | | | | | | | | | | | | |
| Constant currency Research and Insights revenue | | $ | 187 | | | $ | 174 | | | $ | 13 | | | 7% | | $ | 754 | | | $ | 697 | | | $ | 57 | | | 8% |
| | | | | | | | | | | | | | | | |
| | | | |
| | | | | | | | | | | | | | | | |
| Data and Information revenue | | $ | 180 | | | $ | 180 | | | $ | — | | | —% | | $ | 712 | | | $ | 698 | | | $ | 14 | | | 2% |
| FX impact | | 14 | | | — | | | 14 | | | | | 52 | | | — | | | 52 | | | |
| Inorganic revenue from acquisitions | | — | | | — | | | — | | | | | (2) | | | — | | | (2) | | | |
| Organic constant currency Data and Information revenue | | $ | 194 | | | $ | 180 | | | $ | 14 | | | 8% | | $ | 762 | | | $ | 698 | | | $ | 64 | | | 9% |
| | | | | | | | | | | | | | | | |
| | | | | | | | | | |
| | | | | | | | | | | | | | | | |
| | | | | | | | | | | | | | | | |
| | | | | | | | | | | | | | | | |
| | | | | | | | | | | | | | | | |
| | | | | | | | | | | | | | | | |
| | | | | | | | | | | | | | | | |
| | | | | | | | | | |
| | | | | | | | | | | | | | | | |
| | | | | | | | | | | | | | | | |
| | | | | | | | | | | | | | | | |
| | | | | | | | | | | | | | | | |
| | | | | | | | | | | | | | | | |
| | | | | | | | | | | | | | | | |
| | | | |
| | | | | | | | | | | | | | | | |
| MA recurring revenue | | $ | 668 | | | $ | 618 | | | $ | 50 | | | 8% | | $ | 2,599 | | | $ | 2,236 | | | $ | 363 | | | 16% |
| FX impact | | 31 | | | — | | | 31 | | | | | 108 | | | — | | | 108 | | | |
| Inorganic recurring revenue from acquisitions | | (3) | | | — | | | (3) | | | | | (223) | | | — | | | (223) | | | |
| Organic constant currency MA recurring revenue | | $ | 696 | | | $ | 618 | | | $ | 78 | | | 13% | | $ | 2,484 | | | $ | 2,236 | | | $ | 248 | | | 11% |
| | | | | | | | | | | | | | | | |
| | | | | | | | | | | | | | | | |
| | | | | | | | | | | | | | | | |
| | | | | | | | | | | | | | | | |
Table 9 - Key Performance Metrics - Annualized Recurring Revenue (Unaudited)
The Company presents Annualized Recurring Revenue (“ARR”) on a constant currency organic basis for its MA business as a supplemental performance metric to provide additional insight on the estimated value of MA's recurring revenue contracts at a given point in time. The Company uses ARR to manage and monitor performance of its MA operating segment and believes that this metric is a key indicator of the trajectory of MA's recurring revenue base.
The Company calculates ARR by taking the total recurring contract value for each active renewable contract as of the reporting date, divided by the number of days in the contract and multiplied by 365 days to create an annualized value. The Company defines renewable contracts as subscriptions, term licenses, maintenance and renewable services. ARR excludes transaction sales including training, one-time services and perpetual licenses. In order to compare period-over-period ARR excluding the effects of foreign currency translation, the Company bases the calculation on currency rates utilized in its current year operating budget and holds these FX rates constant for the duration of all current and prior periods being reported. Additionally, ARR excludes contracts related to acquisitions to provide additional perspective in assessing growth excluding the impacts from certain acquisition activity.
The Company’s definition of ARR may differ from definitions utilized by other companies reporting similarly named measures, and this metric should be viewed in addition to, and not as a substitute for, financial measures presented in accordance with U.S. GAAP.
| | | | | | | | | | | | | | | | | | | | | | | |
| Amounts in millions | December 31, 2022 | | December 31, 2021 | | Change | | Growth |
| MA ARR | | | | | | | |
| Decision Solutions | $ | 1,235 | | | $ | 1,110 | | | $ | 125 | | | 11% |
| Research and Insights | 770 | | | 707 | | | 63 | | | 9% |
| Data and Information | 768 | | | 705 | | | 63 | | | 9% |
| Total MA ARR | $ | 2,773 | | | $ | 2,522 | | | $ | 251 | | | 10% |
| | | | | | | |
Table 10 - Adjusted Net Income and Adjusted Diluted EPS Attributable to Moody's Common Shareholders (Unaudited)
The Company presents Adjusted Net Income and Adjusted Diluted EPS because management deems these metrics to be useful measures to provide additional perspective on Moody's operating performance. Adjusted Net Income and Adjusted Diluted EPS exclude the impact of: i) amortization of acquired intangible assets; ii) restructuring charges/adjustments; iii) a gain on the extinguishment of debt; iv) FX translation losses reclassified to earnings resulting from the Company no longer conducting commercial operations in Russia; and v) a non-cash gain relating to the Company’s minority investment in BitSight.
The Company excludes the impact of amortization of acquired intangible assets as companies utilize intangible assets with different estimated useful lives and have different methods of acquiring and amortizing intangible assets. These intangible assets were recorded as part of acquisition accounting and contribute to revenue generation. The amortization of intangible assets related to acquisitions will recur in future periods until such intangible assets have been fully amortized. Furthermore, the timing and magnitude of business combination transactions are not predictable, and the purchase price allocated to amortizable intangible assets and the related amortization period are unique to each acquisition and can vary significantly from period to period and across companies. Restructuring charges/adjustments, the gain on extinguishment of debt, FX translation losses reclassified to earnings resulting from the Company no longer conducting commercial operations in Russia and the non-cash gain relating to the Company's minority interest in BitSight are excluded as the frequency and magnitude of these items may vary widely across periods and companies.
The Company excludes the aforementioned items to provide additional perspective when comparing net income and diluted EPS from period to period and across companies as the frequency and magnitude of similar transactions may vary widely across periods.
Below is a reconciliation of these measures to their most directly comparable U.S. GAAP measures:
| | | | | | | | | | | | | | | | | | | | | | | | | | | | | | | | | | | |
| Three Months Ended December 31, | | Year Ended December 31, |
| Amounts in millions | 2022 | | 2021 | | 2022 | | 2021 |
| Net income attributable to Moody's common shareholders | | $ | 246 | | | | $ | 427 | | | | $ | 1,374 | | | | $ | 2,214 | |
| Pre-tax Acquisition-Related Intangible Amortization Expenses | $ | 50 | | | | $ | 50 | | | | $ | 200 | | | | $ | 158 | | |
| Tax on Acquisition-Related Intangible Amortization Expenses | (12) | | | | (12) | | | | (47) | | | | (36) | | |
| Net Acquisition-Related Intangible Amortization Expenses | | 38 | | | | 38 | | | | 153 | | | | 122 | |
| Pre-tax restructuring | $ | 82 | | | | $ | (2) | | | | $ | 114 | | | | $ | — | | |
| Tax on restructuring | (18) | | | | — | | | | (26) | | | | — | | |
| Net restructuring | | 64 | | | | (2) | | | | 88 | | | | — | |
| Pre-tax gain on extinguishment of debt | $ | (70) | | | | $ | — | | | | $ | (70) | | | | $ | — | | |
| Tax on gain on extinguishment of debt | 17 | | | | — | | | | 17 | | | | — | | |
| Net gain on extinguishment of debt | | (53) | | | | — | | | | (53) | | | | — | |
| FX losses resulting from the Company no longer conducting commercial operations in Russia | | — | | | | — | | | | 20 | | | | — | |
| Pre-tax non-cash gain relating to minority investment in BitSight | $ | — | | | | $ | (36) | | | | $ | — | | | | $ | (36) | | |
| Tax on non-cash gain relating to minority investment in BitSight | — | | | | 9 | | | | — | | | | 9 | | |
| Net non-cash gain relating to minority investment in BitSight | | — | | | | (27) | | | | — | | | | (27) | |
| Adjusted Net Income | | $ | 295 | | | | $ | 436 | | | | $ | 1,582 | | | | $ | 2,309 | |
| | | | | | | | | | | |
| | | | | | | | | | | | | | |
| Note: The tax impacts in the table above were calculated using tax rates in effect in the jurisdiction for which the item relates. |
Table 10 - Adjusted Net Income and Adjusted Diluted EPS Attributable to Moody's Common Shareholders (Unaudited) Continued
| | | | | | | | | | | | | | | | | | | | | | | | | | | | | | | | | | | |
| Three Months Ended December 31, | | Year Ended December 31, |
| Amounts in millions | 2022 | | 2021 | | 2022 | | 2021 |
| Diluted earnings per share attributable to Moody's common shareholders | | $ | 1.34 | | | | $ | 2.28 | | | | $ | 7.44 | | | | $ | 11.78 | |
| Pre-tax Acquisition-Related Intangible Amortization Expenses | $ | 0.27 | | | | $ | 0.27 | | | | $ | 1.08 | | | | $ | 0.84 | | |
| Tax on Acquisition-Related Intangible Amortization Expenses | (0.07) | | | | (0.07) | | | | (0.25) | | | | (0.19) | | |
| Net Acquisition-Related Intangible Amortization Expenses | | 0.20 | | | | 0.20 | | | | 0.83 | | | | 0.65 | |
| Pre-tax restructuring | $ | 0.45 | | | | $ | (0.01) | | | | $ | 0.62 | | | | $ | — | | |
| Tax on restructuring | (0.10) | | | | — | | | | (0.14) | | | | — | | |
| Net restructuring | | 0.35 | | | | (0.01) | | | | 0.48 | | | | — | |
| Pre-Tax gain on extinguishment of debt | $ | (0.38) | | | | $ | — | | | | $ | (0.38) | | | | $ | — | | |
| Tax on gain on extinguishment of debt | 0.09 | | | | — | | | | 0.09 | | | | — | | |
| Net gain on extinguishment of debt | | (0.29) | | | | — | | | | (0.29) | | | | — | |
| FX losses resulting from the Company no longer conducting commercial operations in Russia | | — | | | | — | | | | 0.11 | | | | — | |
| Pre-Tax non-cash gain relating to minority investment in BitSight | $ | — | | | | $ | (0.19) | | | | $ | — | | | | $ | (0.19) | | |
| Tax on non-cash gain relating to minority investment in BitSight | — | | | | 0.05 | | | | — | | | | 0.05 | | |
| Net non-cash gain relating to minority investment in BitSight | | — | | | | (0.14) | | | | — | | | | (0.14) | |
| | | | | | | | | | | |
| | | | | | | | | | | |
| | | | | | | | | | | |
| Adjusted Diluted EPS | | $ | 1.60 | | | | $ | 2.33 | | | | $ | 8.57 | | | | $ | 12.29 | |
| | | | | | | | | | | |
| | |
| Note: The tax impacts in the table above were calculated using tax rates in effect in the jurisdiction for which the item relates. |
Table 11 - 2023 Outlook
Moody’s outlook for full year 2023, as of January 31, 2023, reflects assumptions about numerous factors that could affect its business and is based on currently available information reviewed by management through, and as of, today’s date. This outlook does not include the effects of any possible resolution of material uncertain tax positions. For a complete list of these assumptions, please refer to “Assumptions and Outlook” on page 10 of this earnings release. | | | | | |
| Full Year 2023 Moody's Corporation Guidance as of January 31, 2023 |
| MOODY'S CORPORATION | Current guidance |
| Revenue | Increase in the mid-to-high-single-digit percent range |
| Operating expenses | Increase in the low-single-digit percent range |
| Operating margin | Approximately 37% |
Adjusted Operating Margin (1) | 44% to 45% |
| Interest expense, net | $290 to $310 million |
| Effective tax rate | 20% to 22% |
| Diluted EPS | $8.05 to $8.55 |
Adjusted Diluted EPS (1) | $9.00 to $9.50 |
| Operating cash flow | $1.7 to $1.9 billion |
Free Cash Flow (1) | $1.4 to $1.6 billion |
| Share repurchases | Approximately $250 million
(subject to available cash, market conditions, M&A opportunities and other ongoing capital allocation decisions) |
| Moody's Investors Service (MIS) | Current guidance |
| MIS global revenue | Increase in the low-to-mid-single-digit percent range |
| MIS Adjusted Operating Margin | Mid-50s percent range |
| Moody's Analytics (MA) | Current guidance |
| MA global revenue | Increase of approximately 10% |
ARR (2) | Increase in the low-double-digit percent range |
| MA Adjusted Operating Margin | Approximately 31% |
(1) These metrics are adjusted measures. See below for reconciliation of these measures to their comparable U.S. GAAP measure. (2) Refer to Table 9 within this earnings release for the definition of and further information on the ARR metric. |
Table 11 - 2023 Outlook Continued
The following are reconciliations of the Company's adjusted forward looking measures to their comparable U.S. GAAP measure:
| | | | | |
| Projected for the Year Ended
December 31, 2023 |
| Operating margin guidance | Approximately 37% |
| Depreciation and amortization | Approximately 7% |
| Restructuring Expense | Approximately 0.5% |
| Adjusted Operating Margin guidance | 44% to 45% |
| |
| Projected for the Year Ended
December 31, 2023 |
| Operating cash flow guidance | $1.7 to $1.9 billion |
| Less: Capital expenditures | Approximately $0.3 billion |
| Free Cash Flow guidance | $1.4 to $1.6 billion |
| |
| Projected for the Year Ended
December 31, 2023 |
| Diluted EPS guidance | $8.05 to $8.55 |
| Acquisition-Related Intangible Amortization | Approximately $0.85 |
| Restructuring | Approximately $0.10 |
| Adjusted Diluted EPS guidance | $9.00 to $9.50 |