MOODY'S CORPORATION REPORTS RESULTS FOR FOURTH QUARTER AND FULL YEAR 2023; SETS OUTLOOK FOR 2024
NEW YORK, NY - February 13, 2024 - Moody's Corporation (NYSE: MCO) today announced results for the fourth quarter and full year 2023, and provided its outlook for full year 2024.
| | | | | | | | | | | | | | |
| FOURTH QUARTER AND FULL YEAR SUMMARY FINANCIALS |
| | | | |
Moody’s Corporation
(MCO) Revenue | | Moody’s Analytics
(MA) Revenue | | Moody’s Investors Service
(MIS) Revenue |
| 4Q 2023 | | 4Q 2023 | | 4Q 2023 |
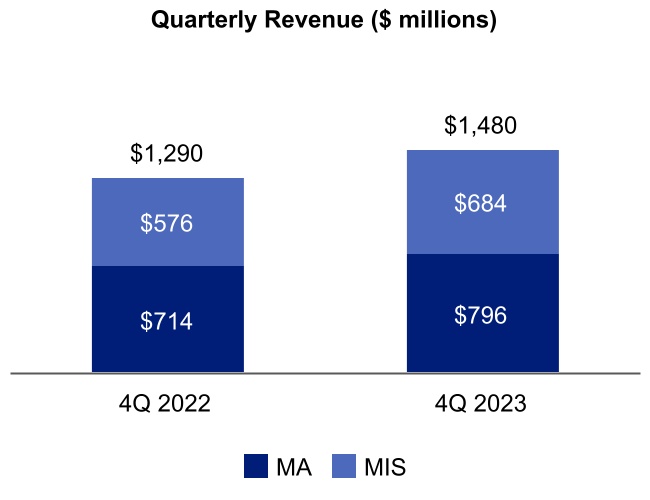
$1.5 billion ⇑ 15% | | $796 million ⇑ 11% | | $684 million ⇑ 19% |
| FY 2023 | | FY 2023 | | FY 2023 |
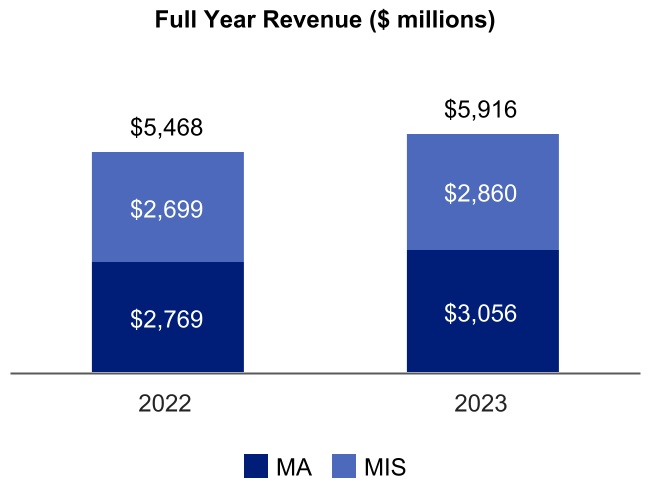
$5.9 billion ⇑ 8% | | $3.1 billion ⇑ 10% | | $2.9 billion ⇑ 6% |
| | | | |
| MCO Diluted EPS | | MCO Adjusted Diluted EPS1 | | MCO FY 2024 Projected |
| 4Q 2023 | | 4Q 2023 | | Diluted EPS |
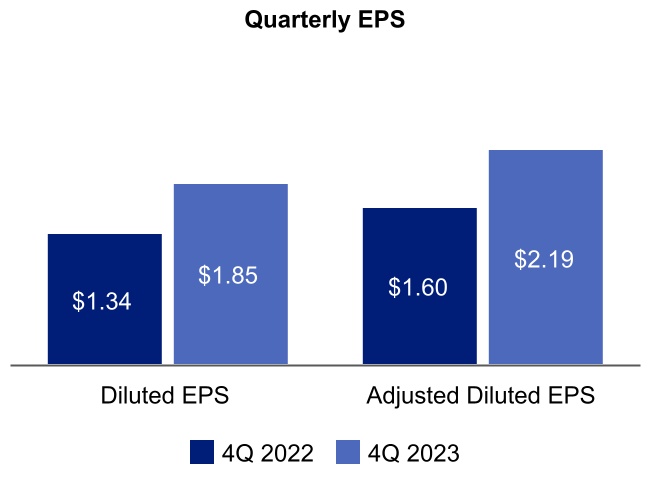
$1.85 ⇑ 38% | | $2.19 ⇑ 37% | | $9.45 to $10.20 |
| | | | |
| | | | |
| | | | |
| FY 2023 | | FY 2023 | | Adjusted Diluted EPS1 |
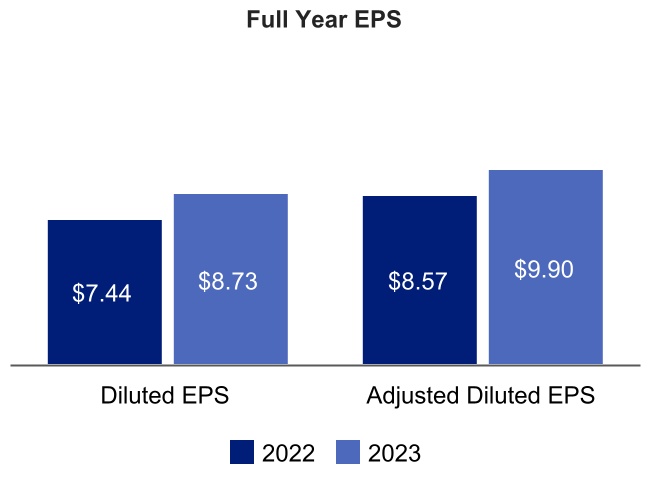
$8.73 ⇑ 17% | | $9.90 ⇑ 16% | | $10.25 to $11.00 |
| | | | |
| | | | | |
| “2023 was a year of tremendous progress for Moody's. We accelerated our pace of innovation, partnered with industry leaders, and produced best-in-class solutions for our customers, setting the foundation for future success. Moody’s continued to deliver strong financial performance, achieving revenue of $5.9 billion, up 8% from 2022. We are excited about the opportunities ahead of us as we harness the power of generative AI while investing for growth to create value for our stakeholders.” |
Rob Fauber President and Chief Executive Officer |
| | | | | |
1 Refer to the tables at the end of this press release for reconciliations of adjusted and constant currency measures to U.S. GAAP. |
| | |
| Moody’s Corporation (MCO) |
| | | | | | | | |
| Fourth Quarter 2023 | | Full Year 2023 |
•Revenue increased 15%, or 13% on a constant currency basis1, from the prior-year period. •MA’s revenue grew 11%, or 10% on a constant currency basis1, from the prior-year period, with all lines of business achieving double-digit revenue growth. •MIS’s revenue grew 19%, or 17% on a constant currency basis1, from the prior-year period, as debt capital markets continued to recover and the outlook for macroeconomic conditions improved.
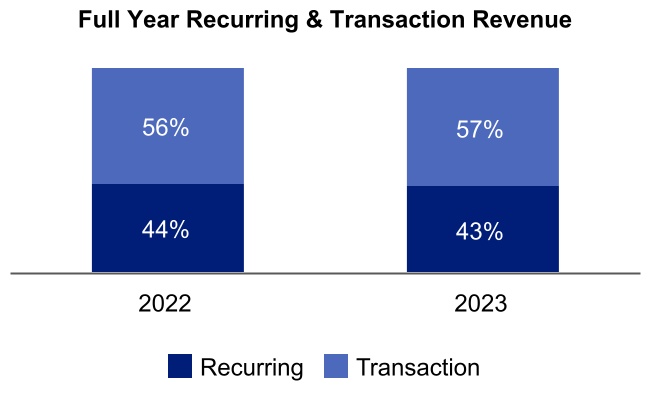
| | •Revenue increased to $5.9 billion, up 8% from the prior year. •MA’s revenue grew 10% from the prior year, to over $3 billion, now representing 52% of MCO’s total revenue. •MIS’s revenue grew 6% as markets stabilized and issuers acclimatized to the higher interest rate environment. •Foreign currency exchange had an immaterial impact on MCO, MA and MIS’s revenues. |
| | | | | | | | |
| Fourth Quarter 2023 | | Full Year 2023 |
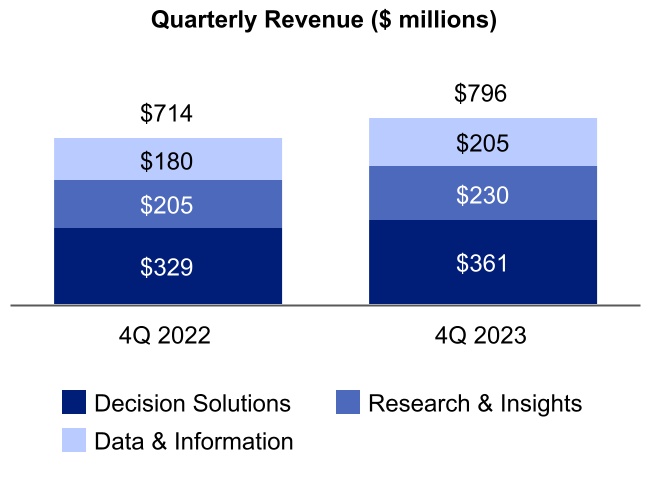
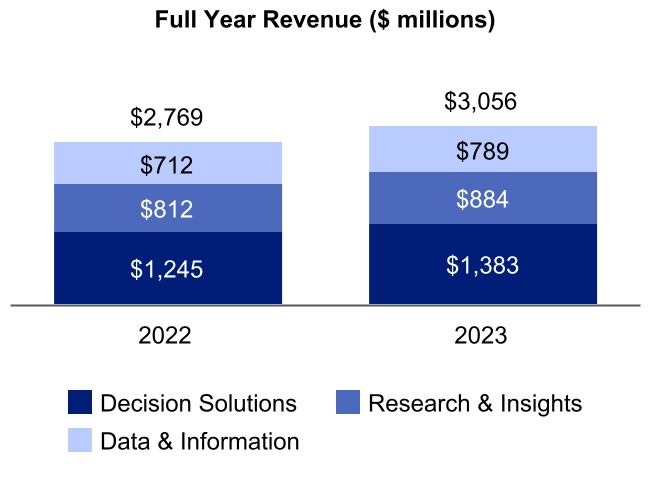
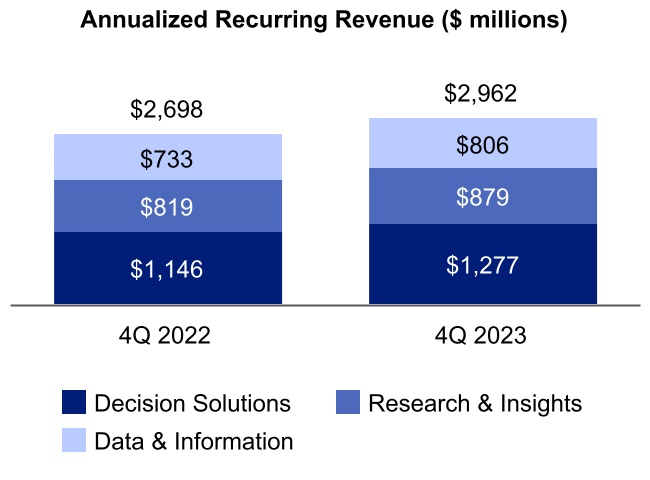
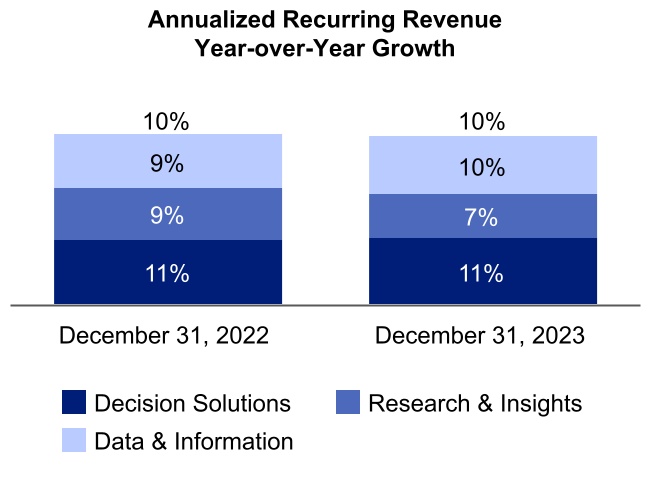
•Revenue increased 11%, or 10% on a constant currency basis1, from the prior-year period. •Decision Solutions revenue grew 10%, or 8% on a constant currency basis1. Banking, Insurance and Know Your Customer (KYC) reported revenue grew 4%, 9% and 22%, respectively. •Research & Insights revenue increased 12%, or 11% on a constant currency basis1, reflecting continued demand and a more favorable sales mix in the quarter. •Data & Information revenue increased 14%, or 11% on a constant currency basis1. Growth continues to be driven by rising demand for ratings data feeds. | | •Revenue increased 10% from the prior year. Foreign currency translation had an immaterial impact on MA’s revenue. •Annualized Recurring Revenue or ARR2 was up 10% with Decision Solutions, Research & Insights and Data & Information ARR growing 11%, 7% and 10%, respectively. •Within Decision Solutions, ARR growth for Banking, Insurance and KYC was 9%, 11% and 17%. |
| | | | | |
2 Refer to Table 10 at the end of this press release for the definition of and further information on the Annualized Recurring Revenue (ARR) metric. |
| | |
| Moody’s Investors Service (MIS) |
| | | | | | | | |
| Fourth Quarter 2023 | | Full Year 2023 |
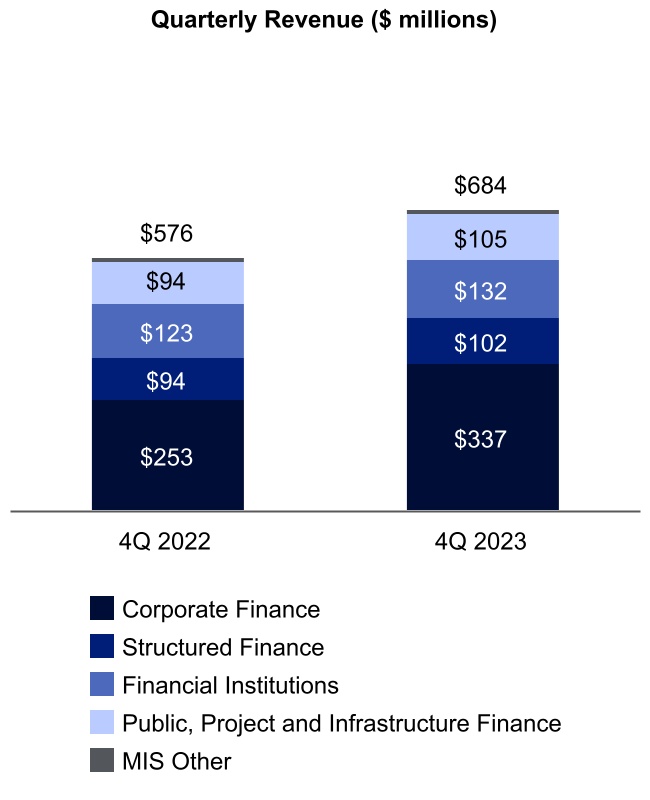
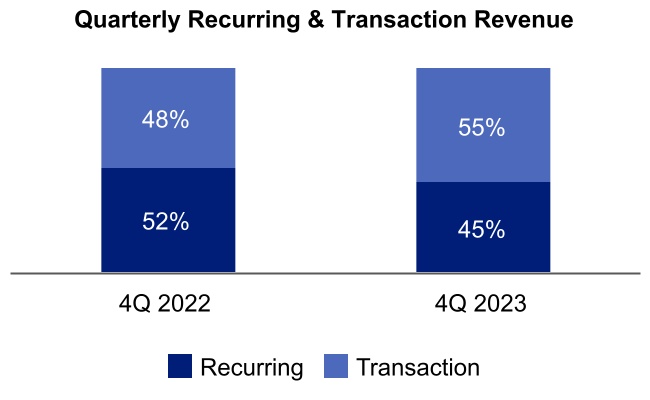
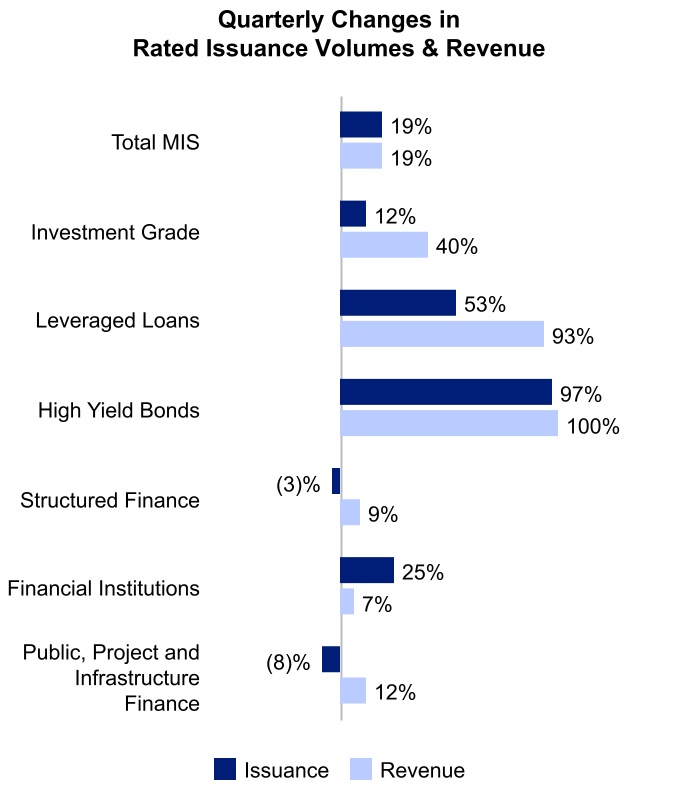
•Revenue grew 19%, or 17% on a constant currency basis1, from the prior-year period. •Benchmark treasury rates continued their downward trajectory from early in the quarter as markets started to price in potential rate cuts in 2024. •Growth was driven by Corporate Finance, with bank loans having the strongest quarter since the beginning of 2022, predominantly driven by refinancing activity. •A favorable issuance mix within Public, Project and Infrastructure Finance positively impacted revenue growth. •Structured Finance revenue growth was driven by increased CLO issuance and favorable pricing constructs for CMBS.
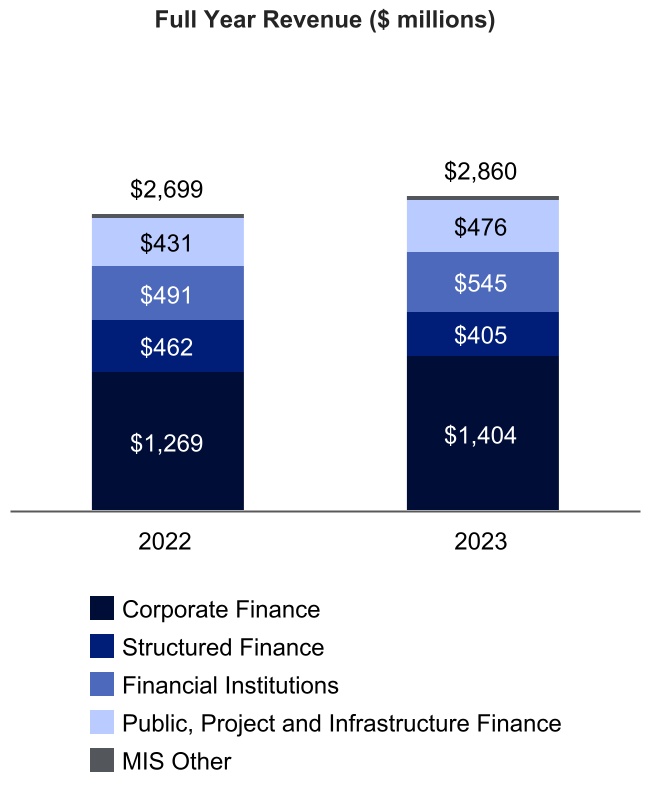
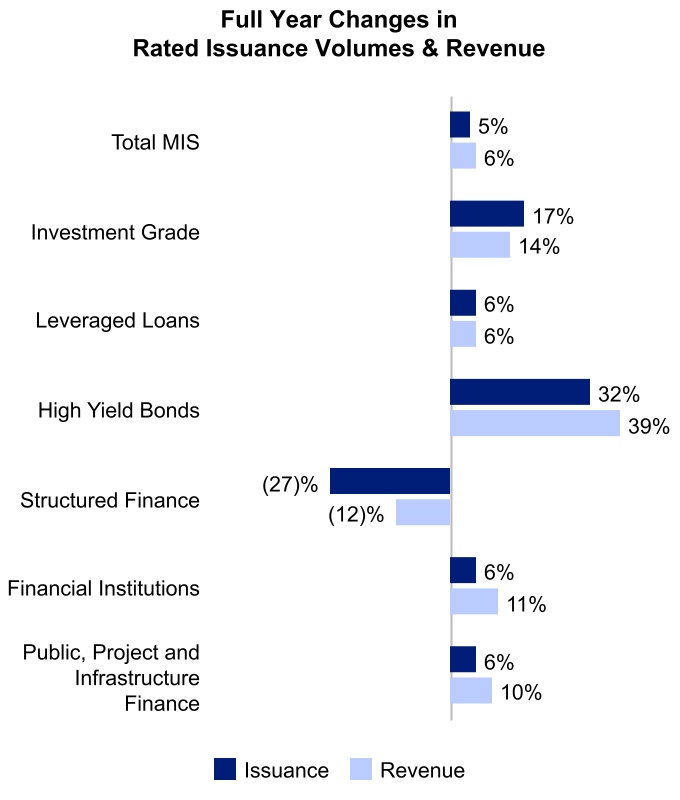
| | •Revenue increased 6% compared to the prior year. Foreign currency translation had an immaterial impact on MIS’s revenue. •Revenue increased in nearly all lines of business as market conditions became more favorable, with Investment Grade and High Yield Bond activity showing the strongest growth. •Financial Institutions revenue benefitted from a favorable issuance mix due to opportunistic activity from infrequent bank issuers. •Structured Finance revenue decreased as higher funding costs and ongoing uncertainty constrained issuance activity over the course of the year.
|
| | |
| OPERATING EXPENSES AND MARGIN |
| | | | | | | | |
| Full Year 2023 | | Full Year 2024 Forecast |
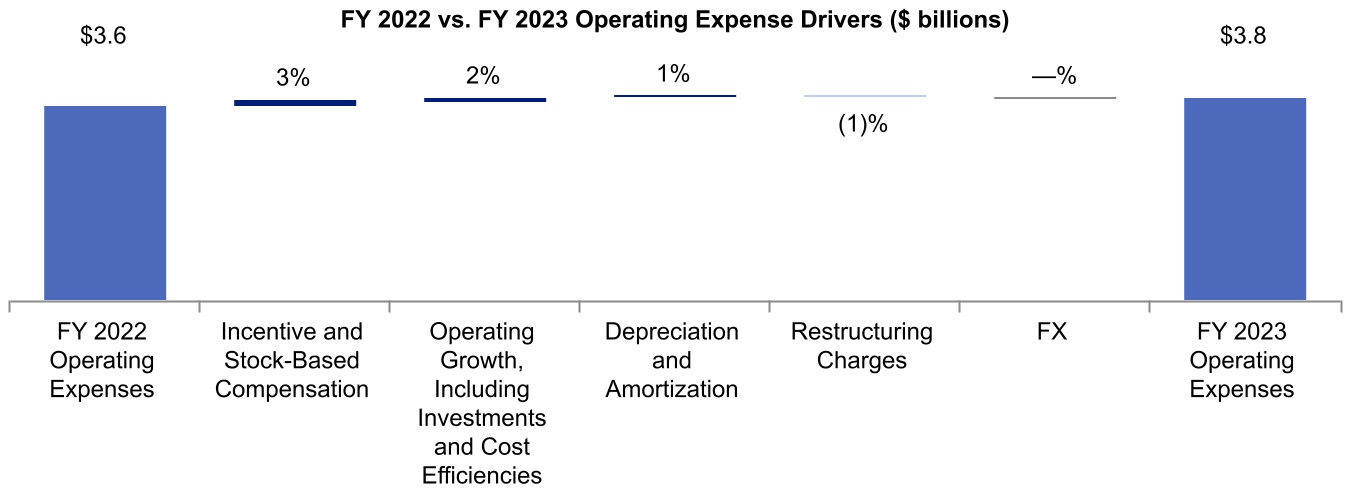
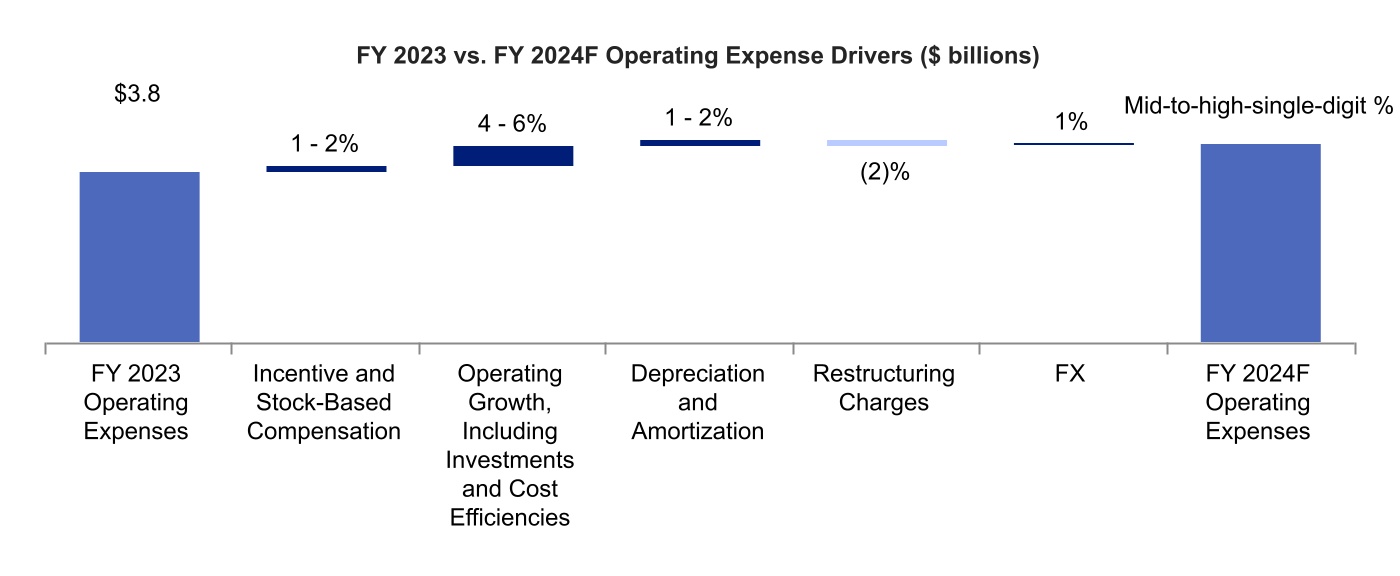
•Operating expenses grew 5% from the prior-year period, including 3% from higher incentive compensation accruals and stock-based compensation. •Recorded $87 million in charges related to the 2022 – 2023 Geolocation Restructuring Program. These actions supported operating leverage improvements in 2023 and created capacity for future organic investment. •Foreign currency translation had an immaterial impact on operating expenses. | | •Operating expenses projected to increase in the mid-to-high-single-digit percent range in 2024. •Assumptions underpinning operating growth include salary and promotion increases as well as ongoing and incremental strategic investment across the firm, most of which is attributable to MA. •Increase in depreciation and amortization expense is primarily driven by existing investments associated with the development of SaaS-based solutions in MA. |
| | |
Operating Margin and Adjusted Operating Margin1 |
| | | | | | | | |
| Fourth Quarter 2023 | | Full Year 2023 |
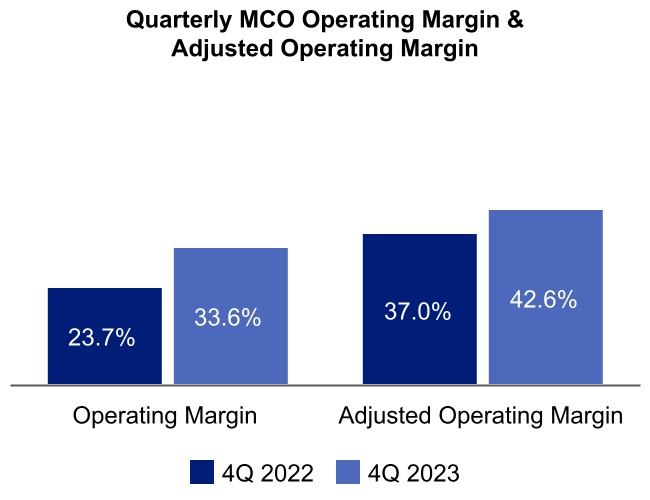
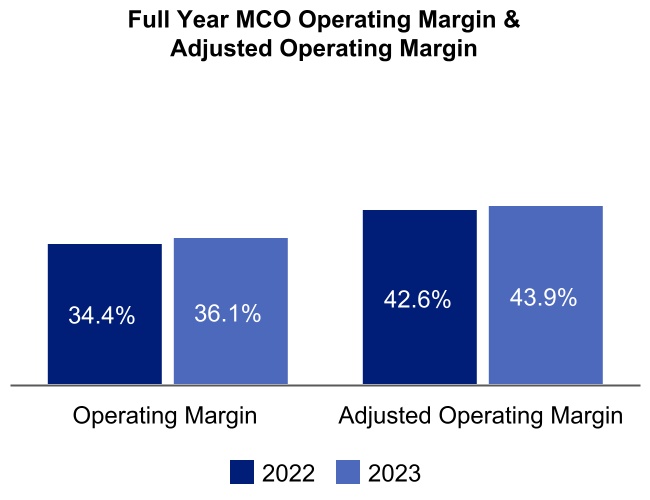
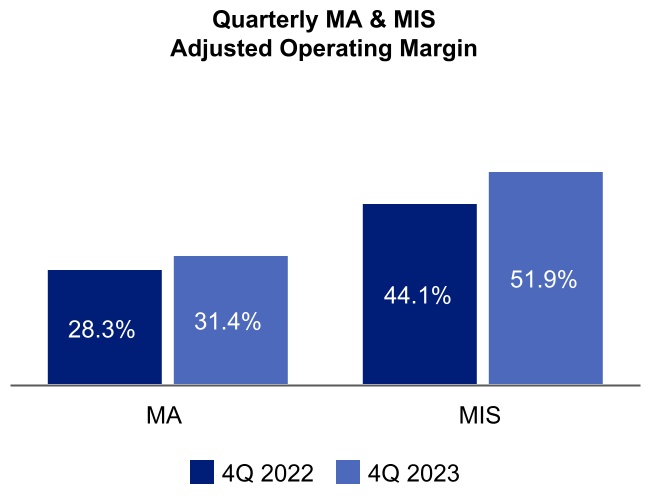
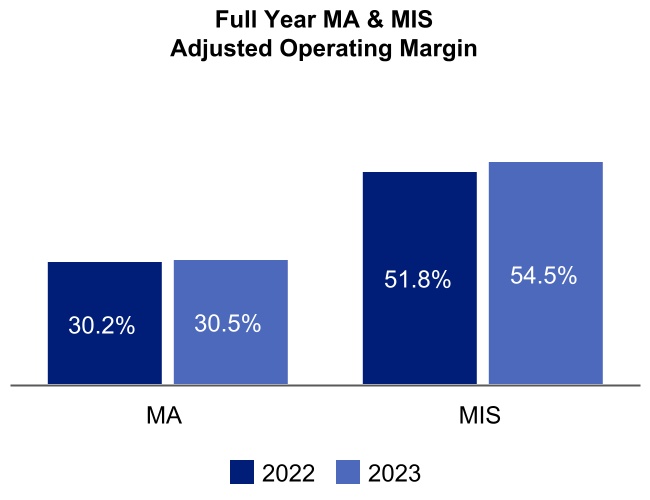
•MCO’s operating margin was 33.6% and adjusted operating margin1 was 42.6%. •Foreign currency translation had an immaterial impact on both operating and adjusted operating margins1. •MA’s adjusted operating margin of 31.4% is a combination of the continuous investment in high growth markets combined with the execution of cost control initiatives. •MIS’s adjusted operating margin was 51.9%, reflecting better revenue growth from an improvement in debt issuance, as well as internal efficiencies. | | •MCO’s operating margin was 36.1% and adjusted operating margin1 was 43.9%. •Foreign currency translation had an immaterial impact on both operating and adjusted operating margins1. •MA and MIS’s adjusted operating margins continued to be supported by proactive cost management actions initiated in the prior year and prudent deployment of organic investment.
|
| | |
Diluted EPS and Adjusted Diluted EPS1 |
| | | | | | | | |
| Fourth Quarter 2023 | | Full Year 2023 |
•Diluted and adjusted diluted EPS1 increased from the prior-year period due to strong revenue growth derived from an increase in issuance activity and growing demand for data feeds and SaaS-based solutions. •The Effective Tax Rate (ETR) was 24.4%, in line with 24.8% reported in the prior-year period. | | •Diluted and adjusted diluted EPS1 increased from the prior-year period due to robust revenue growth, combined with favorable tax resolutions during the year. •ETR was 16.9%, significantly lower than the 21.9% reported in the prior-year, primarily due to the favorable resolutions of uncertain tax positions within U.S. domestic and foreign tax jurisdictions in the first quarter of 2023 that are not expected to occur to a similar magnitude in future years. |
| | |
| CAPITAL ALLOCATION AND LIQUIDITY |
| | |
Capital Returned to Shareholders & Free Cash Flow1 |
| | |
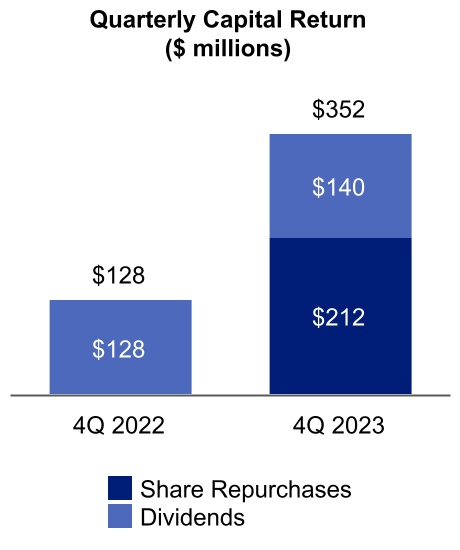
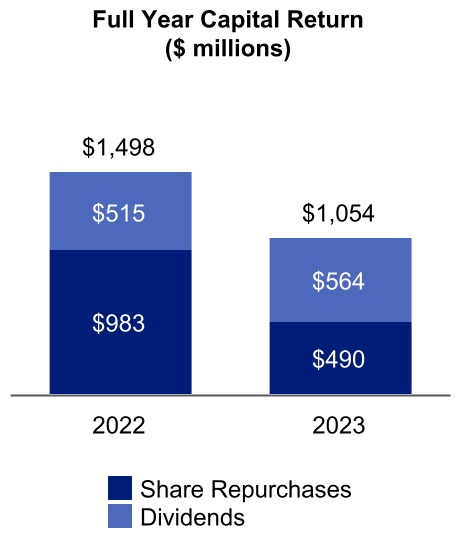
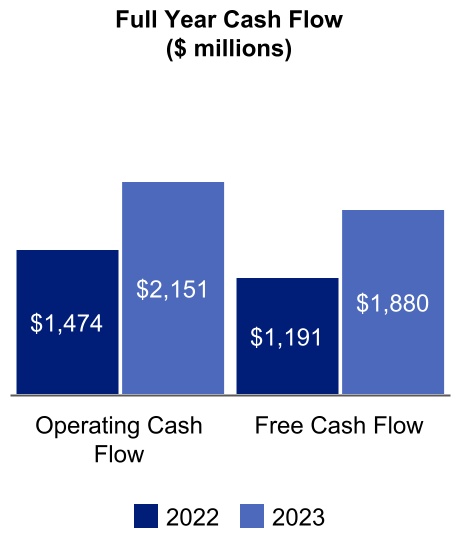
•Cash flow from operations was $2,151 million and free cash flow1 was $1,880 million. •The increase in free cash flow1 is due to improvements in working capital and higher net income, mainly driven by robust revenue growth from both segments. •On February 5, 2024, the Board of Directors declared a regular quarterly dividend of $0.85 per share of MCO Common Stock, a 10% increase from the prior quarterly dividend of $0.77 per share. The dividend will be payable on March 15, 2024, to stockholders of record at the close of business on February 23, 2024. •During the fourth quarter of 2023, Moody’s repurchased 0.6 million shares at an average cost of $346.80 per share and issued net 0.1 million shares as part of its employee stock-based compensation programs. The net amount included shares withheld for employee payroll taxes. •As of December 31, 2023, Moody’s had 182 million shares outstanding, with approximately $359 million of share repurchase authority remaining. On February 5, 2024, the Board of Directors authorized an additional $1 billion in share repurchase authority. •As of December 31, 2023, Moody's had $7.0 billion of outstanding debt and an undrawn $1.25 billion revolving credit facility. |
Moody’s updated outlook for full year 2024, as of February 13, 2024, reflects assumptions about numerous factors that could affect its business and is based on currently available information reviewed by management through, and as of, today’s date. These assumptions include, but are not limited to, the effects of current economic conditions, including the effects of interest rates, inflation, foreign currency exchange rates, capital markets’ liquidity, and activity in different sectors of the debt markets. This outlook also reflects assumptions about global GDP growth, and the impacts resulting from changes in international conditions, including as a result of the Russia-Ukraine military conflict, and the military conflict in Israel and surrounding areas. Actual full year 2024 results could differ materially from Moody’s current outlook.
This outlook incorporates various specific macroeconomic assumptions, including:
| | | | | |
| Forecasted Item | Current assumption |
U.S. GDP(1) growth | 1.0% - 2.0% |
Euro area GDP(1) growth | 0.5% - 1.5% |
| Global benchmark rates | Gradual rate reductions starting in 2Q 2024 |
| U.S. high yield spreads | To fluctuate around 400 - 500 bps, with periodic volatility |
| U.S. inflation rate | To decline to 2.0% by year-end |
| Euro area inflation rate | Large economies to decline to around 2.0% by year-end |
| U.S. unemployment rate | To average between 4.0% - 4.5% for the full year |
| Global high yield default rate | Rise towards 5.0% in 1H 2024 and then ease to around 4.0% by year-end |
| Global MIS rated issuance | Increase in the mid-to-high-single-digit percent range |
| GBP/USD exchange rate | $1.27 for the full year |
| EUR/USD exchange rate | $1.10 for the full year |
Note: All current assumptions are as of February 13, 2024. (1) GDP growth represents real GDP. |
A full summary of Moody's full year 2024 guidance as of February 13, 2024, is included in Table 12 – “2024 Outlook” at the end of this press release.
| | | | | | | | |
| Date and Time | February 13, 2024, at 11:30 a.m. Eastern Time (ET). |
| Webcast | The webcast and its replay can be accessed through Moody’s Investor Relations website, ir.moodys.com, within “Events & Presentations.” |
| Dial In | U.S. and Canada | ‘+1-888-330-2508 |
| Other callers | ‘+1-240-789-2735 |
| Passcode | 9302427 |
| Dial In Replay | A replay will be available immediately after the call on February 13, 2024, and until March 14, 2024. |
| U.S. and Canada | ‘+1-800-770-2030 |
| Other callers | ‘+1-647-362-9199 |
| Passcode | 9302427 |
| | |
| ABOUT MOODY’S CORPORATION |
Moody’s (NYSE: MCO) is a global risk assessment firm that empowers organizations to make better decisions. Its data, analytical solutions and insights help decision-makers identify opportunities and manage the risks of doing business with others. We believe that greater transparency, more informed decisions, and fair access to information open the door to shared progress. With approximately 15,000 employees in more than 40 countries, Moody’s combines international presence with local expertise and over a century of experience in financial markets. Learn more at moodys.com/about.
| | |
| “SAFE HARBOR” STATEMENT UNDER THE PRIVATE SECURITIES LITIGATION REFORM ACT OF 1995 |
Certain statements contained in this document are forward-looking statements and are based on future expectations, plans and prospects for Moody’s business and operations that involve a number of risks and uncertainties. Such statements involve estimates, projections, goals, forecasts, assumptions and uncertainties that could cause actual results or outcomes to differ materially from those contemplated, expressed, projected, anticipated or implied in the forward-looking statements. Stockholders and investors are cautioned not to place undue reliance on these forward-looking statements. The forward-looking statements and other information in this document are made as of the date hereof, and Moody’s undertakes no obligation (nor does it intend) to publicly supplement, update or revise such statements on a going-forward basis, whether as a result of subsequent developments, changed expectations or otherwise, except as required by applicable law or regulation. In connection with the “safe harbor” provisions of the Private Securities Litigation Reform Act of 1995, Moody’s is identifying certain factors that could cause actual results to differ, perhaps materially, from those indicated by these forward-looking statements. These factors, risks and uncertainties include, but are not limited to: the impact of general economic conditions (including significant government debt and deficit levels, and inflation and related monetary policy actions by governments in response to inflation) on worldwide credit markets and on economic activity, including on the volume of mergers and acquisitions, and their effects on the volume of debt and other securities issued in domestic and/or global capital markets; the uncertain effectiveness and possible collateral consequences of U.S. and foreign government initiatives and monetary policy to respond to the current economic climate, including instability of financial institutions, credit quality concerns, and other potential impacts of volatility in financial and credit markets; the global impacts of the Russia - Ukraine military conflict and the military conflict in Israel and the surrounding areas on volatility in world financial markets, on general economic conditions and GDP in the U.S. and worldwide, on global relations and on the Company's own operations and personnel; other matters that could affect the volume of debt and other securities issued in domestic and/or global capital markets, including regulation, increased utilization of technologies that have the potential to intensify competition and accelerate disruption and disintermediation in the financial services industry, as well as the number of issuances of securities without ratings or securities which are rated or evaluated by non-traditional parties; the level of merger and acquisition activity in the U.S. and abroad; the uncertain effectiveness and possible collateral consequences of U.S. and foreign government actions affecting credit markets, international trade and economic policy, including those related to tariffs, tax agreements and trade barriers; the impact of MIS’s withdrawal of its credit ratings on countries or entities within countries and of Moody’s no longer conducting commercial operations in countries where political instability warrants such actions; concerns in the marketplace affecting our credibility or otherwise affecting market perceptions of the integrity or utility of independent credit agency ratings; the introduction or development of competing and/or emerging technologies and products; pricing pressure from competitors and/or customers; the level of success of new product development and global expansion; the impact of regulation as an NRSRO, the potential for new U.S., state and local legislation and regulations; the potential for increased competition and regulation in the jurisdictions in which we operate, including the EU; exposure to litigation related to our rating opinions, as well as any other litigation, government and regulatory proceedings, investigations and inquiries to which Moody’s may be subject from time to time; provisions in U.S. legislation modifying the pleading standards and EU regulations modifying the liability standards applicable to credit rating agencies in a manner adverse to credit rating agencies; provisions of EU regulations imposing additional procedural and substantive requirements on the pricing of services and the expansion of supervisory remit to include non-EU ratings used for regulatory purposes; uncertainty regarding the future relationship between the U.S. and China; the possible loss of key employees and the impact of the global labor environment; failures or malfunctions of our operations and infrastructure; any vulnerabilities to cyber threats or other cybersecurity concerns; the timing and effectiveness of our restructuring programs, such as the 2022 - 2023 Geolocation Restructuring Program; currency and foreign exchange volatility; the outcome of any review by tax authorities of Moody’s global tax planning initiatives; exposure to potential criminal sanctions or civil remedies if Moody’s fails to comply with foreign and U.S. laws and regulations that are applicable in the jurisdictions in which Moody’s operates, including data protection and privacy laws, sanctions laws, anti-corruption laws, and local laws prohibiting corrupt payments to government officials; the impact of mergers, acquisitions, such as our acquisition of RMS, or other business combinations and the ability of Moody’s to successfully integrate acquired businesses; the level of future cash flows; the levels of capital investments; and a decline in the demand for credit risk management tools by financial institutions. These factors, risks and uncertainties as well as other risks and uncertainties that could cause Moody’s actual results to differ materially from those contemplated, expressed, projected, anticipated or implied in the forward-looking statements are described in greater detail under “Risk Factors” in Part I, Item 1A of Moody’s annual report on Form 10-K for the year ended December 31, 2023, and in other filings made by the Company from time to time with the SEC or in materials incorporated herein or therein. Stockholders and investors are cautioned that the occurrence of any of these factors, risks and uncertainties may cause the Company’s actual results to differ materially from those contemplated, expressed, projected, anticipated or implied in the forward-looking statements, which could have a material and adverse effect on the Company’s business, results of operations and financial condition. New factors may emerge from time to time, and it is not possible for the Company to predict new factors, nor can the Company assess the potential effect of any new factors on it. Forward-looking and other statements in this document may also address our corporate responsibility progress, plans, and goals (including sustainability and environmental matters), and the inclusion of such statements is not an indication that these contents are necessarily material to investors or required to be disclosed in the Company’s filings with the Securities and Exchange Commission. In addition, historical, current, and forward-looking sustainability-related statements may be based on standards for measuring progress that are still developing, internal controls and processes that continue to evolve, and assumptions that are subject to change in the future.
Table 1 - Consolidated Statements of Operations (Unaudited)
| | | | | | | | | | | | | | | | | | | | | | | |
| Three Months Ended December 31, | | Year Ended
December 31, |
| Amounts in millions, except per share amounts | 2023 | | 2022 | | 2023 | | 2022 |
| | | | | | | |
| Revenue | $ | 1,480 | | | $ | 1,290 | | | $ | 5,916 | | | $ | 5,468 | |
| | | | | | | |
| Expenses: | | | | | | | |
| Operating | 421 | | | 410 | | | 1,687 | | | 1,613 | |
| Selling, general and administrative | 428 | | | 403 | | | 1,632 | | | 1,527 | |
| Depreciation and amortization | 97 | | | 89 | | | 373 | | | 331 | |
| Restructuring | 36 | | | 82 | | | 87 | | | 114 | |
| Total expenses | 982 | | | 984 | | | 3,779 | | | 3,585 | |
| | | | | | | |
| Operating income | 498 | | | 306 | | | 2,137 | | | 1,883 | |
| Non-operating (expense) income, net | | | | | | | |
| Interest expense, net | (66) | | | (65) | | | (251) | | | (231) | |
| Other non-operating income, net | 18 | | | 16 | | | 49 | | | 38 | |
| Gain on extinguishment of debt | — | | | 70 | | | — | | | 70 | |
| Total non-operating (expense) income, net | (48) | | | 21 | | | (202) | | | (123) | |
| Income before provision for income taxes | 450 | | | 327 | | | 1,935 | | | 1,760 | |
| Provision for income taxes | 110 | | | 81 | | | 327 | | | 386 | |
| Net income | 340 | | | 246 | | | 1,608 | | | 1,374 | |
| Less: net income attributable to noncontrolling interests | — | | | — | | | 1 | | | — | |
| Net income attributable to Moody's Corporation | $ | 340 | | | $ | 246 | | | $ | 1,607 | | | $ | 1,374 | |
| | | | | | | |
| Earnings per share attributable to Moody's common shareholders |
| Basic | $ | 1.86 | | | $ | 1.34 | | | $ | 8.77 | | | $ | 7.47 | |
| Diluted | $ | 1.85 | | | $ | 1.34 | | | $ | 8.73 | | | $ | 7.44 | |
| | | | | | | |
| Weighted average number of shares outstanding |
| Basic | 182.7 | | | 183.2 | | | 183.2 | | | 183.9 | |
| Diluted | 183.6 | | | 183.9 | | | 184.0 | | | 184.7 | |
Table 2 - Condensed Consolidated Balance Sheet Data (Unaudited)
| | | | | | | | | | | |
| Amounts in millions | December 31, 2023 | | December 31, 2022 |
| ASSETS | | | |
| Current assets: | | | |
| Cash and cash equivalents | $ | 2,130 | | | $ | 1,769 | |
| Short-term investments | 63 | | | 90 | |
| Accounts receivable, net of allowance for credit losses of $35 in 2023 and $40 in 2022 | 1,659 | | | 1,652 | |
| Other current assets | 489 | | | 583 | |
| | | |
| Total current assets | 4,341 | | | 4,094 | |
| Property and equipment, net of accumulated depreciation of $1,272 in 2023 and $1,123 in 2022 | 603 | | | 502 | |
| Operating lease right-of-use assets | 277 | | | 346 | |
| Goodwill | 5,956 | | | 5,839 | |
| Intangible assets, net | 2,049 | | | 2,210 | |
| Deferred tax assets, net | 258 | | | 266 | |
| Other assets | 1,138 | | | 1,092 | |
| Total assets | $ | 14,622 | | | $ | 14,349 | |
| LIABILITIES AND SHAREHOLDERS' EQUITY |
| Current liabilities: | | | |
| Accounts payable and accrued liabilities | $ | 1,076 | | | $ | 1,011 | |
| Current portion of operating lease liabilities | 108 | | | 106 | |
| | | |
| | | |
| Deferred revenue | 1,316 | | | 1,258 | |
| | | |
| Total current liabilities | 2,500 | | | 2,375 | |
| Non-current portion of deferred revenue | 65 | | | 75 | |
| Long-term debt | 7,001 | | | 7,389 | |
| Deferred tax liabilities, net | 402 | | | 457 | |
| Uncertain tax positions | 196 | | | 322 | |
| Operating lease liabilities | 306 | | | 368 | |
| Other liabilities | 676 | | | 674 | |
| Total liabilities | 11,146 | | | 11,660 | |
| | | |
|
| | | |
| | | |
| | | |
| | | |
| | | |
| | | |
| | | |
| | | |
| Total Moody's shareholders' equity | 3,318 | | | 2,519 | |
| Noncontrolling interests | 158 | | | 170 | |
| Total shareholders' equity | 3,476 | | | 2,689 | |
| Total liabilities and shareholders' equity | $ | 14,622 | | | $ | 14,349 | |
Table 3 - Condensed Consolidated Statements of Cash Flows (Unaudited)
| | | | | | | | | | | | | | | |
| Year Ended
December 31, | | | | |
| Amounts in millions | 2023 | | 2022 | | | | |
| Cash flows from operating activities | | | | | | | |
| Net income | $ | 1,608 | | | $ | 1,374 | | | | | |
| Reconciliation of net income to net cash provided by operating activities: | | | | | | | |
| Depreciation and amortization | 373 | | | 331 | | | | | |
| Stock-based compensation | 193 | | | 169 | | | | | |
| Deferred income taxes | (38) | | | 48 | | | | | |
| Provision for credit losses on accounts receivable | 22 | | | 25 | | | | | |
| Right-of-use asset impairment & other non-cash restructuring/impairment charges | 35 | | | 29 | | | | | |
| FX translation losses reclassified to net income | — | | | 20 | | | | | |
| Gain on extinguishment of debt | — | | | (70) | | | | | |
| Gain on sale of non-consolidated affiliates | (4) | | | — | | | | | |
| Net changes in other operating assets and liabilities | (38) | | | (452) | | | | | |
| Net cash provided by operating activities | 2,151 | | | 1,474 | | | | | |
| | | | | | | |
| Cash flows from investing activities | | | | | | | |
| Capital additions | (271) | | | (283) | | | | | |
| Purchases of investments | (143) | | | (246) | | | | | |
| Sales and maturities of investments | 162 | | | 216 | | | | | |
| Purchases of investments in non-consolidated affiliates | (5) | | | (74) | | | | | |
| Sales of investments in non-consolidated affiliates | 13 | | | 2 | | | | | |
| Cash paid for acquisitions, net of cash acquired | (3) | | | (97) | | | | | |
| Receipts from settlement of net investment hedges | — | | | 220 | | | | | |
| Net cash used in investing activities | (247) | | | (262) | | | | | |
| | | | | | | |
| Cash flows from financing activities | | | | | | | |
| Issuance of notes | — | | | 988 | | | | | |
| Repayment of notes | (500) | | | (626) | | | | | |
| Proceeds from stock-based compensation plans | 50 | | | 26 | | | | | |
| Repurchase of shares related to stock-based compensation | (71) | | | (87) | | | | | |
| Treasury shares | (490) | | | (983) | | | | | |
| Dividends | (564) | | | (515) | | | | | |
| Dividends to noncontrolling interests | (9) | | | (1) | | | | | |
| Debt issuance costs, extinguishment costs and related fees | — | | | (10) | | | | | |
| Net cash used in financing activities | (1,584) | | | (1,208) | | | | | |
| Effect of exchange rate changes on cash and cash equivalents | 41 | | | (46) | | | | | |
| Increase (decrease) in cash and cash equivalents | 361 | | | (42) | | | | | |
| Cash and cash equivalents, beginning of period | 1,769 | | | 1,811 | | | | | |
| Cash and cash equivalents, end of period | $ | 2,130 | | | $ | 1,769 | | | | | |
| | | | | | | |
| | | | | | | |
| | | | | | | |
Table 4 - Non-Operating (Expense) Income, Net (Unaudited)
| | | | | | | | | | | | | | | | | | | | | | | |
| Three Months Ended December 31, | | Year Ended
December 31, |
| Amounts in millions | 2023 | | 2022 | | 2023 | | 2022 |
| Interest: | | | | | | | |
Expense on borrowings(1) | $ | (76) | | | $ | (64) | | | $ | (296) | | | $ | (216) | |
UTPs and other tax related liabilities(2) | (2) | | | (2) | | | 8 | | | (13) | |
| Net periodic pension costs - interest component | (7) | | | (5) | | | (26) | | | (17) | |
| Income | 19 | | | 6 | | | 63 | | | 15 | |
| Total interest expense, net | $ | (66) | | | $ | (65) | | | $ | (251) | | | $ | (231) | |
| Other non-operating income, net: | | | | | | | |
FX loss(3) | $ | (1) | | | $ | (1) | | | $ | (30) | | | $ | (10) | |
| Net periodic pension costs - other components | 9 | | | 6 | | | 35 | | | 24 | |
| Income from investments in non-consolidated affiliates | 7 | | | 3 | | | 19 | | | 17 | |
| Gain (loss) on investments | 3 | | | 4 | | | 14 | | | (14) | |
| Other | — | | | 4 | | | 11 | | | 21 | |
| Other non-operating income, net | $ | 18 | | | $ | 16 | | | $ | 49 | | | $ | 38 | |
Gain on extinguishment of debt (4) | — | | | 70 | | | — | | | 70 | |
| Total non-operating (expense) income, net | $ | (48) | | | $ | 21 | | | $ | (202) | | | $ | (123) | |
| | |
(1) Expense on borrowings includes interest on long-term debt and realized gains/losses related to interest rate swaps and cross currency swaps. |
(2) The amount for the year ended December 31, 2023 includes a $22 million reduction of tax-related interest expense primarily related to the resolutions of outstanding tax matters during the first quarter of 2023. |
(3) The amount for the year ended December 31, 2022 includes FX translation losses of $20 million reclassified to earnings resulting from the Company no longer conducting commercial operations in Russia. |
(4) The gain on extinguishment of debt for the quarter and year ended December 31, 2022 relates to the early redemption of a portion of the 2.55% 2020 Senior Notes, due 2060. |
|
|
Table 5 - Financial Information by Segment (Unaudited)
The table below shows revenue and Adjusted Operating Income by reportable segment. Adjusted Operating Income is a financial metric utilized by the Company’s chief operating decision maker to assess the profitability of each reportable segment.
| | | | | | | | | | | | | | | | | | | | | | | | | | | | | | | | | | | | | | | | | | | | | | | |
| Three Months Ended December 31, |
| 2023 |
| 2022 |
| Amounts in millions | MA | | MIS | | Eliminations | | Consolidated | | MA | | MIS | | Eliminations | | Consolidated |
| Total external revenue | $ | 796 | |
| $ | 684 | |
| $ | — | |
| $ | 1,480 | |
| $ | 714 | | | $ | 576 | |
| $ | — | |
| $ | 1,290 | |
| Intersegment revenue | 3 | | | 48 | | | (51) | | | — | | | 3 | | | 45 | | | (48) | | | — | |
| Total revenue | 799 | | | 732 | | | (51) | | | 1,480 | | | 717 | | | 621 | | | (48) | | | 1,290 | |
| Operating, SG&A | 548 | | | 352 | | | (51) | | | 849 | | | 514 | | | 347 | | | (48) | |
| 813 | |
| Adjusted Operating Income | $ | 251 | | | $ | 380 | | | $ | — | | | $ | 631 | | | $ | 203 | | | $ | 274 | | | $ | — | | | $ | 477 | |
| Adjusted Operating Margin | 31.4 | % | | 51.9 | % | | | | 42.6 | % | | 28.3 | % | | 44.1 | % | | | | 37.0 | % |
| Depreciation and amortization | 78 | |
| 19 | |
| — | |
| 97 | |
| 68 | | | 21 | |
| — | |
| 89 | |
| Restructuring | 21 | | | 15 | | | — | | | 36 | | | 32 | | | 50 | | | — | | | 82 | |
| Operating income | | | | | | | $ | 498 | | | | | | | | | $ | 306 | |
| Operating margin | | | | | | | 33.6 | % | | | | | | | | 23.7 | % |
| | | | | | | | | | | | | | | |
| Year Ended December 31, |
| 2023 | | 2022 |
| Amounts in millions | MA | | MIS | | Eliminations | | Consolidated | | MA | | MIS | | Eliminations | | Consolidated |
| Total external revenue | $ | 3,056 | | | $ | 2,860 | | | $ | — | |
| $ | 5,916 | |
| $ | 2,769 | | | $ | 2,699 | | | $ | — | |
| $ | 5,468 | |
| Intersegment revenue | 13 | | | 186 | | | (199) | | | — | | | 8 | | | 174 | | | (182) | | | — | |
| Total revenue | 3,069 | | | 3,046 | | | (199) | | | 5,916 | | | 2,777 | | | 2,873 | | | (182) | | | 5,468 | |
| Operating, SG&A | 2,132 | | | 1,386 | | | (199) | | | 3,319 | | | 1,937 | | | 1,385 | | | (182) | |
| 3,140 | |
| Adjusted Operating Income | $ | 937 | | | $ | 1,660 | | | $ | — | | | $ | 2,597 | | | $ | 840 | | | $ | 1,488 | | | $ | — | | | $ | 2,328 | |
| Adjusted Operating Margin | 30.5 | % | | 54.5 | % | | | | 43.9 | % | | 30.2 | % | | 51.8 | % | | | | 42.6 | % |
| Depreciation and amortization | 298 | | | 75 | |
| — | |
| 373 | |
| 250 | | | 81 | |
| — | | | 331 | |
| Restructuring | 59 | | | 28 | | | — | | | 87 | | | 49 | | | 65 | | | — | | | 114 | |
| Operating income | | | | | | | $ | 2,137 | | | | | | | | | $ | 1,883 | |
| Operating margin | | | | | | | 36.1 | % | | | | | | | | 34.4 | % |
Table 6 - Transaction and Recurring Revenue (Unaudited)
The following tables summarize the split between transaction revenue and recurring revenue. In the MA segment, recurring revenue represents subscription-based revenue and software maintenance revenue. Transaction revenue in MA represents perpetual software license fees and revenue from software implementation services, risk management advisory projects, and training and certification services. In the MIS segment, excluding MIS Other, transaction revenue represents the initial rating of a new debt issuance, as well as other one-time fees, while recurring revenue represents recurring monitoring fees of a rated debt obligation and/or entities that issue such obligations, as well as revenue from programs such as commercial paper, medium-term notes and shelf registrations. In MIS Other, transaction revenue represents revenue from professional services, while recurring revenue represents subscription-based revenue.
| | | | | | | | | | | | | | | | | | | | | | | | | | | | | | | | | | | | |
| | Three Months Ended December 31, |
| | 2023 | | 2022 |
| Amounts in millions | | Transaction | | Recurring | | Total | | Transaction | | Recurring | | Total |
| | | | | | | | | | | | |
| Decision Solutions | | $ | 43 | | | $ | 318 | | | $ | 361 | | | $ | 41 | | | $ | 288 | | | $ | 329 | |
| | 12 | % | | 88 | % | | 100 | % | | 12 | % | | 88 | % | | 100 | % |
| Research & Insights | | $ | 4 | | | $ | 226 | | | $ | 230 | | | $ | 5 | | | $ | 200 | | | $ | 205 | |
| | 2 | % | | 98 | % | | 100 | % | | 2 | % | | 98 | % | | 100 | % |
| Data & Information | | $ | 1 | | | $ | 204 | | | $ | 205 | | | $ | — | | | $ | 180 | | | $ | 180 | |
| | — | % | | 100 | % | | 100 | % | | — | % | | 100 | % | | 100 | % |
| Total MA | | $ | 48 | | | $ | 748 | | | $ | 796 | | | $ | 46 | | | $ | 668 | | | $ | 714 | |
| | 6 | % | | 94 | % | | 100 | % | | 6 | % | | 94 | % | | 100 | % |
| | | | | | | | | | | | |
| Corporate Finance | | $ | 205 | |
| $ | 132 | | | $ | 337 | | | $ | 127 | | | $ | 126 | | | $ | 253 | |
| | 61 | % | | 39 | % | | 100 | % | | 50 | % | | 50 | % | | 100 | % |
| Structured Finance | | $ | 48 | | | $ | 54 | | | $ | 102 | | | $ | 45 | | | $ | 49 | | | $ | 94 | |
| | 47 | % | | 53 | % | | 100 | % | | 48 | % | | 52 | % | | 100 | % |
| Financial Institutions | | $ | 59 | | | $ | 73 | | | $ | 132 | | | $ | 52 | | | $ | 71 | | | $ | 123 | |
| | 45 | % | | 55 | % | | 100 | % | | 42 | % | | 58 | % | | 100 | % |
| Public, Project and Infrastructure Finance | | $ | 61 | | | $ | 44 | | | $ | 105 | | | $ | 52 | | | $ | 42 | | | $ | 94 | |
| | 58 | % | | 42 | % | | 100 | % | | 55 | % | | 45 | % | | 100 | % |
| MIS Other | | $ | 2 | | | $ | 6 | | | $ | 8 | | | $ | 1 | | | $ | 11 | | | $ | 12 | |
| | 25 | % | | 75 | % | | 100 | % | | 8 | % | | 92 | % | | 100 | % |
| Total MIS | | $ | 375 | | | $ | 309 | | | $ | 684 | | | $ | 277 | | | $ | 299 | | | $ | 576 | |
| | 55 | % | | 45 | % | | 100 | % | | 48 | % | | 52 | % | | 100 | % |
| | | | | | | | | | | | |
| Total Moody's Corporation | | $ | 423 | | | $ | 1,057 | | | $ | 1,480 | | | $ | 323 | | | $ | 967 | | | $ | 1,290 | |
| | 29 | % | | 71 | % | | 100 | % | | 25 | % | | 75 | % | | 100 | % |
Table 6 - Transaction and Recurring Revenue (Unaudited) Continued
| | | | | | | | | | | | | | | | | | | | | | | | | | | | | | | | | | | | |
| | Year Ended December 31, |
| | 2023 | | 2022 |
| Amounts in millions | | Transaction | | Recurring | | Total | | Transaction | | Recurring | | Total |
| Decision Solutions | | $ | 169 | | | $ | 1,214 | | | $ | 1,383 | | | $ | 153 | | | $ | 1,092 | | | $ | 1,245 | |
| | 12 | % | | 88 | % | | 100 | % | | 12 | % | | 88 | % | | 100 | % |
| Research & Insights | | $ | 16 | | | $ | 868 | | | $ | 884 | | | $ | 17 | | | $ | 795 | | | $ | 812 | |
| | 2 | % | | 98 | % | | 100 | % | | 2 | % | | 98 | % | | 100 | % |
| Data & Information | | $ | 3 | | | $ | 786 | | | $ | 789 | | | $ | — | | | $ | 712 | | | $ | 712 | |
| | — | % | | 100 | % | | 100 | % | | — | % | | 100 | % | | 100 | % |
| Total MA | | $ | 188 | |
| $ | 2,868 | | | $ | 3,056 | | | $ | 170 | | | $ | 2,599 | | | $ | 2,769 | |
| | 6 | % | | 94 | % | | 100 | % | | 6 | % | | 94 | % | | 100 | % |
| | | | | | | | | | | | |
| Corporate Finance | | $ | 887 | | | $ | 517 | | | $ | 1,404 | | | $ | 772 | | | $ | 497 | | | $ | 1,269 | |
| | 63 | % |
| 37 | % |
| 100 | % |
| 61 | % | | 39 | % | | 100 | % |
| Structured Finance | | $ | 190 | |
| $ | 215 | | | $ | 405 | | | $ | 262 | | | $ | 200 | | | $ | 462 | |
| | 47 | % | | 53 | % | | 100 | % | | 57 | % | | 43 | % | | 100 | % |
| Financial Institutions | | $ | 254 | |
| $ | 291 | | | $ | 545 | | | $ | 211 | | | $ | 280 | | | $ | 491 | |
| | 47 | % | | 53 | % | | 100 | % | | 43 | % | | 57 | % | | 100 | % |
| Public, Project and Infrastructure Finance | | $ | 301 | |
| $ | 175 | | | $ | 476 | | | $ | 263 | | | $ | 168 | | | $ | 431 | |
| | 63 | % | | 37 | % | | 100 | % | | 61 | % | | 39 | % | | 100 | % |
| MIS Other | | $ | 6 | |
| $ | 24 | | | $ | 30 | | | $ | 4 | | | $ | 42 | | | $ | 46 | |
| | 20 | % | | 80 | % | | 100 | % | | 9 | % | | 91 | % | | 100 | % |
| Total MIS | | $ | 1,638 | |
| $ | 1,222 | | | $ | 2,860 | | | $ | 1,512 | | | $ | 1,187 | | | $ | 2,699 | |
| | 57 | % | | 43 | % | | 100 | % | | 56 | % | | 44 | % | | 100 | % |
| | | | | | | | | | | | |
| Total Moody's Corporation | | $ | 1,826 | | | $ | 4,090 | | | $ | 5,916 | | | $ | 1,682 | | | $ | 3,786 | | | $ | 5,468 | |
| | 31 | % | | 69 | % | | 100 | % | | 31 | % | | 69 | % | | 100 | % |
Table 7 - Adjusted Operating Income and Adjusted Operating Margin (Unaudited)
The Company presents Adjusted Operating Income and Adjusted Operating Margin because management deems these metrics to be useful measures to provide additional perspective on Moody's operating performance. Adjusted Operating Income excludes the impact of: i) depreciation and amortization; and ii) restructuring charges/adjustments. Depreciation and amortization are excluded because companies utilize productive assets of different estimated useful lives and use different methods of acquiring and depreciating productive assets. Restructuring charges/adjustments are excluded as the frequency and magnitude of these charges may vary widely across periods and companies.
Management believes that the exclusion of the aforementioned items, as detailed in the reconciliation below, allows for an additional perspective on the Company’s operating results from period to period and across companies. The Company defines Adjusted Operating Margin as Adjusted Operating Income divided by revenue.
| | | | | | | | | | | | | | | | | | | | | | | |
| Three Months Ended December 31, | | Year Ended December 31, |
| Amounts in millions | 2023 | | 2022 | | 2023 | | 2022 |
| Operating income | $ | 498 | | | $ | 306 | | | $ | 2,137 | | | $ | 1,883 | |
| Depreciation and amortization | 97 | | | 89 | | | 373 | | | 331 | |
| Restructuring | 36 | | | 82 | | | 87 | | | 114 | |
| Adjusted Operating Income | $ | 631 | | | $ | 477 | | | $ | 2,597 | | | $ | 2,328 | |
| Operating margin | 33.6 | % | | 23.7 | % | | 36.1 | % | | 34.4 | % |
| Adjusted Operating Margin | 42.6 | % | | 37.0 | % | | 43.9 | % | | 42.6 | % |
Table 8 - Free Cash Flow (Unaudited)
The Company defines Free Cash Flow as net cash provided by operating activities minus cash paid for capital additions. Management believes that Free Cash Flow is a useful metric in assessing the Company’s cash flows to service debt, pay dividends and to fund acquisitions and share repurchases. Management deems capital expenditures essential to the Company’s product and service innovations and maintenance of Moody’s operational capabilities. Accordingly, capital expenditures are deemed to be a recurring use of Moody’s cash flow.
Below is a reconciliation of the Company’s net cash flows from operating activities to Free Cash Flow:
| | | | | | | | | | | |
| Year Ended December 31, |
| Amounts in millions | 2023 | | 2022 |
| Net cash provided by operating activities | $ | 2,151 | | | $ | 1,474 | |
| Capital additions | (271) | | | (283) | |
| Free Cash Flow | $ | 1,880 | | | $ | 1,191 | |
| Net cash used in investing activities | $ | (247) | | | $ | (262) | |
| Net cash used in financing activities | $ | (1,584) | | | $ | (1,208) | |
Table 9 - Constant Currency Revenue Growth (Unaudited)
The Company presents constant currency revenue growth as its non-GAAP measure of revenue growth. Management deems this measure to be useful in providing additional perspective in assessing the Company's revenue growth excluding the impacts of changes in foreign exchange rates. The Company calculates the dollar impact of foreign exchange as the difference between the translation of its current period non-USD functional currency results using comparative prior period weighted average foreign exchange translation rates and current year reported results.
Below is a reconciliation of the Company's reported revenue and growth rates to its constant currency revenue growth measures:
| | | | | | | | | | | | | | | | | | | | | | | | | | | | | | | | | | |
| | Three Months Ended December 31, | | |
| Amounts in millions | | 2023 | | 2022 | | Change | | Growth | | | | | | | | |
| MCO revenue | | $ | 1,480 | | | $ | 1,290 | | | $ | 190 | | | 15% | | | | | | | | |
| FX impact | | (21) | | | — | | | (21) | | | | | | | | | | | |
| | | | | | | | | | | | | | | | |
| Constant currency MCO revenue | | $ | 1,459 | | | $ | 1,290 | | | $ | 169 | | | 13% | | | | | | | | |
| | | | | | | | | | | | | | | | |
| MA revenue | | $ | 796 | | | $ | 714 | | | $ | 82 | | | 11% | | | | | | | | |
| FX impact | | (12) | | | — | | | (12) | | | | | | | | | | | |
| | | | | | | | | | | | | | | | |
| Constant currency MA revenue | | $ | 784 | | | $ | 714 | | | $ | 70 | | | 10% | | | | | | | | |
| | | | | | | | | | | | | | | | |
| Decision Solutions revenue | | $ | 361 | | | $ | 329 | | | $ | 32 | | | 10% | | | | | | | | |
| FX impact | | (5) | | | — | | | (5) | | | | | | | | | | | |
| | | | | | | | | | | | | | | | |
| Constant currency Decision Solutions revenue | | $ | 356 | | | $ | 329 | | | $ | 27 | | | 8% | | | | | | | | |
| | | | | | | | | | | | | | | | |
| Research and Insights revenue | | $ | 230 | | | $ | 205 | | | $ | 25 | | | 12% | | | | | | | | |
| FX impact | | (2) | | | — | | | (2) | | | | | | | | | | | |
| | | | | | | | | | | | | | | | |
| Constant currency Research and Insights revenue | | $ | 228 | | | $ | 205 | | | $ | 23 | | | 11% | | | | | | | | |
| | | | | | | | | | | | | | | | |
| Data and Information revenue | | $ | 205 | | | $ | 180 | | | $ | 25 | | | 14% | | | | | | | | |
| FX impact | | (5) | | | — | | | (5) | | | | | | | | | | | |
| | | | | | | | | | | | | | | | |
| Constant currency Data and Information revenue | | $ | 200 | | | $ | 180 | | | $ | 20 | | | 11% | | | | | | | | |
| | | | | | | | | | | | | | | | |
| MIS revenue | | $ | 684 | | | $ | 576 | | | $ | 108 | | | 19% | | | | | | | | |
| FX impact | | (9) | | | — | | | (9) | | | | | | | | | | | |
| | | | | | | | | | | | | | | | |
| Constant currency MIS revenue | | $ | 675 | | | $ | 576 | | | $ | 99 | | | 17% | | | | | | | | |
| | | | | | | | | | | | | | | | |
| | | | | | | | | | | | | | | | |
| | | | | | | | | | | | | | | | |
| | | | | | | | | | | | | | | | |
| | | | | | | | | | | | | | | | |
| | | | | | | | | | | | | | | | |
| | | | | | | | | | | | | | | | |
| | | | | | | | | | | | | | | | |
| | | | | | | | | | | | | | | | |
| | | | | | | | | | | | | | | | |
| | | | | | | | | | | | | | | | |
| | | | | | | | | | | | | | | | |
| | | | | | | | | | | | | | | | |
| | | | | | | | | | | | | | | | |
| | | | | | | | | | | | | | | | |
| | | | | | | | | | | | | | | | |
| | | | | | | | | | | | | | | | |
| | | | | | | | | | | | | | | | |
| | | | | | | | | | | | | | | | |
| | | | | | | | | | | | | | | | |
| | | | | | | | | | | | | | | | |
| | | | | | | | | | |
| | | | | | | | | | | | | | | | |
| | | | | | | | | | | | | | | | |
| | | | | | | | | | | | | | | | |
| | | | | | | | | | | | | | | | |
| | | | | | | | | | | | | | | | |
| | | | | | | | | | | | | | | | |
| | | | | | | | | | |
| | | | | | | | | | | | | | | | |
| | | | | | | | | | | | | | | | |
| | | | | | | | | | | | | | | | |
| | | | | | | | | | | | | | | | |
| | | | | | | | | | | | | | | | |
| | | | | | | | | | | | | | | | |
| | | | |
| | | | | | | | | | | | | | | | |
| | | | | | | | | | | | | | | | |
| | | | | | | | | | | | | | | | |
| | | | | | | | | | | | | | | | |
| | | | | | | | | | | | | | | | |
| | | | | | | | | | | | | | | | |
| | | | | | | | | | | | | | | | |
| | | | | | | | | | | | | | | | |
| | | | | | | | | | | | | | | | |
Table 10 - Key Performance Metrics - Annualized Recurring Revenue (Unaudited)
The Company presents Annualized Recurring Revenue (“ARR”) on a constant currency organic basis for its MA business as a supplemental performance metric to provide additional insight on the estimated value of MA's recurring revenue contracts at a given point in time. The Company uses ARR to manage and monitor performance of its MA operating segment and believes that this metric is a key indicator of the trajectory of MA's recurring revenue base.
The Company calculates ARR by taking the total recurring contract value for each active renewable contract as of the reporting date, divided by the number of days in the contract and multiplied by 365 days to create an annualized value. The Company defines renewable contracts as subscriptions, term licenses, maintenance and renewable services. ARR excludes transaction sales including training, one-time services and perpetual licenses. In order to compare period-over-period ARR excluding the effects of foreign currency translation, the Company bases the calculation on currency rates utilized in its current year operating budget and holds these FX rates constant for the duration of all current and prior periods being reported. Additionally, ARR excludes contracts related to acquisitions to provide additional perspective in assessing growth excluding the impacts from certain acquisition activity.
The Company’s definition of ARR may differ from definitions utilized by other companies reporting similarly named measures, and this metric should be viewed in addition to, and not as a substitute for, financial measures presented in accordance with U.S. GAAP.
| | | | | | | | | | | | | | | | | | | | | | | |
| Amounts in millions | December 31, 2023 | | December 31, 2022 | | Change | | Growth |
| MA ARR | | | | | | | |
| Decision Solutions | | | | | | | |
| Banking | $ | 418 | | | $ | 385 | | | $ | 33 | | | 9% |
| Insurance | 533 | | | 482 | | | 51 | | | 11% |
| KYC | 326 | | | 279 | | | 47 | | | 17% |
| Total Decision Solutions | $ | 1,277 | | | $ | 1,146 | | | $ | 131 | | | 11% |
| Research and Insights | 879 | | | 819 | | | 60 | | | 7% |
| Data and Information | 806 | | | 733 | | | 73 | | | 10% |
| Total MA ARR | $ | 2,962 | | | $ | 2,698 | | | $ | 264 | | | 10% |
| | | | | | | |
Table 11 - Adjusted Net Income and Adjusted Diluted EPS Attributable to Moody's Common Shareholders (Unaudited)
The Company presents Adjusted Net Income and Adjusted Diluted EPS because management deems these metrics to be useful measures to provide additional perspective on Moody's operating performance. Adjusted Net Income and Adjusted Diluted EPS exclude the impact of: i) amortization of acquired intangible assets; ii) restructuring charges/adjustments; iii) a gain on the extinguishment of debt; and iv) FX translation losses reclassified to earnings resulting from the Company no longer conducting commercial operations in Russia.
The Company excludes the impact of amortization of acquired intangible assets as companies utilize intangible assets with different estimated useful lives and have different methods of acquiring and amortizing intangible assets. These intangible assets were recorded as part of acquisition accounting and contribute to revenue generation. The amortization of intangible assets related to acquisitions will recur in future periods until such intangible assets have been fully amortized. Furthermore, the timing and magnitude of business combination transactions are not predictable and the purchase price allocated to amortizable intangible assets and the related amortization period are unique to each acquisition and can vary significantly from period to period and across companies. Restructuring charges/adjustments, the gain on extinguishment of debt, and FX translation losses resulting from the Company no longer conducting commercial operations in Russia are excluded as the frequency and magnitude of these items may vary widely across periods and companies.
The Company excludes the aforementioned items to provide additional perspective when comparing net income and diluted EPS from period to period and across companies as the frequency and magnitude of similar transactions may vary widely across periods.
Below is a reconciliation of these measures to their most directly comparable U.S. GAAP measures:
| | | | | | | | | | | | | | | | | | | | | | | | | | | | | | | | | | | |
| Three Months Ended December 31, | | Year Ended December 31, |
| Amounts in millions | 2023 | | 2022 | | 2023 | | 2022 |
| Net income attributable to Moody's common shareholders | | $ | 340 | | | | $ | 246 | | | | $ | 1,607 | | | | $ | 1,374 | |
| Pre-tax Acquisition-Related Intangible Amortization Expenses | $ | 48 | | | | $ | 50 | | | | $ | 198 | | | | $ | 200 | | |
| Tax on Acquisition-Related Intangible Amortization Expenses | (12) | | | | (12) | | | | (48) | | | | (47) | | |
| Net Acquisition-Related Intangible Amortization Expenses | | 36 | | | | 38 | | | | 150 | | | | 153 | |
| Pre-tax restructuring | $ | 36 | | | | $ | 82 | | | | $ | 87 | | | | $ | 114 | | |
| Tax on restructuring | (10) | | | | (18) | | | | (22) | | | | (26) | | |
| Net restructuring | | 26 | | | | 64 | | | | 65 | | | | 88 | |
| Pre-tax gain on extinguishment of debt | $ | — | | | | $ | (70) | | | | $ | — | | | | $ | (70) | | |
| Tax on gain on extinguishment of debt | — | | | | 17 | | | | — | | | | 17 | | |
| Net gain on extinguishment of debt | | — | | | | (53) | | | | — | | | | (53) | |
| FX losses resulting from the Company no longer conducting commercial operations in Russia | | — | | | | — | | | | — | | | | 20 | |
| Adjusted Net Income | | $ | 402 | | | | $ | 295 | | | | $ | 1,822 | | | | $ | 1,582 | |
| | | | | | | | | | | |
Note: The tax impacts in the tables above were calculated using tax rates in effect in the jurisdiction for which the item relates.
Table 11 - Adjusted Net Income and Adjusted Diluted EPS Attributable to Moody's Common Shareholders (Unaudited) Continued | | | | | | | | | | | | | | | | | | | | | | | | | | | | | | | | | | | |
| | | | | | | | | | | |
| Three Months Ended December 31, | | Year Ended December 31, |
| Amounts in millions | 2023 | | 2022 | | 2023 | | 2022 |
| Diluted earnings per share attributable to Moody's common shareholders | | $ | 1.85 | | | | $ | 1.34 | | | | $ | 8.73 | | | | $ | 7.44 | |
| Pre-tax Acquisition-Related Intangible Amortization Expenses | $ | 0.26 | | | | $ | 0.27 | | | | $ | 1.08 | | | | $ | 1.08 | | |
| Tax on Acquisition-Related Intangible Amortization Expenses | (0.06) | | | | (0.07) | | | | (0.26) | | | | (0.25) | | |
| Net Acquisition-Related Intangible Amortization Expenses | | 0.20 | | | | 0.20 | | | | 0.82 | | | | 0.83 | |
| Pre-tax restructuring | $ | 0.20 | | | | $ | 0.45 | | | | $ | 0.47 | | | | $ | 0.62 | | |
| Tax on restructuring | (0.06) | | | | (0.10) | | | | (0.12) | | | | (0.14) | | |
| Net restructuring | | 0.14 | | | | 0.35 | | | | 0.35 | | | | 0.48 | |
| Pre-tax gain on extinguishment of debt | $ | — | | | | $ | (0.38) | | | | $ | — | | | | $ | (0.38) | | |
| Tax on gain on extinguishment of debt | — | | | | 0.09 | | | | — | | | | 0.09 | | |
| Net gain on extinguishment of debt | | — | | | | (0.29) | | | | — | | | | (0.29) | |
| FX losses resulting from the Company no longer conducting commercial operations in Russia | | — | | | | — | | | | — | | | | 0.11 | |
| | | | | | | | | | | |
| | | | | | | | | | | |
| | | | | | | | | | | |
| Adjusted Diluted EPS | | $ | 2.19 | | | | $ | 1.60 | | | | $ | 9.90 | | | | $ | 8.57 | |
| | |
| Note: The tax impacts in the tables above were calculated using tax rates in effect in the jurisdiction for which the item relates. |
Table 12 - 2024 Outlook
Moody’s updated outlook for full year 2024, as of February 13, 2024, reflects assumptions about numerous factors that could affect its business and is based on currently available information reviewed by management through, and as of, today’s date. For a complete list of these assumptions, please refer to “Assumptions and Outlook” on page 10 of this earnings release. | | | | | |
| Full Year 2024 Moody's Corporation Guidance as of February 13, 2024 |
| MOODY'S CORPORATION | Current guidance |
| Revenue | Increase in the high-single-digit to low-double-digit percent range |
| Operating Expenses | Increase in the mid-to-high-single-digit percent range |
| Operating Margin | 37% to 39% |
Adjusted Operating Margin (1) | 44% to 46% |
| Interest Expense, Net | $240 - $260 million |
| Effective Tax Rate | 22% to 24% |
| Diluted EPS | $9.45 to $10.20 |
Adjusted Diluted EPS (1) | $10.25 to $11.00 |
| Operating Cash Flow | $2.3 to $2.5 billion |
Free Cash Flow (1) | $1.9 to $2.1 billion |
| Share Repurchases | Approximately $1.0 billion (subject to available cash, market conditions, M&A opportunities, and other ongoing capital allocation decisions) |
| Moody's Analytics (MA) | Current guidance |
| MA Revenue | Increase of approximately 10% |
ARR (2) | Increase in the low-double-digit percent range |
| MA Adjusted Operating Margin | 30% to 31% |
| Moody's Investors Service (MIS) | Current guidance |
| MIS Revenue | Increase in the high-single-digit to low-double-digit percent range |
| MIS Adjusted Operating Margin | 55.5% to 57.5% |
(1) These metrics are adjusted measures. See below for reconciliation of these measures to their comparable U.S. GAAP measure. (2) Refer to Table 10 within this earnings release for the definition of and further information on the ARR metric. |
The following are reconciliations of the Company's adjusted forward looking measures to their comparable U.S. GAAP measure: | | | | | |
| Projected for the Year Ended December 31, 2024 |
| Operating margin guidance | 37% to 39% |
| Depreciation and amortization | Approximately 7% |
| |
| Adjusted Operating Margin guidance | 44% to 46% |
| |
| Projected for the Year Ended
December 31, 2024 |
| Operating cash flow guidance | $2.3 to $2.5 billion |
| Less: Capital expenditures | Approximately $0.4 billion |
| Free Cash Flow guidance | $1.9 to $2.1 billion |
| |
| Projected for the Year Ended
December 31, 2024 |
| Diluted EPS guidance | $9.45 to $10.20 |
| Acquisition-Related Intangible Amortization | Approximately $0.80 |
| |
| Adjusted Diluted EPS guidance | $10.25 to $11.00 |