UNITED STATES
SECURITIES AND EXCHANGE COMMISSION
Washington, D.C. 20549
(Mark one) | | | | | |
| ☑ | QUARTERLY REPORT PURSUANT TO SECTION 13 OR 15(d) OF THE SECURITIES EXCHANGE ACT OF 1934 |
For the quarterly period ended September 30, 2024
Or | | | | | |
| ☐ | TRANSITION REPORT PURSUANT TO SECTION 13 OR 15(d) OF THE SECURITIES EXCHANGE ACT OF 1934 |
For the transition period from to
Commission file number 1-14037
____________________
Moody’s Corporation
(Exact name of registrant as specified in its charter) | | | | | | | | | | | |
| Delaware | | 13-3998945 |
| (State of Incorporation) | | (I.R.S. Employer Identification No.) |
7 World Trade Center at 250 Greenwich Street, New York, New York 10007
(Address of Principal Executive Offices)
(Zip Code)
Registrant’s telephone number, including area code:
(212) 553-0300
Securities registered pursuant to Section 12(b) of the Act: | | | | | | | | | | | | | | |
| Title of each class | | Trading Symbol(s) | | Name of each exchange on which registered |
| Common Stock, par value $0.01 per share | | MCO | | New York Stock Exchange |
| 1.75% Senior Notes Due 2027 | | MCO 27 | | New York Stock Exchange |
| 0.950% Senior Notes Due 2030 | | MCO 30 | | New York Stock Exchange |
Indicate by check mark whether the registrant (1) has filed all reports required to be filed by Sections 13 or 15(d) of the Securities Exchange Act of 1934 during the preceding 12 months (or for such shorter period that the registrant was required to file such reports), and (2) has been subject to such filing requirements for the past 90 days. Yes ☑ No ☐
Indicate by check mark whether the registrant has submitted electronically, every Interactive Data File required to be submitted pursuant to Rule 405 of Regulation S-T during the preceding 12 months (or for such shorter period that the registrant was required to submit such files). Yes ☑ No ☐
Indicate by check mark whether the registrant is a large accelerated filer, an accelerated filer, a non-accelerated filer, smaller reporting company, or an emerging growth company. See the definitions of “large accelerated filer,” “accelerated filer,” “smaller reporting company,” and “emerging growth company” in Rule 12b-2 of the Exchange Act. (Check one): | | | | | | | | | | | | | | |
| Large Accelerated Filer | ☑ | | Accelerated filer | ☐ |
| Non-accelerated filer | ☐ | | Smaller reporting company | ☐ |
| Emerging growth company | ☐ | | | |
If an emerging growth company, indicate by check mark if the registrant has elected not to use the extended transition period for complying with any new or revised financial accounting standards provided pursuant to Section 13(a) of the Exchange Act. ☐
Indicate by check mark whether the registrant is a shell company (as defined in Rule 12b-2 of the Exchange Act). Yes ☐ No ☑
Indicate the number of shares outstanding of each of the issuer’s classes of common stock, as of the latest practicable date:
| | |
| Shares Outstanding at September 30, 2024 |
| 181.2 million |
| | | | | | | | |
| MOODY’S CORPORATION
INDEX TO FORM 10-Q | |
| Page(s) |
| |
| | |
| | |
| | |
| | |
| | |
| | |
| | |
| | |
| | |
| | |
| | |
| | |
| | |
| | |
| | |
| | |
| | |
| | |
| | |
| | |
| | |
| | |
| | |
| |
|
| | |
| | |
| | |
| | |
| | |
| | |
| |
GLOSSARY OF TERMS AND ABBREVIATIONS
The following terms, abbreviations and acronyms are used to identify frequently used terms in this report: | | | | | |
| TERM | DEFINITION |
| |
| |
| ABS | Asset backed securities; a component of SFG |
| Acquisition-Related Intangible Amortization Expense | Amortization of definite-lived intangible assets acquired by the Company from all business combination transactions |
| |
| Adjusted Diluted EPS | Diluted EPS excluding the impact of certain items as detailed in the section entitled “Non-GAAP Financial Measures” |
| Adjusted Net Income | Net Income excluding the impact of certain items as detailed in the section entitled “Non-GAAP Financial Measures” |
| Adjusted Operating Income | Operating income excluding the impact of certain items as detailed in the section entitled “Non-GAAP Financial Measures” |
| Adjusted Operating Margin | Adjusted Operating Income divided by revenue |
| Americas | Represents countries within North and South America, excluding the U.S. |
| |
| |
| ARR | Annualized Recurring Revenue; a supplemental performance metric to provide additional insight on the estimated value of MA's recurring revenue contracts at a given point in time, excluding the impact of FX and contracts related to acquisitions |
| ASC | The FASB Accounting Standards Codification; the sole source of authoritative GAAP as of July 1, 2009 except for rules and interpretive releases of the SEC, which are also sources of authoritative GAAP for SEC registrants |
| Asia-Pacific | Represents Australia and countries in Asia including but not limited to: China, India, Indonesia, Japan, Republic of South Korea, Malaysia, Singapore, Sri Lanka and Thailand |
| ASU | The FASB Accounting Standards Update to the ASC. Provides background information for accounting guidance and the bases for conclusions on the changes in the ASC. ASUs are not considered authoritative until codified into the ASC |
| AUD | Australian dollar |
| BitSight | A provider that helps global market participants understand cyber risk through ratings, analytics, and performance management tools |
| Board | The board of directors of the Company |
| BPS | Basis points |
| |
| |
| |
| CAD | Canadian dollar |
| CCXI | China Cheng Xin International Credit Rating Co. Ltd.; China’s first and largest domestic credit rating agency approved by the People’s Bank of China; currently Moody’s owns 30% of CCXI |
| CDP | Carbon Disclosure Project; an international nonprofit organization that helps companies, cities, states and regions manage their environmental impact through a global disclosure system |
| CFG | Corporate finance group; an LOB of MIS |
| CLO | Collateralized loan obligation |
| CMBS | Commercial mortgage-backed securities; an asset class within SFG |
| COLI | Corporate-Owned Life Insurance |
| |
| Common Stock | The Company’s common stock |
| Company | Moody’s Corporation and its subsidiaries; MCO; Moody’s |
| CODM | Chief Operating Decision Maker |
| |
| |
| COVID-19 | An outbreak of a novel strain of coronavirus resulting in an international public health crisis and a global pandemic |
| CP | Commercial Paper |
| CP Program | A program entered into on August 3, 2016 allowing the Company to privately place CP up to a maximum of $1 billion for which the maturity may not exceed 397 days from the date of issue, and which is backstopped by the 2024 Facility |
| CRAs | Credit rating agencies |
| |
| |
| Data and Information (D&I) | LOB within MA which provides vast data sets on companies and securities via data feeds and data applications products |
| |
| | | | | |
| TERM | DEFINITION |
| Decision Solutions (DS) | LOB within MA that provides SaaS solutions supporting banking, insurance, and KYC workflows. This LOB utilizes components from the Data & Information and Research & Insights LOBs to provide risk assessment solutions |
| |
| EMEA | Represents countries within Europe, the Middle East and Africa |
| EPS | Earnings per share |
| |
| ESG | Environmental, Social and Governance |
| |
| |
| ESTR | Euro Short-Term Rate |
| ETR | Effective tax rate |
| EU | European Union |
| EUR | euros |
| |
| Excess Tax Benefits | The difference between the tax benefit realized at exercise of an option or delivery of a restricted share and the tax benefit recorded at the time the option or restricted share is expensed under GAAP |
| Exchange Act | The Securities Exchange Act of 1934, as amended |
| External Revenue | Revenue excluding any intersegment amounts |
| FASB | Financial Accounting Standards Board |
| FIG | Financial institutions group; an LOB of MIS |
| |
| Free Cash Flow | Net cash provided by operating activities less cash paid for capital additions |
| |
| FX | Foreign exchange |
| GAAP | U.S. Generally Accepted Accounting Principles |
| GBP | British pounds |
| GCR (Global Credit Rating Company Limited and subsidiaries) | A domestic credit rating agency with operations spanning Africa; the Company acquired a controlling financial interest in GCR in July 2024; the Company previously accounted for GCR as an equity method investment |
| GDP | Gross domestic product |
| GLoBE | Global Anti-Base Erosion, also known as "Pillar II;" tax model issued by the OECD in 2023 |
| |
| ICRA | ICRA Limited; a provider of credit ratings and research in India |
| |
| INR | Indian rupee |
| |
| |
| |
| |
| |
| |
| |
| JPY | Japanese yen |
| KYC | Know-your-customer |
| |
| LOB | Line of business |
| MA | Moody’s Analytics - a reportable segment of MCO; a global provider of: i) data and information; ii) research and insights; and iii) decision solutions, which help companies make better and faster decisions. MA leverages its unique assets and specialized industry knowledge across multiple risks such as credit, market, financial crime, supply chain, catastrophe and climate to deliver integrated risk assessment solutions that enable business leaders to identify, measure and manage the implications of interrelated risks and opportunities |
| |
| MAKS | Moody’s Analytics Knowledge Services; formerly known as Copal Amba; provided offshore research and analytic services to the global financial and corporate sectors; business was divested in the fourth quarter of 2019 and was formerly a reporting unit within the MA reportable segment |
| |
| MCO | Moody’s Corporation and its subsidiaries; the Company; Moody’s |
| MD&A | Management’s Discussion and Analysis of Financial Condition and Results of Operations |
| M&A | Mergers and acquisitions |
| MIS | Moody’s Investors Service - a reportable segment of MCO; MIS publishes credit ratings and provides assessment services on a wide range of debt obligations, programs and facilities, and the entities that issue such obligations in markets worldwide, including various corporate, financial institution and governmental obligations, and structured finance securities; consists of five LOBs - SFG; CFG; FIG; PPIF; and MIS Other |
| MIS Other | Consists of financial instruments pricing services in the Asia-Pacific region, ICRA non-ratings revenue, and revenue from professional services. These businesses are components of MIS; MIS Other is an LOB of MIS |
| Moody’s | Moody’s Corporation and its subsidiaries; MCO; the Company |
| | | | | |
| TERM | DEFINITION |
| MSS | Moody's Shared Services; primarily consists of information technology and support staff such as finance, human resources and legal that support both MA and MIS |
| |
| |
| Net Income | Net income attributable to Moody’s Corporation, which excludes net income from consolidated noncontrolling interests belonging to the minority interest holder |
| |
| |
| NM | Percentage change is not meaningful |
| Non-GAAP | A financial measure not in accordance with GAAP; these measures, when read in conjunction with the Company’s reported results, can provide useful supplemental information for investors analyzing period-to-period comparisons of the Company’s performance, facilitate comparisons to competitors’ operating results and to provide greater transparency to investors of supplemental information used by management in its financial and operational decision making |
| NRSRO | Nationally Recognized Statistical Rating Organization, which is a credit rating agency registered with the SEC |
| |
| |
| |
| OECD | Organization for Economic Co-operation and Development; an international organization that promotes policies that improve economic and social well-being around the world |
| Operating segment | Term defined in the ASC relating to segment reporting; the ASC defines an operating segment as a component of a business entity that has each of the three following characteristics: i) the component engages in business activities from which it may recognize revenue and incur expenses; ii) the operating results of the component are regularly reviewed by the entity’s CODM; and iii) discrete financial information about the component is available |
| |
| |
| Pillar II | Tax model issued by the OECD in 2023; also referred to as the "Global Anti-Base Erosion" or "GLoBE" rules |
| PPIF | Public, project and infrastructure finance; an LOB of MIS |
| |
| |
| |
| |
| |
| |
| |
| Praedicat | A provider of casualty insurance analytics; the Company acquired a controlling financial interest in Praedicat in September 2024; the Company previously accounted for Praedicat as an equity method investment |
| Recurring Revenue | For MA, represents subscription-based revenue and software maintenance revenue. For MIS, represents recurring monitoring fees of a rated debt obligation and/or entities that issue such obligations, as well as revenue from programs such as commercial paper, medium-term notes and shelf registrations. For MIS Other, represents subscription-based revenue |
| |
| |
| |
| |
| Reporting unit | The level at which Moody’s evaluates its goodwill for impairment under GAAP; defined as an operating segment or one level below an operating segment |
| Research and Insights (R&I) | LOB within MA that provides models, scores, expert insights and commentary. This LOB includes credit research; credit models and analytics; economics data and models; and structured finance solutions |
| |
| |
| RMBS | Residential mortgage-backed securities; an asset class within SFG |
| |
| RMS | Risk Management Solutions, Inc., a global provider of climate and natural disaster risk modeling and analytics; acquired by the Company in September 2021 |
| SaaS | Software-as-a-Service |
| |
| |
| SEC | U.S. Securities and Exchange Commission |
| |
| SFG | Structured finance group; an LOB of MIS |
| SG&A | Selling, general and administrative expenses |
| SGD | Singapore dollar |
| SOFR | Secured Overnight Financing Rate |
| Tax Act | The “Tax Cuts and Jobs Act” enacted into U.S. law on December 22, 2017 which significantly amends the tax code in the U.S. |
| |
| Total Debt | All indebtedness of the Company as reflected on the consolidated balance sheets |
| Transaction Revenue | For MA, represents perpetual software license fees and revenue from software implementation services, risk management advisory projects, and training and certification services. For MIS (excluding MIS Other), represents the initial rating of a new debt issuance as well as other one-time fees. For MIS Other, represents revenue from professional services. |
| U.K. | United Kingdom |
| U.S. | United States |
| USD | U.S. dollar |
| | | | | |
| TERM | DEFINITION |
| UTPs | Uncertain tax positions |
| |
| |
| |
| |
| |
| |
| |
| |
| |
| |
| |
| 2022 - 2023 Geolocation Restructuring Program | Restructuring program approved by the chief executive officer of Moody’s on June 30, 2022 relating to the Company's post-COVID-19 geolocation strategy |
| |
| |
| |
| |
| |
| |
| |
| |
| |
| |
| |
| |
| |
| |
| |
| |
| |
PART I. FINANCIAL INFORMATION
Item 1. Financial Statements
MOODY’S CORPORATION
CONSOLIDATED STATEMENTS OF OPERATIONS (UNAUDITED)
(Amounts in millions, except per share data)
| | | | | | | | | | | | | | | | | | | | | | | |
| Three Months Ended September 30, | | Nine Months Ended
September 30, |
| 2024 | | 2023 | | 2024 | | 2023 |
| Revenue | $ | 1,813 | | | $ | 1,472 | | | $ | 5,416 | | | $ | 4,436 | |
| Expenses | | | | | | | |
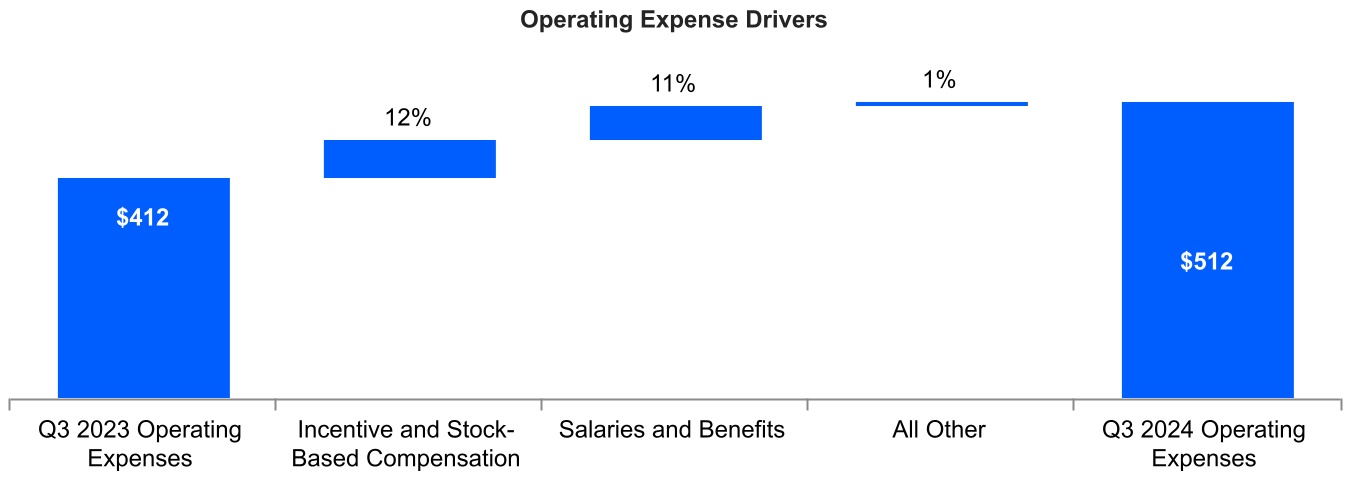
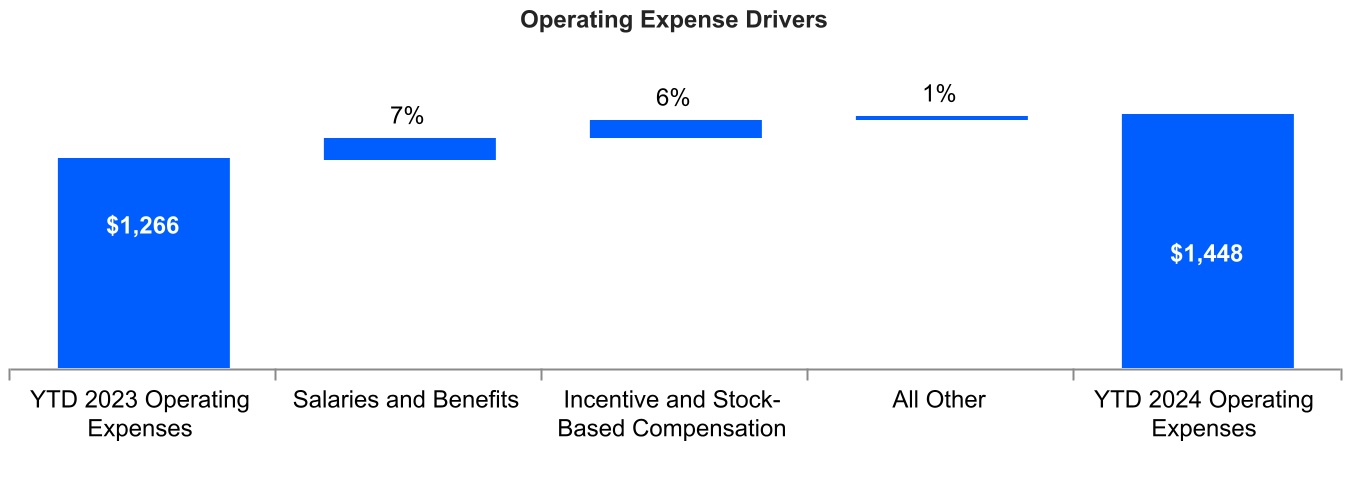
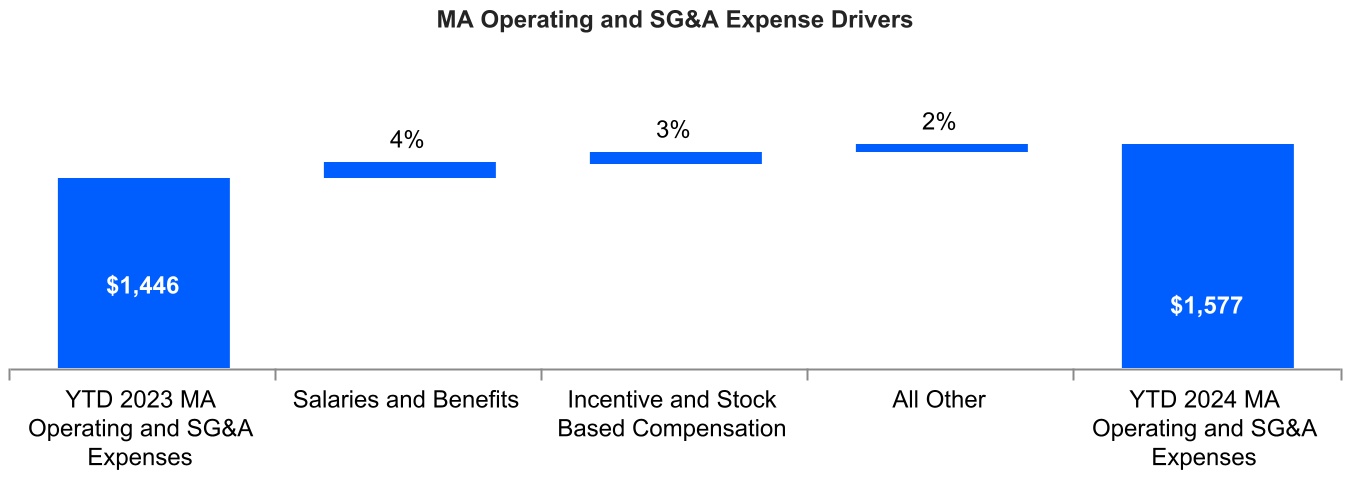
| Operating | 512 | | | 412 | | | 1,448 | | | 1,266 | |
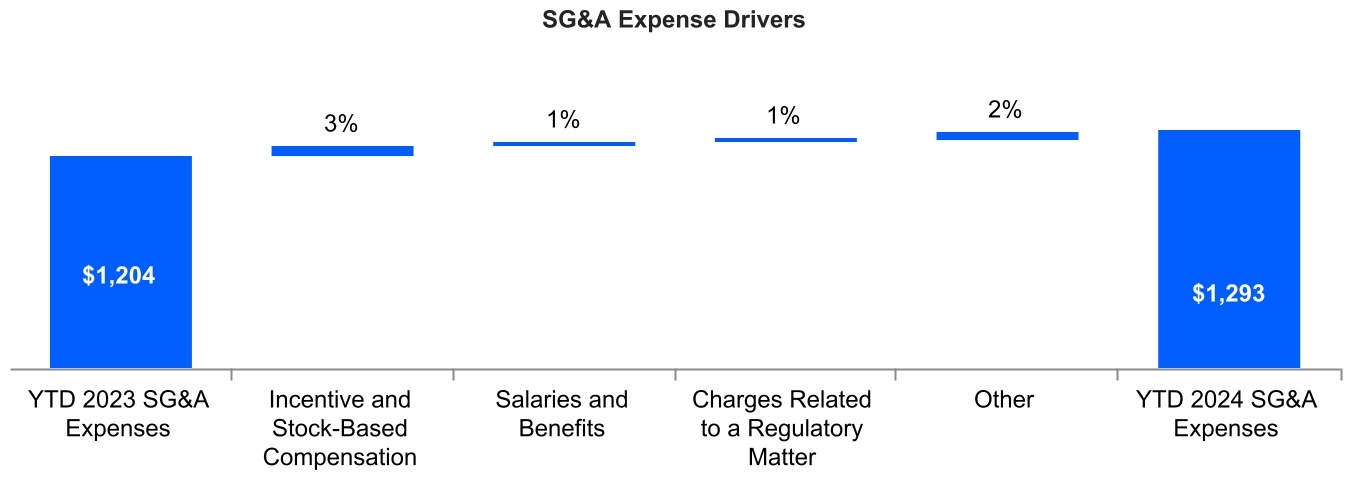
| Selling, general, and administrative | 434 | | | 403 | | | 1,293 | | | 1,204 | |
| Depreciation and amortization | 108 | | | 95 | | | 318 | | | 276 | |
| Restructuring | 6 | | | 27 | | | 13 | | | 51 | |
| Charges related to asset abandonment | 15 | | | — | | | 30 | | | — | |
| | | | | | | |
| Total expenses | 1,075 | | | 937 | | | 3,102 | | | 2,797 | |
| Operating income | 738 | | | 535 | | | 2,314 | | | 1,639 | |
| Non-operating (expense) income, net | | | | | | | |
| Interest expense, net | (60) | | | (66) | | | (185) | | | (185) | |
| Other non-operating income, net | 25 | | | 18 | | | 45 | | | 31 | |
| Total non-operating (expense) income, net | (35) | | | (48) | | | (140) | | | (154) | |
| Income before provision for income taxes | 703 | | | 487 | | | 2,174 | | | 1,485 | |
| Provision for income taxes | 169 | | | 97 | | | 510 | | | 217 | |
| Net income | 534 | | | 390 | | | 1,664 | | | 1,268 | |
| Less: Net income attributable to noncontrolling interests | — | | | 1 | | | 1 | | | 1 | |
| Net income attributable to Moody's | $ | 534 | | | $ | 389 | | | $ | 1,663 | | | $ | 1,267 | |
| Earnings per share attributable to Moody's common shareholders | | | | | | | |
| Basic | $ | 2.94 | | | $ | 2.12 | | | $ | 9.13 | | | $ | 6.91 | |
| Diluted | $ | 2.93 | | | $ | 2.11 | | | $ | 9.09 | | | $ | 6.88 | |
| Weighted average number of shares outstanding | | | | | | | |
| Basic | 181.7 | | | 183.3 | |
| 182.2 | | | 183.4 | |
| Diluted | 182.5 | | | 184.0 | |
| 183.0 | | | 184.1 | |
The accompanying notes are an integral part of the consolidated financial statements.
MOODY’S CORPORATION
CONSOLIDATED STATEMENTS OF COMPREHENSIVE INCOME (UNAUDITED)
(Amounts in millions)
| | | | | | | | | | | | | | | | | | | | | | | | | | | | | | | | | | | |
| | | | | | | | | | | |
| Three Months Ended September 30, 2024 | | Three Months Ended September 30, 2023 |
| Pre-tax
amounts | | Tax
amounts | | After-tax
amounts | | Pre-tax
amounts | | Tax
amounts | | After-tax
amounts |
| Net Income | | | | | $ | 534 | | | | | | | $ | 390 | |
| Other Comprehensive Income (Loss): | | | | | | | | | | | |
| Foreign Currency Adjustments: | | | | | | | | | | | |
| Foreign currency translation adjustments, net | $ | 252 | | | $ | (3) | | | 249 | | | $ | (174) | | | $ | (2) | | | (176) | |
| | | | | | | | | | | |
| Net (losses) gains on net investment hedges | (184) | | | 48 | | | (136) | | | 124 | | | (31) | | | 93 | |
| | | | | | | | | | | |
| Cash Flow Hedges: | | | | | | | | | | | |
| | | | | | | | | | | |
| Reclassification of losses included in net income | 1 | | | — | | | 1 | | | 1 | | | — | | | 1 | |
| Pension and Other Retirement Benefits: | | | | | | | | | | | |
| Amortization of actuarial gains and prior service credits included in net income | — | | | — | | | — | | | (1) | | | — | | | (1) | |
| Net actuarial gains | — | | | — | | | — | | | 2 | | | (1) | | | 1 | |
| Total other comprehensive income (loss) | $ | 69 | | | $ | 45 | | | $ | 114 | | | $ | (48) | | | $ | (34) | | | $ | (82) | |
| | | | | | | | | | | |
| | | | | | | | | | | |
| Comprehensive Income Attributable to Moody's | | | | | $ | 648 | | | | | | | $ | 308 | |
| | | | | | | | | | | | | | | | | | | | | | | | | | | | | | | | | | | |
| Nine Months Ended
September 30, 2024 | | Nine Months Ended
September 30, 2023 |
| |
| Pre-tax
amounts | | Tax
amounts | | After-tax
amounts | | Pre-tax
amounts | | Tax
amounts | | After-tax
amounts |
| Net Income | | | | | $ | 1,664 | | | | | | | $ | 1,268 | |
| Other Comprehensive Income (Loss): | | | | | | | | | | | |
| Foreign Currency Adjustments: | | | | | | | | | | | |
| Foreign currency translation adjustments, net | $ | 98 | | | $ | (3) | | | 95 | | | $ | (14) | | | $ | (4) | | | (18) | |
| | | | | | | | | | | |
| Net (losses) gains on net investment hedges | (40) | | | 10 | | | (30) | | | 11 | | | (3) | | | 8 | |
| | | | | | | | | | | |
| Cash Flow Hedges: | | | | | | | | | | | |
| | | | | | | | | | | |
| Reclassification of losses included in net income | 2 | | | — | | | 2 | | | 2 | | | (1) | | | 1 | |
| Pension and Other Retirement Benefits: | | | | | | | | | | | |
| Amortization of actuarial gains and prior service credits included in net income | (1) | | | — | | | (1) | | | (3) | | | 1 | | | (2) | |
| Net actuarial (losses) gains | (3) | | | 1 | | | (2) | | | 2 | | | (1) | | | 1 | |
| Total other comprehensive loss | $ | 56 | | | $ | 8 | | | $ | 64 | | | $ | (2) | | | $ | (8) | | | $ | (10) | |
| Comprehensive income | | | | | 1,728 | | | | | | | 1,258 | |
| Less: comprehensive loss attributable to noncontrolling interests | | | | | — | | | | | | | (1) | |
| Comprehensive Income Attributable to Moody's | | | | | $ | 1,728 | | | | | | | $ | 1,259 | |
The accompanying notes are an integral part of the consolidated financial statements.
MOODY’S CORPORATION
CONSOLIDATED BALANCE SHEETS (UNAUDITED)
(Amounts in millions, except share and per share data) | | | | | | | | | | | |
| September 30, 2024 | | December 31, 2023 |
| ASSETS | | | |
| Current assets: | | | |
| Cash and cash equivalents | $ | 2,642 | | | $ | 2,130 | |
| Short-term investments | 573 | | | 63 | |
| Accounts receivable, net of allowance for credit losses of $35 in 2024 and $35 in 2023 | 1,708 | | | 1,659 | |
| Other current assets | 470 | | | 489 | |
| | | |
| Total current assets | 5,393 | | | 4,341 | |
| Property and equipment, net of accumulated depreciation of $1,442 in 2024 and $1,272 in 2023 | 662 | | | 603 | |
| Operating lease right-of-use assets | 242 | | | 277 | |
| Goodwill | 6,148 | | | 5,956 | |
| Intangible assets, net | 1,970 | | | 2,049 | |
| Deferred tax assets, net | 268 | | | 258 | |
| Other assets | 1,086 | | | 1,138 | |
| Total assets | $ | 15,769 | | | $ | 14,622 | |
| LIABILITIES AND SHAREHOLDERS' EQUITY |
| Current liabilities: | | | |
| Accounts payable and accrued liabilities | $ | 1,133 | | | $ | 1,076 | |
| Current portion of operating lease liabilities | 109 | | | 108 | |
| | | |
| Current portion of long-term debt | 693 | | | — | |
| Deferred revenue | 1,300 | | | 1,316 | |
| | | |
| Total current liabilities | 3,235 | | | 2,500 | |
| Non-current portion of deferred revenue | 59 | | | 65 | |
| Long-term debt | 6,876 | | | 7,001 | |
| Deferred tax liabilities, net | 416 | | | 402 | |
| Uncertain tax positions | 209 | | | 196 | |
| Operating lease liabilities | 245 | | | 306 | |
| Other liabilities | 661 | | | 676 | |
| Total liabilities | 11,701 | | | 11,146 | |
| Contingencies (Note 15) | | | |
| Shareholders' equity: | | | |
| Preferred stock, par value $0.01 per share; 10,000,000 shares authorized; no shares issued and outstanding | — | | | — | |
| Series common stock, par value $0.01 per share; 10,000,000 shares authorized; no shares issued and outstanding | — | | | — | |
| Common stock, par value $0.01 per share; 1,000,000,000 shares authorized; 342,902,272 shares issued at September 30, 2024 and December 31, 2023, respectively | 3 | | | 3 | |
| Capital surplus | 1,390 | | | 1,228 | |
| Retained earnings | 15,855 | | | 14,659 | |
| Treasury stock, at cost; 161,671,601 and 160,430,754 shares of common stock at September 30, 2024 and December 31, 2023, respectively | (12,840) | | | (12,005) | |
| Accumulated other comprehensive loss | (503) | | | (567) | |
| Total Moody's shareholders' equity | 3,905 | | | 3,318 | |
| Noncontrolling interests | 163 | | | 158 | |
| Total shareholders' equity | 4,068 | | | 3,476 | |
| Total liabilities, noncontrolling interests and shareholders' equity | $ | 15,769 | | | $ | 14,622 | |
The accompanying notes are an integral part of the consolidated financial statements.
MOODY’S CORPORATION
CONSOLIDATED STATEMENTS OF CASH FLOWS (UNAUDITED)
(Amounts in millions) | | | | | | | | | | | |
| Nine Months Ended September 30, |
| 2024 | | 2023 |
| Cash flows from operating activities | |
| Net income | $ | 1,664 | | | $ | 1,268 | |
| Reconciliation of net income to net cash provided by operating activities: | | | |
| Depreciation and amortization | 318 | | | 276 | |
| Stock-based compensation | 166 | | | 143 | |
| Deferred income taxes | 9 | | | (10) | |
| Asset impairment and abandonment-related charges | 15 | | | 12 | |
| | | |
| | | |
| Provision for credit losses on accounts receivable | 14 | | | 15 | |
| Gain on previously held equity method investments | (7) | | | — | |
| Changes in assets and liabilities: | | | |
| Accounts receivable | (43) | | | 112 | |
| Other current assets | 25 | | | 151 | |
| | | |
| Other assets | (1) | | | (31) | |
| Lease obligations | (24) | | | (16) | |
| | | |
| Accounts payable and accrued liabilities | 45 | | | (61) | |
| Deferred revenue | (51) | | | (35) | |
| Uncertain tax positions and other non-current tax liabilities | 12 | | | (114) | |
| Other liabilities | 22 | | | (36) | |
| Net cash provided by operating activities | 2,164 | | | 1,674 | |
| Cash flows from investing activities |
| Capital additions | (243) | | | (198) | |
| Purchases of investments | (623) | | | (105) | |
| Sales and maturities of investments | 105 | | | 115 | |
| Purchases of investments in non-consolidated affiliates | (4) | | | (3) | |
| Sales of investments in non-consolidated affiliates | — | | | 1 | |
| | | |
| Cash paid for acquisitions, net of cash acquired | (110) | | | (3) | |
| | | |
| Net cash used in investing activities | (875) | | | (193) | |
| Cash flows from financing activities | | | |
| Repayment of notes | — | | | (500) | |
| Issuance of notes | 496 | | | — | |
| | | |
| | | |
| Proceeds from stock-based compensation plans | 60 | | | 40 | |
| Treasury shares | (812) | | | (278) | |
| | | |
| Repurchase of shares related to stock-based compensation | (85) | | | (67) | |
| Dividends | (465) | | | (424) | |
| Dividends to noncontrolling interests | (1) | | | (2) | |
| Debt issuance costs and related fees | (5) | | | — | |
| | | |
| Net cash used in financing activities | (812) | | | (1,231) | |
| | | |
| Effect of exchange rate changes on cash and cash equivalents | 35 | | | (13) | |
| Increase in cash and cash equivalents | 512 | | | 237 | |
| Cash and cash equivalents, beginning of period | 2,130 | | | 1,769 | |
| Cash and cash equivalents, end of period | $ | 2,642 | | | $ | 2,006 | |
| | | |
| | | |
| | | |
The accompanying notes are an integral part of the consolidated financial statements.
MOODY’S CORPORATION
CONSOLIDATED STATEMENTS OF SHAREHOLDERS’ EQUITY (UNAUDITED)
(Amounts in millions, except per share data)
| | | | | | | | | | | | | | | | | | | | | | | | | | | | | | | | | | | | | | | | | | | | | | | | | | | | | | | | | | | |
| Shareholders of Moody's Corporation | | | |
| Common Stock | | Capital Surplus | | Retained Earnings | | Treasury Stock | | Accumulated
Other
Comprehensive
Loss | | Total Moody's
Shareholders'
Equity | | Non- Controlling
Interests | | Total
Shareholders'
Equity |
| Shares | | Amount | | | Shares | | Amount | |
| Balance at June 30, 2023 | 342.9 | | | $ | 3 | | | $ | 1,124 | | | $ | 14,213 | | | (159.4) | | | $ | (11,626) | | | $ | (570) | | | $ | 3,144 | | | $ | 168 | | | $ | 3,312 | |
| Net income | | | | | | | 389 | | | | | | | | | 389 | | | 1 | | | 390 | |
| Dividends ($0.77 per share) | | | | | | | (142) | | | | | | | | | (142) | | | (8) | | | (150) | |
| Stock-based compensation | | | | | 46 | | | | | | | | | | | 46 | | | | | 46 | |
| Shares issued for stock-based compensation plans at average cost, net | | | | | 5 | | | | | — | | | 2 | | | | | 7 | | | | | 7 | |
| | | | | | | | | | | | | | | | | | | |
| | | | | | | | | | | | | | | | | | | |
| Treasury shares repurchased, inclusive of excise tax | | | | | — | | | | | (0.5) | | | (171) | | | | | (171) | | | | | (171) | |
| | | | | | | | | | | | | | | | | | | |
| Currency translation adjustment, net of net investment hedge activity (net of tax of $33 million) | | | | | | | | | | | | | (83) | | | (83) | | | — | | | (83) | |
| Net actuarial gains and prior service costs (net of tax of $1 million) | | | | | | | | | | | | | 1 | | | 1 | | | | | 1 | |
| Amortization of actuarial gains and prior service credits | | | | | | | | | | | | | (1) | | | (1) | | | | | (1) | |
| Amortization of losses on cash flow hedges | | | | | | | | | | | | | 1 | | | 1 | | | | | 1 | |
| | | | | | | | | | | | | | | | | | | |
| Balance at September 30, 2023 | 342.9 | | | $ | 3 | | | $ | 1,175 | | | $ | 14,460 | | | (159.9) | | | $ | (11,795) | | | $ | (652) | | | $ | 3,191 | | | $ | 161 | | | $ | 3,352 | |
The accompanying notes are an integral part of the consolidated financial statements.
MOODY'S CORPORATION
CONSOLIDATED STATEMENTS OF SHAREHOLDERS' EQUITY (UNAUDITED)
(Amounts in millions, except per share data)
| | | | | | | | | | | | | | | | | | | | | | | | | | | | | | | | | | | | | | | | | | | | | | | | | | | | | | | | | | | | | | |
| Shareholders of Moody's Corporation | | | | | | |
| Common Stock | | Capital
Surplus | | Retained
Earnings | | Treasury Stock | | Accumulated
Other
Comprehensive
Loss | | Total Moody's
Shareholders'
Equity | | Non- Controlling
Interests | | Total
Shareholders'
Equity | | | |
| Shares | | Amount | | | Shares | | Amount | | | | |
| Balance at December 31, 2022 | 342.9 | | | $ | 3 | | | $ | 1,054 | | | $ | 13,618 | | | (159.7) | | | $ | (11,513) | | | $ | (643) | | | $ | 2,519 | | | $ | 170 | | | $ | 2,689 | | | | |
| Net income | | | | | | | 1,267 | | | | | | | | | 1,267 | | | 1 | | | 1,268 | | | | |
| Dividends ($2.31 per share) | | | | | | | (425) | | | | | | | | | (425) | | | (9) | | | (434) | | | | |
| Stock-based compensation | | | | | 143 | | | | | | | | | | | 143 | | | | | 143 | | | | |
| Shares issued for stock-based compensation plans at average cost, net | | | | | (22) | | | | | 0.7 | | | (2) | | | | | (24) | | | | | (24) | | | | |
| | | | | | | | | | | | | | | | | | | | | | |
| | | | | | | | | | | | | | | | | | | | | | |
| | | | | | | | | | | | | | | | | | | | | | |
| Treasury shares repurchased, inclusive of excise tax | | | | | — | | | | | (0.9) | | | (280) | | | | | (280) | | | | | (280) | | | | |
| | | | | | | | | | | | | | | | | | | | | | |
| Currency translation adjustment, net of net investment hedge activity (net of tax of $7 million) | | | | | | | | | | | | | (9) | | | (9) | | | (1) | | | (10) | | | | |
| Net actuarial gains and prior service costs (net of tax of $1 million) | | | | | | | | | | | | | 1 | | | 1 | | | | | 1 | | | | |
| Amortization of actuarial gains and prior service credits (net of tax of $1 million) | | | | | | | | | | | | | (2) | | | (2) | | | | | (2) | | | | |
| Amortization of losses on cash flow hedges (net of tax of $1 million) | | | | | | | | | | | | | 1 | | | 1 | | | | | 1 | | | | |
| Balance at September 30, 2023 | 342.9 | | | $ | 3 | | | $ | 1,175 | | | $ | 14,460 | | | (159.9) | | | $ | (11,795) | | | $ | (652) | | | $ | 3,191 | | | $ | 161 | | | $ | 3,352 | | | | |
The accompanying notes are an integral part of the consolidated financial statements.
MOODY'S CORPORATION
CONSOLIDATED STATEMENTS OF SHAREHOLDERS' EQUITY (UNAUDITED)
(Amounts in millions, except per share data)
| | | | | | | | | | | | | | | | | | | | | | | | | | | | | | | | | | | | | | | | | | | | | | | | | | | | | | | | | | | |
| Shareholders of Moody's Corporation | | | |
| Common Stock | | Capital
Surplus | | Retained
Earnings | | Treasury Stock | | Accumulated
Other
Comprehensive
Loss | | Total Moody's
Shareholders'
Equity | | Non- Controlling
Interests | | Total
Shareholders'
Equity |
| Shares | | Amount | | | Shares | | Amount | |
| Balance at June 30, 2024 | 342.9 | | | $ | 3 | | | $ | 1,324 | | | $ | 15,478 | | | (160.8) | | | $ | (12,410) | | | $ | (617) | | | $ | 3,778 | | | $ | 160 | | | $ | 3,938 | |
| Net income | | | | | | | 534 | | | | | | | | | 534 | | | — | | | 534 | |
| Dividends ($0.85 per share) | | | | | | | (157) | | | | | | | | | (157) | | | (5) | | | (162) | |
| Stock-based compensation | | | | | 58 | | | | | | | | | | | 58 | | | | | 58 | |
| Shares issued for stock-based compensation plans at average cost, net | | | | | 8 | | | | | — | | | 4 | | | | | 12 | | | | | 12 | |
| | | | | | | | | | | | | | | | | | | |
| Noncontrolling interest resulting from majority acquisition | | | | | | | | | | | | | | | — | | | 8 | | | 8 | |
| Treasury shares repurchased, inclusive of excise tax | | | | | | | | | (0.9) | | | (434) | | | | | (434) | | | | | (434) | |
| Currency translation adjustment, net of net investment hedge activity (net of tax of $45 million) | | | | | | | | | | | | | 113 | | | 113 | | | — | | | 113 | |
| | | | | | | | | | | | | | | | | | | |
| | | | | | | | | | | | | | | | | | | |
| Amortization of losses on cash flow hedges | | | | | | | | | | | | | 1 | | | 1 | | | | | 1 | |
| Balance at September 30, 2024 | 342.9 | | | $ | 3 | | | $ | 1,390 | | | $ | 15,855 | | | (161.7) | | | $ | (12,840) | | | $ | (503) | | | $ | 3,905 | | | $ | 163 | | | $ | 4,068 | |
The accompanying notes are an integral part of the consolidated financial statements.
MOODY'S CORPORATION
CONSOLIDATED STATEMENTS OF SHAREHOLDERS' EQUITY (UNAUDITED)
(Amounts in millions, except per share data)
| | | | | | | | | | | | | | | | | | | | | | | | | | | | | | | | | | | | | | | | | | | | | | | | | | | | | | | | | | | |
| Shareholders of Moody's Corporation | | | |
| Common Stock | | Capital
Surplus | | Retained
Earnings | | Treasury Stock | | Accumulated
Other
Comprehensive
Loss | | Total Moody's
Shareholders'
Equity | | Non- Controlling
Interests | | Total
Shareholders'
Equity |
| Shares | | Amount | | | Shares | | Amount | |
| Balance at December 31, 2023 | 342.9 | | | $ | 3 | | | $ | 1,228 | | | $ | 14,659 | | | (160.4) | | | $ | (12,005) | | | $ | (567) | | | $ | 3,318 | | | $ | 158 | | | $ | 3,476 | |
| Net income | | | | | | | 1,663 | | | | | | | | | 1,663 | | | 1 | | | 1,664 | |
| Dividends ($2.55 per share) | | | | | | | (467) | | | | | | | | | (467) | | | (6) | | | (473) | |
| | | | | | | | | | | | | | | | | | | |
| Stock-based compensation | | | | | 169 | | | | | | | | | | | 169 | | | | | 169 | |
| Shares issued for stock-based compensation plans at average cost, net | | | | | (7) | | | | | 0.6 | | | (18) | | | | | (25) | | | | | (25) | |
| | | | | | | | | | | | | | | | | | | |
| Noncontrolling interest resulting from majority acquisition | | | | | | | | | | | | | | | — | | | 10 | | | 10 | |
| | | | | | | | | | | | | | | | | | | |
| Treasury shares repurchased, inclusive of excise tax | | | | | — | | | | | (1.9) | | | (817) | | | | | (817) | | | | | (817) | |
| | | | | | | | | | | | | | | | | | | |
| Currency translation adjustment, net of net investment hedge activity (net of tax of $7 million) | | | | | | | | | | | | | 65 | | | 65 | | | — | | | 65 | |
| Net actuarial losses (net of tax of $1 million) | | | | | | | | | | | | | (2) | | | (2) | | | | | (2) | |
| Amortization of actuarial gains and prior service credits | | | | | | | | | | | | | (1) | | | (1) | | | | | (1) | |
| Amortization of losses on cash flow hedges | | | | | | | | | | | | | 2 | | | 2 | | | | | 2 | |
| Balance at September 30, 2024 | 342.9 | | | $ | 3 | | | $ | 1,390 | | | $ | 15,855 | | | (161.7) | | | $ | (12,840) | | | $ | (503) | | | $ | 3,905 | | | $ | 163 | | | $ | 4,068 | |
The accompanying notes are an integral part of the consolidated financial statements.
MOODY’S CORPORATION
NOTES TO CONSOLIDATED FINANCIAL STATEMENTS (UNAUDITED)
(tabular dollar and share amounts in millions, except per share data)
NOTE 1. DESCRIPTION OF BUSINESS AND BASIS OF PRESENTATION
Moody’s is a global integrated risk assessment firm that empowers organizations to anticipate, adapt and thrive in a new era of exponential risk. Our data, analytical solutions and insights help decision-makers identify opportunities and manage the risks of doing business with others. Moody’s reports in two reportable segments: MA and MIS.
MA is a global provider of: i) decision solutions; ii) research and insights; and iii) data and information, which help companies make better and faster decisions. MA leverages its unique assets and specialized industry knowledge across multiple risks such as credit, market, financial crime, supply chain, catastrophe and climate to deliver integrated risk assessment solutions that enable business leaders to identify, measure and manage the implications of interrelated risks and opportunities.
MIS publishes credit ratings and provides assessment services on a wide range of debt obligations, programs and facilities, and the entities that issue such obligations in markets worldwide, including various corporate, financial institution and governmental obligations, and structured finance securities.
These interim financial statements have been prepared in accordance with the instructions to Form 10-Q and should be read in conjunction with the Company’s consolidated financial statements and related notes in the Company’s 2023 annual report on Form 10-K filed with the SEC on February 14, 2024. The results of interim periods are not necessarily indicative of results for the full year or any subsequent period. In the opinion of management, all adjustments (including normal recurring accruals) considered necessary for a fair presentation of financial position, results of operations and cash flows at the dates and for the periods presented have been included. The year-end consolidated balance sheet data was derived from audited financial statements, but does not include all disclosures required by GAAP.
Certain reclassifications have been made to prior period amounts to conform to the current presentation.
Recently Issued Accounting Standards
In November 2023, the FASB issued ASU 2023-07, "Segment Reporting (Topic 280): Improvements to Reportable Segment Disclosures" ("ASU No. 2023-07"), which expands segment disclosure requirements for public entities. ASU No. 2023-07 will require entities to disclose significant segment expenses by reportable segment if they are regularly provided to the CODM and included in each reported measure of segment profit or loss. In addition, this ASU permits entities to disclose more than one measure of segment profit or loss used by the CODM. Additionally, disclosure of the CODM’s title and position will be required on an annual basis, as well as an explanation of how the CODM uses the reported measure(s). Furthermore, all existing annual disclosures about segment profit or loss and assets must be provided on an interim basis in addition to disclosure of significant segment expenses and other segment items. This ASU is effective for fiscal years beginning after December 15, 2023, and interim periods within fiscal years beginning after December 15, 2024, and requires retrospective application to all prior periods presented in the financial statements. The Company will adopt this ASU in its Form 10-K for the year ended December 31, 2024 and will provide the aforementioned new required disclosures, including further disaggregation of each segment's operating and SG&A expenses.
In December 2023, the FASB issued ASU 2023-09, "Income Taxes (Topic 740): Improvements to Income Tax Disclosures" ("ASU No. 2023-09"), which is intended to enhance the transparency and decision usefulness of income tax disclosures. The amendments in ASU No. 2023-09 require entities to disclose additional income tax information, primarily related to greater disaggregation of the entity's ETR reconciliation and income taxes paid by jurisdiction disclosures. This ASU is effective for annual periods beginning after December 15, 2024, and should be applied on a prospective basis; however, retrospective application is permitted. The Company is currently evaluating the impact of adopting this ASU on its consolidated financial statements and disclosures.
Reclassification of Previously Reported Revenue by LOB
In the first quarter of 2024, pursuant to the integration of RMS into the Company's order-to-cash systems, the Company reclassified certain prior year revenue by geography disclosures. The impact of the reclassification was not material and prior year revenue disclosures have been reclassified to conform to this new presentation, which is disclosed in Note 2.
NOTE 2. REVENUES
Revenue by Category
The following table presents the Company’s revenues disaggregated by LOB: | | | | | | | | | | | | | | | | | | | | | | | |
| Three Months Ended September 30, | | Nine Months Ended
September 30, |
| 2024 | | 2023 | | 2024 | | 2023 |
| MA: | | | | | | | |
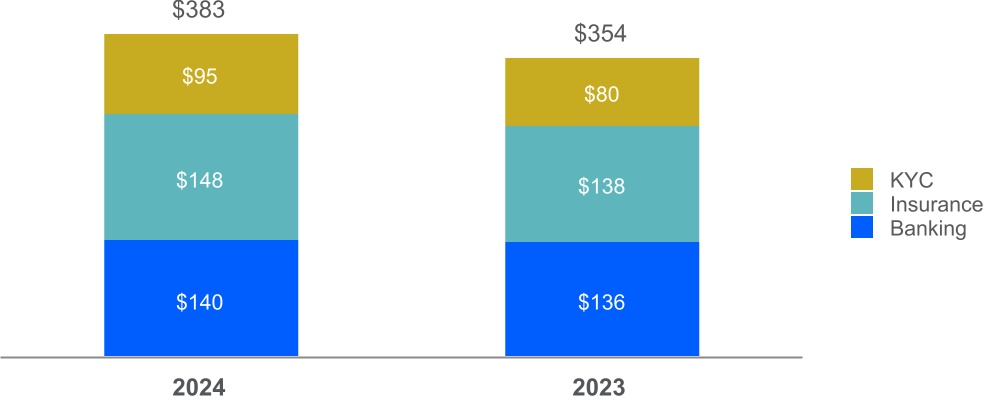
| Decision Solutions (DS) | | | | | | | |
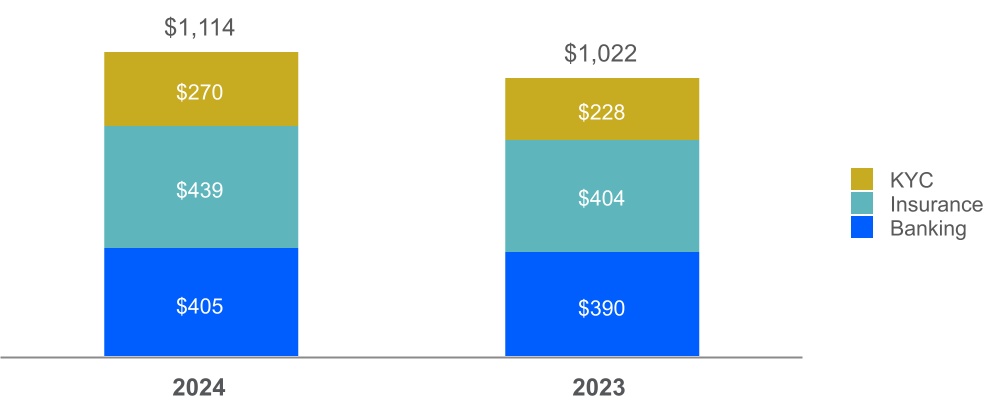
| Banking | $ | 140 | | | $ | 136 | | | $ | 405 | | | $ | 390 | |
| Insurance | 148 | | | 138 | | | 439 | | | 404 | |
| KYC | 95 | | | 80 | | | 270 | | | 228 | |
| Total DS | 383 | | | 354 | | | 1,114 | | | 1,022 | |
| Research and Insights (R&I) | 235 | | | 222 | | | 683 | | | 654 | |
| Data and Information (D&I) | 213 | | | 200 | | | 635 | | | 584 | |
| Total external revenue | 831 | | | 776 | | | 2,432 | | | 2,260 | |
| Intersegment revenue | 3 | | | 3 | | | 10 | | | 10 | |
| Total MA | 834 | | | 779 | | | 2,442 | | | 2,270 | |
| MIS: | | | | | | | |
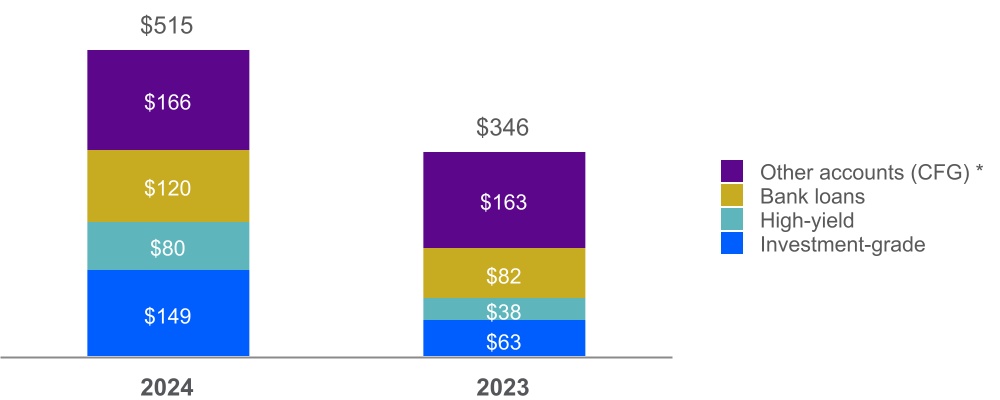
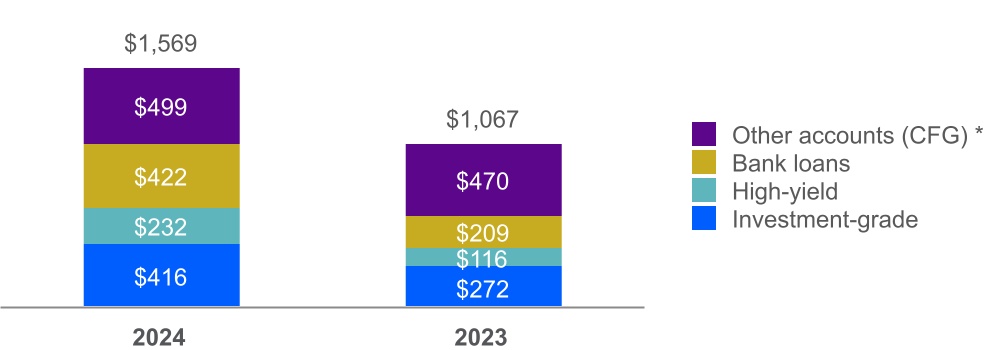
| Corporate Finance (CFG) | | | | | | | |
| Investment-grade | 149 | | | 63 | | | 416 | | | 272 | |
| High-yield | 80 | | | 38 | | | 232 | | | 116 | |
| Bank loans | 120 | | | 82 | | | 422 | | | 209 | |
Other accounts (1) | 166 | | | 163 | | | 499 | | | 470 | |
| Total CFG | 515 | | | 346 | | | 1,569 | | | 1,067 | |
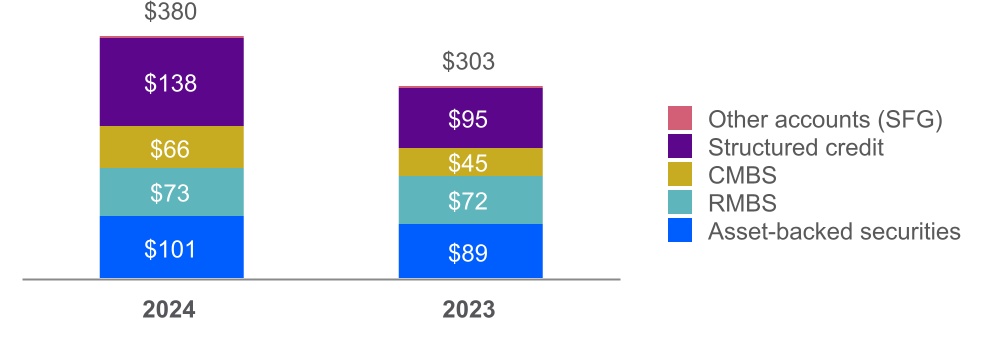
| Structured Finance (SFG) | | | | | | | |
| Asset-backed securities | 34 | | | 30 | | | 101 | | | 89 | |
| RMBS | 24 | | | 22 | | | 73 | | | 72 | |
| CMBS | 27 | | | 17 | | | 66 | | | 45 | |
| Structured credit | 49 | | | 32 | | | 138 | | | 95 | |
| Other accounts | 1 | | | 1 | | | 2 | | | 2 | |
| Total SFG | 135 | | | 102 | | | 380 | | | 303 | |
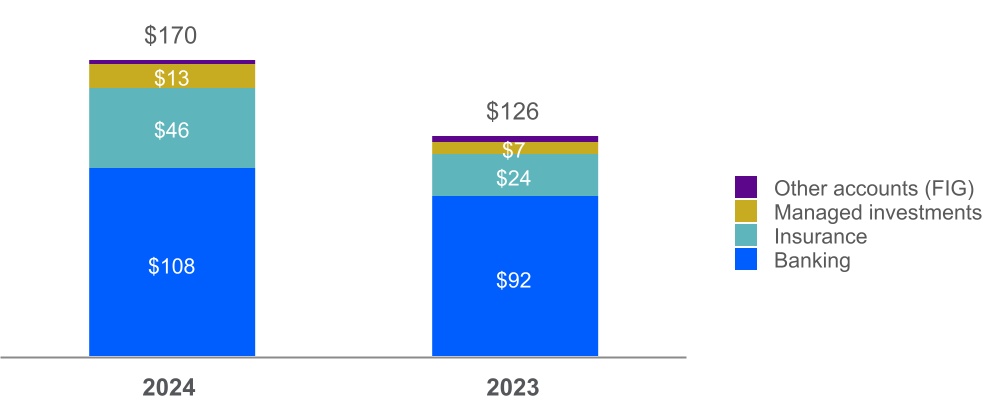
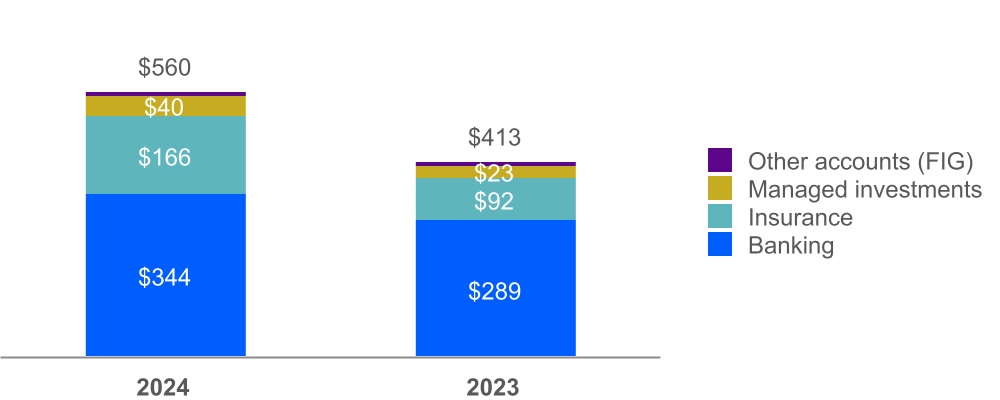
| Financial Institutions (FIG) | | | | | | | |
| Banking | 108 | | | 92 | | | 344 | | | 289 | |
| Insurance | 46 | | | 24 | | | 166 | | | 92 | |
| Managed investments | 13 | | | 7 | | | 40 | | | 23 | |
| Other accounts | 3 | | | 3 | | | 10 | | | 9 | |
| Total FIG | 170 | | | 126 | | | 560 | | | 413 | |
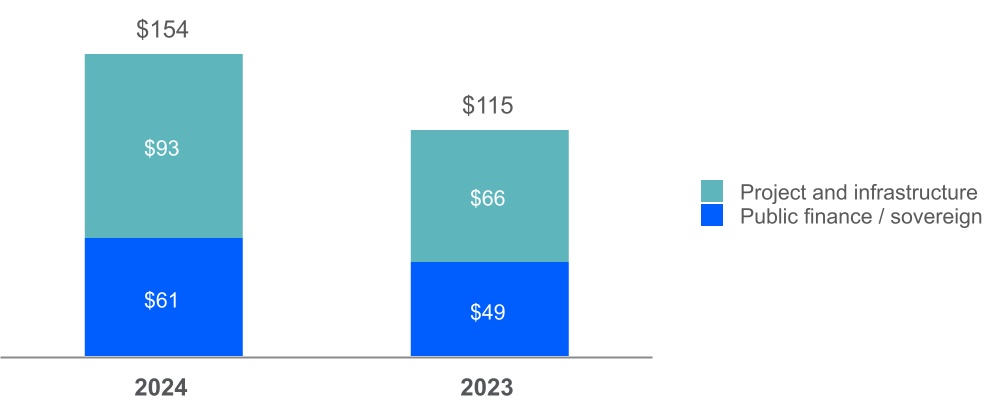
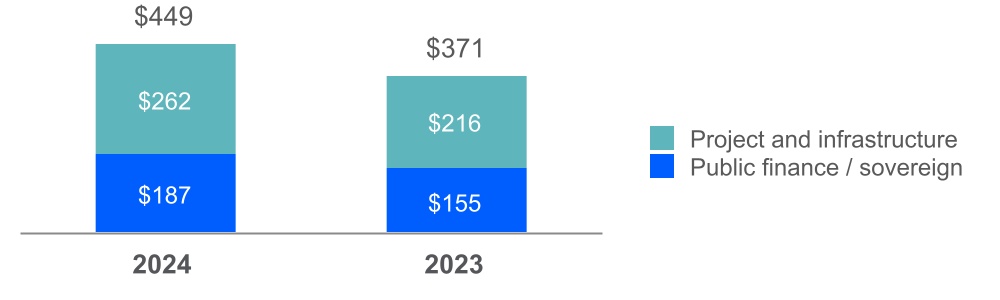
| Public, Project and Infrastructure Finance (PPIF) | | | | | | | |
| Public finance / sovereign | 61 | | | 49 | | | 187 | | | 155 | |
| Project and infrastructure | 93 | | | 66 | | | 262 | | | 216 | |
| Total PPIF | 154 | | | 115 | | | 449 | | | 371 | |
| Total ratings revenue | 974 | | | 689 | | | 2,958 | | | 2,154 | |
| MIS Other | 8 | | | 7 | | | 26 | | | 22 | |
| Total external revenue | 982 | | | 696 | | | 2,984 | | | 2,176 | |
| Intersegment revenue | 48 | | | 47 | | | 144 | | | 138 | |
| Total MIS | 1,030 | | | 743 | | | 3,128 | | | 2,314 | |
| Eliminations | (51) | | | (50) | | | (154) | | | (148) | |
| Total MCO | $ | 1,813 | | | $ | 1,472 | | | $ | 5,416 | | | $ | 4,436 | |
(1) Other includes: recurring monitoring fees of a rated debt obligation and/or entities that issue such obligations as well as fees from programs such as commercial paper, medium term notes, and ICRA corporate finance revenue.
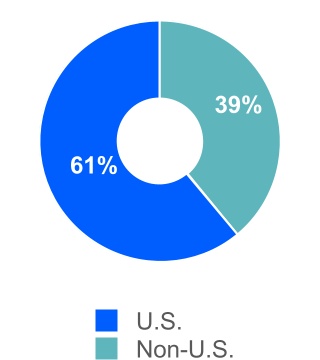
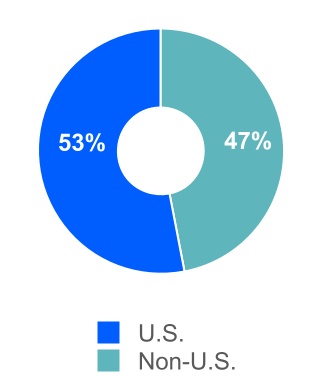
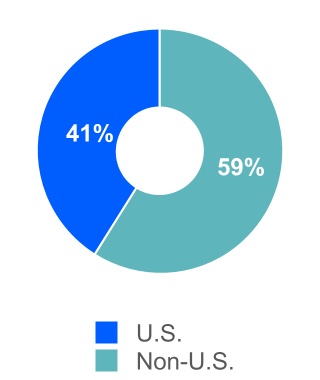
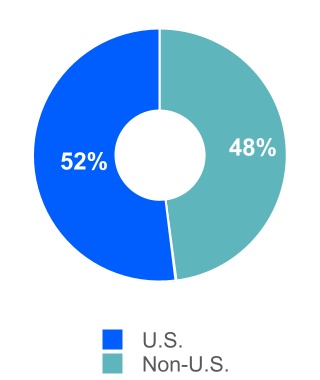
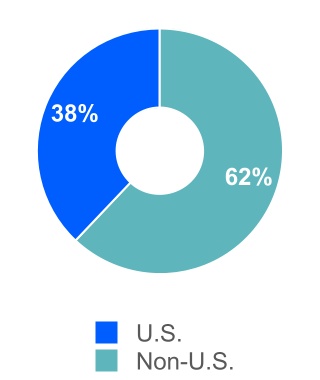
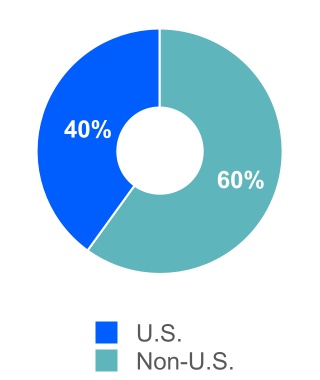
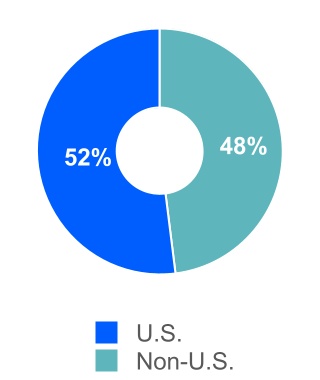
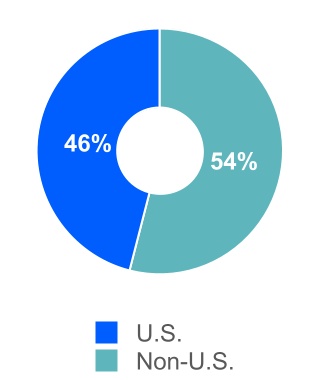
The following table presents the Company’s revenues disaggregated by LOB and geographic area:
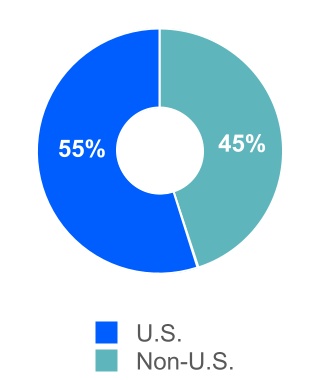
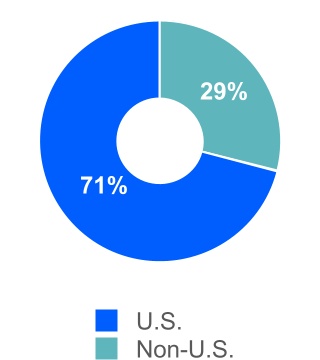
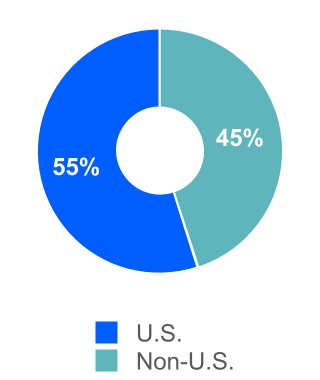
| | | | | | | | | | | | | | | | | | | | | | | | | | | | | | | | | | | |
| Three Months Ended September 30, 2024 | | Three Months Ended September 30, 2023 |
| U.S. | | Non-U.S | | Total | | U.S. | | Non-U.S | | Total |
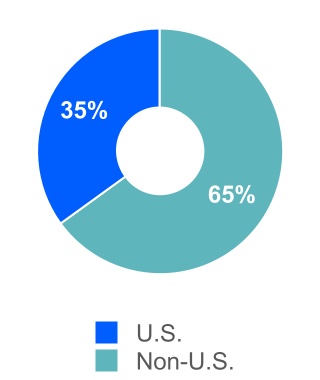
| MA: |
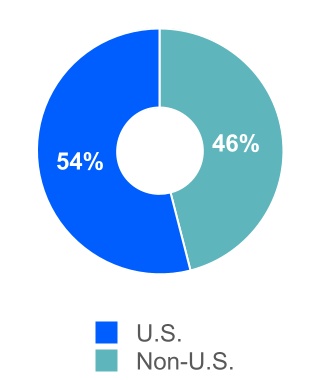
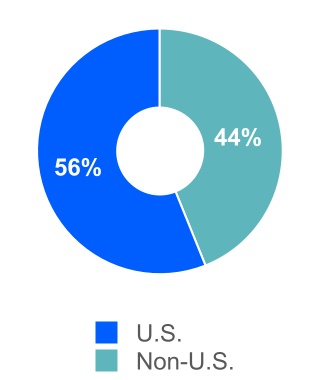
| Decision Solutions | $ | 144 | | | $ | 239 | | | $ | 383 | | | $ | 141 | | | $ | 213 | | | $ | 354 | |
| Research and Insights | 128 | | | 107 | | | 235 | | | 124 | | | 98 | | | 222 | |
| Data and Information | 74 | | | 139 | | | 213 | | | 69 | | | 131 | | | 200 | |
| Total MA | 346 | | | 485 | | | 831 | | | 334 | | | 442 | | | 776 | |
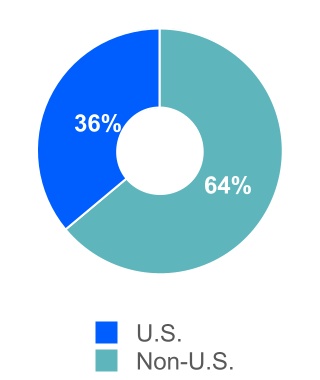
| MIS: |
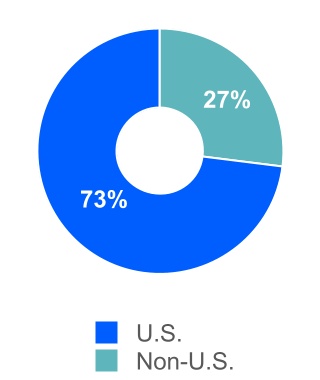
| Corporate Finance | 364 | | | 151 | | | 515 | | | 242 | | | 104 | | | 346 | |
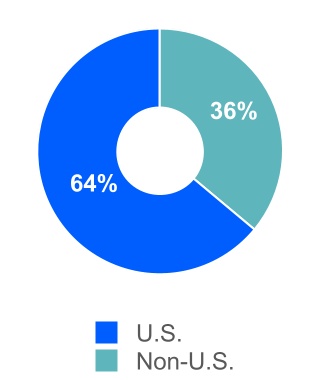
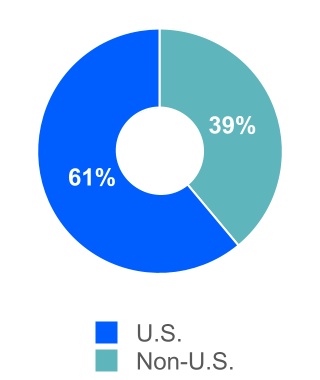
| Structured Finance | 98 | | | 37 | | | 135 | | | 65 | | | 37 | | | 102 | |
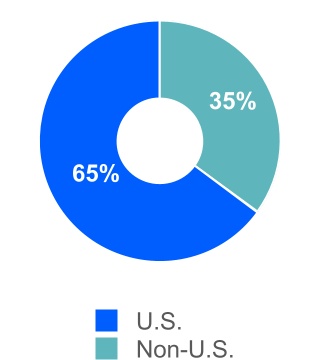
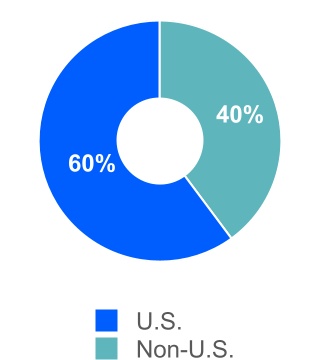
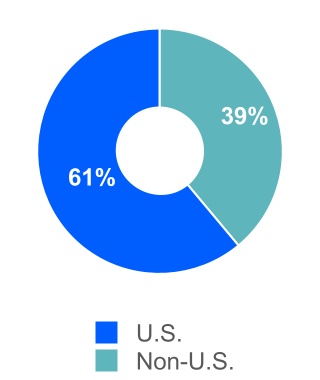
| Financial Institutions | 90 | | | 80 | | | 170 | | | 52 | | | 74 | | | 126 | |
| Public, Project and Infrastructure Finance | 100 | | | 54 | | | 154 | | | 69 | | | 46 | | | 115 | |
| Total ratings revenue | 652 | | | 322 | | | 974 | | | 428 | | | 261 | | | 689 | |
| MIS Other | 1 | | | 7 | | | 8 | | | — | | | 7 | | | 7 | |
| Total MIS | 653 | | | 329 | | | 982 | | | 428 | | | 268 | | | 696 | |
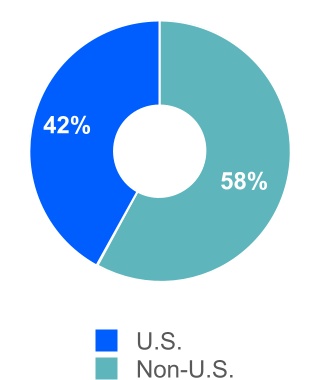
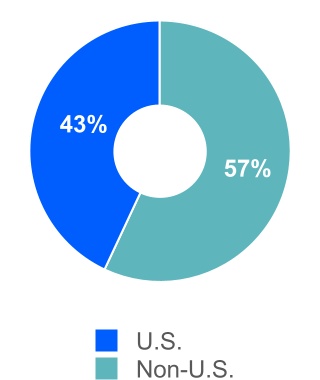
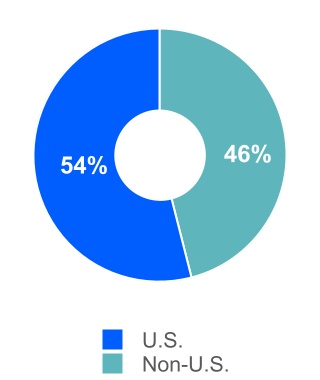
| Total MCO | $ | 999 | | | $ | 814 | | | $ | 1,813 | | | $ | 762 | | | $ | 710 | | | $ | 1,472 | |
| | | | | | | | | | | |
| | | | | | | | | | | |
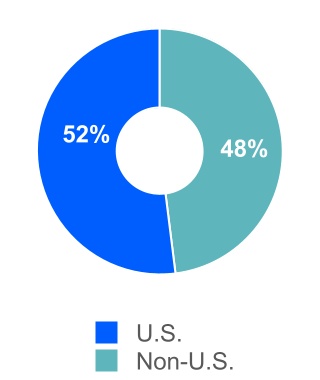
| Nine Months Ended September 30, 2024 | | Nine Months Ended September 30, 2023 |
| U.S. | | Non-U.S | | Total | | U.S. | | Non-U.S | | Total |
| MA: |
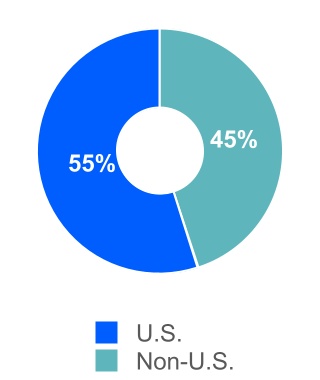
| Decision Solutions | $ | 420 | | | $ | 694 | | | $ | 1,114 | | | $ | 406 | | | $ | 616 | | | $ | 1,022 | |
| Research and Insights | 374 | | | 309 | | | 683 | | | 361 | | | 293 | | | 654 | |
| Data and Information | 227 | | | 408 | | | 635 | | | 204 | | | 380 | | | 584 | |
| Total MA | 1,021 | | | 1,411 | | | 2,432 | | | 971 | | | 1,289 | | | 2,260 | |
| MIS: |
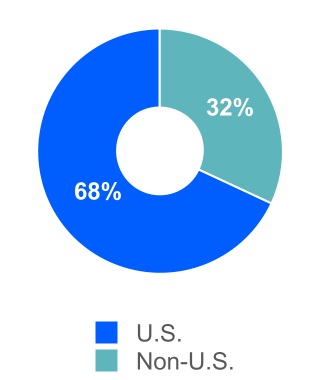
| Corporate Finance | 1,078 | | | 491 | | | 1,569 | | | 727 | | | 340 | | | 1,067 | |
| Structured Finance | 266 | | | 114 | | | 380 | | | 186 | | | 117 | | | 303 | |
| Financial Institutions | 292 | | | 268 | | | 560 | | | 188 | | | 225 | | | 413 | |
| Public, Project and Infrastructure Finance | 284 | | | 165 | | | 449 | | | 228 | | | 143 | | | 371 | |
| Total ratings revenue | 1,920 | | | 1,038 | | | 2,958 | | | 1,329 | | | 825 | | | 2,154 | |
| MIS Other | 1 | | | 25 | | | 26 | | | — | | | 22 | | | 22 | |
| Total MIS | 1,921 | | | 1,063 | | | 2,984 | | | 1,329 | | | 847 | | | 2,176 | |
| Total MCO | $ | 2,942 | | | $ | 2,474 | | | $ | 5,416 | | | $ | 2,300 | | | $ | 2,136 | | | $ | 4,436 | |
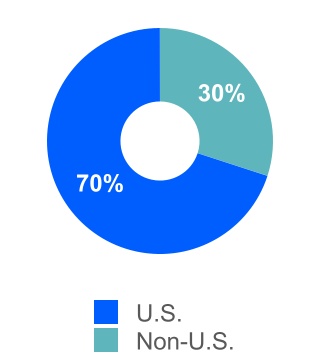
The following table presents the Company’s reportable segment revenues disaggregated by segment and geographic region:
| | | | | | | | | | | | | | | | | | | | | | | |
| Three Months Ended September 30, | | Nine Months Ended
September 30, |
| 2024 | | 2023 | | 2024 | | 2023 |
| MA: | | | | | | | |
| U.S. | $ | 346 | | | $ | 334 | | | $ | 1,021 | | | $ | 971 | |
| Non-U.S.: | | | | | | | |
| EMEA | 334 | | | 310 | | | 969 | | | 895 | |
| Asia-Pacific | 84 | | | 76 | | | 251 | | | 224 | |
| Americas | 67 | | | 56 | | | 191 | | | 170 | |
| Total Non-U.S. | 485 | | | 442 | | | 1,411 | | | 1,289 | |
| Total MA | 831 | | | 776 | | | 2,432 | | | 2,260 | |
| MIS: | |
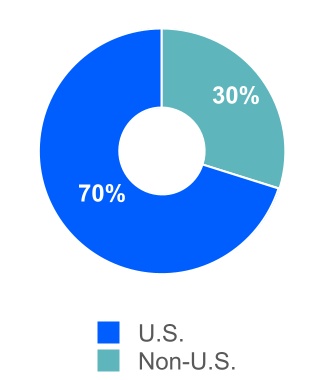
| U.S. | 653 | | | 428 | | | 1,921 | | | 1,329 | |
| Non-U.S.: | | | | | | | |
| EMEA | 212 | | | 155 | | | 685 | | | 509 | |
| Asia-Pacific | 73 | | | 67 | | | 225 | | | 213 | |
| Americas | 44 | | | 46 | | | 153 | | | 125 | |
| Total Non-U.S. | 329 | | | 268 | | | 1,063 | | | 847 | |
| Total MIS | 982 | | | 696 | | | 2,984 | | | 2,176 | |
| Total MCO | $ | 1,813 | | | $ | 1,472 | | | $ | 5,416 | | | $ | 4,436 | |
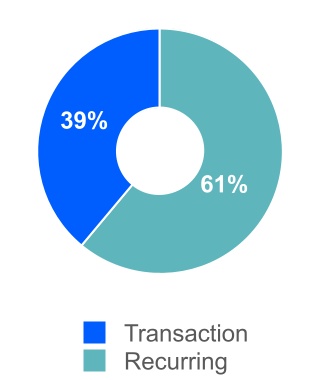
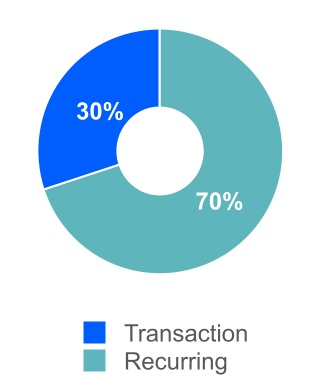
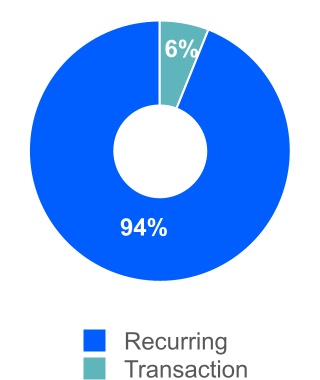
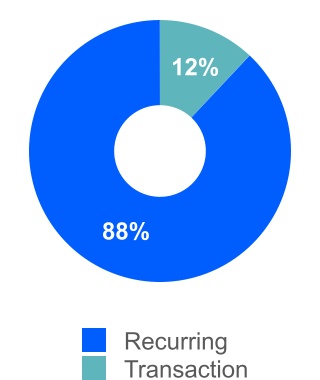
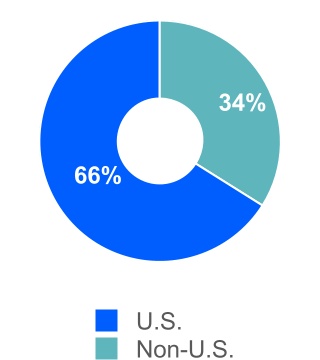
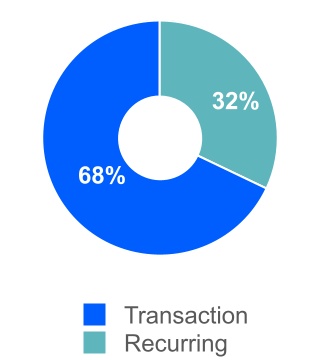
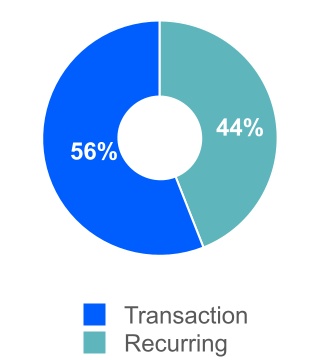
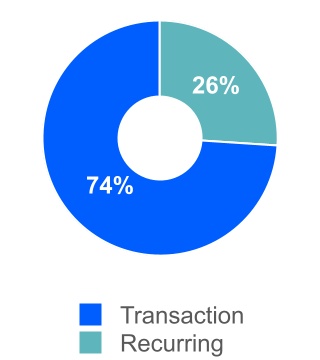
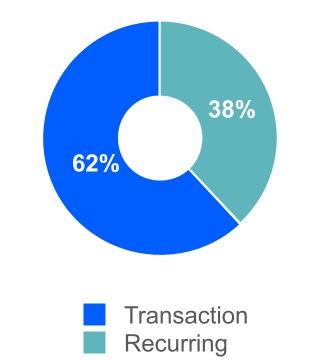
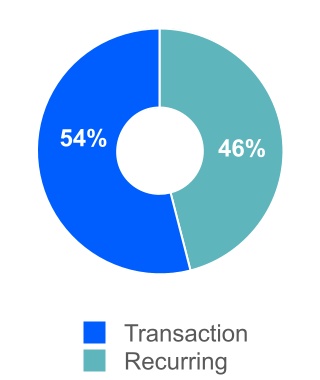
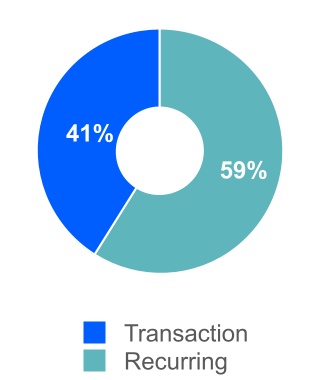
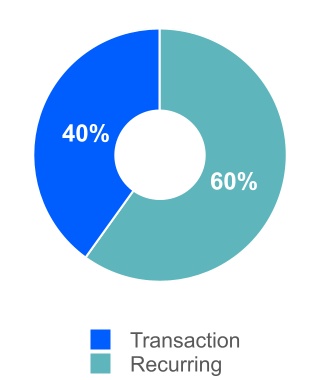
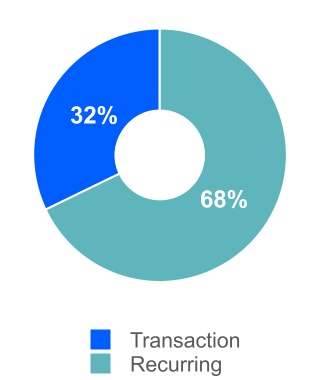
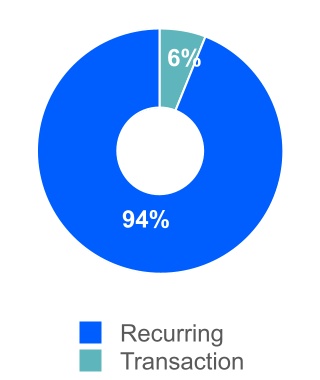
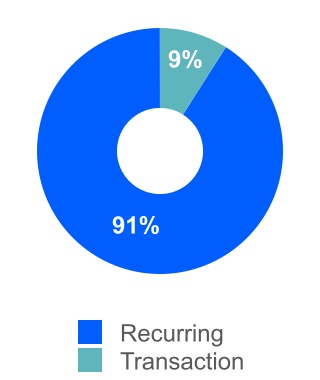
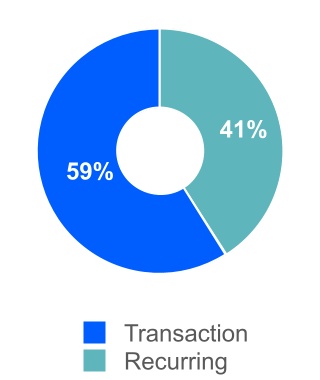
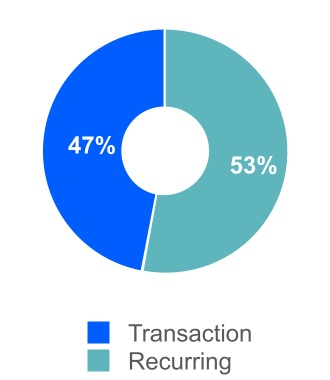
The following table summarizes the split between Transaction Revenue and Recurring Revenue:
| | | | | | | | | | | | | | | | | | | | | | | | | | | | | | | | | | | |
| Three Months Ended September 30, |
| 2024 | | 2023 |
| Transaction | | Recurring | | Total | | Transaction | | Recurring | | Total |
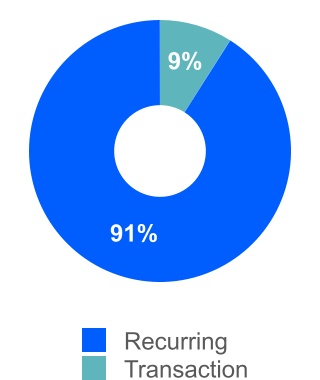
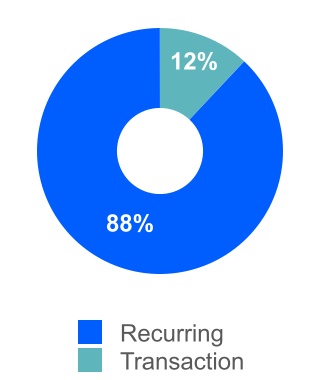
| Decision Solutions | $ | 33 | | | $ | 350 | | | $ | 383 | | | $ | 43 | | | $ | 311 | | | $ | 354 | |
| 9 | % | | 91 | % | | 100 | % | | 12 | % | | 88 | % | | 100 | % |
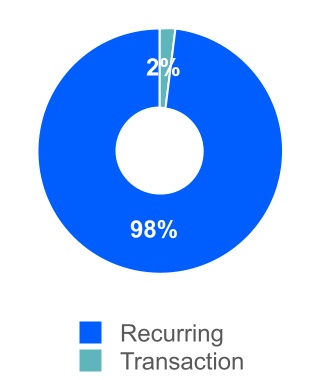
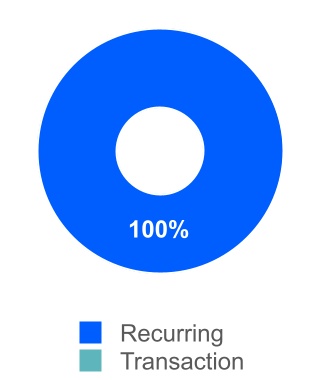
| Research and Insights | $ | 4 | | | $ | 231 | | | $ | 235 | | | $ | 4 | | | $ | 218 | | | $ | 222 | |
| 2 | % | | 98 | % | | 100 | % | | 2 | % | | 98 | % | | 100 | % |
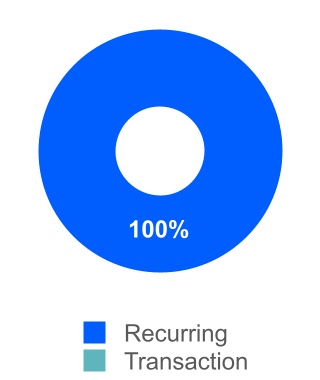
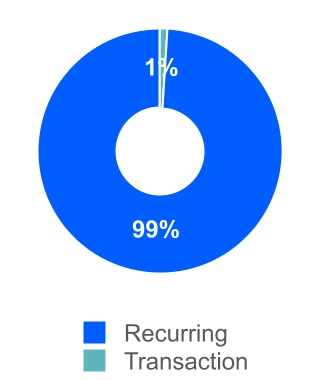
| Data and Information | $ | 1 | | | $ | 212 | | | $ | 213 | | | $ | 1 | | | $ | 199 | | | $ | 200 | |
| — | % | | 100 | % | | 100 | % | | 1 | % | | 99 | % | | 100 | % |
Total MA (1) | $ | 38 | | | $ | 793 | | | $ | 831 | | | $ | 48 | | | $ | 728 | | | $ | 776 | |
| 5 | % | | 95 | % | | 100 | % | | 6 | % | | 94 | % | | 100 | % |
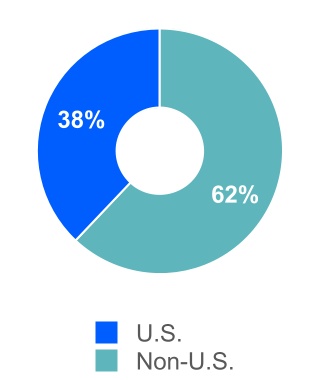
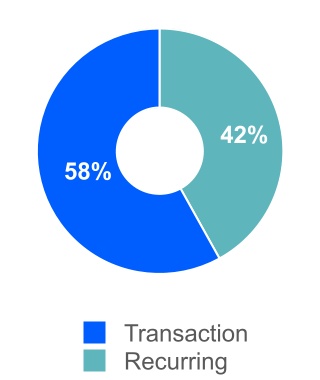
| Corporate Finance | $ | 382 | | | $ | 133 | | | $ | 515 | | | $ | 216 | | | $ | 130 | | | $ | 346 | |
| 74 | % | | 26 | % | | 100 | % | | 62 | % | | 38 | % | | 100 | % |
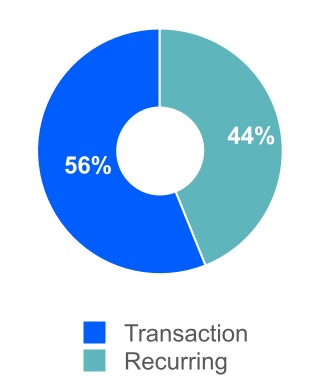
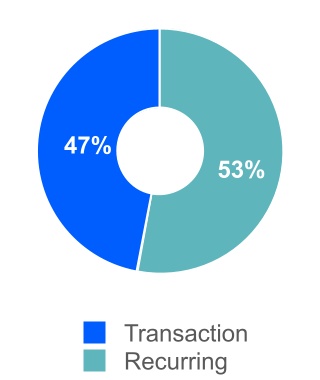
| Structured Finance | $ | 78 | | | $ | 57 | | | $ | 135 | | | $ | 49 | | | $ | 53 | | | $ | 102 | |
| 58 | % | | 42 | % | | 100 | % | | 48 | % | | 52 | % | | 100 | % |
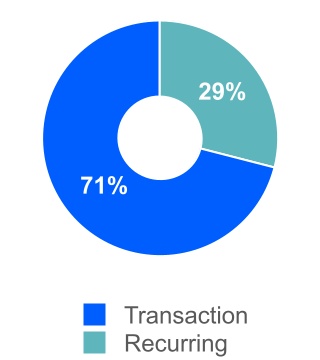
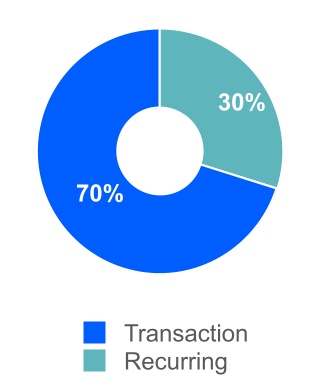
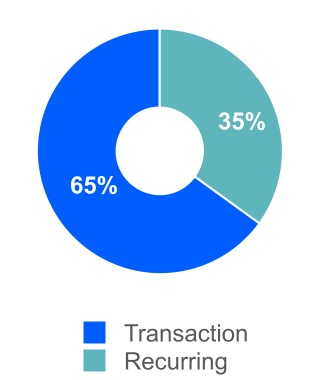
| Financial Institutions | $ | 92 | | | $ | 78 | | | $ | 170 | | | $ | 52 | | | $ | 74 | | | $ | 126 | |
| 54 | % | | 46 | % | | 100 | % | | 41 | % | | 59 | % | | 100 | % |
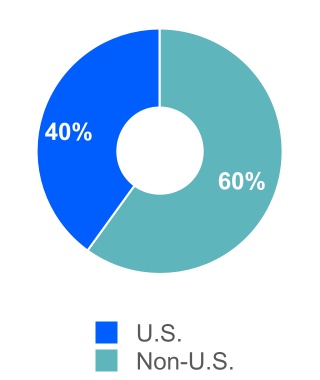
| Public, Project and Infrastructure Finance | $ | 109 | | | $ | 45 | | | $ | 154 | | | $ | 70 | | | $ | 45 | | | $ | 115 | |
| 71 | % | | 29 | % | | 100 | % | | 61 | % | | 39 | % | | 100 | % |
| MIS Other | $ | 2 | | | $ | 6 | | | $ | 8 | | | $ | 2 | | | $ | 5 | | | $ | 7 | |
| 25 | % | | 75 | % | | 100 | % | | 29 | % | | 71 | % | | 100 | % |
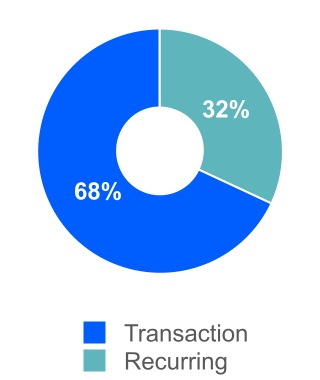
| Total MIS | $ | 663 | | | $ | 319 | | | $ | 982 | | | $ | 389 | | | $ | 307 | | | $ | 696 | |
| 68 | % | | 32 | % | | 100 | % | | 56 | % | | 44 | % | | 100 | % |
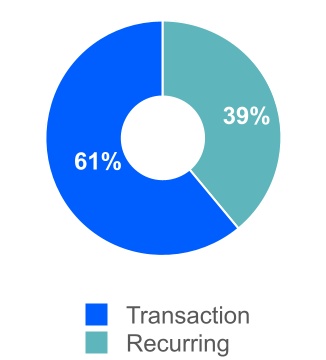
| Total Moody's Corporation | $ | 701 | | | $ | 1,112 | | | $ | 1,813 | | | $ | 437 | | | $ | 1,035 | | | $ | 1,472 | |
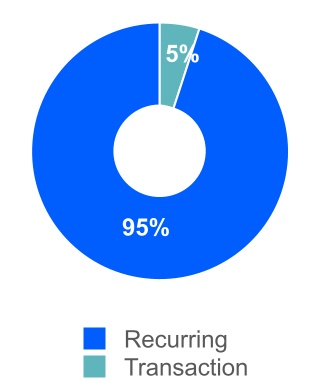
| 39 | % | | 61 | % | | 100 | % | | 30 | % | | 70 | % | | 100 | % |
| | | | | | | | | | | |
| | | | | | | | | | | | | | | | | | | | | | | | | | | | | | | | | | | |
| | | | | | | | | | | |
| Nine Months Ended September 30, |
| 2024 | | 2023 |
| Transaction | | Recurring | | Total | | Transaction | | Recurring | | Total |
| Decision Solutions | $ | 105 | | | $ | 1,009 | | | $ | 1,114 | | | $ | 126 | | | $ | 896 | | | $ | 1,022 | |
| 9 | % | | 91 | % | | 100 | % | | 12 | % | | 88 | % | | 100 | % |
| Research and Insights | $ | 11 | | | $ | 672 | | | $ | 683 | | | $ | 12 | | | $ | 642 | | | $ | 654 | |
| 2 | % | | 98 | % | | 100 | % | | 2 | % | | 98 | % | | 100 | % |
| Data and Information | $ | 3 | | | $ | 632 | | | $ | 635 | | | $ | 2 | | | $ | 582 | | | $ | 584 | |
| — | % | | 100 | % | | 100 | % | | — | % | | 100 | % | | 100 | % |
Total MA (1) | $ | 119 | | | $ | 2,313 | | | $ | 2,432 | | | $ | 140 | | | $ | 2,120 | | | $ | 2,260 | |
| 5 | % | | 95 | % | | 100 | % | | 6 | % | | 94 | % | | 100 | % |
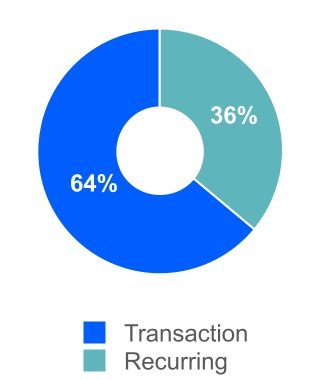
| Corporate Finance | $ | 1,169 | | | $ | 400 | | | $ | 1,569 | | | $ | 682 | | | $ | 385 | | | $ | 1,067 | |
| 75 | % | | 25 | % | | 100 | % | | 64 | % | | 36 | % | | 100 | % |
| Structured Finance | $ | 213 | | | $ | 167 | | | $ | 380 | | | $ | 142 | | | $ | 161 | | | $ | 303 | |
| 56 | % | | 44 | % | | 100 | % | | 47 | % | | 53 | % | | 100 | % |
| Financial Institutions | $ | 329 | | | $ | 231 | | | $ | 560 | | | $ | 195 | | | $ | 218 | | | $ | 413 | |
| 59 | % | | 41 | % | | 100 | % | | 47 | % | | 53 | % | | 100 | % |
| Public, Project and Infrastructure Finance | $ | 315 | | | $ | 134 | | | $ | 449 | | | $ | 240 | | | $ | 131 | | | $ | 371 | |
| 70 | % | | 30 | % | | 100 | % | | 65 | % | | 35 | % | | 100 | % |
| MIS Other | $ | 6 | | | $ | 20 | | | $ | 26 | | | $ | 4 | | | $ | 18 | | | $ | 22 | |
| 23 | % | | 77 | % | | 100 | % | | 18 | % | | 82 | % | | 100 | % |
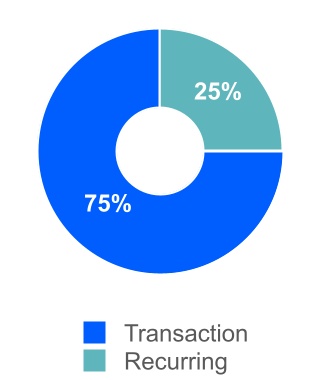
| Total MIS | $ | 2,032 | | | $ | 952 | | | $ | 2,984 | | | $ | 1,263 | | | $ | 913 | | | $ | 2,176 | |
| 68 | % | | 32 | % | | 100 | % | | 58 | % | | 42 | % | | 100 | % |
| Total Moody's Corporation | $ | 2,151 | | | $ | 3,265 | | | $ | 5,416 | | | $ | 1,403 | | | $ | 3,033 | | | $ | 4,436 | |
| 40 | % | | 60 | % | | 100 | % | | 32 | % | | 68 | % | | 100 | % |
(1) Revenue from software implementation services and risk management advisory projects, while classified by management as transactional revenue, is recognized over time under GAAP.The following table presents the timing of revenue recognition:
| | | | | | | | | | | | | | | | | | | | | | | | | | | | | | | | | | | | | | | | | |
| Three Months Ended September 30, 2024 | | Nine Months Ended September 30, 2024 | | |
| MA | | MIS | | Total | | MA | | MIS | | Total | | | | | | |
| Revenue recognized at a point in time | $ | 26 | | | $ | 663 | | | $ | 689 | | | $ | 65 | | | $ | 2,032 | | | $ | 2,097 | | | | | | | |
| Revenue recognized over time | 805 | | | 319 | | | 1,124 | | | 2,367 | | | 952 | | | 3,319 | | | | | | | |
| Total | $ | 831 | | | $ | 982 | | | $ | 1,813 | | | $ | 2,432 | | | $ | 2,984 | | | $ | 5,416 | | | | | | | |
| | | | | | | | | | | | | | | | | |
| | | | | | | | | | | | | | | | | | | | | | | | | | | | | | | | | | | |
| | | | | | | | | | | |
| Three Months Ended September 30, 2023 | | Nine Months Ended September 30, 2023 |
| MA | | MIS | | Total | | MA | | MIS | | Total |
| Revenue recognized at a point in time | $ | 24 | | | $ | 389 | | | $ | 413 | | | $ | 73 | | | $ | 1,263 | | | $ | 1,336 | |
| Revenue recognized over time | 752 | | | 307 | | | 1,059 | | | 2,187 | | | 913 | | | 3,100 | |
| Total | $ | 776 | | | $ | 696 | | | $ | 1,472 | | | $ | 2,260 | | | $ | 2,176 | | | $ | 4,436 | |
Unbilled receivables, deferred revenue and remaining performance obligations
Unbilled receivables
For certain MA arrangements, the timing of when the Company has the unconditional right to consideration and recognizes revenue occurs prior to invoicing the customer. In addition, certain MIS arrangements contain contractual terms whereby the customers are billed in arrears for annual monitoring services, requiring revenue to be accrued as an unbilled receivable as such services are provided.
The following table presents the Company's unbilled receivables, which are included within accounts receivable, net, at September 30, 2024 and December 31, 2023:
| | | | | | | | | | | | | | | | | | | | | | | |
| As of September 30, 2024 | | As of December 31, 2023 |
| MA | | MIS | | MA | | MIS |
| Unbilled Receivables | $ | 119 | | | $ | 470 | | | $ | 119 | | | $ | 415 | |
Deferred revenue
The Company recognizes deferred revenue when a contract requires a customer to pay consideration to the Company in advance of when revenue related to that contract is recognized. This deferred revenue is relieved when the Company satisfies the related performance obligation and revenue is recognized.
Significant changes in the deferred revenue balances during the three and nine months ended September 30, 2024 and 2023 are as follows: | | | | | | | | | | | | | | | | | | | | | | | | | | | | | | | | | | | |
| | | | | | | | | | | |
| Three Months Ended September 30, 2024 | | Three Months Ended September 30, 2023 |
| MA | | MIS | | Total | | MA | | MIS | | Total |
| Balance at June 30, | $ | 1,146 | | | $ | 336 | | | $ | 1,482 | | | $ | 1,116 | | | $ | 336 | | | $ | 1,452 | |
| Changes in deferred revenue | | | | | | | | | | | |
| Revenue recognized that was included in the deferred revenue balance at the beginning of the period | (551) | | | (120) | | | (671) | | | (513) | | | (113) | | | (626) | |
| Increases due to amounts billable excluding amounts recognized as revenue during the period | 410 | | | 92 | | | 502 | | | 410 | | | 82 | | | 492 | |
| Increases due to acquisitions during the period | 5 | | | — | | | 5 | | | — | | | — | | | — | |
| Effect of exchange rate changes | 37 | | | 4 | | | 41 | | | (25) | | | (2) | | | (27) | |
| Total changes in deferred revenue | (99) | | | (24) | | | (123) | | | (128) | | | (33) | | | (161) | |
| Balance at September 30, | $ | 1,047 | | | $ | 312 | | | $ | 1,359 | | | $ | 988 | | | $ | 303 | | | $ | 1,291 | |
| | | | | | | | | | | | | | | | | | | | | | | | | | | | | | | | | | | |
| | | | | | | | | | | |
| Nine Months Ended September 30, 2024 | | Nine Months Ended September 30, 2023 |
| MA | | MIS | | Total | | MA | | MIS | | Total |
| Balance at December 31, | $ | 1,111 | | | $ | 270 | | | $ | 1,381 | | | $ | 1,055 | | | $ | 278 | | | $ | 1,333 | |
| Changes in deferred revenue | | | | | | | | | | | |
| Revenue recognized that was included in the deferred revenue balance at the beginning of the period | (950) | | | (197) | | | (1,147) | | | (969) | | | (192) | | | (1,161) | |
| Increases due to amounts billable excluding amounts recognized as revenue during the period | 860 | | | 238 | | | 1,098 | | | 908 | | | 218 | | | 1,126 | |
| Increases due to acquisitions during the period | 5 | | | — | | | 5 | | | — | | | — | | | — | |
| Effect of exchange rate changes | 21 | | | 1 | | | 22 | | | (6) | | | (1) | | | (7) | |
| Total changes in deferred revenue | (64) | | | 42 | | | (22) | | | (67) | | | 25 | | | (42) | |
| Balance at September 30, | $ | 1,047 | | | $ | 312 | | | $ | 1,359 | | | $ | 988 | | | $ | 303 | | | $ | 1,291 | |
| Deferred revenue - current | $ | 1,047 | | | $ | 253 | | | $ | 1,300 | | | $ | 986 | | | $ | 240 | | | $ | 1,226 | |
| Deferred revenue - non-current | $ | — | | | $ | 59 | | | $ | 59 | | | $ | 2 | | | $ | 63 | | | $ | 65 | |
For the MA segment, the decrease in deferred revenue for the three months ended September 30, 2024 and 2023 was primarily due to the recognition of annual subscription and maintenance billings from December and January. For the nine months ended September 30, 2024 and 2023, the decrease in the deferred revenue balance is attributable to recognition of revenues related to the aforementioned December billings being mostly offset by the impact of the high concentration of billings in the first quarter.
For the MIS segment, the change in the deferred revenue balance for all periods presented was primarily related to the significant portion of contract renewals that occur during the first quarter and are generally recognized over a one year period.
Remaining performance obligation
Remaining performance obligations in the MA segment include both amounts recorded as deferred revenue on the balance sheet as of September 30, 2024 as well as amounts not yet invoiced to customers as of September 30, 2024, largely reflecting future revenue related to signed multi-year arrangements for hosted and installed subscription-based products. As of September 30, 2024, the aggregate amount of the transaction price allocated to remaining performance obligations was approximately $3.5 billion. The Company expects to recognize into revenue approximately 60% of this balance within one year, approximately 25% of this balance between one to two years and the remaining amount thereafter.
Remaining performance obligations in the MIS segment largely reflect deferred revenue related to monitoring fees for certain structured finance products, primarily CMBS, where the issuers can elect to pay the monitoring fees for the life of the security in advance. As of September 30, 2024, the aggregate amount of the transaction price allocated to remaining performance obligations was approximately $97 million. The Company expects to recognize into revenue approximately 25% of this balance within one year, approximately 50% of this balance between one to five years and the remaining amount thereafter. With respect to the remaining performance obligations for the MIS segment, the Company has applied a practical expedient set forth in ASC Topic 606 permitting the omission of unsatisfied performance obligations relating to contracts with an original expected length of one year or less.
NOTE 3. STOCK-BASED COMPENSATION
Presented below is a summary of the stock-based compensation cost and associated tax benefit included in the accompanying consolidated statements of operations:
| | | | | | | | | | | | | | | | | | | | | | | |
| Three Months Ended September 30, | | Nine Months Ended September 30, |
| 2024 | | 2023 | | 2024 | | 2023 |
| Stock-based compensation cost | $ | 57 | | | $ | 46 | | | $ | 166 | | | $ | 143 | |
| Tax benefit | $ | 12 | | | $ | 10 | | | $ | 36 | | | $ | 32 | |
During the first nine months of 2024, the Company granted 0.2 million employee stock options, which had a weighted average grant date fair value of $120.42 per share. The Company also granted 0.5 million shares of restricted stock in the first nine months of 2024, which had a weighted average grant date fair value of $372.64 per share. Both the employee stock options and restricted stock generally vest ratably over four years. Additionally, the Company granted 0.2 million shares of performance-based awards whereby the number of shares that ultimately vest are based on the achievement of certain non-market-based performance metrics of the Company over a period of two to four years. The weighted average grant date fair value of these awards was $361.83 per share.
The following weighted average assumptions were used in determining the fair value using the Black-Scholes option-pricing model for options granted in 2024:
| | | | | |
| Expected dividend yield | 0.91 | % |
| Expected stock volatility | 28 | % |
| Risk-free interest rate | 4.34 | % |
| Expected holding period | 5.9 years |
Unrecognized stock-based compensation expense at September 30, 2024 was $16 million and $279 million for unvested stock options and restricted stock, respectively, which is expected to be recognized over a weighted average period of 1.8 years and 2.5 years, respectively. Additionally, there was $67 million of unrecognized stock-based compensation expense relating to the aforementioned non-market-based performance-based awards, which is expected to be recognized over a weighted average period of 2.3 years.
The following table summarizes information relating to stock option exercises and restricted stock vesting:
| | | | | | | | | | | |
| Nine Months Ended
September 30, |
| 2024 | | 2023 |
| Exercise of stock options: | | | |
| Proceeds from stock option exercises | $ | 44 | | | $ | 26 | |
| Aggregate intrinsic value | $ | 60 | | | $ | 48 | |
| Tax benefit realized upon exercise | $ | 10 | | | $ | 11 | |
Number of shares exercised | 0.3 | | | 0.2 | |
| Vesting of restricted stock: | | | |
| Fair value of shares vested | $ | 183 | | | $ | 154 | |
| Tax benefit realized upon vesting | $ | 45 | | | $ | 36 | |
| Number of shares vested | 0.5 | | | 0.5 | |
| Vesting of performance-based restricted stock: | | | |
| Fair value of shares vested | $ | 40 | | | $ | 24 | |
| Tax benefit realized upon vesting | $ | 9 | | | $ | 3 | |
| Number of shares vested | 0.1 | | | 0.1 | |
NOTE 4. INCOME TAXES
Moody’s ETR was 24.0% and 19.9% for the three months ended September 30, 2024 and 2023, respectively. Moody’s ETR for the nine months ended September 30, 2024 and 2023 was 23.5% and 14.6%, respectively. The increase in the ETR for the nine months ended September 30, 2024 compared to the same period in the prior year was primarily due to tax benefits recognized in the first quarter of 2023, which reflect the resolution of uncertain tax positions in various U.S. and non-U.S. tax jurisdictions and will not recur in 2024. The Company’s year-to-date provision for income taxes differs from the tax computed by applying its estimated annual ETR to the pre-tax earnings primarily due to the excess tax benefits from stock-based compensation of $23 million and a change in tax rate of a non-U.S. tax jurisdiction of $7 million.
The Company classifies interest related to UTPs in interest expense, net in its consolidated statements of operations. Penalties, if incurred, would be recognized in other non-operating income, net. The Company had a net increase in its UTP reserves of $2 million, net of federal tax, during the third quarter of 2024 and an increase in its UTPs of $13 million, net of federal tax, during the first nine months of 2024.
Moody’s is subject to U.S. federal income tax as well as income tax in various state, local and foreign jurisdictions. The tax years 2021 through 2023 remain open to examination. The Company’s New York City tax returns for 2018 through 2022 are currently under examination. The Company’s U.K. tax returns for 2017 through 2022 remain open to examination.
For ongoing audits, it is possible the balance of UTPs could decrease in the next twelve months as a result of the settlement of such audits, which might involve the payment of additional taxes, the adjustment of certain deferred taxes and/or the recognition of tax benefits. It is also possible that new issues will be raised by tax authorities which could necessitate increases to the balance of UTPs. As the Company is unable to predict the timing or outcome of these audits, it is unable to estimate the amount of future changes to the balance of UTPs at this time. However, the Company believes that it has adequately provided for its financial exposure relating to all open tax years, by tax jurisdiction, in accordance with the applicable provisions of ASC Topic 740 regarding UTPs.
The following table shows the amount the Company paid for income taxes: | | | | | | | | | | | |
| Nine Months Ended September 30, |
| 2024 | | 2023 |
| Income taxes paid | $ | 391 | | | $ | 213 | |
Effective in 2024, multiple foreign jurisdictions in which the Company operates have enacted legislation to adopt a minimum tax rate described in the Global Anti-Base Erosion tax model rules (referred to as GloBE or Pillar II) issued by the OECD. A minimum ETR of 15% applies to multinational companies with consolidated revenue above €750 million. Under the GloBE rules, a company is required to determine a combined ETR for all entities located in a jurisdiction. If the jurisdictional effective tax rate is less than 15%, an additional tax generally will be due to bring the jurisdictional ETR up to 15%. We have evaluated the impact of the Pillar II global minimum tax rules on our consolidated financial statements and related disclosures. As of September 30, 2024, the Pillar II minimum tax requirement is not expected to have a material impact on our full-year results of operations or financial position.
NOTE 5. RECONCILIATION OF WEIGHTED AVERAGE SHARES OUTSTANDING
Below is a reconciliation of basic to diluted shares outstanding: | | | | | | | | | | | | | | | | | | | | | | | |
| Three Months Ended September 30, | | Nine Months Ended September 30, |
| |
| 2024 | | 2023 | | 2024 | | 2023 |
| Basic | 181.7 | | | 183.3 | | | 182.2 | | | 183.4 | |
| Dilutive effect of shares issuable under stock-based compensation plans | 0.8 | | | 0.7 | | | 0.8 | | | 0.7 | |
| Diluted | 182.5 | | | 184.0 | | | 183.0 | | | 184.1 | |
| Anti-dilutive options to purchase common shares and restricted stock as well as contingently issuable restricted stock which are excluded from the table above | 0.3 | | | 0.4 | | | 0.4 | | | 0.5 | |
The calculation of basic shares outstanding is based on the weighted average number of shares of common stock outstanding during the reporting period. The calculation of diluted EPS requires certain assumptions regarding the use of both cash proceeds and assumed proceeds that would be received upon the exercise of stock options and vesting of restricted stock outstanding as of September 30, 2024 and 2023.
NOTE 6. CASH EQUIVALENTS AND INVESTMENTS
The table below provides additional information on the Company’s cash equivalents and investments: | | | | | | | | | | | | | | | | | | | | | | | | | | | | | | | | | | | |
| As of September 30, 2024 |
| | | | | | | Balance sheet location |
| Cost | | Gains/(Losses) | | Fair Value | | Cash and cash equivalents | | Short-term
investments | | Other
assets |
Certificates of deposit and money market deposit accounts/funds (1) | $ | 1,691 | | | $ | — | | | $ | 1,691 | | | $ | 1,117 | | | $ | 573 | | | $ | 1 | |
| Mutual funds | $ | 101 | | | $ | 11 | | | $ | 112 | | | $ | — | | | $ | — | | | $ | 112 | |
| | | | | | | | | | | |
| | | | | | | | | | | | | | | | | | | | | | | | | | | | | | | | | | | |
| As of December 31, 2023 |
| | | | | | | Balance sheet location |
|
Cost | | Gains/(Losses) | |
Fair Value | | Cash and cash
equivalents | | Short-term
investments | | Other
assets |
| | | | | | | | | | | |
Certificates of deposit and money market deposit accounts/funds (1) | $ | 1,178 | | | $ | — | | | $ | 1,178 | | | $ | 1,112 | | | $ | 63 | | | $ | 3 | |
| Mutual funds | $ | 91 | | | $ | 6 | | | $ | 97 | | | $ | — | | | $ | — | | | $ | 97 | |
(1) Consists of time deposits, money market deposit accounts and money market funds. The remaining contractual maturities for the certificates of deposits classified as short-term investments are one month to 12 months at both September 30, 2024 and December 31, 2023. The remaining contractual maturities for the certificates of deposits classified in other assets are 14 months to 15 months at September 30, 2024 and 14 months at December 31, 2023. Time deposits with a maturity of less than 90 days at time of purchase are classified as cash and cash equivalents.
In addition, the Company invested in COLI. As of September 30, 2024 and December 31, 2023, the contract value of the COLI was $49 million and $47 million, respectively.
NOTE 7. DERIVATIVE INSTRUMENTS AND HEDGING ACTIVITIES
The Company is exposed to global market risks, including risks from changes in FX rates and changes in interest rates. Accordingly, the Company uses derivatives in certain instances to manage financial exposures that occur in the normal course of business. The Company does not hold or issue derivatives for speculative purposes.
Derivatives and non-derivative instruments designated as accounting hedges:
Fair Value Hedges
Interest Rate Swaps
The Company has entered into interest rate swaps to convert the fixed interest rate on certain of its long-term debt to a floating interest rate based on the SOFR. The purpose of these hedges is to mitigate the risk associated with changes in the fair value of the long-term debt, thus the Company has designated these swaps as fair value hedges. The fair value of the swaps is adjusted quarterly with a corresponding adjustment to the carrying value of the debt. The changes in the fair value of the swaps and the underlying hedged item generally offset and the net cash settlements on the swaps are recorded each period within interest expense, net in the Company’s consolidated statements of operations.
The following table summarizes the Company’s interest rate swaps designated as fair value hedges: | | | | | | | | | | | | | | | | | | | | | | | | | | |
| | | | Notional Amount | | |
| Hedged Item | | Nature of Swap | | As of September 30, 2024 | | As of December 31, 2023 | | Floating Interest Rate |
| 2014 Senior Notes due 2044 | | Pay Floating/Receive Fixed | | $ | 300 | | | $ | 300 | | | SOFR |
| 2017 Senior Notes due 2028 | | Pay Floating/Receive Fixed | | 500 | | | 500 | | | SOFR |
| 2018 Senior Notes due 2029 | | Pay Floating/Receive Fixed | | 400 | | | 400 | | | SOFR |
| 2018 Senior Notes due 2048 | | Pay Floating/Receive Fixed | | 300 | | | 300 | | | SOFR |
| 2020 Senior Notes due 2025 | | Pay Floating/Receive Fixed | | 300 | | | 300 | | | SOFR |
| 2022 Senior Notes due 2052 | | Pay Floating/Receive Fixed | | 500 | | | 500 | | | SOFR |
| 2022 Senior Notes due 2032 | | Pay Floating/Receive Fixed | | 250 | | | 250 | | | SOFR |
| Total | | | | $ | 2,550 | | | $ | 2,550 | | | |
Refer to Note 13 for information on the cumulative amount of fair value hedging adjustments included in the carrying amount of the above hedged items.
The following table summarizes the impact to the statements of operations of the Company’s interest rate swaps designated as fair value hedges:
| | | | | | | | | | | | | | | | | | | | | | | | | | | | | | | | | |
| Total amounts of financial statement line item presented in the statements of operations in which the effects of fair value hedges are recorded | | Amount of income/(loss) recognized in the consolidated statements of operations | |
| Three Months Ended September 30, | | Nine Months Ended September 30, | |
| 2024 | | 2023 | | 2024 | | 2023 | |
| Interest expense, net | | $ | (60) | | | $ | (66) | | | $ | (185) | | | $ | (185) | | |
| | | | | | | | | | | |
Description | | Location on Consolidated Statements of Operations | | | | | | | | | |
| Net interest settlements and accruals on interest rate swaps | | Interest expense, net | | $ | (25) | | | $ | (25) | | | $ | (74) | | | $ | (64) | | |
| Fair value changes on interest rate swaps | | Interest expense, net | | $ | 79 | | | $ | (35) | | | $ | 57 | | | $ | (35) | | |
| Fair value changes on hedged debt | | Interest expense, net | | $ | (79) | | | $ | 35 | | | $ | (57) | | | $ | 35 | | |
Net investment hedges
Debt designated as net investment hedges
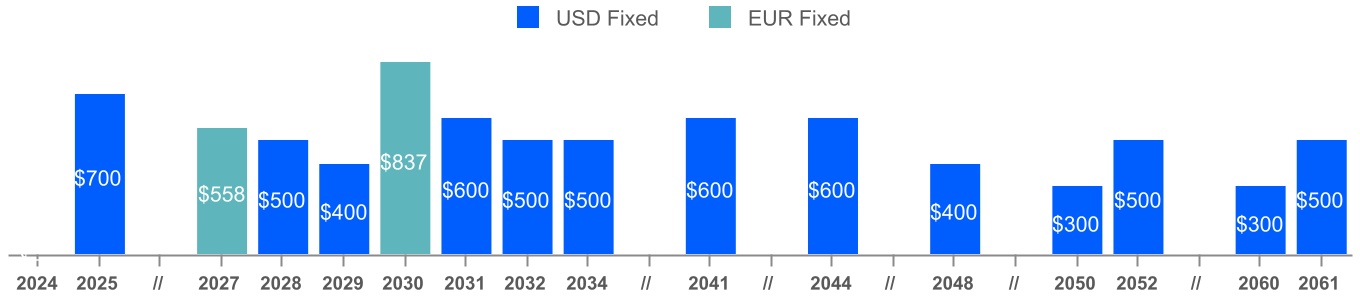
The Company has designated €500 million of the 2015 Senior Notes Due 2027 and €750 million of the 2019 Senior Notes due 2030 as net investment hedges to mitigate FX exposure related to a portion of the Company’s euro net investment in certain foreign subsidiaries against changes in euro/USD exchange rates. These hedges are designated as accounting hedges under the applicable sections of ASC Topic 815 and will end upon the repayment of the notes in 2027 and 2030, respectively, unless terminated early at the discretion of the Company.
Cross currency swaps designated as net investment hedges
The Company enters into cross-currency swaps to mitigate FX exposure related to a portion of the Company’s euro net investment in certain foreign subsidiaries against changes in euro/USD exchange rates. The following tables provide information on the cross-currency swaps designated as net investment hedges under ASC Topic 815:
| | | | | | | | | | | | | | | | | | | | | | | | | | |
| September 30, 2024 |
| | Pay | | Receive |
| Nature of Swap | | Notional Amount | | Weighted Average Interest Rate | | Notional Amount | | Weighted Average Interest Rate |
| Pay Fixed/Receive Fixed | | € | 965 | | | 2.91% | | $ | 1,014 | | | 4.41% |
| Pay Floating/Receive Floating | | 2,138 | | | Based on ESTR | | 2,250 | | | Based on SOFR |
| Total | | € | 3,103 | | | | | $ | 3,264 | | | |
| | | | | | | | | | | | | | | | | | | | | | | | | | |
| December 31, 2023 |
| | Pay | | Receive |
| Nature of Swap | | Notional Amount | | Weighted Average Interest Rate | | Notional Amount | | Weighted Average Interest Rate |
| Pay Fixed/Receive Fixed | | € | 765 | | | 3.67% | | $ | 800 | | | 5.25% |
| Pay Floating/Receive Floating | | 2,138 | | | Based on ESTR | | 2,250 | | | Based on SOFR |
| Total | | € | 2,903 | | | | | $ | 3,050 | | | |
As of September 30, 2024 these hedges will expire and the notional amounts will be settled as follows unless terminated early at the discretion of the Company:
| | | | | | | | | | | | | | |
| Years Ending December 31, | | Notional Amount (Pay) | | Notional Amount (Receive) |
| 2026 | | € | 450 | | | $ | 500 | |
| 2027 | | 531 | | | 550 | |
| 2028 | | 588 | | | 600 | |
| 2029 | | 573 | | | 614 | |
| 2031 | | 481 | | | 500 | |
| 2032 | | 480 | | | 500 | |
| Total | | € | 3,103 | | | $ | 3,264 | |
The following table provides information on the gains/(losses) on the Company’s net investment and cash flow hedges:
| | | | | | | | | | | | | | | | | | | | | | | | | | | | | | | | | | | | | | |
| Derivative and Non-Derivative Instruments in Net Investment Hedging Relationships | | Amount of Gain/(Loss) Recognized in AOCL on Derivative, net of Tax | | Amount of Loss Reclassified from AOCL into Income, net of Tax | | Gain Recognized in Income on Derivative (Amount Excluded from Effectiveness Testing) |
| Three Months Ended September 30, | | Three Months Ended September 30, | | Three Months Ended September 30, |
| 2024 | | 2023 | | 2024 | | 2023 | | 2024 | | 2023 |
| | | | | | | | | | | | |
| Cross currency swaps | | $ | (95) | | | $ | 63 | | | $ | — | | | $ | — | | | $ | 12 | | | $ | 13 | |
| Long-term debt | | (41) | | | 30 | | | — | | | — | | | — | | | — | |
| Total net investment hedges | | $ | (136) | | | $ | 93 | | | $ | — | | | $ | — | | | $ | 12 | | | $ | 13 | |
| Derivatives in Cash Flow Hedging Relationships | | | | | | | | | | | | |
| Cross currency swap | | $ | — | | | $ | — | | | $ | — | | | $ | — | | | $ | — | | | $ | — | |
| Interest rate contracts | | — | | | — | | | (1) | | | (1) | | | — | | | — | |
| Total cash flow hedges | | $ | — | | | $ | — | | | $ | (1) | | | $ | (1) | | | $ | — | | | $ | — | |
| Total | | $ | (136) | | | $ | 93 | | | $ | (1) | | | $ | (1) | | | $ | 12 | | | $ | 13 | |
| | | | | | | | | | | | |
| | | | | | | | | | | | | | | | | | | | | | | | | | | | | | | | | | | | | | |
| Derivative and Non-Derivative Instruments in Net Investment Hedging Relationships | | Amount of Gain/(Loss) Recognized in AOCL on Derivative, net of Tax | | Amount of Loss Reclassified from AOCL into Income, net of Tax | | Gain Recognized in Income on Derivative (Amount Excluded from Effectiveness Testing) |
| Nine Months Ended September 30, | | Nine Months Ended September 30, | | Nine Months Ended September 30, |
| | 2024 | | 2023 | | 2024 | | 2023 | | 2024 | | 2023 |
| | | | | | | | | | | | |
| Cross currency swaps | | $ | (20) | | | $ | — | | | $ | — | | | $ | — | | | $ | 34 | | | $ | 43 | |
| Long-term debt | | (10) | | | 8 | | | — | | | — | | | — | | | — | |
| Total net investment hedges | | $ | (30) | | | $ | 8 | | | $ | — | | | $ | — | | | $ | 34 | | | $ | 43 | |
| Derivatives in Cash Flow Hedging Relationships | | | | | | | | | | | | |
| Cross currency swaps | | $ | — | | | $ | — | | | $ | — | | | $ | 1 | | | $ | — | | | $ | — | |
| Interest rate contracts | | — | | | — | | | (2) | | | (2) | | | — | | | — | |
| Total cash flow hedges | | $ | — | | | $ | — | | | $ | (2) | | | $ | (1) | | | $ | — | | | $ | — | |
| Total | | $ | (30) | | | $ | 8 | | | $ | (2) | | | $ | (1) | | | $ | 34 | | | $ | 43 | |
| | | | | | | | | | | | |
The cumulative amount of net investment hedge and cash flow hedge gains (losses) remaining in AOCL is as follows: | | | | | | | | | | | |
| Cumulative Gains/(Losses), net of tax |
| September 30, 2024 | | December 31, 2023 |
| Net investment hedges | | | |
| Cross currency swaps | $ | 1 | | | $ | 21 | |
| FX forwards | 29 | | | 29 | |
| Long-term debt | (7) | | | 3 | |
| Total net investment hedges | $ | 23 | | | $ | 53 | |
| Cash flow hedges | | | |
| Interest rate contracts | $ | (43) | | | $ | (45) | |
| Cross currency swaps | 1 | | | 1 | |
| Total cash flow hedges | (42) | | | (44) | |
| Total net gain in AOCL | $ | (19) | | | $ | 9 | |
Derivatives not designated as accounting hedges:
Foreign exchange forwards
The Company also enters into foreign exchange forward contracts to mitigate the change in fair value on certain assets and liabilities denominated in currencies other than a subsidiary’s functional currency. These forward contracts are not designated as accounting hedges under the applicable sections of ASC Topic 815. Accordingly, changes in the fair value of these contracts are recognized immediately in other non-operating income, net, in the Company’s consolidated statements of operations along with the FX gain or loss recognized on the assets and liabilities denominated in a currency other than the subsidiary’s functional currency. These contracts have expiration dates at various times through July 2025.
The following table summarizes the notional amounts of the Company’s outstanding foreign exchange forwards: | | | | | | | | | | | | | | | | | | | | | | | | | | | | | |
| September 30, 2024 | | December 31, 2023 |
Notional amount of currency pair(1): | Sell | | Buy | | Sell | | Buy |
| Contracts to sell USD for GBP | $ | 567 | | | £ | 435 | | | $ | 513 | | | £ | 407 | |
| Contracts to sell USD for JPY | $ | 29 | | | ¥ | 4,000 | | | $ | 14 | | | ¥ | 2,000 | |
| Contracts to sell USD for CAD | $ | 52 | | | C$ | 70 | | | $ | 147 | | | C$ | 200 | |
| Contracts to sell USD for SGD | $ | 69 | | | S$ | 90 | | | $ | 50 | | | S$ | 67 | |
| Contracts to sell USD for EUR | $ | — | | | € | — | | | $ | 60 | | | € | 55 | |
| | | | | | | | | |
| Contracts to sell USD for INR | $ | 23 | | | ₹ | 1,900 | | | $ | 23 | | | ₹ | 1,900 | |
| | | | | | | | | |
| Contracts to sell EUR for USD | € | 15 | | | $ | 17 | | | € | — | | | $ | — | |
| Contracts to sell USD for AUD | $ | — | | | A$ | — | | | $ | 5 | | | A$ | 8 | |
| Contracts to sell CAD for USD | C$ | — | | | $ | — | | | C$ | 25 | | | $ | 19 | |
| | | | | | | | | | | | | | | | | | | | | | | | | | | | | | | | | | | | | | | | | | | | | | | |
| (1) € = euro, £ = British pound, S$ = Singapore dollar, $ = U.S. dollar, ¥ = Japanese yen, C$ = Canadian dollar, ₹= Indian Rupee, A$ = Australian dollar |
Total Return Swaps
The Company has entered into total return swaps to mitigate market-driven changes in the value of certain liabilities associated with the Company's deferred compensation plans. The fair value of these swaps at September 30, 2024 and related gains in the three and nine months ended September 30, 2024 were not material. The notional amount of the total return swaps as of September 30, 2024 and December 31, 2023 was $65 million and $58 million, respectively.
The following table summarizes the impact to the consolidated statements of operations relating to the gains (losses) on the Company’s derivatives which are not designated as hedging instruments:
| | | | | | | | | | | | | | | | | | | | | | | | | | | | | | | | | | |
| Derivatives not designated as accounting hedges | | Location on Consolidated Statements of Operations | | | Three Months Ended September 30, | | Nine Months Ended September 30, | |
| | | 2024 | | 2023 | | 2024 | | 2023 | |
| FX forwards | | Other non-operating income, net | | | $ | 39 | | | $ | (25) | | | $ | 21 | | | $ | (10) | | |
| Total return swaps | | Operating expense | | | $ | 1 | | | $ | (2) | | | $ | 5 | | | $ | (2) | | |
| Total return swaps | | SG&A expense | | | $ | 1 | | | $ | (1) | | | $ | 2 | | | $ | (1) | | |
The table below shows the classification between assets and liabilities on the Company’s consolidated balance sheets for the fair value of the derivative instrument as well as the carrying value of its non-derivative debt instruments designated and qualifying as net investment hedges: | | | | | | | | | | | | | | | | | | | | |
| | Derivative and Non-Derivative Instruments |
| | Balance Sheet Location | | September 30, 2024 | | December 31, 2023 |
| Assets: | | | | | | |
| Derivatives designated as accounting hedges: | | | | | | |
| | | | | | |
| Cross-currency swaps designated as net investment hedges | | Other assets | | $ | — | | | $ | 3 | |
| | | | | | |
| | | | | | |
| | | | | | |
| Derivatives not designated as accounting hedges: | | | | | | |
| FX forwards on certain assets and liabilities | | Other current assets | | 17 | | | 13 | |
| | | | | | |
| Total assets | | | | $ | 17 | | | $ | 16 | |
| Liabilities: | | | | | | |
| Derivatives designated as accounting hedges: | | | | | | |
| | | | | | |
| Interest rate swaps designated as fair value hedges | | Accounts payable and accrued liabilities | | $ | 6 | | | $ | — | |
| Cross-currency swaps designated as net investment hedges | | Other liabilities | | 207 | | | 183 | |
| Interest rate swaps designated as fair value hedges | | Other liabilities | | 120 | | | 183 | |
| Total derivatives designated as accounting hedges | | | | 333 | | | 366 | |
| Non-derivatives designated as accounting hedges: | | | | | | |
| Long-term debt designated as net investment hedge | | Long-term debt | | 1,395 | | | 1,381 | |
| | | | | | |
| | | | | | |
| Total liabilities | | | | $ | 1,728 | | | $ | 1,747 | |
NOTE 8. GOODWILL AND OTHER ACQUIRED INTANGIBLE ASSETS
The following table summarizes the activity in goodwill for the periods indicated: | | | | | | | | | | | | | | | | | | | | | | | | | | | | | | | | | | | | | | | | | | | | | | | | | | | | | |
| Nine Months Ended September 30, 2024 |
| MA | | MIS | | Consolidated |
| Gross goodwill | | Accumulated
impairment
charge | | Net
goodwill | | Gross goodwill | | Accumulated impairment
charge | | Net
goodwill | | Gross goodwill | | Accumulated
impairment
charge | | Net
goodwill |
Balance at beginning
of year | $ | 5,681 | | | $ | (12) | | | $ | 5,669 | | | $ | 287 | | | $ | — | | | $ | 287 | | | $ | 5,968 | | | $ | (12) | | | $ | 5,956 | |
Additions/ adjustments (1) | 39 | | | — | | | 39 | | | 98 | | | — | | | 98 | | | 137 | | | — | | | 137 | |
| Foreign currency translation adjustments | 54 | | | — | | | 54 | | | 1 | | | — | | | 1 | | | 55 | | | — | | | 55 | |
| | | | | | | | | | | | | | | | | |
| Ending balance | $ | 5,774 | | | $ | (12) | | | $ | 5,762 | | | $ | 386 | | | $ | — | | | $ | 386 | | | $ | 6,160 | | | $ | (12) | | | $ | 6,148 | |
| | | | | | | | | | | | | | | | | | | | | | | | | | | | | | | | | | | | | | | | | | | | | | | | | | | | | |
| Year Ended December 31, 2023 |
| MA | | MIS | | Consolidated |
| Gross goodwill | | Accumulated impairment charge | | Net goodwill | | Gross goodwill | | Accumulated impairment charge | | Net goodwill | | Gross goodwill | | Accumulated impairment charge | | Net goodwill |
Balance at beginning
of year | $ | 5,474 | | | $ | (12) | | | $ | 5,462 | | | $ | 377 | | | $ | — | | | $ | 377 | | | $ | 5,851 | | | $ | (12) | | | $ | 5,839 | |
Additions/ adjustments (2) | 90 | | | — | | | 90 | | | (87) | | | — | | | (87) | | | 3 | | | — | | | 3 | |
Foreign currency translation
adjustments | 117 | | | — | | | 117 | | | (3) | | | — | | | (3) | | | 114 | | | — | | | 114 | |
| | | | | | | | | | | | | | | | | |
| Ending balance | $ | 5,681 | | | $ | (12) | | | $ | 5,669 | | | $ | 287 | | | $ | — | | | $ | 287 | | | $ | 5,968 | | | $ | (12) | | | $ | 5,956 | |
(1) The 2024 additions/adjustments primarily relate to certain immaterial acquisitions in 2024 (most notably GCR and Praedicat in the third quarter of 2024).
(2) The 2023 additions/adjustments primarily relate to a reallocation of goodwill pursuant to a realignment of certain components of the Company's ESG business in the first quarter of 2023.
Acquired intangible assets and related amortization consisted of: | | | | | | | | | | | |
| September 30,
2024 | | December 31,
2023 |
| Customer relationships | $ | 2,109 | | | $ | 2,065 | |
| Accumulated amortization | (634) | | | (556) | |
| Net customer relationships | 1,475 | | | 1,509 | |
| Software/product technology | 691 | | | 674 | |
| Accumulated amortization | (420) | | | (364) | |
| Net software/product technology | 271 | | | 310 | |
| Database | 179 | | | 179 | |
| Accumulated amortization | (97) | | | (82) | |
| Net database | 82 | | | 97 | |
| Trade names | 207 | | | 199 | |
| Accumulated amortization | (83) | | | (72) | |
| Net trade names | 124 | | | 127 | |
Other (1) | 66 | | | 52 | |
| Accumulated amortization | (48) | | | (46) | |
| Net other | 18 | | | 6 | |
| Total acquired intangible assets, net | $ | 1,970 | | | $ | 2,049 | |
(1) Other intangible assets primarily consist of trade secrets, covenants not to compete, and acquired ratings methodologies and models.
Amortization expense relating to acquired intangible assets is as follows:
| | | | | | | | | | | | | | | | | | | | | | | |
| Three Months Ended September 30, | | Nine Months Ended
September 30, |
| 2024 | | 2023 | | 2024 | | 2023 |
| Amortization expense | $ | 51 | | | $ | 49 | | | $ | 148 | | | $ | 150 | |
NOTE 9. RESTRUCTURING
On June 30, 2022, the chief executive officer of Moody’s approved the 2022 - 2023 Geolocation Restructuring Program. The Company estimates that the program will result in annualized savings of $145 million to $165 million per year. This program related to the Company's post-COVID-19 geolocation strategy and other strategic initiatives and included the rationalization and exit of certain leased office spaces and a reduction in staff, including the relocation of certain job functions. Cumulative charges related to this program are shown in the table below. The savings generated from the 2022 - 2023 Geolocation Restructuring Program will strengthen the Company's operating margin, with a portion being deployed to support strategic investments, including the Company's workplace of the future program and employee retention initiatives. The 2022 - 2023 Geolocation Restructuring Program was substantially completed at the end of 2023. Cash outlays associated with this program, which primarily relate to personnel-related costs, are expected to be $145 million to $155 million, substantially all of which are expected to be paid by the end of 2024.
Total expense included in the accompanying consolidated statements of operations relating to the aforementioned restructuring program is below:
| | | | | | | | | | | | | | | | | | | | | | | | | | | | | |
| 2022 - 2023 Geolocation Restructuring Program | Three months ended September 30, | | Nine months ended September 30, | | Cumulative expense incurred |
| 2024 | | 2023 | | 2024 | | 2023 | |
| Employee Termination Costs | $ | 6 | | | $ | 17 | | | $ | 13 | | | $ | 39 | | | $ | 149 | |
| Real Estate Related Costs | — | | | 10 | | | — | | | 12 | | | 63 | |
| Other Costs | — | | | — | | | — | | | — | | | 1 | |
| Total Restructuring | $ | 6 | | | $ | 27 | | | $ | 13 | | | $ | 51 | | | $ | 213 | |
The restructuring liability for the aforementioned plan was not material at September 30, 2024.
NOTE 10. FAIR VALUE
The tables below present information about items that are carried at fair value at September 30, 2024 and December 31, 2023:
| | | | | | | | | | | | | | | | | |
| Fair Value Measurement as of September 30, 2024 |
| Description | Balance | | Level 1 | | Level 2 |
| Assets: | | | | | |
Derivatives (1) | $ | 17 | | | $ | — | | | $ | 17 | |
| Money market funds/mutual funds | 122 | | | 122 | | | — | |
| Total | $ | 139 | | | $ | 122 | | | $ | 17 | |
| Liabilities: | | | | | |
Derivatives (1) | $ | 333 | | | $ | — | | | $ | 333 | |
| Total | $ | 333 | | | $ | — | | | $ | 333 | |
| | | | | | | | | | | | | | | | | |
| Fair Value Measurement as of December 31, 2023 |
| Description | Balance | | Level 1 | | Level 2 |
| Assets: | | | | | |
Derivatives (1) | $ | 16 | | | $ | — | | | $ | 16 | |
| Money market funds/mutual funds | 107 | | | 107 | | | — | |
| Total | $ | 123 | | | $ | 107 | | | $ | 16 | |
| Liabilities: | | | | | |
Derivatives (1) | $ | 366 | | | $ | — | | | $ | 366 | |
| Total | $ | 366 | | | $ | — | | | $ | 366 | |
(1) Represents fair value of certain derivative contracts as more fully described in Note 7 to the consolidated financial statements.
The following are descriptions of the methodologies utilized by the Company to estimate the fair value of its derivative contracts, money market mutual funds and mutual funds:
Derivatives:
In determining the fair value of the derivative contracts in the table above, the Company utilizes industry standard valuation models. Where applicable, these models project future cash flows and discount the future amounts to a present value using spot rates, forward points, currency volatilities, interest rates as well as the risk of non-performance of the Company and the counterparties with whom it has derivative contracts. The Company established strict counterparty credit guidelines and only enters into transactions with financial institutions that adhere to these guidelines. Accordingly, the risk of counterparty default is deemed to be minimal.
Money market funds and mutual funds:
The mutual funds in the table above are deemed to be equity securities with readily determinable fair values with changes in the fair value recognized through net income under ASC Topic 321. The fair value of these instruments is determined using Level 1 inputs as defined in the ASC Topic 820.
NOTE 11. OTHER BALANCE SHEET AND STATEMENTS OF OPERATIONS INFORMATION
The following tables contain additional detail related to certain balance sheet captions:
| | | | | | | | | | | |
| September 30, 2024 | | December 31, 2023 |
| Other current assets: | | | |
| Prepaid taxes | $ | 73 | | | $ | 115 | |
| Prepaid expenses | 168 | | | 133 | |
| Capitalized costs to obtain and fulfill sales contracts | 118 | | | 116 | |
| Foreign exchange forwards on certain assets and liabilities | 17 | | | 13 | |
| | | |
| Interest receivable on interest rate and cross currency swaps | 51 | | | 79 | |
| Other | 43 | | | 33 | |
| Total other current assets | $ | 470 | | | $ | 489 | |
| | | |
| Other assets: | | | |
| Investments in non-consolidated affiliates | $ | 467 | | | $ | 521 | |
| Deposits for real-estate leases | 16 | | | 16 | |
| Indemnification assets related to acquisitions | 112 | | | 111 | |
| Mutual funds, certificates of deposit and money market deposit accounts/funds | 113 | | | 100 | |
| Company owned life insurance (at contract value) | 49 | | | 47 | |
| Capitalized costs to obtain sales contracts | 202 | | | 196 | |
| Derivative instruments designated as accounting hedges | — | | | 3 | |
| Pension and other retirement employee benefits | 41 | | | 41 | |
| Other | 86 | | | 103 | |
| Total other assets | $ | 1,086 | | | $ | 1,138 | |
| | | |
| Accounts payable and accrued liabilities: | | | |
| Salaries and benefits | $ | 130 | | | $ | 130 | |
| Incentive compensation | 321 | | | 345 | |
| Customer credits, advanced payments and advanced billings | 136 | | | 105 | |
| | | |
| Dividends | 17 | | | 7 | |
| Professional service fees | 56 | | | 46 | |
| Interest accrued on debt | 52 | | | 83 | |
| Accounts payable | 50 | | | 23 | |
| Income taxes | 156 | | | 108 | |
| Pension and other retirement employee benefits | 15 | | | 15 | |
| Accrued royalties | 18 | | | 24 | |
| | | |
| Restructuring liability | 12 | | | 35 | |
| | | |
| Derivative instruments designated as accounting hedges | 6 | | | — | |
| Interest payable on interest rate and cross currency swaps | 52 | | | 67 | |
| Other | 112 | | | 88 | |
| Total accounts payable and accrued liabilities | $ | 1,133 | | | $ | 1,076 | |
| | | |
| | | |
| | | |
| | | |
| | | |
| | | |
| | | |
| | | |
| | | |
| | | |
| | | | | | | | | | | |
| | | |
| | | |
| | | |
| | | |
| | | |
| | | |
| | | |
| | | |
| | | |
| | | |
| | | |
| | | |
| | | |
| | | |
| | | |
| | | |
| | | |
| | | |
| | | |
| | | |
| | | |
| | | |
| | | |
| | | |
| | | |
| | | |
| | | |
| | | |
| | | |
| | | |
| | | |
| | | |
| | | |
| | | |
| | | |
| | | |
| September 30, 2024 | | December 31, 2023 |
| Other liabilities: | | | |
| Pension and other retirement employee benefits | $ | 199 | | | $ | 190 | |
| | | |
| Interest accrued on UTPs | 45 | | | 36 | |
| MAKS indemnification provisions | 19 | | | 19 | |
| Income tax liability - non-current portion | 12 | | | 15 | |
| Derivative instruments designated as accounting hedges | 327 | | | 366 | |
| | | |
| Other | 59 | | | 50 | |
| Total other liabilities | $ | 661 | | | $ | 676 | |
Investments in non-consolidated affiliates:
The following table provides additional detail regarding Moody's investments in non-consolidated affiliates, as included in other assets in the consolidated balance sheets:
| | | | | | | | | | | |
| September 30, 2024 | | December 31, 2023 |
Equity method investments (1) | $ | 131 | | | $ | 186 | |
Investments measured using the measurement alternative (2) | 327 | | | 327 | |
| Other | 9 | | | 8 | |
| Total investments in non-consolidated affiliates | $ | 467 | | | $ | 521 | |
| (1) Equity securities in which the Company has significant influence over the investee but does not have a controlling financial interest in accordance with ASC Topic 323. |
| (2) Equity securities without readily determinable fair value for which the Company has elected to apply the measurement alternative in accordance with ASC Topic 321. |
Moody's holds various investments accounted for under the equity method, the most significant of which is the Company's minority investment in CCXI. Moody's also holds various investments measured using the measurement alternative, the most significant of which is the Company's minority interest in BitSight.
Earnings from non-consolidated affiliates, which are included within other non-operating income, net, are disclosed within the table below.
Other non-operating income, net:
The following table summarizes the components of other non-operating income, net:
| | | | | | | | | | | | | | | | | | | | | | | |
| Three Months Ended September 30, | | Nine Months Ended September 30, |
| 2024 | | 2023 | | 2024 | | 2023 |
FX (loss) gain (1) | $ | — | | | $ | 2 | | | $ | (7) | | | $ | (29) | |
| Net periodic pension income - non-service and non-interest cost components | 9 | | | 8 | | | 25 | | | 26 | |
| Income from investments in non-consolidated affiliates | 8 | | | 9 | | | 10 | | | 12 | |
Gain on previously held equity method investments (2) | 7 | | | — | | | 7 | | | — | |
| Gain on investments | 4 | | | — | | | 12 | | | 11 | |
Other (3) | (3) | | | (1) | | | (2) | | | 11 | |
| Total | $ | 25 | | | $ | 18 | | | $ | 45 | | | $ | 31 | |
(1) The amount for the nine months ended September 30, 2023 includes a $23 million loss recorded pursuant to an immaterial out-of-period adjustment relating to the 2022 fiscal year.
(2) The amounts for the three and nine months ended September 30, 2024 reflect non-cash gains relating to the step-acquisitions of Praedicat and GCR.
(3) The amount for the nine months ended September 30, 2023 includes a benefit of $9 million related to the favorable resolutions of various tax matters.
Charges related to asset abandonment:
During the nine months ended September 30, 2024, the Company recorded charges related to asset abandonment of $30 million. Costs of $15 million were recorded in the second quarter of 2024 related to severance incurred pursuant to a reduction in staff due to the Company's decision to outsource the production of certain sustainability content utilized in our product offerings. Additionally, the Company has reduced the estimated useful lives of certain internally developed software and amortizable intangible assets that are associated with the sustainability content offerings for which production is being outsourced. During the third quarter of 2024,
the Company incurred $15 million in incremental amortization expense related to the change in estimated useful lives of these assets and expects to incur an additional $15 million of incremental amortization expense in the fourth quarter of 2024.
NOTE 12. COMPREHENSIVE INCOME AND ACCUMULATED OTHER COMPREHENSIVE LOSS
The following tables show changes in AOCL by component (net of tax): | | | | | | | | | | | | | | | | | | | | | | | | | | | | | | | | | | | |
| | | | | | | | | | | |
| Three Months Ended September 30, |
| 2024 | | 2023 |
| Gains/(Losses) | Pension and Other Retirement Benefits | Cash Flow Hedges | Foreign Currency Translation Adjustments | Net Investment Hedges | Total | | Pension and Other Retirement Benefits | Cash Flow Hedges | Foreign Currency Translation Adjustments | Net Investment Hedges | Total |
| Balance at June 30, | $ | (59) | | $ | (43) | | $ | (674) | | $ | 159 | | $ | (617) | | | $ | (48) | | $ | (45) | | $ | (577) | | $ | 100 | | $ | (570) | |
| Other comprehensive income/(loss) before reclassifications | — | | — | | 249 | | (136) | | 113 | | | 1 | | — | | (176) | | 93 | | (82) | |
| Amounts reclassified from AOCL | — | | 1 | | — | | — | | 1 | | | (1) | | 1 | | — | | — | | — | |
| Other comprehensive income/(loss) | — | | 1 | | 249 | | (136) | | 114 | | | — | | 1 | | (176) | | 93 | | (82) | |
| Balance at September 30, | $ | (59) | | $ | (42) | | $ | (425) | | $ | 23 | | $ | (503) | | | $ | (48) | | $ | (44) | | $ | (753) | | $ | 193 | | $ | (652) | |
| | | | | | | | | | | | | | | | | | | | | | | | | | | | | | | | | | | |
| Nine Months Ended September 30, |
| 2024 | | 2023 |
| Gains/(Losses) | Pension and Other Retirement Benefits | Cash Flow Hedges | Foreign Currency Translation Adjustments | Net Investment Hedges | Total | | Pension and Other Retirement Benefits | Cash Flow Hedges | Foreign Currency Translation Adjustments | Net Investment Hedges | Total |
| Balance at December 31, | $ | (56) | | $ | (44) | | $ | (520) | | $ | 53 | | $ | (567) | | | $ | (47) | | $ | (45) | | $ | (736) | | $ | 185 | | $ | (643) | |
| Other comprehensive (loss)/income before reclassifications | (2) | | — | | 95 | | (30) | | 63 | | | 1 | | — | | (17) | | 8 | | (8) | |
| Amounts reclassified from AOCL | (1) | | 2 | | — | | — | | 1 | | | (2) | | 1 | | — | | — | | (1) | |
| | | | | | | | | | | |
| Other comprehensive (loss)/income | (3) | | 2 | | 95 | | (30) | | 64 | | | (1) | | 1 | | (17) | | 8 | | (9) | |
| Balance at September 30, | $ | (59) | | $ | (42) | | $ | (425) | | $ | 23 | | $ | (503) | | | $ | (48) | | $ | (44) | | $ | (753) | | $ | 193 | | $ | (652) | |
|
NOTE 13. INDEBTEDNESS
The Company’s debt is recorded at its carrying value, which represents the issuance amount plus or minus any issuance premium or discount, except for certain debt as depicted in the table below, which is recorded at the carrying value adjusted for the fair value of an interest rate swap used to hedge the fair value of the note.
The following table summarizes total indebtedness:
| | | | | | | | | | | | | | | | | | | | | | | | | | | | | |
| September 30, 2024 |
| Notes Payable: | Principal Amount | | Fair Value of Interest Rate Swaps (1) | | Unamortized (Discount) Premium | | Unamortized Debt Issuance Costs | | Carrying Value |
| 5.25% 2014 Senior Notes, due 2044 | $ | 600 | | | $ | (26) | | | $ | 3 | | | $ | (4) | | | $ | 573 | |
| 1.75% 2015 Senior Notes, due 2027 | 558 | | | — | | | — | | | (1) | | | 557 | |
| | | | | | | | | |
| 3.25% 2017 Senior Notes, due 2028 | 500 | | | (14) | | | (2) | | | (1) | | | 483 | |
| 4.25% 2018 Senior Notes, due 2029 | 400 | | | (25) | | | (1) | | | (1) | | | 373 | |
| 4.875% 2018 Senior Notes, due 2048 | 400 | | | (29) | | | (6) | | | (3) | | | 362 | |
| 0.950% 2019 Senior Notes, due 2030 | 837 | | | — | | | (2) | | | (3) | | | 832 | |
| 3.75% 2020 Senior Notes, due 2025 | 700 | | | (6) | | | — | | | (1) | | | 693 | |
| 3.25% 2020 Senior Notes, due 2050 | 300 | | | — | | | (4) | | | (3) | | | 293 | |
| 2.55% 2020 Senior Notes, due 2060 | 300 | | | — | | | (2) | | | (3) | | | 295 | |
| 2.00% 2021 Senior Notes, due 2031 | 600 | | | — | | | (6) | | | (4) | | | 590 | |
| 2.75% 2021 Senior Notes, due 2041 | 600 | | | — | | | (12) | | | (5) | | | 583 | |
| 3.10% 2021 Senior Notes, due 2061 | 500 | | | — | | | (7) | | | (5) | | | 488 | |
| 3.75% 2022 Senior Notes, due 2052 | 500 | | | (21) | | | (8) | | | (5) | | | 466 | |
| 4.25% 2022 Senior Notes, due 2032 | 500 | | | (5) | | | (2) | | | (3) | | | 490 | |
| 5.00% 2024 Senior Notes, due 2034 | 500 | | | — | | | (4) | | | (5) | | | 491 | |
| Total debt | $ | 7,795 | | | $ | (126) | | | $ | (53) | | | $ | (47) | | | $ | 7,569 | |
| Current portion | | | | | | | | | (693) | |
| Total long-term debt | | | | | | | | | $ | 6,876 | |
| | | | | | | | | | | | | | | | | | | | | | | | | | | | | |
| December 31, 2023 |
| Notes Payable: | Principal Amount | | Fair Value of Interest Rate Swaps (1) | | Unamortized (Discount) Premium | | Unamortized Debt Issuance Costs | | Carrying Value |
| 5.25% 2014 Senior Notes, due 2044 | $ | 600 | | | $ | (34) | | | $ | 3 | | | $ | (4) | | | $ | 565 | |
| 1.75% 2015 Senior Notes, due 2027 | 552 | | | — | | | — | | | (1) | | | 551 | |
| | | | | | | | | |
| 3.25% 2017 Senior Notes, due 2028 | 500 | | | (26) | | | (2) | | | (2) | | | 470 | |
| 4.25% 2018 Senior Notes, due 2029 | 400 | | | (34) | | | (2) | | | (2) | | | 362 | |
| 4.875% 2018 Senior Notes, due 2048 | 400 | | | (36) | | | (6) | | | (3) | | | 355 | |
| 0.950% 2019 Senior Notes, due 2030 | 829 | | | — | | | (2) | | | (4) | | | 823 | |
| 3.75% 2020 Senior Notes, due 2025 | 700 | | | (16) | | | (1) | | | (1) | | | 682 | |
| 3.25% 2020 Senior Notes, due 2050 | 300 | | | — | | | (4) | | | (3) | | | 293 | |
| 2.55% 2020 Senior Notes, due 2060 | 300 | | | — | | | (2) | | | (3) | | | 295 | |
| 2.00% 2021 Senior Notes, due 2031 | 600 | | | — | | | (6) | | | (4) | | | 590 | |
| 2.75% 2021 Senior Notes, due 2041 | 600 | | | — | | | (12) | | | (5) | | | 583 | |
| 3.10% 2021 Senior Notes, due 2061 | 500 | | | — | | | (7) | | | (5) | | | 488 | |
| 3.75% 2022 Senior Notes, due 2052 | 500 | | | (29) | | | (8) | | | (5) | | | 458 | |
| 4.25% 2022 Senior Notes, due 2032 | 500 | | | (8) | | | (2) | | | (4) | | | 486 | |
| Total long-term debt | $ | 7,281 | | | $ | (183) | | | $ | (51) | | | $ | (46) | | | $ | 7,001 | |
(1) The fair value of interest rate swaps in the tables above represents the cumulative amount of fair value hedging adjustments included in the carrying value of the hedged debt.
Notes Payable
At September 30, 2024, the Company was in compliance with all covenants contained within all of the debt agreements. All of the debt agreements contain cross default provisions which state that default under one of the aforementioned debt instruments could in turn permit lenders under other debt instruments to declare borrowings outstanding under those instruments to be immediately due and payable. As of September 30, 2024, there were no such cross defaults.
The repayment schedule for the Company’s borrowings is as follows:
| | | | | |
| Year Ending December 31, | Year Ending Total |
| 2024 (After September 30,) | $ | — | |
| 2025 | 700 | |
| 2026 | — | |
| 2027 | 558 | |
| 2028 | 500 | |
| Thereafter | 6,037 | |
| Total | $ | 7,795 | |
Interest expense, net
The following table summarizes the components of interest as presented in the consolidated statements of operations and the cash paid for interest:
| | | | | | | | | | | | | | | | | | | | | | | | |
| Three Months Ended September 30, | | Nine Months Ended September 30, | |
| 2024 | | 2023 | | 2024 | | 2023 | |
| Income | $ | 28 | | | $ | 19 | | | $ | 73 | | | $ | 44 | | |
Expense on borrowings(1) | (79) | | | (75) | | | (227) | | | (220) | | |
(Expense) income on UTPs and other tax related liabilities(2) | (3) | | | (4) | | | (12) | | | 10 | | |
| Net periodic pension costs - interest component | (6) | | | (6) | | | (19) | | | (19) | | |
| Interest expense, net | $ | (60) | | | $ | (66) | | | $ | (185) | | | $ | (185) | | |
Interest paid(3) | $ | 83 | | | $ | 87 | | | $ | 234 | | | $ | 230 | | |
(1) Expense on borrowings includes interest on long-term debt, as well as realized gains/losses related to interest rate swaps and cross currency swaps, which are more fully discussed in Note 7.
(2) The amount for the nine months ended September 30, 2023 includes a $22 million reduction of tax-related interest expense primarily related to the resolutions of tax matters.
(3) Interest paid includes net settlements on interest rate swaps, which are more fully discussed in Note 7.
The fair value and carrying value of the Company’s debt as of September 30, 2024 and December 31, 2023 are as follows:
| | | | | | | | | | | | | | | | | | | | | | | |
| September 30, 2024 | | December 31, 2023 |
| Carrying Value | | Estimated Fair Value | | Carrying Value | | Estimated Fair Value |
| Total debt | $ | 7,569 | | | $ | 7,066 | | | $ | 7,001 | | | $ | 6,402 | |
The fair value of the Company’s debt is estimated based on quoted prices in active markets as of the reporting date, which are considered Level 1 inputs within the fair value hierarchy.
NOTE 14. LEASES
The Company has operating leases, substantially all of which relate to the lease of office space. The Company’s leases which are classified as finance leases are not material to the consolidated financial statements. Certain of the Company’s leases include options to renew, with renewal terms that can extend the lease term from one year to 20 years at the Company’s discretion.
The following table presents the components of the Company’s lease cost:
| | | | | | | | | | | | | | | | | | | | | | | |
| Three Months Ended September 30, | | Nine Months Ended September 30, |
| 2024 | | 2023 | | 2024 | | 2023 |
| Operating lease cost | $ | 23 | | | $ | 23 | | | $ | 66 | | | $ | 70 | |
| Sublease income | (1) | | | (1) | | | (5) | | | (5) | |
| Variable lease cost | 5 | | | 6 | | | 16 | | | 16 | |
| Total lease cost | $ | 27 | | | $ | 28 | | | $ | 77 | | | $ | 81 | |
The following tables present other information related to the Company’s operating leases:
| | | | | | | | | | | | | | | | | | | | | | | |
| Three Months Ended September 30, | | Nine Months Ended September 30, |
| 2024 | | 2023 | | 2024 | | 2023 |
| Cash paid for amounts included in the measurement of operating lease liabilities | $ | 31 | | | $ | 30 | | | $ | 90 | | | $ | 90 | |
| Right-of-use assets obtained in exchange for new operating lease liabilities | $ | 15 | | | $ | 1 | | | $ | 20 | | | $ | 25 | |
| | | | | | | | | | | | |
| September 30, 2024 | | September 30, 2023 | |
| Weighted-average remaining lease term | 4.0 years | | 4.6 years | |
| Weighted-average discount rate applied to operating leases | 3.2 | % | | 3.2 | % | |
The following table presents a maturity analysis of the future minimum lease payments included within the Company’s operating lease liabilities at September 30, 2024:
| | | | | | | | |
| Year Ending December 31, | | Operating Leases |
| 2024 (After September 30,) | | $ | 30 | |
| 2025 | | 113 | |
| 2026 | | 93 | |
| 2027 | | 75 | |
| 2028 | | 24 | |
| After 2028 | | 41 | |
| Total lease payments (undiscounted) | | 376 | |
| Less: Interest | | 22 | |
| Present value of lease liabilities: | | $ | 354 | |
| Lease liabilities - current | | $ | 109 | |
| Lease liabilities - noncurrent | | $ | 245 | |
NOTE 15. CONTINGENCIES
Given the nature of the Company's activities, Moody’s and its subsidiaries are subject to legal and tax proceedings, governmental, regulatory and legislative investigations, subpoenas and other inquiries, and claims and litigation by governmental and private parties that are based on ratings assigned by MIS or that are otherwise incidental to the Company’s business. Moody’s and MIS also are subject to periodic reviews, inspections, examinations and investigations by regulators in the U.S. and other jurisdictions, any of which may result in claims, legal proceedings, assessments, fines, penalties or restrictions on business activities. On September 3, 2024, MIS settled charges by the SEC for failure to comply with record preservation requirements applicable to MIS. The settlement followed an investigation relating to certain business communications sent over electronic messaging channels that had not been approved by MIS. The SEC has settled similar charges with other NRSROs and other registrants subject to record preservation requirements. The terms of MIS's settlement included the payment of a $20 million civil monetary penalty. As previously disclosed in the Company's Form 10-Q's this year, the Company had accrued that amount in its consolidated financial statements in prior periods. Moody’s also is subject to ongoing tax audits as addressed in Note 4 to the consolidated financial statements.
Management periodically assesses the Company’s liabilities and contingencies in connection with these matters based upon the latest information available. For claims, litigation and proceedings and governmental investigations and inquiries not related to income taxes, the Company records liabilities in the consolidated financial statements when it is both probable that a liability has been incurred and the amount of loss can be reasonably estimated and periodically adjusts these as appropriate. When the
reasonable estimate of the loss is within a range of amounts, the minimum amount of the range is accrued unless some higher amount within the range is a better estimate than another amount within the range. In instances when a loss is reasonably possible but uncertainties exist related to the probable outcome and/or the amount or range of loss, management does not record a liability but discloses the contingency if material. As additional information becomes available, the Company adjusts its assessments and estimates of such matters accordingly. Moody’s also discloses material pending legal proceedings pursuant to SEC rules and other pending matters as it may determine to be appropriate.
In view of the inherent difficulty of assessing the potential outcome of legal proceedings, governmental, regulatory and legislative investigations and inquiries, claims and litigation and similar matters and contingencies, particularly when the claimants seek large or indeterminate damages or assert novel legal theories or the matters involve a large number of parties, the Company often cannot predict what the eventual outcome of the pending matters will be or the timing of any resolution of such matters. The Company also may be unable to predict the impact (if any) that any such matters may have on how its business is conducted, on its competitive position or on its financial position, results of operations or cash flows. As the process to resolve any pending matters progresses, management will continue to review the latest information available and assess its ability to predict the outcome of such matters and the effects, if any, on its operations and financial condition and to accrue for and disclose such matters as and when required. However, because such matters are inherently unpredictable and unfavorable developments or resolutions can occur, the ultimate outcome of such matters, including the amount of any loss, may differ from those estimates.
NOTE 16. SEGMENT INFORMATION
The Company is organized into two operating segments: MA and MIS and accordingly, the Company reports in two reportable segments: MA and MIS.
Revenue for MA and expenses for MIS include an intersegment fee charged to MIS from MA for certain MA products and services utilized in MIS’s ratings process. Additionally, revenue for MIS and expenses for MA include intersegment fees charged to MA for the rights to use and distribute content, data and products developed by MIS. These intersegment fees are generally based on the market value of the products and services being transferred between the segments.
Overhead expenses include costs such as rent and occupancy, information technology and support staff such as finance, human resources and legal. Such costs and corporate expenses that exclusively benefit one segment are fully charged to that segment.
For overhead costs and corporate expenses that benefit both segments, costs are allocated to each segment based on the segment’s share of full-year 2018 actual revenue which comprises a “Baseline Pool” established in 2019, which will remain fixed over time. In subsequent periods, incremental overhead costs (or reductions thereof) will be allocated to each segment based on the prevailing shares of total revenue represented by each segment.
“Eliminations” in the following table represent intersegment revenue/expense. Moody’s does not report the Company’s assets by reportable segment, as this metric is not used by the CODM to allocate resources to the segments. Consequently, it is not practical to show assets by reportable segment.
Financial Information by Segment
The table below shows revenue and Adjusted Operating Income by reportable segment. Adjusted Operating Income is a financial metric utilized by the Company’s CODM to assess the profitability of each reportable segment. Refer to Note 2 for further details on the components of the Company’s revenue.
| | | | | | | | | | | | | | | | | | | | | | | | | | | | | | | | | | | | | | | | | | | | | | | |
| Three Months Ended September 30, |
| 2024 | | 2023 |
| MA | | MIS | | Eliminations | | Consolidated | | MA | | MIS | | Eliminations | | Consolidated |
| Total external revenue | $ | 831 | | | $ | 982 | | | $ | — | | | $ | 1,813 | | | $ | 776 | | | $ | 696 | | | $ | — | | | $ | 1,472 | |
| Intersegment revenue | 3 | | | 48 | | | (51) | | | — | | | 3 | | | 47 | | | (50) | | | — | |
| Revenue | 834 | | | 1,030 | | | (51) | | | 1,813 | | | 779 | | | 743 | | | (50) | | | 1,472 | |
| Operating, SG&A | 581 | | | 416 | | | (51) | | | 946 | | | 517 | | | 348 | | | (50) | | | 815 | |
| Adjusted Operating Income | $ | 253 | | | $ | 614 | | | $ | — | | | $ | 867 | | | $ | 262 | | | $ | 395 | | | $ | — | | | $ | 657 | |
| Add: | | | | | | |
| | | | | | | | |
Depreciation and
amortization | 88 | | | 20 | | | — | | | 108 | | | 76 | | | 19 | | | — | | | 95 | |
| | | | | | | | | | | | | | | |
| Restructuring | 4 | | | 2 | | | — | | | 6 | | | 22 | | | 5 | | | — | | | 27 | |
| Charges related to asset abandonment | 15 | | | — | | | — | | | 15 | | | — | | | — | | | — | | | — | |
| | | | | | | | | | | | | | | |
| | | | | | | | | | | | | | | |
| Operating Income | | | | | | | $ | 738 | | | | | | | | | $ | 535 | |
| | | | | | | | | | | | | | | |
| | | | | | | | | | | | | | | | | | | | | | | | | | | | | | | | | | | | | | | | | | | | | | | |
| | | | | | | | | | | | | | | |
| Nine Months Ended September 30, |
| 2024 | | 2023 |
| MA | | MIS | | Eliminations | | Consolidated | | MA | | MIS | | Eliminations | | Consolidated |
| Total external revenue | $ | 2,432 | | | $ | 2,984 | | | $ | — | | | $ | 5,416 | | | $ | 2,260 | | | $ | 2,176 | | | $ | — | | | $ | 4,436 | |
| Intersegment revenue | 10 | | | 144 | | | (154) | | | — | | | 10 | | | 138 | | | (148) | | | — | |
| Revenue | 2,442 | | | 3,128 | | | (154) | | | 5,416 | | | 2,270 | | | 2,314 | | | (148) | | | 4,436 | |
| Operating, SG&A | 1,721 | | | 1,174 | | | (154) | | | 2,741 | | | 1,584 | | | 1,034 | | | (148) | | | 2,470 | |
| Adjusted Operating Income | $ | 721 | | | $ | 1,954 | | | $ | — | | | $ | 2,675 | | | $ | 686 | | | $ | 1,280 | | | $ | — | | | $ | 1,966 | |
| Add: | | | | | | | | | | | | | | | |
| Depreciation and amortization | 260 | | | 58 | | | — | | | 318 | | | 220 | | | 56 | | | — | | | 276 | |
| Restructuring | 7 | | | 6 | | | — | | | 13 | | | 38 | | | 13 | | | — | | | 51 | |
| Charges related to asset abandonment | 30 | | | — | | | — | | | 30 | | | — | | | — | | | — | | | — | |
| | | | | | | | | | | | | | | |
| | | | | | | | | | | | | | | |
| | | | | | | | | | | | | | | |
| Operating Income | | | | | | | $ | 2,314 | | | | | | | | | $ | 1,639 | |
The table below shows cumulative restructuring expense incurred through September 30, 2024 by reportable segment.
| | | | | | | | | | | | | | | | | |
| MA | | MIS | | Total |
| | | | | |
| | | | | |
| | | | | |
| 2022 - 2023 Geolocation Restructuring Program | $ | 115 | | | $ | 98 | | | $ | 213 | |
The 2022 - 2023 Geolocation Restructuring Program is more fully discussed in Note 9.
Consolidated Revenue Information by Geographic Area
| | | | | | | | | | | | | | | | | | | | | | | |
| Three Months Ended September 30, | | Nine Months Ended September 30, |
| 2024 | | 2023 | | 2024 | | 2023 |
| United States | $ | 999 | | | $ | 762 | | | $ | 2,942 | | | $ | 2,300 | |
| Non-U.S.: | | | | | | | |
| EMEA | 546 | | | 465 | | | 1,654 | | | 1,404 | |
| Asia-Pacific | 157 | | | 143 | | | 476 | | | 437 | |
| Americas | 111 | | | 102 | | | 344 | | | 295 | |
| Total Non-U.S. | 814 | | | 710 | | | 2,474 | | | 2,136 | |
| Total | $ | 1,813 | | | $ | 1,472 | | | $ | 5,416 | | | $ | 4,436 | |
Item 2. Management's Discussion and Analysis of Financial Condition and Results of Operations
This discussion and analysis of financial condition and results of operations should be read in conjunction with the Moody’s Corporation consolidated financial statements and notes thereto included elsewhere in this quarterly report on Form 10–Q.
This Management’s Discussion and Analysis of Financial Condition and Results of Operations contains Forward-Looking Statements. See “Forward-Looking Statements” commencing on page 77 for a discussion of uncertainties, risks and other factors associated with these statements. THE COMPANY
In a world shaped by increasingly interconnected risks, Moody's data, insights, and innovative technologies help customers develop a holistic view of their world and unlock opportunities. With a rich history of experience in global markets and a diverse workforce of approximately 16,000 across more than 40 countries, Moody's gives customers the comprehensive perspective needed to act with confidence and thrive. Moody’s has two reportable segments: MA and MIS.
| | | | | | | | |
| | |
| Moody's Analytics | | Moody's Investors Service |
| | |
| MA provides data, intelligence and analytical tools to help business and financial leaders make confident decisions. | Global risk assessment firm that empowers organizations to anticipate, adapt and thrive in a new era of exponential risk. Our data, analytical solutions and insights help decision-makers identify opportunities and manage the risks of doing business with others. | For more than 115 years, MIS has been a leading provider of credit ratings, research, and risk analysis helping businesses, governments, and other entities around the globe. |
| | |
MA is comprised of: i) three cloud-based SaaS businesses serving banking, insurance and KYC workflows (Decision Solutions); ii) a premier fixed income and economic research business (Research & Insights); and iii) a data business powered by the world’s largest database on companies and credit (Data & Information).
MIS publishes credit ratings and provides assessment services on a wide range of debt obligations, programs and facilities, and the entities that issue such obligations in markets worldwide, including various corporate, financial institution and governmental obligations, and structured finance securities.
Sustainability
Moody’s manages its business with the goal of delivering value to all of its stakeholders, including its customers, employees, business partners, local communities and stockholders. As part of this effort, Moody’s advances its commitment to sustainability by considering ESG factors in its operations, value chain, products and services. We use our specialized knowledge and assets to make a positive difference through technology tools, research and analytical services that help other organizations and the investor community better understand the links between sustainability considerations and the global markets. During 2024, Moody's received the following awards and recognition for its sustainability-related efforts:
•Recognized among America’s 100 Most JUST Companies by JUST Capital and CNBC for its commitment to serving its workforce, customers, communities, the environment, and stockholders for its sustainability-related efforts;
•Made CDP's 2023 Climate Change 'A' List, in recognition of Moody's leadership in corporate transparency and actions taken to mitigate climate change;
•Named to the 2023 Dow Jones Sustainability Indices (DJSI) - World and North America, an annual listing of publicly traded companies, recognizing Moody's for its strong corporate sustainability practices; and
•Recognized as a 2023 CDP Supplier Engagement leader for the fourth consecutive year, ranking among the top 4% companies assessed for supplier engagement on climate change.
The Board oversees sustainability matters via the Audit, Governance & Nominating and Compensation & Human Resources Committees, as part of its oversight of management and the Company’s overall strategy. The Audit Committee oversees financial, risk and other disclosures made in the Company’s annual and quarterly reports related to sustainability and has overseen the expanded voluntary disclosures the Company has made in its periodic filings. The Governance & Nominating Committee oversees sustainability matters, including significant issues of corporate social and environmental responsibility, as they pertain to the Company’s business and to long-term value creation for the Company and its stockholders, and makes recommendations to the Board regarding these issues. This has helped to develop the Company’s robust ESG strategy. Finally, the Compensation & Human Resources Committee oversees inclusion of sustainability-related performance goals for determining compensation of all senior executives. This oversight has resulted in the Company more fully integrating sustainability-related performance metrics into the strategic & operational compensation metric of all senior executives. The Board also oversees Moody’s policies for assessing and managing the Company's exposure to risk, including climate-related risks such as business continuity disruption and
reputational or credibility concerns stemming from incorporation of climate-related risks into the credit methodologies and credit ratings of MIS, or analysis of such risks within MA's products and services. The Board maintains its collective knowledge of sustainability topics through ongoing education, such as regular presentations from management on various ESG issues, including climate and the integration of ESG factors into Moody’s products and solutions.
| | | | | | | | | | | | | | | | | | | | | | | |
| Three Pillars of Moody's Sustainability Strategy |
| | | | |
| Our Actions | | Our Influence | | Our Support |
| the decisions and actions we can take related to impacts under our direct control | | the actions that we can demand or request from entities providing us with products and services | | the steps we take to support or enable direct action by other organizations or communities |
Critical Accounting Estimates
Moody’s discussion and analysis of its financial condition and results of operations are based on the Company’s consolidated financial statements, which have been prepared in accordance with GAAP. The preparation of these financial statements requires Moody’s to make estimates and judgments that affect reported amounts of assets and liabilities and related disclosures of contingent assets and liabilities at the dates of the financial statements and revenue and expenses during the reporting periods. These estimates are based on historical experience and on other assumptions that are believed to be reasonable under the circumstances. On an ongoing basis, Moody’s evaluates its estimates, including those related to revenue recognition, contingencies, goodwill and acquired intangible assets, pension and other retirement benefits, investments in non-consolidated affiliates, and income taxes. Actual results may differ from these estimates under different assumptions or conditions. Item 7, MD&A, in the Company’s annual report on Form 10-K for the year ended December 31, 2023, includes descriptions of some of the judgments that Moody’s makes in applying its accounting estimates in these areas. Since the date of the annual report on Form 10-K, there have been no material changes to the Company’s critical accounting estimates disclosures other than the update below relating to the Company's annual assessment of goodwill for impairment.
Goodwill and Other Acquired Intangible Assets
At July 31st of each year, Moody’s evaluates its goodwill for impairment at the reporting unit level, defined as an operating segment (i.e., MA and MIS), or one level below an operating segment (i.e., a component of an operating segment).
The Company has four reporting units: two reporting units within MA consisting of businesses that offer: i) data and data-driven analytical solutions; and ii) risk-management software, workflow and CRE solutions, and two within the Company’s ratings business (one for the ICRA business and one that encompasses all of Moody’s other ratings operations).
The Company evaluates the recoverability of goodwill using a two-step impairment test approach at the reporting unit level. In the first step, the Company assesses various qualitative factors to determine whether the fair value of a reporting unit may be less than its carrying amount. If a determination is made based on the qualitative factors that an impairment does not exist, the Company is not required to perform further testing. If the aforementioned qualitative assessment results in the Company concluding that it is more likely than not that the fair value of a reporting unit may be less than its carrying amount, the fair value of the reporting unit will be quantitatively determined and compared to its carrying value including goodwill. If the fair value of the reporting unit exceeds the carrying value of the net assets assigned to that unit, goodwill is not impaired, and the Company is not required to perform further testing. If the fair value of the reporting unit is less than the carrying value, the Company will record a goodwill impairment charge for the amount by which the carrying value exceeds the reporting unit’s fair value. The Company evaluates its reporting units on an annual basis, or more frequently if there are changes in the reporting structure of the Company due to acquisitions, realignments or if there are indicators of potential impairment. For the reporting units where the Company is consistently able to conclude that no impairment exists using only a qualitative approach, the Company’s accounting policy is to perform the second step of the aforementioned goodwill impairment assessment at least once every three years.
At July 31, 2024, the Company performed quantitative assessments for each of the four reporting units in accordance with the aforementioned policy. These quantitative assessments resulted in fair values that significantly exceeded carrying value for all reporting units. Accordingly, at the date of the filing of this quarterly report on Form 10-Q, the Company does not believe that any of its reporting units are at risk for impairment.
Determining the fair value of a reporting unit involves the use of significant estimates and assumptions, which are more fully described below. In addition, the Company also makes certain judgments and assumptions in allocating shared assets and liabilities to determine the carrying values for each of its reporting units.
Other assets and liabilities, including applicable corporate assets, are allocated to the extent they are related to the operation of respective reporting units.
Methodologies and significant estimates utilized in determining the fair value of reporting units:
The following is a discussion regarding the Company’s methodology for determining the fair value of its reporting units, excluding ICRA, as of July 31, 2024. As ICRA is a publicly traded company in India, the Company was able to observe its fair value based on its market capitalization.
The fair value of each reporting unit, excluding ICRA, was estimated using a discounted cash flow methodology and comparable public company and precedent transaction multiples. The discounted cash flow analysis requires significant estimates, including projections of future operating results and cash flows of each reporting unit that are based on internal budgets and strategic plans, expected long-term growth rates, terminal values, weighted average cost of capital and the effects of external factors and market conditions. Changes in these estimates and assumptions could materially affect the estimated fair value of each reporting unit that could result in an impairment charge to reduce the carrying value of goodwill, which could be material to the Company’s financial position and results of operations. Moody’s allocates newly acquired goodwill to reporting units based on the reporting unit expected to benefit from the acquisition.
The sensitivity analyses on the future cash flows and WACC assumptions are described below. These key assumptions utilized in the discounted cash flow valuation methodology require significant management judgment:
–Future cash flow assumptions - The projections for future cash flows utilized in the models are derived from historical experience and assumptions regarding future growth and profitability of each reporting unit. These projections are consistent with the Company’s operating budget and strategic plan. Cash flows for the five years subsequent to the date of the quantitative goodwill impairment test were utilized in the determination of the fair value of each reporting unit. Beyond five years, a terminal value was determined using a perpetuity growth rate based on inflation and real GDP growth rates. A sensitivity analysis of the revenue growth rates was performed on all reporting units. For each reporting unit analyzed, a 10% reduction in the revenue growth rates used would still result in fair values that significantly exceeded carrying values.
–WACC - The WACC is the rate used to discount each reporting unit’s estimated future cash flows. The WACC is calculated based on the proportionate weighting of the cost of debt and equity. The cost of equity is based on a risk-free interest rate and an equity risk factor, which is derived from public companies similar to the reporting unit and which captures the perceived risks and uncertainties associated with the reporting unit’s cash flows. The cost of debt component is calculated as the weighted average cost associated with all of the Company’s outstanding borrowings as of the date of the impairment test and was immaterial to the computation of the WACC. The cost of debt and equity is weighted based on the debt to market capitalization ratio of publicly traded companies with similarities to the reporting unit being tested. The WACC for all reporting units ranged from 10.0% to 10.5% as of July 31, 2024. Differences in the WACC used between reporting units is primarily due to distinct risks and uncertainties regarding the cash flows of the different reporting units. A sensitivity analysis of the WACC was performed on all reporting units as of July 31, 2024 for each reporting unit. For all reporting units, an increase in the WACC of one percentage point would still result in fair values that significantly exceeded carrying values.
Reportable Segments
The Company is organized into two reportable segments as of September 30, 2024: MA and MIS, which are more fully described in the section entitled “The Company” above and in Note 16 to the consolidated financial statements.
RESULTS OF OPERATIONS
The following footnotes are applicable throughout the discussion of the Company's results of operations:
(1) Refer to the section entitled "Non-GAAP Financial Measures" of this MD&A for the definition and methodology that the Company utilizes to calculate this metric.
(2) Refer to the section entitled "Key Performance Metrics" of this MD&A for the definition and methodology that the Company utilizes to calculate this metric.
Three months ended September 30, 2024 compared with three months ended September 30, 2023
Executive Summary
The following table provides an executive summary of key operating results for the quarter ended September 30, 2024. Following this executive summary is a more detailed discussion of the Company’s operating results as well as a discussion of the operating results of the Company’s reportable segments.
| | | | | | | | | | | | | | |
| Three Months Ended September 30, | |
| Financial measure: | 2024 | 2023 | % Change Favorable
(Unfavorable) | Insight and Key Drivers of Change Compared to Prior Year |
| Moody's total revenue | $ | 1,813 | | $ | 1,472 | | 23 | % | — reflects revenue growth in both segments |
| MA external revenue | $ | 831 | | $ | 776 | | 7 | % | — sustained demand for KYC and insurance offerings; — ongoing strong retention and new sales for ratings data feeds and company data applications; and — continued demand for credit research product offerings |
| MIS external revenue | $ | 982 | | $ | 696 | | 41 | % | reflects issuance growth across all LOBs resulting from: — favorable market conditions for issuers, due to sustained tight credit spreads; and — demand from investors, as yields remain high ahead of potential future interest rate cuts |
| Total operating and SG&A expenses | $ | 946 | | $ | 815 | | (16 | %) | — higher incentive and stock-based compensation aligned with actual/projected financial and operating performance; and — higher salaries and benefits reflecting an increase in headcount and annual salary increases in both segments |
| Depreciation and amortization | $ | 108 | | $ | 95 | | (14 | %) | — higher amortization of internally developed software, primarily related to the development of MA SaaS solutions |
| Restructuring | $ | 6 | | $ | 27 | | 78 | % | — relates to the Company's 2022 - 2023 Geolocation Restructuring Program, more fully discussed in Note 9 to the consolidated financial statements |
| Charges related to asset abandonment | $ | 15 | | $ | — | | NM | — costs related to the Company's decision to outsource the production of certain sustainability content utilized in our product offerings, which is more fully discussed in Note 11 to the consolidated financial statements |
| Total non-operating (expense) income, net | $ | (35) | | $ | (48) | | 27 | % | — an increase in interest income due to higher cash and short-term investment balances and higher interest rates; and — gains recorded on previously held equity investments, more fully discussed in Note 11 to the consolidated financial statements |
| Operating margin | 40.7 | % | 36.3 | % | 440 | BPS | — operating margin and Adjusted Operating Margin(1) expansion reflects strong revenue growth, particularly within MIS, outpacing an increase in operating and SG&A expenses |
Adjusted Operating Margin(1) | 47.8 | % | 44.6 | % | 320 | BPS |
| ETR | 24.0 | % | 19.9 | % | (410 | BPS) | — reflects adjustments resulting from the finalization of income tax returns, coupled with increased earnings from non-U.S. operations subject to higher income tax rates |
| Diluted EPS | $ | 2.93 | | $ | 2.11 | | 39 | % | — increase reflects growth in operating income and Adjusted Operating Income(1) driven mainly by strong MIS revenue growth |
Adjusted Diluted EPS(1) | $ | 3.21 | | $ | 2.43 | | 32 | % |
Moody's Corporation | | | | | | | | | | | | | | | | | |
| Three Months Ended September 30, | | % Change Favorable (Unfavorable) |
| 2024 | | 2023 | |
| Revenue: | | | | | |
| United States | $ | 999 | | | $ | 762 | | | 31 | % |
| Non-U.S.: | | | | | |
| EMEA | 546 | | | 465 | | | 17 | % |
| Asia-Pacific | 157 | | | 143 | | | 10 | % |
| Americas | 111 | | | 102 | | | 9 | % |
| Total Non-U.S. | 814 | | | 710 | | | 15 | % |
| Total | 1,813 | | | 1,472 | | | 23 | % |
| Expenses: | | | | | |
| Operating | 512 | | | 412 | | | (24 | %) |
| SG&A | 434 | | | 403 | | | (8 | %) |
| Depreciation and amortization | 108 | | | 95 | | | (14 | %) |
| Restructuring | 6 | | | 27 | | | 78 | % |
| Charges related to asset abandonment | 15 | | | — | | | NM |
| | | | | |
| | | | | |
| | | | | |
| Total | 1,075 | | | 937 | | | (15 | %) |
| Operating income | $ | 738 | | | $ | 535 | | | 38 | % |
Adjusted Operating Income(1) | $ | 867 | | | $ | 657 | | | 32 | % |
| Interest expense, net | $ | (60) | | | $ | (66) | | | 9 | % |
| Other non-operating income, net | 25 | | | 18 | | | 39 | % |
| Non-operating (expense) income, net | $ | (35) | | | $ | (48) | | | 27 | % |
| | | | | |
| Net income attributable to Moody's | $ | 534 | | | $ | 389 | | | 37 | % |
| Diluted weighted average shares outstanding | 182.5 | | | 184.0 | | | 1 | % |
| Diluted EPS attributable to Moody's common shareholders | $ | 2.93 | | | $ | 2.11 | | | 39 | % |
Adjusted Diluted EPS(1) | $ | 3.21 | | | $ | 2.43 | | | 32 | % |
| Operating margin | 40.7 | % | | 36.3 | % | | |
Adjusted Operating Margin(1) | 47.8 | % | | 44.6 | % | | |
| ETR | 24.0 | % | | 19.9 | % | | |
The table below shows Moody’s global staffing by geographic area:
| | | | | | | | | | | | | | | | | | | | | | | | | |
| | | September 30, | | | | Change |
| | | 2024 | | 2023(a) | | | | % |
| | | | | | | | |
| MA | U.S. | | 2,971 | | | 3,049 | | | | | (3 | %) |
| Non-U.S. | | 5,182 | | | 4,829 | | | | | 7 | % |
| Total | | 8,153 | | | 7,878 | | | | | 3 | % |
| MIS | U.S. | | 1,559 | | | 1,469 | | | | | 6 | % |
| Non-U.S. | | 4,136 | | | 3,822 | | | | | 8 | % |
| Total | | 5,695 | | | 5,291 | | | | | 8 | % |
| | | | | | | | |
|
| MSS | U.S. | | 689 | | | 729 | | | | | (5 | %) |
| Non-U.S. | | 1,239 | | | 1,145 | | | | | 8 | % |
| Total | | 1,928 | | | 1,874 | | | | | 3 | % |
| | | | | | | | |
| Total MCO | U.S. | | 5,219 | | | 5,247 | | | | | (1 | %) |
| Non-U.S. | | 10,557 | | | 9,796 | | | | | 8 | % |
| Total | | 15,776 | | | 15,043 | | | | | 5 | % |
(a) Certain reclassifications and adjustments have been made to 2023 amounts to reflect certain departmental reorganizations and M&A integrations
GLOBAL REVENUE
| | | | | | | | | | | | | | |
| Three months ended September 30, |
2024-----------------------------------------------------------------------------------2023
_______________________________________________________________________________________________________
| | | | | | | | | | | | | | | | | |
| Global revenue ⇑ $341 million | U.S. Revenue ⇑ $237 million | Non-U.S. Revenue ⇑ $104 million |
The increase in global revenue reflects growth in both segments, both in the U.S. and internationally. Refer to the section entitled “Segment Results” of this MD&A for a more comprehensive discussion of the Company’s segment revenue.
| | | | |
| | Third Quarter Operating Expense ⇑ $100 million |
| | | | | | | | |
| Compensation expenses of $394 million increased $93 million, with the most notable drivers reflecting: | | Non-compensation expenses of $118 million increased $7 million, with the most notable driver reflecting: |
| — higher incentive and stock-based compensation aligned with actual/projected financial and operating performance and headcount growth; and | | — an increase in costs to support operating growth, including investments to support technology and innovation |
| — higher salaries and benefits that reflects hiring and salary increases to support continued growth in the business | | |
| | | | |
| | Third Quarter SG&A Expense ⇑ $31 million |
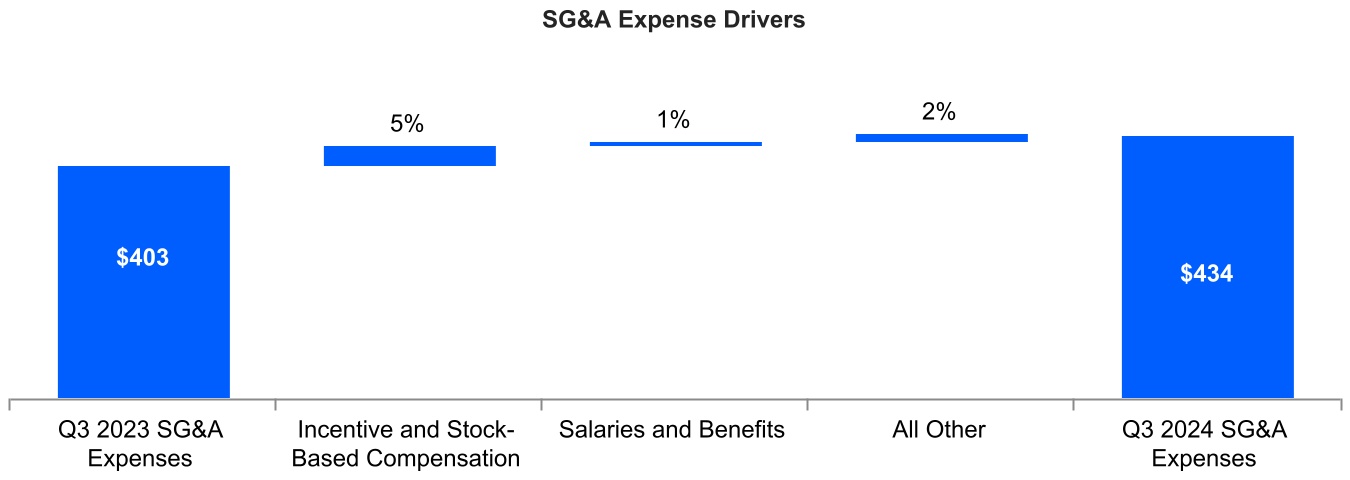
| | | | | |
| Compensation expenses of $274 million increased $23 million, with the most notable driver reflecting: | Non-compensation expenses of $160 million increased $8 million, with the most notable driver reflecting: |
| — higher incentive and stock-based compensation aligned with actual/projected financial and operating performance and headcount growth | — costs to support operating growth |
| | |
| Depreciation and amortization |
The increase is primarily driven by amortization of internally developed software, which relates to the development of MA SaaS solutions.
The amounts in both periods reflect charges and adjustments related to the Company's 2022 - 2023 Geolocation Restructuring Program as more fully discussed in Note 9 to the consolidated financial statements.
| | |
| Charges related to asset abandonment |
Reflects costs related to the Company's decision to outsource the production of certain sustainability content utilized in our product offerings, which is more fully discussed in Note 11 to the consolidated financial statements.
| | | | | | | | | |
| | Operating margin 40.7%, ⇑ 440 BPS | | | Adjusted Operating Margin(1) 47.8%, ⇑ 320 BPS |
Operating margin and Adjusted Operating Margin(1) expansion reflects strong revenue growth, particularly in MIS, outpacing an increase in operating and SG&A expenses.
| | | | | | | | | | |
| | | Interest Expense, net ⇓ $6 million | | | Other non-operating income ⇑ $7 million |
| | | | | | | | | | | | | | |
| The most notable driver of the decrease in expense is due to: | | Increase in income is primarily due to: |
| — higher interest income of $9 million reflecting higher cash and short term investment balances and interest yields | | — gains of $7 million recorded on previously held equity investments, more fully discussed in Note 11 to the consolidated financial statements |
The ETR was higher than the prior year reflecting adjustments resulting from the finalization of income tax returns, coupled with increased earnings from non-U.S. operations subject to higher income tax rates.
| | | | | | | | | | |
| | Diluted EPS ⇑ $0.82 | | | | Adjusted Diluted EPS(1) ⇑ $0.78 |
Both diluted EPS and Adjusted Diluted EPS(1) growth is mostly attributable to higher operating income and Adjusted Operating Income(1), the components of which are more fully described above.
Segment Results
Moody’s Analytics
The table below provides a summary of revenue and operating results, followed by further insight and commentary:
| | | | | | | | | | | | | | | | | |
| Three Months Ended September 30, | | % Change Favorable (Unfavorable) |
| 2024 | | 2023 | |
| Revenue: | | | | | |
| Decision Solutions (DS) | $ | 383 | | | $ | 354 | | | 8 | % |
| Research and Insights (R&I) | 235 | | | 222 | | | 6 | % |
| Data and Information (D&I) | 213 | | | 200 | | | 7 | % |
| Total external revenue | 831 | | | 776 | | | 7 | % |
| Intersegment revenue | 3 | | | 3 | | | — | % |
| Total MA revenue | 834 | | | 779 | | | 7 | % |
| Expenses: | | | | | |
| Operating and SG&A (external) | 533 | | | 470 | | | (13 | %) |
| Operating and SG&A (intersegment) | 48 | | | 47 | | | (2 | %) |
| Total operating and SG&A | 581 | | | 517 | | | (12 | %) |
| | | | | |
| | | | | |
| | | | | |
| | | | | |
| | | | | |
| | | | | |
| | | | | |
| | | | | |
| | | | | |
| | | | | |
| | | | | |
| Adjusted Operating Income | $ | 253 | | | $ | 262 | | | (3 | %) |
| | | | | |
| | | | | |
| Adjusted Operating Margin | 30.3 | % | | 33.6 | % | | |
| | | | | |
| Depreciation and amortization | 88 | | | 76 | | | (16 | %) |
| Restructuring | 4 | | | 22 | | | 82 | % |
| Charges related to asset abandonment | 15 | | | — | | | NM |
MOODY'S ANALYTICS REVENUE
| | |
| Three months ended September 30, |
2024-----------------------------------------------------------------------------------2023
_______________________________________________________________________________________________________
| | | | | | | | |
| MA: Global revenue ⇑ $55 million | U.S. Revenue ⇑ $12 million | Non-U.S. Revenue ⇑ $43 million |
The 7% increase in global MA revenue reflects growth both in the U.S. (4%) and internationally (10%).
–ARR(2) increased 9% reflecting growth across all LOBs.
DECISION SOLUTIONS REVENUE
| | | | | | | | | | | | | | |
| Three months ended September 30, |
2024-----------------------------------------------------------------------------------2023
_______________________________________________________________________________________________________
| | | | | | | | |
| DS: Global revenue ⇑ $29 million | U.S. Revenue ⇑ $3 million | Non-U.S. Revenue ⇑ $26 million |
Global DS revenue for the three months ended September 30, 2024 and 2023 was comprised as follows:
Global DS revenue grew 8% compared to the third quarter of 2023 and reflects increases in the U.S. (2%) and internationally (12%).
The most notable drivers of the growth are as follows:
–strong demand for an expanding suite of KYC solutions, reflecting increased customer and supplier risk data usage, which drove revenue and ARR(2) growth of 19% and 14%, respectively;
–Insurance revenue and ARR(2) grew 7% and 13%, respectively.
–recurring revenue growth of 11% in Insurance was attributable to strong demand resulting in new sales for subscription-based catastrophe and actuarial models.
–Banking revenue and ARR(2) grew 3% and 10%, respectively.
–recurring revenue growth of 10% within banking was supported by strong customer retention coupled with expansion of existing customer relationships to subscription-based banking offerings, which enable customers' lending, risk management and finance workflows;
–the aforementioned recurring revenue growth for Insurance and Banking was partially offset by a decline in transaction revenue of 50% and 17%, respectively, reflecting MA's continued strategic shift to subscription-based solutions.
The aforementioned factors contributed to overall ARR(2) growth for DS of 12%.
RESEARCH AND INSIGHTS REVENUE
| | |
| Three months ended September 30, |
2024-----------------------------------------------------------------------------------2023
___________________________________________________ ________________________________________________
| | | | | | | | |
| R&I: Global revenue ⇑ $13 million | U.S. Revenue ⇑ $4 million | Non-U.S. Revenue ⇑ $9 million |
Global R&I revenue increased 6% compared to the third quarter of 2023 and reflects growth in both the U.S. (3%) and internationally (9%). This increase was driven by sales growth from credit and economic research product offerings, which contributed to R&I ARR(2) growth of 6%.
DATA AND INFORMATION REVENUE
| | |
| Three months ended September 30, |
2024-----------------------------------------------------------------------------------2023
________________________________________________________________________________________________________
| | | | | | | | |
| D&I: Global revenue ⇑ $13 million | U.S. Revenue ⇑ $5 million | Non-U.S. Revenue ⇑ $8 million |
Global D&I revenue increased 7% compared to the third quarter of 2023 and reflects growth in both the U.S. (7%) and internationally (6%), mainly driven by continued strong demand for company data applications and ratings data feeds, which contributed to ARR(2) growth of 8%.
| | | | |
| | MA: Third Quarter Operating and SG&A Expense ⇑ $63 million |
| | | | | | | | | | | | |
| | Compensation expenses of $350 million increased $46 million, with the most notable drivers reflecting: | | | | Non-compensation expenses of $183 million increased $17 million: |
| | — growth in salaries and benefits reflecting higher headcount and annual salary increases to support business growth; and | | | | — the increase is mostly attributable to costs to support operating growth, including investments to support technology, innovation and product development |
| | — an increase in incentive compensation driven by higher headcount coupled with higher stock-based compensation aligned with actual/projected financial and operating performance | | | | |
| | | | |
| | MA: Adjusted Operating Margin 30.3% ⇓ 330 BPS |
Adjusted Operating Margin contraction for MA is due to operating and SG&A expense growth of 13% outpacing the 7% increase in global MA revenue.
| | |
| Depreciation and amortization |
The increase in depreciation and amortization expense primarily reflects higher amortization of internally developed software relating to the development of SaaS-based solutions.
The amounts in both periods reflect charges and adjustments related to the Company's 2022 - 2023 Geolocation Restructuring Program as more fully discussed in Note 9 to the consolidated financial statements.
| | |
| Charges related to asset abandonment |
Reflects costs related to the Company's decision to outsource the production of certain sustainability content utilized in our product offerings, which is more fully discussed in Note 11 to the consolidated financial statements.
Moody’s Investors Service
The table below provides a summary of revenue and operating results, followed by further insight and commentary: | | | | | | | | | | | | | | | | | |
| Three Months Ended September 30, | | % Change Favorable (Unfavorable) |
| 2024 | | 2023 | |
| Revenue: | | | | | |
| Corporate finance (CFG) | $ | 515 | | | $ | 346 | | | 49 | % |
| Structured finance (SFG) | 135 | | | 102 | | | 32 | % |
| Financial institutions (FIG) | 170 | | | 126 | | | 35 | % |
| Public, project and infrastructure finance (PPIF) | 154 | | | 115 | | | 34 | % |
| Total ratings revenue | 974 | | | 689 | | | 41 | % |
| MIS Other | 8 | | | 7 | | | 14 | % |
| Total external revenue | 982 | | | 696 | | | 41 | % |
| Intersegment revenue | 48 | | | 47 | | | 2 | % |
| Total MIS revenue | 1,030 | | | 743 | | | 39 | % |
| Expenses: | | | | | |
| Operating and SG&A (external) | 413 | | | 345 | | | (20 | %) |
| Operating and SG&A (intersegment) | 3 | | | 3 | | | — | % |
| Total operating and SG&A | 416 | | | 348 | | | (20 | %) |
| | | | | |
| | | | | |
| | | | | |
| | | | | |
| | | | | |
| | | | | |
| | | | | |
| | | | | |
| Adjusted Operating Income | $ | 614 | | | $ | 395 | | | 55 | % |
| | | | | |
| | | | | |
| Adjusted Operating Margin | 59.6 | % | | 53.2 | % | | |
| | | | | |
| Depreciation and amortization | 20 | | | 19 | | | (5 | %) |
| Restructuring | 2 | | | 5 | | | 60 | % |
The following chart presents changes in rated issuance volumes compared to the third quarter of 2023. To the extent that changes in rated issuance volumes had a material impact to MIS's revenue compared to the prior year, those impacts are discussed below.
MOODY'S INVESTORS SERVICE REVENUE
| | | | | | | | | | | | | | |
| Three months ended September 30, |
2024-----------------------------------------------------------------------------------2023
_______________________________________________________________________________________________________
| | | | | | | | |
| MIS: Global revenue ⇑ $286 million | U.S. Revenue ⇑ $225 million | Non-U.S. Revenue ⇑ $61 million |
The increase in global MIS revenue reflects strong growth across all ratings LOBs.
CFG REVENUE
| | | | | | | | | | | | | | |
| Three months ended September 30, |
2024-----------------------------------------------------------------------------------2023
_______________________________________________________________________________________________________
| | | | | | | | |
| CFG: Global revenue ⇑ $169 million | U.S. Revenue ⇑ $122 million | Non-U.S. Revenue ⇑ $47 million |
Global CFG revenue for the three months ended September 30, 2024 and 2023 was comprised as follows:
* Other includes: recurring monitoring fees of a rated debt obligation and/or entities that issue such obligations as well as fees from programs such as commercial paper, medium term notes, and ICRA corporate finance revenue.
The increase in CFG revenue of 49% reflects growth in both the U.S. (50%) and internationally (45%).
Transaction revenue increased $166 million compared to the same period in the prior year, with continued momentum in investment-grade and leveraged finance (which includes bank loans and speculative-grade bonds). The growth in these sectors resulted from:
–refinancing activity and new mandates resulting from continued tight corporate credit spreads;
–strong investor demand to capture yields ahead of further potential interest rate cuts; and
–bank loan issuance to fund M&A transactions.
SFG REVENUE
| | | | | | | | | | | | | | |
| Three months ended September 30, |
2024---------------------------------------------------------------------------2023
_______________________________________________________________________________________________________
| | | | | | | | |
| SFG: Global revenue ⇑ $33 million | U.S. Revenue ⇑ $33 million | Non-U.S. Revenue was in line with prior year |
Global SFG revenue for the three months ended September 30, 2024 and 2023 was comprised as follows:
The increase in SFG revenue of 32% reflects growth in the U.S. (51%).
Transaction revenue increased $29 million compared to the third quarter of 2023, mainly attributable to strong issuance activity in U.S. CLOs and CMBS, supported by tighter spreads and strong investor demand.
FIG REVENUE
| | | | | | | | | | | | | | |
| Three months ended September 30, |
2024-----------------------------------------------------------------------------------2023
_______________________________________________________________________________________________________
| | | | | | | | |
| FIG: Global revenue ⇑ $44 million | U.S. Revenue ⇑ $38 million | Non-U.S. Revenue ⇑ $6 million |
Global FIG revenue for the three months ended September 30, 2024 and 2023 was comprised as follows:
The increase in FIG revenue of 35% reflects growth in both the U.S. (73%) and internationally (8%).
Transaction revenue increased $40 million compared to the third quarter of 2023, mainly due to growth in the insurance and banking sectors, which was primarily attributable to a favorable issuance mix from infrequent issuer activity as well as higher overall rated issuance volumes.
PPIF REVENUE
| | | | | | | | | | | | | | |
| Three months ended September 30, |
2024-----------------------------------------------------------------------------------2023
_______________________________________________________________________________________________________
| | | | | | | | |
| PPIF: Global revenue ⇑ $39 million | U.S. Revenue ⇑ $31 million | Non-U.S. Revenue ⇑ 8 million |
Global PPIF revenue for the three months ended September 30, 2024 and 2023 was comprised as follows:
The increase in PPIF revenue of 34% reflects growth in both the U.S. (45%) and internationally (17%).
Transaction revenue increased $39 million compared to the third quarter of 2023 primarily due to:
–increased investment-grade infrastructure finance activity in the U.S. and EMEA; and
–growth in issuance from U.S. Public Finance issuers, reflecting new deals in the state and local government sectors.
| | | | |
| | MIS: Third Quarter Operating and SG&A Expense ⇑ $68 million |
| | | | | | | | | | | | |
| | Compensation expenses of $318 million increased $70 million, with the most notable drivers of the growth reflecting: | | | | Non-compensation expenses of $95 million decreased $2 million: |
| | — an increase in incentive and stock-based compensation driven by actual/projected financial and operating performance and higher headcount; and | | | | — non-compensation expenses were generally in line compared to the prior year |
| | — growth in salaries and benefits reflecting higher headcount and annual salary increases | | | |
| | | | | | |
| | | | MIS: Adjusted Operating Margin 59.6% ⇑ 640 BPS |
The MIS Adjusted Operating Margin expansion primarily reflects the aforementioned 41% increase in revenue.
The amounts in both periods reflect charges and adjustments related to the Company's 2022 - 2023 Geolocation Restructuring Program as more fully discussed in Note 9 to the consolidated financial statements.
Nine months ended September 30, 2024 compared with nine months ended September 30, 2023
Executive Summary
The following table provides an executive summary of key operating results for the nine months ended September 30, 2024. Following this executive summary is a more detailed discussion of the Company’s operating results as well as a discussion of the operating results of the Company’s reportable segments.
| | | | | | | | | | | | | | |
| Nine Months Ended September 30, | |
| Financial measure: | 2024 | 2023 | % Change Favorable (Unfavorable) | Insight and Key Drivers of Change Compared to Prior Year |
| Moody's total revenue | $ | 5,416 | | $ | 4,436 | | 22 | % | — reflects revenue growth in both segments |
| MA external revenue | $ | 2,432 | | $ | 2,260 | | 8 | % | — sustained demand for KYC, insurance offerings and SaaS-based banking solutions; — ongoing strong retention for ratings data feeds and company data applications; and — continued demand for credit and economic research product offerings |
| MIS external revenue | $ | 2,984 | | $ | 2,176 | | 37 | % | reflects issuance growth across all LOBs resulting from: — favorable market conditions for issuers, due to sustained tight credit spreads and opportunistic issuance ahead of expected interest rate reductions and potential volatility later in the year; and — demand from investors, as yields remain high ahead of potential future interest rate cuts |
| Total operating and SG&A expenses | $ | 2,741 | | $ | 2,470 | | (11 | %) | — higher incentive and stock-based compensation aligned with actual/projected financial and operating performance; and — higher salaries and benefits reflecting an increase in headcount and annual salary increases in both segments |
| Depreciation and amortization | $ | 318 | | $ | 276 | | (15 | %) | — higher amortization of internally developed software, primarily related to the development of MA SaaS solutions |
| Restructuring | $ | 13 | | $ | 51 | | 75 | % | — relates to the Company's 2022 - 2023 Geolocation Restructuring Program, more fully discussed in Note 9 to the consolidated financial statements |
| Charges related to asset abandonment | $ | 30 | | $ | — | | NM | — costs related to the Company's decision to outsource the production of certain sustainability content utilized in our product offerings, which is more fully discussed in Note 11 to the consolidated financial statements |
| Total non-operating (expense) income, net | $ | (140) | | $ | (154) | | 9 | % | — a net decrease of $22 million in foreign exchange losses recorded during the year mainly attributable to an immaterial out-of-period adjustment relating to the 2022 fiscal year recorded in the first quarter of 2023; and — an increase in interest income of $29 million due to higher cash and short-term investment balances and higher interest rates; partially offset by: — an increase in tax-related interest expense of $22 million mainly due to the favorable resolution of tax matters in the prior year |
| Operating margin | 42.7 | % | 36.9 | % | 580 BPS | — operating margin and Adjusted Operating Margin(1) expansion reflects strong revenue growth, particularly in MIS, outpacing operating and SG&A expense growth |
Adjusted Operating Margin(1) | 49.4 | % | 44.3 | % | 510 BPS |
| ETR | 23.5 | % | 14.6 | % | (890 BPS) | — higher ETR primarily reflects tax benefits recognized in the first quarter of 2023, which resulted from the resolutions of UTPs in various U.S. and non-U.S. tax jurisdictions |
| Diluted EPS | $ | 9.09 | | $ | 6.88 | | 32 | % | — increase reflects growth in operating income/Adjusted Operating Income(1) driven mainly by increases in MIS revenue, partially offset by: — a $0.75 per share benefit in the prior year resulting from the resolutions of tax matters in the first quarter of 2023 |
Adjusted Diluted EPS(1) | $ | 9.85 | | $ | 7.71 | | 28 | % |
Moody’s Corporation | | | | | | | | | | | | | | | | | |
| Nine Months Ended September 30, | | % Change Favorable
(Unfavorable) |
| 2024 | | 2023 | |
| Revenue: | | | | | |
| United States | $ | 2,942 | | | $ | 2,300 | | | 28 | % |
| Non-U.S.: | | | | | |
| EMEA | 1,654 | | | 1,404 | | | 18 | % |
| Asia-Pacific | 476 | | | 437 | | | 9 | % |
| Americas | 344 | | | 295 | | | 17 | % |
| Total Non-U.S. | 2,474 | | | 2,136 | | | 16 | % |
| Total | 5,416 | | | 4,436 | | | 22 | % |
| Expenses: | | | | | |
| Operating | 1,448 | | | 1,266 | | | (14 | %) |
| SG&A | 1,293 | | | 1,204 | | | (7 | %) |
| Depreciation and amortization | 318 | | | 276 | | | (15 | %) |
| Restructuring | 13 | | | 51 | | | 75 | % |
| Charges related to asset abandonment | 30 | | | — | | | NM |
| | | | | |
| | | | | |
| Total | 3,102 | | | 2,797 | | | (11 | %) |
| Operating income | 2,314 | | | 1,639 | | | 41 | % |
Adjusted Operating Income (1) | 2,675 | | | 1,966 | | | 36 | % |
| Interest expense, net | (185) | | | (185) | | | — | % |
| Other non-operating income, net | 45 | | | 31 | | | 45 | % |
| Non-operating (expense) income, net | (140) | | | (154) | | | 9 | % |
| | | | | |
| Net income attributable to Moody’s | $ | 1,663 | | | $ | 1,267 | | | 31 | % |
| Diluted weighted average shares outstanding | 183.0 | | | 184.1 | | | 1 | % |
| Diluted EPS attributable to Moody’s common shareholders | $ | 9.09 | | | $ | 6.88 | | | 32 | % |
Adjusted Diluted EPS (1) | $ | 9.85 | | | $ | 7.71 | | | 28 | % |
| Operating margin | 42.7 | % | | 36.9 | % | | |
Adjusted Operating Margin (1) | 49.4 | % | | 44.3 | % | | |
| Effective tax rate | 23.5 | % | | 14.6 | % | | |
GLOBAL REVENUE
| | |
| Nine months ended September 30, |
2024-----------------------------------------------------------------------------------2023
_______________________________________________________________________________________________________
| | | | | | | | | | | | | | | | | |
| Global revenue ⇑ $980 million | U.S. Revenue ⇑ $642 million | Non-U.S. Revenue ⇑ $338 million |
Growth in global revenue reflected increases in both MA and MIS, both in the U.S. and internationally. Refer to the section entitled “Segment Results” of this MD&A for a more comprehensive discussion of the Company’s segment revenue.
| | | | |
| | YTD Operating Expense ⇑ $182 million |
| | | | | | | | |
| Compensation expenses of $1,086 million increased $166 million, with the most notable drivers reflecting: | | Non-compensation expenses of $362 million increased $16 million, with the most notable driver reflecting: |
| — higher salaries and benefits reflecting hiring and salary increases to support continued growth in the business; and | | — costs to support operating growth, including investments to support technology, innovation and product development |
| — higher incentive and stock-based compensation aligned with actual/projected financial and operating performance and headcount growth | | |
| | | | |
| | YTD SG&A Expense ⇑ $89 million |
| | | | | |
| Compensation expenses of $804 million increased $51 million, with the most notable drivers reflecting: | Non-compensation expenses of $489 million increased $38 million, with the most notable drivers reflecting: |
| — higher incentive and stock-based compensation aligned with headcount growth and actual/projected financial and operating performance; and | — a charge in 2024 relating to a regulatory investigation, which is more fully discussed in Note 15 to the consolidated financial statements; and |
| — higher salaries and benefits reflecting an increase in headcount and annual salary increases | — increases in costs to support operating growth |
| | |
| Depreciation and amortization |
The increase in depreciation and amortization expense is driven by amortization of internally developed software, which is primarily related to the development of MA SaaS solutions.
The amounts in both periods reflect charges and adjustments related to the Company's 2022 - 2023 Geolocation Restructuring Program as more fully discussed in Note 9 to the consolidated financial statements.
| | |
| Charges related to asset abandonment |
Reflects costs related to the Company's decision to outsource the production of certain sustainability content utilized in our product offerings, which is more fully discussed in Note 11 to the consolidated financial statements.
| | | | | | | | | |
| | Operating margin 42.7%, ⇑ 580 BPS | | | Adjusted Operating Margin(1) 49.4%, ⇑ 510 BPS |
Increases in both Operating margin and Adjusted Operating Margin(1) is due to strong revenue growth, particularly within MIS, partially offset by an increase in operating and SG&A expenses.
| | | | | | | | | |
| | Interest Expense, net in line with prior year | | | Other non-operating income ⇑ $14 million |
| | | | | | | | |
| Interest expense was in line with prior year with the following offsetting factors: | | Increase in income is primarily due to: |
— higher interest income of $29 million reflecting higher cash and short-term investment balances and interest yields; offset by | | — a $22 million net decrease in foreign currency losses mainly attributable to an immaterial out-of-period adjustment relating to the 2022 fiscal year recorded in the first quarter of 2023; and |
| — an increase of $22 million in tax-related interest mainly reflecting the favorable resolution of tax matters in the prior year | |
| — gains of $7 million recorded on previously held equity investments, more fully discussed in Note 11 to the consolidated financial statements; partially offset by |
| | — a benefit of $9 million in the prior year related to the favorable resolution of various tax matters |
The increase in the ETR primarily reflects $113 million in tax benefits recognized in the first quarter of 2023, which resulted from the resolutions of UTPs in various U.S. and non-U.S. tax jurisdictions.
| | | | | | | | | |
| | Diluted EPS ⇑ $2.21 | | | Adjusted Diluted EPS(1) ⇑ $2.14 |
Both diluted EPS and Adjusted Diluted EPS(1) growth is mostly attributable to higher operating income and Adjusted Operating Income(1), the components of which are more fully described above. This was partially offset by a $0.75 per share benefit in the prior year related to the resolution of tax matters in the first quarter of 2023.
Moody’s Analytics
The table below provides a summary of revenue and operating results, followed by further insight and commentary:
| | | | | | | | | | | | | | | | | |
| Nine Months Ended September 30, | | % Change Favorable
(Unfavorable) |
| 2024 | | 2023 | |
| Revenue: | | | | | |
| Decision Solutions (DS) | $ | 1,114 | | | $ | 1,022 | | | 9 | % |
| Research and Insights (R&I) | 683 | | | 654 | | | 4 | % |
| Data and Information (D&I) | 635 | | | 584 | | | 9 | % |
| Total external revenue | 2,432 | | | 2,260 | | | 8 | % |
| Intersegment revenue | 10 | | | 10 | | | — | % |
| Total MA Revenue | 2,442 | | | 2,270 | | | 8 | % |
| Expenses: | | | | | |
| Operating and SG&A (external) | 1,577 | | | 1,446 | | | (9 | %) |
| Operating and SG&A (intersegment) | 144 | | | 138 | | | (4 | %) |
| | | | | |
| | | | | |
| Total operating and SG&A expense | 1,721 | | | 1,584 | | | (9 | %) |
| | | | | |
| | | | | |
| Adjusted Operating Income | $ | 721 | | | $ | 686 | | | 5 | % |
| | | | | |
| Adjusted Operating Margin | 29.5 | % | | 30.2 | % | | |
| | | | | |
| Depreciation and amortization | 260 | | | 220 | | | (18 | %) |
| Restructuring | 7 | | | 38 | | | 82 | % |
| Charges related to asset abandonment | 30 | | | — | | | NM |
MOODY'S ANALYTICS REVENUE
| | |
| Nine months ended September 30, |
2024-----------------------------------------------------------------------------------2023
_______________________________________________________________________________________________________
| | | | | | | | |
| MA: Global revenue ⇑ $172 million | U.S. Revenue ⇑ $50 million | Non-U.S. Revenue ⇑ $122 million |
The 8% increase in global MA revenue reflects growth both in the U.S. (5%) and internationally (9%) across all LOBs.
–ARR(2) grew 9% reflecting increases across all LOBs.
.
DECISION SOLUTIONS REVENUE
| | |
| Nine months ended September 30, |
2024-----------------------------------------------------------------------------------2023
_______________________________________________________________________________________________________
| | | | | | | | |
| DS: Global revenue ⇑ $92 million | U.S. Revenue ⇑ $14 million | Non-U.S. Revenue ⇑ $78 million |
Global DS revenue for the nine months ended September 30, 2024 and 2023 was comprised as follows:
Global DS revenue grew 9% compared to the first nine months of 2023 and reflects increases in both the U.S. (3%) and internationally (13%).
The most notable drivers of the growth are as follows:
–strong demand for KYC and compliance solutions reflecting increased customer and supplier risk data usage, which drove both revenue and ARR(2) growth of 18% and 14%, respectively;
–Insurance revenue and ARR(2) grew 9% and 13%, respectively.
–recurring revenue growth of 12% in Insurance was attributable to improved customer retention and strong demand resulting in new sales for subscription-based revenue for catastrophe and actuarial modeling tools.
–Banking revenue and ARR(2) grew 4% and 10%, respectively.
–recurring revenue growth of 9% within Banking supported by strong customer retention coupled with expansion of existing customer relationships to subscription-based banking offerings, which enable customers' lending, risk management and finance workflows;
–the aforementioned recurring revenue growth for Insurance and Banking was partially offset by a decline in transaction revenue of 36% and 12%, respectively, reflecting MA's continued strategic shift to subscription-based solutions.
The aforementioned factors also contributed to overall ARR(2) growth for DS of 12%.
RESEARCH AND INSIGHTS REVENUE
| | |
| Nine months ended September 30, |
2024-----------------------------------------------------------------------------------2023
_______________________________________________________________________________________________________
| | | | | | | | |
| R&I: Global revenue ⇑ $29 million | U.S. Revenue ⇑ $13 million | Non-U.S. Revenue ⇑ $16 million |
Global R&I revenue increased 4% compared to the first nine months of 2023 and reflects growth in both the U.S. (4%) and internationally (5%). This increase was attributable to sales growth for credit and economic research product offerings, which contributed to ARR(2) growth of 6%.
DATA AND INFORMATION REVENUE
| | |
| Nine months ended September 30, |
2024-----------------------------------------------------------------------------------2023
_______________________________________________________________________________________________________
| | | | | | | | |
| D&I: Global revenue ⇑ $51 million | U.S. Revenue ⇑ $23 million | Non-U.S. Revenue ⇑ $28 million |
Global D&I revenue increased 9% compared to the first nine months of 2023 and reflects growth in both the U.S. (11%) and internationally (7%), mainly driven by continued strong demand for company data applications and ratings data feeds, which contributed to ARR(2) growth of 8% for D&I.
| | | | |
| | MA: YTD Operating and SG&A Expense ⇑ $131 million |
| | | | | | | | | | | | |
| | Compensation expenses of $1,023 million increased $102 million: | | | | Non-compensation expenses of $554 million increased $29 million: |
| | — the growth in salaries and benefits reflects higher headcount and annual salary increases to support business growth; and | | | | — the modest increase is mostly attributable to costs to support operating growth, including investments to support technology, innovation and product development |
| | — the increase in incentive and stock-based compensation is driven by higher headcount and actual/projected financial and operating performance | | | |
| | | | |
| | MA: Adjusted Operating Margin 29.5% ⇓ 70 BPS |
The modest decline in Adjusted Operating Margin is primarily due to operating and SG&A expense growth of 9% slightly outpacing the 8% increase in global MA revenue.
| | |
| Depreciation and amortization |
The increase in depreciation and amortization expense primarily reflects higher amortization of internally developed software relating to the development of SaaS-based solutions.The amounts in both periods reflect charges and adjustments related to the Company's 2022 - 2023 Geolocation Restructuring Program as more fully discussed in Note 9 to the consolidated financial statements.
| | |
| Charges related to asset abandonment |
Reflects costs related to the Company's decision to outsource the production of certain sustainability content utilized in our product offerings, which is more fully discussed in Note 11 to the consolidated financial statements.
Moody’s Investors Service
The table below provides a summary of revenue and operating results, followed by further insight and commentary: | | | | | | | | | | | | | | | | | |
| Nine Months Ended September 30, | | % Change Favorable
(Unfavorable) |
| 2024 | | 2023 | |
| Revenue: | | | | | |
| Corporate finance (CFG) | $ | 1,569 | | | $ | 1,067 | | | 47 | % |
| Structured finance (SFG) | 380 | | | 303 | | | 25 | % |
| Financial institutions (FIG) | 560 | | | 413 | | | 36 | % |
| Public, project and infrastructure finance (PPIF) | 449 | | | 371 | | | 21 | % |
| Total ratings revenue | 2,958 | | | 2,154 | | | 37 | % |
| MIS Other | 26 | | | 22 | | | 18 | % |
| Total external revenue | 2,984 | | | 2,176 | | | 37 | % |
| Intersegment royalty | 144 | | | 138 | | | 4 | % |
| Total | 3,128 | | | 2,314 | | | 35 | % |
| Expenses: | | | | | |
| Operating and SG&A (external) | 1,164 | | | 1,024 | | | (14 | %) |
| Operating and SG&A (intersegment) | 10 | | | 10 | | | — | % |
| Total operating and SG&A expense | 1,174 | | | 1,034 | | | (14 | %) |
| | | | | |
| Adjusted Operating Income | $ | 1,954 | | | $ | 1,280 | | | 53 | % |
| | | | | |
| Adjusted Operating Margin | 62.5 | % | | 55.3 | % | | |
| | | | | |
| Depreciation and amortization | 58 | | | 56 | | | (4 | %) |
| Restructuring | 6 | | | 13 | | | 54 | % |
The following chart presents changes in rated issuance volumes compared to the first nine months of 2023. To the extent that changes in rated issuance volumes had a material impact to MIS's revenue compared to the prior year, those impacts are discussed below.
MOODY'S INVESTORS SERVICE REVENUE
| | |
| Nine months ended September 30, |
2024-----------------------------------------------------------------------------------2023
_______________________________________________________________________________________________________
| | | | | | | | |
| MIS: Global revenue ⇑ $808 million | U.S. Revenue ⇑ $592 million | Non-U.S. Revenue ⇑ $216 million |
The increase in global MIS revenue reflects strong growth across all LOBs.
CFG REVENUE
| | |
| Nine months ended September 30, |
2024-----------------------------------------------------------------------------------2023
_______________________________________________________________________________________________________
| | | | | | | | |
| CFG: Global revenue ⇑ $502 million | U.S. Revenue ⇑ 351 million | Non-U.S. Revenue ⇑ $151 million |
Global CFG revenue for the nine months ended September 30, 2024 and 2023 was comprised as follows:
* Other includes: recurring monitoring fees of a rated debt obligation and/or entities that issue such obligations as well as fees from programs such as commercial paper, medium term notes, and ICRA corporate finance revenue.
The increase in CFG revenue of 47% reflects growth in both the U.S (48%) and internationally (44%).
Transaction revenue increased $487 million compared to the same period in the prior year, with continued momentum in leveraged finance (which includes bank loans and speculative-grade bonds) and investment-grade. The growth in these sectors resulted from:
–bank loan issuance to fund M&A transactions;
–refinancing activity and new mandates resulting from continued tight corporate credit spreads; and
–strong investor demand to capture yields ahead of further potential interest rate cuts.
SFG REVENUE
| | |
| Nine months ended September 30, |
2024-----------------------------------------------------------------------------------2023
_______________________________________________________________________________________________________
| | | | | | | | |
| SFG: Global revenue ⇑ $77 million | U.S. Revenue ⇑ $80 million | Non-U.S. Revenue ⇓ $3 million |
Global SFG revenue for the nine months ended September 30, 2024 and 2023 was comprised as follows:
The increase in SFG revenue of 25% reflects growth in the U.S. (43%), partially offset by modest declines in international revenue (3%).
Transaction revenue increased $71 million compared to the first nine months of 2023, mainly attributable to:
–higher CLO issuance, with new deals supported by increased bank loan activity, coupled with refinancing activity; and
–increased issuance activity from the CMBS and ABS asset classes, reflecting tightening credit spreads and strong investor demand, including from first time issuers.
FIG REVENUE
| | |
| Nine months ended September 30, |
2024-----------------------------------------------------------------------------------2023
_______________________________________________________________________________________________________
| | | | | | | | |
| FIG: Global revenue ⇑ $147 million | U.S. Revenue ⇑ $104 million | Non-U.S. Revenue ⇑ $43 million |
Global FIG revenue for the nine months ended September 30, 2024 and 2023 was comprised as follows:
The increase in FIG revenue of 36% reflects growth in both the U.S. (55%) and internationally (19%).
Transaction revenue increased $134 million compared to the same period in the prior year, primarily driven by growth in the insurance and banking sectors, which was mainly attributable to a favorable issuance mix from infrequent issuer activity.
PPIF REVENUE
| | |
| Nine months ended September 30, |
2024-----------------------------------------------------------------------------------2023
______________________________________________________________________________________________________
| | | | | | | | |
| PPIF: Global revenue ⇑ $78 million | U.S. Revenue ⇑ $56 million | Non-U.S. Revenue ⇑ $22 million |
Global PPIF revenue for the nine months ended September 30, 2024 and 2023 was comprised as follows:
The 21% increase in PPIF revenue reflects increases in both the U.S. (25%) and internationally (15%).
Transaction revenue increased $75 million compared to the same period in the prior year, primarily due to:
–higher issuance from U.S. Public Finance issuers, reflecting increased activity in the state and local government, healthcare and higher education sectors;
–increased U.S. and international investment-grade infrastructure finance activity; and
–higher U.S. Project Finance activity supported by continued market improvement.
| | | | |
| | MIS: YTD Operating and SG&A Expense ⇑ $140 million |
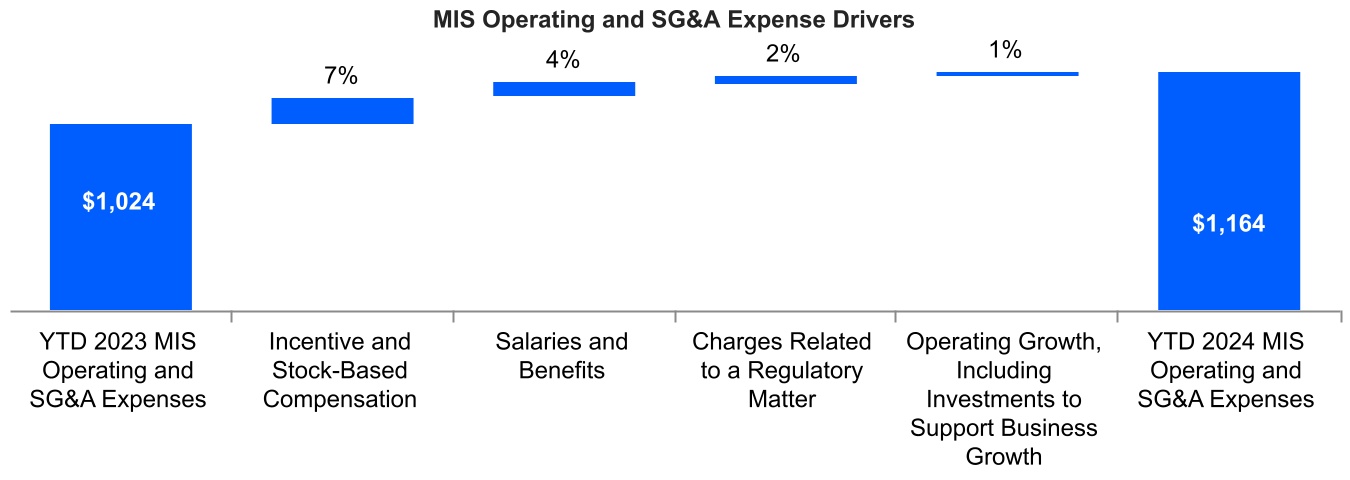
| | | | | | | | | | | | |
| | Compensation expenses of $867 million increased $115 million with the most notable drivers of the growth reflecting: | | | | Non-compensation expenses of $297 million increased $25 million with the most notable drivers of the growth reflecting: |
| | — an increase in incentive and stock-based compensation driven by higher headcount and actual/projected financial and operating performance; and | | | | — a charge relating to a regulatory investigation, which is more fully discussed in Note 15 to the consolidated financial statements; and |
| | — growth in salaries and benefits reflecting higher headcount and annual salary increases | | | | — an increase in costs to support operating growth, including investments to support technology and innovation |
| | | | |
| | Adjusted Operating Margin of 62.5% ⇑ 720 BPS |
The MIS Adjusted Operating Margin expansion primarily reflected the aforementioned 37% increase in revenue, partially offset by growth of 14% in operating and SG&A expenses.
The amounts in both periods reflect charges and adjustments related to the Company's 2022 - 2023 Geolocation Restructuring Program as more fully discussed in Note 9 to the consolidated financial statements.
LIQUIDITY AND CAPITAL RESOURCES
Moody's remains committed to using its cash flow to create value for shareholders by both investing in the Company's employees and growing the business through targeted organic initiatives and inorganic acquisitions aligned with strategic priorities. Additional excess capital is returned to the Company’s shareholders via a combination of dividends and share repurchases.
Cash Flow
The Company is currently financing its operations, capital expenditures and share repurchases from operating and financing cash flows.
The following is a summary of the changes in the Company’s cash flows followed by a brief discussion of these changes:
| | | | | | | | | | | | | | | | | |
| Nine Months Ended September 30, | | $ Change
Favorable (Unfavorable) |
| 2024 | | 2023 | |
| Net cash provided by operating activities | $ | 2,164 | | | $ | 1,674 | | | $ | 490 | |
| Net cash used in investing activities | $ | (875) | | | $ | (193) | | | $ | (682) | |
| Net cash used in financing activities | $ | (812) | | | $ | (1,231) | | | $ | 419 | |
Free Cash Flow (1) | $ | 1,921 | | | $ | 1,476 | | | $ | 445 | |
(1) Free Cash Flow is a non-GAAP measure and is defined by the Company as net cash provided by operating activities minus cash paid for capital expenditures. Refer to “Non-GAAP Financial Measures” of this MD&A for further information on this financial measure.
Net cash provided by operating activities
Net cash flows from operating activities in the nine months ended September 30, 2024 increased by $490 million compared to the same period in 2023, with the most notable drivers reflecting:
–growth in operating income of $675 million;
partially offset by:
–$178 million in higher income tax payments in the current year.
Net cash used in investing activities
The $682 million increase in cash used in investing activities in the nine months ended September 30, 2024 compared to the same period in 2023 was primarily due to:
–higher net purchases of investments in 2024 of $528 million;
–higher cash paid for acquisitions, net of cash acquired, of $107 million primarily due to the acquisitions of GCR and Praedicat in the third quarter of 2024, coupled with certain immaterial acquisitions completed in the first quarter of 2024; and
–higher cash paid for capital additions of $45 million compared to the prior year reflecting both costs to support investments in company-wide technology infrastructure coupled with costs related to the development of SaaS-based solutions in MA.
Net cash used in financing activities
The $419 million decrease in cash used in financing activities in the nine months ended September 30, 2024 compared to the same period in the prior year was primarily attributed to:
–a $500 million repayment of notes payable in 2023; and
–a $496 million issuance of notes in the third quarter of 2024;
partially offset by:
– higher cash paid for treasury share repurchases in 2024 of $534 million compared to the prior year.
Cash and cash equivalents and short-term investments
The Company’s aggregate cash and cash equivalents and short-term investments of $3.2 billion at September 30, 2024 included approximately $2.1 billion located outside of the U.S. Approximately 31% of the Company’s aggregate cash and cash equivalents and short-term investments is denominated in euros and GBP. The Company manages both its U.S. and non-U.S. cash flow to maintain sufficient liquidity in all regions to effectively meet its operating needs.
As a result of the Tax Act, all previously net undistributed foreign earnings have now been subject to U.S. tax. The Company continues to evaluate which entities it will indefinitely reinvest earnings outside the U.S. The Company has provided deferred taxes for those entities whose earnings are not considered indefinitely reinvested. Accordingly, the Company continues to repatriate a portion of its non-U.S. cash in these subsidiaries and will continue to repatriate certain of its offshore cash in a manner that addresses compliance with local statutory requirements, sufficient offshore working capital and any other factors that may be relevant in certain jurisdictions. Notwithstanding the Tax Act, which generally eliminated federal income tax on future cash repatriation to the U.S., cash repatriation may be subject to state and local taxes or withholding or similar taxes.
Material Cash Requirements
The Company's material cash requirements consist of the following contractual and other obligations:
Financing Arrangements
Indebtedness
At September 30, 2024, Moody’s had $7.6 billion of outstanding debt and approximately $1 billion of additional capacity available under the Company’s CP Program, which is backstopped by the $1.25 billion 2024 Facility.
The repayment schedule for the Company’s borrowings outstanding at September 30, 2024 is as follows:
For additional information on the Company's outstanding debt, refer to Note 13 to the consolidated financial statements.
Future interest payments and fees associated with the Company's debt and credit facility are expected to be $4.8 billion, of which approximately $300 million is expected to be paid in each of the next five years, and the remaining amount expected to be paid thereafter.
Management may consider pursuing additional long-term financing when it is appropriate in light of cash requirements for operations, share repurchases and other strategic opportunities, which could result in higher financing costs.
Purchase Obligations
Purchase obligations generally include multi-year agreements with vendors to purchase goods or services and mainly include data center/cloud hosting fees and fees for information technology licensing and maintenance. As of September 30, 2024, these purchase obligations totaled $683 million, of which approximately 40% is expected to be paid in the next twelve months and another approximate 45% expected to be paid over the next two subsequent years, with the remainder to be paid thereafter.
Leases
The Company has remaining payments relating to its operating leases of $376 million at September 30, 2024, primarily related to real estate leases, of which $118 million in payments are expected over the next twelve months. For more information on the expected cash flows relating to the Company's operating leases, refer to Note 14 to the consolidated financial statements.
Pension and Other Retirement Plan Obligations
The Company does not anticipate making significant contributions to its funded pension plan in the next twelve months. This plan is overfunded at September 30, 2024, and accordingly holds sufficient investments to fund future benefit obligations. Payments for the Company's unfunded plans are not expected to be material in either the short or long-term.
Dividends and share repurchases
On October 21, 2024, the Board approved the declaration of a quarterly dividend of $0.85 per share for Moody’s common stock, payable December 13, 2024 to shareholders of record at the close of business on November 22, 2024. The continued payment of dividends at this rate, or at all, is subject to the discretion of the Board.
On February 5, 2024, the Board approved $1 billion in share repurchase authority. At September 30, 2024, the Company had approximately $547 million of remaining authority under this authorization. On October 15, 2024, the Board authorized an additional $1.5 billion in share repurchase authority. There is no established expiration date for the remaining authorizations.
Sources of Funding to Satisfy Material Cash Requirements
The Company believes that it has the financial resources needed to meet its cash requirements and expects to have positive operating cash flow over the next twelve months. Cash requirements for periods beyond the next twelve months will depend, among other things, on the Company’s profitability and its ability to manage working capital requirements. The Company may also borrow from various sources as described above.
NON-GAAP FINANCIAL MEASURES
In addition to its reported results, Moody’s has included in this MD&A certain adjusted results that the SEC defines as “Non-GAAP financial measures.” Management believes that such adjusted financial measures, when read in conjunction with the Company’s reported results, can provide useful supplemental information for investors analyzing period-to-period comparisons of the Company’s performance, facilitate comparisons to competitors’ operating results and can provide greater transparency to investors of supplemental information used by management in its financial and operational decision-making. These adjusted measures, as defined by the Company, are not necessarily comparable to similarly defined measures of other companies. Furthermore, these adjusted measures should not be viewed in isolation or used as a substitute for other GAAP measures in assessing the operating performance or cash flows of the Company. Below are brief descriptions of the Company’s adjusted financial measures accompanied by a reconciliation of the adjusted measure to its most directly comparable GAAP measure:
Adjusted Operating Income and Adjusted Operating Margin:
The Company presents Adjusted Operating Income and Adjusted Operating Margin because management deems these metrics to be useful measures to provide additional perspective on Moody's operating performance. Adjusted Operating Income excludes the impact of: i) depreciation and amortization; ii) restructuring charges/adjustments; and iii) charges related to an asset abandonment. Depreciation and amortization are excluded because companies utilize productive assets of different estimated useful lives and use different methods of acquiring and depreciating productive assets. Restructuring charges/adjustments and charges related to asset abandonment are excluded as the frequency and magnitude of these charges may vary widely across periods and companies.
Management believes that the exclusion of the aforementioned items, as detailed in the reconciliation below, allows for an additional perspective on the Company’s operating results from period to period and across companies. The Company defines Adjusted Operating Margin as Adjusted Operating Income divided by revenue.
| | | | | | | | | | | | | | | | | | | | | | | |
| Three Months Ended September 30, | | Nine Months Ended September 30, |
| 2024 | | 2023 | | 2024 | | 2023 |
| Operating income | $ | 738 | | | $ | 535 | | | $ | 2,314 | | | $ | 1,639 | |
| Adjustments: | | | | | | | |
| Depreciation and amortization | 108 | | | 95 | | | 318 | | | 276 | |
| Restructuring | 6 | | | 27 | | | 13 | | | 51 | |
| Charges related to asset abandonment | 15 | | | — | | | 30 | | | — | |
| Adjusted Operating Income | $ | 867 | | | $ | 657 | | | $ | 2,675 | | | $ | 1,966 | |
| Operating margin | 40.7 | % | | 36.3 | % | | 42.7 | % | | 36.9 | % |
| Adjusted Operating Margin | 47.8 | % | | 44.6 | % | | 49.4 | % | | 44.3 | % |
Adjusted Net Income and Adjusted Diluted EPS attributable to Moody's common shareholders:
The Company presents Adjusted Net Income and Adjusted Diluted EPS because management deems these metrics to be useful measures to provide additional perspective on Moody’s operating performance. Adjusted Net Income and Adjusted Diluted EPS exclude the impact of: i) amortization of acquired intangible assets; ii) restructuring charges/adjustments; iii) charges related to asset abandonment; and iv) gains on previously held equity method investments.
The Company excludes the impact of amortization of acquired intangible assets as companies utilize intangible assets with different estimated useful lives and have different methods of acquiring and amortizing intangible assets. These intangible assets were recorded as part of acquisition accounting and contribute to revenue generation. The amortization of intangible assets related to acquisitions will recur in future periods until such intangible assets have been fully amortized. Furthermore, the timing and magnitude of business combination transactions are not predictable and the purchase price allocated to amortizable intangible assets and the related amortization period are unique to each acquisition and can vary significantly from period to period and across companies. Restructuring charges/adjustments, charges related to asset abandonment, and gains on previously held equity method investments are excluded as the frequency and magnitude of these items may vary widely across periods and companies.
The Company excludes the aforementioned items to provide additional perspective when comparing net income and diluted EPS from period to period and across companies as the frequency and magnitude of similar transactions may vary widely across periods.
| | | | | | | | | | | | | | | | | | | | | | | | | | | | | | | | | | | |
| Three Months Ended September 30, | | Nine Months Ended September 30, |
| Amounts in millions | 2024 | | 2023 | | 2024 | | 2023 |
| Net Income attributable to Moody's common shareholders | | $ | 534 | | | | $ | 389 | | | | $ | 1,663 | | | | $ | 1,267 | |
| | | | | | | | | | | |
| | | | | | | | | | | |
| | | | | | | | | | | |
| Pre-tax Acquisition-Related Intangible Amortization Expenses | $ | 51 | | | | $ | 49 | | | | $ | 148 | | | | $ | 150 | | |
| Tax on Acquisition-Related Intangible Amortization Expenses | (12) | | | | (12) | | | | (36) | | | | (36) | | |
| Net Acquisition-Related Intangible Amortization Expenses |
| 39 | | |
| 37 | | |
| 112 | | |
| 114 | |
| | | | | | | | | | | |
| Pre-tax restructuring | $ | 6 | | | | $ | 27 | | | | $ | 13 | | | | $ | 51 | | |
| Tax on restructuring | (1) | | | | (6) | | | | (3) | | | | (12) | | |
| Net restructuring | | 5 | | | | 21 | | | | 10 | | | | 39 | |
| | | | | | | | | | | |
| Pre-tax charges related to asset abandonment | $ | 15 | | | | $ | — | | | | $ | 30 | | | | $ | — | | |
| Tax on charges related to asset abandonment | (3) | | | | — | | | | (7) | | | | — | | |
| Net charges related to asset abandonment | | 12 | | | | — | | | | 23 | | | | — | |
| Pre-tax gain on previously held equity method investments | $ | (7) | | | | $ | — | | | | $ | (7) | | | | $ | — | | |
| Tax on gain on previously held equity method investments | 2 | | | | — | | | | 2 | | | | — | | |
| Net gain on previously held equity method investments | | (5) | | | | — | | | | (5) | | | | — | |
| Adjusted Net Income |
| $ | 585 | | |
| $ | 447 | | |
| $ | 1,803 | | |
| $ | 1,420 | |
| | | | | | | | | | | | | | | | | | | | | | | | | | | | | | | | | | | |
| Three Months Ended September 30, | | Nine Months Ended September 30, |
| 2024 | | 2023 | | 2024 | | 2023 |
| Diluted earnings per share attributable to Moody's common shareholders | | $ | 2.93 | | | | $ | 2.11 | | | | $ | 9.09 | | | | $ | 6.88 | |
| | | | | | | | | | | |
| | | | | | | | | | | |
| | | | | | | | | | | |
| Pre-tax Acquisition-Related Intangible Amortization Expenses | $ | 0.28 | | | | $ | 0.27 | | | | $ | 0.81 | | | | $ | 0.81 | | |
| Tax on Acquisition-Related Intangible Amortization Expenses | (0.07) | | | | (0.06) | | | | (0.20) | | | | (0.19) | | |
| Net Acquisition-Related Intangible Amortization Expenses | | 0.21 | | | | 0.21 | | | | 0.61 | | | | 0.62 | |
| | | | | | | | | | | |
| Pre-tax restructuring | $ | 0.03 | | | | $ | 0.15 | | | | $ | 0.07 | | | | $ | 0.28 | | |
| Tax on restructuring | — | | | | (0.04) | | | | (0.02) | | | | (0.07) | | |
| Net restructuring | | 0.03 | | | | 0.11 | | | | 0.05 | | | | 0.21 | |
| | | | | | | | | | | |
| Pre-tax charges related to asset abandonment | $ | 0.08 | | | | $ | — | | | | $ | 0.16 | | | | $ | — | | |
| Tax on charges related to asset abandonment | (0.01) | | | | — | | | | (0.03) | | | | — | | |
| Net charges related to asset abandonment | | 0.07 | | | | — | | | | 0.13 | | | | — | |
| Pre-tax gain on previously held equity method investments | $ | (0.04) | | | | $ | — | | | | $ | (0.04) | | | | $ | — | | |
| Tax on gain on previously held equity method investments | 0.01 | | | | — | | | | 0.01 | | | | — | | |
| Net gain on previously held equity method investments | | (0.03) | | | | — | | | | (0.03) | | | | — | |
| Adjusted Diluted EPS | | $ | 3.21 | | | | $ | 2.43 | | | | $ | 9.85 | | | | $ | 7.71 | |
Note: the tax impacts in the table above were calculated using tax rates in effect in the jurisdiction for which the item relates.
Free Cash Flow:
The Company defines Free Cash Flow as net cash provided by operating activities minus cash paid for capital additions. Management believes that Free Cash Flow is a useful metric in assessing the Company’s cash flows to service debt, pay dividends and to fund acquisitions and share repurchases. Management deems capital expenditures essential to the Company’s product and service innovations and maintenance of Moody’s operational capabilities. Accordingly, capital expenditures are deemed to be a recurring use of Moody’s cash flow. Below is a reconciliation of the Company’s net cash flows from operating activities to Free Cash Flow: | | | | | | | | | | | |
| | | |
| Nine Months Ended September 30, |
| 2024 | | 2023 |
| Net cash provided by operating activities | $ | 2,164 | | | $ | 1,674 | |
| Capital additions | (243) | | | (198) | |
| Free Cash Flow | $ | 1,921 | | | $ | 1,476 | |
| Net cash used in investing activities | $ | (875) | | | $ | (193) | |
| Net cash used in financing activities | $ | (812) | | | $ | (1,231) | |
Key Performance Metrics:
The Company presents Annualized Recurring Revenue (“ARR”) on a constant currency organic basis for its MA business as a supplemental performance metric to provide additional insight on the estimated value of MA's recurring revenue contracts at a given point in time. The Company uses ARR to manage and monitor performance of its MA operating segment and believes that this metric is a key indicator of the trajectory of MA's recurring revenue base.
The Company calculates ARR by taking the total recurring contract value for each active renewable contract as of the reporting date, divided by the number of days in the contract and multiplied by 365 days to create an annualized value. The Company defines renewable contracts as subscriptions, term licenses, maintenance and renewable services. ARR excludes transaction sales including one-time training, services and perpetual licenses. In order to compare period-over-period ARR excluding the effects of foreign currency translation, the Company bases the calculation on currency rates utilized in its current year operating budget and holds these FX rates constant for the duration of all current and prior periods being reported. Additionally, ARR excludes contracts related to acquisitions to provide additional perspective in assessing growth excluding the impacts from certain acquisition activity.
The Company’s definition of ARR may differ from definitions utilized by other companies reporting similarly named measures, and this metric should be viewed in addition to, and not as a substitute for, financial measures presented in accordance with GAAP.
| | | | | | | | | | | | | | | | | | | | | | | | | | | | | | | | |
| Amounts in millions | | September 30, 2024 | | September 30, 2023 | | Change | | Growth | | | | | | | | |
| | | | | | | | | | | | | | | | |
| | | | | | | | | | | | | | | | |
| | | | | | | | | | | | | | | | |
| | | | | | | | | | | | | | | | |
| | | | | | | | | | | | | | | | |
| | | | | | | | | | | | | | | | |
| MA ARR | | | | | | | | | | | | | | | | |
| Decision Solutions | | | | | | | | | | | | | | | | |
| Banking | | $ | 439 | | | $ | 400 | | | $ | 39 | | | 10% | | | | | | | | |
| Insurance | | 579 | | | 514 | | | 65 | | | 13% | | | | | | | | |
| KYC | | 360 | | | 316 | | | 44 | | | 14% | | | | | | | | |
| Total Decision Solutions | | $ | 1,378 | | | $ | 1,230 | | | $ | 148 | | | 12% | | | | | | | | |
| Research and Insights | | 910 | | | 860 | | | 50 | | | 6% | | | | | | | | |
| Data and Information | | 859 | | | 796 | | | 63 | | | 8% | | | | | | | | |
| Total MA ARR | | $ | 3,147 | | | $ | 2,886 | | | $ | 261 | | | 9% | | | | | | | | |
| | | | | | | | | | | | | | | | |
| | | | | | | | | | | | | | | | |
| | | | | | | | | | | | | | | | |
| | | | | | | | | | | | | | | | |
| | | | | | | | | | | | | | | | |
| | | | | | | | | | | | | | | | |
| | | | | | | | | | | | | | | | |
| | | | | | | | | | | | | | | | |
| | | | | | | | | | | | | | | | |
| | | | | | | | | | | | | | | | |
RECENTLY ISSUED ACCOUNTING STANDARDS
Refer to Note 1 to the consolidated financial statements located in Part I of this Form 10-Q for a discussion on the impact to the Company relating to recently issued accounting pronouncements.
CONTINGENCIES
Legal proceedings in which the Company is involved also may impact Moody’s liquidity or operating results. No assurance can be provided as to the outcome of such proceedings. In addition, litigation inherently involves significant costs. For information regarding legal proceedings, see Item 1 - "Financial Statements," Note 15 "Contingencies” in this Form 10-Q.
FORWARD-LOOKING STATEMENTS
Certain statements contained in this quarterly report on Form 10-Q are forward-looking statements and are based on future expectations, plans and prospects for the Company's business and operations that involve a number of risks and uncertainties. Such statements involve estimates, projections, goals, forecasts, assumptions and uncertainties that could cause actual results or outcomes to differ materially from those contemplated, expressed, projected, anticipated or implied in the forward-looking statements. Those statements appear at various places throughout this quarterly report on Form 10-Q, including in the sections entitled “Contingencies” under Item 2, “MD&A,” commencing on page 39 of this quarterly report on Form 10-Q, under “Legal Proceedings” in Part II, Item 1, of this Form 10-Q, and elsewhere in the context of statements containing the words “believe,” “expect,” “anticipate,” “intend,” “plan,” “will,” “predict,” “potential,” “continue,” “strategy,” “aspire,” “target,” “forecast,” “project,” “estimate,” “should,” “could,” “may,” and similar expressions or words and variations thereof relating to the Company’s views on future events, trends and contingencies or otherwise convey the prospective nature of events or outcomes generally indicative of forward-looking statements. Stockholders and investors are cautioned not to place undue reliance on these forward-looking statements. The forward-looking statements and other information in this document are made as of the date of this quarterly report on Form 10-Q, and the Company undertakes no obligation (nor does it intend) to publicly supplement, update or revise such statements on a going-forward basis, whether as a result of subsequent developments, changed expectations or otherwise, except as required by applicable law or regulation. In connection with the “safe harbor” provisions of the Private Securities Litigation Reform Act of 1995, the Company is identifying certain factors that could cause actual results to differ, perhaps materially, from those indicated by these forward-looking statements. Those factors, risks and uncertainties include, but are not limited to:
•the impact of general economic conditions (including significant government debt and deficit levels and inflation and related monetary policy actions by governments in response to inflation) on worldwide credit markets and on economic activity, including on the volume of mergers and acquisitions, and their effects on the volume of debt and other securities issued in domestic and/or global capital markets;
•the uncertain effectiveness and possible collateral consequences of U.S. and foreign government initiatives and monetary policy to respond to the current economic climate, including instability of financial institutions, credit quality concerns, and other potential impacts of volatility in financial and credit markets;
•the global impacts of the Russia-Ukraine military conflict and the military conflict in the Middle East on volatility in world financial markets, on general economic conditions and GDP in the U.S. and worldwide, on global relations and on the Company's own operations and personnel;
•other matters that could affect the volume of debt and other securities issued in domestic and/or global capital markets, including regulation, increased utilization of technologies that have the potential to intensify competition and accelerate disruption and disintermediation in the financial services industry, as well as the number of issuances of securities without ratings or securities which are rated or evaluated by non-traditional parties;
•the level of merger and acquisition activity in the U.S. and abroad;
•the uncertain effectiveness and possible collateral consequences of U.S. and foreign government actions affecting credit markets, international trade and economic policy, including those related to tariffs, tax agreements and trade barriers;
•the impact of MIS’s withdrawal of its credit ratings on countries or entities within countries and of Moody’s no longer conducting commercial operations in countries where political instability warrants such actions;
•concerns in the marketplace affecting our credibility or otherwise affecting market perceptions of the integrity or utility of independent credit agency ratings;
•the introduction or development of competing and/or emerging technologies and products;
•pricing pressure from competitors and/or customers;
•the level of success of new product development and global expansion;
•the impact of regulation as an NRSRO, the potential for new U.S., state and local legislation and regulations;
•the potential for increased competition and regulation in the jurisdictions in which we operate, including the EU;
•exposure to litigation related to our rating opinions, as well as any other litigation, government and regulatory proceedings, investigations and inquiries to which Moody’s may be subject from time to time;
•provisions in U.S. legislation modifying the pleading standards and EU regulations modifying the liability standards, applicable to CRAs in a manner adverse to CRAs;
•provisions of EU regulations imposing additional procedural and substantive requirements on the pricing of services and the expansion of supervisory remit to include non-EU ratings used for regulatory purposes;
•uncertainty regarding the future relationship between the U.S. and China;
•the possible loss of key employees and the impact of the global labor environment;
•failures or malfunctions of our operations and infrastructure;
•any vulnerabilities to cyber threats or other cybersecurity concerns;
•the timing and effectiveness of any restructuring programs;
•currency and foreign exchange volatility;
•the outcome of any review by tax authorities of Moody’s global tax planning initiatives;
•exposure to potential criminal sanctions or civil remedies if Moody’s fails to comply with foreign and U.S. laws and regulations that are applicable in the jurisdictions in which Moody’s operates, including data protection and privacy laws, sanctions laws, anti-corruption laws, and local laws prohibiting corrupt payments to government officials;
•the impact of mergers, acquisitions, or other business combinations and the ability of Moody’s to successfully integrate acquired businesses;
•the level of future cash flows;
•the levels of capital investments; and
•a decline in the demand for credit risk management tools by financial institutions.
These factors, risks and uncertainties as well as other risks and uncertainties that could cause Moody’s actual results to differ materially from those contemplated, expressed, projected, anticipated or implied in the forward-looking statements are described in greater detail under “Risk Factors” in Part I, Item 1A of Moody’s annual report on Form 10-K for the year ended December 31, 2023, and in other filings made by the Company from time to time with the SEC or in materials incorporated herein or therein. Stockholders and investors are cautioned that the occurrence of any of these factors, risks and uncertainties may cause the Company’s actual results to differ materially from those contemplated, expressed, projected, anticipated or implied in the forward-looking statements, which could have a material and adverse effect on the Company’s business, results of operations and financial condition. New factors may emerge from time to time, and it is not possible for the Company to predict new factors, nor can the Company assess the potential effect of any new factors on it. Forward-looking and other statements in this document may also address our corporate responsibility progress, plans, and goals (including sustainability and environmental matters), and the inclusion of such statements is not an indication that these contents are necessarily material to investors or required to be disclosed in the Company’s filings with the Securities and Exchange Commission. In addition, historical, current, and forward-looking sustainability-related statements may be based on standards for measuring progress that are still developing, internal controls and processes that continue to evolve, and assumptions that are subject to change in the future.
Item 3. Quantitative and Qualitative Disclosures About Market Risk
There have been no significant changes to the Company's market risk during the nine months ended September 30, 2024. For a discussion of the Company’s exposure to market risk, refer to the Company’s market risk disclosures set forth in Part II, Item 7A, “Quantitative and Qualitative Disclosures About Market Risk” of our Form 10-K for the year ended December 31, 2023.
Item 4. Controls and Procedures
Evaluation of Disclosure Controls and Procedures: The Company carried out an evaluation, as required by Rule 13a-15(b) under the Exchange Act, under the supervision and with the participation of the Company’s management, including the Company’s Chief Executive Officer and Chief Financial Officer, of the effectiveness of the design and operation of the Company’s disclosure controls and procedures, as defined in Rule 13a-15(e) of the Exchange Act, as of the end of the period covered by this report (the “Evaluation Date”). Based on such evaluation, such officers have concluded that, as of the Evaluation Date, the Company’s disclosure controls and procedures were effective to provide reasonable assurance that information required to be disclosed by the Company in reports that it files or submits under the Exchange Act is recorded, processed, summarized and reported within the time periods specified in the communication to the Company’s management, including the Company’s Chief Executive Officer and Chief Financial Officer, as appropriate to allow timely decisions regarding required disclosure.
The Company’s management, including the Company’s Chief Executive Officer and Chief Financial Officer, has determined that there were no changes in the Company’s internal control over financial reporting that have materially affected, or are reasonably likely to materially affect, these internal controls over financial reporting during the three-month period ended September 30, 2024.
The Company's disclosure controls and procedures are designed to provide reasonable assurance of achieving their objectives as specified above. The Company's management does not expect, however, that our disclosure controls and procedures will prevent or detect all instances of error and fraud. Any control system, regardless of how well designed and operated, is based upon certain assumptions, and can provide only reasonable, not absolute, assurance that its objectives will be met. Further, no evaluation of controls can provide absolute assurance that misstatements due to error or fraud will not occur or that all control issues and instances of fraud, if any, within the Company have been detected.
PART II. OTHER INFORMATION
Item 1. Legal Proceedings
For information regarding legal proceedings, see Item 1 – “Financial Statements – Notes to Consolidated Financial Statements (Unaudited),” Note 15 “Contingencies” in this Form 10-Q.
Item 1A. Risk Factors
There have been no material changes from the significant risk factors and uncertainties previously disclosed under the heading "Risk Factors" in the Company's annual report on Form 10-K for the year ended December 31, 2023, that if they were to occur, could materially adversely affect the Company’s business, financial condition, operating results and/or cash flow. For a discussion of the Company’s risk factors, refer to Item 1A. “Risk Factors” contained in the Company’s annual report on Form 10-K for the year ended December 31, 2023.
Item 2. Unregistered Sales of Equity Securities and Use of Proceeds
MOODY'S PURCHASES OF EQUITY SECURITIES
For the three months ended September 30, 2024 | | | | | | | | | | | | | | | | | | | | | | | | | | |
| Period | | Total Number of Shares Purchased (1) | |
Average Price Paid per Share | | Total Number of Shares Purchased as Part of Publicly Announced Program | | Approximate Dollar Value of Shares That May Yet be Purchased Under the Program(2) |
| July 1- 31 | | 254,701 | | | $ | 441.26 | | | 249,457 | | | $ | 865 | million |
| August 1- 31 | | 354,722 | | | $ | 466.79 | | | 354,650 | | | $ | 699 | million |
| September 1- 30 | | 316,635 | | | $ | 481.08 | | | 315,988 | | | $ | 547 | million |
| Total | | 926,058 | | | $ | 464.77 | | | 920,095 | | | |
(1) Includes surrender to the Company of 5,244; 72; and 647 shares of common stock in July, August, and September, respectively, to satisfy tax withholding obligations in connection with the vesting of restricted stock issued to employees.
(2) As of the last day of each of the months. On February 5, 2024, the Board of Directors authorized $1 billion in share repurchase authority. At September 30, 2024 there was approximately $547 million of share repurchase authority remaining under this authorization. On October 15, 2024, the Board authorized an additional $1.5 billion in share repurchase authority. There is no established expiration date for the remaining authorizations.
During the third quarter of 2024, Moody’s issued a net 100,000 shares under employee stock-based compensation plans.
Item 5. Other Information
Rule 10b5-1 Plans
On July 30, 2024, Robert Fauber, the Company's Chief Executive Officer, adopted a trading plan intended to satisfy Rule 10b5-1(c). The plan relates to the sale of up to 17,191 shares of Moody’s Corporation common stock between November 1, 2024 and October 27, 2025. The shares include: i) shares which will be acquired upon the exercise of employee stock options; and ii) vested restricted stock units.
Item 6. Exhibits | | | | | | | | |
| Exhibit No | | Description |
| 3 | | Articles of Incorporation and By-laws |
| | |
| .1 | | |
| | |
| .2 | | |
| | |
| 4 | | Instruments Defining the Rights of Security Holders, Including Indentures |
| | |
| .1 | | Eighteenth Supplemental Indenture, dated as of August 5, 2024, between the Company and Computershare Trust Company, N.A. as successor to Wells Fargo Bank, National Association, as Trustee, including the form of 5.000% Senior Note due 2034 (incorporated by reference to Exhibit 4.1 to the Report on Form 8-K of the Registrant, file number 1-4037, filed August 5, 2024) |
| | |
| 10 | | Material Contracts |
| | |
| .1* | | |
| | |
| 31 | | Certifications Pursuant to Section 302 of the Sarbanes-Oxley Act of 2002 |
| | |
| .1* | | |
| | |
| .2* | | |
| | |
| 32 | | Certifications Pursuant to Section 906 of the Sarbanes-Oxley Act of 2002 |
| | |
| .1* | | |
| | |
| .2* | | |
| | |
| 101.INS* | | Inline XBRL Instance Document (the instance document does not appear in the Interactive Data File because its XBRL tags are embedded within the Inline XBRL document) |
| 101.SCH* | | Inline XBRL Taxonomy Extension Schema Document |
| 101.CAL* | | Inline XBRL Taxonomy Extension Calculation Linkbase Document |
| 101.DEF* | | Inline XBRL Definitions Linkbase Document |
| 101.LAB* | | Inline XBRL Taxonomy Extension Labels Linkbase Document |
| 101.PRE* | | Inline XBRL Taxonomy Extension Presentation Linkbase Document |
| 104* | | Cover Page Interactive Data File (formatted as inline XBRL and contained in Exhibit 101) |
| | |
| * Filed herewith |
|
SIGNATURES
Pursuant to the requirements of the Securities Exchange Act of 1934, the registrant has duly caused this report to be signed on its behalf by the undersigned thereunto duly authorized.
| | | | | | | | |
| | MOODY’S CORPORATION |
| | |
| | |
| By: | / S / NOÉMIE HEULAND |
| | Noémie Heuland |
| | Senior Vice President and Chief Financial Officer |
| | (principal financial officer) |
| | |
| By: | / S / CAROLINE SULLIVAN |
| | Caroline Sullivan |
| | Chief Accounting Officer and Corporate Controller |
| | (principal accounting officer) |
| | |
| Date: October 23, 2024 | | |