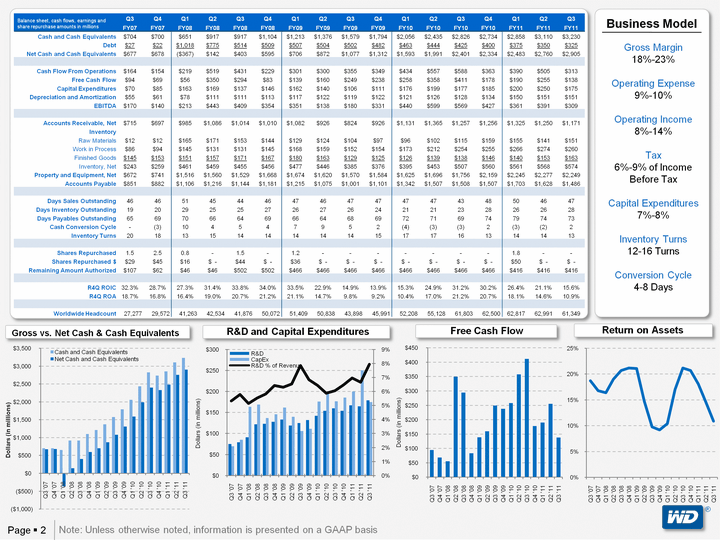
| Page ? 2 (r) Free Cash Flow Return on Assets R&D and Capital Expenditures Gross vs. Net Cash & Cash Equivalents Business Model Gross Margin 18%-23% Operating Expense 9%-10% Operating Income 8%-14% Tax 6%-9% of Income Before Tax Capital Expenditures 7%-8% Inventory Turns 12-16 Turns Conversion Cycle 4-8 Days Q3 Q4 Q1 Q2 Q3 Q4 Q1 Q2 Q3 Q4 Q1 Q2 Q3 Q4 Q1 Q2 Q3 FY07 FY07 FY08 FY08 FY08 FY08 FY09 FY09 FY09 FY09 FY10 FY10 FY10 FY10 FY11 FY11 FY11 Cash and Cash Equivalents $704 $700 $651 $917 $917 $1,104 $1,213 $1,376 $1,579 $1,794 $2,056 $2,435 $2,826 $2,734 $2,858 $3,110 $3,230 Debt $27 $22 $1,018 $775 $514 $509 $507 $504 $502 $482 $463 $444 $425 $400 $375 $350 $325 Net Cash and Cash Equivalents $677 $678 ($367) $142 $403 $595 $706 $872 $1,077 $1,312 $1,593 $1,991 $2,401 $2,334 $2,483 $2,760 $2,905 Cash Flow From Operations $164 $154 $219 $519 $431 $229 $301 $300 $355 $349 $434 $557 $588 $363 $390 $505 $313 Free Cash Flow $94 $69 $56 $350 $294 $83 $139 $160 $249 $238 $258 $358 $411 $178 $190 $255 $138 Capital Expenditures $70 $85 $163 $169 $137 $146 $162 $140 $106 $111 $176 $199 $177 $185 $200 $250 $175 Depreciation and Amortization $55 $61 $78 $111 $111 $113 $117 $122 $119 $122 $121 $126 $128 $134 $150 $151 $151 EBITDA $170 $140 $213 $443 $409 $354 $351 $138 $180 $331 $440 $599 $569 $427 $361 $391 $309 Accounts Receivable, Net $715 $697 $985 $1,086 $1,014 $1,010 $1,082 $926 $824 $926 $1,131 $1,365 $1,257 $1,256 $1,325 $1,250 $1,171 Inventory Raw Materials $12 $12 $165 $171 $153 $144 $129 $124 $104 $97 $96 $102 $115 $159 $155 $141 $151 Work in Process $86 $94 $145 $131 $131 $145 $168 $159 $152 $154 $173 $212 $254 $255 $266 $274 $260 Finished Goods $145 $153 $151 $157 $171 $167 $180 $163 $129 $125 $126 $139 $138 $146 $140 $153 $163 Inventory, Net $243 $259 $461 $459 $455 $456 $477 $446 $385 $376 $395 $453 $507 $560 $561 $568 $574 Property and Equipment, Net $672 $741 $1,516 $1,560 $1,529 $1,668 $1,674 $1,620 $1,570 $1,584 $1,625 $1,696 $1,756 $2,159 $2,245 $2,277 $2,249 Accounts Payable $851 $882 $1,106 $1,216 $1,144 $1,181 $1,215 $1,075 $1,001 $1,101 $1,342 $1,507 $1,508 $1,507 $1,703 $1,628 $1,486 Days Sales Outstanding 46 46 51 45 44 46 47 46 47 47 47 47 43 48 50 46 47 Days Inventory Outstanding 19 20 29 25 25 27 26 27 26 24 21 21 23 28 26 26 28 Days Payables Outstanding 65 69 70 66 64 69 66 64 68 69 72 71 69 74 79 74 73 Cash Conversion Cycle - (3) 10 4 5 4 7 9 5 2 (4) (3) (3) 2 (3) (2) 2 Inventory Turns 20 18 13 15 14 14 14 14 14 15 17 17 16 13 14 14 13 Shares Repurchased 1.5 2.5 0.8 - 1.5 - 1.2 - - - - - - - 1.8 - - Shares Repurchased $ $29 $45 $16 $ - $44 $ - $36 $ - $ - $ - $ - $ - $ - $ - $50 $ - $ - Remaining Amount Authorized $107 $62 $46 $46 $502 $502 $466 $466 $466 $466 $466 $466 $466 $466 $416 $416 $416 R4Q ROIC 32.3% 28.7% 27.3% 31.4% 33.8% 34.0% 33.5% 22.9% 14.9% 13.9% 15.3% 24.9% 31.2% 30.2% 26.4% 21.1% 15.6% R4Q ROA 18.7% 16.8% 16.4% 19.0% 20.7% 21.2% 21.1% 14.7% 9.8% 9.2% 10.4% 17.0% 21.2% 20.7% 18.1% 14.6% 10.9% Worldwide Headcount 27,277 29,572 41,263 42,534 41,876 50,072 51,409 50,838 43,898 45,991 52,208 55,128 61,803 62,500 62,817 62,991 61,349 Balance sheet, cash flows, earnings and share repurchase amounts in millions (CHART) (CHART) (CHART) (CHART) Note: Unless otherwise noted, information is presented on a GAAP basis |


