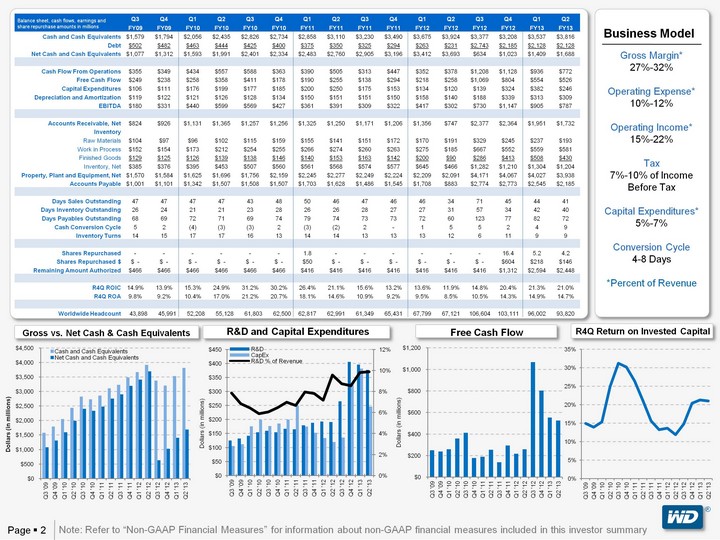
| Page ? 2 (r) Free Cash Flow R4Q Return on Invested Capital R&D and Capital Expenditures Gross vs. Net Cash & Cash Equivalents Business Model Gross Margin* 27%-32%Operating Expense* 10%-12%Operating Income* 15%-22%Tax 7%-10% of Income Before TaxCapital Expenditures* 5%-7% Conversion Cycle 4-8 Days*Percent of Revenue Q3 Q4 Q1 Q2 Q3 Q4 Q1 Q2 Q3 Q4 Q1 Q2 Q3 Q4 Q1 Q2 FY09 FY09 FY10 FY10 FY10 FY10 FY11 FY11 FY11 FY11 FY12 FY12 FY12 FY12 FY13 FY13 Cash and Cash Equivalents $1,579 $1,794 $2,056 $2,435 $2,826 $2,734 $2,858 $3,110 $3,230 $3,490 $3,675 $3,924 $3,377 $3,208 $3,537 $3,816 Debt $502 $482 $463 $444 $425 $400 $375 $350 $325 $294 $263 $231 $2,743 $2,185 $2,128 $2,128 Net Cash and Cash Equivalents $1,077 $1,312 $1,593 $1,991 $2,401 $2,334 $2,483 $2,760 $2,905 $3,196 $3,412 $3,693 $634 $1,023 $1,409 $1,688 Cash Flow From Operations $355 $349 $434 $557 $588 $363 $390 $505 $313 $447 $352 $378 $1,208 $1,128 $936 $772 Free Cash Flow $249 $238 $258 $358 $411 $178 $190 $255 $138 $294 $218 $258 $1,069 $804 $554 $526 Capital Expenditures $106 $111 $176 $199 $177 $185 $200 $250 $175 $153 $134 $120 $139 $324 $382 $246 Depreciation and Amortization $119 $122 $121 $126 $128 $134 $150 $151 $151 $150 $158 $140 $188 $339 $313 $309 EBITDA $180 $331 $440 $599 $569 $427 $361 $391 $309 $322 $417 $302 $730 $1,147 $905 $787 Accounts Receivable, Net $824 $926 $1,131 $1,365 $1,257 $1,256 $1,325 $1,250 $1,171 $1,206 $1,356 $747 $2,377 $2,364 $1,951 $1,732 Inventory Raw Materials $104 $97 $96 $102 $115 $159 $155 $141 $151 $172 $170 $191 $329 $245 $237 $193 Work in Process $152 $154 $173 $212 $254 $255 $266 $274 $260 $263 $275 $185 $667 $552 $559 $581 Finished Goods $129 $125 $126 $139 $138 $146 $140 $153 $163 $142 $200 $90 $286 $413 $508 $430 Inventory, Net $385 $376 $395 $453 $507 $560 $561 $568 $574 $577 $645 $466 $1,282 $1,210 $1,304 $1,204 Property, Plant and Equipment, Net $1,570 $1,584 $1,625 $1,696 $1,756 $2,159 $2,245 $2,277 $2,249 $2,224 $2,209 $2,091 $4,171 $4,067 $4,027 $3,938 Accounts Payable $1,001 $1,101 $1,342 $1,507 $1,508 $1,507 $1,703 $1,628 $1,486 $1,545 $1,708 $883 $2,774 $2,773 $2,545 $2,185 Days Sales Outstanding 47 47 47 47 43 48 50 46 47 46 46 34 71 45 44 41 Days Inventory Outstanding 26 24 21 21 23 28 26 26 28 27 27 31 57 34 42 40 Days Payables Outstanding 68 69 72 71 69 74 79 74 73 73 72 60 123 77 82 72 Cash Conversion Cycle 5 2 (4) (3) (3) 2 (3) (2) 2 - 1 5 5 2 4 9 Inventory Turns 14 15 17 17 16 13 14 14 13 13 13 12 6 11 9 9 Shares Repurchased - - - - - - 1.8 - - - - - - 16.4 5.2 4.2 Shares Repurchased $ $ - $ - $ - $ - $ - $ - $50 $ - $ - $ - $ - $ - $ - $604 $218 $146 Remaining Amount Authorized $466 $466 $466 $466 $466 $466 $416 $416 $416 $416 $416 $416 $416 $1,312 $2,594 $2,448 R4Q ROIC 14.9% 13.9% 15.3% 24.9% 31.2% 30.2% 26.4% 21.1% 15.6% 13.2% 13.6% 11.9% 14.8% 20.4% 21.3% 21.0% R4Q ROA 9.8% 9.2% 10.4% 17.0% 21.2% 20.7% 18.1% 14.6% 10.9% 9.2% 9.5% 8.5% 10.5% 14.3% 14.9% 14.7% Worldwide Headcount 43,898 45,991 52,208 55,128 61,803 62,500 62,817 62,991 61,349 65,431 67,799 67,121 106,604 103,111 96,002 93,820 Balance sheet, cash flows, earnings and share repurchase amounts in millions (CHART) (CHART) (CHART) (CHART) Note: Refer to "Non-GAAP Financial Measures" for information about non-GAAP financial measures included in this investor summary |