Exhibit 99.2
| | | | | | | | | | | | | | | | | | | | | | | | | | | | | | | | | | | | | | | | | | | | | | | | | | | | | | | | | | | | | | | | |
Amounts in millions, except per share amounts,
ASP, percentages1 | | Q1
FY13 | | | Q2
FY13 | | | Q3
FY13 | | | Q4
FY13 | | | Q1
FY14 | | | Q2
FY14 | | | Q3
FY14 | | | Q4
FY14 | | | Q1
FY15 | | | Q2
FY15 | | | Q3FY15 | | | Q4
FY15 | | | Q1
FY16 | | | Q2
FY16 | | | Q3
FY16 | | | Q4
FY169 | |
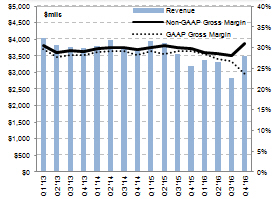
Revenue | | $ | 4,035 | | | $ | 3,824 | | | $ | 3,764 | | | $ | 3,728 | | | $ | 3,804 | | | $ | 3,972 | | | $ | 3,703 | | | $ | 3,651 | | | $ | 3,943 | | | $ | 3,888 | | | $ | 3,550 | | | $ | 3,191 | | | $ | 3,360 | | | $ | 3,317 | | | $ | 2,822 | | | $ | 3,495 | |
Gross Profit | | $ | 1,193 | | | $ | 1,059 | | | $ | 1,061 | | | $ | 1,050 | | | $ | 1,099 | | | $ | 1,156 | | | $ | 1,076 | | | $ | 1,029 | | | $ | 1,149 | | | $ | 1,110 | | | $ | 1,032 | | | $ | 930 | | | $ | 955 | | | $ | 906 | | | $ | 753 | | | $ | 821 | |
Gross Margin | | | 29.6 | % | | | 27.7 | % | | | 28.2 | % | | | 28.2 | % | | | 28.9 | % | | | 29.1 | % | | | 29.1 | % | | | 28.2 | % | | | 29.1 | % | | | 28.5 | % | | | 29.1 | % | | | 29.1 | % | | | 28.4 | % | | | 27.3 | % | | | 26.7 | % | | | 23.5 | % |
R&D | | $ | 396 | | | $ | 378 | | | $ | 396 | | | $ | 402 | | | $ | 401 | | | $ | 416 | | | $ | 418 | | | $ | 426 | | | $ | 437 | | | $ | 426 | | | $ | 402 | | | $ | 381 | | | $ | 385 | | | $ | 389 | | | $ | 359 | | | $ | 484 | |
SG&A | | | 179 | | | | 162 | | | | 185 | | | | 180 | | | | 132 | | | | 226 | | | | 201 | | | | 202 | | | | 220 | | | | 164 | | | | 199 | | | | 190 | | | | 192 | | | | 207 | | | | 166 | | | | 400 | |
Other | | | 26 | | | | 41 | | | | 63 | | | | 689 | | | | 24 | | | | 36 | | | | 38 | | | | 49 | | | | 23 | | | | 54 | | | | 10 | | | | 104 | | | | 56 | | | | 59 | | | | 140 | | | | 117 | |
| | | | | | | | | | | | | | | | | | | | | | | | | | | | | | | | | | | | | | | | | | | | | | | | | | | | | | | | | | | | | | | | |
Total Operating Expenses | | $ | 601 | | | $ | 581 | | | $ | 644 | | | $ | 1,271 | | | $ | 557 | | | $ | 678 | | | $ | 657 | | | $ | 677 | | | $ | 680 | | | $ | 644 | | | $ | 611 | | | $ | 675 | | | $ | 633 | | | $ | 655 | | | $ | 665 | | | $ | 1,001 | |
Operating Income (Loss) | | $ | 592 | | | $ | 478 | | | $ | 417 | | | $ | (221 | ) | | $ | 542 | | | $ | 478 | | | $ | 419 | | | $ | 352 | | | $ | 469 | | | $ | 466 | | | $ | 421 | | | $ | 255 | | | $ | 322 | | | $ | 251 | | | $ | 88 | | | $ | (180 | ) |
Interest & Other Expense, net | | $ | 14 | | | $ | 10 | | | $ | 11 | | | $ | 9 | | | $ | 10 | | | $ | 11 | | | $ | 13 | | | $ | 5 | | | $ | 9 | | | $ | 8 | | | $ | 9 | | | $ | 8 | | | $ | 8 | | | $ | 7 | | | $ | 8 | | | $ | 290 | |
Net Income (Loss) | | $ | 519 | | | $ | 335 | | | $ | 391 | | | $ | (265 | ) | | $ | 495 | | | $ | 430 | | | $ | 375 | | | $ | 317 | | | $ | 423 | | | $ | 438 | | | $ | 384 | | | $ | 220 | | | $ | 283 | | | $ | 251 | | | $ | 74 | | | $ | (351 | ) |
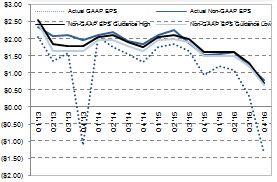
EPS | | $ | 2.06 | | | $ | 1.36 | | | $ | 1.60 | | | $ | (1.12 | ) | | $ | 2.05 | | | $ | 1.77 | | | $ | 1.55 | | | $ | 1.32 | | | $ | 1.76 | | | $ | 1.84 | | | $ | 1.63 | | | $ | 0.94 | | | $ | 1.21 | | | $ | 1.07 | | | $ | 0.32 | | | $ | (1.34 | ) |
Diluted Shares Outstanding | | | 252 | | | | 246 | | | | 245 | | | | 236 | | | | 242 | | | | 243 | | | | 242 | | | | 241 | | | | 240 | | | | 238 | | | | 236 | | | | 235 | | | | 234 | | | | 234 | | | | 234 | | | | 261 | |
Non-GAAP Results Gross Profit10 | | $ | 1,231 | | | $ | 1,097 | | | $ | 1,099 | | | $ | 1,085 | | | $ | 1,135 | | | $ | 1,196 | | | $ | 1,115 | | | $ | 1,078 | | | $ | 1,188 | | | $ | 1,187 | | | $ | 1,069 | | | $ | 951 | | | $ | 972 | | | $ | 944 | | | $ | 794 | | | $ | 1,084 | |
Gross Margin10 | | | 30.5 | % | | | 28.7 | % | | | 29.2 | % | | | 29.1 | % | | | 29.8 | % | | | 30.1 | % | | | 30.1 | % | | | 29.5 | % | | | 30.1 | % | | | 30.5 | % | | | 30.1 | % | | | 29.8 | % | | | 28.9 | % | | | 28.5 | % | | | 28.1 | % | | | 31.0 | % |
Operating Expenses10 | | $ | 564 | | | $ | 529 | | | $ | 559 | | | $ | 564 | | | $ | 574 | | | $ | 616 | | | $ | 605 | | | $ | 598 | | | $ | 638 | | | $ | 620 | | | $ | 591 | | | $ | 560 | | | $ | 567 | | | $ | 542 | | | $ | 477 | | | $ | 691 | |
Net Income | | $ | 594 | | | $ | 513 | | | $ | 514 | | | $ | 477 | | | $ | 514 | | | $ | 532 | | | $ | 470 | | | $ | 445 | | | $ | 504 | | | $ | 539 | | | $ | 441 | | | $ | 356 | | | $ | 366 | | | $ | 374 | | | $ | 283 | | | $ | 208 | |
EPS | | $ | 2.36 | | | $ | 2.09 | | | $ | 2.10 | | | $ | 1.96 | | | $ | 2.12 | | | $ | 2.19 | | | $ | 1.94 | | | $ | 1.85 | | | $ | 2.10 | | | $ | 2.26 | | | $ | 1.87 | | | $ | 1.51 | | | $ | 1.56 | | | $ | 1.60 | | | $ | 1.21 | | | $ | 0.79 | |
Diluted Shares Outstanding6 | | | 252 | | | | 246 | | | | 245 | | | | 243 | | | | 242 | | | | 243 | | | | 242 | | | | 241 | | | | 240 | | | | 238 | | | | 236 | | | | 235 | | | | 234 | | | | 234 | | | | 234 | | | | 263 | |
Revenue By Channel OEM | | | 63 | % | | | 61 | % | | | 60 | % | | | 66 | % | | | 64 | % | | | 62 | % | | | 62 | % | | | 65 | % | | | 63 | % | | | 63 | % | | | 64 | % | | | 67 | % | | | 67 | % | | | 65 | % | | | 66 | % | | | 63 | % |
Distributors | | | 24 | % | | | 24 | % | | | 26 | % | | | 23 | % | | | 24 | % | | | 24 | % | | | 25 | % | | | 23 | % | | | 24 | % | | | 23 | % | | | 23 | % | | | 21 | % | | | 21 | % | | | 21 | % | | | 22 | % | | | 19 | % |
Retail | | | 13 | % | | | 15 | % | | | 14 | % | | | 11 | % | | | 12 | % | | | 14 | % | | | 13 | % | | | 12 | % | | | 13 | % | | | 14 | % | | | 13 | % | | | 12 | % | | | 12 | % | | | 14 | % | | | 12 | % | | | 18 | % |
Revenue by Geography Americas | | | 23 | % | | | 27 | % | | | 27 | % | | | 28 | % | | | 26 | % | | | 25 | % | | | 25 | % | | | 24 | % | | | 27 | % | | | 27 | % | | | 29 | % | | | 32 | % | | | 30 | % | | | 31 | % | | | 30 | % | | | 38 | % |
EMEA | | | 18 | % | | | 23 | % | | | 22 | % | | | 19 | % | | | 20 | % | | | 23 | % | | | 21 | % | | | 20 | % | | | 21 | % | | | 24 | % | | | 21 | % | | | 21 | % | | | 21 | % | | | 23 | % | | | 23 | % | | | 19 | % |
Asia/ANZ | | | 59 | % | | | 50 | % | | | 51 | % | | | 53 | % | | | 54 | % | | | 52 | % | | | 54 | % | | | 56 | % | | | 52 | % | | | 49 | % | | | 50 | % | | | 47 | % | | | 49 | % | | | 46 | % | | | 47 | % | | | 43 | % |
Revenue Client Devices14 | | $ | 2,650 | | | $ | 2,259 | | | $ | 2,168 | | | $ | 2,109 | | | $ | 2,198 | | | $ | 2,226 | | | $ | 2,126 | | | $ | 2,170 | | | $ | 2,255 | | | $ | 2,089 | | | $ | 1,820 | | | $ | 1,546 | | | $ | 1,670 | | | $ | 1,581 | | | $ | 1,370 | | | $ | 1,584 | |
Client Solutions14 | | | 500 | | | | 568 | | | | 500 | | | | 401 | | | | 455 | | | | 543 | | | | 479 | | | | 444 | | | | 504 | | | | 528 | | | | 452 | | | | 366 | | | | 399 | | | | 459 | | | | 346 | | | | 666 | |
Data Center Devices & Solutions14 | | | 885 | | | | 997 | | | | 1,096 | | | | 1,218 | | | | 1,151 | | | | 1,203 | | | | 1,098 | | | | 1,037 | | | | 1,184 | | | | 1,271 | | | | 1,278 | | | | 1,279 | | | | 1,291 | | | | 1,277 | | | | 1,106 | | | | 1,245 | |
| | | | | | | | | | | | | | | | | | | | | | | | | | | | | | | | | | | | | | | | | | | | | | | | | | | | | | | | | | | | | | | | |
Total Revenue | | $ | 4,035 | | | $ | 3,824 | | | $ | 3,764 | | | $ | 3,728 | | | $ | 3,804 | | | $ | 3,972 | | | $ | 3,703 | | | $ | 3,651 | | | $ | 3,943 | | | $ | 3,888 | | | $ | 3,550 | | | $ | 3,191 | | | $ | 3,360 | | | $ | 3,317 | | | $ | 2,822 | | | $ | 3,495 | |
Exabytes Shipped Client Devices | | | 28.0 | | | | 28.0 | | | | 28.1 | | | | 27.9 | | | | 30.4 | | | | 33.0 | | | | 32.9 | | | | 34.8 | | | | 39.1 | | | | 37.6 | | | | 34.3 | | | | 30.5 | | | | 34.3 | | | | 35.3 | | | | 31.7 | | | | 32.0 | |
Client Solutions | | | 7.0 | | | | 8.7 | | | | 7.9 | | | | 6.8 | | | | 7.9 | | | | 9.6 | | | | 8.6 | | | | 8.2 | | | | 9.8 | | | | 11.0 | | | | 9.6 | | | | 8.2 | | | | 9.2 | | | | 11.3 | | | | 8.5 | | | | 9.5 | |
Data Center Devices & Solutions | | | 9.3 | | | | 10.9 | | | | 12.4 | | | | 13.0 | | | | 12.5 | | | | 12.5 | | | | 12.1 | | | | 12.2 | | | | 15.9 | | | | 17.8 | | | | 17.4 | | | | 17.5 | | | | 20.0 | | | | 22.5 | | | | 22.8 | | | | 24.6 | |
| | | | | | | | | | | | | | | | | | | | | | | | | | | | | | | | | | | | | | | | | | | | | | | | | | | | | | | | | | | | | | | | |
Total Exabytes Shipped13 | | | 44.3 | | | | 47.6 | | | | 48.4 | | | | 47.7 | | | | 50.8 | | | | 55.1 | | | | 53.6 | | | | 55.2 | | | | 64.8 | | | | 66.4 | | | | 61.3 | | | | 56.2 | | | | 63.5 | | | | 69.1 | | | | 63.0 | | | | 66.1 | |
R4Q EB Shipped | | | 45.9 | | | | 93.0 | | | | 140.8 | | | | 188.0 | | | | 194.5 | | | | 202.0 | | | | 207.2 | | | | 214.7 | | | | 228.7 | | | | 240.0 | | | | 247.7 | | | | 248.7 | | | | 247.4 | | | | 250.1 | | | | 251.8 | | | | 261.7 | |
HDD TAM | | | 139.1 | | | | 135.8 | | | | 135.9 | | | | 133.3 | | | | 140.2 | | | | 142.2 | | | | 138.1 | | | | 138.0 | | | | 147.3 | | | | 140.8 | | | | 125.0 | | | | 111.0 | | | | 118.7 | | | | 115.1 | | | | 100.5 | | | | 98.5 | |
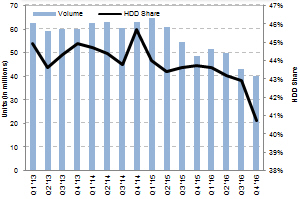
HDD Share | | | 44.9 | % | | | 43.6 | % | | | 44.3 | % | | | 44.9 | % | | | 44.7 | % | | | 44.4 | % | | | 43.8 | % | | | 45.7 | % | | | 44.0 | % | | | 43.4 | % | | | 43.6 | % | | | 43.7 | % | | | 43.6 | % | | | 43.2 | % | | | 42.9 | % | | | 40.7 | % |
HDD Units2 | | | 62.5 | | | | 59.2 | | | | 60.2 | | | | 59.9 | | | | 62.6 | | | | 63.1 | | | | 60.4 | | | | 63.1 | | | | 64.7 | | | | 61.0 | | | | 54.5 | | | | 48.5 | | | | 51.7 | | | | 49.7 | | | | 43.1 | | | | 40.1 | |
HDD ASP | | $ | 62 | | | $ | 62 | | | $ | 61 | | | $ | 60 | | | $ | 58 | | | $ | 60 | | | $ | 58 | | | $ | 56 | | | $ | 58 | | | $ | 60 | | | $ | 61 | | | $ | 60 | | | $ | 60 | | | $ | 61 | | | $ | 60 | | | $ | 63 | |
HDD PC Units5 HDD Notebook Units | | | 25.887 | | | | 21.300 | | | | 21.547 | | | | 23.989 | | | | 22.912 | | | | 22.662 | | | | 21.814 | | | | 22.899 | | | | 23.396 | | | | 21.178 | | | | 18.785 | | | | 15.513 | | | | 15.804 | | | | 15.318 | | | | 13.577 | | | | 11.449 | |
HDD Desktop Units | | | 16.819 | | | | 17.717 | | | | 18.383 | | | | 16.185 | | | | 17.307 | | | | 16.825 | | | | 16.635 | | | | 16.182 | | | | 16.320 | | | | 15.375 | | | | 13.523 | | | | 11.601 | | | | 11.683 | | | | 12.458 | | | | 10.681 | | | | 7.924 | |
HDD Non-PC Units HDD Consumer Electronics Units4 | | | 8.019 | | | | 6.452 | | | | 6.517 | | | | 6.544 | | | | 8.474 | | | | 8.794 | | | | 8.573 | | | | 10.906 | | | | 10.485 | | | | 9.295 | | | | 8.610 | | | | 9.056 | | | | 11.484 | | | | 8.461 | | | | 7.318 | | | | 10.038 | |
HDD Branded Units | | | 5.767 | | | | 7.139 | | | | 6.517 | | | | 5.281 | | | | 6.146 | | | | 7.018 | | | | 6.272 | | | | 6.012 | | | | 6.780 | | | | 7.156 | | | | 6.090 | | | | 5.151 | | | | 5.575 | | | | 6.443 | | | | 5.157 | | | | 4.709 | |
HDD Enterprise Units | | | 5.988 | | | | 6.633 | | | | 7.211 | | | | 7.897 | | | | 7.771 | | | | 7.783 | | | | 7.129 | | | | 7.098 | | | | 7.763 | | | | 8.041 | | | | 7.519 | | | | 7.199 | | | | 7.185 | | | | 7.008 | | | | 6.390 | | | | 5.994 | |
| | | | | | | | | | | | | | | | | | | | | | | | | | | | | | | | | | | | | | | | | | | | | | | | | | | | | | | | | | | | | | | | |
Total HDD Units | | | 62.480 | | | | 59.241 | | | | 60.175 | | | | 59.896 | | | | 62.610 | | | | 63.082 | | | | 60.423 | | | | 63.097 | | | | 64.744 | | | | 61.045 | | | | 54.527 | | | | 48.520 | | | | 51.731 | | | | 49.688 | | | | 43.123 | | | | 40.114 | |
| | | | |
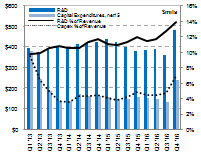
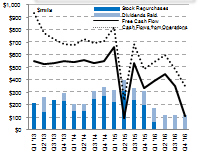
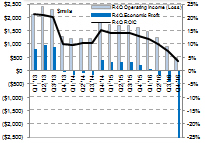
| Volume and HDD Share2 | | Revenue, GAAP and Non-GAAP Gross Margin10 | | GAAP & Non-GAAP EPS Analysis |
 | |  | |  |
| | |
| Note: Refer to “Non-GAAP Financial Measures” for information about non-GAAP financial measures included in this quarterly fact sheet. | | | | |
| | | | |
| Page 1 | | Quarterly Fact Sheet – Q4 FY16 | |  |
| | | | | | | | | | | | | | | | | | | | | | | | | | | | | | | | | | | | | | | | | | | | | | | | | | | | | | | | | | | | | | | | |
Balance sheet, cash flows, earnings, dividends and
share repurchase amounts in millions | | Q1
FY13 | | | Q2
FY13 | | | Q3
FY13 | | | Q4
FY13 | | | Q1
FY14 | | | Q2
FY14 | | | Q3
FY14 | | | Q4
FY14 | | | Q1
FY15 | | | Q2
FY15 | | | Q3
FY15 | | | Q4
FY15 | | | Q1
FY16 | | | Q2
FY16 | | | Q3
FY16 | | | Q4
FY16 | |
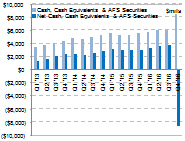
Cash and Cash Equivalents | | $ | 3,537 | | | $ | 3,816 | | | $ | 4,060 | | | $ | 4,309 | | | $ | 4,869 | | | $ | 4,655 | | | $ | 4,569 | | | $ | 4,804 | | | $ | 5,159 | | | $ | 4,902 | | | $ | 4,812 | | | $ | 5,024 | | | $ | 5,081 | | | $ | 5,363 | | | $ | 5,887 | | | $ | 8,151 | |
Available-for-Sale (AFS) Securities | | | — | | | | — | | | | — | | | | — | | | | — | | | | — | | | | 470 | | | | 499 | | | | 454 | | | | 465 | | | | 523 | | | | 590 | | | | 704 | | | | 732 | | | | 146 | | | | 345 | |
Debt | | | (2,128 | ) | | | (2,128 | ) | | | (2,013 | ) | | | (1,955 | ) | | | (2,398 | ) | | | (2,340 | ) | | | (2,469 | ) | | | (2,438 | ) | | | (2,406 | ) | | | (2,375 | ) | | | (2,344 | ) | | | (2,567 | ) | | | (2,536 | ) | | | (2,505 | ) | | | (2,203 | ) | | | (16,994 | ) |
| | | | | | | | | | | | | | | | | | | | | | | | | | | | | | | | | | | | | | | | | | | | | | | | | | | | | | | | | | | | | | | | |
Net Cash, Cash Equivalents & AFS Securities | | $ | 1,409 | | | $ | 1,688 | | | $ | 2,047 | | | $ | 2,354 | | | $ | 2,471 | | | $ | 2,315 | | | $ | 2,570 | | | $ | 2,865 | | | $ | 3,207 | | | $ | 2,992 | | | $ | 2,991 | | | $ | 3,047 | | | $ | 3,249 | | | $ | 3,590 | | | $ | 3,830 | | | $ | (8,498 | ) |
Cash Flow From Operations | | $ | 936 | | | $ | 772 | | | $ | 727 | | | $ | 684 | | | $ | 680 | | | $ | 727 | | | $ | 697 | | | $ | 713 | | | $ | 827 | | | $ | 243 | | | $ | 684 | | | $ | 488 | | | $ | 545 | | | $ | 598 | | | $ | 485 | | | $ | 355 | |
Free Cash Flow | | $ | 554 | | | $ | 526 | | | $ | 539 | | | $ | 548 | | | $ | 544 | | | $ | 557 | | | $ | 536 | | | $ | 552 | | | $ | 667 | | | $ | 97 | | | $ | 534 | | | $ | 332 | | | $ | 394 | | | $ | 449 | | | $ | 352 | | | $ | 114 | |
Capital Expenditures, net15 | | $ | 382 | | | $ | 246 | | | $ | 188 | | | $ | 136 | | | $ | 136 | | | $ | 170 | | | $ | 161 | | | $ | 161 | | | $ | 160 | | | $ | 146 | | | $ | 150 | | | $ | 156 | | | $ | 151 | | | $ | 149 | | | $ | 133 | | | $ | 241 | |
Depreciation and Amortization | | $ | 313 | | | $ | 309 | | | $ | 309 | | | $ | 302 | | | $ | 312 | | | $ | 317 | | | $ | 307 | | | $ | 308 | | | $ | 289 | | | $ | 290 | | | $ | 285 | | | $ | 250 | | | $ | 236 | | | $ | 252 | | | $ | 246 | | | $ | 420 | |
EBITDA | | $ | 905 | | | $ | 787 | | | $ | 726 | | | $ | 81 | | | $ | 854 | | | $ | 795 | | | $ | 726 | | | $ | 660 | | | $ | 758 | | | $ | 756 | | | $ | 706 | | | $ | 505 | | | $ | 558 | | | $ | 503 | | | $ | 334 | | | $ | 240 | |
Accounts Receivable, Net | | $ | 1,951 | | | $ | 1,732 | | | $ | 1,700 | | | $ | 1,793 | | | $ | 1,791 | | | $ | 1,959 | | | $ | 1,802 | | | $ | 1,989 | | | $ | 1,915 | | | $ | 1,880 | | | $ | 1,696 | | | $ | 1,532 | | | $ | 1,616 | | | $ | 1,650 | | | $ | 1,254 | | | $ | 1,461 | |
Inventory Raw Materials | | $ | 237 | | | $ | 193 | | | $ | 191 | | | $ | 167 | | | $ | 208 | | | $ | 201 | | | $ | 204 | | | $ | 168 | | | $ | 178 | | | $ | 154 | | | $ | 173 | | | $ | 168 | | | $ | 135 | | | $ | 130 | | | $ | 133 | | | $ | 571 | |
Work in Process | | | 559 | | | | 581 | | | | 583 | | | | 575 | | | | 579 | | | | 581 | | | | 519 | | | | 493 | | | | 509 | | | | 510 | | | | 498 | | | | 500 | | | | 507 | | | | 474 | | | | 440 | | | | 636 | |
Finished Goods | | | 508 | | | | 430 | | | | 423 | | | | 446 | | | | 457 | | | | 511 | | | | 554 | | | | 565 | | | | 585 | | | | 618 | | | | 651 | | | | 700 | | | | 618 | | | | 634 | | | | 654 | | | | 922 | |
| | | | | | | | | | | | | | | | | | | | | | | | | | | | | | | | | | | | | | | | | | | | | | | | | | | | | | | | | | | | | | | | |
Total Inventory | | $ | 1,304 | | | $ | 1,204 | | | $ | 1,197 | | | $ | 1,188 | | | $ | 1,244 | | | $ | 1,293 | | | $ | 1,277 | | | $ | 1,226 | | | $ | 1,272 | | | $ | 1,282 | | | $ | 1,322 | | | $ | 1,368 | | | $ | 1,260 | | | $ | 1,238 | | | $ | 1,227 | | | $ | 2,129 | |
Property, Plant and Equipment, Net | | $ | 4,027 | | | $ | 3,938 | | | $ | 3,803 | | | $ | 3,700 | | | $ | 3,638 | | | $ | 3,509 | | | $ | 3,406 | | | $ | 3,293 | | | $ | 3,202 | | | $ | 3,099 | | | $ | 3,051 | | | $ | 2,965 | | | $ | 2,890 | | | $ | 2,801 | | | $ | 2,687 | | | $ | 3,508 | |
Accounts Payable | | $ | 2,545 | | | $ | 2,185 | | | $ | 2,037 | | | $ | 1,990 | | | $ | 2,061 | | | $ | 2,106 | | | $ | 1,902 | | | $ | 1,971 | | | $ | 2,016 | | | $ | 2,071 | | | $ | 2,020 | | | $ | 1,881 | | | $ | 1,799 | | | $ | 1,806 | | | $ | 1,571 | | | $ | 1,888 | |
Accounts Payable to Related Parties | | $ | — | | | $ | — | | | $ | — | | | $ | — | | | $ | — | | | $ | — | | | $ | — | | | $ | — | | | $ | — | | | $ | — | | | $ | — | | | $ | — | | | $ | — | | | $ | — | | | $ | — | | | $ | 168 | |
Days Sales Outstanding11 | | | 44 | | | | 41 | | | | 41 | | | | 44 | | | | 43 | | | | 45 | | | | 44 | | | | 50 | | | | 48 | | | | 44 | | | | 44 | | | | 44 | | | | 44 | | | | 45 | | | | 40 | | | | 38 | |
Days Inventory Outstanding11 | | | 42 | | | | 40 | | | | 40 | | | | 40 | | | | 42 | | | | 42 | | | | 44 | | | | 42 | | | | 45 | | | | 42 | | | | 48 | | | | 55 | | | | 48 | | | | 47 | | | | 54 | | | | 72 | |
Days Payables Outstanding11 | | | 82 | | | | 72 | | | | 69 | | | | 67 | | | | 69 | | | | 68 | | | | 65 | | | | 68 | | | | 71 | | | | 68 | | | | 73 | | | | 76 | | | | 68 | | | | 68 | | | | 69 | | | | 70 | |
Cash Conversion Cycle11 | | | 4 | | | | 9 | | | | 12 | | | | 17 | | | | 16 | | | | 19 | | | | 23 | | | | 24 | | | | 22 | | | | 18 | | | | 19 | | | | 23 | | | | 24 | | | | 24 | | | | 25 | | | | 40 | |
Inventory Turns11 | | | 9 | | | | 9 | | | | 9 | | | | 9 | | | | 9 | | | | 9 | | | | 8 | | | | 9 | | | | 8 | | | | 9 | | | | 8 | | | | 7 | | | | 8 | | | | 8 | | | | 7 | | | | 5 | |
Dividends Paid | | $ | — | | | $ | 121 | | | $ | — | | | $ | 60 | | | $ | 59 | | | $ | 59 | | | $ | 71 | | | $ | 70 | | | $ | 94 | | | $ | 94 | | | $ | 93 | | | $ | 116 | | | $ | 115 | | | $ | 116 | | | $ | 116 | | | $ | 116 | |
Shares Repurchased | | | 5.2 | | | | 4.2 | | | | 5.2 | | | | 4.4 | | | | 2.3 | | | | 2.0 | | | | 2.8 | | | | 3.2 | | | | 2.2 | | | | 3.2 | | | | 2.2 | | | | 2.0 | | | | 0.7 | | | | — | | | | — | | | | — | |
Shares Repurchased | | $ | 218 | | | $ | 146 | | | $ | 243 | | | $ | 235 | | | $ | 150 | | | $ | 150 | | | $ | 244 | | | $ | 272 | | | $ | 223 | | | $ | 309 | | | $ | 240 | | | $ | 198 | | | $ | 60 | | | $ | — | | | $ | — | | | $ | — | |
Remaining Amount Authorized | | $ | 2,594 | | | $ | 2,448 | | | $ | 2,205 | | | $ | 1,970 | | | $ | 1,820 | | | $ | 1,670 | | | $ | 1,426 | | | $ | 1,154 | | | $ | 931 | | | $ | 622 | | | $ | 2,382 | | | $ | 2,184 | | | $ | 2,124 | | | $ | 2,124 | | | $ | 2,124 | | | $ | 2,124 | |
R4Q Economic Profit8 | | $ | 801 | | | $ | 976 | | | $ | 884 | | | $ | (59 | ) | | $ | (176 | ) | | $ | (109 | ) | | $ | (158 | ) | | $ | 415 | | | $ | 332 | | | $ | 328 | | | $ | 320 | | | $ | 203 | | | $ | 52 | | | $ | (157 | ) | | $ | (440 | ) | | $ | (2,527 | ) |
R4Q ROIC8 | | | 21.3 | % | | | 21.0 | % | | | 20.0 | % | | | 10.1 | % | | | 9.7 | % | | | 10.5 | % | | | 10.2 | % | | | 15.1 | % | | | 14.2 | % | | | 14.1 | % | | | 14.1 | % | | | 13.1 | % | | | 11.7 | % | | | 10.0 | % | | | 7.4 | % | | | 3.6 | % |
R4Q ROA8 | | | 14.9 | % | | | 14.7 | % | | | 14.2 | % | | | 7.0 | % | | | 6.7 | % | | | 7.2 | % | | | 7.0 | % | | | 10.6 | % | | | 10.0 | % | | | 10.1 | % | | | 10.2 | % | | | 9.6 | % | | | 8.7 | % | | | 7.5 | % | | | 5.4 | % | | | 1.3 | % |
Worldwide Headcount3 | | | 96,002 | | | | 93,820 | | | | 87,565 | | | | 85,777 | | | | 87,586 | | | | 87,976 | | | | 84,556 | | | | 84,072 | | | | 83,277 | | | | 83,993 | | | | 80,767 | | | | 76,449 | | | | 76,052 | | | | 74,891 | | | | 67,884 | | | | 72,878 | |
| | | | | | |
Gross vs. Net Cash, Cash
Equivalents & AFS Securities | | R&D10 and Capital
Expenditures | | Free Cash Flow & Cash Flow
from Operatations | | R4Q ROIC, R4Q Economic
Profit & R4Q Operating Income8 |
 | |  | |  | |  |
| Note: Refer to “Non-GAAP Financial Measures” for information about non-GAAP financial measures included in this quarterly fact sheet. | | | | | | |
| | | | |
| Page 2 | | Quarterly Fact Sheet – Q4 FY16 | | |
Debt Tranches and Interest Rates
| | | | | | | | | | | | | | | | | | | | | | | | |
Debt | | Base Rate | | | Tenor | | | Maturity | | | Original Principal
Amount | | | Balance
Outstanding
as of 7/1/16A | | | Indicative Rates
bpsB | |
Revolver drawnC | | | L+200 | | | | 5 years | | | | | | | $ | 0 | | | $ | 0 | | | | 2.468 | % |
Bridge Loan | | | L+200 | | | | 7/26/2016 | D | | | | | | $ | 3,000 | | | $ | 3,000 | | | | 2.468 | % |
Term Loan A (floor of 0bps) | | | L+200 | | | | 5 years | | | | April 29, 2021 | | | $ | 4,125 | | | $ | 4,125 | | | | 2.468 | % |
Term Loan B Dollar (floor of 75bps) | | | L+550 | | | | 7 years | | | | April 29, 2023 | | | $ | 3,750 | | | $ | 3,750 | | | | 6.250 | % |
Term Loan B Euro (floor of 75 bps)E | | | E+525 | | | | 7 years | | | | April 29, 2023 | | | $ | 987 | | | $ | 987 | | | | 6.000 | % |
Sr. Secured Notes Due 2023F | | | 7.375 | % | | | 7 years | | | | April 1, 2023 | | | $ | 1,875 | | | $ | 1,875 | | | | 7.375 | % |
Sr. Unsecured Notes Due 2024F | | | 10.500 | % | | | 8 years | | | | April 1, 2024 | | | $ | 3,350 | | | $ | 3,350 | | | | 10.500 | % |
| | | | | | | | | | | | | | | | | | | | | | | | |
Total | | | | | | | | | | | | | | $ | 17,087 | | | $ | 17,087 | | | | 5.615 | %G |
| | | | | | | | | | | | | | | | | | | | | | | | |
Weighted average interest rate excluding the Bridge Loan | | | | | | | | | | | | | | | | 6.285 | %G |
| A | Excluding Original Issue Discount and fees |
| B | L = 1 Month LIBOR, E = 1 Month EURIBOR |
| B | Based on current leverage ratios |
| C | Revolver capacity: $1,000M |
| D | Cash bridge contractual maturity date—Paid off on July 21, 2016 |
| E | Principal in EURO denominated debt = Euro 885M, converted at Fiscal Month EUR/USD balance sheet rate of 1.11508 |
| F | Notes are callable in 3 years (starting April 1, 2019) |
| G | Weighted average interest rate as of July 1, 2016 |
The schedule above excludes convertible debt assumed in connection with the acquisition of SanDisk
| | |
Estimated Effective Tax Ranges (Non-GAAP) | | |
| FY17 : | | 15% - 20% |
| FY18 – FY23 : | | 10% - 15% |
| Beyond FY23 : | | 7% - 10% |
| | | | |
| Page 3 | | Quarterly Fact Sheet – Q4 FY16 | | |
| | | | | | | | | | | | | | | | | | | | | | | | | | | | | | | | | | | | | | | | | | | | | | | | | | | | | | | | | | | | | | | | |
In millions, except gross margin and per share amounts | | Q1
FY13 | | | Q2
FY13 | | | Q3
FY13 | | | Q4
FY13 | | | Q1
FY14 | | | Q2
FY14 | | | Q3
FY14 | | | Q4
FY14 | | | Q1
FY15 | | | Q2
FY15 | | | Q3
FY15 | | | Q4
FY15 | | | Q1
FY16 | | | Q2
FY16 | | | Q3
FY16 | | | Q4
FY16 | |
Reconciliation of Cash Flows from Operations to Free Cash Flow | | | | | | | | | | | | | | | | | | | | | | | | | | | | | | | | | | | | | | | | | | | | | | | | | | | | | | | | | | | | | | | | |
Cash Flows from Operations | | $ | 936 | | | $ | 772 | | | $ | 727 | | | $ | 684 | | | $ | 680 | | | $ | 727 | | | $ | 697 | | | $ | 713 | | | $ | 827 | | | $ | 243 | | | $ | 684 | | | $ | 488 | | | $ | 545 | | | $ | 598 | | | $ | 485 | | | $ | 355 | |
Purchases of Property, Plant and Equipment, net | | | (382 | ) | | | (246 | ) | | | (188 | ) | | | (136 | ) | | | (136 | ) | | | (170 | ) | | | (161 | ) | | | (161 | ) | | | (160 | ) | | | (146 | ) | | | (150 | ) | | | (156 | ) | | | (151 | ) | | | (149 | ) | | | (133 | ) | | $ | (151 | ) |
Note Receivable with Flash Ventures, net | | | — | | | | — | | | | — | | | | — | | | | — | | | | — | | | | — | | | | — | | | | — | | | | — | | | | — | | | | — | | | | — | | | | — | | | | — | | | | (90 | ) |
| | | | | | | | | | | | | | | | | | | | | | | | | | | | | | | | | | | | | | | | | | | | | | | | | | | | | | | | | | | | | | | | |
Free Cash Flow | | $ | 554 | | | $ | 526 | | | $ | 539 | | | $ | 548 | | | $ | 544 | | | $ | 557 | | | $ | 536 | | | $ | 552 | | | $ | 667 | | | $ | 97 | | | $ | 534 | | | $ | 332 | | | $ | 394 | | | $ | 449 | | | $ | 352 | | | $ | 114 | |
Reconciliation of Net Income to EBITDA | | | | | | | | | | | | | | | | | | | | | | | | | | | | | | | | | | | | | | | | | | | | | | | | | | | | | | | | | | | | | | | | |
Net Income (Loss) | | $ | 519 | | | $ | 335 | | | $ | 391 | | | $ | (265 | ) | | $ | 495 | | | $ | 430 | | | $ | 375 | | | $ | 317 | | | $ | 423 | | | $ | 438 | | | $ | 384 | | | $ | 220 | | | $ | 283 | | | $ | 251 | | | $ | 74 | | | $ | (351 | ) |
Interest and Other Expense, net | | | 14 | | | | 10 | | | | 11 | | | | 9 | | | | 10 | | | | 11 | | | | 13 | | | | 5 | | | | 9 | | | | 8 | | | | 9 | | | | 8 | | | | 8 | | | | 7 | | | | 8 | | | | 290 | |
Income Tax Expense (Benefit) | | | 59 | | | | 133 | | | | 15 | | | | 35 | | | | 37 | | | | 37 | | | | 31 | | | | 30 | | | | 37 | | | | 20 | | | | 28 | | | | 27 | | | | 31 | | | | (7 | ) | | | 6 | | | | (119 | ) |
Depreciation and Amortization | | | 313 | | | | 309 | | | | 309 | | | | 302 | | | | 312 | | | | 317 | | | | 307 | | | | 308 | | | | 289 | | | | 290 | | | | 285 | | | | 250 | | | | 236 | | | | 252 | | | | 246 | | | | 420 | |
| | | | | | | | | | | | | | | | | | | | | | | | | | | | | | | | | | | | | | | | | | | | | | | | | | | | | | | | | | | | | | | | |
EBITDA | | $ | 905 | | | $ | 787 | | | $ | 726 | | | $ | 81 | | | $ | 854 | | | $ | 795 | | | $ | 726 | | | $ | 660 | | | $ | 758 | | | $ | 756 | | | $ | 706 | | | $ | 505 | | | $ | 558 | | | $ | 503 | | | $ | 334 | | | $ | 240 | |
Reconciliation of Operating Income (Loss) to | | | | | | | | | | | | | | | | | | | | | | | | | | | | | | | | | | | | | | | | | | | | | | | | | | | | | | | | | | | | | | | | |
R4Q Economic Profit | | | | | | | | | | | | | | | | | | | | | | | | | | | | | | | | | | | | | | | | | | | | | | | | | | | | | | | | | | | | | | | | |
Operating Income (Loss) | | $ | 592 | | | $ | 478 | | | $ | 417 | | | $ | (221 | ) | | $ | 542 | | | $ | 478 | | | $ | 419 | | | $ | 352 | | | $ | 469 | | | $ | 466 | | | $ | 421 | | | $ | 255 | | | $ | 322 | | | $ | 251 | | | $ | 88 | | | $ | (180 | ) |
Income Tax (Expense) Benefit | | | (59 | ) | | | (133 | ) | | | (15 | ) | | | (35 | ) | | | (37 | ) | | | (37 | ) | | | (31 | ) | | | (30 | ) | | | (37 | ) | | | (20 | ) | | | (28 | ) | | | (27 | ) | | | (31 | ) | | | 7 | | | | (6 | ) | | | 119 | |
| | | | | | | | | | | | | | | | | | | | | | | | | | | | | | | | | | | | | | | | | | | | | | | | | | | | | | | | | | | | | | | | |
Net Operating Profit After Taxes | | | 533 | | | | 345 | | | | 402 | | | | (256 | ) | | | 505 | | | | 441 | | | | 388 | | | | 322 | | | | 432 | | | | 446 | | | | 393 | | | | 228 | | | | 291 | | | | 258 | | | | 82 | | | | (61 | ) |
R4Q Net Operating Profit After Taxes | | | 1,919 | | | | 2,117 | | | | 2,032 | | | | 1,024 | | | | 996 | | | | 1,092 | | | | 1,078 | | | | 1,656 | | | | 1,583 | | | | 1,588 | | | | 1,593 | | | | 1,499 | | | | 1,358 | | | | 1,170 | | | | 859 | | | | 570 | |
Invested Capital x WACC | | | (1,118 | ) | | | (1,141 | ) | | | (1,148 | ) | | | (1,083 | ) | | | (1,172 | ) | | | (1,201 | ) | | | (1,236 | ) | | | (1,241 | ) | | | (1,251 | ) | | | (1,260 | ) | | | (1,273 | ) | | | (1,296 | ) | | | (1,306 | ) | | | (1,327 | ) | | | (1,299 | ) | | | (3,097 | ) |
| | | | | | | | | | | | | | | | | | | | | | | | | | | | | | | | | | | | | | | | | | | | | | | | | | | | | | | | | | | | | | | | |
R4Q Economic Profit | | $ | 801 | | | $ | 976 | | | $ | 884 | | | $ | (59 | ) | | $ | (176 | ) | | $ | (109 | ) | | $ | (158 | ) | | $ | 415 | | | $ | 332 | | | $ | 328 | | | $ | 320 | | | $ | 203 | | | $ | 52 | | | $ | (157 | ) | | $ | (440 | ) | | $ | (2,527 | ) |
Reconciliation of Gross Margin to Non-GAAP Gross Margin & | | | | | | | | | | | | | | | | | | | | | | | | | | | | | | | | | | | | | | | | | | | | | | | | | | | | | | | | | | | | | | | | |
Gross Profit to Non-GAAP Gross Profit | | | | | | | | | | | | | | | | | | | | | | | | | | | | | | | | | | | | | | | | | | | | | | | | | | | | | | | | | | | | | | | | |
Gross Profit10 | | $ | 1,193 | | | $ | 1,059 | | | $ | 1,061 | | | $ | 1,050 | | | $ | 1,099 | | | $ | 1,156 | | | $ | 1,076 | | | $ | 1,029 | | | $ | 1,149 | | | $ | 1,110 | | | $ | 1,032 | | | $ | 930 | | | $ | 955 | | | $ | 906 | | | $ | 753 | | | $ | 821 | |
Acquisition-related charges | | | — | | | | — | | | | — | | | | — | | | | — | | | | — | | | | — | | | | — | | | | — | | | | — | | | | — | | | | — | | | | — | | | | — | | | | — | | | | 122 | |
Charges related to cost saving initiatives | | | — | | | | — | | | | — | | | | — | | | | — | | | | — | | | | — | | | | — | | | | — | | | | — | | | | — | | | | — | | | | — | | | | 22 | | | | 25 | | | | 27 | |
Other charges | | | — | | | | — | | | | — | | | | — | | | | — | | | | — | | | | — | | | | 10 | | | | — | | | | 39 | | | | — | | | | 1 | | | | — | | | | — | | | | — | | | | — | |
Amortization of acquired intangible assets | | | 38 | | | | 38 | | | | 38 | | | | 35 | | | | 36 | | | | 40 | | | | 39 | | | | 39 | | | | 39 | | | | 38 | | | | 37 | | | | 20 | | | | 17 | | | | 16 | | | | 16 | | | | 114 | |
| | | | | | | | | | | | | | | | | | | | | | | | | | | | | | | | | | | | | | | | | | | | | | | | | | | | | | | | | | | | | | | | |
Non-GAAP Gross Profit10 | | $ | 1,231 | | | $ | 1,097 | | | $ | 1,099 | | | $ | 1,085 | | | $ | 1,135 | | | $ | 1,196 | | | $ | 1,115 | | | $ | 1,078 | | | $ | 1,188 | | | $ | 1,187 | | | $ | 1,069 | | | $ | 951 | | | $ | 972 | | | $ | 944 | | | $ | 794 | | | $ | 1,084 | |
Revenue | | $ | 4,035 | | | $ | 3,824 | | | $ | 3,764 | | | $ | 3,728 | | | $ | 3,804 | | | $ | 3,972 | | | $ | 3,703 | | | $ | 3,651 | | | $ | 3,943 | | | $ | 3,888 | | | $ | 3,550 | | | $ | 3,191 | | | $ | 3,360 | | | $ | 3,317 | | | $ | 2,822 | | | $ | 3,495 | |
Gross Margin10 | | | 29.6 | % | | | 27.7 | % | | | 28.2 | % | | | 28.2 | % | | | 28.9 | % | | | 29.1 | % | | | 29.1 | % | | | 28.2 | % | | | 29.1 | % | | | 28.5 | % | | | 29.1 | % | | | 29.1 | % | | | 28.4 | % | | | 27.3 | % | | | 26.7 | % | | | 23.5 | % |
Non-GAAP Gross Margin10 | | | 30.5 | % | | | 28.7 | % | | | 29.2 | % | | | 29.1 | % | | | 29.8 | % | | | 30.1 | % | | | 30.1 | % | | | 29.5 | % | | | 30.1 | % | | | 30.5 | % | | | 30.1 | % | | | 29.8 | % | | | 28.9 | % | | | 28.5 | % | | | 28.1 | % | | | 31.0 | % |
Reconciliation of Operating Expenses to Non-GAAP | | | | | | | | | | | | | | | | | | | | | | | | | | | | | | | | | | | | | | | | | | | | | | | | | | | | | | | | | | | | | | | | |
Operating Expenses | | | | | | | | | | | | | | | | | | | | | | | | | | | | | | | | | | | | | | | | | | | | | | | | | | | | | | | | | | | | | | | | |
Total Operating Expenses | | $ | 601 | | | $ | 581 | | | $ | 644 | | | $ | 1,271 | | | $ | 557 | | | $ | 678 | | | $ | 657 | | | $ | 677 | | | $ | 680 | | | $ | 644 | | | $ | 611 | | | $ | 675 | | | $ | 633 | | | $ | 655 | | | $ | 665 | | | $ | 1,001 | |
Less: | | | | | | | | | | | | | | | | | | | | | | | | | | | | | | | | | | | | | | | | | | | | | | | | | | | | | | | | | | | | | | | | |
Amortization of acquired intangible assets | | | (11 | ) | | | (11 | ) | | | (11 | ) | | | (11 | ) | | | (11 | ) | | | (11 | ) | | | (11 | ) | | | (8 | ) | | | (7 | ) | | | (7 | ) | | | (7 | ) | | | (8 | ) | | | (8 | ) | | | (8 | ) | | | (6 | ) | | | (73 | ) |
Employee termination, asset impairment and other charges | | | (26 | ) | | | (41 | ) | | | (63 | ) | | | (8 | ) | | | (11 | ) | | | (23 | ) | | | (25 | ) | | | (26 | ) | | | (9 | ) | | | (36 | ) | | | (10 | ) | | | (104 | ) | | | (56 | ) | | | (27 | ) | | | (140 | ) | | | (117 | ) |
Charges related to cost saving initiatives | | | — | | | | — | | | | — | | | | — | | | | — | | | | — | | | | — | | | | — | | | | — | | | | — | | | | — | | | | — | | | | — | | | | (15 | ) | | | (24 | ) | | | (30 | ) |
Charges related to arbitration award | | | — | | | | — | | | | — | | | | (681 | ) | | | (13 | ) | | | (13 | ) | | | (13 | ) | | | (13 | ) | | | (14 | ) | | | (1 | ) | | | — | | | | — | | | | — | | | | (32 | ) | | | — | | | | — | |
Acquisition-related charges | | | — | | | | — | | | | — | | | | (7 | ) | | | (13 | ) | | | — | | | | — | | | | — | | | | — | | | | — | | | | (3 | ) | | | — | | | | — | | | | (27 | ) | | | (16 | ) | | | (116 | ) |
Charges and insurance recoveries related to flooding, net | | | — | | | | — | | | | — | | | | — | | | | 65 | | | | — | | | | — | | | | — | | | | — | | | | 37 | | | | — | | | | — | | | | — | | | | — | | | | — | | | | — | |
Other charges | | | — | | | | — | | | | (11 | ) | | | — | | | | — | | | | (15 | ) | | | (3 | ) | | | (32 | ) | | | (12 | ) | | | (17 | ) | | | — | | | | (3 | ) | | | (2 | ) | | | (4 | ) | | | (2 | ) | | | 26 | |
| | | | | | | | | | | | | | | | | | | | | | | | | | | | | | | | | | | | | | | | | | | | | | | | | | | | | | | | | | | | | | | | |
Non-GAAP Operating Expenses | | $ | 564 | | | $ | 529 | | | $ | 559 | | | $ | 564 | | | $ | 574 | | | $ | 616 | | | $ | 605 | | | $ | 598 | | | $ | 638 | | | $ | 620 | | | $ | 591 | | | $ | 560 | | | $ | 567 | | | $ | 542 | | | $ | 477 | | | $ | 691 | |
Reconciliation of Net Income (Loss) to Non-GAAP Net Income | | | | | | | | | | | | | | | | | | | | | | | | | | | | | | | | | | | | | | | | | | | | | | | | | | | | | | | | | | | | | | | | |
Net Income (Loss) | | $ | 519 | | | $ | 335 | | | $ | 391 | | | $ | (265 | ) | | $ | 495 | | | $ | 430 | | | $ | 375 | | | $ | 317 | | | $ | 423 | | | $ | 438 | | | $ | 384 | | | $ | 220 | | | $ | 283 | | | $ | 251 | | | $ | 74 | | | $ | (351 | ) |
Amortization of acquired intangible assets | | | 49 | | | | 49 | | | | 49 | | | | 46 | | | | 47 | | | | 51 | | | | 50 | | | | 47 | | | | 46 | | | | 45 | | | | 44 | | | | 28 | | | | 25 | | | | 24 | | | | 22 | | | | 187 | |
Employee termination, asset impairment and other charges | | | 26 | | | | 41 | | | | 63 | | | | 8 | | | | 11 | | | | 23 | | | | 25 | | | | 36 | | | | 9 | | | | 53 | | | | 10 | | | | 104 | | | | 56 | | | | 27 | | | | 140 | | | | 117 | |
Convertible Debt | | | — | | | | — | | | | — | | | | — | | | | — | | | | — | | | | — | | | | — | | | | — | | | | — | | | | — | | | | — | | | | — | | | | — | | | | — | | | | 58 | |
Charges related to cost saving initiatives | | | — | | | | — | | | | — | | | | — | | | | — | | | | — | | | | — | | | | — | | | | — | | | | — | | | | — | | | | — | | | | — | | | | 37 | | | | 49 | | | | 57 | |
Charges related to arbitration award | | | — | | | | — | | | | — | | | | 681 | | | | 13 | | | | 13 | | | | 13 | | | | 13 | | | | 14 | | | | 1 | | | | — | | | | — | | | | — | | | | 32 | | | | — | | | | — | |
Acquisition-related charges | | | — | | | | — | | | | — | | | | 7 | | | | 13 | | | | — | | | | — | | | | — | | | | — | | | | — | | | | 3 | | | | — | | | | — | | | | 27 | | | | 16 | | | | 238 | |
Charges and insurance recoveries related to flooding, net | | | — | | | | — | | | | — | | | | — | | | | (65 | ) | | | — | | | | — | | | | — | | | | — | | | | (37 | ) | | | — | | | | — | | | | — | | | | — | | | | — | | | | — | |
Other charges | | | — | | | | — | | | | 11 | | | | — | | | | — | | | | 15 | | | | 7 | | | | 32 | | | | 12 | | | | 39 | | | | — | | | | 4 | | | | 2 | | | | 4 | | | | 2 | | | | (3 | ) |
Income tax adjustments | | | — | | | | 88 | | | | — | | | | — | | | | — | | | | — | | | | — | | | | — | | | | — | | | | — | | | | — | | | | — | | | | — | | | | (28 | ) | | | (20 | ) | | | (95 | ) |
| | | | | | | | | | | | | | | | | | | | | | | | | | | | | | | | | | | | | | | | | | | | | | | | | | | | | | | | | | | | | | | | |
Non-GAAP Net Income | | $ | 594 | | | $ | 513 | | | $ | 514 | | | $ | 477 | | | $ | 514 | | | $ | 532 | | | $ | 470 | | | $ | 445 | | | $ | 504 | | | $ | 539 | | | $ | 441 | | | $ | 356 | | | $ | 366 | | | $ | 374 | | | $ | 283 | | | $ | 208 | |
EPS | | $ | 2.06 | | | $ | 1.36 | | | $ | 1.60 | | | $ | (1.12 | ) | | $ | 2.05 | | | $ | 1.77 | | | $ | 1.55 | | | $ | 1.32 | | | $ | 1.76 | | | $ | 1.84 | | | $ | 1.63 | | | $ | 0.94 | | | $ | 1.21 | | | $ | 1.07 | | | $ | 0.32 | | | $ | (1.34 | ) |
Non-GAAP EPS | | $ | 2.36 | | | $ | 2.09 | | | $ | 2.10 | | | $ | 1.96 | | | $ | 2.12 | | | $ | 2.19 | | | $ | 1.94 | | | $ | 1.85 | | | $ | 2.10 | | | $ | 2.26 | | | $ | 1.87 | | | $ | 1.51 | | | $ | 1.56 | | | $ | 1.60 | | | $ | 1.21 | | | $ | 0.79 | |
Diluted Shares Outstanding | | | 252 | | | | 246 | | | | 245 | | | | 236 | | | | 242 | | | | 243 | | | | 242 | | | | 241 | | | | 240 | | | | 238 | | | | 236 | | | | 235 | | | | 234 | | | | 234 | | | | 234 | | | | 261 | |
Non-GAAP Diluted Shares Outstanding6 | | | 252 | | | | 246 | | | | 245 | | | | 243 | | | | 242 | | | | 243 | | | | 242 | | | | 241 | | | | 240 | | | | 238 | | | | 236 | | | | 235 | | | | 234 | | | | 234 | | | | 234 | | | | 263 | |
Reconciliation of Income Tax Provision as a percentage of pre-tax | | | | | | | | | | | | | | | | | | | | | | | | | | | | | | | | | | | | | | | | | | | | | | | | | | | | | | | | | | | | | | | | |
income to Non-GAAP income tax provision as a percentage of | | | | | | | | | | | | | | | | | | | | | | | | | | | | | | | | | | | | | | | | | | | | | | | | | | | | | | | | | | | | | | | | |
non-GAAP pre-tax income | | | | | | | | | | | | | | | | | | | | | | | | | | | | | | | | | | | | | | | | | | | | | | | | | | | | | | | | | | | | | | | | |
Net income (loss) | | $ | 519 | | | $ | 335 | | | $ | 391 | | | $ | (265 | ) | | $ | 495 | | | $ | 430 | | | $ | 375 | | | $ | 317 | | | $ | 423 | | | $ | 438 | | | $ | 384 | | | $ | 220 | | | $ | 283 | | | $ | 251 | | | $ | 74 | | | $ | (351 | ) |
Income tax expense (benefit) | | | 59 | | | | 133 | | | | 15 | | | | 35 | | | | 37 | | | | 37 | | | | 31 | | | | 30 | | | | 37 | | | | 20 | | | | 28 | | | | 27 | | | | 31 | | | | (7 | ) | | | 6 | | | | (119 | ) |
| | | | | | | | | | | | | | | | | | | | | | | | | | | | | | | | | | | | | | | | | | | | | | | | | | | | | | | | | | | | | | | | |
Pre-tax income | | $ | 578 | | | $ | 468 | | | $ | 406 | | | $ | (230 | ) | | $ | 532 | | | $ | 467 | | | $ | 406 | | | $ | 347 | | | $ | 460 | | | $ | 458 | | | $ | 412 | | | $ | 247 | | | $ | 314 | | | $ | 244 | | | $ | 80 | | | $ | (470 | ) |
Income tax provision as a percentage of pre-tax income | | | 10 | % | | | 28 | % | | | 4 | % | | | -15 | % | | | 7 | % | | | 8 | % | | | 8 | % | | | 9 | % | | | 8 | % | | | 4 | % | | | 7 | % | | | 11 | % | | | 10 | % | | | -3 | % | | | 8 | % | | | 25 | % |
Non-GAAP Net Income | | $ | 594 | | | $ | 513 | | | $ | 514 | | | $ | 477 | | | $ | 514 | | | $ | 532 | | | $ | 470 | | | $ | 445 | | | $ | 504 | | | $ | 539 | | | $ | 441 | | | $ | 356 | | | $ | 366 | | | $ | 374 | | | $ | 283 | | | $ | 208 | |
Add: | | | | | | | | | | | | | | | | | | | | | | | | | | | | | | | | | | | | | | | | | | | | | | | | | | | | | | | | | | | | | | | | |
Income tax expense (benefit) | | | 59 | | | | 133 | | | | 15 | | | | 35 | | | | 37 | | | | 37 | | | | 31 | | | | 30 | | | | 37 | | | | 20 | | | | 28 | | | | 27 | | | | 31 | | | | (7 | ) | | | 6 | | | | (119 | ) |
Income tax adjustments | | | — | | | | (88 | ) | | | — | | | | — | | | | — | | | | — | | | | — | | | | — | | | | — | | | | — | | | | — | | | | — | | | | — | | | | 28 | | | | 20 | | | | 95 | |
| | | | | | | | | | | | | | | | | | | | | | | | | | | | | | | | | | | | | | | | | | | | | | | | | | | | | | | | | | | | | | | | |
Non-GAAP income tax expense (benefit) | | | 59 | | | | 45 | | | | 15 | | | | 35 | | | | 37 | | | | 37 | | | | 31 | | | | 30 | | | | 37 | | | | 20 | | | | 28 | | | | 27 | | | | 31 | | | | 21 | | | | 26 | | | | (24 | ) |
Non-GAAP pre-tax income | | $ | 653 | | | $ | 558 | | | $ | 529 | | | $ | 512 | | | $ | 551 | | | $ | 569 | | | $ | 501 | | | $ | 475 | | | $ | 541 | | | $ | 559 | | | $ | 469 | | | $ | 383 | | | $ | 397 | | | $ | 395 | | | $ | 309 | | | $ | 184 | |
Non-GAAP income tax provision as a percentage of pre-tax income | | | 9 | % | | | 8 | % | | | 3 | % | | | 7 | % | | | 7 | % | | | 7 | % | | | 6 | % | | | 6 | % | | | 7 | % | | | 4 | % | | | 6 | % | | | 7 | % | | | 8 | % | | | 5 | % | | | 8 | % | | | -13 | % |
| | | | |
| Page 4 | | Quarterly Fact Sheet – Q4 FY16 | | |
Non-GAAP Financial Measures
This Quarterly Fact Sheet contains non-GAAP financial measures. These non-GAAP measures are not in accordance with, or an alternative for, measures prepared in accordance with GAAP and may be different from non-GAAP measures used by other companies.
Free Cash Flow:Free cash flow is a non-GAAP financial measure defined as cash flows from operations less purchases of property, plant and equipment, net of proceeds from sales of property, plant, and equipment, and the net activity in notes receivable and investments in the Flash Ventures. We consider free cash flow to be useful as an indicator of our overall liquidity, as the amount of free cash flow generated in any period is representative of cash that is available for strategic opportunities including, among others, investing in the Company’s business, making strategic acquisitions, strengthening the balance sheet, repaying debt, paying dividends and repurchasing stock.
EBITDA: EBITDA is a non-GAAP financial measure defined as net income before interest, income tax expense, depreciation and amortization. We include information concerning EBITDA because we believe it is a useful measure to evaluate our operating performance. As a measure of our operating performance, we believe EBITDA provides a measure of operating results unaffected by differences in capital structures, capital investment cycles and ages of related assets among otherwise comparable companies.
Economic Profit:Economic profit (EP) is a non-GAAP financial measure defined as net operating profit after taxes less the value of invested capital multiplied by the weighted average cost of capital, where net operating profit after taxes is defined as income from operations minus tax expense and invested capital is defined as the sum of current debt, long-term debt and equity. Management uses EP to evaluate business performance and allocate resources, and it is a component in determining management’s incentive compensation. Management believes EP provides additional perspective to investors about financial returns generated by the business and represents profit generated over and above the cost of capital used by the business to generate that profit.
Non-GAAP Gross Margin and Non-GAAP Gross Profit:Non-GAAP gross margin is a non-GAAP measure defined as non-GAAP gross profit divided by revenue. Non-GAAP gross profit is a non-GAAP measure defined as gross profit before any charges to cost of goods sold that may not be indicative of ongoing operations. We believe that non-GAAP gross profit is a useful measure to investors as an alternative method for measuring our operating performance and comparing it against prior periods’ performance.
Non-GAAP Operating Expenses:Non-GAAP operating expenses is a non-GAAP measure defined as operating expenses before any charges that may not be indicative of ongoing operations. We believe that non-GAAP operating expenses is a useful measure to investors as an alternative method for measuring our expense management and comparing it against prior periods’ performance.
Non-GAAP Net Income and Non-GAAP EPS:Non-GAAP net income and non-GAAP EPS are non-GAAP measures defined as net income and EPS, respectively, before any charges that may not be indicative of ongoing operations, or any tax impact related to those charges. We believe that non-GAAP net income and non-GAAP EPS are useful measures to investors as an alternative method for measuring our earnings performance and comparing it against prior periods’ performance.
Non-GAAP income tax provision as a percentage of non-GAAP pre-tax income: Non-GAAP income tax provision is a non-GAAP measure defined as income tax provision plus any income tax adjustments that may not be indicative of ongoing operations. We believe that non-GAAP income tax provision as a percentage of non-GAAP pre-tax income is a useful measure to investors as an alternative method for measuring our effective tax rate and comparing it against prior periods’ performance.
We exclude the following items from our non-GAAP measures:
Amortization of acquired intangible assets: We incur expenses from the amortization of acquired intangible assets over their economic lives. Such charges are significantly impacted by the timing and magnitude of our acquisitions and any related impairment charges.
Employee termination, asset impairment and other charges: From time-to-time, in order to realign our operations with anticipated market demand or to achieve cost synergies from the integration of acquisitions, we may terminate employees and/or restructure our operations. From time-to-time, we may also incur charges from the impairment of intangible assets and other long-lived assets. These charges (including any reversals of charges recorded in prior periods) are inconsistent in amount and frequency and are not a part of the ongoing operation of our business.
Convertible debt:We exclude non-cash economic interest expense associated with the convertible senior notes, the gains and losses on the conversion of the convertible senior notes and call option, and unrealized gains and losses related to the change in fair value of the exercise option and call option. These charges and gains and losses do not reflect our cash operating results or the ongoing results of our business.
Charges related to cost saving initiatives: In connection with the transformation of our business, beginning in the 2nd quarter of fiscal 2016, we have incurred charges related to cost saving initiatives which do not qualify for special accounting treatment as exit or disposal activities. These charges, which are not part of the ongoing operation of our business, primarily relate to costs associated with rationalizing our channel partners or vendors, transforming our information systems infrastructure, integrating our product roadmap, and accelerated depreciation on assets.
Charges related to arbitration award: In relation to an arbitration award for claims brought against the Company by Seagate Technology LLC, which was satisfied in October 2014, and the related dispute over the calculation of post-award interest, which was resolved in February 2016, we have recorded loss contingencies. The resulting expense is inconsistent in amount and frequency.
Acquisition-related charges:In connection with our business combinations, we incur expenses which we would not have otherwise incurred as part of our business operations. These expenses include third-party professional service and legal fees, third-party integration services, severance costs, non-cash adjustments to the fair value of acquired inventory, contract termination costs, retention bonuses, and changes to the fair value of contingent consideration. We may also experience other one-time accounting impacts in connection with these transactions. These charges and impacts are related to acquisitions, are inconsistent in amount and frequency, and have no direct correlation to the operation of our business.
Insurance recoveries:From time-to-time, we receive insurance recoveries related to losses or other events which occurred in a prior period. Such recoveries are inconsistent in amount and frequency.
Other charges:From time-to-time, we sell investments or other assets which are not considered strategic or necessary to our business; are a party to legal or arbitration proceedings, which could result in an expense or benefit due to settlements, final judgments, or accruals for loss contingencies; or incur other charges or gains which are not a part of the ongoing operation of our business. The resulting expense or benefit is inconsistent in amount and frequency.
Income tax adjustments:Income tax adjustments reflect the difference between income taxes based on a forecasted annual non-GAAP tax rate and a forecasted annual GAAP tax rate as a result of the timing of certain non-GAAP pre-tax adjustments.
| | | | |
| Page 5 | | Quarterly Fact Sheet – Q4 FY16 | | |
Formulas
Share= Units (HDD) / TAM
ASP = Revenue / Units (HDD)
Free Cash Flow= Cash Flow from Operations – Capital Expenditures, net
EBITDA = Net Income (Loss) + Interest and Other Expense, net + Income Tax Expense + Depreciation and Amortization
Days Sales Outstanding (DSO)= Accounts Receivable / (Revenue / 91 days)
Days Inventory Outstanding (DIO)= Inventory / (Cost of Revenue / 91 days)
Days Payables Outstanding (DPO)= Accounts Payable / (Cost of Revenue / 91 days)
Cash Conversion Cycle= DSO + DIO – DPO
Inventory Turns= 364 days / DIO
R4Q Economic Profit = R4Q Net Operating Profit After Taxes – (Invested Capital x WACC)
| | • | | Invested Capital = Short-term debt + Current portion of long-term debt + Long-term debt + Total shareholders’ equity |
R4Q ROIC = R4Q (Net Income (Loss) + Interest Expense) / R4Q Average (Short-term debt + Current portion of long-term debt + Long-term debt + Total shareholders’ equity)
R4Q ROA= R4Q Net Income (Loss) / R4Q Average Total Assets
Footnotes
| 1. | ASP, Revenue by Channel and Revenue by Geography exclude external sales of media/substrates. |
| 2. | HDD Unit volume excludes WD TV Media Players without hard drives, WD Livewire, SSD and media. |
| 3. | Worldwide Headcount excludes temporary and contracted employees. |
| 4. | Consumer Electronics includes gaming. |
| 5. | PC includes shipments to distributors, second/third tier external HDD manufacturers, and white box manufacturers. |
| 6. | Non-GAAP diluted shares outstanding are equivalent to GAAP diluted shares outstanding except in periods when a net loss is reported on a GAAP basis, but net income is reported on a non-GAAP basis. Dilutive shares are not included in the calculation of EPS when a net loss is reported. |
| 7. | WACC of 11% is an internal assumption. |
| 8. | Q2 FY12 includes charges related to the flooding. Q4 FY13 includes charges related to the arbitration award. |
| 9. | HDD TAM is preliminary and based on internal information. |
| 10. | Certain FY14 amounts have been reclassified from gross profit, R&D and SG&A to the other charges line within operating expenses to conform to the annual presentation of FY14 in Part II, Item 8, Note18 in the Notes to Consolidated Financial Statements included in our Annual Report on Form 10-K. |
| 11. | Q1 FY15 cash conversion cycle calculated using 98 days due to a 14 week quarter. Q1 FY15 inventory turns calculated using 371 days due to a 53 week year. |
| 12. | Non-PC revenue percentage includes consumer electronics, enterprise applications, branded products, and SSD. |
| 13. | Excludes Non-Memory Products. |
| 14. | Client Devices is comprised of notebook and desktop HDD, consumer electronics HDD, client SSD, embedded, wafer sales and licensing and royalties. Client Solutions is comprised of branded HDD, branded flash, removables and licensing and royalties. Datacenter Devices and Solutions is comprised of enterprise HDD, enterprise SSD, data center software, data center solutions and licensing and royalties. |
| 15. | Capital expenditures, net is comprised of purchases of property, plant and equipment, net and note receivable with flash ventures, net. |
| | | | |
| Page 6 | | Quarterly Fact Sheet – Q4 FY16 | | |