SCHEDULE 14A
PROXY STATEMENT PURSUANT TO SECTION 14(a) OF THE
SECURITIES EXCHANGE ACT OF 1934
(Amendment No. )
Filed by the Registrant ☒ Filed by a Party other than the Registrant ☐
Check the appropriate box:
| | |
| ☐ | | Preliminary Proxy Statement |
| |
| ☐ | | Confidential, for Use of the Commission Only (as permitted by Rule 14a-6(e)(2)) |
| |
| ☐ | | Definitive Proxy Statement |
| |
| ☒ | | Definitive Additional Materials |
| |
| ☐ | | Soliciting MaterialPursuant to § 240.14a-12 |
WESTERN DIGITAL CORPORATION
(Name of Registrant as Specified In Its Charter)
(Name of Person(s) Filing Proxy Statement, if other than the Registrant)
Payment of Filing Fee (Check the appropriate box):
| | | | |
| |
| ☒ | | Fee not required. |
| |
| ☐ | | Fee computed on table below per Exchange Act Rules 14a-6(i)(1) and 0-11. |
| | |
| | (1) | | Title of each class of securities to which transaction applies: |
| | (2) | | Aggregate number of securities to which transaction applies: |
| | (3) | | Per unit price or other underlying value of transaction computed pursuant to Exchange Act Rule 0-11 (set forth the amount on which the filing fee is calculated and state how it was determined): |
| | (4) | | Proposed maximum aggregate value of transaction: |
| | (5) | | Total fee paid: |
| |
| ☐ | | Fee paid previously with preliminary materials. |
| |
| ☐ | | Check box if any part of the fee is offset as provided by Exchange Act Rule 0-11(a)(2) and identify the filing for which the offsetting fee was paid previously. Identify the previous filing by registration statement number, or the Form or Schedule and the date of its filing. |
| | |
| | (1) | | Amount Previously Paid: |
| | (2) | | Form, Schedule or Registration Statement No.: |
| | (3) | | Filing Party: |
| | (4) | | Date Filed: |

Stockholder Update Fall 2018 ©2018 Western Digital Corporation or its affiliates. All rights reserved.
This presentation contains forward-looking statements that involve risks and uncertainties, including, but not limited to, statements regarding: our market positioning; business and financial strategies; market trends; our product and technology development efforts and growth opportunities; and our compensation and corporate governance philosophies and practices. Forward-looking statements should not be read as a guarantee of future performance or results, and will not necessarily be accurate indications of the times at, or by, which such performance or results will be achieved, if at all. Forward-looking statements are subject to risks and uncertainties that could cause actual performance or results to differ materially from those expressed in or suggested by the forward-looking statements. Key risks and uncertainties include: volatility in global economic conditions; business conditions and growth in the storage ecosystem; impact of competitive products and pricing; market acceptance and cost of commodity materials and specialized product components; actions by competitors; unexpected advances in competing technologies; our development and introduction of products based on new technologies and expansion into new data storage markets; risks associated with acquisitions, mergers and joint ventures; difficulties or delays in manufacturing; and other risks and uncertainties listed in the company’s filings with the Securities and Exchange Commission (the “SEC”) and available on the SEC’s website at www.sec.gov, including our most recently filed periodic report, to which your attention is directed. We do not undertake any obligation to publicly update or revise any forward-looking statement, whether as a result of new information, future developments or otherwise, except as required by law. This presentation includes references to non-GAAP financial measures. Reconciliations of the differences between the non-GAAP measures provided in this presentation to the comparable GAAP financial measures are included in the appendix and are available in the Investor Relations section of our website. Forward-Looking Statements Safe Harbor | Disclaimers ©2018 Western Digital Corporation or its affiliates. All rights reserved.
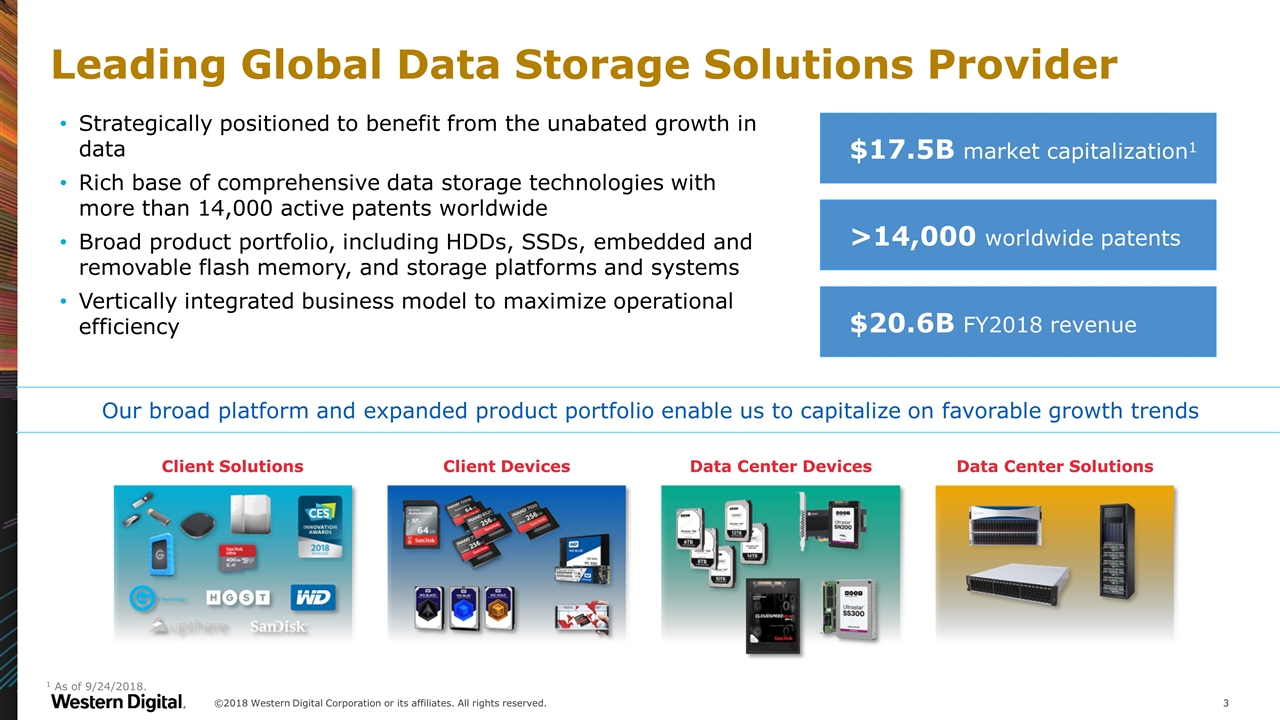
Leading Global Data Storage Solutions Provider ©2018 Western Digital Corporation or its affiliates. All rights reserved. Strategically positioned to benefit from the unabated growth in data Rich base of comprehensive data storage technologies with more than 14,000 active patents worldwide Broad product portfolio, including HDDs, SSDs, embedded and removable flash memory, and storage platforms and systems Vertically integrated business model to maximize operational efficiency $17.5B market capitalization1 Our broad platform and expanded product portfolio enable us to capitalize on favorable growth trends >14,000 worldwide patents Client Solutions Client Devices Data Center Devices Data Center Solutions 1 As of 9/24/2018. $20.6B FY2018 revenue
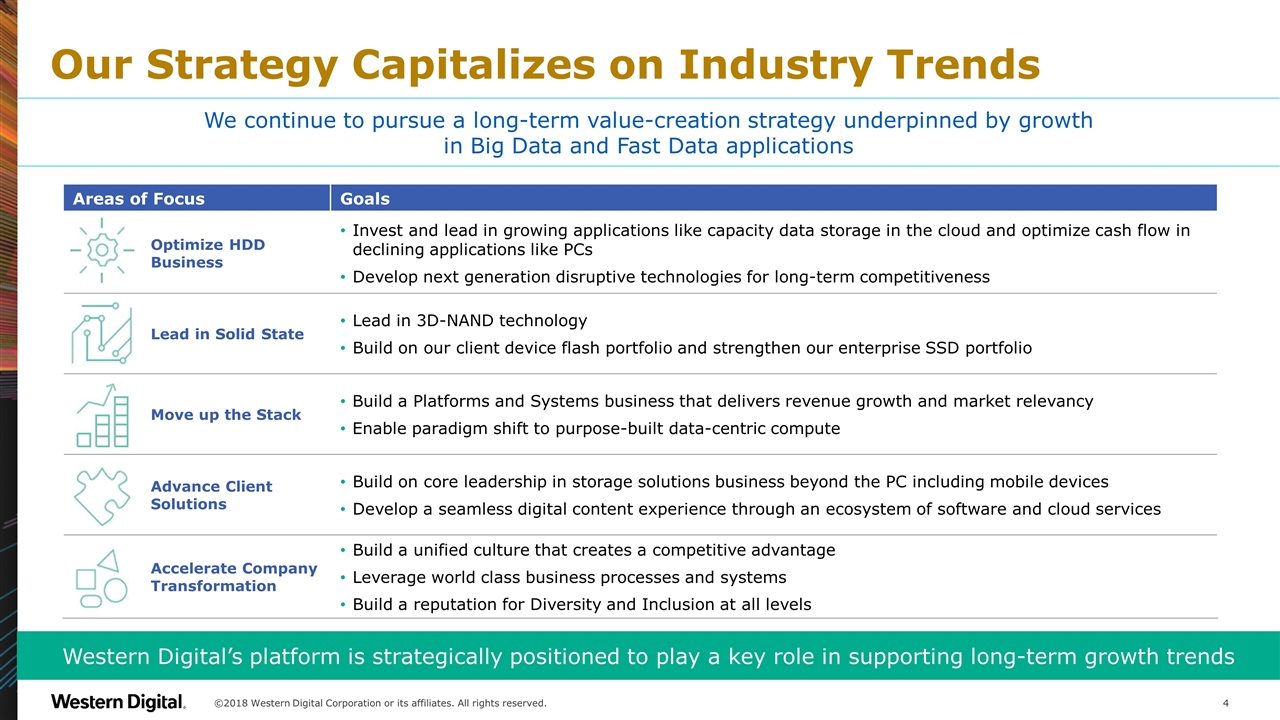
Our Strategy Capitalizes on Industry Trends Western Digital’s platform is strategically positioned to play a key role in supporting long-term growth trends We continue to pursue a long-term value-creation strategy underpinned by growth in Big Data and Fast Data applications ©2018 Western Digital Corporation or its affiliates. All rights reserved. Areas of Focus Goals Optimize HDD Business Invest and lead in growing applications like capacity data storage in the cloud and optimize cash flow in declining applications like PCs Develop next generation disruptive technologies for long-term competitiveness Lead in Solid State Lead in 3D-NAND technology Build on our client device flash portfolio and strengthen our enterprise SSD portfolio Move up the Stack Build a Platforms and Systems business that delivers revenue growth and market relevancy Enable paradigm shift to purpose-built data-centric compute Advance Client Solutions Build on core leadership in storage solutions business beyond the PC including mobile devices Develop a seamless digital content experience through an ecosystem of software and cloud services Accelerate Company Transformation Build a unified culture that creates a competitive advantage Leverage world class business processes and systems Build a reputation for Diversity and Inclusion at all levels
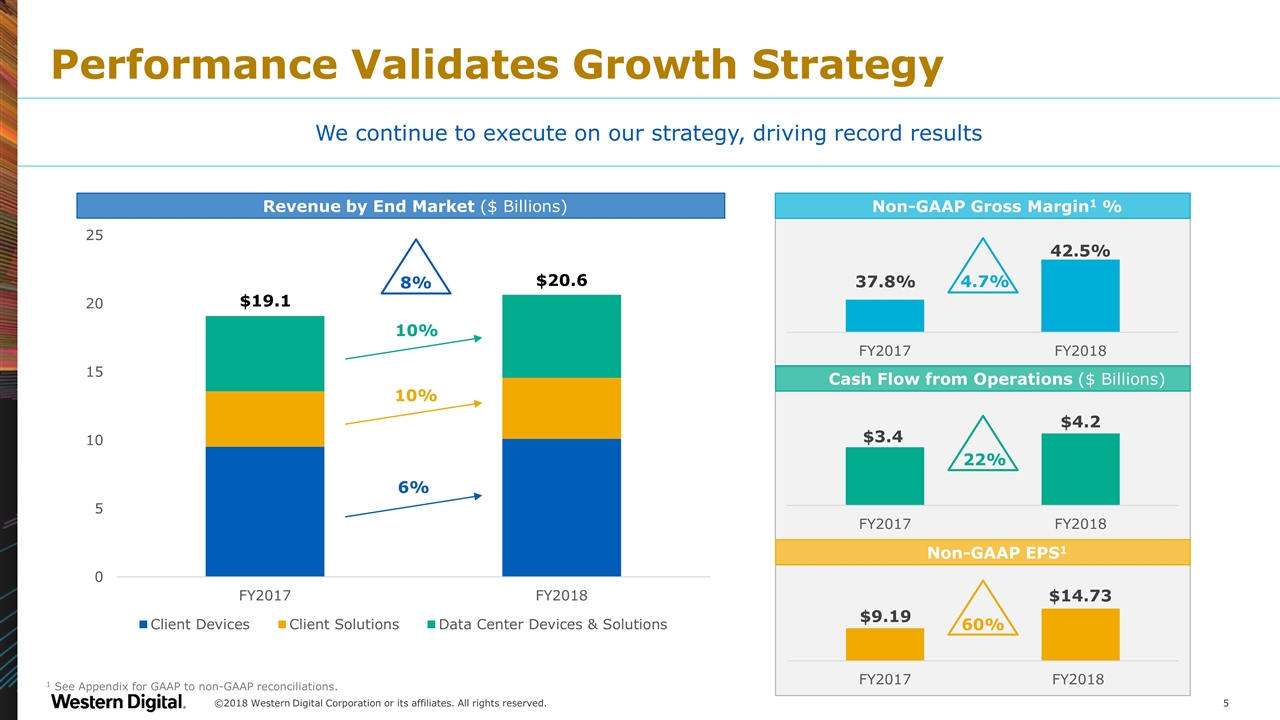
Performance Validates Growth Strategy 4.7% 1 See Appendix for GAAP to non-GAAP reconciliations. 22% Cash Flow from Operations ($ Billions) 60% Non-GAAP EPS1 We continue to execute on our strategy, driving record results Non-GAAP Gross Margin1 % ©2018 Western Digital Corporation or its affiliates. All rights reserved. Revenue by End Market ($ Billions) 10% 10% 6% $19.1 $20.6 8%
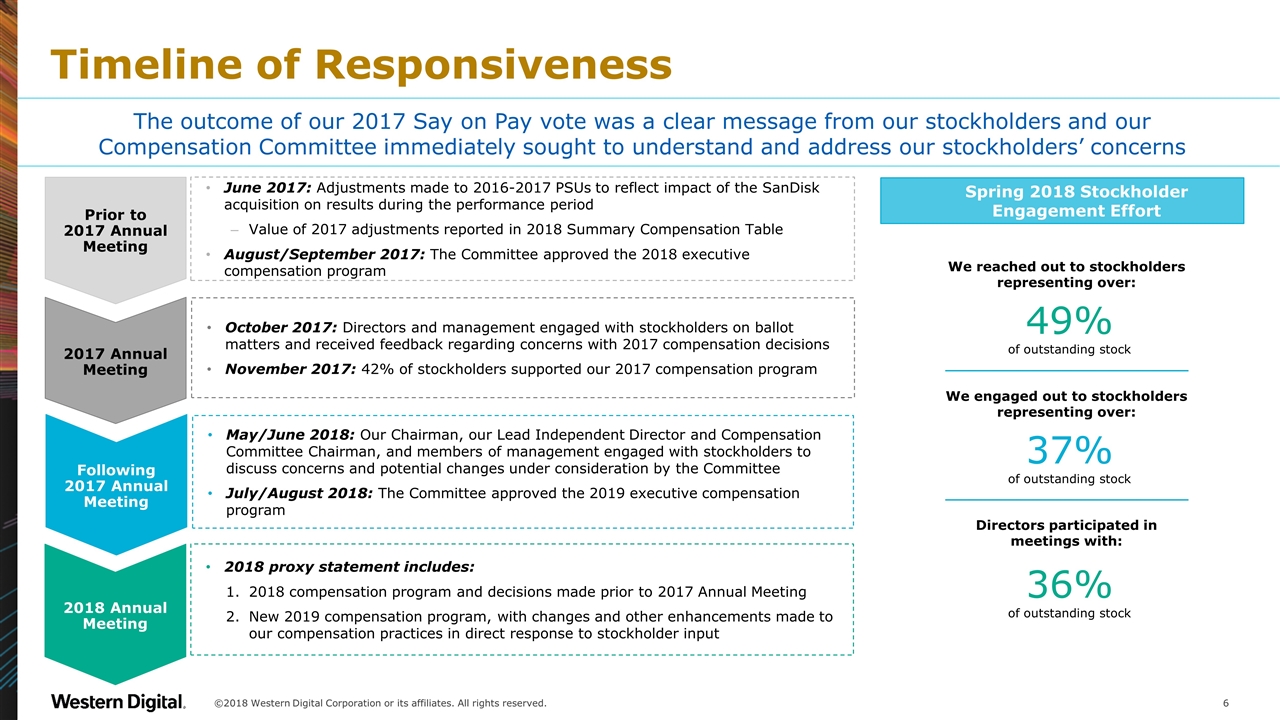
Spring 2018 Stockholder Engagement Effort Timeline of Responsiveness ©2018 Western Digital Corporation or its affiliates. All rights reserved. Prior to 2017 Annual Meeting 2017 Annual Meeting Following 2017 Annual Meeting June 2017: Adjustments made to 2016-2017 PSUs to reflect impact of the SanDisk acquisition on results during the performance period Value of 2017 adjustments reported in 2018 Summary Compensation Table August/September 2017: The Committee approved the 2018 executive compensation program October 2017: Directors and management engaged with stockholders on ballot matters and received feedback regarding concerns with 2017 compensation decisions November 2017: 42% of stockholders supported our 2017 compensation program May/June 2018: Our Chairman, our Lead Independent Director and Compensation Committee Chairman, and members of management engaged with stockholders to discuss concerns and potential changes under consideration by the Committee July/August 2018: The Committee approved the 2019 executive compensation program The outcome of our 2017 Say on Pay vote was a clear message from our stockholders and our Compensation Committee immediately sought to understand and address our stockholders’ concerns 2018 proxy statement includes: 2018 compensation program and decisions made prior to 2017 Annual Meeting New 2019 compensation program, with changes and other enhancements made to our compensation practices in direct response to stockholder input We reached out to stockholders representing over: 49% of outstanding stock 37% of outstanding stock 36% of outstanding stock 2018 Annual Meeting We engaged out to stockholders representing over: Directors participated in meetings with:
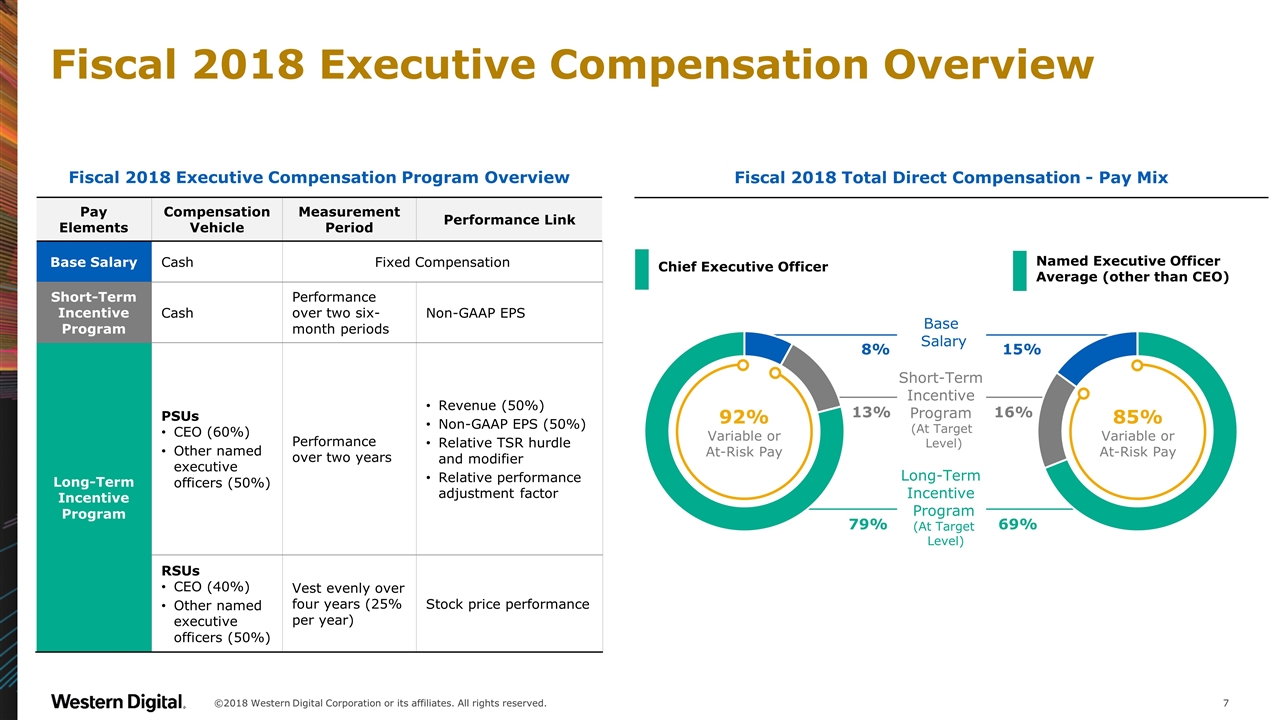
Fiscal 2018 Executive Compensation Overview ©2018 Western Digital Corporation or its affiliates. All rights reserved. Fiscal 2018 Executive Compensation Program Overview Pay Elements Compensation Vehicle Measurement Period Performance Link Base Salary Cash Fixed Compensation Short-Term Incentive Program Cash Performance over two six-month periods Non-GAAP EPS Long-Term Incentive Program PSUs CEO (60%) Other named executive officers (50%) Performance over two years Revenue (50%) Non-GAAP EPS (50%) Relative TSR hurdle and modifier Relative performance adjustment factor RSUs CEO (40%) Other named executive officers (50%) Vest evenly over four years (25% per year) Stock price performance Chief Executive Officer Named Executive Officer Average (other than CEO) Base Salary Short-Term Incentive Program (At Target Level) Long-Term Incentive Program (At Target Level) 8% 15% 13% 16% 79% 69% 92% Variable or At-Risk Pay Fiscal 2018 Total Direct Compensation - Pay Mix 85% Variable or At-Risk Pay
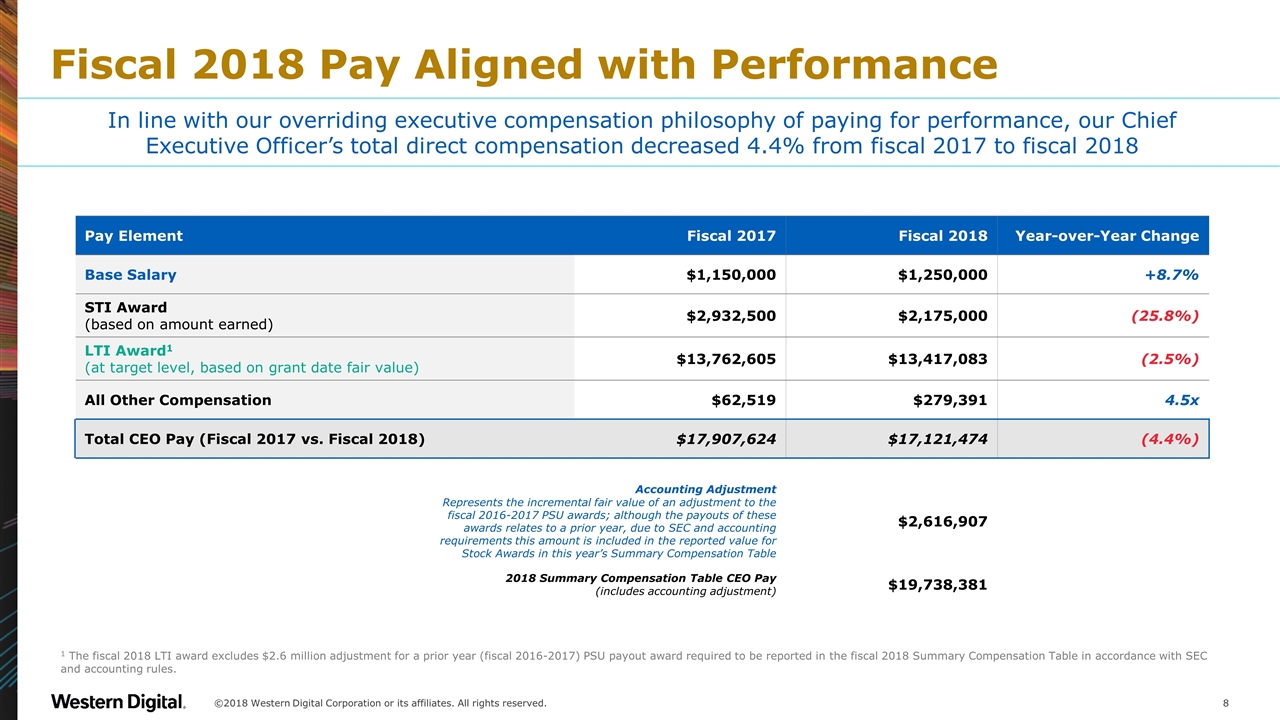
Fiscal 2018 Pay Aligned with Performance ©2018 Western Digital Corporation or its affiliates. All rights reserved. Pay Element Fiscal 2017 Fiscal 2018 Year-over-Year Change Base Salary $1,150,000 $1,250,000 +8.7% STI Award (based on amount earned) $2,932,500 $2,175,000 (25.8%) LTI Award1 (at target level, based on grant date fair value) $13,762,605 $13,417,083 (2.5%) All Other Compensation $62,519 $279,391 4.5x Total CEO Pay (Fiscal 2017 vs. Fiscal 2018) $17,907,624 $17,121,474 (4.4%) Accounting Adjustment Represents the incremental fair value of an adjustment to the fiscal 2016-2017 PSU awards; although the payouts of these awards relates to a prior year, due to SEC and accounting requirements this amount is included in the reported value for Stock Awards in this year’s Summary Compensation Table $2,616,907 2018 Summary Compensation Table CEO Pay (includes accounting adjustment) $19,738,381 In line with our overriding executive compensation philosophy of paying for performance, our Chief Executive Officer’s total direct compensation decreased 4.4% from fiscal 2017 to fiscal 2018 1 The fiscal 2018 LTI award excludes $2.6 million adjustment for a prior year (fiscal 2016-2017) PSU payout award required to be reported in the fiscal 2018 Summary Compensation Table in accordance with SEC and accounting rules.
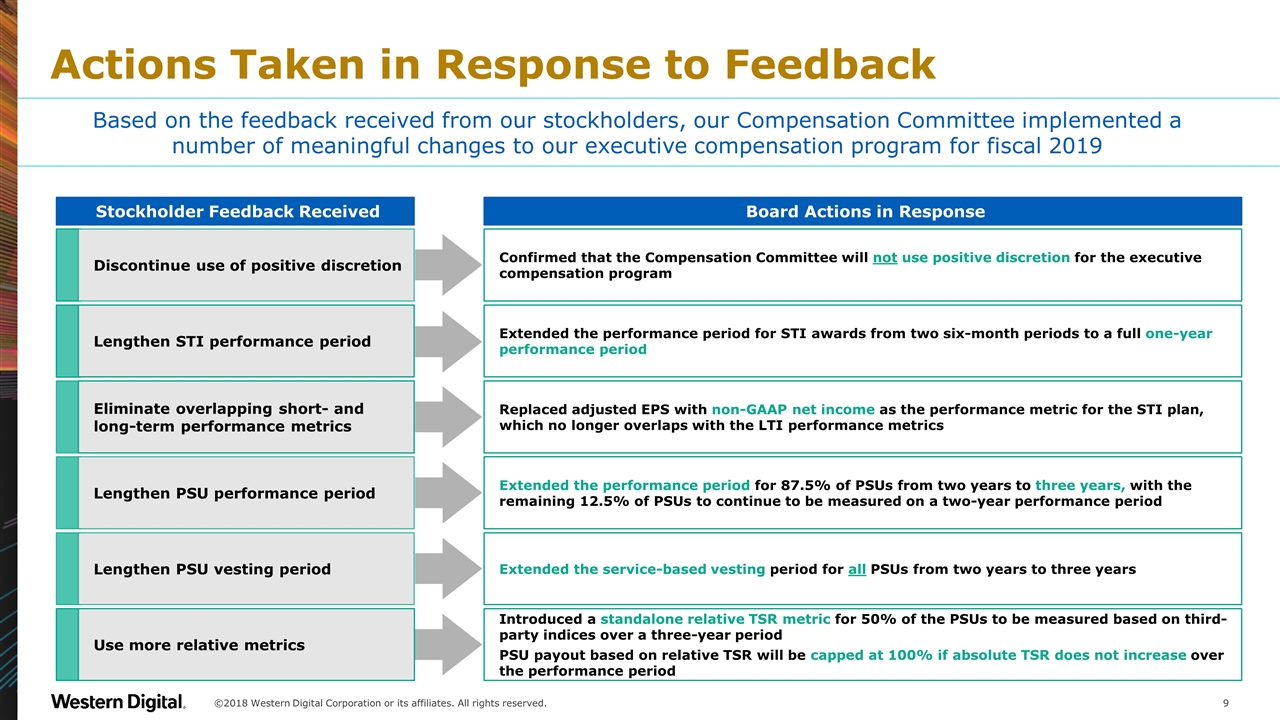
Actions Taken in Response to Feedback Stockholder Feedback Received Board Actions in Response Based on the feedback received from our stockholders, our Compensation Committee implemented a number of meaningful changes to our executive compensation program for fiscal 2019 ©2018 Western Digital Corporation or its affiliates. All rights reserved. Extended the performance period for STI awards from two six-month periods to a full one-year performance period Lengthen STI performance period Extended the performance period for 87.5% of PSUs from two years to three years, with the remaining 12.5% of PSUs to continue to be measured on a two-year performance period Lengthen PSU performance period Introduced a standalone relative TSR metric for 50% of the PSUs to be measured based on third-party indices over a three-year period PSU payout based on relative TSR will be capped at 100% if absolute TSR does not increase over the performance period Use more relative metrics Extended the service-based vesting period for all PSUs from two years to three years Lengthen PSU vesting period Replaced adjusted EPS with non-GAAP net income as the performance metric for the STI plan, which no longer overlaps with the LTI performance metrics Eliminate overlapping short- and long-term performance metrics Confirmed that the Compensation Committee will not use positive discretion for the executive compensation program Discontinue use of positive discretion
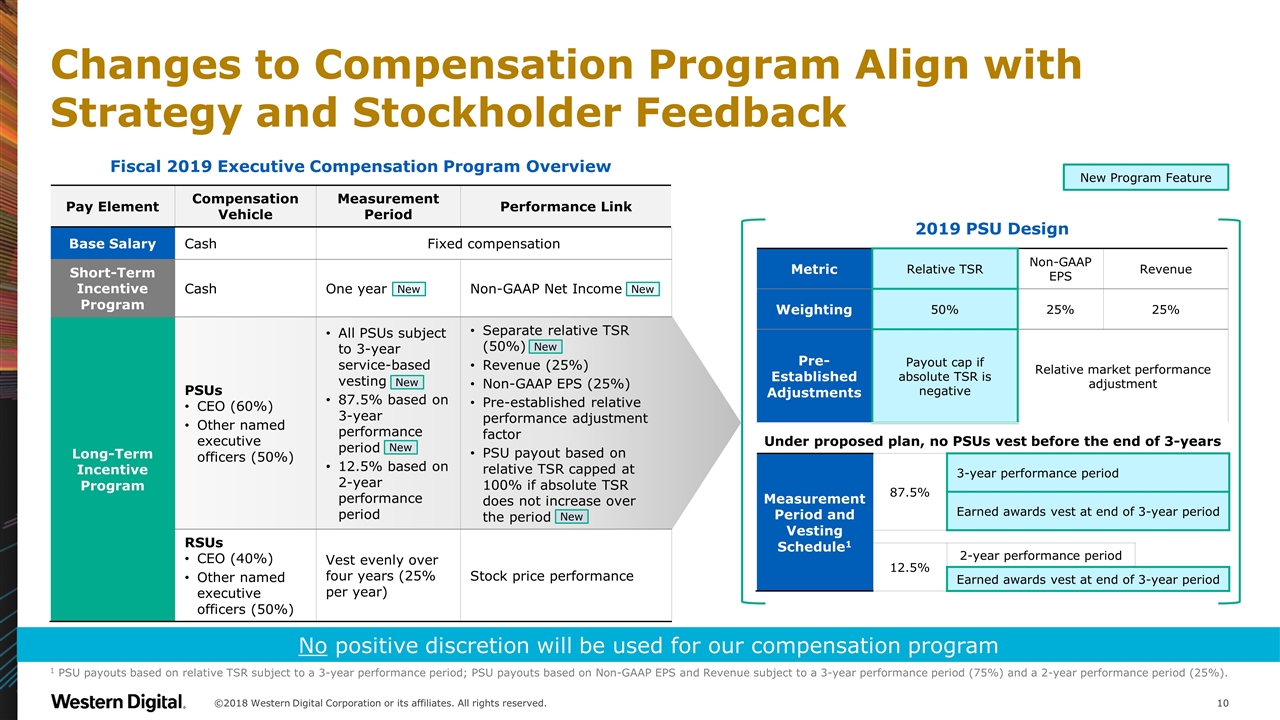
Fiscal 2019 Executive Compensation Program Overview Pay Element Compensation Vehicle Measurement Period Performance Link Base Salary Cash Fixed compensation Short-Term Incentive Program Cash One year Non-GAAP Net Income Long-Term Incentive Program PSUs CEO (60%) Other named executive officers (50%) All PSUs subject to 3-year service-based vesting 87.5% based on 3-year performance period 12.5% based on 2-year performance period Separate relative TSR (50%) Revenue (25%) Non-GAAP EPS (25%) Pre-established relative performance adjustment factor PSU payout based on relative TSR capped at 100% if absolute TSR does not increase over the period RSUs CEO (40%) Other named executive officers (50%) Vest evenly over four years (25% per year) Stock price performance Changes to Compensation Program Align with Strategy and Stockholder Feedback ©2018 Western Digital Corporation or its affiliates. All rights reserved. No positive discretion will be used for our compensation program 2019 PSU Design Metric Relative TSR Non-GAAP EPS Revenue Weighting 50% 25% 25% Pre-Established Adjustments Payout cap if absolute TSR is negative Relative market performance adjustment Under proposed plan, no PSUs vest before the end of 3-years Measurement Period and Vesting Schedule1 87.5% 3-year performance period Earned awards vest at end of 3-year period 12.5% 2-year performance period Earned awards vest at end of 3-year period New Program Feature New New 1 PSU payouts based on relative TSR subject to a 3-year performance period; PSU payouts based on Non-GAAP EPS and Revenue subject to a 3-year performance period (75%) and a 2-year performance period (25%). New New New New
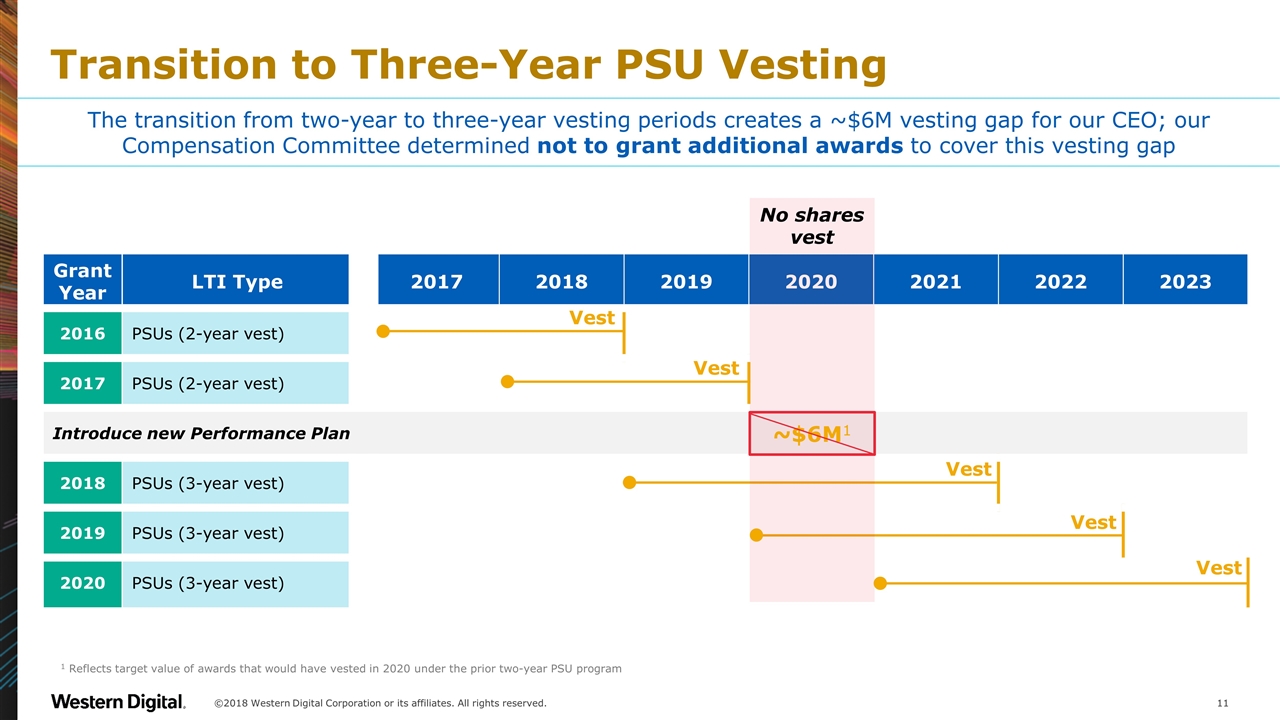
Transition to Three-Year PSU Vesting ©2018 Western Digital Corporation or its affiliates. All rights reserved. Grant Year LTI Type 2017 2018 2019 2020 2021 2022 2023 2016 PSUs (2-year vest) 2017 PSUs (2-year vest) Introduce new Performance Plan 2018 PSUs (3-year vest) 2019 PSUs (3-year vest) 2020 PSUs (3-year vest) No shares vest Vest Vest Vest Vest Vest ~$6M1 The transition from two-year to three-year vesting periods creates a ~$6M vesting gap for our CEO; our Compensation Committee determined not to grant additional awards to cover this vesting gap 1 Reflects target value of awards that would have vested in 2020 under the prior two-year PSU program
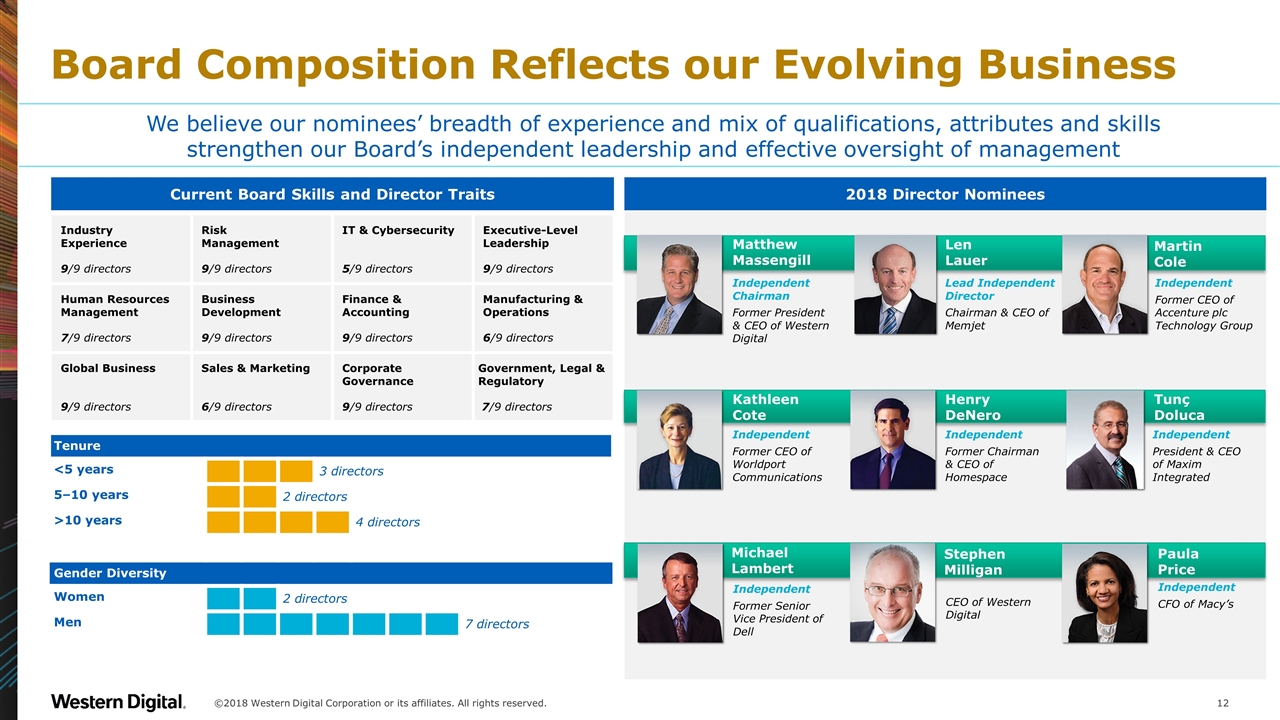
Board Composition Reflects our Evolving Business Industry Experience 9/9 directors Risk Management 9/9 directors IT & Cybersecurity 5/9 directors Executive-Level Leadership 9/9 directors Human Resources Management 7/9 directors Business Development 9/9 directors Finance & Accounting 9/9 directors Manufacturing & Operations 6/9 directors Global Business 9/9 directors Sales & Marketing 6/9 directors Corporate Governance 9/9 directors Government, Legal & Regulatory 7/9 directors Current Board Skills and Director Traits ©2018 Western Digital Corporation or its affiliates. All rights reserved. We believe our nominees’ breadth of experience and mix of qualifications, attributes and skills strengthen our Board’s independent leadership and effective oversight of management Independent Chairman Former President & CEO of Western Digital Matthew Massengill Len Lauer Lead Independent Director Chairman & CEO of Memjet Martin Cole Independent Former CEO of Accenture plc Technology Group Kathleen Cote Independent Former CEO of Worldport Communications Henry DeNero Independent Former Chairman & CEO of Homespace Tunç Doluca Independent President & CEO of Maxim Integrated Independent Former Senior Vice President of Dell CEO of Western Digital Independent CFO of Macy’s Michael Lambert Stephen Milligan Paula Price Tenure <5 years 3 directors 5–10 years 2 directors >10 years 4 directors Gender Diversity Women 2 directors Men 7 directors 2018 Director Nominees
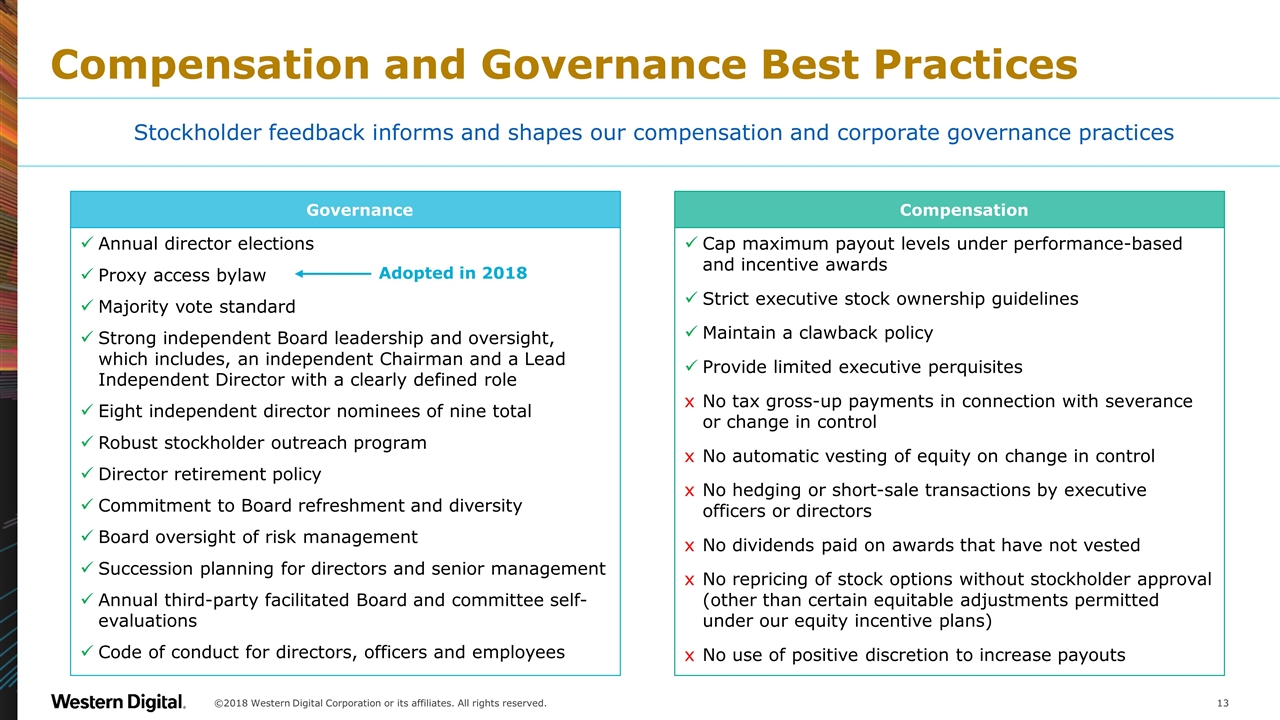
Compensation and Governance Best Practices Annual director elections Proxy access bylaw Majority vote standard Strong independent Board leadership and oversight, which includes, an independent Chairman and a Lead Independent Director with a clearly defined role Eight independent director nominees of nine total Robust stockholder outreach program Director retirement policy Commitment to Board refreshment and diversity Board oversight of risk management Succession planning for directors and senior management Annual third-party facilitated Board and committee self-evaluations Code of conduct for directors, officers and employees Adopted in 2018 Governance Cap maximum payout levels under performance-based and incentive awards Strict executive stock ownership guidelines Maintain a clawback policy Provide limited executive perquisites No tax gross-up payments in connection with severance or change in control No automatic vesting of equity on change in control No hedging or short-sale transactions by executive officers or directors No dividends paid on awards that have not vested No repricing of stock options without stockholder approval (other than certain equitable adjustments permitted under our equity incentive plans) No use of positive discretion to increase payouts Compensation Stockholder feedback informs and shapes our compensation and corporate governance practices ©2018 Western Digital Corporation or its affiliates. All rights reserved.
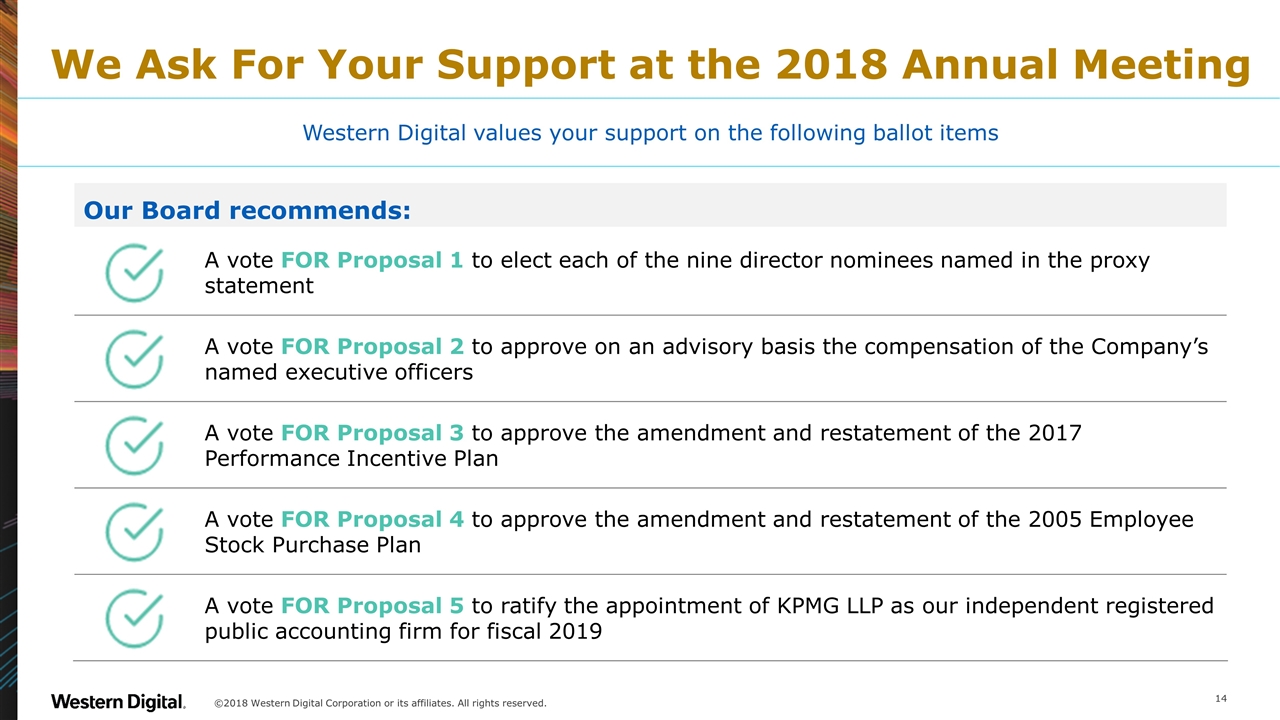
We Ask For Your Support at the 2018 Annual Meeting ©2018 Western Digital Corporation or its affiliates. All rights reserved. Western Digital values your support on the following ballot items Our Board recommends: A vote FOR Proposal 1 to elect each of the nine director nominees named in the proxy statement A vote FOR Proposal 2 to approve on an advisory basis the compensation of the Company’s named executive officers A vote FOR Proposal 3 to approve the amendment and restatement of the 2017 Performance Incentive Plan A vote FOR Proposal 4 to approve the amendment and restatement of the 2005 Employee Stock Purchase Plan A vote FOR Proposal 5 to ratify the appointment of KPMG LLP as our independent registered public accounting firm for fiscal 2019

Appendix ©2018 Western Digital Corporation or its affiliates. All rights reserved.
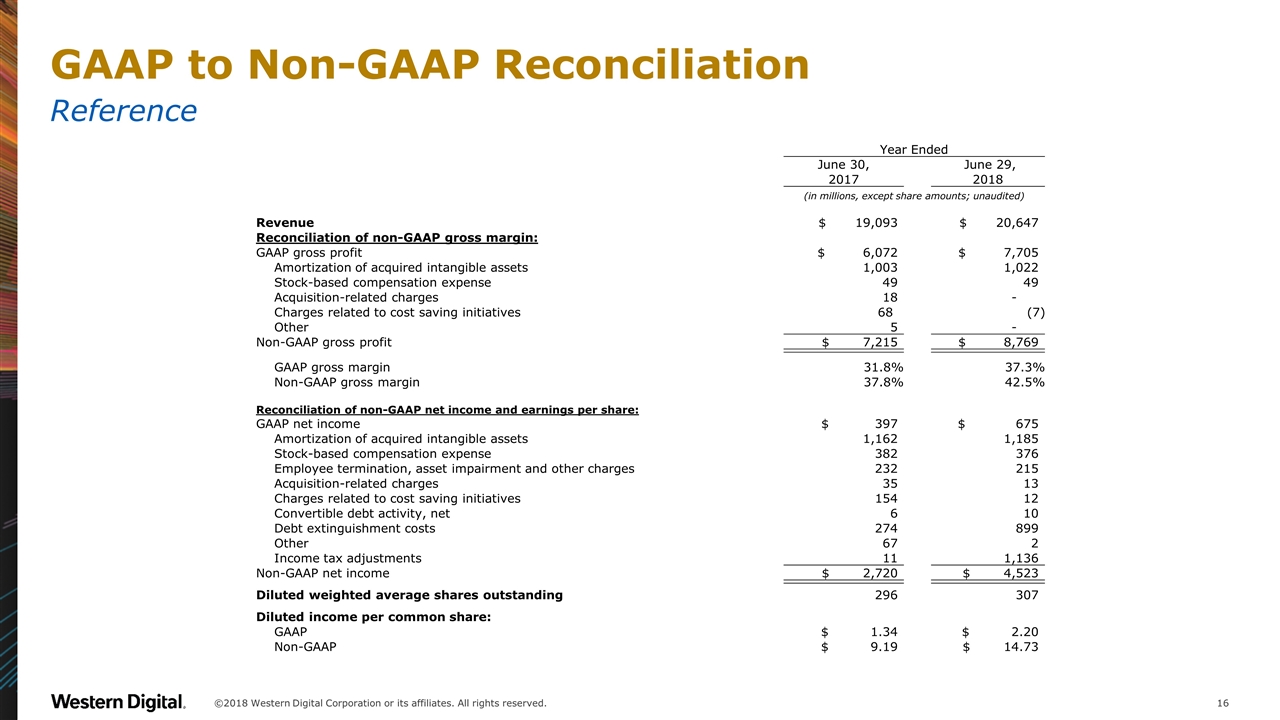
GAAP to Non-GAAP Reconciliation Reference Year Ended June 30, June 29, 2017 2018 (in millions, except share amounts; unaudited) Revenue $ 19,093 $ 20,647 Reconciliation of non-GAAP gross margin: GAAP gross profit $ 6,072 $ 7,705 Amortization of acquired intangible assets 1,003 1,022 Stock-based compensation expense 49 49 Acquisition-related charges 18 - Charges related to cost saving initiatives 68 (7) Other 5 - Non-GAAP gross profit $ 7,215 $ 8,769 GAAP gross margin 31.8% 37.3% Non-GAAP gross margin 37.8% 42.5% Reconciliation of non-GAAP net income and earnings per share: GAAP net income $ 397 $ 675 Amortization of acquired intangible assets 1,162 1,185 Stock-based compensation expense 382 376 Employee termination, asset impairment and other charges 232 215 Acquisition-related charges 35 13 Charges related to cost saving initiatives 154 12 Convertible debt activity, net 6 10 Debt extinguishment costs 274 899 Other 67 2 Income tax adjustments 11 1,136 Non-GAAP net income $ 2,720 $ 4,523 Diluted weighted average shares outstanding 296 307 Diluted income per common share: GAAP $ 1.34 $ 2.20 Non-GAAP $ 9.19 $ 14.73 ©2018 Western Digital Corporation or its affiliates. All rights reserved.
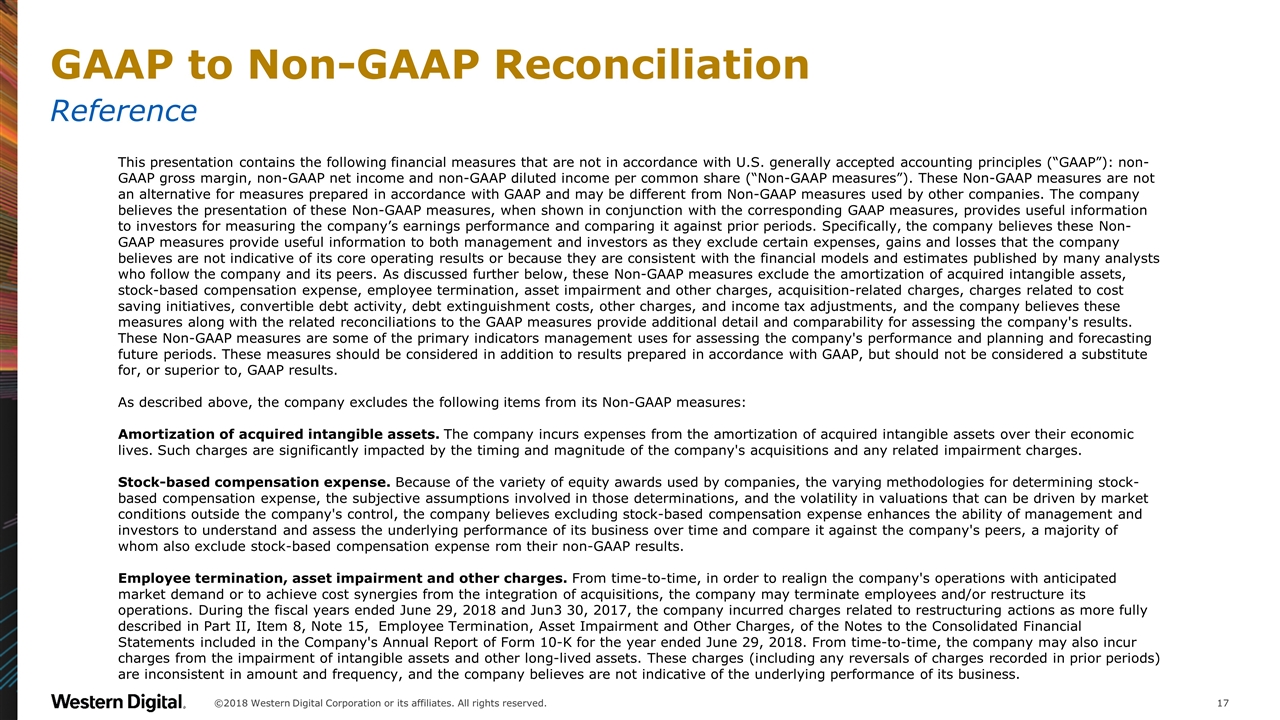
GAAP to Non-GAAP Reconciliation Reference This presentation contains the following financial measures that are not in accordance with U.S. generally accepted accounting principles (“GAAP”): non-GAAP gross margin, non-GAAP net income and non-GAAP diluted income per common share (“Non-GAAP measures”). These Non-GAAP measures are not an alternative for measures prepared in accordance with GAAP and may be different from Non-GAAP measures used by other companies. The company believes the presentation of these Non-GAAP measures, when shown in conjunction with the corresponding GAAP measures, provides useful information to investors for measuring the company’s earnings performance and comparing it against prior periods. Specifically, the company believes these Non-GAAP measures provide useful information to both management and investors as they exclude certain expenses, gains and losses that the company believes are not indicative of its core operating results or because they are consistent with the financial models and estimates published by many analysts who follow the company and its peers. As discussed further below, these Non-GAAP measures exclude the amortization of acquired intangible assets, stock-based compensation expense, employee termination, asset impairment and other charges, acquisition-related charges, charges related to cost saving initiatives, convertible debt activity, debt extinguishment costs, other charges, and income tax adjustments, and the company believes these measures along with the related reconciliations to the GAAP measures provide additional detail and comparability for assessing the company's results. These Non-GAAP measures are some of the primary indicators management uses for assessing the company's performance and planning and forecasting future periods. These measures should be considered in addition to results prepared in accordance with GAAP, but should not be considered a substitute for, or superior to, GAAP results. As described above, the company excludes the following items from its Non-GAAP measures: Amortization of acquired intangible assets. The company incurs expenses from the amortization of acquired intangible assets over their economic lives. Such charges are significantly impacted by the timing and magnitude of the company's acquisitions and any related impairment charges. Stock-based compensation expense. Because of the variety of equity awards used by companies, the varying methodologies for determining stock-based compensation expense, the subjective assumptions involved in those determinations, and the volatility in valuations that can be driven by market conditions outside the company's control, the company believes excluding stock-based compensation expense enhances the ability of management and investors to understand and assess the underlying performance of its business over time and compare it against the company's peers, a majority of whom also exclude stock-based compensation expense rom their non-GAAP results. Employee termination, asset impairment and other charges. From time-to-time, in order to realign the company's operations with anticipated market demand or to achieve cost synergies from the integration of acquisitions, the company may terminate employees and/or restructure its operations. During the fiscal years ended June 29, 2018 and Jun3 30, 2017, the company incurred charges related to restructuring actions as more fully described in Part II, Item 8, Note 15, Employee Termination, Asset Impairment and Other Charges, of the Notes to the Consolidated Financial Statements included in the Company's Annual Report of Form 10-K for the year ended June 29, 2018. From time-to-time, the company may also incur charges from the impairment of intangible assets and other long-lived assets. These charges (including any reversals of charges recorded in prior periods) are inconsistent in amount and frequency, and the company believes are not indicative of the underlying performance of its business. ©2018 Western Digital Corporation or its affiliates. All rights reserved.
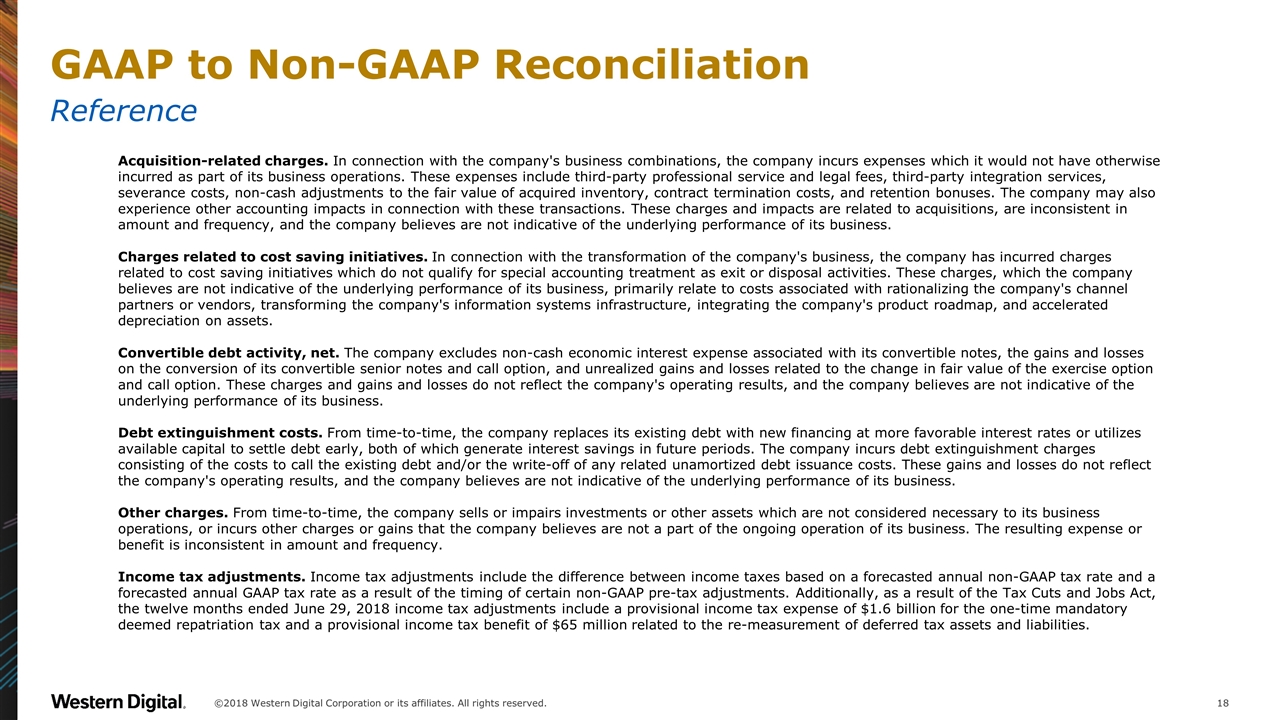
GAAP to Non-GAAP Reconciliation Reference Acquisition-related charges. In connection with the company's business combinations, the company incurs expenses which it would not have otherwise incurred as part of its business operations. These expenses include third-party professional service and legal fees, third-party integration services, severance costs, non-cash adjustments to the fair value of acquired inventory, contract termination costs, and retention bonuses. The company may also experience other accounting impacts in connection with these transactions. These charges and impacts are related to acquisitions, are inconsistent in amount and frequency, and the company believes are not indicative of the underlying performance of its business. Charges related to cost saving initiatives. In connection with the transformation of the company's business, the company has incurred charges related to cost saving initiatives which do not qualify for special accounting treatment as exit or disposal activities. These charges, which the company believes are not indicative of the underlying performance of its business, primarily relate to costs associated with rationalizing the company's channel partners or vendors, transforming the company's information systems infrastructure, integrating the company's product roadmap, and accelerated depreciation on assets. Convertible debt activity, net. The company excludes non-cash economic interest expense associated with its convertible notes, the gains and losses on the conversion of its convertible senior notes and call option, and unrealized gains and losses related to the change in fair value of the exercise option and call option. These charges and gains and losses do not reflect the company's operating results, and the company believes are not indicative of the underlying performance of its business. Debt extinguishment costs. From time-to-time, the company replaces its existing debt with new financing at more favorable interest rates or utilizes available capital to settle debt early, both of which generate interest savings in future periods. The company incurs debt extinguishment charges consisting of the costs to call the existing debt and/or the write-off of any related unamortized debt issuance costs. These gains and losses do not reflect the company's operating results, and the company believes are not indicative of the underlying performance of its business. Other charges. From time-to-time, the company sells or impairs investments or other assets which are not considered necessary to its business operations, or incurs other charges or gains that the company believes are not a part of the ongoing operation of its business. The resulting expense or benefit is inconsistent in amount and frequency. Income tax adjustments. Income tax adjustments include the difference between income taxes based on a forecasted annual non-GAAP tax rate and a forecasted annual GAAP tax rate as a result of the timing of certain non-GAAP pre-tax adjustments. Additionally, as a result of the Tax Cuts and Jobs Act, the twelve months ended June 29, 2018 income tax adjustments include a provisional income tax expense of $1.6 billion for the one-time mandatory deemed repatriation tax and a provisional income tax benefit of $65 million related to the re-measurement of deferred tax assets and liabilities. ©2018 Western Digital Corporation or its affiliates. All rights reserved.

Insights Machine Learning Precise Predictions Real-Time Results Protection Automation Anywhere Anytime Analytics Context Aware ©2017 Western Digital Corporation or its affiliates. All rights reserved. Confidential. Delivering the possibilities of data ©2018 Western Digital Corporation or its affiliates. All rights reserved.


