EXHIBIT 13
Killbuck Bancshares, Inc.
Corporate Profile
Killbuck Bancshares, Inc. (the “Company”) was incorporated under the laws of the State of Ohio on November 29, 1991 at the direction of management of the Bank, for the purpose of becoming a bank holding company by acquiring all of the outstanding shares of The Killbuck Savings Bank Company. In November 1992, the Company became the sole shareholder of the Bank. The Bank carries on business under the name “The Killbuck Savings Bank Company.” The principal office of the Company is located at 165 N. Main Street, Killbuck, Ohio.
The Killbuck Savings Bank Company was established under the banking laws of the State of Ohio in September of 1900. The Bank is headquartered in Killbuck, Ohio, which is located in the northeast portion of Ohio, in Holmes County. The Bank is insured by the Federal Deposit Insurance Corporation, and is regulated by the Ohio Division of Financial Institutions and the Board of Governors of the Federal Reserve System.
The Bank provides customary retail and commercial banking services to its customers, including checking and savings accounts, Health Savings Accounts (HSA), time deposits, interest-bearing accounts, internet banking, bill payment, safe deposit facilities, real estate mortgage loans and consumer loans. The Bank also makes secured and unsecured commercial loans.
Stock Market Information
Our common shares are currently quoted by a number of quotation services, including the Over the Counter Bulletin Board (the “OTCBB”) and the Pink Sheets Electronic Quotation Service (the “Pink Sheets”), as well as by Community Banc Investments, New Concord, Ohio (“CBI”), each of which handles a limited amount of the Corporation’s stock transactions. The OTCBB and the Pink Sheets are both quotation services for “over-the-counter securities,” which are generally considered to be any equity securities not otherwise listed on a national exchange, such as NASDAQ, NYSE or Amex. CBI is a licensed intrastate securities dealer that specializes in marketing the stock of independent banks in Ohio. The Company’s common shares are quoted on the OTCBB and the Pink Sheets under the trading symbol “KLIB.”
The common stock of the Company trades infrequently. Parties interested in buying or selling the Company’s stock are generally referred to Community Banc Investments, New Concord, Ohio (“CBI”). The quarterly high and low price information in the table below was obtained from CBI and the OTCBB.
| | | | | | | | | | | |
Quarter Ended | | High | | Low | | Cash
Dividends
Paid |
2006 | | March 31 | | $ | 105.42 | | $ | 102.50 | | | N/A |
| | June 30 | | | 106.66 | | | 103.00 | | $ | 1.20 |
| | September 30 | | | 110.85 | | | 103.00 | | | N/A |
| | December 31 | | | 111.76 | | | 109.10 | | $ | 2.30 |
| | | | |
2005 | | March 31 | | $ | 98.75 | | $ | 97.64 | | | N/A |
| | June 30 | | | 100.06 | | | 98.85 | | $ | 1.05 |
| | September 30 | | | 102.44 | | | 94.00 | | | N/A |
| | December 31 | | | 103.45 | | | 102.44 | | $ | 1.15 |
At December 31, 2006, the Company had approximately 1,007 shareholders of record.
Management does not have knowledge of the prices paid in all transactions and has not verified the accuracy of those prices that have been reported. Because of the lack of an established market for the Company’s stock, these prices may not reflect the prices at which the stock would trade in a more active market.
Cash dividends are paid on a semi-annual basis. Included in the December 31, 2006 dividend of $2.30 per share was a special one-time dividend of $1.00 per share. This special dividend will not be repeated in the foreseeable future.
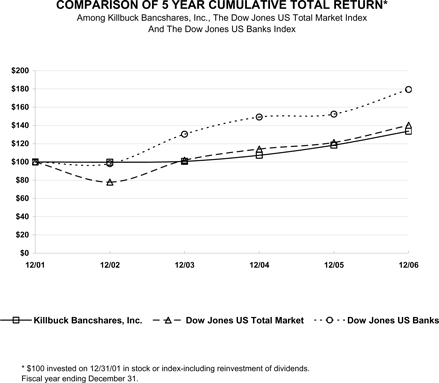
Performance Graph—Five-Year Shareholder Return Comparison
The following chart compares the five-year cumulative return on $100 invested on December 31, 2001 in each of the following: (1) Common Stock of Killbuck Bancshares, Inc.; (2) the Dow Jones Total Market Index; and (3) the Dow Jones Bank Index.
| | | | | | | | | | | | |
| | | 12/01 | | 12/02 | | 12/03 | | 12/04 | | 12/05 | | 12/06 |
Killbuck Bancshares, Inc. | | 100.00 | | 99.74 | | 100.66 | | 107.37 | | 118.48 | | 133.70 |
Dow Jones US Total Market | | 100.00 | | 77.92 | | 101.88 | | 114.12 | | 121.34 | | 140.23 |
Dow Jones US Banks | | 100.00 | | 98.11 | | 130.43 | | 149.16 | | 152.39 | | 179.38 |
Selected Financial Data
The following table sets forth general information and ratios of the Company at the dates indicated (in thousands except per share data and shares).
| | | | | | | | | | | | | | | | | | | | |
| | | Year Ended December 31, | |
| | | 2006 | | | 2005 | | | 2004 | | | 2003 | | | 2002 | |
For The Year: | | | | | | | | | | | | | | | | | | | | |
Total interest income | | $ | 20,038 | | | $ | 16,618 | | | $ | 14,033 | | | $ | 14,283 | | | $ | 16,057 | |
Total interest expense | | | 5,919 | | | | 4,169 | | | | 3,264 | | | | 4,017 | | | | 5,926 | |
| | | | | | | | | | | | | | | | | | | | |
Net interest income | | | 14,119 | | | | 12,449 | | | | 10,769 | | | | 10,266 | | | | 10,131 | |
Provision for loan losses | | | 215 | | | | 377 | | | | 225 | | | | 390 | | | | 210 | |
| | | | | | | | | | | | | | | | | | | | |
Net interest income after provision for loan losses | | | 13,904 | | | | 12,072 | | | | 10,544 | | | | 9,876 | | | | 9,921 | |
Total other income | | | 1,307 | | | | 1,265 | | | | 1,015 | | | | 1,120 | | | | 873 | |
Total other expense | | | 7,996 | | | | 7,613 | | | | 7,158 | | | | 7,045 | | | | 6,642 | |
| | | | | | | | | | | | | | | | | | | | |
Income before income taxes | | | 7,215 | | | | 5,724 | | | | 4,401 | | | | 3,951 | | | | 4,152 | |
Income tax expense | | | 1,992 | | | | 1,513 | | | | 982 | | | | 742 | | | | 934 | |
| | | | | | | | | | | | | | | | | | | | |
Net income | | $ | 5,223 | | | $ | 4,211 | | | $ | 3,419 | | | $ | 3,209 | | | $ | 3,218 | |
| | | | | | | | | | | | | | | | | | | | |
| | | | | |
Per share data | | | | | | | | | | | | | | | | | | | | |
Net earnings | | $ | 8.14 | | | $ | 6.44 | | | $ | 5.16 | | | $ | 4.75 | | | $ | 4.68 | |
Dividends | | $ | 3.50 | | | $ | 2.20 | | | $ | 1.95 | | | $ | 1.85 | | | $ | 1.75 | |
Book value (at period end) | | $ | 61.28 | | | $ | 57.20 | | | $ | 53.78 | | | $ | 51.24 | | | $ | 50.03 | |
| | | | | |
Average no. of shares outstanding | | | 641,759 | | | | 653,996 | | | | 662,130 | | | | 676,133 | | | | 686,739 | |
| | | | | |
Year-end balances: | | | | | | | | | | | | | | | | | | | | |
Total loans | | $ | 194,623 | | | $ | 208,901 | | | $ | 217,173 | | | $ | 201,697 | | | $ | 175,157 | |
Securities | | | 64,746 | | | | 45,078 | | | | 45,769 | | | | 58,211 | | | | 80,626 | |
Total assets | | | 313,205 | | | | 298,050 | | | | 293,867 | | | | 284,139 | | | | 283,174 | |
Deposits | | | 264,301 | | | | 250,349 | | | | 247,349 | | | | 241,724 | | | | 239,039 | |
Borrowings | | | 8,554 | | | | 9,599 | | | | 10,575 | | | | 7,810 | | | | 9,198 | |
Shareholders’ equity | | | 39,134 | | | | 37,049 | | | | 35,359 | | | | 34,062 | | | | 34,204 | |
| | | | | |
Significant ratios: | | | | | | | | | | | | | | | | | | | | |
Return on average assets | | | 1.74 | % | | | 1.44 | % | | | 1.18 | % | | | 1.13 | % | | | 1.15 | % |
Return on average equity | | | 14.58 | | | | 12.24 | | | | 10.26 | | | | 9.77 | | | | 10.10 | |
Dividends per share to net income per share | | | 43.03 | | | | 34.16 | | | | 37.72 | | | | 38.95 | | | | 37.31 | |
Average equity to average assets | | | 11.96 | | | | 11.79 | | | | 11.55 | | | | 11.53 | | | | 11.36 | |
Loans to deposits | | | 73.64 | | | | 83.44 | | | | 87.80 | | | | 83.44 | | | | 73.28 | |
Allowance for loan loss to total loans | | | 1.23 | | | | 1.11 | | | | 1.22 | | | | 1.34 | | | | 1.33 | |
MANAGEMENT’S DISCUSSION AND ANALYSIS OF FINANCIAL CONDITION AND RESULTS OF OPERATIONS
Killbuck Bancshares, Inc. (“Killbuck” or the “Company”) is the parent holding company for the Killbuck Savings Bank Company (the “Bank”). The following discussion and analysis is intended to provide information about the financial condition and results of operation of the Company and should be read in conjunction with the audited Consolidated Financial Statements, footnotes and other discussions appearing elsewhere in this annual report and the Company’s Form 10-K.
Certain information presented in this discussion and analysis and other statements concerning future performance, developments or events, and expectations for growth and market forecasts constitute forward-looking statements which are subject to a number of risks and uncertainties, including interest rate fluctuations, changes in local or national economic conditions, and government and regulatory actions which might cause actual results to differ materially from stated expectations or estimates.
Critical Accounting Policies
The Company’s accounting policies are integral to understanding the results reported. The accounting policies are described in detail in Note 1 of the consolidated financial statements. Our most complex accounting policies require management’s judgment to ascertain the valuation of assets, liabilities, commitments and contingencies. We have established detailed policies and control procedures that are intended to ensure valuation methods are well controlled and applied consistently from period to period. In addition, the policies and procedures are intended to ensure that the process for changing methodologies occurs in an appropriate manner. The following is a brief description of our current accounting policies involving significant management valuation judgments.
Allowance for Loan Losses
Arriving at an appropriate level of allowance for loan losses involves a high degree of judgment. The Company’s allowance for loan losses provides for probable losses based upon evaluations of known and inherent risks in the loan portfolio.
Management uses historical information to assess the adequacy of the allowance for loan losses as well as the prevailing business environment as it is affected by changing economic conditions and various external factors, which may impact the portfolio in ways currently unforeseen. The allowance is increased by provisions for loan losses and by recoveries of loans previously charged-off and reduced by loans charged-off. For a full discussion of the Company’s methodology of assessing the adequacy of the reserve for loan losses, refer to Note 1 of “Notes to Consolidated Financial Statements.”
Goodwill and Other Intangible Assets
As discussed in Note 7 of the consolidated financial statements, the Company must assess goodwill and other intangible assets each year for impairment. This assessment involves estimating cash flows for future periods. If the future cash flows were less than the recorded goodwill and other intangible assets balances, we would be required to take a charge against earnings to write down the assets to the lower value.
Deferred Tax Assets
We use an estimate of future earnings to support our position that the benefit of our deferred tax assets will be realized. If future income should prove non-existent or less than the amount of the deferred tax assets within the tax years to which they may be applied, the asset may not be realized and our net income will be reduced. Our deferred tax assets are described further in Note 14 of the consolidated financial statements.
Overview
The reported results of the Company are dependent on a variety of factors, including the general interest rate environment, competitive conditions in the industry, governmental policies and regulations and conditions in the markets for financial assets. We are not aware of any market or institutional trends, events or uncertainties that are expected to have a material effect on liquidity, capital resources or operations. Net interest income is the largest component of net income, and consists of the difference between income generated on interest-earning assets and interest expense incurred on interest-bearing liabilities. Net interest income is primarily affected by the volume, interest rates and composition of interest-earning assets and interest-bearing liabilities.
A loan production facility was opened in Millersburg, Ohio in July 2003. This facility has allowed us to concentrate our Millersburg lenders into one location to provide better service, more office space, and new business opportunities with a commercial calling officer. In April of 2004, a branch facility was opened in the German Village grocery store complex in Berlin, Ohio. It provides a greater level of convenience to the Berlin community. However, in the fourth quarter of 2006, the German Village grocery store was closed. The branch and the other stores remain open even though traffic has slowed down.
RESULTS OF OPERATIONS
Summary
For 2006, we recorded net income of $5.2 million compared to $4.2 million for 2005 and $3.4 million for 2004.
Other operating income was $1.3 million for 2006 compared to $1.3 million for 2005 and $1.0 million for 2004.
Total other operating expenses were $8.0 million in 2006 compared to $7.6 million in 2005 and $7.2 million in 2004.
Earnings per share for 2006 were $8.14 compared to $6.44 for 2005 and $5.16 for 2004.
NET INTEREST INCOME
Our net interest income increased by $1,670,000 in 2006 from 2005 and increased by $1,680,000 in 2005 from 2004.
Total interest income increased by $3,420,000 or 20.6% for 2006 from 2005. The increase for 2006 resulted primarily from an increase of $2,158,000 in interest income on loans. The increases in loan interest income resulted primarily from increases in the current yield on the loan portfolios. The current yield on the average loan portfolios increased from 6.60% to 8.09%. The increase in the current yield was a result of the loans repricing replacing historically low interest rates. The average loan portfolio decreased $12.0 million or 5.6% for 2006 due to greater competitive loan pricing. The $584,000 increase in investment interest income resulted from increases in the average volume in the investment portfolio as well as increases in the current yield on the investment portfolio. The average balances of the investment portfolio increased by $9.7 million or 20.9% for 2006 from 2005 due to decreasing loan demand and deposit growth. The current yield on the average balances in the investment portfolio increased from 4.33% to 4.63% due to the rate environment.
Total interest income increased by $2,585,000 or 18.4% for 2005 from 2004. The increase for 2005 resulted primarily from an increase of $2,567,000 in interest income on loans. The increases in loan interest income resulted primarily from increases in the current yield on the loan portfolios. The current yield on the average loan portfolios increased from 5.46% to 6.60%. The increase in the current yield was a result of the loans repricing replacing historically low interest rates. The average loan portfolio increased $2.0 million or .9% for 2005. The $283,000 decrease in investment interest income resulted primarily from decreases in the average volume in the investment portfolio. The average balances of the investment portfolio decreased by $7.4 million or 13.8% for 2005 from 2004 due to increasing federal funds sold for liquidity purposes.
The yield on earning assets was 7.16%, 6.09%, and 5.13% for 2006, 2005, and 2004 respectively. The increase in the yield on earning assets is attributable to the general increase in interest rates.
Interest expense for 2006 increased by $1,750,000 or 42.0% from 2005. The increase was primarily due to an increase in the cost on interest bearing liabilities, which increased 78 basis points from 1.99% in 2005 to 2.77% in 2006, and increased 45 basis points from 1.54% in 2004 to 1.99% in 2005. The increase for 2006 is due mainly to an increase in the cost of time deposits of 102 basis points from 2.91% to 3.93%.
The average volume of time deposits and money market deposits increased $9.2 million and $ ..6 million respectively in 2006. Interest-bearing demand deposits and savings deposits decreased $1.5 million and $2.5 million respectively in 2006. The volume increases in time deposits and decreases in other deposit categories are primarily due to the rising interest rate environment. The funds are shifting into time deposits.
The average volume of time deposits increased $1.1 million while interest bearing demand deposits, money market deposits, and savings deposits decreased $1.5 million, $2.1 million, and $150,000 respectively for 2005.
The cost on average interest-bearing liabilities was 2.77% for 2006 and 1.99% for 2005, and 1.54% for 2004.
Mainly due to an increase in the current yields on loans, the net yield on earning assets has increased this year maintaining the rising trend of prior years. The net yield on average interest-earning assets is 5.04%, 4.56% and 3.94% for 2006, 2005 and 2004 respectively. Management believes this trend may continue; however, the incremental increases will become smaller and may eventually decrease due to the current competitive loan pricing environment while the cost on average interest-bearing liabilities continues to increase.
The following table sets forth, for the periods indicated, information regarding the total dollar amounts of interest income from average interest-earning assets and the resulting yields, the total dollar amount of interest expense on average interest-bearing liabilities and the resulting rate paid, net interest income, interest rate spread and the net yield on interest-earning assets (dollars in thousands):
Average Balance Sheet and Net Interest Analysis
| | | | | | | | | | | | | | | | | | | | | | | | | | | | |
| | | For the Year Ended December 31 | |
| | | 2006 | | | 2005 | | | 2004 | |
| | | Average
Balance | | | Interest | | Yield/ Rate | | | Average
Balance | | | Interest | | Yield/ Rate | | | Average
Balance | | | Interest | | Yield/ Rate | |
Assets | | | | | | | | | | | | | | | | | | | | | | | | | | | | |
Interest earning assets: | | | | | | | | | | | | | | | | | | | | | | | | | | | | |
Loans (1)(2)(3) | | $ | 202,525 | | | 16,382 | | 8.09 | % | | $ | 215,486 | | | 14,224 | | 6.60 | % | | $ | 213,463 | | | $ | 11,657 | | 5.46 | % |
Securities—taxable (4) | | | 22,136 | | | 1,086 | | 4.91 | % | | | 9,863 | | | 400 | | 4.06 | % | | | 13,308 | | | | 517 | | 3.88 | % |
Securities – nontaxable | | | 32,034 | | | 1,406 | | 4.39 | % | | | 34,719 | | | 1,525 | | 4.39 | % | | | 38,685 | | | | 1,700 | | 4.39 | % |
Securities – Equity (4)(5) | | | 1,632 | | | 93 | | 5.73 | % | | | 1,565 | | | 76 | | 4.86 | % | | | 1,515 | | | | 67 | | 4.45 | % |
Federal funds sold | | | 21,657 | | | 1,071 | | 4.95 | % | | | 11,182 | | | 393 | | 3.51 | % | | | 6,404 | | | | 92 | | 1.44 | % |
| | | | | | | | | | | | | | | | | | | | | | | | | | | | |
Total interest—earnings assets | | | 279,984 | | | 20,038 | | 7.16 | % | | | 272,815 | | | 16,618 | | 6.09 | % | | | 273,375 | | | | 14,033 | | 5.13 | % |
| | | | | | | | | | | | | | | | | | | | | | | | | | | | |
| | | | | | | | | |
Noninterest-earning assets | | | | | | | | | | | | | | | | | | | | | | | | | | | | |
Cash and due from other Institutions | | | 9,851 | | | | | | | | | 9,801 | | | | | | | | | 9,627 | | | | | | | |
Premises and equipment, net | | | 5,293 | | | | | | | | | 5,175 | | | | | | | | | 5,013 | | | | | | | |
Accrued interest | | | 1,195 | | | | | | | | | 893 | | | | | | | | | 781 | | | | | | | |
Other assets | | | 5,725 | | | | | | | | | 5,644 | | | | | | | | | 2,542 | | | | | | | |
Less allowance for loan losses | | | (2,407 | ) | | | | | | | | (2,510 | ) | | | | | | | | (2,764 | ) | | | | | | |
| | | | | | | | | | | | | | | | | | | | | | | | | | | | |
Total | | $ | 299,641 | | | | | | | | $ | 291,818 | | | | | | | | $ | 288,574 | | | | | | | |
| | | | | | | | | | | | | | | | | | | | | | | | | | | | |
| | | | | | | | | |
Liabilities and Shareholders Equity | | | | | | | | | | | | | | | | | | | | | | | | | | | | |
Interest bearing liabilities: | | | | | | | | | | | | | | | | | | | | | | | | | | | | |
Interest bearing demand | | | 30,668 | | | 176 | | 0.57 | % | | | 32,117 | | | 162 | | 0.50 | % | | $ | 33,610 | | | $ | 123 | | 0.37 | % |
Money market accounts | | | 17,837 | | | 418 | | 2.34 | % | | | 17,196 | | | 235 | | 1.37 | % | | | 19,316 | | | | 171 | | 0.89 | % |
Savings deposits | | | 39,588 | | | 377 | | 0.95 | % | | | 42,049 | | | 315 | | 0.75 | % | | | 42,198 | | | | 267 | | 0.63 | % |
Time deposits | | | 116,846 | | | 4,587 | | 3.93 | % | | | 107,701 | | | 3,129 | | 2.91 | % | | | 106,629 | | | | 2,427 | | 2.28 | % |
Short term borrowings | | | 4,193 | | | 117 | | 2.79 | % | | | 4,140 | | | 47 | | 1.14 | % | | | 3,871 | | | | 8 | | 0.21 | % |
Average Balance Sheet and Net Interest Analysis (Continued)
| | | | | | | | | | | | | | | | | | | | | | | | | | | |
| | | For the Year Ended December 31 | |
| | | 2006 | | | 2005 | | | 2004 | |
| | | Average
Balance | | Interest | | Yield/ Rate | | | Average
Balance | | Interest | | Yield/ Rate | | | Average
Balance | | Interest | | Yield/ Rate | |
Federal Home Loan Bank Advances | | | 4,683 | | | 244 | | 5.20 | % | | | 6,084 | | | 281 | | 4.62 | % | | | 6,003 | | | 268 | | 4.46 | % |
| | | | | | | | | | | | | | | | | | | | | | | | | | | |
Total interest bearing liabilities | | | 213,815 | | | 5,919 | | 2.77 | % | | | 209,287 | | | 4,169 | | 1.99 | % | | | 211,627 | | | 3,264 | | 1.54 | % |
| | | | | | | | | | | | | | | | | | | | | | | | | | | |
| | | | | | | | | |
Noninterest bearing liabilities: | | | | | | | | | | | | | | | | | | | | | | | | | | | |
Demand deposits | | | 45,995 | | | | | | | | | 44,856 | | | | | | | | | 41,220 | | | | | | |
Accrued expenses and other liabilities | | | 3,993 | | | | | | | | | 3,265 | | | | | | | | | 2,394 | | | | | | |
| | | | | | | | | |
Shareholder’s equity | | | 35,838 | | | | | | | | | 34,410 | | | | | | | | | 33,333 | | | | | | |
| | | | | | | | | | | | | | | | | | | | | | | | | | | |
Total | | $ | 299,641 | | | | | | | | $ | 291,818 | | | | | | | | $ | 288,574 | | | | | | |
| | | | | | | | | | | | | | | | | | | | | | | | | | | |
Net interest income | | | | | $ | 14,119 | | | | | | | | $ | 12,449 | | | | | | | | $ | 10,769 | | | |
| | | | | | | | | | | | | | | | | | | | | | | | | | | |
Interest rate spread (6) | | | | | | | | 4.39 | % | | | | | | | | 4.10 | % | | | | | | | | 3.59 | % |
| | | | | | | | | | | | | | | | | | | | | | | | | | | |
Net yield on interest earning assets (7) | | | | | | | | 5.04 | % | | | | | | | | 4.56 | % | | | | | | | | 3.94 | % |
| | | | | | | | | | | | | | | | | | | | | | | | | | | |
| (1) | For purposes of these computations, the daily average loan amounts outstanding are net of deferred loan fees. |
| (2) | Included in loan interest income are loan related fees of $326,356, $292,727, and $299,952 in 2006, 2005, and 2004, respectively. |
| (3) | Nonaccrual loans are included in loan totals and do not have a material impact on the information presented. |
| (4) | Average balance is computed using the carrying value of securities. The average yield has been computed using the historical amortized cost average balance for available for sale securities. |
| (5) | Equity securities are comprised of common stock of the Federal Home Loan Bank, Federal Reserve Bank, and Great Lakes Bankers Bank. |
| (6) | Interest rate spread represents the difference between the average yield on interest earning assets and the average cost of interest bearing liabilities. |
| (7) | Net yield on interest earning assets represents net interest income as a percentage of average interest earning assets. |
Rate/Volume Analysis
The table below sets forth certain information regarding changes in interest income and interest expense of the Company for the periods indicated. For each category of interest-earning assets and interest-bearing liabilities, information is provided on changes attributable to (i) changes in volume (changes in average volume multiplied by old rate) and (ii) changes in rates (changes in rate multiplied by old average volume). Changes which are not solely attributable to rate or volume are allocated to changes in rate due to rate sensitivity of interest-earning assets and interest-bearing liabilities (dollars in thousands).
| | | | | | | | | | | | | | | | | | | | | | | | |
| | | 2006 Compared to 2005 | | | 2005 Compared to 2004 | |
| | | Increase (Decrease) Due To | | | Increase (Decrease) Due To | |
| | | Volume | | | Rate | | | Net | | | Volume | | | Rate | | | Net | |
Interest income | | | | | | | | | | | | | | | | | | | | | | | | |
Loans | | $ | (856 | ) | | $ | 3,014 | | | $ | 2,158 | | | $ | 110 | | | $ | 2,457 | | | $ | 2,567 | |
Securities-taxable | | | 498 | | | | 188 | | | | 686 | | | | (134 | ) | | | 17 | | | | (117 | ) |
Securities-nontaxable | | | (118 | ) | | | (1 | ) | | | (119 | ) | | | (174 | ) | | | (1 | ) | | | (175 | ) |
Securities-equities | | | 3 | | | | 14 | | | | 17 | | | | 2 | | | | 7 | | | | 9 | |
Federal funds sold | | | 368 | | | | 310 | | | | 678 | | | | 69 | | | | 232 | | | | 301 | |
| | | | | | | | | | | | | | | | | | | | | | | | |
Total interest earning | | | | | | | | | | | | | | | | | | | | | | | | |
Assets | | | (105 | ) | | | 3,525 | | | | 3,420 | | | | (127 | ) | | | 2,712 | | | | 2,585 | |
| | | | | | | | | | | | | | | | | | | | | | | | |
| | | | | | |
Interest expense | | | | | | | | | | | | | | | | | | | | | | | | |
Interest bearing demand | | | (7 | ) | | | 21 | | | | 14 | | | | (5 | ) | | | 44 | | | | 39 | |
Money market accounts | | | 9 | | | | 174 | | | | 183 | | | | (19 | ) | | | 83 | | | | 64 | |
Savings deposits | | | (18 | ) | | | 80 | | | | 62 | | | | (1 | ) | | | 49 | | | | 48 | |
Time deposits | | | 266 | | | | 1,192 | | | | 1,458 | | | | 24 | | | | 678 | | | | 702 | |
Short-term borrowing | | | 1 | | | | 69 | | | | 70 | | | | 1 | | | | 38 | | | | 39 | |
Federal Home Loan Bank | | | | | | | | | | | | | | | | | | | | | | | | |
Advances | | | (64 | ) | | | 27 | | | | (37 | ) | | | 4 | | | | 9 | | | | 13 | |
| | | | | | | | | | | | | | | | | | | | | | | | |
Total interest bearing | | | | | | | | | | | | | | | | | | | | | | | | |
Liabilities | | | 187 | | | | 1,563 | | | | 1,750 | | | | 4 | | | | 901 | | | | 905 | |
| | | | | | | | | | | | | | | | | | | | | | | | |
| | | | | | |
Net change in interest income | | $ | (292 | ) | | $ | 1,962 | | | $ | 1,670 | | | $ | (131 | ) | | $ | 1,811 | | | $ | 1,680 | |
| | | | | | | | | | | | | | | | | | | | | | | | |
Provision for Loan Losses
The provision for loan losses was $214,514 for 2006, $376,722 for 2005, and $225,000 for 2004. We make periodic provisions to the allowance for loan losses to maintain the allowance at an acceptable level commensurate with the credit risks inherent in the loan portfolio. There can be no assurances, however, that additional provisions will not be required in future periods. The allowance for loan losses as a percent of total loans was 1.23%, 1.11%, and 1.22% for 2006, 2005 and 2004 respectively.
The allowance for loan losses is Management’s estimate of the amount of probable credit losses in the portfolio. The Company determines the allowance for loan losses based upon an ongoing evaluation. This evaluation is inherently subjective, as it requires material estimates, including the amounts and timing of cash flows expected to be received on impaired loans that may be susceptible to significant change. Increases to the allowance for loan losses are made by charges to the provision for loan losses. Loans deemed uncollectible are charged against the allowance for loan losses. Recoveries of previously charged-off amounts are credited to the allowance for loan losses.
The Company’s allowance for loan losses is the accumulation of various components calculated based upon independent methodologies. All components of the allowance for loan losses represent an estimation performed according to either Financial Accounting Standards No. 5 or No. 114. Management’s estimate of each allowance component is based on certain observable data that Management believes is the most reflective of the underlying loan losses being estimated. Changes in the amount of each component of the allowance for loan losses are directionally consistent with changes in the observable data and corresponding analyses. Some of the components that Management factors in are current economic conditions, loan growth assumptions, credit concentrations, and levels of nonperforming loans.
A key element of the methodology for determining the allowance for loan losses is the Company’s credit-risk-evaluation process, which includes credit-risk grading of individual commercial loans. Loans are assigned credit-risk grades based on an internal assessment of conditions that affect a borrower’s ability to meet its contractual obligation under the loan agreement. The assessment process includes reviewing a borrower’s current financial information, historical payment experience, credit documentation, public information, and other information specific to each individual borrower. Certain commercial loans are reviewed on an annual or rotational basis or as Management becomes aware of information affecting a borrower’s ability to fulfill its obligation.
Noninterest Income
Total non-interest income, which is comprised principally of fees and charges on customers’ deposit accounts increased $43,000 or 3.4% to $1,307,000 in 2006 from $1,264,000 in 2005 and a $249,000 or 24.52% increase from $1,015,000 for 2004. Service charges increased $131,000 or 15.9% in 2006. Of this $131,000 increase, approximately $128,000 or 26.4% is due mainly to a new overdraft program, which began in the fourth quarter 2006. In 2005, service charges increased $20,000 or 2.5% due mainly to a continued increase in ATM and debit card interchange fees. The Bank sells fixed rate loans in the secondary market. Due to market conditions, the Bank originated and sold $3.6 million less of these loans in 2006 compared to 2005. Gains for these sales were $35,000 in 2006, $72,000 in 2005, and $63,000 in 2004.
Other Income decreased $52,000 or 14.13% to $316,000 in 2006 from $368,000 for 2005, due primarily from the decrease in income from the alternative investment service of approximately $27,000. This income was $39,000 for 2006 and $66,000 for 2005 and $25,000 for 2004. In 2005, Other Income increased $220,000 due primarily to the $149,000 in income from the Bank-Owned Life Insurance (BOLI) purchased in December 2004. The Company purchased life insurance policies on certain key employees. The BOLI is recorded at its cash surrender value or the amount that can be realized.
Noninterest Expense
Total non-interest expense increased $383,000 or 5.0% to $8.0 million in 2006 as compared to $7.6 million in 2005 and increased $455,000 or 6.4% for 2005 from $7.2 million in 2004.
Salary and employee benefits for 2006 totaled $4.5 million, an increase of $254,000 or 5.9% from $4.3 million in 2005 and increased $302,000 or 7.6% from $4.0 million in 2004. Approximately $73,000 of the increase is due to medical group insurance costs due to the insurer mandating a higher limit for the partially self-funded plan. These remaining increases are due to normal increases for annual salary raises and employee benefits. The increase for 2005 was attributable to staff additions and normal recurring employee cost increases for salary and employee benefits.
Occupancy and equipment expense increased $40,000 in 2006 and decreased $40,000 in 2005. Approximately $31,000 is attributable to the timing in recording of Real Estate Taxes. The remaining changes were attributable to changes in items that are normal and recurring in nature. Depreciation expense decreased $31,000 in 2005.
Other operating expenses for 2006 totaled $2.48 million, an $89,000 or 3.7% increase from the $2.39 million reported in 2005 and a $192,000 or 8.7% increase from the $2.20 million reported in 2004. Professional fees increased approximately $15,000 or 4.6 % from $313,000 in 2005 to $328,000 for 2006. Professional fees related to consultants increased approximately $33,000 of which approximately $19,000 was related to a Human Resources Recruiter, approximately $8,000 was related to strategic planning, and approximately $7,000 was related to new product development. Professional fees related to the Sarbanes-Oxley Act Section 404 Internal Controls certification work decreased approximately $61,000. Professional fees related to audits and examinations increased approximately $30,000 while legal expenses increased approximately $12,000 due to a new attorney relationship; the previous counsel retired. The Ohio State franchise tax increased approximately $22,000 or 9.8% from $439,000 in 2005 to $461,000 for 2006. Postage expenses increased approximately $16,000 or 10.5% from $155,000 in 2005 to $172,000 for 2006 while Stationery, Supplies, and Printing increased approximately $13,000 or 7.8% from 2005. Data processing expenses increased $8,000 or 5.4% from $149,000 in 2005 to $157,000 in 2006. The changes in the remaining expense accounts were attributable to increases/decreases in items that are normal and recurring in nature.
Income Tax Expense
Income tax expense increased $479,000 for 2006 to $1,992,000 from $1,513,000 in 2005; and increased $532,000 for 2005 to $1,513,000 from $981,000 in 2004. The effective rate on taxes for 2006, 2005 and 2004 was 27.2%, 26.4% and 22.2% respectively. The effective tax rate is affected by the amount of tax-exempt income earned by the Company each year.
Comparison of Financial Condition at December 31, 2006 and 2005
Total assets at December 31, 2006 amounted to $313 million, an increase of $15 million compared to $298 million at December 31, 2005.
Cash and cash equivalents increased $9.4 million or 28.2% from December 31, 2005 to December 31, 2006, with liquid funds held in the form of federal funds sold increasing $9.7 million. The increase in federal funds sold at December 31, 2006 is the excess of funds from the net increase in deposits that was not used in investing activities, financing activities, or operating activities and from the decrease in net loans.
Total investment securities increased $19.7 million or 43.6% from December 31, 2005 to December 31, 2006. The increase in investments was due to the excess funds due to the decrease in net loans. Information detailing the book value of the investment portfolio by security type and classification is present in Note 3 to the consolidated financial statements.
Total loans were $194.6 million at December 31, 2006 a decrease of $14.3 million or 6.8% from $208.9 million at December 31, 2005. The loan decreases were due in part to an increasingly competitive loan rate environment, the increase in lending interest rates, and a general slowdown of the business expansion in the communities we serve. Of this $14.3 million decrease approximately $13.9 million was in the residential real estate loan portfolio, approximately $1.2 million was a decrease in the agriculture real estate loan portfolio, approximately $2.8 million was an increase in the commercial real estate loan portfolio, approximately $1.5 million was an increase in the construction real estate loan portfolio, approximately $2.2 million was a decrease in the commercial and other loan portfolio, and approximately $1.3 million was a decrease in the consumer and credit loan portfolio. The mix of the residential 1-4 family mortgages changed due to the increase in lending rates. Approximately $5.7 million in residential 1 to 4 family fixed rate mortgages increased while the residential 1 to 4 family adjustable rate mortgages decreased. Late in 1997, we began to offer residential mortgage customers a fixed rate product. This program enables us to offer competitive long-term fixed rates. These loans are made with the intent to sell in the secondary loan market. We originated and sold $8.7 million and $12.3 million of loans in 2006 and 2005. Profit on the sale of these loans was $35,000 and $72,000 for 2006 and 2005. Information detailing the composition of the loan portfolio is presented in Note 4 to the consolidated financial statements.
Total deposits increased $14.0 million or 5.6% from December 31, 2005 to December 31, 2006. Money market deposits, and time deposits increased $.3 million and $22.4 million, respectively. Non-interest bearing demand deposit accounts, the interest bearing demand deposits, and savings deposits decreased $2.4 million, $1.7 million, and $4.6 million, respectively. The increases are attributable to new deposit account growth and internal movement of existing accounts. See also, Average Balance Sheet and Net Interest Analysis for information related to the average amount and average interest paid on deposit accounts during 2006 and 2005. Information related to the maturity of time deposits of $100,000 and over at December 31, 2006 is presented in Note 8 of the accompanying consolidated financial statements.
Advances were $3.2 million and $6.0 million at December 31, 2006 and 2005 respectively. In 2006, there were no new advances. There was $1.7 million in new advances in 2005 for the matched funding loan program. Additional information on the Federal Home Loan Bank Advances is presented in Note 10 of the accompanying consolidated financial statements.
Shareholders’ equity increased $2.1 million during 2006 to $39.1 million at December 31, 2006 from $37.0 million at December 31, 2005. This increase was the result of $5.2 million in net earnings during the year, a net unrealized gain on securities available for sale of $.1 million, and Cash Dividends paid totaling $2.2 million. The Company also purchased treasury stock for $1.0 million. Treasury stock purchases are monitored against the Company’s Strategic Plan and the goals set forth in the plan. The Treasury stock purchases have not exceeded the Strategic Plan’s guidelines for 2006.
Market Risk and Asset/Liability Management
Our primary market risk exposure is interest rate risk and, to a lesser extent, liquidity risk. Because of the nature of our operations, we are not subject to currency exchange or commodity price risk and, since we have no trading portfolio, it is not subject to trading risk. Currently, we have equity securities that represent only 2.5% of its investment portfolio and, therefore, equity price risk is not significant.
We actively manage interest rate sensitivity and asset/liability products through an asset/liability management committee. The principle objectives of asset-liability management are to maximize current net interest income while minimizing the risk to future earnings of negative fluctuations in net interest margin and to insure adequate liquidity exists to meet operational needs.
Management expected interest rates to rise in 2006 from the forty plus year lows; therefore, we aligned the balance sheet for earning assets to reprice more quickly than liabilities, which resulted in the marked improvement in the net interest income. Management does not anticipate this trend to continue. The cost on average interest-bearing liabilities continues to increase while the current competitive loan-pricing environment exerts a downward pressure on the yields on loans, which was the main component of the increase in the net yield on earning assets in 2006. The net interest margin is expected to experience compression in 2007.
In an effort to reduce interest rate risk and protect itself from the negative effects or rapid or prolonged changes in interest rates, we have instituted certain asset and liability management measures, including underwriting long-term fixed rate loans that are saleable in the secondary market, offering longer term deposit products and diversifying the loan portfolio into shorter term consumer and commercial business loans. In addition, since the mid-1980’s, we have originated variable rate loans and as of December 31, 2006, they comprised approximately 77.9% of the total loan portfolio.
Liquidity
Liquidity represents our ability to meet normal cash flow requirements of our customers for the funding of loans and repayment of deposits. Both short-term and long-term liquidity needs are generally derived from the repayments and maturities of loans and investment securities, and the receipt of deposits. Management monitors liquidity daily, and on a monthly basis incorporates liquidity management into its asset/liability program. The assets defined as liquid are cash, cash equivalents, and the available for sale security portfolio. The liquidity ratio as of December 31, 2006 and 2005 are 25% and 16%, respectively.
Operating activities, as presented in the statement of cash flows in the accompanying consolidated financial statements, provided $5.3 million and $5.2 million in cash during 2006 and 2005 respectively, generated principally from net income.
Investing activities consist primarily of loan originations and repayments, investment purchases and maturities, and investment in technology. These activities used $5.6 million in funds during 2006 principally by the net purchases of investments and net purchase of fixed assets of $19.4 million and $.9 million respectively; and provided funds by the net payments of loans of $14.1 million and from the net proceeds from the sale of Other Real Estate Owned (OREO) totaling $.6 million. These activities provided $6.9 million in funds during 2005 principally by the net payments of loans and the net proceeds of investments of $7.5 million and $.7 million, respectively; and used funds for the net purchase of technology and fixed asset totaling $1.3 million.
Financing activities consisted of the solicitation and repayment of customer deposits, borrowings and repayments, purchase of treasury stock, and the payment of dividends. For 2006, financing activities provided $9.7 million, comprised mainly of net deposit increases of $13.9 million and net increase in short-term borrowings of $1.7 million; and used $5.9 million in funds in repayment of Federal Home Loan Bank advances of $2.7 million, purchase of treasury stock of $1.0 million and payment of dividends of $2.2 million.
For 2005, financing activities used $.4 million in funds, comprised mainly of net Federal Home Loan Bank advance repayments of $.9 million, net decrease in short-term borrowings of $.1 million, purchase of treasury stock of $1.0 million and payment of dividends of $1.4 million; and provided net deposit increases of $3.0 million.
In addition to using the loan, investment and deposit portfolios as sources of liquidity, we have access to funds from the Federal Home Loan Bank of Cincinnati. We also have a ready source of funds through the available-for-sale component of the investment securities portfolio.
Capital Resources
Capital adequacy is our ability to support growth while protecting the interests of shareholders and depositors. Bank regulatory agencies have developed certain capital ratio requirements, which are used to assist them in monitoring the safety and soundness of financial institutions. We continually monitor these capital requirements and believe the Company to be in compliance with these regulations at December 31, 2006.
Our regulatory capital position at December 31, 2006, as compared to the minimum regulatory capital requirements imposed on us by banking regulators at that date is presented in Note 17 of the accompanying consolidated financial statements. We are not aware of any actions contemplated by banking regulators, which would result in us being in non-compliance with capital requirements.
Impact of Inflation Changing Prices
The consolidated financial statements and the accompanying notes presented elsewhere in this document, have been prepared in accordance with accounting principles generally accepted in the United States of America, which require the measurement of financial position and operating results in terms of historical dollars without considering the change in the relative purchasing power of money over time and due to inflation. Unlike most industrial companies, virtually all of the assets and liabilities are monetary in nature. The impact of inflation is reflected in the increased cost of operations. As a result, interest rates have a greater impact on performance than do the effects of general levels of inflation. Interest rates do not necessarily move in the same direction or to the same extent as the prices of goods and services.
QUANTITATIVE AND QUALITATIVE DISCLOSURES ABOUT MARKET RISK
The Bank’s primary market risk exposure is interest rate risk and, to a lesser extent, liquidity risk. Because of the nature of the Bank’s operations, the Bank is not subject to currency exchange or commodity price risk and, since the Bank has no trading portfolio, it is not subject to trading risk. The Bank’s loan portfolio, concentrated primarily within the surrounding market area, is subject to risks associated with the local economy. Since all of the interest earning assets and interest bearing liabilities are located at the Bank, all of the interest rate risk lies at the Bank level. As a result, all significant interest rate risk management procedures are performed at the Bank level.
The Bank actively manages interest rate sensitivity and asset/liability products through an asset/liability management committee. The principle purposes of asset-liability management are to maximize current net interest income while minimizing the risk to future earnings of negative fluctuations in net interest margin and to insure adequate liquidity exists to meet operational needs.
In an effort to reduce interest rate risk and protect itself from the negative effects or rapid or prolonged changes in interest rates, the Bank has instituted certain asset and liability management measures, including underwriting long-term fixed rate loans that are saleable in the secondary market, offering longer term deposit products and diversifying the loan portfolio into shorter term consumer and commercial business loans. In addition, since the mid-1980’s, the Bank has originated variable rate loans and as of December 31, 2006, they comprised approximately 77.9% of the total loan portfolio.
One of the principal functions of the Company’s asset/liability management program is to monitor the level to which the balance sheet is subject to interest rate risk. The goal of this program is to manage the relationship between interest-earning assets and interest-bearing liabilities to minimize the fluctuations in the net interest spread and achieve consistent growth in net interest income during periods of changing interest rates.
Interest rate sensitivity is measured as the difference between the volume of assets and liabilities that are subject to repricing in a future period of time. These differences are known as interest sensitivity gaps. The Bank utilizes gap management as the primary means of measuring interest rate risk. Gap analysis identifies and quantifies the Bank’s exposure or vulnerability to changes in interest rates in relationship to the Bank’s interest rate sensitivity position. A rate sensitive asset or liability is one, which is capable of being repriced (i.e., the interest rate can be adjusted or principal can be reinvested) within a specified period of time. Subtracting total rate sensitive liabilities (RSL) from total rate sensitive assets (RSA) within specified time horizons nets the Bank’s gap positions. These gaps reflect the Bank’s exposure to changes in market interest rates, as discussed below.
Because many of the Bank’s deposit liabilities are capable of being immediately repriced, the Bank offers variable rate loan products in order to help maintain a proper balance in its ability to reprice various interest bearing assets and liabilities. Furthermore, the Bank’s deposit rates are not tied to an external index. As a result, although changing market interest rates impact repricing, the Bank has retained much of its control over repricing.
The Bank conducts the rate sensitivity analysis through the use of a simulation model which also monitors earnings at risk by projecting earnings of the Bank based upon an economic forecast of the most likely interest rate movement. The model also calculates earnings of the Bank based upon what are estimated to be the largest foreseeable rate increase and the largest foreseeable rate decrease. Such analysis translates interest rate movements and the Bank’s rate sensitivity position into dollar amounts by which earnings may fluctuate as a result of rate changes. A 2% immediate increase in interest rates would increase earnings by 14.8% and a 2% immediate decrease in interest rates would decrease earnings by 14.6%.
The data included in the table that follows indicates that the Bank is asset sensitive within one year. Generally, an asset sensitive gap could negatively affect net interest income in an environment of decreasing interest rates as a greater amount of interest bearing assets could be repricing at lower rates. During times of rising interest rates, an asset sensitive gap could positively affect net interest income as rates would be increased on a larger volume of assets as compared to deposits. As a result, interest income would increase more rapidly than interest expense. A liability sensitive gap indicates that declining interest rates could positively affect net interest income as expense of liabilities would decrease more rapidly than interest income would decline. Conversely, rising rates could negatively affect net interest income as income from assets would increase less rapidly than deposit costs. Although rate sensitivity analysis enables the Bank to minimize interest rate risk, the magnitude of rate increases or decreases on assets versus liabilities may not correlate directly. As a result, fluctuations in interest spreads can occur even when repricing capabilities are perfectly matched.
It is the policy of the Bank to generally maintain a gap ratio within a range that is minus 10 percent to plus 20 percent of total assets for the time horizon of one year. When Management believes that interest rates will increase it can take actions to increase the RSA/RSL ratios. When Management believes interest rates will decline, it can take actions to decrease the RSA/RSL ratio.
During 2006, the Bank’s focus was on spreading out the maturities of time deposits within the one to five year time frame while continuing to make variable rate loans. The above strategy was implemented to better position the Bank for rate changes in a rising rate environment. The strategy was successful as earnings were positively impacted. The Bank’s asset/liability management focus for 2007 will include improving the Bank’s rate sensitivity gap. As noted above, at December 31, 2006 the Bank was asset sensitive; however, the cumulative rate sensitivity gap was such that the Bank’s earnings and capital should not be materially affected by the repricing of assets and liabilities due to decreases in interest rates in 2007.
Changes in market interest rates can also affect the Bank’s liquidity position through the impact rate changes may have on the market value of the Bank’s investment portfolio. Rapid increases in market rates can negatively impact the market values of investment securities. As securities values decline it becomes more difficult to sell investments to meet liquidity demands without incurring a loss. The Bank can address this by increasing liquid funds, which may be utilized to meet unexpected liquidity needs when a decline occurs in the value of securities.
The following table presents the Bank’s interest rate sensitivity gap position as of December 31, 2006 (dollars in thousands):
INTEREST RATE SENSITIVITY GAPS
(IN THOUSANDS)
| | | | | | | | | | | | | | | | | | | | | | | | | | | |
| | | 2007 | | | 2008 | | | 2009 | | | 2010 | | | 2011 | | | Thereafter | | | Total |
Interest-earnings assets: | | | | | | | | | | | | | | | | | | | | | | | | | | | |
Loans: | | | | | | | | | | | | | | | | | | | | | | | | | | | |
Fixed | | $ | 14,558 | | | $ | 6,861 | | | $ | 5,498 | | | $ | 2,686 | | | $ | 2,620 | | | $ | 10,703 | | | $ | 42,926 |
Variable | | | 128,773 | | | | 1,827 | | | | 12,359 | | | | 635 | | | | 8,042 | | | | 61 | | | | 151,697 |
Securities: | | | | | | | | | | | | | | | | | | | | | | | | | | | |
Fixed | | | 7,352 | | | | 8,249 | | | | 10,703 | | | | 11,963 | | | | 14,244 | | | | 12,235 | | | | 64,746 |
Variable | | | — | | | | — | | | | — | | | | — | | | | — | | | | — | | | | — |
Other interest-earning assets | | | 28,146 | | | | — | | | | — | | | | — | | | | — | | | | — | | | | 28,146 |
| | | | | | | | | | | | | | | | | | | | | | | | | | | |
Total interest-earning assets | | | 178,829 | | | | 16,937 | | | | 28,560 | | | | 15,284 | | | | 24,906 | | | | 22,999 | | | | 287,515 |
| | | | | | | | | | | | | | | | | | | | | | | | | | | |
| | | | | | | |
Interest-bearing liabilities: | | | | | | | | | | | | | | | | | | | | | | | | | | | |
Demand and savings deposits | | | 25,687 | | | | 25,687 | | | | 25,687 | | | | 25,685 | | | | — | | | | — | | | | 102,746 |
Time deposits: | | | | | | | | | | | | | | | | | | | | | | | | | | | |
Fixed | | | 91,339 | | | | 25,328 | | | | 11,671 | | | | 2,721 | | | | 1,265 | | | | 15 | | | | 132,339 |
Variable | | | — | | | | — | | | | — | | | | — | | | | — | | | | — | | | | — |
Short-term borrowings | | | 5,310 | | | | — | | | | — | | | | — | | | | — | | | | — | | | | 5,310 |
FHLB advances | | | 689 | | | | 667 | | | | 649 | | | | 567 | | | | 229 | | | | 443 | | | | 3,244 |
| | | | | | | | | | | | | | | | | | | | | | | | | | | |
Total interest-bearing liabilities | | | 123,025 | | | | 51,682 | | | | 38,007 | | | | 28,973 | | | | 1,494 | | | | 458 | | | | 243,639 |
| | | | | | | | | | | | | | | | | | | | | | | | | | | |
Interest rate sensitivity gap | | | 55,804 | | | | (34,745 | ) | | | (9,447 | ) | | | (13,689 | ) | | | 23,412 | | | | 22,541 | | | | |
| | | | | | | | | | | | | | | | | | | | | | | | | | | |
Cumulative rate sensitivity gap | | $ | 55,804 | | | $ | 21,059 | | | $ | 11,612 | | | $ | (2,077 | ) | | $ | 21,335 | | | $ | 43,876 | | | | |
| | | | | | | | | | | | | | | | | | | | | | | | | | | |
Cumulative interest rate sensitivity gap as a percent of interest earning assets | | | 19.41 | % | | | 7.32 | % | | | 4.04 | % | | | -0.72 | % | | | 7.42 | % | | | 15.26 | % | | | |
| | | | | | | | | | | | | | | | | | | | | | | | | | | |
Killbuck Bancshares, Inc.
Killbuck, Ohio
Audit Report
December 31, 2006
Killbuck Bancshares, Inc.
AUDITED CONSOLIDATED FINANCIAL STATEMENTS
DECEMBER 31, 2006
Report of Independent Registered Public Accounting Firm
The Board of Directors and Shareholders
Killbuck Bancshares, Inc.
We have audited the accompanying consolidated balance sheet of Killbuck Bancshares, Inc. and subsidiary as of December 31, 2006 and 2005, and the related consolidated statements of income, changes in shareholders’ equity, and cash flows for each of the three years in the period ended December 31, 2006. These financial statements are the responsibility of the Company’s management. Our responsibility is to express an opinion on these financial statements based on our audits.
We conducted our audits in accordance with the standards of the Public Company Accounting Oversight Board (United States). Those standards require that we plan and perform the audit to obtain reasonable assurance about whether the financial statements are free of material misstatement. An audit includes examining, on a test basis, evidence supporting the amounts and disclosures in the financial statements. An audit also includes assessing the accounting principles used and significant estimates made by management, as well as evaluating the overall financial statement presentation. We believe that our audits provide a reasonable basis for our opinion.
In our opinion, the consolidated financial statements referred to above present fairly, in all material respects, the financial position of Killbuck Bancshares, Inc. and subsidiary as of December 31, 2006 and 2005, and the results of their operations and their cash flows for each of the three years in the period ended December 31, 2006 in conformity with U.S. generally accepted accounting principles.
/s/ S.R. Snodgrass, A.C.
Steubenville, Ohio
February 20, 2007
-2-
Killbuck Bancshares, Inc.
CONSOLIDATED BALANCE SHEET
| | | | | | | | |
| | | December 31, | |
| | | 2006 | | | 2005 | |
ASSETS | | | | | | | | |
Cash and cash equivalents: | | | | | | | | |
Cash and amounts due from depository institutions | | $ | 14,732,362 | | | $ | 15,031,294 | |
Federal funds sold | | | 27,973,000 | | | | 18,300,000 | |
| | | | | | | | |
Total cash and cash equivalents | | | 42,705,362 | | | | 33,331,294 | |
| | | | | | | | |
| | |
Investment securities: | | | | | | | | |
Securities available for sale | | | 34,752,975 | | | | 14,307,200 | |
Securities held to maturity (fair value of $30,684,221 and $31,696,907) | | | 29,992,583 | | | | 30,770,829 | |
| | | | | | | | |
Total investment securities | | | 64,745,558 | | | | 45,078,029 | |
| | | | | | | | |
| | |
Loans (net of allowance for loan losses of $2,393,705 and $2,313,313) | | | 191,932,069 | | | | 206,241,946 | |
| | |
Loans held for sale | | | 172,500 | | | | 94,600 | |
Premises and equipment, net | | | 5,713,596 | | | | 5,834,516 | |
Accrued interest receivable | | | 1,396,267 | | | | 1,145,875 | |
Goodwill, net | | | 1,329,249 | | | | 1,329,249 | |
Other assets | | | 5,210,886 | | | | 4,994,451 | |
| | | | | | | | |
Total assets | | $ | 313,205,487 | | | $ | 298,049,960 | |
| | | | | | | | |
| | |
LIABILITIES | | | | | | | | |
Deposits: | | | | | | | | |
Noninterest bearing demand | | $ | 48,693,192 | | | $ | 51,130,983 | |
Interest bearing demand | | | 30,473,620 | | | | 32,244,405 | |
Money market | | | 15,050,083 | | | | 14,716,407 | |
Savings | | | 37,744,514 | | | | 42,347,138 | |
Time | | | 132,339,103 | | | | 109,910,217 | |
| | | | | | | | |
Total deposits | | | 264,300,512 | | | | 250,349,150 | |
Federal Home Loan Bank advances | | | 3,243,371 | | | | 5,989,051 | |
Short-term borrowings | | | 5,310,281 | | | | 3,610,000 | |
Accrued interest and other liabilities | | | 1,217,526 | | | | 1,052,456 | |
| | | | | | | | |
Total liabilities | | | 274,071,690 | | | | 261,000,657 | |
| | | | | | | | |
| | |
SHAREHOLDERS’ EQUITY | | | | | | | | |
Common stock – No par value: 1,000,000 shares authorized, 718,431 issued | | | 8,846,670 | | | | 8,846,670 | |
Retained earnings | | | 37,315,334 | | | | 34,332,104 | |
Accumulated other comprehensive income | | | 4,892 | | | | (64,736 | ) |
Treasury stock, at cost (79,789 and 70,671 shares) | | | (7,033,099 | ) | | | (6,064,735 | ) |
| | | | | | | | |
| | |
Total shareholders’ equity | | | 39,133,797 | | | | 37,049,303 | |
| | | | | | | | |
| | |
Total liabilities and shareholders’ equity | | $ | 313,205,487 | | | $ | 298,049,960 | |
| | | | | | | | |
See accompanying notes to the consolidated financial statements.
-3-
Killbuck Bancshares, Inc.
CONSOLIDATED STATEMENT OF INCOME
| | | | | | | | | |
| | | Year Ended December 31, |
| | | 2006 | | 2005 | | 2004 |
INTEREST INCOME | | | | | | | | | |
Interest and fees on loans | | $ | 16,381,634 | | $ | 14,224,557 | | $ | 11,656,645 |
Federal funds sold | | | 1,071,435 | | | 392,963 | | | 92,160 |
Investment securities: | | | | | | | | | |
Taxable | | | 1,179,370 | | | 475,958 | | | 583,917 |
Exempt from federal income tax | | | 1,405,745 | | | 1,524,894 | | | 1,700,170 |
| | | | | | | | | |
Total interest income | | | 20,038,184 | | | 16,618,372 | | | 14,032,892 |
| | | | | | | | | |
| | | |
INTEREST EXPENSE | | | | | | | | | |
Deposits | | | 5,559,002 | | | 3,841,007 | | | 2,988,827 |
Federal Home Loan Bank advances | | | 243,602 | | | 280,628 | | | 267,509 |
Short term borrowings | | | 116,882 | | | 47,447 | | | 7,844 |
| | | | | | | | | |
Total interest expense | | | 5,919,486 | | | 4,169,082 | | | 3,264,180 |
| | | | | | | | | |
| | | |
NET INTEREST INCOME | | | 14,118,698 | | | 12,449,290 | | | 10,768,712 |
Provision for loan losses | | | 214,514 | | | 376,722 | | | 225,000 |
| | | | | | | | | |
| | | |
NET INTEREST INCOME AFTER PROVISION FOR LOAN LOSSES | | | 13,904,184 | | | 12,072,568 | | | 10,543,712 |
| | | | | | | | | |
| | | |
NONINTEREST INCOME | | | | | | | | | |
Service charges on deposit accounts | | | 955,388 | | | 824,306 | | | 803,823 |
Gain on sale of loans, net | | | 35,207 | | | 72,492 | | | 62,777 |
Other income | | | 316,464 | | | 367,670 | | | 148,615 |
| | | | | | | | | |
Total other income | | | 1,307,059 | | | 1,264,468 | | | 1,015,215 |
| | | | | | | | | |
| | | |
NONINTEREST EXPENSE | | | | | | | | | |
Salaries and employee benefits | | | 4,543,331 | | | 4,288,850 | | | 3,987,149 |
Occupancy and equipment | | | 974,553 | | | 934,534 | | | 974,517 |
Other expense | | | 2,478,005 | | | 2,389,316 | | | 2,196,676 |
| | | | | | | | | |
Total other expense | | | 7,995,889 | | | 7,612,700 | | | 7,158,342 |
| | | | | | | | | |
| | | |
INCOME BEFORE INCOME TAXES | | | 7,215,354 | | | 5,724,336 | | | 4,400,585 |
Income taxes | | | 1,991,961 | | | 1,513,468 | | | 981,177 |
| | | | | | | | | |
| | | |
NET INCOME | | $ | 5,223,393 | | $ | 4,210,868 | | $ | 3,419,408 |
| | | | | | | | | |
EARNINGS PER SHARE | | $ | 8.14 | | $ | 6.44 | | $ | 5.16 |
| | | | | | | | | |
WEIGHTED AVERAGE SHARES OUTSTANDING | | | 642,141 | | | 654,289 | | | 662,415 |
| | | | | | | | | |
See accompanying notes to the consolidated financial statements.
-4-
Killbuck Bancshares, Inc.
CONSOLIDATED STATEMENT OF CHANGES IN SHAREHOLDERS’ EQUITY
| | | | | | | | | | | | | | | | | | | | | | | |
| | | Common
Stock | | Retained
Earnings | | | Accumulated Other
Comprehensive
Income (Loss) | | | Treasury
Stock | | | Total
Shareholders’ Equity | | | Comprehensive
Income | |
BALANCE, DECEMBER 31, 2003 | | | 8,846,670 | | | 29,430,710 | | | | 166,471 | | | | (4,382,297 | ) | | | 34,061,554 | | | | | |
| | | | | | |
Net income | | | | | | 3,419,408 | | | | | | | | | | | | 3,419,408 | | | $ | 3,419,408 | |
Other comprehensive income: | | | | | | | | | | | | | | | | | | | | | | | |
Unrealized loss on available for sale securities, net of tax benefit of $67,624 | | | | | | | | | | (131,270 | ) | | | | | | | (131,270 | ) | | | (131,270 | ) |
| | | | | | | | | | | | | | | | | | | | | | | |
Comprehensive income | | | | | | | | | | | | | | | | | | | | | $ | 3,288,138 | |
| | | | | | | | | | | | | | | | | | | | | | | |
Cash dividends paid ($1.95 per share) | | | | | | (1,291,144 | ) | | | | | | | | | | | (1,291,144 | ) | | | | |
Purchase of Treasury Stock, at cost (7,302 shares) | | | | | | | | | | | | | | (699,614 | ) | | | (699,614 | ) | | | | |
| | | | | | | | | | | | | | | | | | | | | | | |
| | | | | | |
BALANCE, DECEMBER 31, 2004 | | | 8,846,670 | | | 31,558,974 | | | | 35,201 | | | | (5,081,911 | ) | | | 35,358,934 | | | | | |
| | | | | | |
Net income | | | | | | 4,210,868 | | | | | | | | | | | | 4,210,868 | | | $ | 4,210,868 | |
Other comprehensive income: | | | | | | | | | | | | | | | | | | | | | | | |
Unrealized loss on available for sale securities, net of tax benefit of $51,483 | | | | | | | | | | (99,937 | ) | | | | | | | (99,937 | ) | | | (99,937 | ) |
| | | | | | | | | | | | | | | | | | | | | | | |
Comprehensive income | | | | | | | | | | | | | | | | | | | | | $ | 4,110,931 | |
| | | | | | | | | | | | | | | | | | | | | | | |
Cash dividends paid ($2.20 per share) | | | | | | (1,437,738 | ) | | | | | | | | | | | (1,437,738 | ) | | | | |
Purchase of Treasury Stock, at cost (9,726 shares) | | | | | | | | | | | | | | (982,824 | ) | | | (982,824 | ) | | | | |
| | | | | | | | | | | | | | | | | | | | | | | |
| | | | | | |
BALANCE, DECEMBER 31, 2005 | | | 8,846,670 | | | 34,332,104 | | | | (64,736 | ) | | | (6,064,735 | ) | | | 37,049,303 | | | | | |
| | | | | | |
Net income | | | | | | 5,223,393 | | | | | | | | | | | | 5,223,393 | | | $ | 5,223,393 | |
Other comprehensive income: | | | | | | | | | | | | | | | | | | | | | | | |
Unrealized gain on available for sale securities, net of tax of $35,869 | | | | | | | | | | 69,628 | | | | | | | | 69,628 | | | | 69,628 | |
| | | | | | | | | | | | | | | | | | | | | | | |
Comprehensive income | | | | | | | | | | | | | | | | | | | | | $ | 5,293,021 | |
| | | | | | | | | | | | | | | | | | | | | | | |
Cash dividends paid ($3.50 per share) | | | | | | (2,240,163 | ) | | | | | | | | | | | (2,240,163 | ) | | | | |
Purchase of Treasury Stock, at cost (9,118 shares) | | | | | | | | | | | | | | (968,364 | ) | | | (968,364 | ) | | | | |
| | | | | | | | | | | | | | | | | | | | | | | |
| | | | | | |
BALANCE, DECEMBER 31, 2006 | | $ | 8,846,670 | | $ | 37,315,334 | | | $ | 4,892 | | | $ | (7,033,099 | ) | | $ | 39,133,797 | | | | | |
| | | | | | | | | | | | | | | | | | | | | | | |
See accompanying notes to the consolidated financial statements.
-5-
Killbuck Bancshares, Inc.
CONSOLIDATED STATEMENT OF CASH FLOWS
| | | | | | | | | | | | |
| | | Year Ended December 31, | |
| | | 2006 | | | 2005 | | | 2004 | |
OPERATING ACTIVITIES | | | | | | | | | | | | |
Net income | | $ | 5,223,393 | | | $ | 4,210,868 | | | $ | 3,419,408 | |
Adjustments to reconcile net income to net cash provided by operating activities: | | | | | | | | | | | | |
Provision for loan losses | | | 214,514 | | | | 376,722 | | | | 225,000 | |
Depreciation, amortization and accretion, net | | | 294,640 | | | | 282,704 | | | | 395,031 | |
Gain on sale of loans, net | | | (35,207 | ) | | | (72,492 | ) | | | (62,777 | ) |
Origination of loans held for sale | | | (8,691,135 | ) | | | (12,287,154 | ) | | | (11,567,660 | ) |
Proceeds from the sale of loans | | | 8,648,442 | | | | 12,432,545 | | | | 11,984,386 | |
Federal Home Loan Bank stock dividend | | | (72,200 | ) | | | (55,200 | ) | | | (46,500 | ) |
Net changes in: | | | | | | | | | | | | |
Accrued interest and other assets | | | (364,131 | ) | | | (196,631 | ) | | | (2,838,759 | ) |
Accrued interest and other liabilities | | | 98,705 | | | | 457,997 | | | | 39,800 | |
| | | | | | | | | | | | |
Net cash provided by operating activities | | | 5,317,021 | | | | 5,149,359 | | | | 1,547,929 | |
| | | | | | | | | | | | |
| | | |
INVESTING ACTIVITIES | | | | | | | | | | | | |
Investment securities available for sale: | | | | | | | | | | | | |
Proceeds from maturities and repayments | | | 2,564,933 | | | | 5,246,396 | | | | 8,202,151 | |
Purchases | | | (22,874,680 | ) | | | (9,951,484 | ) | | | (563,104 | ) |
Investment securities held to maturity: | | | | | | | | | | | | |
Proceeds from maturities and repayments | | | 5,174,959 | | | | 5,743,430 | | | | 4,843,728 | |
Purchases | | | (4,346,635 | ) | | | (396,456 | ) | | | (235,000 | ) |
Net decrease (increase) in loans | | | 14,095,363 | | | | 7,542,647 | | | | (15,758,177 | ) |
Purchase of premises and equipment | | | (874,329 | ) | | | (1,269,333 | ) | | | (329,272 | ) |
Net proceeds OREO other real estate owned | | | 620,000 | | | | — | | | | — | |
| | | | | | | | | | | | |
Net cash (used in) provided by investing activities | | | (5,640,389 | ) | | | 6,915,200 | | | | (3,839,674 | ) |
| | | | | | | | | | | | |
| | | |
FINANCING ACTIVITIES | | | | | | | | | | | | |
Net increase in deposits | | | 13,951,362 | | | | 3,000,389 | | | | 5,624,947 | |
Proceeds from Federal Home Loan Bank advances | | | — | | | | 1,700,000 | | | | 6,035,000 | |
Repayment of Federal Home Loan Bank advances | | | (2,745,680 | ) | | | (2,556,291 | ) | | | (2,634,463 | ) |
Net increase (decrease) in short-term borrowings | | | 1,700,281 | | | | (120,000 | ) | | | (635,000 | ) |
Purchase of treasury shares | | | (968,364 | ) | | | (982,824 | ) | | | (699,614 | ) |
Cash dividends paid | | | (2,240,163 | ) | | | (1,437,738 | ) | | | (1,291,144 | ) |
| | | | | | | | | | | | |
Net cash provided by (used in) financing activities | | | 9,697,436 | | | | (396,464 | ) | | | 6,399,726 | |
| | | | | | | | | | | | |
Increase (decrease) in cash and cash equivalents | | | 9,374,068 | | | | 11,668,095 | | | | 4,107,981 | |
| | | |
Cash and cash equivalents at beginning of year | | | 33,331,294 | | | | 21,663,199 | | | | 17,555,218 | |
| | | | | | | | | | | | |
| | | |
Cash and cash equivalents at end of year | | $ | 42,705,362 | | | $ | 33,331,294 | | | $ | 21,663,199 | |
| | | | | | | | | | | | |
See accompanying notes to the consolidated financial statements.
-6-
Killbuck Bancshares, Inc.
NOTES TO CONSOLIDATED FINANCIAL STATEMENTS
| 1. | SUMMARY OF SIGNIFICANT ACCOUNTING POLICIES |
A summary of the significant accounting and reporting policies applied in the presentation of the consolidated financial statements follows:
Nature of Operations and Basis of Presentation
Killbuck Bancshares, Inc. (the “Company”) is an Ohio corporation organized as the holding company of The Killbuck Savings Bank Company (the “Bank”). The Bank is a state-chartered bank located in Ohio. The Company and its subsidiary operate in the single industry of commercial banking and derive substantially all their income from banking and bank-related services which include interest earnings on residential real estate, commercial mortgage, commercial and consumer loan financing as well as interest earnings on investment securities and charges for deposit services to its customers through nine full service branches and one loan production office. The Board of Governors of the Federal Reserve System supervises the Company and Bank, while the Bank is also subject to regulation and supervision by the Ohio Division of Financial Institutions.
The consolidated financial statements of the Company include its wholly owned subsidiary, the Bank. All intercompany transactions have been eliminated in consolidation. The investment in subsidiary on the parent company financial statements is carried at the parent company’s equity in the underlying net assets.
The accounting principles followed by the Company and the methods of applying these principles conform with U.S. generally accepted accounting principles and with general practice within the banking industry. In preparing the financial statements, management is required to make estimates and assumptions that affect the reported amounts of assets and liabilities as of the consolidated balance sheet date and related revenues and expenses for the period. Actual results may differ significantly from those estimates.
Investment Securities
Investment securities are classified, at the time of purchase, based upon management’s intention and ability, as securities held to maturity or securities available for sale. Debt securities acquired with the intent and ability to hold to maturity are stated at cost adjusted for amortization of premium and accretion of discount which are computed using the level yield method. Certain other debt and equity securities have been classified as available for sale to serve principally as a source of liquidity. Unrealized holding gains and losses on available for sale securities are reported as a separate component of shareholders’ equity, net of tax, until realized. Realized securities gains and losses are computed using the specific identification method. Interest and dividends on investment securities are recognized as income when earned.
Common stock of the Federal Home Loan Bank, Federal Reserve Bank and Great Lakes Bankers Bank represent ownership in institutions, which are wholly-owned by other financial institutions. These securities are accounted for at cost and are classified with other assets.
Bank-Owned Life Insurance (BOLI)
The Company purchased life insurance policies on certain key employees. BOLI is recorded at its cash surrender value or the amount that can be realized.
-7-
Loans
Loans are stated at their outstanding principal, less the allowance for loan losses and any net deferred loan fees. Interest income on loans is recognized on the accrual method. Accrual of interest on loans is generally discontinued when it is determined that a reasonable doubt exists as to the collectibility of principal, interest, or both. Loans are returned to accrual status when past due interest is collected, and the collection of principal is probable.
Loan origination and commitment fees, as well as certain direct origination costs, are deferred and amortized as a yield adjustment over the lives of the related loans using the interest method. Amortization of deferred loan fees is discontinued when a loan is placed on nonaccrual status.
Mortgage loans originated and held for sale in the secondary market are carried at the lower of cost or market value determined on an aggregate basis. Net unrealized losses are recognized in a valuation allowance through charges to income. Gains and losses on the sale of loans held for sale are determined using the specific identification method. All loans are sold to Freddie Mac.
Allowance for Loan Losses
The allowance for loan losses represents the amount which management estimates is adequate to provide for probable losses inherent in its loan portfolio. The allowance method is used in providing for loan losses. Accordingly, all loan losses are charged to the allowance, and all recoveries are credited to it. The allowance for loan losses is established through a provision for loan losses which is charged to operations. The provision is based upon management’s periodic evaluation of individual loans, the overall risk characteristics of the various portfolio segments, past experience with losses, the impact of economic conditions on borrowers, and other relevant factors. The estimates used in determining the adequacy of the allowance for loan losses including the amounts and timing of future cash flows expected on impaired loans, are particularly susceptible to significant change in the near term.
Impaired loans are commercial and commercial real estate loans for which it is probable that the Company will not be able to collect all amounts due according to the contractual terms of the loan agreement. The Company individually evaluates such loans for impairment and does not aggregate loans by major risk classifications. The definition of “impaired loans” is not the same as the definition of “nonaccrual loans,” although the two categories overlap. The Company may choose to place a loan on nonaccrual status due to payment delinquency or uncertain collectibility, while not classifying the loan as impaired, provided the loan is not a commercial or commercial real estate classification. Factors considered by management in determining impairment include payment status and collateral value. The amount of impairment for these types of loans is determined by the difference between the present value of the expected cash flows related to the loan, using the original interest rate, and its recorded value, or as a practical expedient in the case of collateralized loans, the difference between the fair value of the collateral and the recorded amount of the loans. When foreclosure is probable, impairment is measured based on the fair value of the collateral.
Mortgage loans secured by one-to-four family properties and all consumer loans are large groups of smaller balance homogeneous loans and are measured for impairment collectively. Loans that experience insignificant payment delays, which are defined as 90 days or less, generally are not classified as impaired. Management determines the significance of payment delays on a case-by-case basis, taking into consideration all of the circumstances concerning the loan, the credit worthiness and payment history of the borrower, the length of the payment delay, and the amount of shortfall in relation to the principal and interest owed.
-8-
Premises and Equipment
Premises and equipment are stated at cost, less accumulated depreciation. Depreciation is principally computed on the straight-line method over the estimated useful lives of the related assets, which range from three to ten years for furniture, fixtures and equipment and 25 to 50 years for building premises. Leasehold improvements are amortized over the shorter of their estimated useful lives or their respective lease terms, which range from seven to fifteen years. Expenditures for maintenance and repairs are charged against income as incurred. Costs of major additions and improvements are capitalized.
Real Estate Owned
Real estate acquired in settlement of loans is stated at the lower of the recorded investment in the property or its fair value minus estimated costs of sale. Prior to foreclosure the value of the underlying collateral is written down by a charge to the allowance for loan losses if necessary. Any subsequent write-downs are charged against operating expenses. Operating expenses of such properties, net of related income and losses on their disposition, are included in other expenses.
Intangible Assets
Goodwill represents the amount by which the market value of the stock issued in the merger of Commercial Saving Bank Co. (Commercial) of Danville, Ohio with and into The Killbuck Savings Bank Company exceeded the market value of the assets, liabilities and capital of Commercial on the date of the merger. As of December 31, 2006 and 2005 respectively, net goodwill was $1,329,249 and $1,329,249. The Company adopted Statement of Financial Accounting Standards (“FAS”) No. 142,Goodwill and Other Intangible Assets, which changed the accounting for goodwill from an amortization method to an impairment-only approach. This statement eliminates the regularly scheduled amortization of goodwill and replaces this method with a two-step process for testing the impairment of goodwill on at least an annual basis. This approach could cause more volatility in the Company’s reported net income because impairment losses, if any, could occur irregularly and in varying amounts.
Mortgage Servicing Rights (“MSRs”)
The Company has agreements for the express purpose of selling loans in the secondary market. The Company maintains all servicing rights for these loans. Originated MSRs are recorded by allocating total costs incurred between the loan and servicing rights based on their relative fair values. MSRs are amortized in proportion to the estimated servicing income over the estimated life of the servicing portfolio. Impairment is evaluated based on the fair value of the right, based on portfolio interest rates and prepayment characteristics. MSRs are a component of other assets on the Consolidated Balance Sheet.
Employee Benefits Plans
The Bank maintains an integrated money purchase pension plan and a 401(K) plan covering eligible employees. The Bank’s contributions are based upon the plan’s contribution formula.
-9-
Recent Accounting Pronouncements
In February 2006, the Financial Accounting Standards Board (“FASB”) issued Statement of Financial Accounting Standards (“FAS”) No. 155,Accounting for Certain Hybrid Instruments, as an amendment of FASB Statements No. 133 and 140. FAS No. 155 allows financial instruments that have embedded derivatives to be accounted for as a whole (eliminating the need to bifurcate the derivative from its host) if the holder elects to account for the whole instrument on a fair value basis. This statement is effective for all financial instruments acquired or issued after the beginning of an entity’s first fiscal year that begins after September 15, 2006. The adoption of this standard is not expected to have a material effect on the Company’s results of operations or financial position.
In March 2006, the FASB issued FAS No. 156,Accounting for Servicing of Financial Assets. This statement, which is an amendment to FAS No. 140, will simplify the accounting for servicing assets and liabilities, such as those common with mortgage securitization activities. Specifically, FAS No. 156 addresses the recognition and measurement of separately recognized servicing assets and liabilities and provides an approach to simplify efforts to obtain hedge-like (offset) accounting. FAS No. 156 also clarifies when an obligation to service financial assets should be separately recognized as a servicing asset or a servicing liability; requires that a separately recognized servicing asset or servicing liability be initially measured at fair value, if practicable; and permits an entity with a separately recognized servicing asset or servicing liability to choose either of the amortization or fair value methods for subsequent measurement. The provisions of FAS No. 156 are effective as of the beginning of the first fiscal year that begins after September 15, 2006. The adoption of this standard is not expected to have a material effect on the Company’s results of operations or financial position.
In September 2006, the FASB issued FAS No. 157,Fair Value Measurements, which provides enhanced guidance for using fair value to measure assets and liabilities. The standard applies whenever other standards require or permit assets or liabilities to be measured at fair value. The standard does not expand the use of fair value in any new circumstances. FAS No. 157 is effective for financial statements issued for fiscal years beginning after November 15, 2007, and interim periods within those fiscal years. Early adoption is permitted. The adoption of this standard is not expected to have a material effect on the Company’s results of operations or financial position.
In September 2006, the FASB issued FAS No. 158,Employers’ Accounting for Defined Benefit Pension and Other Postretirement Plans, an amendment of FASB Statements No. 87, 88, 106 and 132(R). FAS No. 158 requires that a company recognize the overfunded or underfunded status of its defined benefit post retirement plans (other than multiemployer plans) as an asset or liability in its statement of financial position and that it recognize changes in the funded status in the year in which the changes occur through other comprehensive income. FAS No. 158 also requires the measurement of defined benefit plan assets and obligations as of the fiscal year-end, in addition to footnote disclosures. FAS No. 158 is effective for fiscal years ending after December 15, 2006. The adoption of this standard is not expected to have a material effect on the Company’s results of operations or financial position.
In June 2006, the FASB issued FASB Interpretation No. 48 (“FIN 48”),Accounting for Uncertainty in Income Taxes. FIN 48 is an interpretation of FAS No. 109,Accounting for Income Taxes, and it seeks to reduce the diversity in practice associated with certain aspects of measurement and recognition in accounting for income taxes. This Interpretation clarifies that management is expected to evaluate an income tax position taken or expected to be taken for likelihood of realization before recording any amounts for such position in the financial statement. FIN 48 also requires expanded disclosure with respect to income tax positions taken that are not certain to be realized. This Interpretation is effective for fiscal years beginning after December 15, 2006, and will require management to evaluate every open tax position that exists in every jurisdiction on the date of initial adoption. The Company is currently evaluating the impact the adoption of the standard will have on the Company’s results of operations.
-10-
In September 2006, the FASB reached consensus on the guidance provided by Emerging Issues Task Force Issue 06-4 (“EITF 06-4”),Accounting for Deferred Compensation and Postretirement Benefit Aspects of Endorsement Split-Dollar Life Insurance Arrangements. The guidance is applicable to endorsement split-dollar life insurance arrangements, whereby the employer owns and controls the insurance policy, that are associated with a postretirement benefit. EITF 06-4 requires that for a split-dollar life insurance arrangement within the scope of the issue, an employer should recognize a liability for future benefits in accordance with FAS No. 106 (if, in substance, a postretirement benefit plan exists) or Accounting Principles Board Opinion No. 12 (if the arrangement is, in substance, an individual deferred compensation contract) based on the substantive agreement with the employee. EITF 06-4 is effective for fiscal years beginning after December 15, 2007. The Company is currently evaluating the impact the adoption of the standard will have on the Company’s results of operations or financial condition.
In September 2006, the FASB reached consensus on the guidance provided by Emerging Issues Task Force Issue 06-5(“EITF 06-5”),Accounting for Purchases of Life Insurance—Determining the Amount That Could Be Realized in Accordance with FASB Technical Bulletin No. 85-4, Accounting for Purchases of Life Insurance. EITF 06-5 states that a policyholder should consider any additional amounts included in the contractual terms of the insurance policy other than the cash surrender value in determining the amount that could be realized under the insurance contract. EITF 06-5 also states that a policyholder should determine the amount that could be realized under the life insurance contract assuming the surrender of an individual-life by individual-life policy (or certificate by certificate in a group policy). EITF 06-5 is effective for fiscal years beginning after December 15, 2006. The Company is currently evaluating the impact the adoption of the standard will have on the Company’s results of operations or financial condition.
Income Taxes
The Company and its subsidiary file a consolidated federal income tax return. Income tax expense is allocated among the parent company and the subsidiary as if each had filed a separate return. Deferred tax assets and liabilities are reflected at currently enacted income tax rates applicable to the period in which the deferred tax assets or liabilities are expected to be realized or settled. As changes in tax laws or rates are enacted, deferred tax assets and liabilities are adjusted through the provision for income taxes. Deferred income tax expenses or benefits are based on the changes in the deferred tax asset or liability from period to period.
Earnings Per Share
The Company currently maintains a simple capital structure; therefore, there are no dilutive effects on earnings per share. As such, earnings per share are calculated using the weighted average number of share outstanding for the period.
Comprehensive Income
The Company is required to present comprehensive income in a full set of general purpose financial statements for all periods presented. Other comprehensive income is comprised exclusively of unrealized holding gains and losses on the available for sale securities portfolio. The Company has elected to report the effects of other comprehensive income as part of the Consolidated Statement of Changes in Shareholders’ Equity.
Cash Flow Information
For purposes of reporting cash flows, cash and cash equivalents include cash and amounts due from financial institutions and federal funds sold. Cash payments for interest in 2006, 2005 and 2004 were $5,817,972, $4,086,202, and $3,275,495, respectively. Cash payments for income taxes for 2006, 2005, and 2004 were $1,981,287, $1,233,912, and $883,858 respectively.
Reclassification of Comparative Amounts
Certain amounts in the prior year consolidated financial statements have been reclassified to conform to the current year presentation. These reclassifications had no effect on shareholders’ equity or net income.
-11-
Federal funds sold at December 31 consists of the following:
| | | | | | | | | | | | | | | | |
| | | 2006 | | 2005 |
Institution | | Rate | | | Maturity | | Balance | | Rate | | | Maturity | | Balance |
National City Bank | | 5.06 | % | | 1-02-07 | | $ | 17,973,000 | | 3.94 | % | | 1-02-06 | | $ | 10,600,000 |
Great Lakes Bankers Bank | | 5.16 | % | | 1-02-07 | | | 10,000,000 | | 4.15 | % | | 1-02-06 | | | 7,700,000 |
| | | | | | | | | | | | | | | | |
| | | | | | | $ | 27,973,000 | | | | | | | $ | 18,300,000 |
| | | | | | | | | | | | | | | | |
3. INVESTMENT SECURITIES
The amortized cost of securities and their estimated fair values are as follows:
Securities Available for Sale
| | | | | | | | | | | | |
| | | 2006 |
| | | Amortized
Cost | | Gross
Unrealized
Gains | | Gross
Unrealized
Losses | | Fair Value |
Obligations of U.S. Government Agencies and Corporations | | $ | 34,745,564 | | $ | 106,828 | | $ | 99,417 | | $ | 34,752,975 |
| | | | | | | | | | | | |
Total | | $ | 34,745,564 | | $ | 106,828 | | $ | 99,417 | | $ | 34,752,975 |
| | | | | | | | | | | | |
| |
| | | 2005 |
| | | Amortized
Cost | | Gross
Unrealized
Gains | | Gross
Unrealized
Losses | | Fair Value |
Obligations of U.S. Government Agencies and Corporations | | $ | 14,405,286 | | $ | 12,921 | | $ | 111,007 | | $ | 14,307,200 |
| | | | | | | | | | | | |
Total | | $ | 14,405,286 | | $ | 12,921 | | $ | 111,007 | | $ | 14,307,200 |
| | | | | | | | | | | | |
Securities Held to Maturity
| | | | | | | | | | | | |
| | | 2006 |
| | | Amortized
Cost | | Gross
Unrealized
Gains | | Gross
Unrealized
Losses | | Fair Value |
Obligations of States and Political Subdivisions | | $ | 29,992,583 | | $ | 744,130 | | $ | 52,492 | | $ | 30,684,221 |
| | | | | | | | | | | | |
Total | | $ | 29,992,583 | | $ | 744,130 | | $ | 52,492 | | $ | 30,684,221 |
| | | | | | | | | | | | |
| |
| | | 2005 |
| | | Amortized
Cost | | Gross
Unrealized
Gains | | Gross
Unrealized
Losses | | Fair Value |
Obligations of States and Political Subdivisions | | $ | 30,770,829 | | $ | 996,010 | | $ | 69,932 | | $ | 31,696,907 |
| | | | | | | | | | | | |
Total | | $ | 30,770,829 | | $ | 996,010 | | $ | 69,932 | | $ | 31,696,907 |
| | | | | | | | | | | | |
-12-
| 3. | INVESTMENT SECURITIES (CONTINUED) |
The amortized cost and fair values of debt securities at December 31, 2006, by contractual maturity, are shown below. Expected maturities will differ from contractual maturities because borrowers may have the right to call or repay obligations with or without call or prepayment penalties.
| | | | | | | | | | | | |
| | | Available For Sale | | Held to Maturity |
| | | Amortized
Cost | | Fair Value | | Amortized
Cost | | Fair Value |
Due in one year or less | | $ | 3,998,899 | | $ | 3,982,190 | | $ | 3,368,591 | | $ | 3,385,407 |
Due after one year through five years | | | 29,790,378 | | | 29,837,660 | | | 15,322,041 | | | 15,666,720 |
Due after five through ten years | | | 658,074 | | | 644,871 | | | 10,524,938 | | | 10,848,511 |
Due after ten years | | | 298,213 | | | 288,254 | | | 777,013 | | | 783,583 |
| | | | | | | | | | | | |
| | $ | 34,745,564 | | $ | 34,752,975 | | $ | 29,992,583 | | $ | 30,684,221 |
| | | | | | | | | | | | |
Investment securities with an approximate carrying value of $34,929,000 and $32,595,000 at December 31, 2006 and 2005, respectively were pledged to secure public deposits, securities sold under agreement to repurchase and for other purposes as required or permitted by law.
The following tables show the Company’s gross unrealized losses and fair value, aggregated by investment category and length of time, that the individual securities have been in a continuous unrealized loss position, at December 31, 2006 and 2005. As of December 31, 2006, there were a total of 44 securities in a loss position.
| | | | | | | | | | | | | | | | | | |
| | | 2006 |
| | | Less Than Twelve Months | | Twelve Months or Greater | | Total |
| | | Fair Value | | Gross
Unrealized
Losses | | Fair Value | | Gross
Unrealized
Losses | | Fair Value | | Gross
Unrealized
Losses |
U.S. Government agencies and corporations | | $ | 8,973,810 | | $ | 25,972 | | $ | 7,630,037 | | $ | 73,445 | | $ | 16,603,847 | | $ | 99,417 |
Obligations of states and Political subdivisions | | | 1,468,099 | | | 5,329 | | | 2,160,399 | | | 47,163 | | | 3,628,498 | | | 52,492 |
| | | | | | | | | | | | | | | | | | |
Total debt securities | | $ | 10,441,909 | | $ | 31,301 | | $ | 9,790,436 | | $ | 120,608 | | $ | 20,232,345 | | $ | 151,909 |
| | | | | | | | | | | | | | | | | | |
| |
| | | 2005 |
| | | Less Than Twelve Months | | Twelve Months or Greater | | Total |
| | | Fair Value | | Gross
Unrealized
Losses | | Fair Value | | Gross
Unrealized
Losses | | Fair Value | | Gross
Unrealized
Losses |
U.S. Government agencies and corporations | | $ | 7,687,525 | | $ | 63,972 | | $ | 2,505,467 | | $ | 47,035 | | $ | 10,192,992 | | $ | 111,007 |
Obligations of states and Political subdivisions | | | 2,249,380 | | | 23,085 | | | 1,599,113 | | | 46,847 | | | 3,848,493 | | | 69,932 |
| | | | | | | | | | | | | | | | | | |
Total debt securities | | $ | 9,936,905 | | $ | 87,057 | | $ | 4,104,580 | | $ | 93,882 | | $ | 14,041,485 | | $ | 180,939 |
| | | | | | | | | | | | | | | | | | |
The Company’s investment securities portfolio contains unrealized losses of direct obligations of the U.S. Government securities, including mortgage-related instruments issued or backed by the full faith and credit of the United States government, and debt obligations of a U.S. state or political subdivision.
-13-
| 3. | INVESTMENT SECURITIES (CONTINUED) |
On a monthly basis, the Company evaluates, the severity and duration of impairment for its investment securities portfolio. Unless the Company has the ability to hold the security to maturity without incurring a loss, impairment is considered other than temporary when an investment security has sustained a decline of ten percent or more for six months.
The Company has concluded that any impairment of its investment securities portfolio is not other than temporary, but is the result of interest rate changes that are not expected to result in the noncollection of principal and interest, during the period.
Major classification of loans are summarized as follows:
| | | | | | | | |
| | | 2006 | | | 2005 | |
Real estate – residential | | $ | 77,024,815 | | | $ | 90,976,398 | |
Real estate – farm | | | 13,367,589 | | | | 14,550,237 | |
Real estate – commercial | | | 50,147,368 | | | | 47,312,047 | |
Real estate – construction | | | 10,917,038 | | | | 9,446,729 | |
Commercial and other loans | | | 36,225,488 | | | | 38,399,400 | |
Consumer and credit loans | | | 6,940,764 | | | | 8,216,453 | |
| | | | | | | | |
| | | 194,623,062 | | | | 208,901,264 | |
Less allowance for loan losses | | | (2,393,705 | ) | | | (2,313,313 | ) |
Less net deferred loan fees | | | (297,288 | ) | | | (346,005 | ) |
| | | | | | | | |
Loans, net | | $ | 191,932,069 | | | $ | 206,241,946 | |
| | | | | | | | |
Loans held for sale at December 31, 2006 and 2005 were $172,500 and $94,600 respectively. Real estate loans serviced for Freddie Mac, which are not included in the consolidated balance sheet, totaled $53,327,778 and $50,287,462 at December 31, 2006 and 2005, respectively. The Bank is currently collecting a fee of .25% for servicing these loans.
Total nonaccrual loans and the related interest for the years ended December 31 are as follows. In management’s opinion, these loans did not meet the definition of impaired loans.
| | | | | | | | | |
| | | 2006 | | 2005 | | 2004 |
Principal outstanding | | $ | 471,101 | | $ | 631,791 | | $ | 1,094,922 |
Contractual interest due | | $ | 54,227 | | $ | 31,115 | | $ | 38,263 |
Interest income recognized | | $ | — | | $ | — | | $ | — |
The Company’s primary business activity is with customers located within its local trade area. Residential, commercial, personal, and agricultural loans are granted. The Company also selectively funds loans originated outside of its trade area provided such loans meet its credit policy guidelines. Although the Company has a diversified loan portfolio at December 31, 2006 and 2005, loans outstanding to individuals and businesses are dependent upon the local economic conditions in its immediate trade area.
The Bank entered into transactions with certain directors, executive officers, significant stockholders, and their affiliates. A summary of loan activity for those directors, executive officers, and their associates with loan balances in excess of $120,000 for the year ended December 31, 2006 is as follows:
| | | | | | | | | |
Balance December 31, 2005 | | Additions | | Amounts Collected | | Balance December 31, 2006 |
$3,353,229 | | $ | 572,549 | | $ | 219,086 | | $ | 3,706,692 |
-14-
| 5. | ALLOWANCE FOR LOAN LOSSES |
An analysis of the change in the allowance for loan losses follows:
| | | | | | | | | | | | |
| | | 2006 | | | 2005 | | | 2004 | |
Balance, January 1 | | $ | 2,313,313 | | | $ | 2,645,981 | | | $ | 2,701,943 | |
Add: | | | | | | | | | | | | |
Provision charged to operations | | | 214,514 | | | | 376,722 | | | | 225,000 | |
Loan recoveries | | | 360,199 | | | | 74,953 | | | | 74,942 | |
Less: Loans charged off | | | (494,319 | ) | | | (784,343 | ) | | | (355,904 | ) |
| | | | | | | | | | | | |
Balance, December 31 | | $ | 2,393,705 | | | $ | 2,313,313 | | | $ | 2,645,981 | |
| | | | | | | | | | | | |
Premises and equipment are summarized as follows:
| | | | | | | | |
| | | 2006 | | | 2005 | |
Land | | $ | 2,050,242 | | | $ | 1,775,541 | |
Building and improvements | | | 4,484,824 | | | | 4,165,964 | |
Leasehold improvements | | | 75,619 | | | | 75,619 | |
Furniture, fixtures and equipment | | | 3,939,690 | | | | 4,223,945 | |
Other Real Estate Owned | | | 80,000 | | | | 700,000 | |
| | | | | | | | |
| | | 10,630,375 | | | | 10,941,069 | |
Less accumulated depreciation | | | (4,916,779 | ) | | | (5,106,553 | ) |
| | | | | | | | |
Total | | $ | 5,713,596 | | | $ | 5,834,516 | |
| | | | | | | | |
Depreciation expense charged to operations was $368,995 for 2006, $378,558 for 2005, and $408,422 for 2004.
As of December 31, 2006 and 2005, goodwill had a gross carrying amount of $1,661,561 and an accumulated amortization amount of $332,312 resulting in a net carrying amount of $1,329,249.
The gross carrying amount of goodwill was tested for impairment in the second quarter. Due to an increase in overall earning asset growth, operating profits and cash flows were greater than expected for the reporting units. Based on fair value of the reporting unit, estimated using the expected present value of future cash flows, no goodwill impairment loss was recognized in the current year.
Time deposits include certificates of deposit in denominations of $100,000 or more. Such deposits aggregated $46,956,911 and $38,459,171 at December 31, 2006 and 2005, respectively.
Interest expense on certificates of deposit $100,000 and over amounted to $1,502,305 in 2006, $1,010,191 in 2005, and $661,560 in 2004.
The following table sets forth the remaining maturity of time certificates of deposits of $100,000 or more at December 31, 2006.
| | | |
3 months or less | | $ | 8,943,025 |
Over 3 through 6 months | | | 4,908,561 |
Over 6 through 12 months | | | 21,839,119 |
Over 12 months | | | 11,266,206 |
| | | |
Total | | $ | 46,956,911 |
| | | |
-15-
The following table sets forth the remaining maturity of all time deposits at December 31, 2006.
| | | |
12 month or less | | $ | 91,338,779 |
12 months through 24 months | | | 25,328,133 |
24 months through 36 months | | | 11,671,391 |
36 months through 48 months | | | 2,721,054 |
48 months through 60 months | | | 1,264,472 |
Over 60 months | | | 15,274 |
| | | |
| | | $132,339,103 |
| | | |
Short-term borrowings consist of securities sold under agreements to repurchase. These retail repurchase agreements are with customers in their respective loan market areas. These borrowings are collateralized with securities owned by the Company and held in their safekeeping account at an independent correspondent bank. The outstanding balances and related information for short-term borrowings are summarized as follows:
| | | | | | | | |
| | | 2006 | | | 2005 | |
Short-term borrowings: | | | | | | | | |
Ending balance | | $ | 5,310,281 | | | $ | 3,610,000 | |
Maximum month-end balance during the year | | | 5,310,281 | | | | 5,275,000 | |
Average month-end balance during the year | | | 4,389,190 | | | | 4,159,999 | |
Weighted average at year end | | | 3.06 | % | | | 1.96 | % |
Weighted average rate during the year | | | 2.79 | % | | | 1.14 | % |
The Company has pledged investment securities with carrying values of $6,001,590 and $4,944,376 as of December 31, 2006 and 2005, respectively, as collateral for the repurchase agreements.
| 10. | FEDERAL HOME LOAN BANK ADVANCES |
The Federal Home Loan Bank advances have monthly principal and interest payments due with maturity dates from 2006 through 2017. Interest rates range from 3.59% to 8.90% on the advances. The scheduled aggregate minimum future principal payments on the advances outstanding as of December 31, 2006 are as follows:
| | | |
Year Ending December 31, | | Amount |
2007 | | $ | 689,160 |
2008 | | | 667,030 |
2009 | | | 648,649 |
2010 | | | 566,645 |
2011 | | | 228,582 |
2012 and thereafter | | | 443,305 |
| | | |
Total | | $ | 3,243,371 |
| | | |
The Bank maintains a credit arrangement with Federal Home Loan Bank of Cincinnati, Ohio (“FHLB”). The FHLB borrowings, when used, are collateralized by the Bank’s investment in Federal Home Loan Bank stock and a blanket collateral pledge agreement with FHLB under which the Bank has pledged certain qualifying assets equal to 150 percent of the unpaid amount of the outstanding balances. At December 31, 2006 the Bank had a borrowing capacity of approximately $43.9 million with the FHLB. At December 31, 2006 and 2005 there was $3,243,371 and $5,989,051, respectively borrowed against this credit arrangement.
-16-
| 11. | EMPLOYEE BENEFIT PLANS |
The Bank maintains an integrated money purchase pension plan and a 401(k) plan.
Under the integrated money purchase pension plan contribution formula, the Bank, for each plan year, will contribute an amount equal to 8% of an employee’s compensation for the plan year and 5.7% of the amount of an employee’s excess compensation for the plan year. Excess compensation is a participant’s compensation in excess of the designated integration level. This designated integration level is 100% of the taxable wage base in effect at the beginning of the plan year. The federal government annually adjusts the taxable wage base. This plan does not permit nor require employees to make contributions to the plan.
The 401(k) plan allows employees to make salary reduction contributions to the plan up to 20% of a participant’s compensation. For each plan year, the Bank may contribute to the plan an amount of matching contributions for a particular plan year. The Bank may choose not to make matching contributions for a particular plan year. For 2006 and 2005 the Bank matched 25% of the employees’ voluntary contributions up to 1% of the employee’s compensation.
Both plans cover substantially all employees with one year of service and attained age 21. For 2006, the annual contribution to a participant’s retirement account may not exceed $44,000.
The pension costs charged to operating expense for the years 2006, 2005 and 2004 amounted to $301,650, $275,660 and $253,812, respectively.
| 12. | OTHER OPERATING EXPENSE |
Other operating expense included the following:
| | | | | | | | | |
| | | 2006 | | 2005 | | 2004 |
Professional fees | | $ | 327,579 | | $ | 313,062 | | $ | 190,389 |
Franchise tax | | | 460,580 | | | 438,630 | | | 433,920 |
Telephone | | | 160,381 | | | 158,748 | | | 154,739 |
Stationery, supplies and printing | | | 173,147 | | | 160,646 | | | 165,140 |
Postage, express and freight | | | 171,752 | | | 155,388 | | | 156,279 |
Data processing | | | 157,012 | | | 148,822 | | | 167,532 |
Other | | | 1,027,554 | | | 1,014,020 | | | 928,677 |
| | | | | | | | | |
Total | | $ | 2,478,005 | | $ | 2,389,316 | | $ | 2,196,676 |
| | | | | | | | | |
The bank leases the space housing the German Village branch located in Berlin, Ohio. The lease expires in seven years, with an option to automatically renew for an additional ten year period. Minimum future rental payments are as follows:
| | | |
Less than 1 year | | $ | 18,900 |
1 to 3 years | | | 37,800 |
3 to 5 years | | | 38,942 |
Greater than 5 years | | | 269,004 |
| | | |
| | $ | 364,646 |
| | | |
The provision for federal income taxes for the years ended December 31 consist of:
| | | | | | | | | | |
| | | 2006 | | 2005 | | | 2004 |
Current payable | | $ | 1,731,861 | | $ | 1,516,365 | | | $ | 884,920 |
Deferred | | | 260,100 | | | (2,897 | ) | | | 96,257 |
| | | | | | | | | | |
Total provision | | $ | 1,991,961 | | $ | 1,513,468 | | | $ | 981,177 |
| | | | | | | | | | |
-17-
| 14. | INCOME TAXES (CONTINUED) |
The following is a reconcilement between the actual provision for federal income taxes and the amount of income taxes, which would have been provided at statutory rates for the year ended December 31:
| | | | | | | | | | | | | | | | | | | | | |
| | | 2006 | | | 2005 | | | 2004 | |
| | | Amount | | | % of
Pre-Tax
Income | | | Amount | | | % of
Pre-Tax
Income | | | Amount | | | % of
Pre-Tax
Income | |
Provision at statutory rate | | $ | 2,453,220 | | | 34.0 | % | | $ | 1,946,274 | | | 34.0 | % | | $ | 1,496,199 | | | 34.0 | % |
Tax exempt income | | | (485,601 | ) | | (7.0 | ) | | | (519,659 | ) | | (9.1 | ) | | | (579,220 | ) | | (13.2 | ) |
Non-deductible interest | | | | | | | | | | | | | | | | | | | | | |
Expense | | | 31,167 | | | 0.4 | | | | 33,291 | | | 0.6 | | | | 30,376 | | | .7 | |
Other, net | | | (6,825 | ) | | (0.2 | ) | | | 53,562 | | | 0.9 | | | | 33,822 | | | .7 | |
| | | | | | | | | | | | | | | | | | | | | |
Tax expense and effective rate | | $ | 1,991,961 | | | 27.2 | % | | $ | 1,513,468 | | | 26.4 | % | | $ | 981,177 | | | 22.2 | % |
| | | | | | | | | | | | | | | | | | | | | |
The tax effects of deductible and taxable temporary differences that gave rise to significant portions of the net deferred tax assets and liabilities at December 31 are as follows:
| | | | | | | |
| | | 2006 | | | 2005 |
Deferred Tax Assets: | | | | | | | |
Allowance for loan losses | | $ | 617,497 | | | $ | 786,526 |
Deferred loan fees | | | 3,035 | | | | 5,075 |
Net unrealized loss on securities | | | — | | | | 33,349 |
| | | | | | | |
Deferred tax asset | | | 620,532 | | | | 824,950 |
| | | | | | | |
Deferred Tax Liabilities: | | | | | | | |
Premise and equipment | | | 335,041 | | | | 316,520 |
Stock dividends | | | 218,892 | | | | 194,344 |
Net unrealized gain on securities | | | 2,583 | | | | — |
Other, net | | | 140,901 | | | | 130,871 |
| | | | | | | |
Deferred tax liabilities | | $ | 697,417 | | | | 641,735 |
| | | | | | | |
Net deferred tax (liabilities) assets | | $ | (76,885 | ) | | $ | 183,215 |
| | | | | | | |
No valuation allowance was established at December 31, 2005 in view of certain tax strategies coupled with the anticipated future taxable income as evidenced by the company’s earnings potential.
| 15. | COMMITMENTS AND CONTINGENT LIABILITIES |
Commitments
In the normal course of business, the Company has outstanding commitments and contingent liabilities, such as commitments to extend credit and standby letters of credit, which are not included in the accompanying consolidated financial statements. The Company’s exposure to credit loss in the event of nonperformance by the other party to the financial instruments for commitments to extend credit and standby letters of credit is represented by the contractual or notional amount of those instruments. The Company uses the same credit policies in making such commitments as it does for instruments that are included in the consolidated balance sheet.
These commitments were comprised of the following at December 31:
| | | | | | |
| | | 2006 | | 2005 |
Commitments to extend credit | | $ | 38,064,000 | | $ | 35,011,000 |
Standby letters of credit | | | 1,097,000 | | | 730,000 |
| | | | | | |
Total | | $ | 39,161,000 | | $ | 35,741,000 |
| | | | | | |
-18-
| 15. | COMMITMENTS AND CONTINGENT LIABILITIES (CONTINUED) |
Commitments to extend credit are agreements to lend to a customer as long as there is no violation of any condition established in the contract. Commitments generally have fixed expiration dates or other termination clauses and may require payment of a fee. Since many of the commitments are expected to expire without being drawn upon, the total commitment amounts do not necessarily represent future cash requirements. The Company evaluates each customer’s creditworthiness on a case-by-case basis. The amount of collateral obtained, if deemed necessary by the Company upon extension of credit, is based on management’s credit evaluation. Collateral held varies but may include accounts receivable, inventory, property and equipment, and income-producing commercial properties.
Standby letters of credit are conditional commitments issued by the Company to guarantee the performance of a customer to a third party. Standby letters of credit generally have fixed expiration dates or other termination clauses and may require payment of a fee. The fees earned from issuance of letters are recognized at the origination of the coverage period. The credit risk involved in issuing letters of credit is essentially the same as that involved in extending loan facilities to customers. The Company’s policy for obtaining collateral, and the nature of such collateral, is essentially the same as that involved in making commitments to extend credit.
The Company has not been required to perform any financial guarantees during the past two years. The Company has not incurred any losses on its commitments in either 2006 or 2005.
Contingent Liabilities
The Company and its subsidiary are subject to claims and lawsuits which arise primarily in the ordinary course of business. It is the opinion of management that the disposition or ultimate resolution of such claims and lawsuits will not have a material adverse effect on the consolidated financial position of the Company.
The approval of regulatory authorities is required if the total of all dividends declared by the Bank in any calendar year exceeds net profits as defined for that year combined with its retained net profits for the two preceding calendar years less any required transfers to surplus. Under this formula, the amount available for payment of dividends by the Bank to the Company in 2007, without the approval of the regulatory authorities, is approximately $3,567,454 plus 2007 profits retained up to the date of the dividend declaration.
Included in cash and due from banks are required federal reserves of $3,798,000 and $3,957,000 at December 31, 2006 and 2005, respectively, for facilitating the implementation of monetary policy by the Federal Reserve System. The required reserves are computed by applying prescribed ratios to the classes of average deposit balances. These are held in the form of cash on hand and/or balances maintained directly with the Federal Reserve Bank.
Federal law prevents the Company from borrowing from the Bank unless the loans are secured by specific obligations. Further, such secured loans are limited in amount to ten percent of the Bank’s capital. The Company had no such borrowings at December 31, 2006 and 2005.
| 17. | REGULATORY CAPITAL REQUIREMENTS |
Federal regulations require the Company and the Bank to maintain minimum amounts of capital. Specifically, each is required to maintain certain minimum dollar amounts and ratios of Total and Tier I capital to risk-weighted assets and of Tier I capital to average total assets.
In addition to the capital requirements, the Federal Deposit Insurance Corporation Improvement Act (“FDICIA”) established five capital categories ranging from “well capitalized” to “critically undercapitalized.” Should any institution fail to meet the requirements to be considered “adequately capitalized,” it would become subject to a series of increasingly restrictive regulatory actions.
-19-
| 17. | REGULATORY CAPITAL REQUIREMENTS (CONTINUED) |
As of December 31, 2006 and 2005, the FDIC categorized the Bank as well capitalized under the regulatory framework for prompt corrective action. To be classified as a well capitalized financial institution, Total risk-based, Tier I risk-based, and Tier I Leverage capital ratios must be at least ten percent, six percent, and five percent, respectively. There have been no conditions or events since notification that management believes have changed this category.
The Company’s actual capital ratios are presented in the following table, which shows the Company met all regulatory capital requirements. The capital position of the Bank does not differ significantly from the Company’s.
| | | | | | | | | | | | |
| | | 2006 | | | 2005 | |
| | | Amount | | Ratio | | | Amount | | Ratio | |
Total Risk Based Capital (to Risk Weighted Assets) | | | | | | | | | | | | |
| | | | |
Actual | | $ | 40,194 | | 19.09 | % | | $ | 38,098 | | 17.38 | % |
For Capital Adequacy Purposes | | | 16,844 | | 8.00 | | | | 17,539 | | 8.00 | |
To be well capitalized | | | 21,055 | | 10.00 | | | | 21,924 | | 10.00 | |
| | | | |
Tier 1 Capital (to Risk Weighted Assets) | | | | | | | | | | | | |
| | | | |
Actual | | | 37,800 | | 17.95 | % | | $ | 35,785 | | 16.32 | % |
For Capital Adequacy Purposes | | | 8,422 | | 4.00 | | | | 8,770 | | 4.00 | |
To be well capitalized | | | 12,633 | | 6.00 | | | | 13,154 | | 6.00 | |
| | | | |
Tier 1 Capital (to Average Assets) | | | | | | | | | | | | |
| | | | |
Actual | | | 37,800 | | 12.33 | % | | $ | 35,785 | | 12.07 | % |
For Capital Adequacy Purposes | | | 12,266 | | 4.00 | | | | 11,854 | | 4.00 | |
To be well capitalized | | | 15,333 | | 5.00 | | | | 14,818 | | 5.00 | |
| 18. | FAIR VALUE DISCLOSURE OF FINANCIAL INSTRUMENTS |
The carrying amounts and estimated fair values at December 31 are as follows:
| | | | | | | | | | | | |
| | | 2006 | | 2005 |
| | | Carrying
Amount | | Fair Value | | Carrying
Amount | | Fair Value |
Financial assets: | | | | | | | | | | | | |
Cash and due from banks | | $ | 14,732,362 | | $ | 14,732,362 | | $ | 15,031,294 | | $ | 15,031,294 |
Federal funds sold | | | 27,973,000 | | | 27,973,000 | | | 18,300,000 | | | 18,300,000 |
Securities available for sale | | | 34,752,975 | | | 34,752,975 | | | 14,307,200 | | | 14,307,200 |
Securities held to maturity | | | 29,992,583 | | | 30,684,000 | | | 30,770,829 | | | 31,696,907 |
Net loans | | | 191,932,069 | | | 194,179,973 | | | 206,241,946 | | | 208,546,387 |
Loans held for sale | | | 172,500 | | | 89,027 | | | 94,600 | | | 95,613 |
Accrued interest receivable | | | 1,396,267 | | | 1,396,267 | | | 1,145,875 | | | 1,145,875 |
Regulatory Stock | | | 1,661,210 | | | 1,661,210 | | | 1,589,010 | | | 1,589,010 |
Bank Owned Life Insurance | | | 3,272,451 | | | 3,272,451 | | | 3,141,889 | | | 3,141,889 |
| | | | |
Financial liabilities: | | | | | | | | | | | | |
Deposits | | $ | 264,300,512 | | $ | 264,271,409 | | $ | 250,349,150 | | $ | 242,227,000 |
Federal Home Loan Bank advances | | | 3,243,371 | | | 3,378,000 | | | 5,989,051 | | | 6,010,000 |
Short term borrowings | | | 5,310,281 | | | 5,310,281 | | | 3,610,000 | | | 3,610,000 |
Accrued interest payable | | | 335,751 | | | 335,751 | | | 234,237 | | | 234,237 |
-20-
| 18. | FAIR VALUE DISCLOSURE OF FINANCIAL INSTRUMENTS (CONTINUED) |
Financial instruments are defined as cash, evidence of ownership interest in an entity, or a contract which creates an obligation or right to receive or deliver cash or another financial instrument from/to a second entity on potentially favorable or unfavorable terms.
Fair value is defined as the amount at which a financial instrument could be exchanged in a current transaction between willing parties other than in a forced or liquidation sale. If a quoted market price is available for a financial instrument, the estimated fair value would be calculated based upon the market price per trading unit of the instrument.
If no readily available market exists, the fair value estimates for financial instruments should be based upon management’s judgment regarding current economic conditions, interest rate risk, expected cash flows, future estimated losses, and other factors as determined through various option pricing formulas or simulation modeling. As many of these assumptions result from judgments made by management based upon estimates which are inherently uncertain, the resulting estimated fair values may not be indicative of the amount realizable in the sale of a particular financial instrument. In addition, changes in assumptions on which the estimated fair values are based may have a significant impact on the resulting estimated fair values.
As certain assets and liabilities such as deferred tax assets and liabilities, premises and equipment and many other operational elements of the Company, are not considered financial instruments, but have value, this estimated fair value of financial instruments would not represent the full market value of the Company.
The Company employed simulation modeling in determining the estimated fair value of financial instruments for which quoted market prices were not available based upon the following assumptions:
Cash and Due from Banks, Federal Funds Sold, Accrued Interest Receivable, Regulatory Stock, BOLI, Short-Term Borrowings, and Accrued Interest Payable
The fair value approximates the current carrying value.
Investment Securities and Loans Held for Sale
The fair value of investment securities and loans held for sale are equal to the available quoted market price. If no quoted market price is available, fair value is estimated using the quoted market price for similar securities.
Loans, Deposits, and Federal Home Loan Bank Advances
The fair value of loans is estimated by discounting the future cash flows using a simulation model which estimates future cash flows and constructs discount rates that consider reinvestment opportunities, operating expenses, non-interest income, credit quality, and prepayment risk. Demand, savings, and money market deposit accounts are valued at the amount payable on demand as of year end. Fair values for time deposits and Federal Home Loan Bank advances are estimated using a discounted cash flow calculation that applies contractual costs currently being offered in the existing portfolio to current market rates being offered for deposits and borrowings of similar remaining maturities.
Commitments to Extend Credit and Standby Letters of Credit
These financial instruments are generally not subject to sale, and estimated fair values are not readily available. The carrying value, represented by the net deferred fee arising from the unrecognized commitment or letter of credit, and the fair value, determined by discounting the remaining contractual fee over the term of the commitment using fees currently charged to enter into similar agreements with similar credit risk, are not considered material for disclosure. The contractual amounts of unfunded commitments and letters of credit are presented previously in the commitments and contingent liabilities note.
-21-
The following are parent only condensed financial statements:
CONDENSED BALANCE SHEET
| | | | | | |
| | | December 31, |
| | | 2006 | | 2005 |
ASSETS | | | | | | |
Cash | | $ | 314,318 | | $ | 338,484 |
Dividends Cash | | | 142,185 | | | 130,280 |
Investment in bank subsidiary | | | 38,819,421 | | | 36,710,818 |
| | | | | | |
Total assets | | $ | 39,275,924 | | $ | 37,179,582 |
| | | | | | |
| | |
LIABILITIES AND SHAREHOLDERS’ EQUITY | | | | | | |
Dividend Checks Outstanding | | $ | 142,127 | | $ | 130,280 |
Shareholders’ equity | | | 39,133,797 | | | 37,049,302 |
| | | | | | |
Total liabilities and shareholders’ equity | | $ | 39,275,924 | | $ | 37,179,582 |
| | | | | | |
CONDENSED STATEMENT OF INCOME
| | | | | | | | | | | | |
| | | Year Ended December 31, | |
| | | 2006 | | | 2005 | | | 2004 | |
INCOME | | | | | | | | | | | | |
Dividends from bank subsidiary | | $ | 3,225,000 | | | $ | 2,750,000 | | | $ | 1,825,000 | |
| | | |
Operating expenses | | | 61,487 | | | | 102,415 | | | | 50 | |
| | | | | | | | | | | | |
| | | |
Income before income taxes | | | 3,163,513 | | | | 2,647,585 | | | | 1,824,950 | |
| | | |
Income tax benefit | | | (20,905 | ) | | | (34,804 | ) | | | (17 | ) |
| | | | | | | | | | | | |
Income before equity in undistributed net income of subsidiary | | | 3,184,418 | | | | 2,682,389 | | | | 1,824,967 | |
| | | |
Equity in undistributed net income of subsidiary | | | 2,038,975 | | | | 1,528,479 | | | | 1,594,441 | |
| | | | | | | | | | | | |
NET INCOME | | $ | 5,223,393 | | | $ | 4,210,868 | | | $ | 3,419,408 | |
| | | | | | | | | | | | |
-22-
| 19. | PARENT COMPANY (CONTINUED) |
CONDENSED STATEMENT OF CASH FLOWS
| | | | | | | | | | | | |
| | | Year Ended December 31, | |
| | | 2006 | | | 2005 | | | 2004 | |
OPERATING ACTIVITIES | | | | | | | | | | | | |
Net income | | $ | 5,223,393 | | | $ | 4,210,868 | | | $ | 3,419,408 | |
Adjustments to reconcile net income to net cash provided by operating activities: | | | | | | | | | | | | |
Equity in undistributed net income of subsidiary | | | (2,038,975 | ) | | | (1,528,479 | ) | | | (1,594,441 | ) |
(Increase) decrease in other assets | | | — | | | | — | | | | (17 | ) |
Increase in other liabilities | | | 11,848 | | | | 51,198 | | | | — | |
| | | | | | | | | | | | |
Net cash provided by operating activities | | | 3,196,266 | | | | 2,733,587 | | | | 1,824,950 | |
| | | | | | | | | | | | |
| | | |
FINANCING ACTIVITIES | | | | | | | | | | | | |
Purchase of treasury shares | | | (968,364 | ) | | | (982,824 | ) | | | (699,614 | ) |
Dividends paid | | | (2,240,163 | ) | | | (1,437,738 | ) | | | (1,291,144 | ) |
Advance from subsidiary | | | — | | | | 50,937 | | | | — | |
| | | | | | | | | | | | |
Net cash used in financing activities | | | (3,208,527 | ) | | | (2,369,625 | ) | | | (1,990,758 | ) |
| | | | | | | | | | | | |
INCREASE (DECREASE) IN CASH | | | (12,261 | ) | | | 363,962 | | | | (165,808 | ) |
| | | |
CASH AT BEGINNING OF YEAR | | | 468,764 | | | | 104,802 | | | | 270,610 | |
| | | | | | | | | | | | |
CASH AT END OF YEAR | | $ | 456,503 | | | $ | 468,764 | | | $ | 104,802 | |
| | | | | | | | | | | | |
-23-
| 20. | SELECTED QUARTERLY FINANCIAL DATA (UNAUDITED) |
(IN THOUSANDS EXCEPT PER SHARE DATA)
| | | | | | | | | | | | |
| | | Three Months Ended |
| | | March 2006 | | June 2006 | | September 2006 | | December 2006 |
Total interest income | | $ | 4,711 | | $ | 4,954 | | $ | 5,110 | | $ | 5,264 |
Total interest expense | | | 1,258 | | | 1,389 | | | 1,528 | | | 1,745 |
| | | | | | | | | | | | |
Net interest income | | | 3,453 | | | 3,565 | | | 3,582 | | | 3,519 |
Provision for loan losses | | | 60 | | | 60 | | | — | | | 95 |
| | | | | | | | | | | | |
Net interest income after provision for loans losses | | | 3,393 | | | 3,505 | | | 3,582 | | | 3,424 |
| | | | |
Total other income | | | 310 | | | 317 | | | 304 | | | 376 |
Total other expense | | | 2,119 | | | 1,914 | | | 2,017 | | | 1,946 |
| | | | | | | | | | | | |
Income before income taxes | | | 1,584 | | | 1,908 | | | 1,869 | | | 1,854 |
Income taxes | | | 422 | | | 560 | | | 508 | | | 502 |
| | | | | | | | | | | | |
Net income | | $ | 1,162 | | $ | 1,348 | | $ | 1,361 | | $ | 1,352 |
| | | | | | | | | | | | |
Per share data: | | | | | | | | | | | | |
Net earnings | | $ | 1.80 | | $ | 2.10 | | $ | 2.12 | | $ | 2.12 |
| | | | | | | | | | | | |
Weighted average shares outstanding | | | 645,729 | | | 642,346 | | | 641,491 | | | 639,079 |
| | | | | | | | | | | | |
-24-
| 20. | SELECTED QUARTERLY FINANCIAL DATA (UNAUDITED)(CONTINUED) |
(IN THOUSANDS EXCEPT PER SHARE DATA)
| | | | | | | | | | | | |
| | | Three Months Ended |
| | | March 2005 | | June 2005 | | September 2005 | | December 2005 |
Total interest income | | $ | 3,768 | | $ | 4,018 | | $ | 4,274 | | $ | 4,558 |
Total interest expense | | | 865 | | | 998 | | | 1,101 | | | 1,205 |
| | | | | | | | | | | | |
Net interest income | | | 2,903 | | | 3,020 | | | 3,173 | | | 3,353 |
Provision for loan losses | | | 75 | | | 75 | | | 30 | | | 197 |
| | | | | | | | | | | | |
Net interest income after provision for loans losses | | | 2,828 | | | 2,945 | | | 3,143 | | | 3,156 |
| | | | |
Total other income | | | 311 | | | 361 | | | 300 | | | 293 |
Total other expense | | | 2,045 | | | 1,743 | | | 1,939 | | | 1,886 |
| | | | | | | | | | | | |
Income before income taxes | | | 1,094 | | | 1,563 | | | 1,504 | | | 1,563 |
Income taxes | | | 249 | | | 425 | | | 403 | | | 436 |
| | | | | | | | | | | | |
Net income | | $ | 845 | | $ | 1,138 | | $ | 1,101 | | $ | 1,127 |
| | | | | | | | | | | | |
| | | | |
Per share data: | | | | | | | | | | | | |
Net earnings | | $ | 1.29 | | $ | 1.73 | | $ | 1.69 | | $ | 1.73 |
| | | | | | | | | | | | |
Weighted average shares outstanding | | | 657,046 | | | 656,402 | | | 653,225 | | | 650,482 |
| | | | | | | | | | | | |
-25-