QuickLinks -- Click here to rapidly navigate through this document
UNITED STATES
SECURITIES AND EXCHANGE COMMISSION
Washington, D.C. 20549
FORM 10-K
| (Mark One) | |
ý |
ANNUAL REPORT PURSUANT TO SECTION 13 OR 15(d) OF THE SECURITIES EXCHANGE ACT OF 1934 |
For the fiscal year ended December 31, 2007 |
or |
o |
TRANSITION REPORT PURSUANT TO SECTION 13 or 15(d) OF THE SECURITIES EXCHANGE ACT OF 1934 |
For the transition period from to |
Commission file number: 0-24557
CARDINAL FINANCIAL CORPORATION
(Exact name of registrant as specified in its charter)
Virginia
(State or other jurisdiction
of incorporation or organization) | | 54-1874630
(I.R.S. Employer
Identification No.) |
8270 Greensboro Drive, Suite 500
McLean, Virginia
(Address of principal executive offices) |
|
22102
(Zip Code) |
Registrant's telephone number, including area code:(703) 584-3400
Securities registered pursuant to Section 12(b) of the Act:
| Title of each class | | Name of each exchange on which registered |
| Common Stock, par value $1.00 per share | | The Nasdaq Stock Market |
Securities registered pursuant to Section 12(g) of the Act: None
Indicate by check mark if the registrant is a well-known seasoned issuer, as defined in Rule 405 of the Securities Act. Yes o No ý
Indicate by check mark if the registrant is not required to file reports pursuant to Section 13 or Section 15(d) of the Act. Yes o No ý
Indicate by check mark whether the registrant (1) has filed all reports required to be filed by Section 13 or 15(d) of the Securities Exchange Act of 1934 during the preceding 12 months (or for such shorter period that the registrant was required to file such reports), and (2) has been subject to such filing requirements for the past 90 days. Yes ý No o
Indicate by check mark if disclosure of delinquent filers pursuant to Item 405 of Regulation S-K is not contained herein, and will not be contained, to the best of registrant's knowledge, in definitive proxy or information statements incorporated by reference in Part III of this Form 10-K or any amendment to this Form 10-K. o
Indicate by check mark whether the registrant is a large accelerated filer, an accelerated filer, or a non-accelerated filer or a smaller reporting company. See definition of "large accelerated filer," "accelerated filer" and "smaller reporting company" in Rule 12b-2 of the Exchange Act. (Check one):
| Large accelerated filer o | | Accelerated filer ý | | Non-accelerated filer o
(Do not check if smaller reporting company) | | Smaller reporting company o |
Indicate by check mark whether the registrant is a shell company (as defined in Rule 12b-2 of the Act). Yes o No ý
State the aggregate market value of the voting and non-voting common equity held by non-affiliates computed by reference to the price at which the common equity was last sold as of June 30, 2007: $204,482,931.
The number of shares outstanding of Common Stock, as of March 11, 2008, was 24,164,061.
DOCUMENTS INCORPORATED BY REFERENCE
Portions of the registrant's definitive Proxy Statement for the 2008 Annual Meeting of Shareholders are incorporated by reference into Part III of this Form 10-K. With the exception of the portions of the Proxy Statement specifically incorporated herein by reference, the Proxy Statement is not deemed to be filed as part of this Form 10-K.
TABLE OF CONTENTS
| |
| | Page
|
|---|
PART I |
Item 1. |
|
Business |
|
3 |
Item 1A. |
|
Risk Factors |
|
21 |
Item 1B. |
|
Unresolved Staff Comments |
|
26 |
Item 2. |
|
Properties |
|
26 |
Item 3. |
|
Legal Proceedings |
|
26 |
Item 4. |
|
Submission of Matters to a Vote of Security Holders |
|
26 |
PART II |
Item 5. |
|
Market for Registrant's Common Equity, Related Stockholder Matters and Issuer Purchases of Equity Securities |
|
27 |
Item 6. |
|
Selected Financial Data |
|
29 |
Item 7. |
|
Management's Discussion and Analysis of Financial Condition and Results of Operations |
|
30 |
Item 7A. |
|
Quantitative and Qualitative Disclosures About Market Risk |
|
68 |
Item 8. |
|
Financial Statements and Supplementary Data |
|
69 |
Item 9. |
|
Changes in and Disagreements with Accountants on Accounting and Financial Disclosure |
|
119 |
Item 9A. |
|
Controls and Procedures |
|
119 |
Item 9B. |
|
Other Information |
|
119 |
PART III |
Item 10. |
|
Directors, Executive Officers and Corporate Governance |
|
120 |
Item 11. |
|
Executive Compensation |
|
120 |
Item 12. |
|
Security Ownership of Certain Beneficial Owners and Management and Related Stockholder Matters |
|
120 |
Item 13. |
|
Certain Relationships and Related Transactions, and Director Independence |
|
120 |
Item 14. |
|
Principal Accounting Fees and Services |
|
120 |
Part IV |
Item 15. |
|
Exhibits, Financial Statement Schedules |
|
121 |
This Annual Report on Form 10-K has not been reviewed, or confirmed for accuracy or relevance, by the Federal Deposit Insurance Corporation.
2
PART I
Item 1. Business
Overview
Cardinal Financial Corporation, a financial holding company, was formed in late 1997 as a Virginia corporation, principally in response to opportunities resulting from the consolidation of several Virginia-based banks with regional bank holding companies. In our market area, these bank consolidations had been accompanied by the dissolution of local boards of directors and relocation or termination of management and customer service professionals.
We own Cardinal Bank, a Virginia state-chartered community bank headquartered in Tysons Corner, Virginia. Cardinal Bank has offices in Alexandria, Annandale, Arlington, Chantilly, Clifton, Fairfax, Fredericksburg, Herndon, Leesburg, Manassas, McLean, Purcellville, Reston, Stafford, Sterling, Sterling Park, Tysons Corner, and Woodbridge, Virginia, Washington, D.C. and Bethesda, Maryland. We conduct all of our business through Cardinal Bank (the "Bank"), our principal operating unit, its subsidiary George Mason Mortgage, LLC ("George Mason"), Cardinal Wealth Services, Inc. ("CWS"), and Wilson/Bennett Capital Management, Inc. ("Wilson/Bennett").
Cardinal Bank offers a wide range of traditional bank loan and deposit products and services to both our commercial and retail customers. Our commercial relationship managers focus on attracting small and medium sized businesses as well as government contractors, commercial real estate developers and builders and professionals, such as physicians, accountants and attorneys. We have 25 branch office locations and provide competitive products and services.
George Mason engages primarily in the origination and acquisition of residential mortgages for sale into the secondary market on a best efforts basis through seven branches located throughout the metropolitan Washington, D.C. region. George Mason is one of the largest residential mortgage originators in the greater Washington metropolitan area, generating originations of approximately $2.2 billion in 2007 and $3.0 billion in 2006, excluding advances on construction loans and including loans purchased from other mortgage banking companies owned by local home builders but managed by George Mason.
CWS provides brokerage and investment services through a contract with Raymond James Financial Services, Inc. Under this contract, financial advisors can offer our customers an extensive range of financial products and services, including estate planning, qualified retirement plans, mutual funds, annuities, life insurance, fixed income and equity securities and equity research and recommendations. CWS's principal source of revenue is the net commissions it earns on the purchases and sales of investment products to its customers.
Wilson/Bennett provides professional investment management of financial assets with asset preservation as the primary goal. Clients include individuals, pension plans and medium sized corporations. Wilson/Bennett utilizes a value oriented investment approach and focuses on large capitalization stocks as well as cash management services. Wilson/Bennett earns fees based upon the market value of its clients' portfolios.
On February 9, 2006, Cardinal Bank acquired certain fiduciary and other assets and assumed certain liabilities of FBR National Trust Company, formerly a subsidiary of Friedman, Billings, Ramsey Group, Inc. As a result of this transaction, the Bank acts as trustee or custodian for client assets and earns fees primarily based upon balances under management. This transaction has helped to diversify the Bank's sources of non-interest income and allows us to provide additional services to our customers.
3
Growth Strategy
We believe that the strong demographic characteristics of our market, the ongoing bank consolidation, and the stable economy in the metropolitan Washington, D.C. area, particularly in Northern Virginia, provide a significant opportunity to continue building a successful community-focused banking franchise. We intend to continue to expand our business through internal growth, as well as selective geographic expansion, while maintaining strong asset quality and achieving increasing profitability. The strategy for achieving these objectives includes the following:
Expand our footprint through branch expansion. We intend to continue to expand our footprint by establishing new branches and potentially acquiring existing branches or other financial institutions in communities that present attractive growth opportunities within Northern Virginia and other markets in the greater Washington, D.C. metropolitan area. During the first quarter of 2007, we opened two branch banking offices, our first branch banking office in Bethesda, Maryland, and a second location in Arlington, Virginia.
As a result of the recent consolidation of banks in our market, we expect to continue to have opportunities to acquire or lease former branch sites from other financial institutions. As we have done in the past, we may acquire additional sites prior to planned branch openings when we believe the sites are attractive and are available on favorable terms. Our current plans, which are subject to change, contemplate that we will add no new branches in 2008. Because the opening of each new branch increases our operating expenses, we intend to stage future branch openings in an effort to minimize the impact of these expenses on our results of operations.
Capitalize on the continued bank consolidation in our market. We anticipate that recently announced or completed bank mergers will result in further consolidation in our target market and intend to capitalize on the dislocation of customers resulting from this consolidation. We believe this consolidation creates opportunities for us to further expand our branch network, as discussed above, as well as to increase our market share of bank deposits within our target market. As a local banking organization, we believe we can compete effectively by providing a high level of personalized service in a service-oriented and customer-centric branch system. We will also continue to explore the possibility of further growth through acquisition in Virginia, the metropolitan Washington, D.C. market, or other areas if we believe that such expansion will strengthen the Company by diversifying its customer base and sources of revenue and be accretive to earnings within a reasonable time frame.
Expand our lending activities. We have substantially increased our legal lending limit to $24.0 million as of December 31, 2007 as a result of the completion of our secondary common stock offering in May 2005, and earnings retained in the business. The increase in our legal lending limit allows us to further expand our commercial and real estate lending activities. It also improves our ability to serve larger residential homebuilders and allows us to seek business from larger government contractors. According to George Mason University's Center for Regional Analysis, federal government spending in the greater Washington region was approximately $119 billion in 2007, and we believe there are unique growth opportunities in this sector of our regional economy. Our goal is to aggressively grow our loan portfolio while maintaining superior asset quality through conservative underwriting practices. During periods of growth in our loan portfolio, our earnings could be adversely impacted by provisions to our allowance for loan losses as a result of increases in loan balances.
Continue to recruit experienced bankers. We have been successful in recruiting senior bankers with experience in and knowledge of our market who have been displaced or have grown dissatisfied as a result of the previously mentioned bank consolidation. We intend to continue our efforts to recruit experienced bankers, particularly experienced lenders, who can immediately generate additional loan volume through their existing credit relationships.
4
Focus on specialized lending services. We have expanded certain existing product lines, including government contract receivables lending, SBA guaranteed lending, and retail lending. Our commercial relationship managers focus on attracting small and medium sized businesses, including commercial real estate developers, builders, country clubs, and professionals such as physicians, accountants and attorneys. Our goal is to create a diversified, community-focused banking franchise, balanced between retail, commercial and real estate transactions and services.
Offer additional financial products and services. George Mason has increased our fee income and has allowed us to offer our existing customer base a far greater array of mortgage loan products. In addition, we market our traditional banking, trust and wealth management products to the George Mason customer base. Our focus at George Mason is to build and maintain relationships with local and national homebuilders in an attempt to reduce reliance on the cyclical refinancing market. Building relationships with larger homebuilders assists us in our efforts to increase our commercial real estate lending activities.
We plan to further develop and expand the investment services we offer through CWS, Wilson/Bennett and through our trust services department. We believe we have opportunities to cross-sell additional services to both our traditional banking customers and George Mason's customers. We further believe we will be able to attract new customers by offering a broader array of financial products and services.
Business Segment Operations
We operate in three business segments, commercial banking, mortgage banking and wealth management and trust services. The commercial banking segment includes both commercial and consumer lending and provides customers such products as commercial loans, real estate loans, and other business financing and consumer loans. In addition, this segment provides customers with several choices of deposit products, including demand deposit accounts, savings accounts and certificates of deposit. The mortgage banking segment engages primarily in the origination and acquisition of residential mortgages for sale into the secondary market on a best efforts basis. The wealth management and trust services segment provides investment and financial advisory services to businesses and individuals, including financial planning, retirement/estate planning, trust, estates, custody, investment management, escrows, and retirement plans.
Results related to the assets acquired and liabilities assumed from FBR National Trust Company have been reflected in the wealth management and trust services segment since the date of their acquisition and assumption, February 9, 2006.
For financial information about the reportable segments, see "Business Segment Operations" in Item 7 below and note 18 of the notes to the consolidated financial statements in Item 8 below.
Market Area
We consider our primary target market to be the greater Washington metropolitan area, which includes the District of Columbia, the Northern Virginia counties of Arlington, Fairfax, Fauquier, Loudoun, Prince William, Spotsylvania and Stafford, the Northern Virginia cities of Alexandria, Fairfax, Falls Church, Fredericksburg, and Manassas, and the Maryland counties of Frederick, Montgomery and Prince Georges. We will, however, consider expansion into other areas if we believe such expansion will strengthen the Company by diversifying its customer base and sources of revenue and be accretive to earnings within a reasonable time frame.
Based on estimates released by the U.S. Census Bureau, the population of the greater Washington metropolitan area was approximately 5.3 million people in 2006, the eighth largest metropolitan statistical area in the country. The median annual household income for this area in 2006 was
5
approximately $79,000, which makes it one of the wealthiest regions in the country. Based on estimates released by the Bureau of Labor Statistics of the U.S. Department of Labor for December 2007 the unemployment rate for the greater Washington metropolitan area was approximately 3.0% compared to a national unemployment rate of 4.8%. As of June 30, 2007, total deposits in this area were approximately $155 billion as reported by the Federal Deposit Insurance Corporation ("FDIC").
Our headquarters is located approximately seven miles west of Washington, D.C. in Fairfax County, Virginia. Fairfax County, with over one million people, is the most populous county in Virginia and the most populous jurisdiction in the Washington, D.C. area. According to the latest U.S. Census Bureau estimates, Fairfax County also has the highest median household income of any county in the United States of $100,300, recently surpassing our neighbor, Loudoun County.
Competition
The greater Washington region is dominated by branches of large regional or national banks headquartered outside of the region. Our market area is a highly competitive, highly branched, banking market. We compete as a financial intermediary with other commercial banks, savings and loan associations, savings banks, credit unions, mortgage banking firms, consumer finance companies, securities brokerage firms, insurance companies, mutual fund groups and other types of financial institutions. George Mason faces significant competition from both traditional financial institutions and other national and local mortgage banking operations.
The competition to acquire deposits and to generate loans, including mortgage banking loans, is intense, and pricing is important. Many of our competitors are larger and have substantially greater resources and lending limits than we do. In addition, many competitors offer more extensive branch and ATM networks than we currently have. Larger institutions operating in the greater Washington market have access to funding sources at lower costs than are available to us since they have larger and more diverse fund generating capabilities. However, we believe that we have and will continue to be successful in competing in this environment due to an emphasis on a high level of personalized customer service, localized and more responsive decision making, and community involvement.
Of the $155 billion in bank deposits in the greater Washington region at June 30, 2007, approximately 81% were held by banks that are either based outside of the greater Washington region or are operating wholesale banks that generate deposits nationally. Excluding the deposits held by institutions based outside our region, we have grown to the seventh largest financial institution headquartered in the greater Washington region as measured by total deposits. By providing competitive products and more personalized service and being actively involved in our local communities, we believe we can continue to increase our share of this deposit market.
Customers
We believe that the recent and ongoing bank consolidation within Northern Virginia and the greater Washington region provides a significant opportunity to build a successful, locally-oriented banking franchise. We also believe that many of the larger financial institutions in our area do not emphasize the high level of personalized service to small and medium-sized commercial businesses, professionals or individual retail customers that we emphasize.
We expect to continue serving these business and professional markets with experienced commercial relationship managers, and we have increased our retail marketing efforts through the expansion of our branch network and development of additional retail products and services. We expanded our deposit market share through aggressive marketing of our President's Club, Chairman's Club, Simply Savings and Monster Money Market relationship products and our Totally Free Checking product.
6
Banking Products and Services
Our principal business is to accept deposits from the public and to make loans and other investments. The principal sources of funds for the Bank's loans and investments are demand, time, savings and other deposits, repayments of existing loans, and borrowings. Our principal source of income is interest collected on loans, investment securities and other investments. Non-interest income, which includes among other things deposit and loan fees and service charges, gains on sales of loans, investment fee income, and management fee income, is the next largest component of our revenues. Our principal expenses are interest expense on deposits and borrowings, employee compensation and benefits, occupancy-related expenses, and other overhead expenses.
The principal business of George Mason, the Bank's mortgage banking subsidiary, is to originate residential loans for sale into the secondary market on a best efforts basis. These loans are closed and serviced by George Mason on an interim basis pending their ultimate sale to a permanent investor. The mortgage subsidiary funds these loans through a line of credit from Cardinal Bank and cash available through its own operations. George Mason's income on these loans is generated from the fees it charges its customers, the gains it recognizes upon the sales of loans and the interest income it earns while the loans are being serviced. Costs associated with these loans are primarily comprised of salaries and commissions paid to loan originators and support personnel, interest expense incurred while the loans are held pending sale and other expenses associated with the origination of the loans. In addition, George Mason generates management fee income by providing specific services to other mortgage banking companies owned by local home builders.
George Mason also offers a construction-to-permanent loan program. This program provides variable and fixed rate financing for customers to construct their residences. Once the home has been completed, the loan converts to fixed rate financing and is sold into the secondary market. These construction-to-permanent loans generate fee income as well as net interest income for George Mason and are classified as loans held for sale.
George Mason's business is both cyclical and seasonal. The cyclical nature of its business is influenced by, among other things, the levels of and trends in mortgage interest rates, national and local economic conditions and consumer confidence in the economy. Historically, George Mason has its lowest levels of quarterly loan closings during the first quarter of the year.
Both Cardinal Bank and George Mason are committed to providing high quality products and services to their customers, and have made a significant investment in their core information technology systems. These systems provide the technology that fully automates the branches, processes bank transactions, mortgage originations, other loans and electronic banking, conducts database and direct response marketing, provides cash management solutions, streamlined reporting and reconciliation support.
With this investment in technology, the Bank offers internet-based delivery of products for both individuals and commercial customers. Customers can open accounts, apply for loans, check balances, check account history, transfer funds, pay bills, download account transactions into Quicken™ and Microsoft Money™, and correspond via e-mail with the Bank over the internet. The internet provides an inexpensive way for the Bank to expand its geographic borders and branch activities while providing services offered by larger banks.
We offer a broad array of products and services to our customers. A description of our products and services is set forth below.
7
Lending
We offer a full range of short to long-term commercial, real estate and consumer lending products and services, which are described in further detail below. We have established target percentage goals for each type of loan to insure adequate diversification of our loan portfolio. These goals, however, may change from time to time as a result of competition, market conditions, employee expertise, and other factors. Commercial and industrial loans, real estate-commercial loans, real estate-construction loans, real estate-residential loans, home equity loans, and consumer loans account for approximately 13%, 40%, 18%, 20%, 8% and 1%, respectively of our loan portfolio at December 31, 2007.
Commercial and Industrial Loans. We make commercial loans to qualified businesses in our market area. Our commercial lending portfolio consists primarily of commercial and industrial loans for the financing of accounts receivable, inventory, property, plant and equipment. Our government contract lending group provides secured lending to government contracting firms and businesses based primarily on receivables from the federal government. We also offer Small Business Administration (SBA) guaranteed loans and asset-based lending arrangements to our customers. We are certified as a preferred lender by the SBA, which provides us with much more flexibility in approving loans guaranteed under the SBA's various loan guaranty programs.
Commercial and industrial loans generally have a higher degree of risk than residential mortgage loans, but have commensurately higher yields. Residential mortgage loans generally are made on the basis of the borrower's ability to repay the loan from his or her salary and other income and are secured by residential real estate, the value of which generally is ascertainable. In contrast, commercial loans typically are made on the basis of the borrower's ability to repay the loan from the cash flow from its business and are secured by business assets, such as commercial real estate, accounts receivable, equipment and inventory, the values of which may decline over time and generally cannot be appraised with as much precision as residential real estate. As a result, the availability of funds for the repayment of commercial loans may be substantially dependent upon the commercial success of the business itself.
To manage these risks, our policy is to secure the commercial loans we make with both the assets of the business, which are subject to the risks described above, and other additional collateral and guarantees that may be available. In addition, we actively monitor certain attributes of the borrower and the credit facility, including advance rate, cash flow, collateral value and other credit factors that we consider appropriate.
Commercial Mortgage Loans. We originate commercial mortgage loans. These loans are primarily secured by various types of commercial real estate, including office, retail, warehouse, industrial and other non-residential types of properties and are made to the owners and/or occupiers of such property. These loans generally have maturities ranging from one to ten years.
Commercial mortgage lending entails significant additional risk compared with traditional residential mortgage lending. Commercial mortgage loans typically involve larger loan balances concentrated with single borrowers or groups of related borrowers. Additionally, the repayment of loans secured by income-producing properties is typically dependent upon the successful operation of a business or real estate project and thus may be subject, to a greater extent than is the case with residential mortgage loans, to adverse conditions in the commercial real estate market or in the general economy. Our commercial real estate loan underwriting criteria require an examination of debt service coverage ratios, the borrower's creditworthiness and prior credit history and reputation, and we generally require personal guarantees or endorsements with respect to these loans. In the loan underwriting process, we also carefully consider the location of the property that will be collateral for the loan.
8
Loan-to-value ratios for commercial mortgage loans generally do not exceed 80%. We permit loan-to-value ratios of up to 80% if the borrower has appropriate liquidity, net worth and cash flow.
Residential Mortgage Loans. Residential mortgage loans are originated by both Cardinal Bank and George Mason. Our residential mortgage loans consist of residential first and second mortgage loans, residential construction loans and home equity lines of credit and term loans secured by the residences of borrowers. Second mortgage and home equity lines of credit are used for home improvements, education and other personal expenditures. We make mortgage loans with a variety of terms, including fixed, floating and variable interest rates, with maturities ranging from three months to thirty years.
Residential mortgage loans generally are made on the basis of the borrower's ability to repay the loan from his or her salary and other income and are secured by residential real estate, the value of which is generally readily ascertainable. These loans are made consistent with our appraisal and real estate lending policies, which detail maximum loan-to-value ratios and maturities. Residential mortgage loans and home equity lines of credit secured by owner-occupied property generally are made with a loan-to-value ratio of up to 80%. Loan-to-value ratios of up to 90% may be allowed on residential owner-occupied property if the borrower exhibits unusually strong creditworthiness. We generally do not make residential loans which, at the time of inception, have loan-to-value ratios in excess of 90%.
Construction Loans. Our construction loan portfolio consists of single-family residential properties, multi-family properties and commercial projects. Construction lending entails significant additional risks compared with residential mortgage lending. Construction loans often involve larger loan balances concentrated with single borrowers or groups of related borrowers. Construction loans also involve additional risks since funds are advanced while the property is under construction, which property has uncertain value prior to the completion of construction. Thus, it is more difficult to evaluate accurately the total loan funds required to complete a project and related loan-to-value ratios. To reduce the risks associated with construction lending, we limit loan-to-value ratios for owner occupied residential or commercial properties to 80%, and for investor-owned residential or commercial properties to 80% of when-completed appraised values. We expect that these loan-to-value ratios will provide sufficient protection against fluctuations in the real estate market to limit the risk of loss. Maturities for construction loans generally range from 12 to 24 months for residential, non-residential and multi-family properties.
Consumer Loans. Our consumer loans consist primarily of installment loans made to individuals for personal, family and household purposes. The specific types of consumer loans we make include home improvement loans, automobile loans, debt consolidation loans and general consumer lending.
Consumer loans may entail greater risk than residential mortgage loans, particularly in the case of consumer loans that are unsecured, such as lines of credit, or secured by rapidly depreciable assets, such as automobiles. In such cases, any repossessed collateral for a defaulted consumer loan may not provide an adequate source of repayment of the outstanding loan balance as a result of the greater likelihood of damage, loss or depreciation. The remaining deficiency often does not warrant further substantial collection efforts against the borrower. In addition, consumer loan collections are dependent on the borrower's continuing financial stability, and thus are more likely to be adversely affected by job loss, divorce, illness or personal bankruptcy. Furthermore, the application of various federal and state laws, including federal and state bankruptcy and insolvency laws, may limit the amount that can be recovered on such loans. A loan may also give rise to claims and defenses by a consumer loan borrower against an assignee of such loan, such as the bank, and a borrower may be able to assert against such assignee claims and defenses that it has against the seller of the underlying collateral.
Our policy for consumer loans is to accept moderate risk while minimizing losses, primarily through a careful credit and financial analysis of the borrower. In evaluating consumer loans, we require our lending officers to review the borrower's level and stability of income, past credit history,
9
amount of debt currently outstanding and the impact of these factors on the ability of the borrower to repay the loan in a timely manner. In addition, we require our banking officers to maintain an appropriate differential between the loan amount and collateral value.
We also issue credit cards to certain of our customers. In determining to whom we will issue credit cards, we evaluate the borrower's level and stability of income, past credit history and other factors. Finally, we make additional loans that are not classified in one of the above categories. In making such loans, we attempt to ensure that the borrower meets our loan underwriting standards.
Loan Participations
From time to time we purchase and sell commercial loan participations to or from other banks within our market area. All loan participations purchased have been underwritten using the bank's standard and customary underwriting criteria and are in good standing.
Deposits
We offer a broad range of interest-bearing and non-interest-bearing deposit accounts, including commercial and retail checking accounts, money market accounts, individual retirement accounts, regular interest-bearing savings accounts and certificates of deposit with a range of maturity date options. The primary sources of deposits are small and medium-sized businesses and individuals within our target market. Senior management has the authority to set rates within specified parameters in order to remain competitive with other financial institutions in our market area. All deposits are insured by the FDIC up to the maximum amount permitted by law. We have a service charge fee schedule, which is generally competitive with other financial institutions in our market, covering such matters as maintenance fees and per item processing fees on checking accounts, returned check charges and other similar fees.
Courier Services
We offer courier services to our business customers. Courier services permit us to provide the convenience and personalized service that our customers require by scheduling pick-ups of deposits and other banking transactions.
Deposit on Demand
We provide our commercial banking customers electronic deposit capability through our Deposit on Demand product. Business customers who sign up for this service can scan their deposits and send electronic batches of their deposits to the bank. This product reduces or eliminates the need for businesses with daily deposits and high check volume to visit the bank and provides the benefit of viewing images of deposited checks.
Telephone and Internet Banking
We believe that there is a strong demand within our market for telephone banking and internet banking. These services allow both commercial and retail customers to access detailed account information and execute a wide variety of banking transactions, including balance transfers and bill payment. We believe that these services are particularly attractive to our customers, as it enables them at any time to conduct their banking business and monitor their accounts. Telephone and internet banking assist us in attracting and retaining customers and encourages our existing customers to consider Cardinal for all of their banking and financial needs.
During 2007, we introduced Cardinal Mobile Banking to our customers. Customers who sign up for this service can access their accounts from any internet-enabled cell phone, PDA or mobile device.
10
Customers can check their balance, view account activity, transfer funds between deposit accounts, and pay their bills online. Cardinal Mobile Banking is encrypted using the Wireless Transport Layer Security (WTLS) protocol, which provides the highest level of security available today. As part of our Mobile Banking service, customers can also receive text messages about their account balances and recent transaction activity.
Automatic Teller Machines
We have an ATM at each of our branch offices and we make other financial institutions' ATMs available to our customers.
Other Products and Services
We offer other banking-related specialized products and services to our customers, such as travelers' checks, coin counters, wire services, and safe deposit box services. We issue letters of credit and standby letters of credit for some of our commercial customers, most of which are related to real estate construction loans. We have not engaged in any securitizations of loans.
Credit Policies
Our chief credit officer and senior lending officers are primarily responsible for maintaining both a quality loan portfolio and a strong credit culture throughout the organization. The chief credit officer is responsible for developing and updating our credit policies and procedures, which are approved by the board of directors. Senior lending officers may make exceptions to these credit policies and procedures as appropriate, but any such exception must be documented and made for sound business reasons, and, if the loan is in excess of the officer's lending limit, be approved by the chief credit officer.
Credit quality is controlled by the chief credit officer through compliance with our credit policies and procedures. Our risk-decision process is actively managed in a disciplined fashion to maintain an acceptable risk profile characterized by soundness, diversity, quality, prudence, balance and accountability. Our credit approval process consists of specific authorities granted to the lending officers and combinations of lending officers. Loans exceeding a particular lending officer's level of authority, or the combined limit of several officers, are reviewed and considered for approval by an officers' loan committee and, when above a specified amount, by a committee of the Bank's board of directors. Generally, loans greater than $1,500,000 require committee approval. Our policy allows exceptions for very specific conditions, such as loans secured by deposits at our Bank. The chief credit officer works closely with each lending officer at the Bank level to ensure that the business being solicited is of the quality and structure that fits our desired risk profile.
Under our credit policies, we monitor our concentration of credit risk. We have established credit concentration guideline limits for commercial and industrial loans, real estate—commercial loans, real estate—residential loans and consumer purpose loans, which include home equity loans. Furthermore, the Bank has established limits on the total amount of the Bank's outstanding loans to one borrower, all of which are set below legal lending limits.
Loans closed by George Mason are underwritten in accordance with guidelines established by the various secondary market investors to which George Mason sells its loans. George Mason may originate non-traditional loans, such as negative amortization loans, for these investors.
Brokerage and Asset Management Services
CWS provides brokerage and investment services through an arrangement with Raymond James Financial Services, Inc. Under this arrangement, financial advisors can offer our customers an extensive range of investment products and services, including estate planning, qualified retirement plans, mutual
11
funds, annuities, life insurance, fixed income and equity securities and equity research and recommendations. Through Wilson/Bennett, we also offer asset management services to customers using a value-oriented approach that focuses on large capitalization stocks.
On February 9, 2006, the Bank acquired certain fiduciary and other assets and assumed certain liabilities of FBR National Trust Company, formerly a subsidiary of Friedman, Billings, Ramsey Group, Inc. This acquisition allowed us to create a trust division, and services provided by our trust division include trust, estates, custody, investment management, escrows, and retirement plans. The addition of trust services diversifies the Bank's sources of non-interest income and allows us to provide additional services to our customers.
Employees
At December 31, 2007, we had 364 full-time equivalent employees. None of our employees are represented by any collective bargaining unit. We believe our relations with our employees are good.
Government Supervision and Regulation
General
As a financial holding company, we are subject to regulation under the Bank Holding Company Act of 1956, as amended, and the examination and reporting requirements of the Board of Governors of the Federal Reserve System. Other federal and state laws govern the activities of our bank subsidiary, including the activities in which it may engage, the investments that it makes, the aggregate amount of loans that it may grant to one borrower, and the dividends it may declare and pay to us. Our bank subsidiary is also subject to various consumer and compliance laws. As a state-chartered bank, the Bank is primarily subject to regulation, supervision and examination by the Bureau of Financial Institutions of the Virginia State Corporation Commission. Our bank subsidiary also is subject to regulation, supervision and examination by the Federal Deposit Insurance Corporation. As part of our bank subsidiary, George Mason is subject to the same regulations as the Bank.
The following description summarizes the more significant federal and state laws applicable to us. To the extent that statutory or regulatory provisions are described, the description is qualified in its entirety by reference to that particular statutory or regulatory provision.
The Bank Holding Company Act
Under the Bank Holding Company Act, we are subject to periodic examination by the Federal Reserve and required to file periodic reports regarding our operations and any additional information that the Federal Reserve may require. Our activities at the bank holding company level are limited to:
- •
- banking, managing or controlling banks;
- •
- furnishing services to or performing services for our subsidiaries; and
- •
- engaging in other activities that the Federal Reserve has determined by regulation or order to be so closely related to banking as to be a proper incident to these activities.
Some of the activities that the Federal Reserve Board has determined by regulation to be closely related to the business of a bank holding company include making or servicing loans and specific types of leases, performing specific data processing services and acting in some circumstances as a fiduciary or investment or financial adviser.
With some limited exceptions, the Bank Holding Company Act requires every bank holding company to obtain the prior approval of the Federal Reserve before:
- •
- acquiring substantially all the assets of any bank; and
12
- •
- acquiring direct or indirect ownership or control of any voting shares of any bank if after such acquisition it would own or control more than 5% of the voting shares of such bank (unless it already owns or controls the majority of such shares), or merging or consolidating with another bank holding company.
In addition, and subject to some exceptions, the Bank Holding Company Act and the Change in Bank Control Act, together with their regulations, require Federal Reserve approval prior to any person or company acquiring "control" of a bank holding company. Control is conclusively presumed to exist if an individual or company acquires 25% or more of any class of voting securities of the bank holding company. Control is rebuttably presumed to exist if a person acquires 10% or more, but less than 25%, of any class of voting securities and if the institution has registered securities under Section 12 of the Securities Exchange Act of 1934 or no other person owns a greater percentage of that class of voting securities immediately after the transaction. The regulations provide a procedure for challenging this rebuttable control presumption.
In November 1999, Congress enacted the Gramm-Leach-Bliley Act ("GLBA"), which made substantial revisions to the statutory restrictions separating banking activities from other financial activities. Under the GLBA, bank holding companies that are well-capitalized and well-managed and meet other conditions can elect to become "financial holding companies." As financial holding companies, they and their subsidiaries are permitted to acquire or engage in previously impermissible activities, such as insurance underwriting and securities underwriting and distribution. In addition, financial holding companies may also acquire or engage in certain activities in which bank holding companies are not permitted to engage in, such as travel agency activities, insurance agency activities, merchant banking and other activities that the Federal Reserve determines to be financial in nature or complementary to these activities. Financial holding companies continue to be subject to the overall oversight and supervision of the Federal Reserve, but the GLBA applies the concept of functional regulation to the activities conducted by subsidiaries. For example, insurance activities would be subject to supervision and regulation by state insurance authorities. We became a financial holding company in 2004.
Payment of Dividends
We are a legal entity separate and distinct from Cardinal Bank, CWS, Wilson/Bennett, and Cardinal Statutory Trust I. Virtually all of our cash revenues will result from dividends paid to us by our bank subsidiary and interest earned on short term investments. Our bank subsidiary is subject to laws and regulations that limit the amount of dividends that it can pay. Under Virginia law, a bank may not declare a dividend in excess of its accumulated retained earnings. Additionally, our bank subsidiary may not declare a dividend if the total amount of all dividends, including the proposed dividend, declared by the bank in any calendar year exceeds the total of the bank's retained net income of that year to date, combined with its retained net income of the two preceding years, unless the dividend is approved by the FDIC. Our bank subsidiary may not declare or pay any dividend if, after making the dividend, the bank would be "undercapitalized," as defined in the banking regulations.
The FDIC and the state have the general authority to limit the dividends paid by insured banks if the payment is deemed an unsafe and unsound practice. Both the state and the FDIC have indicated that paying dividends that deplete a bank's capital base to an inadequate level would be an unsound and unsafe banking practice.
In addition, we are subject to certain regulatory requirements to maintain capital at or above regulatory minimums. These regulatory requirements regarding capital affect our dividend policies. Regulators have indicated that financial holding companies should generally pay dividends only if the organization's net income available to common shareholders over the past year has been sufficient to fully fund the dividends, and the prospective rate of earnings retention appears consistent with the organization's capital needs, asset quality and overall financial condition.
13
Insurance of Accounts, Assessments and Regulation by the FDIC
The deposits of our bank subsidiary are insured by the FDIC up to the limits set forth under applicable law. The deposits of our bank subsidiary are subject to the deposit insurance assessments of the Bank Insurance Fund, or "BIF", of the FDIC.
The FDIC has implemented a risk-based deposit insurance assessment system under which the assessment rate for an insured institution may vary according to regulatory capital levels of the institution and other factors, including supervisory evaluations. In addition to being influenced by the risk profile of the particular depository institution, FDIC premiums are also influenced by the size of the FDIC insurance fund in relation to total deposits in FDIC insured banks. The FDIC has authority to impose special assessments.
In February 2006, The Federal Deposit Insurance Reform Act of 2005 and The Federal Deposit Insurance Reform Conforming Amendments Act of 2005 (collectively, "The Reform Act") was signed into law. This legislation contained technical and conforming changes to implement deposit insurance reform, as well as a number of study and survey requirements.
The Reform Act provides for the following changes:
- •
- Merging the Bank Insurance Fund ("BIF") and the Savings Association Insurance Fund ("SAIF") into a new fund, the Deposit Insurance Fund ("DIF"). This change was made effective March 31, 2006.
- •
- Increasing the coverage limit for retirement accounts to $250,000 and indexing the coverage limit for retirement accounts to inflation as with the general deposit insurance coverage limit. This change was made effective April 1, 2006.
- •
- Establishing a range of 1.15 percent to 1.50 percent within which the FDIC Board of Directors may set the Designated Reserve Ratio ("DRR").
- •
- Allowing the FDIC to manage the pace at which the reserve ratio varies within this range.
- 1.
- If the reserve ratio falls below 1.15 percent—or is expected to within 6 months—the FDIC must adopt a restoration plan that provides that the DIF will return to 1.15 percent generally within 5 years.
- 2.
- If the reserve ratio exceeds 1.35 percent, the FDIC must generally dividend to DIF members half of the amount above the amount necessary to maintain the DIF at 1.35 percent, unless the FDIC Board, considering statutory factors, suspends the dividends.
- 3.
- If the reserve ratio exceeds 1.5 percent, the FDIC must generally dividend to DIF members all amounts above the amount necessary to maintain the DIF at 1.5 percent.
- •
- Eliminating the restrictions on premium rates based on the DRR and granting the FDIC Board the discretion to price deposit insurance according to risk for all insured institutions regardless of the level of the reserve ratio.
- •
- Granting a one-time initial assessment credit (of approximately $4.7 billion) to recognize institutions' past contributions to the fund.
- •
- Requiring the FDIC to conduct studies of three issues: (1) further potential changes to the deposit insurance system, (2) the appropriate deposit base in designating the reserve ratio, and (3) the FDIC's contingent loss reserving methodology and accounting for losses.
14
- •
- Requiring the Comptroller General to conduct studies of (1) federal bank regulators' administration of the prompt corrective action program and recent changes to the FDIC deposit insurance system, and (2) the organizational structure of the FDIC.
The FDIC is authorized to prohibit any insured institution from engaging in any activity that the FDIC determines by regulation or order to pose a serious threat to the DIF. Also, the FDIC may initiate enforcement actions against banks, after first giving the institution's primary regulatory authority an opportunity to take such action. The FDIC may terminate the deposit insurance of any depository institution if it determines, after a hearing, that the institution has engaged or is engaging in unsafe or unsound practices, is in an unsafe or unsound condition to continue operations, or has violated any applicable law, regulation, order or any condition imposed in writing by the FDIC. It also may suspend deposit insurance temporarily during the hearing process for the permanent termination of insurance, if the institution has no tangible capital. If deposit insurance is terminated, the deposits at the institution at the time of termination, less subsequent withdrawals, shall continue to be insured for a period from six months to two years, as determined by the FDIC. We are unaware of any existing circumstances that could result in termination of any of our bank subsidiary's deposit insurance.
Capital Requirements
Each of the FDIC and the Federal Reserve Board has issued risk-based and leverage capital guidelines applicable to banking organizations that it supervises. Under the risk-based capital requirements, we and our bank subsidiary are each generally required to maintain a minimum ratio of total capital to risk-weighted assets (including specific off-balance sheet activities, such as standby letters of credit) of 8%. At least half of the total capital must be composed of "Tier 1 Capital," which is defined as common equity, retained earnings, qualifying perpetual preferred stock and minority interests in common equity accounts of consolidated subsidiaries, less certain intangibles. The remainder may consist of "Tier 2 Capital", which is defined as specific subordinated debt, some hybrid capital instruments and other qualifying preferred stock and a limited amount of the loan loss allowance and pretax net unrealized holding gains on certain equity securities. In addition, each of the federal banking regulatory agencies has established minimum leverage capital requirements for banking organizations. Under these requirements, banking organizations must maintain a minimum ratio of Tier 1 capital to adjusted average quarterly assets equal to 3% to 5%, subject to federal bank regulatory evaluation of an organization's overall safety and soundness. In summary, the capital measures used by the federal banking regulators are:
- •
- Total Risk-Based Capital ratio, which is the total of Tier 1 Risk-Based Capital (which includes common shareholders' equity, trust preferred securities, minority interests and qualifying preferred stock, less goodwill and other adjustments) and Tier 2 Capital (which includes preferred stock not qualifying as Tier 1 capital, mandatory convertible debt, limited amounts of subordinated debt, other qualifying term debt and the allowance for loan losses up to 1.25 percent of risk-weighted assets and other adjustments) as a percentage of total risk-weighted assets
- •
- Tier 1 Risk-Based Capital ratio (Tier 1 capital divided by total risk-weighted assets), and
- •
- the Leverage ratio (Tier 1 capital divided by adjusted average total assets)
Under these regulations, a bank will be:
- •
- "well capitalized" if it has a Total Risk-Based Capital ratio of 10% or greater, a Tier 1 Risk-Based Capital ratio of 6% or greater, a Leverage ratio of 5% or greater, and is not subject to any written agreement, order, capital directive, or prompt corrective action directive by a federal bank regulatory agency to meet and maintain a specific capital level for any capital measure
15
- •
- "adequately capitalized" if it has a Total Risk-Based Capital ratio of 8% or greater, a Tier 1 Risk-Based Capital ratio of 4% or greater, and a Leverage ratio of 4% or greater (or 3% in certain circumstances) and is not well capitalized
- •
- "undercapitalized" if it has a Total Risk-Based Capital ratio of less than 8%, a Tier 1 Risk-Based Capital ratio of less than 4% (or 3% in certain circumstances), or a Leverage ratio of less than 4% (or 3% in certain circumstances)
- •
- "significantly undercapitalized" if it has a Total Risk-Based Capital ratio of less than 6%, a Tier 1 Risk-Based Capital ratio of less than 3%, or a Leverage ratio of less than 3%, or
- •
- "critically undercapitalized" if its tangible equity is equal to or less than 2% of tangible assets.
The risk-based capital standards of each of the FDIC and the Federal Reserve Board explicitly identify concentrations of credit risk and the risk arising from non-traditional activities, as well as an institution's ability to manage these risks, as important factors to be taken into account by the agency in assessing an institution's overall capital adequacy. The capital guidelines also provide that an institution's exposure to a decline in the economic value of its capital due to changes in interest rates be considered by the agency as a factor in evaluating a banking organization's capital adequacy.
The FDIC may take various corrective actions against any undercapitalized bank and any bank that fails to submit an acceptable capital restoration plan or fails to implement a plan acceptable to the FDIC. These powers include, but are not limited to, requiring the institution to be recapitalized, prohibiting asset growth, restricting interest rates paid, requiring prior approval of capital distributions by any financial holding company that controls the institution, requiring divestiture by the institution of its subsidiaries or by the holding company of the institution itself, requiring new election of directors, and requiring the dismissal of directors and officers. We are considered "well-capitalized" at December 31, 2007 and, in addition, our bank subsidiary maintains sufficient capital to remain in compliance with capital requirements and is considered "well-capitalized" at December 31, 2007.
Other Safety and Soundness Regulations
There are significant obligations and restrictions imposed on financial holding companies and their depository institution subsidiaries by federal law and regulatory policy that are designed to reduce potential loss exposure to the depositors of such depository institutions and to the FDIC insurance fund in the event that the depository institution is insolvent or is in danger of becoming insolvent. These obligations and restrictions are not for the benefit of investors. Regulators may pursue an administrative action against any financial holding company or bank which violates the law, engages in an unsafe or unsound banking practice, or which is about to engage in an unsafe or unsound banking practice. The administrative action could take the form of a cease and desist proceeding, a removal action against the responsible individuals or, in the case of a violation of law or unsafe and unsound banking practice, a civil monetary penalty action. A cease and desist order, in addition to prohibiting certain action, could also require that certain actions be undertaken. Under the policies of the Federal Reserve Board, we are required to serve as a source of financial strength to our subsidiary depository institution and to commit resources to support the Bank in circumstances where we might not do so otherwise.
The Bank Secrecy Act
Under the Bank Secrecy Act ("BSA"), a financial institution is required to have systems in place to detect certain transactions, based on the size and nature of the transaction. Financial institutions are generally required to report cash transactions involving more than $10,000 to the United States Treasury. In addition, financial institutions are required to file Suspicious Activity Reports for
16
transactions that involve more than $5,000 and which the financial institution knows, suspects or has reason to suspect, involves illegal funds, is designed to evade the requirements of the BSA or has no lawful purpose. The USA PATRIOT Act of 2001, enacted in response to the September 11, 2001 terrorist attacks, requires bank regulators to consider a financial institution's compliance with the BSA when reviewing applications from a financial institution. As part of its BSA program, the USA PATRIOT Act of 2001 also requires a financial institution to follow recently implemented customer identification procedures when opening accounts for new customers and to review U.S. government-maintained lists of individuals and entities that are prohibited from opening accounts at financial institutions.
Monetary Policy
The commercial banking business is affected not only by general economic conditions but also by the monetary policies of the Federal Reserve Board. The instruments of monetary policy employed by the Federal Reserve Board include open market operations in United States government securities, changes in the discount rate on member bank borrowings and changes in reserve requirements against deposits held by federally insured banks. The Federal Reserve Board's monetary policies have had a significant effect on the operating results of commercial banks in the past and are expected to continue to do so in the future. In view of changing conditions in the national and international economy and in the money markets, as well as the effect of actions by monetary and fiscal authorities, including the Federal Reserve System, no prediction can be made as to possible future changes in interest rates, deposit levels, loan demand or the business and earnings of our bank subsidiary, its subsidiary, or any of our other subsidiaries.
Federal Reserve System
In 1980, Congress enacted legislation that imposed reserve requirements on all depository institutions that maintain transaction accounts or non-personal time deposits. NOW accounts and demand deposit accounts that permit payments or transfers to third parties fall within the definition of transaction accounts and are subject to these reserve requirements. For net transaction accounts in 2008, the first $9.3 million of balances will be exempt from reserve requirements. A 3% reserve ratio will be assessed on net transaction account balances over $9.3 million to and including $43.9 million. A 10% reserve ratio will be applied to amounts in net transaction account balances in excess of $43.9 million. These percentages are subject to adjustment by the Federal Reserve Board. Because required reserves must be maintained in the form of vault cash or in a non-interest- bearing account at, or on behalf of, a Federal Reserve Bank, the effect of the reserve requirement is to reduce the amount of our interest-earning assets.
Transactions with Affiliates
Transactions between banks and their affiliates are governed by Sections 23A and 23B of the Federal Reserve Act. An affiliate of a bank is any bank or entity that controls, is controlled by or is under common control with such bank. Generally, Sections 23A and 23B (i) limit the extent to which the bank or its subsidiaries may engage in "covered transactions" with any one affiliate to an amount equal to 10% of such institution's capital stock and surplus, and maintain an aggregate limit on all such transactions with affiliates to an amount equal to 20% of such capital stock and surplus, and (ii) require that all such transactions be on terms substantially the same as, or at least as favorable to those that, the bank has provided to a non-affiliate. The term "covered transaction" includes the making of loans, purchase of assets, issuance of a guarantee and similar other types of transactions. Section 23B applies to "covered transactions" as well as sales of assets and payments of money to an affiliate. These transactions must also be conducted on terms substantially the same as, or at least favorable to those that, the bank has provided to non-affiliates.
17
Loans to Insiders
The Federal Reserve Act and related regulations impose specific restrictions on loans to directors, executive officers and principal shareholders of banks. Under Section 22(h) of the Federal Reserve Act, loans to a director, an executive officer and to a principal shareholder of a bank, and to entities controlled by any of the foregoing, may not exceed, together with all other outstanding loans to such person and entities controlled by such person, the bank's loan-to-one borrower limit. Loans in the aggregate to insiders and their related interests as a class may not exceed two times the bank's unimpaired capital and unimpaired surplus until the bank's total assets equal or exceed $100,000,000, at which time the aggregate is limited to the bank's unimpaired capital and unimpaired surplus. Section 22(h) also prohibits loans above amounts prescribed by the appropriate federal banking agency to directors, executive officers and principal shareholders of a bank or bank holding company, and to entities controlled by such persons, unless such loan is approved in advance by a majority of the board of directors of the bank with any "interested" director not participating in the voting. The FDIC has prescribed the loan amount, which includes all other outstanding loans to such person, as to which such prior board of director approval is required, as being the greater of $25,000 or 5% of capital and surplus (up to $500,000). Section 22(h) requires that loans to directors, executive officers and principal shareholders be made on terms and underwriting standards substantially the same as offered in comparable transactions to other persons.
Community Reinvestment Act
Under the Community Reinvestment Act and related regulations, depository institutions have an affirmative obligation to assist in meeting the credit needs of their market areas, including low and moderate-income areas, consistent with safe and sound banking practice. The Community Reinvestment Act requires the adoption by each institution of a Community Reinvestment Act statement for each of its market areas describing the depository institution's efforts to assist in its community's credit needs. Depository institutions are periodically examined for compliance with the Community Reinvestment Act and are periodically assigned ratings in this regard. Banking regulators consider a depository institution's Community Reinvestment Act rating when reviewing applications to establish new branches, undertake new lines of business, and/or acquire part or all of another depository institution. An unsatisfactory rating can significantly delay or even prohibit regulatory approval of a proposed transaction by a financial holding company or its depository institution subsidiaries.
The Gramm-Leach-Bliley Act and federal bank regulators have made various changes to the Community Reinvestment Act. Among other changes, Community Reinvestment Act agreements with private parties must be disclosed and annual reports must be made to a bank's primary federal regulator. A financial holding company or any of its subsidiaries will not be permitted to engage in new activities authorized under the GLBA if any bank subsidiary received less than a "satisfactory" rating in its latest Community Reinvestment Act examination.
Consumer Laws Regarding Fair Lending
In addition to the Community Reinvestment Act described above, other federal and state laws regulate various lending and consumer aspects of our business. Governmental agencies, including the Department of Housing and Urban Development, the Federal Trade Commission and the Department of Justice, have become concerned that prospective borrowers may experience discrimination in their efforts to obtain loans from depository and other lending institutions. These agencies have brought litigation against depository institutions alleging discrimination against borrowers. Many of these suits have been settled, in some cases for material sums of money, short of a full trial.
These governmental agencies have clarified what they consider to be lending discrimination and have specified various factors that they will use to determine the existence of lending discrimination
18
under the Equal Credit Opportunity Act and the Fair Housing Act, including evidence that a lender discriminated on a prohibited basis, evidence that a lender treated applicants differently based on prohibited factors in the absence of evidence that the treatment was the result of prejudice or a conscious intention to discriminate, and evidence that a lender applied an otherwise neutral non-discriminatory policy uniformly to all applicants, but the practice had a discriminatory effect, unless the practice could be justified as a business necessity.
Banks and other depository institutions also are subject to numerous consumer-oriented laws and regulations. These laws, which include the Truth in Lending Act, the Truth in Savings Act, the Real Estate Settlement Procedures Act, the Electronic Funds Transfer Act, the Equal Credit Opportunity Act, and the Fair Housing Act, require compliance by depository institutions with various disclosure requirements and requirements regulating the availability of funds after deposit or the making of some loans to customers.
Gramm-Leach-Bliley Act of 1999
The Gramm-Leach-Bliley Act of 1999 covers a broad range of issues, including a repeal of most of the restrictions on affiliations among depository institutions, securities firms and insurance companies. The following description summarizes some of its significant provisions.
The GLBA repeals sections 20 and 32 of the Glass-Steagall Act, thus permitting unrestricted affiliations between banks and securities firms. It also permits bank holding companies to elect to become financial holding companies. A financial holding company may engage in or acquire companies that engage in a broad range of financial services, including securities activities such as underwriting, dealing, investment, merchant banking, insurance underwriting, sales and brokerage activities. In order to become a financial holding company, the bank holding company and all of its affiliated depository institutions must be well-capitalized, well-managed and have at least a satisfactory Community Reinvestment Act rating. We became a financial holding company in 2004.
The GLBA provides that the states continue to have the authority to regulate insurance activities, but prohibits the states in most instances from preventing or significantly interfering with the ability of a bank, directly or through an affiliate, to engage in insurance sales, solicitations or cross-marketing activities. Although the states generally must regulate bank insurance activities in a nondiscriminatory manner, the states may continue to adopt and enforce rules that specifically regulate bank insurance activities in areas identified under the law. Under the law, the federal bank regulatory agencies adopted insurance consumer protection regulations that apply to sales practices, solicitations, advertising and disclosures.
The GLBA adopts a system of functional regulation under which the Federal Reserve Board is designated as the umbrella regulator for financial holding companies, but financial holding company affiliates are principally regulated by functional regulators such as the FDIC for bank affiliates, the Securities and Exchange Commission for securities affiliates, and state insurance regulators for insurance affiliates. It repeals the broad exemption of banks from the definitions of "broker" and "dealer" for purposes of the Securities Exchange Act of 1934, as amended. It also identifies a set of specific activities, including traditional bank trust and fiduciary activities, in which a bank may engage without being deemed a "broker," and a set of activities in which a bank may engage without being deemed a "dealer." Additionally, GLBA makes conforming changes in the definitions of "broker" and "dealer" for purposes of the Investment Company Act of 1940, as amended, and the Investment Advisers Act of 1940, as amended.
The GLBA contains extensive customer privacy protection provisions. Under these provisions, a financial institution must provide to its customers, both at the inception of the customer relationship and on an annual basis, the institution's policies and procedures regarding the handling of customers' nonpublic personal financial information. The law provides that, except for specific limited exceptions,
19
an institution may not provide such personal information to unaffiliated third parties unless the institution discloses to the customer that such information may be so provided and the customer is given the opportunity to opt out of such disclosure. An institution may not disclose to a non-affiliated third party, other than to a consumer credit reporting agency, customer account numbers or other similar account identifiers for marketing purposes. The GLBA also provides that the states may adopt customer privacy protections that are stricter than those contained in the act.
Future Regulatory Uncertainty
Because federal and state regulation of financial institutions changes regularly and is the subject of constant legislative debate, we cannot forecast how federal and state regulation of financial institutions may change in the future and, as a result, impact our operations. Although Congress and the state legislature in recent years have sought to reduce the regulatory burden on financial institutions with respect to the approval of specific transactions, we fully expect that the financial institution industry will remain heavily regulated in the near future and that additional laws or regulations may be adopted further regulating specific banking practices.
Additional Information
We file with or furnish to the Securities and Exchange Commission ("SEC") annual, quarterly and current reports, proxy statements, and various other documents under the Securities Exchange Act of 1934, as amended (the "Exchange Act"). The public may read and copy any materials that we file with or furnish to the SEC at the SEC's Public Reference Room, which is located at 100 F Street, NE, Washington, D.C. 20549. The public may obtain information on the operation of the Public Reference Room by calling the SEC at 1-800-SEC-0330. Also, the SEC maintains an internet website atwww.sec.gov that contains reports, proxy and information statements and other information regarding registrants, including us, that file or furnish documents electronically with the SEC.
We also make available free of charge on or through our internet website (www.cardinalbank.com) our annual report on Form 10-K, quarterly reports on Form 10-Q, current reports on Form 8-K and, if applicable, amendments to those reports as filed or furnished pursuant to Section 13(a) of the Exchange Act as soon as reasonably practicable after we electronically file such materials with, or furnish them to, the SEC.
20
Item 1A. Risk Factors
Our operations are subject to many risks that could adversely affect our future financial condition and performance and, therefore, the market value of our Common Stock. The risk factors applicable to us are the following:
Our mortgage banking revenue is sensitive to changes in economic conditions, decreased economic activity, a slowdown in the housing market or higher interest rates and may adversely impact our profits.
Our mortgage banking segment is a significant portion of our consolidated business and maintaining our revenue stream in this segment is dependent upon our ability to originate loans and sell them to investors. Loan production levels are sensitive to changes in economic conditions and recently have suffered from a slowdown in the local housing market and tightening credit conditions. Any sustained period of decreased activity caused by further housing price pressure, loan underwriting restrictions or higher interest rates would adversely affect our mortgage originations and, consequently, reduce our income from mortgage banking activities. As a result, these conditions would also adversely affect our net income.
Deteriorating economic conditions may also cause home buyers to default on their mortgages. In certain of these cases where we have originated loans and sold them to investors, we may be required to repurchase loans or provide a financial settlement to investors if it is proven that the borrower failed to provide full and accurate information on or related to their loan application or for which appraisals have not been acceptable. Such repurchases or settlements would also adversely affect our net income.
George Mason, as part of the service it provides to its managed companies, purchases the loans managed companies originate at the time of origination. These loans are then sold by George Mason to investors. George Mason has agreements with its managed companies requiring that, for any loans that were originated by a managed company and for which investors have requested George Mason to repurchase due to the borrowers failure to provide full and accurate information on or related to their loan application or for which appraisals have not been acceptable, the managed company be responsible for buying back the loan. In the event that the managed company's financial condition deteriorates and it is unable to fund the repurchase of such loans, George Mason may have to provide the funds to repurchase these loans from investors.
We have goodwill and other intangibles that may become impaired, and thus result in a charge against earnings.
At December 31, 2007, we had $12.9 million and $2.7 million of goodwill related to the George Mason and Wilson/Bennett acquisitions, respectively. In addition, we have identified and recorded other intangible assets, such as customer relationships and trade names, as of the acquisition dates of both George Mason and Wilson/Bennett. The carrying amount of these intangibles at December 31, 2007 was $1.1 million at George Mason and $179,000 at Wilson/Bennett. Goodwill and other intangibles are tested for impairment on an annual basis or when facts and circumstances indicate that impairment may have occurred.
As noted above, our mortgage banking segment is sensitive to changes in economic conditions, decreased economic activity, a slowdown in the housing market and higher interest rates. In addition to directly impacting our revenues and net income, these conditions, if sustained, may result in an impairment charge related to the goodwill and other intangibles at George Mason if we determine the carrying value of the goodwill and other intangible assets is greater than their fair value.
At Wilson/Bennett, we recorded an impairment loss totaling $2.9 million pretax, and $1.9 million after tax, during the quarter ended September 30, 2006. This was due to the loss of several significant clients as a result of the unexpected retirement of John W. Fisher, Wilson/Bennett's founder, Chief
21
Executive Officer and President. After that announcement, these clients terminated their asset management contracts, triggering the impairment evaluation.
In 2007, we performed the required annual test for impairment of goodwill, and our analysis showed the current carrying value of goodwill to be less than the fair value. However, we cannot fully predict future balances of assets under management, and future declines in assets managed by Wilson/Bennett as a result of additional losses in its client base or the lack of success in attracting and maintaining new clients could again result in an impairment condition and adversely impact earnings in future periods.
We may be adversely affected by economic conditions in our market area.
We are headquartered in Northern Virginia, and our market is the greater Washington, D.C. metropolitan area. Because our lending and deposit-gathering activities are concentrated in this market, we will be affected by the general economic conditions in the greater Washington area, which may, among other factors, be impacted by the level of federal government spending. Changes in the economy, and government spending in particular, may influence the growth rate of our loans and deposits, the quality of the loan portfolio and loan and deposit pricing. A significant decline in general economic condition caused by inflation, recession, unemployment or other factors, would impact these local economic conditions and the demand for banking products and services generally, and could negatively affect our financial condition and performance.
We may not be able to successfully manage our growth or implement our growth strategies, which may adversely affect our results of operations and financial condition.
During the last five years, we have experienced significant growth, and a key aspect of our business strategy is our continued growth and expansion. Our ability to continue to grow depends, in part, upon our ability to:
- •
- open new branch offices or acquire existing branches or other financial institutions;
- •
- attract deposits to those locations and cross-sell new and existing depositors additional products and services; and
- •
- identify attractive loan and investment opportunities.
We may not be able to successfully implement our growth strategy if we are unable to identify attractive markets, locations or opportunities to expand. Our ability to successfully manage our growth will also depend upon our ability to maintain capital levels sufficient to support this growth, maintain effective cost controls and adequate asset quality such that earnings are not adversely impacted to a material degree.
As we continue to implement our growth strategy by opening new branches or acquiring branches or other banks, we expect to incur increased personnel, occupancy and other operating expenses. In the case of new branches, we must absorb those higher expenses while we begin to generate new deposits, and there is a further time lag involved in redeploying new deposits into attractively priced loans and other higher yielding earning assets. Thus, our plans to branch aggressively could depress our earnings in the short run, even if we efficiently execute our branching strategy.
We rely heavily on our management team and the unexpected loss of any of those personnel could adversely affect our operations; we depend on our ability to attract and retain key personnel.
We are a customer-focused and relationship-driven organization. We expect our future growth to be driven in a large part by the relationships maintained with our customers by our Chairman and Chief Executive Officer, Bernard H. Clineburg, and our other executive and senior lending officers. We
22
have entered into employment agreements with Mr. Clineburg and six other executive officers. The existence of such agreements, however, does not necessarily assure us that we will be able to continue to retain their services. The unexpected loss of Mr. Clineburg or other key employees could have a significant adverse effect on our business and possibly result in reduced revenues and earnings. We maintain bank owned life insurance policies on all of our corporate executives.
The implementation of our business strategy will also require us to continue to attract, hire, motivate and retain skilled personnel to develop new customer relationships, as well as develop new financial products and services. Many experienced banking professionals employed by our competitors are covered by agreements not to compete or solicit their existing customers if they were to leave their current employment. These agreements make the recruitment of these professionals more difficult. While we have been recently successful in acquiring what we consider to be talented banking professionals, the market for talented people is competitive and we may not continue to be successful in attracting, hiring, motivating or retaining experienced banking professionals.
We may incur losses if we are unable to successfully manage interest rate risk.
Our future profitability will substantially depend upon our ability to maintain or increase the spread between the interest rates earned on investments and loans and interest rates paid on deposits and other interest-bearing liabilities. Changes in interest rates will affect our operating performance and financial condition. The shape of the yield curve can also impact net interest income. Changing rates will impact how fast our mortgage loans and mortgage backed securities will have the principal repaid. Rate changes can also impact the behavior of our depositors, especially depositors in non-maturity deposits such as demand, interest checking, savings and money market accounts. While we attempt to minimize our exposure to interest rate risk, we are unable to eliminate it as it is an inherent part of our business. Our net interest spread will depend on many factors that are partly or entirely outside our control, including competition, federal economic, monetary and fiscal policies, and industry-specific conditions and economic conditions generally.
We may be adversely impacted by changes in the condition of financial markets.
We are directly and indirectly affected by changes in market conditions. Market risk generally represents the risk that values of assets and liabilities or revenues will be adversely affected by changes in market conditions. Market risk is inherent in the financial instruments associated with our operations and activities including loans, deposits, securities, short-term borrowings, long-term debt, trading account assets and liabilities, and derivatives. Just a few of the market conditions that may shift from time to time, thereby exposing us to market risk, include fluctuations in interest and currency exchange rates, equity and futures prices, and price deterioration or changes in value due to changes in market perception or actual credit quality of issuers. Accordingly, depending on the instruments or activities impacted, market risks can have adverse effects on our results from operations and our overall financial condition.
Recently, the subprime mortgage market dislocation has also impacted the ratings of certain monoline insurance providers which, in turn, has affected the pricing of certain municipal securities and the liquidity of the short term public finance markets. We have some exposure to monolines and, as a result, are continuing to monitor this exposure as the markets evolve.
Our concentration in loans secured by real estate may increase our future credit losses, which would negatively affect our financial results.
We offer a variety of secured loans, including commercial lines of credit, commercial term loans, real estate, construction, home equity, consumer and other loans. Approximately 86% of our loans are secured by real estate, both residential and commercial, substantially all of which are located in our
23
market area. A major change in the region's real estate market, resulting in a deterioration in real estate values, or in the local or national economy, including changes caused by raising interest rates, could adversely affect our customers' ability to pay these loans, which in turn could adversely impact us. Risk of loan defaults and foreclosures are inherent in the banking industry, and we try to limit our exposure to this risk by carefully underwriting and monitoring our extensions of credit. We cannot fully eliminate credit risk, and as a result credit losses may occur in the future.
If our allowance for loan losses becomes inadequate, our results of operations may be adversely affected.
We maintain an allowance for loan losses that we believe is a reasonable estimate of known and inherent losses in our loan portfolio. Through a periodic review and analysis of the loan portfolio, management determines the adequacy of the allowance for loan losses by considering such factors as general and industry-specific market conditions, credit quality of the loan portfolio, the collateral supporting the loans and financial performance of our loan customers relative to their financial obligations to us. The amount of future losses is impacted by changes in economic, operating and other conditions, including changes in interest rates, which may be beyond our control. Actual losses may exceed our current estimates. Rapidly growing loan portfolios are, by their nature, unseasoned. Estimating loan loss allowances for an unseasoned portfolio is more difficult than with seasoned portfolios, and may be more susceptible to changes in estimates and to losses exceeding estimates. Although we believe the allowance for loan losses is a reasonable estimate of known and inherent losses in our loan portfolio, we cannot fully predict such losses or assert that our loan loss allowance will be adequate in the future. Future loan losses that are greater than current estimates could have a material impact on our future financial performance.
Banking regulators periodically review our allowance for loan losses and may require us to increase our allowance for loan losses or recognize additional loan charge-offs, based on credit judgments different than those of our management. Any increase in the amount of our allowance or loans charged-off as required by these regulatory agencies could have a negative effect on our operating results.
Our future success is dependent on our ability to compete effectively in the highly competitive banking and financial services industry.
We face vigorous competition from other commercial banks, savings and loan associations, savings banks, credit unions, mortgage banking firms, consumer finance companies, securities brokerage firms, insurance companies, money market funds and other types of financial institutions for deposits, loans and other financial services in our market area. A number of these banks and other financial institutions are significantly larger than we are and have substantially greater access to capital and other resources, as well as larger lending limits and branch systems, and offer a wider array of banking services. Many of our nonbank competitors are not subject to the same extensive regulations that govern us. As a result, these nonbank competitors have advantages over us in providing certain services. This competition may reduce or limit our margins and our market share and may adversely affect our results of operations and financial condition.
Our businesses and earnings are impacted by governmental, fiscal and monetary policy.
We are affected by domestic monetary policy. For example, the Federal Reserve Board regulates the supply of money and credit in the United States and its policies determine in large part our cost of funds for lending, investing and capital raising activities and the return we earn on those loans and investments, both of which affect our net interest margin. The actions of the Federal Reserve Board also can materially affect the value of financial instruments we hold, such as loans and debt securities, and its policies also can affect our borrowers, potentially increasing the risk that they may fail to repay their loans. Our businesses and earnings also are affected by the fiscal or other policies that are adopted by various regulatory authorities of the United States. Changes in fiscal or monetary policy are beyond our control and hard to predict.
24
Our profitability and the value of any equity investment in us may suffer because of rapid and unpredictable changes in the highly regulated environment in which we operate.
We are subject to extensive supervision by several governmental regulatory agencies at the federal and state levels. Recently enacted, proposed and future banking and other legislation and regulations have had, and will continue to have, or may have a significant impact on the financial services industry. These regulations, which are generally intended to protect depositors and not our shareholders, and the interpretation and application of them by federal and state regulators, are beyond our control, may change rapidly and unpredictably, and can be expected to influence our earnings and growth. Our success depends on our continued ability to maintain compliance with these regulations. Many of these regulations increase our costs and thus place other financial institutions that may not be subject to similar regulation in stronger, more favorable competitive positions.
If we need additional capital in the future to continue our growth, we may not be able to obtain it on terms that are favorable. This could negatively affect our performance and the value of our common stock.
Our business strategy calls for continued growth. We anticipate that we will be able to support this growth through the generation of additional deposits at existing and new branch locations, as well as expanded loan and other investment opportunities. However, we may need to raise additional capital in the future to support our continued growth and to maintain desired capital levels. Our ability to raise capital through the sale of additional equity securities or the placement of financial instruments that qualify as regulatory capital will depend primarily upon our financial condition and the condition of financial markets at that time. We may not be able to obtain additional capital in the amounts or on terms satisfactory to us. Our growth may be constrained if we are unable to raise additional capital as needed.
We have extended off-balance sheet commitments to borrowers which could expose us to credit and interest rate risk.
We enter into certain off-balance sheet arrangements in the normal course of business to meet the financing needs of our customers. These off-balance sheet arrangements include commitments to extend credit, standby letters of credit and guarantees which would impact our liquidity and capital resources to the extent customers accept or use these commitments. These instruments involve, to varying degrees, elements of credit and interest rate risk in excess of the amount recognized in the balance sheet. Our exposure to credit loss in the event of nonperformance by the other party to the financial instrument for commitments to extend credit and standby letters of credit and guarantees written is represented by the contractual or notional amount of those instruments. We use the same credit policies in making commitments and conditional obligations as we do for on-balance-sheet instruments.
We have operational risk that could impact our ability to provide services to our customers.
We have operational risk exposure throughout our organization. Integral to our performance is the continued effectiveness and efficiency of our information technology, operational infrastructure, relationships with third parties and key individuals involved in our ongoing activities. Failure by any or all of these resources subjects us to risks that may vary in size, scale and scope. This includes but is not limited to operational or technical failures, unlawful tampering with our information technology infrastructure, terrorist activities, ineffectiveness or exposure due to interruption in third party support, as well as the loss of key individuals or failure on the part of the key individuals to perform properly.
25
We may be parties to certain legal proceedings that may impact our earnings.
We face significant legal risks in our businesses, and the volume of claims and amount of damages and penalties claimed in litigation and regulatory proceedings against financial institutions remain high. Substantial legal liability or significant regulatory action against us could have material adverse financial impact or cause significant reputational risk to us, which in turn could seriously harm our business prospects.
Item 1B. Unresolved Staff Comments
None.
Item 2. Properties
Cardinal Bank, excluding its George Mason subsidiary, conducts its business from 25 branch offices. Nine of these facilities are owned and 16 are leased. Leased branch banking facilities range in size from 457 square feet to 11,182 square feet. Our leases on these facilities expire at various dates through 2016, and all but one of our leases have renewal options. The branch that does not have a renewal option is located at the headquarters location of George Mason (see below for additional lease information for George Mason). Fifteen of our branch banking locations have drive-up banking capabilities and all have ATMs.
Cardinal Wealth Services, Inc. conducts its business from two of Cardinal Bank's branch facilities.
George Mason conducts its business from seven leased facilities which range in size from 1,476 square feet to 31,520 square feet. The leases have various expiration dates through 2011 and only three of their seven locations have renewal options.
Wilson/Bennett conducts its business from office space located in our Tysons Corner, Virginia headquarters facility.
Our headquarters facility in Tysons Corner, Virginia comprises 41,818 square feet of leased office space. This lease expires in January 2010. In addition to housing various administrative functions—including accounting, data processing, compliance, treasury, marketing, deposit and loan operations—our commercial and industrial and commercial real estate lending functions and various other departments are located there.
We believe that all of our properties are maintained in good operating condition and are suitable and adequate for our operational needs.
Item 3. Legal Proceedings
In the ordinary course of our operations, we become party to various legal proceedings.
On August 9, 2007, we filed a complaint against defendants Philip A. Seifert and Liberty Growth Fund, LP in the Circuit Court of Fairfax County, Virginia. The complaint set forth several causes of action including actual fraud and claims associated with the stopped payment check and dishonored check tendered to us as a result of our serving as escrow agent for the equity financing transaction between Liberty Growth Fund, LP and AIMS Worldwide, Inc on July 25, 2007. As a result of Mr. Seifert's death on November 18, 2007, we have terminated the legal proceedings against him and Liberty Growth Fund, LP.
On February 28, 2008, OneBeacon Midwest Company ("OneBeacon") filed a complaint for declaratory judgment in the U.S. District Court for the Eastern District of Virginia. OneBeacon provides insurance coverage for us and we have filed an insurance claim and proof of loss to recover the $3.5 million attributable to the above referenced loss on the escrow arrangement between Liberty Growth Fund LP and AIMS Worldwide, Inc. OneBeacon is seeking a determination of their rights and obligations under a Financial Institution Bond issued by OneBeacon to us with respect to this claim and proof of loss. Through this action, OneBeacon seeks a court declaration that the Financial Institution Bond does not provide coverage for our claim.
Item 4. Submission of Matters to a Vote of Security Holders
No matters were submitted to a vote of security holders, through the solicitation of proxies or otherwise, during the fourth quarter of 2007.
26
PART II
Item 5. Market for Registrant's Common Equity, Related Stockholder Matters and Issuer Purchases of Equity Securities
Market Price for Common Stock and Dividends. Our common stock is currently listed for quotation on the Nasdaq Global Select Market under the symbol "CFNL." Our common stock had traded on the Nasdaq National Market under the same symbol until July 3, 2006. As of March 3, 2008, our common stock was held by 631 shareholders of record. In addition, we estimate that there were 6,375 beneficial owners of our common stock who own their shares through brokers or banks.
The high and low sale prices per share for our common stock for each quarter of 2007 and 2006 as reported on the market at the time and dividends declared during those periods were as follows:
Periods Ended
| | High
| | Low
| | Dividends
|
|---|
| 2007 | | | | | | | | | |
| | First Quarter | | $ | 10.82 | | $ | 9.62 | | $ | 0.01 |
| | Second Quarter | | | 10.07 | | | 9.40 | | | 0.01 |
| | Third Quarter | | | 10.20 | | | 8.50 | | | 0.01 |
| | Fourth Quarter | | | 10.49 | | | 8.56 | | | 0.01 |
| 2006 | | | | | | | | | |
| | First Quarter | | $ | 13.54 | | $ | 10.62 | | $ | 0.01 |
| | Second Quarter | | | 13.68 | | | 10.63 | | | 0.01 |
| | Third Quarter | | | 12.01 | | | 10.21 | | | 0.01 |
| | Fourth Quarter | | | 11.17 | | | 9.71 | | | 0.01 |
Dividend Policy. The board of directors intends to follow a policy of retaining any earnings necessary to operate our business in accordance with all regulatory policies while maximizing the long-term return for the Company's investors. Our future dividend policy is subject to the discretion of the board of directors and future dividend payments will depend upon a number of factors, including future earnings, alternative investment opportunities, financial condition, cash requirements, and general business conditions.
Our ability to distribute cash dividends will depend primarily on the ability of our subsidiaries to pay dividends to us. Cardinal Bank is subject to legal limitations on the amount of dividends it is permitted to pay. Furthermore, neither Cardinal Bank nor we may declare or pay a cash dividend on any of our capital stock if we are insolvent or if the payment of the dividend would render us insolvent or unable to pay our obligations as they become due in the ordinary course of business. For additional information on these limitations, see "Government Regulation and Supervision—Payment of Dividends" in Item 1 above.
Repurchases. On February 26, 2007, we publicly announced that the Board of Directors had adopted a program to repurchase up to 1,000,000 shares of our common stock. The timing and amount of repurchases, if any, will depend on market conditions, share price, trading volume, and other factors, and there is no assurance that we will purchase shares during any period. No termination date was set for the buyback program. Shares may be repurchased in the open market or through privately negotiated transactions.
27
As of December 31, 2007, we had purchased 278,140 shares of our common stock at a total cost of $2.7 million. All of these shares have been cancelled and retired.
Period
| | (a) Total
Number of
Shares
Purchased
| | (b) Average
Price Paid per
Share ($)
| | (c) Total
Number of
Shares
Purchased as
Part of Publicly
Announced
Program
| | (d) Maximum
Number of
Shares that May
Yet Be
Purchased
Under the
Program
|
|---|
| October 1—October 31, 2007 | | — | | — | | — | | 776,260 |
| November 1—November 30, 2007 | | 54,400 | | 9.83 | | 54,400 | | 721,860 |
| December 1—December 31, 2007 | | — | | — | | — | | 721,860 |
| | |
| |
| |
| |
|
| | Total | | 54,400 | | 9.83 | | 54,400 | | 721,860 |
| | |
| |
| |
| |
|
Stock Performance Graph. The graph set forth below shows the cumulative shareholder return on the Company's Common Stock during the five-year period ended December 31, 2007, as compared with: (i) an overall stock market index, the NASDAQ Composite; and (ii) a published industry index, the SNL Bank Index. The stock performance graph assumes that $100 was invested on December 31, 2002 in our common stock and each of the comparable indices and that dividends were reinvested.
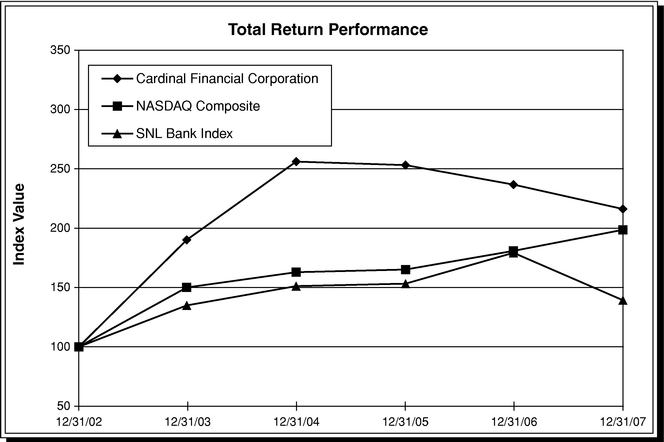
| | Period Ending
|
|---|
Index
|
|---|
| | 12/31/02
| | 12/31/03
| | 12/31/04
| | 12/31/05
| | 12/31/06
| | 12/31/07
|
|---|
| Cardinal Financial Corporation | | 100.00 | | 190.11 | | 256.09 | | 253.13 | | 236.71 | | 216.13 |
| NASDAQ Composite | | 100.00 | | 150.01 | | 162.89 | | 165.13 | | 180.85 | | 198.60 |
| SNL Bank Index | | 100.00 | | 134.90 | | 151.17 | | 153.23 | | 179.24 | | 139.28 |
28
Item 6. Selected Financial Data
Selected Financial Data
(In thousands, except per share data)
| | Years Ended December 31,
| |
|---|
| | 2007
| | 2006
| | 2005
| | 2004
| | 2003
| |
|---|
| Income Statement Data: | | | | | | | | | | | | | | | | |
| | Interest income | | $ | 98,643 | | $ | 87,401 | | $ | 67,374 | | $ | 40,522 | | $ | 24,602 | |
| | Interest expense | | | 58,324 | | | 46,047 | | | 29,891 | | | 15,969 | | | 9,429 | |
| | |
| |
| |
| |
| |
| |
| | Net interest income | | | 40,319 | | | 41,354 | | | 37,483 | | | 24,553 | | | 15,173 | |
| | Provision for loan losses | | | 2,548 | | | 1,232 | | | 2,456 | | | 1,626 | | | 1,001 | |
| | |
| |
| |
| |
| |
| |
| | Net interest income after provision for loan losses | | | 37,771 | | | 40,122 | | | 35,027 | | | 22,927 | | | 14,172 | |
| | Non-interest income | | | 19,480 | | | 21,684 | | | 24,669 | | | 9,409 | | | 3,829 | |
| | Non-interest expense | | | 51,884 | | | 51,245 | | | 44,653 | | | 27,154 | | | 15,355 | |
| | |
| |
| |
| |
| |
| |
| | Net income before income taxes | | | 5,367 | | | 10,561 | | | 15,043 | | | 5,182 | | | 2,646 | |
| | Provision (benefit) for income taxes | | | 885 | | | 3,173 | | | 5,167 | | | 1,713 | | | (3,508 | ) |
| | |
| |
| |
| |
| |
| |
| | Net income | | | 4,482 | | | 7,388 | | | 9,876 | | | 3,469 | | | 6,154 | |
| | Dividends to preferred shareholders | | | — | | | — | | | — | | | — | | | 495 | |
| | |
| |
| |
| |
| |
| |
| | Net income to common shareholders | | $ | 4,482 | | $ | 7,388 | | $ | 9,876 | | $ | 3,469 | | $ | 5,659 | |
| | |
| |
| |
| |
| |
| |
| Balance Sheet Data: | | | | | | | | | | | | | | | | |
| | Total assets | | $ | 1,690,031 | | $ | 1,638,429 | | $ | 1,452,287 | | $ | 1,211,576 | | $ | 636,248 | |
| | Loans receivable, net of fees | | | 1,039,684 | | | 845,449 | | | 705,644 | | | 489,896 | | | 336,002 | |
| | Allowance for loan losses | | | 11,641 | | | 9,638 | | | 8,301 | | | 5,878 | | | 4,344 | |
| | Loans held for sale | | | 170,487 | | | 338,731 | | | 361,668 | | | 365,454 | | | — | |
| | Total investment securities | | | 364,946 | | | 329,296 | | | 294,224 | | | 289,507 | | | 273,614 | |
| | Total deposits | | | 1,096,925 | | | 1,218,882 | | | 1,069,872 | | | 824,210 | | | 474,129 | |
| | Other borrowed funds | | | 400,060 | | | 194,631 | | | 155,421 | | | 201,085 | | | 74,457 | |
| | Total shareholders' equity | | | 159,463 | | | 155,873 | | | 147,879 | | | 95,105 | | | 85,412 | |
| | Preferred shares outstanding | | | — | | | — | | | — | | | — | | | 1,364 | |
| | Common shares outstanding | | | 24,202 | | | 24,459 | | | 24,363 | | | 18,463 | | | 16,377 | |
Per Common Share Data: |
|
|
|
|
|
|
|
|
|
|
|
|
|
|
|
|
| | Basic net income | | $ | 0.18 | | $ | 0.30 | | $ | 0.45 | | $ | 0.19 | | $ | 0.55 | |
| | Fully diluted net income | | | 0.18 | | | 0.30 | | | 0.44 | | | 0.19 | | | 0.54 | |
| | Book value | | | 6.59 | | | 6.37 | | | 6.07 | | | 5.15 | | | 4.80 | |
| | Tangible book value(1) | | | 5.90 | | | 5.75 | | | 5.37 | | | 4.41 | | | 5.24 | |
Performance Ratios: |
|
|
|
|
|
|
|
|
|
|
|
|
|
|
|
|
| | Return on average assets | | | 0.27 | % | | 0.51 | % | | 0.74 | % | | 0.37 | % | | 1.18 | % |
| | Return on average equity | | | 2.85 | | | 4.87 | | | 7.67 | | | 3.69 | | | 13.84 | |
| | Dividend payout ratio | | | 0.22 | | | 0.13 | | | 0.02 | | | — | | | — | |
| | Net interest margin(2) | | | 2.63 | | | 2.98 | | | 2.92 | | | 2.72 | | | 3.00 | |
| | Efficiency ratio(3)(4) | | | 80.11 | | | 77.70 | | | 71.84 | | | 79.95 | | | 80.81 | |
| | Non-interest income to average assets | | | 1.19 | | | 1.49 | | | 1.85 | | | 1.00 | | | 0.73 | |
| | Non-interest expense to average assets | | | 3.18 | | | 3.52 | | | 3.35 | | | 2.90 | | | 2.94 | |
| | Loans receivable, net of fees to total deposits | | | 94.78 | | | 69.36 | | | 65.96 | | | 59.44 | | | 70.87 | |
Asset Quality Ratios: |
|
|
|
|
|
|
|
|
|
|
|
|
|
|
|
|
| | Net charge-offs to average loans receivable, net of fees | | | 0.06 | % | | 0.00 | % | | 0.01 | % | | 0.02 | % | | 0.01 | % |
| | Nonperforming loans to loans receivable, net of fees | | | — | | | 0.01 | | | 0.03 | | | 0.11 | | | 0.12 | |
| | Nonperforming loans to total assets | | | — | | | 0.01 | | | 0.01 | | | 0.05 | | | 0.06 | |
| | Allowance for loan losses to nonperforming loans | | | — | | | 11,822.87 | | | 3,879.00 | | | 1,074.60 | | | 1,102.54 | |
| | Allowance for loan losses to loans receivable, net of fees | | | 1.12 | | | 1.14 | | | 1.18 | | | 1.20 | | | 1.29 | |
Capital Ratios: |
|
|
|
|
|
|
|
|
|
|
|
|
|
|
|
|
| | Tier 1 risk-based capital | | | 12.10 | % | | 13.25 | % | | 14.83 | % | | 12.65 | % | | 19.66 | % |
| | Total risk-based capital | | | 12.98 | | | 14.06 | | | 15.65 | | | 13.40 | | | 20.66 | |
| | Leverage capital ratio | | | 10.26 | | | 10.68 | | | 10.71 | | | 8.83 | | | 15.45 | |
Other: |
|
|
|
|
|
|
|
|
|
|
|
|
|
|
|
|
| | Average shareholders' equity to average total assets | | | 9.65 | % | | 10.43 | % | | 9.66 | % | | 10.05 | % | | 7.84 | % |
| | Average loans receivable, net of fees to average total deposits | | | 78.87 | | | 68.42 | | | 60.34 | | | 59.97 | | | 63.02 | |
| | Average common shares outstanding: | | | | | | | | | | | | | | | | |
| | | Basic | | | 24,606 | | | 24,424 | | | 22,113 | | | 18,448 | | | 10,218 | |
| | | Diluted | | | 25,012 | | | 24,987 | | | 22,454 | | | 18,705 | | | 11,468 | |
- (1)
- Tangible book value is calculated as total shareholders' equity, excluding accumulated other comprehensive income, less goodwill and other intangible assets, divided by common shares outstanding.
- (2)
- Net interest margin is calculated as net interest income divided by total average earning assets and reported on a tax equivalent basis at a rate of 35%.
- (3)
- Efficiency ratio is calculated as total non-interest expense divided by the total of net interest income and non-interest income, excluding the loss on escrow arrangment during 2007, the impairment loss during 2006 and the litigation recovery during 2007 and 2006.
- (4)
- The calculation of the efficiency ratio, which is a financial measure not prepared in accordance with generally accepted accounting principles ('GAAP'), and a reconciliation of the efficiency ratio to our GAAP financial information are included in our Table 1 to Item 7 to this Annual Report on Form 10-K.
29
Item 7. Management's Discussion and Analysis of Financial Condition and Results of Operations
The following presents management's discussion and analysis of our consolidated financial condition at December 31, 2007 and 2006 and the results of our operations for the years ended December 31, 2007, 2006 and 2005. The discussion should be read in conjunction with the consolidated financial statements and related notes included in this report.
Caution About Forward-Looking Statements
We make certain forward-looking statements in this Form 10-K that are subject to risks and uncertainties. These forward-looking statements include statements regarding our profitability, liquidity, allowance for loan losses, interest rate sensitivity, market risk, growth strategy, and financial and other goals. The words "believes," "expects," "may," "will," "should," "projects," "contemplates," "anticipates," "forecasts," "intends," or other similar words or terms are intended to identify forward-looking statements.
These forward-looking statements are subject to significant uncertainties because they are based upon or are affected by factors including:
- •
- the ability to successfully manage our growth or implement our growth strategies if we are unable to identify attractive markets, locations or opportunities to expand in the future;
- •
- changes in interest rates and the successful management of interest rate risk;
- •
- risks inherent in making loans such as repayment risks and fluctuating collateral values;
- •
- maintaining cost controls and asset quality as we open or acquire new branches;
- •
- maintaining capital levels adequate to support our growth;
- •
- reliance on our management team, including our ability to attract and retain key personnel;
- •
- competition with other banks and financial institutions, and companies outside of the banking industry, including those companies that have substantially greater access to capital and other resources;
- •
- changes in general economic and business conditions in our market area;
- •
- risks and uncertainties related to future trust operations;
- •
- changes in operations of Wilson/Bennett Capital Management, Inc., its customer base and assets under management and any associated impact on the fair value of goodwill in the future;
- •
- demand, development and acceptance of new products and services;
- •
- problems with technology utilized by us;
- •
- changing trends in customer profiles and behavior;
- •
- changes in banking, other laws and regulations applicable to us; and
- •
- other factors discussed in "Risk Factors" in Item 1A above.
Because of these uncertainties, our actual future results may be materially different from the results indicated by these forward-looking statements. In addition, our past results of operations do not necessarily indicate our future results.
Overview
We are a locally managed financial holding company headquartered in Tysons Corner, Virginia, committed to providing superior customer service, a diversified mix of financial products and services,
30
and convenient banking to our retail and business consumers. We own Cardinal Bank (the "Bank"), a Virginia state-chartered community bank, Cardinal Wealth Services, Inc. ("CWS"), an investment services subsidiary, and Wilson/Bennett Capital Management, Inc. ("Wilson/Bennett"), an asset management firm. Through these three subsidiaries and George Mason Mortgage, LLC ("George Mason"), a mortgage banking subsidiary of the Bank, we offer a wide range of traditional banking products and services to both our commercial and retail customers. Our commercial relationship managers focus on attracting small and medium sized businesses as well as government contractors, commercial real estate developers and builders and professionals, such as physicians, accountants and attorneys. We have 25 branch office locations and seven mortgage banking office locations and provide competitive products and services. We complement our core banking operations by offering a full range of investment products and services to our customers through our third-party brokerage relationship with Raymond James Financial Services, Inc. and asset management services through Wilson/Bennett.
On February 9, 2006, we acquired certain fiduciary and other assets and assumed certain liabilities of FBR National Trust Company, formerly a subsidiary of Friedman, Billings, Ramsey Group, Inc. Services provided by this division include trust, estates, custody, investment management, escrows, and retirement plans. The trust division is included, along with CWS and Wilson/Bennett, in the wealth management and trust services segment.
On June 9, 2005, we acquired Wilson/Bennett for a total consideration of $6.5 million, which consisted of a payment of $1.5 million in cash and the issuance of 611,111 shares of our common stock, which we valued at $4.9 million. Wilson/Bennett's assets and liabilities were recorded at fair value as of the purchase date. This transaction resulted in the recognition of $3.6 million of goodwill and $2.6 million of other intangible assets. Wilson/Bennett uses a value-oriented approach that focuses on large capitalization stocks. Wilson/Bennett's primary source of revenue is management fees earned on the assets it manages for its customers. These management fees are generally based upon the market value of managed and custodial assets and, accordingly, revenues from Wilson/Bennett will be, assuming a consistent customer base, more when appropriate indices, such as the S&P 500, are higher and lower when such indices are depressed.
In July 2004, we acquired George Mason. George Mason, based in Fairfax, Virginia, engages primarily in the origination and acquisition of residential mortgages for sale into the secondary market on a best efforts basis through seven branches located throughout the metropolitan Washington, D.C. region. George Mason does business in eight states, primarily Virginia and Maryland, and the District of Columbia. George Mason is one of the largest residential mortgage originators in the greater Washington metropolitan area, generating originations of approximately $2.2 billion and $3.0 billion of loans in 2007 and 2006, respectively, excluding advances on construction loans and including loans purchased from other mortgage banking companies which are owned by local home builders but managed by George Mason (the "managed companies"). George Mason's primary sources of revenue include net interest income earned on loans held for sale, gains on sales of loans and contractual management fees earned relating to services provided to the managed companies. Loans are made pursuant to purchase commitments and are sold servicing released.
George Mason also offers a construction-to-permanent loan program. This program provides variable and fixed rate financing for customers to construct their residences. Once the home has been completed, the loan converts to fixed rate financing and is sold into the secondary market. These construction-to-permanent loans generate fee income as well as net interest income for George Mason and are classified as loans held for sale.
George Mason's business is both cyclical and seasonal. The cyclical nature of its business is influenced by, among other factors, the levels of and trends in mortgage interest rates, national and local economic conditions and consumer confidence in the economy. Historically, George Mason has its lowest levels of quarterly loan closings during the first quarter of the year.
31
In July 2004, we formed a wholly-owned subsidiary, Cardinal Statutory Trust I, for the purpose of issuing $20.0 million of floating rate junior subordinated deferrable interest debentures ("trust preferred securities"). These trust preferred securities are due in 2034 and pay interest at a rate equal to LIBOR (London Interbank Offered Rate) plus 2.40%, which adjusts quarterly. These securities are redeemable at par beginning September 2009. Under certain qualifying events, these securities are redeemable at a premium through March 2008 and at par thereafter. The interest rate on this debt was 7.39% at December 31, 2007. We have guaranteed payment of these securities. The $20.6 million payable by us to Cardinal Statutory Trust I is included in other borrowed funds in the consolidated statements of condition since Cardinal Statutory Trust I is an unconsolidated subsidiary as we are not the primary beneficiary of this entity. We utilized the proceeds from the issuance of the trust preferred securities to make a capital contribution into the Bank.
Net interest income is our primary source of revenue. We define revenue as net interest income plus non-interest income. As discussed further in the interest rate sensitivity section, we manage our balance sheet and interest rate risk exposure to maximize, and concurrently stabilize, net interest income. We do this by monitoring our liquidity position and the spread between the interest rates earned on interest-earning assets and the interest rates paid on interest-bearing liabilities. We attempt to minimize our exposure to interest rate risk, but are unable to eliminate it entirely. In addition to management of interest rate risk, we also analyze our loan portfolio for exposure to credit risk. Loan defaults and foreclosures are inherent risks in the banking industry and we attempt to limit our exposure to these risks by carefully underwriting and then monitoring our extensions of credit. In addition to net interest income, non-interest income is an important source of revenue for us and includes, among other things, service charges on deposits and loans, investment fee income and gains and losses on sales of investment securities available-for-sale, gains on sales of loans and management fee income.
Net interest income and non-interest income represented the following percentages of total revenue for the three years ended December 31, 2007:
| | Net Interest
Income
| | Non-Interest
Income
| |
|---|
| 2007 | | 67.4 | % | 32.6 | % |
| 2006 | | 65.6 | % | 34.4 | % |
| 2005 | | 60.3 | % | 39.7 | % |
Non-interest income is a lower percentage of our total revenue in 2007 than 2006 and 2005 because mortgage originations were lower due to the cyclical nature of the mortgage banking business.
Current Business Environment
During the second half of 2007, extreme dislocations emerged in the financial markets, including the leveraged finance, subprime mortgage, and commercial paper markets. These financial conditions continue to negatively affect the economy and the financial services sector in 2008. The slowdown of the economy, significant decline in consumer real estate prices, and the downturn in the housing sector have affected our mortgage banking business and may impact our commercial and retail loan portfolio. We expect that certain industry sectors, in particular those that are dependent on the housing sector, will experience further stress.
The subprime mortgage dislocation has also impacted the ratings of certain monoline insurance providers (monolines) which has affected the pricing of certain municipal securities and the liquidity of the short term public finance markets. We have some exposure to monolines and as a result are continuing to monitor this exposure as the markets evolve. Of the $33.7 million in our municipal securities portfolio, $31.2 million remain AAA rated while approximately $2.5 million were downgraded to single A status after December 31, 2007, due to the downgrades of the monoline insurance
32
companies that insured those bonds. These bonds remain unlimited general obligations of the municipalities.
The above conditions, together with uncertainty in energy costs and the overall economic slowdown, which may ultimately lead to recessionary conditions, might affect other areas in which we do business and may adversely impact our results in 2008. The degree of the impact is dependent upon the duration and severity of the aforementioned conditions in this rapidly changing business and interest rate environment
Financial Developments
The year ended December 31, 2007 was our fifth consecutive year of profitability. For the year, we reported net income of $4.5 million. George Mason contributed $1.6 million to consolidated net income during 2007. The wealth management and trust services segment, which includes CWS, Wilson/Bennett and our trust division, recorded a net loss for 2007 totaling $1.8 million. This segment reported a loss because of $3.5 million in expense resulting from an arrangement where we served as the escrow agent in connection with an equity financing transaction between Liberty Growth Fund and AIMS Worldwide. The $3.5 million expense caused by this transaction is discussed in detail in the "Financial Overview" section below.
Total assets increased by $51.6 million in 2007, from $1.64 billion at December 31, 2006, to $1.69 billion at December 31, 2007. Total loans receivable, net of deferred fees and costs, increased to $1.04 billion at December 31, 2007, compared to $845.4 million at December 31, 2006, an increase of $194.2 million. Total deposits decreased by $122.0 million in 2007, from $1.22 billion at December 31, 2006, to $1.10 billion at December 31, 2007. Total other borrowed funds increased by $205.4 million to $400.1 million at December 31, 2007 compared to $194.6 million at December 31, 2006.
For the year ended December 31, 2006, we reported net income of $7.4 million. George Mason contributed $1.9 million to consolidated net income during 2006. The wealth management and trust services segment, which includes CWS, Wilson/Bennett and the trust services division since the date of its acquisition, February 9, 2006, recorded a net loss of $2.0 million. This segment reported a loss as a result of the unexpected retirement of John W. Fisher, Wilson/Bennett's founder, Chief Executive Officer and President, which caused a non-cash impairment charge of $2.9 million. This charge is discussed in detail in the "Financial Overview" section below.
Total assets increased by $186.1 million in 2006, from $1.45 billion at December 31, 2005, to $1.64 billion at December 31, 2006. Total loans receivable, net of deferred fees and costs, increased to $845.4 million at December 31, 2006, compared to $705.6 million at December 31, 2005, an increase of $139.8 million. Total deposits increased by $149.0 million in 2006, from $1.07 billion at December 31, 2005, to $1.22 billion at December 31, 2006. Total other borrowed funds increased by $39.2 million to $194.6 million at December 31, 2006 compared to $155.4 million at December 31, 2005.
For the year ended December 31, 2005, we had net income of $9.9 million, or $0.44 per diluted common share. George Mason contributed $6.7 million to consolidated net income during 2005. The wealth management and trust services segment, which included CWS and Wilson/Bennett from the date of its acquisition, June 9, 2005, recorded net income of $1,000 for 2005.
Critical Accounting Policies
General
U.S. generally accepted accounting principles are complex and require management to apply significant judgment to various accounting, reporting, and disclosure matters. Management must use assumptions, judgments, and estimates when applying these principles where precise measurements are not possible or practical. These policies are critical because they are highly dependent upon subjective or complex judgments, assumptions and estimates. Changes in such judgments, assumptions and estimates may have a significant impact on the consolidated financial statements. Actual results, in fact, could differ from initial estimates.
33
The accounting policies we view as critical are those relating to judgments, assumptions and estimates regarding the determination of the allowance for loan losses, accounting for economic hedging activities, accounting for business combinations and impairment testing of goodwill, accounting for the impairment of amortizing intangible assets and other long-lived assets, and the valuation of deferred tax assets.
Allowance for Loan Losses
We maintain the allowance for loan losses at a level that represents management's best estimate of known and inherent losses in our loan portfolio. Both the amount of the provision expense and the level of the allowance for loan losses are impacted by many factors, including general and industry-specific economic conditions, actual and expected credit losses, historical trends and specific conditions of individual borrowers. Unusual and infrequently occurring events, such as hurricanes and other weather-related disasters, may impact our assessment of possible credit losses. As a part of our analysis, we use comparative peer group data and qualitative factors, such as levels of and trends in delinquencies and non-accrual loans, national and local economic trends and conditions and concentrations of loans exhibiting similar risk profiles to support our estimates.
For purposes of our analysis, we categorize our loans into one of five categories: commercial and industrial, commercial real estate (including construction), home equity lines of credit, residential mortgages, and consumer loans. In the absence of meaningful historical loss factors, peer group loss factors are applied and are adjusted by the qualitative factors mentioned above. The indicated loss factors resulting from this analysis are applied for each of the five categories of loans. In addition, we individually assign loss factors to all loans that have been identified as having loss attributes, as indicated by deterioration in the financial condition of the borrower or a decline in underlying collateral value if the loan is collateral dependent. Since we have limited historical data on which to base loss factors for classified loans, we typically apply, in accordance with regulatory guidelines, a 5% loss factor to all loans classified as special mention, a 15% loss factor to all loans classified as substandard and a 50% loss factor to all loans classified as doubtful. Loans classified as loss loans are fully reserved or charged off. In certain instances, we evaluate the impairment of certain loans on a loan by loan basis. For these loans, we analyze the fair value of the collateral underlying the loan and consider estimated costs to sell the collateral on a discounted basis. If the net collateral value is less than the loan balance (including accrued interest and any unamortized premium or discount associated with the loan) we recognize an impairment and establish a specific reserve for the impaired loan.
Credit losses are an inherent part of our business and, although we believe the methodologies for determining the allowance for loan losses and the current level of the allowance are adequate, it is possible that there may be unidentified losses in the portfolio at any particular time that may become evident at a future date pursuant to additional internal analysis or regulatory comment. Additional provisions for such losses, if necessary, would be recorded in the commercial banking or mortgage banking segments, as appropriate, and would negatively impact earnings.
Accounting for Economic Hedging Activities
We account for our derivatives and hedging activities in accordance with Statement of Financial Accounting Standards ("SFAS") No. 133,Accounting for Derivative Instruments and Certain Hedging Activities, as amended, which requires that all derivative instruments be recorded on the statement of condition at their fair values. We do not enter into derivative transactions for speculative purposes. For derivatives designated as hedges, we contemporaneously document the hedging relationship, including the risk management objective and strategy for undertaking the hedge, how effectiveness will be assessed at inception and at each reporting period and the method for measuring ineffectiveness. We evaluate the effectiveness of these transactions at inception and on an ongoing basis. Ineffectiveness is recorded through earnings. For derivatives designated as cash flow hedges, the fair value adjustment is
34
recorded as a component of other comprehensive income, except for the ineffective portion which is recorded in earnings. For derivatives designated as fair value hedges, the fair value adjustments for both the hedged item and the hedging instrument are recorded through the income statement with any difference considered the ineffective portion of the hedge.
We discontinue hedge accounting prospectively when it is determined that the derivative is no longer highly effective. In situations in which cash flow hedge accounting is discontinued, we continue to carry the derivative at its fair value on the statement of condition and recognize any subsequent changes in its fair value in earnings over the term of the forecasted transaction. When hedge accounting is discontinued because it is probable that the forecasted transaction will not occur, we recognize immediately in earnings any gains and losses that were accumulated in other comprehensive income.
In the normal course of business, we enter into contractual commitments, including rate lock commitments, to finance residential mortgage loans. These commitments, which contain fixed expiration dates, offer the borrower an interest rate guarantee provided the loan meets underwriting guidelines and closes within the timeframe established by us. Interest rate risk arises on these commitments and subsequently closed loans if interest rates change between the time of the interest rate lock and the delivery of the loan to the investor. Loan commitments related to residential mortgage loans intended to be sold are considered derivatives and are marked to market through earnings.
To mitigate the effect of interest rate risk inherent in providing rate lock commitments, we economically hedge our commitments by entering into best efforts delivery forward loan sales contracts. During the rate lock commitment period, these forward loan sales contracts are marked to market through earnings and are not designated as accounting hedges under SFAS No. 133, as amended. The fair values of loan commitments and the fair values of forward loan sales contracts generally move in opposite directions, and the net impact of changes in these valuations on net income during the loan commitment period is generally inconsequential. At the closing of the loan, the loan commitment derivative expires and we record a loan held for sale and continue to be obligated under the same forward loan sales contract. The forward sales contract is then designated as a hedge against the variability in cash to be received from the loan sale. Loans held for sale are accounted for at the lower of cost or market in accordance with SFAS No. 65,Accounting for Certain Mortgage Banking Activities. Prior to October 1, 2005, the changes in value of the forward loan sales contracts from the date the loan closed to the date it was sold to an investor were marked to market through earnings. On October 1, 2005, we began designating our forward sale contracts as hedges to mitigate the variability in cash flow to be received from the sale of mortgage loans.
Accounting for Business Combinations and Impairment Testing of Goodwill
We account for acquisitions of other businesses in accordance with SFAS No. 141,Business Combinations. This statement mandates the use of purchase accounting and, accordingly, assets and liabilities, including previously unrecorded assets and liabilities, are recorded at fair values as of the acquisition date. We utilize a variety of valuation methods to estimate fair value of acquired assets and liabilities. To support our purchase allocations, we have utilized independent consultants to identify and value identifiable purchased intangibles. The difference between the fair value of assets acquired and the liabilities assumed is recorded as goodwill. Goodwill and any other intangible assets are accounted for in accordance with SFAS No. 142,Goodwill and Other Intangible Assets. In accordance with this statement, goodwill will not be amortized but will be tested on at least an annual basis for impairment.
To test goodwill for impairment, we perform an analysis to compare the fair value of the reporting unit to which the goodwill is assigned to the carrying value of the reporting unit. We make estimates of the discounted cash flows from the expected future operations of the reporting unit. If the analysis indicates that the fair value of the reporting unit is less than its carrying value, we do an analysis to
35
compare the implied fair value of the reporting unit's goodwill with the carrying amount of that goodwill. The implied fair value of the goodwill is determined by allocating the fair value of the reporting unit to all its assets and liabilities. If the implied fair value of the goodwill is less than the carrying value, an impairment loss is recognized.
Accounting for the Impairment of Amortizing Intangible Assets and Other Long-Lived Assets
In accordance with SFAS No. 144,Accounting for the Impairment or Disposal of Long-Lived Assets, we continually review our long-lived assets for impairment whenever events or changes in circumstances indicate that the remaining estimated useful life of such assets might warrant revision or that the balances may not be recoverable. We evaluate possible impairment by comparing estimated future cash flows, before interest expense and on an undiscounted basis, with the net book value of long-term assets, including amortizable intangible assets. If undiscounted cash flows are insufficient to recover assets, further analysis is performed in order to determine the amount of the impairment.
An impairment loss is recognized for the excess of the carrying amount of the assets over their fair values. Fair value is usually determined based on the present value of estimated expected future cash flows using a discount rate commensurate with the risks involved.
Valuation of Deferred Tax Assets
We record a provision for income tax expense based on the amounts of current taxes payable or refundable and the change in net deferred tax assets or liabilities during the year. Deferred tax assets and liabilities are recognized for the tax effects of differing carrying values of assets and liabilities for tax and financial statement purposes that will reverse in future periods. When substantial uncertainty exists concerning the recoverability of a deferred tax asset, the carrying value of the asset is reduced by a valuation allowance. The amount of any valuation allowance established is based upon an estimate of the deferred tax asset that is more likely than not to be recovered. Increases or decreases in the valuation allowance result in increases or decreases to the provision for income taxes.
New Financial Accounting Standards
On July 13, 2006, the FASB issued Interpretation No. 48 ("FIN No. 48"),Accounting for Uncertainty in Income Taxes: an interpretation of FASB Statement No. 109. This interpretation clarifies the accounting for uncertainty in income taxes recognized in an entity's financial statements in accordance with SFAS No. 109,Accounting for Income Taxes. FIN No. 48 prescribes a recognition threshold and measurement principles for financial statement disclosure of tax positions taken or expected to be taken on a tax return. This interpretation is effective for fiscal years beginning after December 15, 2006. The adoption of FIN No. 48 did not have any impact on our consolidated financial position or results of operations. We have included the required disclosures in note 10 to the notes to the consolidated financial statements included in Item 8 below.
In September 2006, the FASB issued SFAS No. 157,Fair Value Measurements. SFAS No. 157 defines fair value, establishes a framework for measuring fair value in accordance with U.S. generally accepted accounting principles, and expands disclosures about fair value measurements. The statement clarifies that the exchange price is the price in an orderly transaction between market participants to sell an asset or transfer a liability at the measurement date. The statement emphasizes that fair value is a market-based measurement and not an entity-specific measurement. It also establishes a fair value hierarchy used in fair value measurements and expands the required disclosures of assets and liabilities measured at fair value. This standard is effective for fiscal years beginning after December 15, 2007. The adoption of this standard is not expected to have a material impact on our consolidated financial position or results of operations.
36
In February 2007, the FASB issued SFAS No. 159,The Fair Value Option for Financial Assets and Financial Liabilities—including an amendment of FAS 115. SFAS No. 159 allows entities to choose, at specified election dates, to measure eligible financial assets and liabilities at fair value that are not otherwise required to be measured at fair value. If a company elects the fair value option for an eligible item, changes in that item's fair value in subsequent reporting periods must be recognized in current earnings. SFAS No. 159 also establishes presentation and disclosure requirements designed to draw comparison between entities that elect different measurement attributes for similar assets and liabilities. SFAS No. 159 is effective for fiscal years beginning after November 15, 2007. We are currently evaluating the requirements of this standard to determine the impact, if any, on our consolidated financial position or results of operations.
In November 2007, the SEC issued Staff Accounting Bulletin No. 109 ("SAB No. 109"),Written Loan Commitments Recorded at Fair Value Through Earnings. SAB No. 109 requires fair value measurements of derivatives or other written loan commitments recorded through earnings to include the future cash flows related to the loan's servicing rights. SAB No. 109 also states that internally developed intangible assets should be excluded from these measurements. SAB No. 109, which supersedes SAB No. 105,Application of Accounting Principles to Loan Commitments, applies to all loan commitments that are accounted for at fair value through earnings. Previously, SAB No. 105 applied to only derivative loan commitments accounted for at fair value through earnings. SAB No. 109 should be applied prospectively to derivative loan commitments issued or modified in fiscal quarters beginning after December 15, 2007. The adoption of this standard is not expected to have a material impact on our consolidated financial position or results of operations.
In December 2007, the SEC issued Staff Accounting Bulletin No. 110 ("SAB No. 110"),Certain Assumptions Used in Valuation Methods. SAB No. 110 extends the use of the "simplified" method, under certain circumstances, in developing an estimate of expected term of "plain vanilla" share options in accordance with SFAS No. 123R,Share-Based Payment. Prior to the issuance of SAB No. 110, SAB No. 107 stated that the simplified method was only available for grants made up to December 31, 2007. We are continuing the use of the simplified method.
Financial Overview
2007 Compared to 2006
At December 31, 2007, total assets were $1.69 billion, an increase of 3.2%, or $51.6 million, from $1.64 billion at December 31, 2006. Total loans receivable, net of deferred fees and costs, increased 23.0%, or $194.2 million, to $1.04 billion at December 31, 2007, from $845.4 million at December 31, 2006. Total investment securities increased by $35.7 million, or 10.8%, to $364.9 million at December 31, 2007, from $329.3 million at December 31, 2006. Total deposits decreased 10.0%, or $122.0 million, to $1.10 billion at December 31, 2007, from $1.22 billion at December 31, 2006. Other borrowed funds, which primarily include repurchase agreements, Federal Home Loan Bank ("FHLB") advances and fed funds purchased, increased $205.4 million to $400.1 million at December 31, 2007, from $194.6 million at December 31, 2006.
Shareholders' equity at December 31, 2007 was $159.5 million, an increase of $3.6 million from $155.9 million at December 31, 2006. The increase in shareholders' equity was primarily attributable to net income of $4.5 million for the year ended December 31, 2007 and increases in other comprehensive income of $1.8 million for the year ended December 31, 2007. These increases were offset by repurchases of our common stock totaling $2.7 million for the year. Total shareholders' equity to total assets at December 31, 2007 and 2006 was 9.4% and 9.5%, respectively. Book value per share at December 31, 2007 and 2006 was $6.59 and $6.37, respectively. Total risk-based capital to risk-weighted assets was 12.98% at December 31, 2007 compared to 14.06% at December 31, 2006. We were considered "well capitalized" for regulatory purposes at December 31, 2007.
37
We recorded net income of $4.5 million, or $0.18 per diluted common share, for the year ended December 31, 2007, compared to net income of $7.4 million, or $0.30 per diluted common share, in 2006. Each of these years had significant events, which are described below, which materially impacted earnings.
For the year ended December 31, 2007, we recorded a $3.5 million loss on an escrow arrangement with Liberty Growth Fund, LP and AIMS Worldwide, Inc. We served as the escrow agent in connection with an equity financing transaction between Liberty Growth Fund and AIMS Worldwide. In that transaction, Liberty Growth Fund had agreed to purchase from AIMS Worldwide shares of its preferred stock for $3.85 million. AIMS Worldwide would then use these proceeds to fund its acquisition of two other companies. As provided in the escrow agreement, Liberty Growth Fund delivered a check to us in the amount of $3.85 million on July 24, 2007. On July 25, 2007, we released funds totaling $3.85 million to AIMS Worldwide and certain of its designated beneficiaries and shares of AIMS Worldwide's preferred stock and warrants to an agent of Liberty Growth Fund. We then learned that Liberty Growth Fund had previously stopped payment on its check. Liberty Growth Fund issued another check in the same amount, but that check was dishonored for lack of sufficient funds. Of the $3.85 million released, we recovered $350,000 from one of the parties involved in the transaction.
We continue to pursue this issue through the legal avenues available to us in order to recover the total amount we are due. We hold in escrow additional shares of AIMS Worldwide's preferred stock that may be issued in a potential second round of financing with Liberty Growth Fund. However, we are not the beneficial owner of these shares. In addition, we have made a claim to our insurance company in order to recover any amounts that may be covered. On February 28, 2008, a complaint for declaratory relief was filed by OneBeacon Midwest Company ("OneBeacon") against us. OneBeacon provides insurance coverage for us and we have filed an insurance claim and proof of loss to recover the $3.5 million attributable to the above referenced loss on the escrow arrangement between Liberty Growth Fund LP and AIMS Worldwide, Inc. OneBeacon is seeking a determination of their rights and obligations under a Financial Institution Bond issued by OneBeacon to us with respect to this claim and proof of loss. Through this action, OneBeacon seeks a court declaration that the Financial Institution Bond does not provide coverage for our claim.
For the year ended December 31, 2006, we recorded a $2.9 million non-cash impairment charge. In July 2006, we announced the retirement of John W. Fisher, Wilson/Bennett's founder, Chief Executive Officer and President, from Wilson/Bennett and as a member of our board of directors. As Mr. Fisher transitioned out of his involvement with Wilson/Bennett, several significant clients unexpectedly either terminated or advised us that they intended to terminate their asset management contracts. This triggered an evaluation of our goodwill and intangible assets. Accordingly, we updated our analysis of the fair value of the goodwill and intangible assets associated with our acquisition of Wilson/Bennett. The updated analysis indicated an impairment to the goodwill and certain customer relationships and Mr. Fisher's employment agreement.
Since Mr. Fisher's retirement announcement, Wilson/Bennett has added experienced portfolio managers and professional sales staff to assist with cross-sell opportunities with our other divisions. We will continue to monitor the operations of Wilson/Bennett, its customer base and managed and custodial assets and any associated impact on goodwill and the remaining intangible assets in the future.
Excluding the loss on the escrow arrangement during 2007 and the impairment charges recorded during 2006, we would have recorded net income of $7.1 million and $9.3 million for the years ended December 31, 2007 and 2006, respectively, a decrease of $2.2 million, or 23.2%. A reconciliation of this non-GAAP financial measure to our GAAP financial information is presented in Table 1 below.
38
Also contributing to our decrease in net income for the year ended December 31, 2007 as compared to the year ended December 31, 2006 was an increase in our provision for loan losses of $1.3 million to $2.5 million for the year ended December 31, 2007 primarily due to the significant loan growth we had during the year. The provision for loan losses was $1.2 million for the same period of 2006. Non-interest income decreased $2.2 million to $19.5 million for the year ended December 31, 2007 as compared to $21.7 million for the same period of 2006 due primarily to decreases in gains on sales of loans and management fee income.
The return on average assets for the years ended December 31, 2007 and 2006 was 0.27% and 0.51%, respectively. The return on average equity for the years ended December 31, 2007 and 2006 was 2.85% and 4.87%, respectively.
2006 Compared to 2005
At December 31, 2006, total assets were $1.64 billion, an increase of 12.8%, or $186.1 million, from $1.45 billion at December 31, 2005. Total loans receivable, net of deferred fees and costs, increased 19.8%, or $139.8 million, to $845.4 million at December 31, 2006, from $705.6 million at December 31, 2005. Total investment securities increased by $35.1 million, or 11.9%, to $329.3 million at December 31, 2006, from $294.2 million at December 31, 2005. Total deposits increased 13.9%, or $149.0 million, to $1.22 billion at December 31, 2006, from $1.07 billion at December 31, 2005. Other borrowed funds, which primarily include repurchase agreements, FHLB advances and our payable to Cardinal Statutory Trust I, increased $39.2 million to $194.6 million at December 31, 2006, from $155.4 million at December 31, 2005. Our balance sheet growth was a result of our continued increase in market share in our designated market area, additional branch locations and the addition of experienced banking professionals during 2006.
Shareholders' equity at December 31, 2006 was $155.9 million, an increase of $8.0 million from $147.9 million at December 31, 2005. The increase in shareholders' equity was primarily attributable to net income of $7.4 million for the year ended December 31, 2006. Total shareholders' equity to total assets at December 31, 2006 and 2005 was 9.5% and 10.2%, respectively. Book value per share at December 31, 2006 and 2005 was $6.37 and $6.07, respectively. Total risk-based capital to risk-weighted assets was 14.06% at December 31, 2006 compared to 15.65% at December 31, 2005. Accordingly, we were considered "well capitalized" for regulatory purposes at December 31, 2006.
We recorded net income of $7.4 million, or $0.30 per diluted common share, for the year ended December 31, 2006, compared to net income of $9.9 million, or $0.44 per diluted common share, in 2005. The decrease in net income for the year ended December 31, 2006 compared to the same period of 2005 is primarily a result of the impairment charges to the goodwill and certain other intangible assets related to our acquisition of Wilson/Bennett, as mentioned above.
The return on average assets for the years ended December 31, 2006 and 2005 was 0.51% and 0.74%, respectively. The return on average equity for the years ended December 31, 2006 and 2005 was 4.87% and 7.67%, respectively.
39
Table 1.
Reconciliation of GAAP to Non-GAAP Financial Measures
Years Ended December 31, 2007, 2006 and 2005
(In thousands, except per share data)
| | 2007
| | 2006
| | 2005
| |
|---|
| GAAP reported non-interest expense | | $ | 51,884 | | $ | 51,245 | | $ | 44,653 | |
| Less nonrecurring expenses, pretax | | | | | | | | | | |
| | Loss related to escrow arrangement | | | 3,500 | | | — | | | — | |
| | Legal expenses related to escrow arrangement | | | 546 | | | — | | | — | |
| | Impairment of goodwill | | | — | | | 960 | | | — | |
| | Impairment of customer relationships intangible | | | — | | | 1,454 | | | — | |
| | Impairment of employment/non-compete agreement | | | — | | | 513 | | | — | |
| | |
| |
| |
| |
| Non-interest expense without nonrecurring expenses | | $ | 47,838 | | $ | 48,318 | | $ | 44,653 | |
| | |
| |
| |
| |
| GAAP reported net income | | $ | 4,482 | | $ | 7,388 | | $ | 9,876 | |
| Less nonrecurring expenses, after tax | | | | | | | | | | |
| | Loss related to escrow arrangement | | | 2,293 | | | — | | | — | |
| | Legal expenses related to escrow arrangement | | | 358 | | | — | | | — | |
| | Impairment of goodwill | | | — | | | 624 | | | — | |
| | Impairment of customer relationships intangible | | | — | | | 946 | | | — | |
| | Impairment of employment/non-compete agreement | | | — | | | 333 | | | — | |
| | |
| |
| |
| |
| Net income without nonrecurring expenses | | $ | 7,133 | | $ | 9,291 | | $ | 9,876 | |
| | |
| |
| |
| |
| GAAP reported earnings per common share, basic | | $ | 0.18 | | $ | 0.30 | | $ | 0.45 | |
| Less nonrecurring expenses, after tax: | | | | | | | | | | |
| | Loss related to escrow arrangement | | | 0.09 | | | — | | | — | |
| | Legal expenses related to escrow arrangement | | | 0.01 | | | — | | | — | |
| | Impairment of goodwill | | | — | | | 0.03 | | | — | |
| | Impairment of customer relationships intangible | | | — | | | 0.04 | | | — | |
| | Impairment of employment/non-compete agreement | | | — | | | 0.01 | | | — | |
| | |
| |
| |
| |
| Earnings per common share without nonrecurring expenses—basic | | $ | 0.28 | | $ | 0.38 | | $ | 0.45 | |
| | |
| |
| |
| |
| GAAP reported earnings per common share, fully diluted | | $ | 0.18 | | $ | 0.30 | | $ | 0.44 | |
| Less nonrecurring expenses, after tax: | | | | | | | | | | |
| | Loss related to escrow arrangement | | | 0.09 | | | — | | | — | |
| | Legal expenses related to escrow arrangement | | | 0.01 | | | — | | | — | |
| | Impairment of goodwill | | | — | | | 0.02 | | | — | |
| | Impairment of customer relationships intangible | | | — | | | 0.04 | | | — | |
| | Impairment of employment/non-compete agreement | | | — | | | 0.01 | | | — | |
| | |
| |
| |
| |
| Earnings per common share without nonrecurring expenses—fully diluted | | $ | 0.28 | | $ | 0.37 | | $ | 0.44 | |
| | |
| |
| |
| |
| Calculation of efficiency ratio(1): | | | | | | | | | | |
| Non-interest expense without nonrecurring expenses (from above) | | $ | 47,838 | | $ | 48,318 | | $ | 44,653 | |
| | |
| |
| |
| |
| GAAP reported net interest income | | | 40,319 | | | 41,354 | | | 37,483 | |
| GAAP reported non-interest income | | | 19,480 | | | 21,684 | | | 24,669 | |
| Less: litigation recovery on previously impaired investment | | | 83 | | | 855 | | | — | |
| | |
| |
| |
| |
| Non-interest income without litigation recovery | | | 19,397 | | | 20,829 | | | 24,669 | |
| | |
| |
| |
| |
| Total net interest income and non-interest income for efficiency ratio | | $ | 59,716 | | $ | 62,183 | | $ | 62,152 | |
| | |
| |
| |
| |
| Efficiency ratio without nonrecurring income and expenses | | | 80.11 | % | | 77.70 | % | | 71.84 | % |
- (1)
- Efficiency ratio is calculated as total non-interest expense divided by the total of net interest income and non-interest income, excluding the loss on escrow arrangement during 2007, the impairment loss during 2006 and the litigation recovery during 2007 and 2006.
40
Statements of Operations
Net Interest Income/Margin
Net interest income is our primary source of revenue, representing the difference between interest and fees earned on interest-bearing assets and the interest paid on deposits and other interest-bearing liabilities. The level of net interest income is affected primarily by variations in the volume and mix of these assets and liabilities, as well as changes in interest rates. At the end of 2003, the federal funds rate was at 1.00%, its lowest level in over forty years. During 2004, as economic activity increased, the Federal Reserve raised the key federal funds rate five times to 2.25% by year end. The Federal Reserve continued this policy in 2005, increasing the federal funds rate eight times to 4.25% by year end, and in 2006 increased the federal funds rate four times to 5.25% by year end. During 2007, the Federal Reserve began easing the federal funds rate due to worsening economic conditions related to the tightening credit markets and decreased the rate four times to end at 4.25% at December 31, 2007. See "Interest Rate Sensitivity" for further information.
41
Table 2.
Average Balance Sheets and Interest Rates on Interest-Earning Assets and Interest-Bearing Liabilities
Years Ended December 31, 2007, 2006 and 2005
(In thousands)
| | 2007
| | 2006
| | 2005
| |
|---|
| | Average
Balance
| | Interest
Income/
Expense
| | Average
Yield/
Rate
| | Average
Balance
| | Interest
Income/
Expense
| | Average
Yield/
Rate
| | Average
Balance
| | Interest
Income/
Expense
| | Average
Yield/
Rate
| |
|---|
| Assets | | | | | | | | | | | | | | | | | | | | | | | | | |
| Interest-earning assets: | | | | | | | | | | | | | | | | | | | | | | | | | |
| | Loans(1): | | | | | | | | | | | | | | | | | | | | | | | | | |
| | | Commercial and industrial | | $ | 108,762 | | $ | 8,263 | | 7.60 | % | $ | 85,269 | | $ | 6,314 | | 7.40 | % | $ | 66,414 | | $ | 4,030 | | 6.07 | % |
| | | Real estate—commercial | | | 366,176 | | | 24,598 | | 6.72 | | | 288,567 | | | 19,082 | | 6.61 | | | 255,505 | | | 16,199 | | 6.34 | |
| | | Real estate—construction | | | 169,503 | | | 14,077 | | 8.30 | | | 143,476 | | | 12,040 | | 8.39 | | | 77,634 | | | 5,468 | | 7.04 | |
| | | Real estate—residential | | | 201,863 | | | 11,029 | | 5.46 | | | 172,809 | | | 9,012 | | 5.22 | | | 115,829 | | | 5,936 | | 5.12 | |
| | | Home equity lines | | | 69,908 | | | 4,967 | | 7.11 | | | 73,194 | | | 5,089 | | 6.95 | | | 67,086 | | | 3,458 | | 5.15 | |
| | | Consumer | | | 6,405 | | | 508 | | 7.93 | | | 4,865 | | | 367 | | 7.54 | | | 5,046 | | | 359 | | 7.11 | |
| | |
| |
| | | |
| |
| | | |
| |
| | | |
| | | | Total loans | | | 922,617 | | | 63,442 | | 6.88 | | | 768,180 | | | 51,904 | | 6.76 | | | 587,514 | | | 35,450 | | 6.03 | |
| | |
| |
| | | |
| |
| | | |
| |
| | | |
| Loans held for sale | | | 233,451 | | | 16,686 | | 7.15 | | | 259,743 | | | 19,288 | | 7.43 | | | 372,866 | | | 19,379 | | 5.20 | |
| Investment securities—trading | | | 11 | | | 1 | | 4.62 | | | — | | | — | | 0.00 | | | — | | | — | | 0.00 | |
| Investment securities available-for-sale | | | 266,935 | | | 13,256 | | 4.97 | | | 226,011 | | | 10,483 | | 4.64 | | | 159,720 | | | 6,195 | | 3.88 | |
| Investment securities held-to-maturity | | | 88,803 | | | 3,722 | | 4.19 | | | 106,938 | | | 4,351 | | 4.07 | | | 127,407 | | | 4,914 | | 3.86 | |
| Other investments | | | 10,626 | | | 635 | | 5.98 | | | 6,409 | | | 378 | | 5.90 | | | 6,269 | | | 261 | | 4.16 | |
| Federal funds sold | | | 25,217 | | | 1,318 | | 5.23 | | | 25,675 | | | 1,206 | | 4.70 | | | 31,981 | | | 1,175 | | 3.67 | |
| | |
| |
| | | |
| |
| | | |
| |
| | | |
| Total interest-earning assets and interest income(2) | | | 1,547,660 | | | 99,060 | | 6.40 | | | 1,392,956 | | | 87,610 | | 6.29 | | | 1,285,757 | | | 67,374 | | 5.24 | |
| | | | | |
| | | | | | |
| | | | | | |
| | | |
| Noninterest-earning assets: | | | | | | | | | | | | | | | | | | | | | | | | | |
| | | Cash and due from banks | | | 8,122 | | | | | | | | 6,813 | | | | | | | | 6,657 | | | | | | |
| | | Premises and equipment, net | | | 19,565 | | | | | | | | 19,758 | | | | | | | | 17,446 | | | | | | |
| | | Goodwill and other intangibles, net | | | 17,371 | | | | | | | | 19,763 | | | | | | | | 18,363 | | | | | | |
| | | Accrued interest and other assets | | | 48,586 | | | | | | | | 24,532 | | | | | | | | 10,919 | | | | | | |
| | | Allowance for loan losses | | | (10,322 | ) | | | | | | | (8,853 | ) | | | | | | | (6,974 | ) | | | | | |
| | |
| | | | | | |
| | | | | | |
| | | | | | |
| Total assets | | $ | 1,630,982 | | | | | | | $ | 1,454,969 | | | | | | | $ | 1,332,168 | | | | | | |
| | |
| | | | | | |
| | | | | | |
| | | | | | |
| Liabilities and Shareholders' Equity | | | | | | | | | | | | | | | | | | | | | | | | | |
| Interest-bearing liabilities: | | | | | | | | | | | | | | | | | | | | | | | | | |
| Interest-bearing deposits: | | | | | | | | | | | | | | | | | | | | | | | | | |
| | Interest checking | | $ | 122,806 | | $ | 3,691 | | 3.01 | % | $ | 136,368 | | $ | 3,796 | | 2.78 | % | $ | 113,628 | | $ | 1,366 | | 1.20 | % |
| | Money markets | | | 56,229 | | | 1,437 | | 2.56 | | | 117,527 | | | 2,881 | | 2.45 | | | 166,301 | | | 4,397 | | 2.64 | |
| | Statement savings | | | 352,078 | | | 16,354 | | 4.64 | | | 154,643 | | | 7,272 | | 4.70 | | | 9,302 | | | 106 | | 1.13 | |
| | Certificates of deposit | | | 515,182 | | | 24,215 | | 4.70 | | | 598,187 | | | 25,142 | | 4.20 | | | 570,669 | | | 19,030 | | 3.33 | |
| | |
| |
| | | |
| |
| | | |
| |
| | | |
| | | Total interest-bearing deposits | | | 1,046,295 | | | 45,697 | | 4.37 | | | 1,006,725 | | | 39,091 | | 3.88 | | | 859,900 | | | 24,899 | | 2.90 | |
| | |
| |
| | | |
| |
| | | |
| |
| | | |
| Other borrowed funds | | | 281,417 | | | 12,627 | | 4.49 | | | 165,501 | | | 6,956 | | 4.20 | | | 207,747 | | | 4,992 | | 2.40 | |
| | |
| |
| | | |
| |
| | | |
| |
| | | |
| Total interest-bearing liabilities and interest expense | | | 1,327,712 | | | 58,324 | | 4.39 | | | 1,172,226 | | | 46,047 | | 3.93 | | | 1,067,647 | | | 29,891 | | 2.80 | |
| | | | | |
| | | | | | |
| | | | | | |
| | | |
| Noninterest-bearing liabilities: | | | | | | | | | | | | | | | | | | | | | | | | | |
| | Demand deposits | | | 123,493 | | | | | | | | 116,041 | | | | | | | | 113,813 | | | | | | |
| | Other liabilities | | | 22,382 | | | | | | | | 15,018 | | | | | | | | 21,980 | | | | | | |
| | Common shareholders' equity | | | 157,395 | | | | | | | | 151,684 | | | | | | | | 128,728 | | | | | | |
| | |
| | | | | | |
| | | | | | |
| | | | | | |
| Total liabilities and shareholders' equity | | $ | 1,630,982 | | | | | | | $ | 1,454,969 | | | | | | | $ | 1,332,168 | | | | | | |
| | |
| | | | | | |
| | | | | | |
| | | | | | |
| Net interest income and net interest margin(2) | | | | | $ | 40,736 | | 2.63 | % | | | | $ | 41,563 | | 2.98 | % | | | | $ | 37,483 | | 2.92 | % |
| | | | | |
| | | | | | |
| | | | | | |
| | | |
- (1)
- Non-accrual loans are included in average balances and do not have a material effect on the average yield. Interest income on non-accruing loans was not material for the years presented.
- (2)
- Interest income for loans receivable, investment securities available-for-sale and fed funds sold (which includes investments in money market preferred stock) is reported on a fully taxable-equivalent basis at a rate of 35%.
42
Table 3.
Rate and Volume Analysis
Years Ended December 31, 2007, 2006 and 2005
(In thousands)
| | 2007 Compared to 2006
| | 2006 Compared to 2005
| |
|---|
| | Average
Volume(3)
| | Average
Rate
| | Increase
(Decrease)
| | Average
Volume(3)
| | Average
Rate
| | Increase
(Decrease)
| |
|---|
| Interest income: | | | | | | | | | | | | | | | | | | | |
| | Loans(1): | | | | | | | | | | | | | | | | | | | |
| | | Commercial and industrial | | $ | 1,740 | | $ | 209 | | $ | 1,949 | | $ | 1,144 | | $ | 1,140 | | $ | 2,284 | |
| | | Real estate—commercial | | | 5,132 | | | 384 | | | 5,516 | | | 2,096 | | | 787 | | | 2,883 | |
| | | Real estate—construction | | | 2,184 | | | (147 | ) | | 2,037 | | | 4,637 | | | 1,935 | | | 6,572 | |
| | | Real estate—residential | | | 1,515 | | | 502 | | | 2,017 | | | 2,920 | | | 156 | | | 3,076 | |
| | | Home equity lines | | | (228 | ) | | 106 | | | (122 | ) | | 315 | | | 1,316 | | | 1,631 | |
| | | Consumer | | | 116 | | | 25 | | | 141 | | | (13 | ) | | 21 | | | 8 | |
| | |
| |
| |
| |
| |
| |
| |
| | | | Total loans | | | 10,459 | | | 1,079 | | | 11,538 | | | 11,099 | | | 5,355 | | | 16,454 | |
| | |
| |
| |
| |
| |
| |
| |
| Loans held for sale | | | (1,952 | ) | | (650 | ) | | (2,602 | ) | | (5,879 | ) | | 5,788 | | | (91 | ) |
| Investment securities—trading | | | 1 | | | — | | | 1 | | | — | | | — | | | — | |
| Investment securities available-for-sale | | | 1,898 | | | 875 | | | 2,773 | | | 2,571 | | | 1,717 | | | 4,288 | |
| Investment securities held-to-maturity | | | (738 | ) | | 109 | | | (629 | ) | | (789 | ) | | 226 | | | (563 | ) |
| Other investments | | | 249 | | | 8 | | | 257 | | | 6 | | | 111 | | | 117 | |
| Federal funds sold | | | (22 | ) | | 134 | | | 112 | | | (232 | ) | | 263 | | | 31 | |
| | |
| |
| |
| |
| |
| |
| |
| | | | Total interest income(2) | | | 9,895 | | | 1,555 | | | 11,450 | | | 6,776 | | | 13,460 | | | 20,236 | |
Interest expense: |
|
|
|
|
|
|
|
|
|
|
|
|
|
|
|
|
|
|
|
| Interest-bearing deposits: | | | | | | | | | | | | | | | | | | | |
| | | Interest checking | | | (378 | ) | | 273 | | | (105 | ) | | 273 | | | 2,157 | | | 2,430 | |
| | | Money markets | | | (1,503 | ) | | 59 | | | (1,444 | ) | | (1,290 | ) | | (226 | ) | | (1,516 | ) |
| | | Statement savings | | | 9,284 | | | (202 | ) | | 9,082 | | | 1,641 | | | 5,525 | | | 7,166 | |
| | | Certificates of deposit | | | (3,489 | ) | | 2,562 | | | (927 | ) | | 918 | | | 5,194 | | | 6,112 | |
| | |
| |
| |
| |
| |
| |
| |
| | | | Total interest-bearing deposits | | | 3,914 | | | 2,692 | | | 6,606 | | | 1,542 | | | 12,650 | | | 14,192 | |
| | |
| |
| |
| |
| |
| |
| |
| Other borrowed funds | | | 4,872 | | | 799 | | | 5,671 | | | (76 | ) | | 2,040 | | | 1,964 | |
| | |
| |
| |
| |
| |
| |
| |
| | | Total interest expense | | | 8,786 | | | 3,491 | | | 12,277 | | | 1,466 | | | 14,690 | | | 16,156 | |
| | |
| |
| |
| |
| |
| |
| |
| Net interest income(2) | | $ | 1,109 | | $ | (1,936 | ) | $ | (827 | ) | $ | 5,310 | | $ | (1,230 | ) | $ | 4,080 | |
| | |
| |
| |
| |
| |
| |
| |
- (1)
- Non-accrual loans are included in average balances and do not have a material effect on the average yield. Interest income on non-accruing loans was not material for the years presented.
- (2)
- Interest income for loans receivable, investment securities available-for-sale and fed funds sold (which includes investments in money market preferred stock) is reported on a fully taxable-equivalent basis at a rate of 35%.
- (3)
- Changes attributable to rate/volume have been allocated to volume.
2007 Compared to 2006
Net interest income on a tax equivalent basis for the year ended December 31, 2007 was $40.7 million, compared to $41.6 million for the year ended December 31, 2006, a decrease of $827,000, or 2.0%. The decrease in net interest income was primarily a result of increases in the
43
interest rates and average volume of deposits and other borrowed funds, net of the impact of increased average volume and yield on earning assets during 2007, compared with 2006. The increase in funding costs was primarily attributable to an increase in rates paid on average interest-bearing liabilities. Net increases in loans receivable and investment securities were funded through the increase in other borrowed funds and a decrease in loans held for sale.
Our net interest margin, on a tax equivalent basis, for the years ended December 31, 2007 and 2006 was 2.63% and 2.98%, respectively. The decrease was primarily a result of a 46 basis point increase in the rates paid on interest-bearing liabilities offset by an 11 basis point increase in the yield on average earning assets. The average yield on interest-earning assets increased to 6.40% in 2007 from 6.29% in 2006, and our cost of interest-bearing liabilities increased to 4.39% in 2007 from 3.93% in 2006. The cost of other borrowed funds, which generally are shorter term fundings and which we continued to utilize in 2007 to help fund our balance sheet growth, increased 29 basis points to 4.49% in 2007 from 4.20% in 2006. The cost of deposit liabilities increased 49 basis points to 4.37% in 2007 from 3.88% for 2006.
Total average earning assets increased by 11.1% to $1.55 billion at December 31, 2007, compared to $1.39 billion at December 31, 2006. The increase in our average earning assets were primarily driven by the increase in average loans receivable of $154.4 million and an increase in investment securities of $22.8 million offset by the decrease in our average inventory of loans held for sale of $26.3 million. These increases were funded by an increase in average total deposits of $47.0 million and other borrowed funds of $115.9 million during 2007.
Average loans receivable increased $154.4 million to $922.6 million during 2007 from $768.2 million in 2006. Average balances of nonperforming assets, which consist of non-accrual loans, are included in the net interest margin calculation and did not have a material impact on our net interest margin in 2007 and 2006. Additional interest income of approximately $5,000 for 2007 and $15,000 for 2006 would have been realized had all nonperforming assets performed as originally expected. Nonperforming assets exclude loans that are both past due 90 days or more and still accruing interest due to an assessment of collectibility.
Average total deposits increased $47.0 million to $1.17 billion in 2007 from $1.12 billion in 2006. The largest increase in average deposit balances was in statement savings, which increased $197.4 million compared to 2006, a result of our advertised Simply Savings product which was introduced during 2006. This savings product allows new customers to earn a yield of 4.21% on funds deposited with us as of December 31, 2007. The increase in our statement savings was offset by decreases in our money market balances of $61.3 million and decreases in our certificates of deposit of $83.0 million for the year ended December 31, 2007 compared to the year ended December 31, 2006.
2006 Compared to 2005
Net interest income on a tax equivalent basis for the year ended December 31, 2006 was $41.6 million, compared to $37.5 million for the year ended December 31, 2005, an increase of $4.1 million, or 10.9%. The increase in net interest income was primarily a result of increases in the interest rates and average volume of loans receivable and investment securities, net of the impact of increased funding costs during 2006, compared with 2005. The increase in funding costs was primarily attributable to an increase in rates paid on average interest-bearing liabilities. Net increases in loans receivable and investment securities were funded through the increase in total deposits and a decrease in loans held for sale.
Our net interest margin, on a tax equivalent basis, for the years ended December 31, 2006 and 2005 was 2.98% and 2.92%, respectively, primarily as a result of a 105 basis point increase in the rates earned on average interest-earning assets offset by an increased cost of average interest-bearing liabilities of 113 basis points. The average yield on interest-earning assets increased to 6.29% in 2006 from 5.24% in 2005, and our cost of interest-bearing liabilities increased to 3.93% in 2006 from 2.80% in 2005. The cost of other borrowed funds, which generally are shorter term fundings, increased 180 basis points to 4.20% in 2006 from 2.40% in 2005. The cost of deposit liabilities increased 98 basis points to 3.88% in 2006 from 2.90% for 2005.
44
Total average earning assets increased by 8.3% to $1.39 billion at December 31, 2006, compared to $1.29 billion at December 31, 2005. This resulted primarily from a $180.7 million increase in average loans receivable. Average investment securities increased $45.8 million during 2006 to $332.9 million at December 31, 2006, from $287.1 million at December 31, 2005. These increases were funded by average deposit growth of $149.1 million.
Average loans receivable increased $180.7 million to $768.2 million during 2006 from $587.5 million in 2005. Average balances of nonperforming assets, which consist of non-accrual loans, are included in the net interest margin calculation and did not have a material impact on our net interest margin in 2006 and 2005. Additional interest income of approximately $15,000 for 2006 and $18,000 for 2005 would have been realized had all nonperforming assets performed as originally expected. Nonperforming assets exclude loans that are both past due 90 days or more and still accruing interest due to an assessment of collectibility.
Average total deposits increased $149.1 million to $1.12 billion in 2006 from $973.7 million in 2005. The largest increase in average deposit balances was experienced in statement savings, which increased $145.3 million compared to 2005, a result of our advertised Simply Savings product which was introduced during 2006. During 2006, this savings product allowed new customers to earn a yield of 5.01% on funds deposited with us.
Interest Rate Sensitivity
We are exposed to various business risks including interest rate risk. Our goal is to maximize net interest income without incurring excessive interest rate risk. Management of net interest income and interest rate risk must be consistent with the level of capital and liquidity that we maintain. We manage interest rate risk through an asset and liability committee ("ALCO"). ALCO is responsible for managing our interest rate risk in conjunction with liquidity and capital management.
We employ an independent consulting firm to model our interest rate sensitivity. We use a net interest income simulation model as our primary tool to measure interest rate sensitivity. Many assumptions are developed based on expected activity in the balance sheet. For maturing assets, assumptions are created for the redeployment of these assets. For maturing liabilities, assumptions are developed for the replacement of these funding sources. Assumptions are also developed for assets and liabilities that could reprice during the modeled time period. These assumptions also cover how we expect rates to change on non-maturity deposits such as interest checking, money market checking, savings accounts as well as certificates of deposit. Based on inputs that include the current balance sheet, the current level of interest rates and the developed assumptions, the model then produces an expected level of net interest income assuming that market rates remain unchanged. This is considered the base case. Next, the model determines what net interest income would be based on specific changes in interest rates. The rate simulations are performed for a two year period and include ramped rate changes of down 200 basis points and up 200 basis points. In the ramped down rate change, the model moves rates gradually down 200 basis points over the first year and then rates remain flat in the second year. For the up 200 basis point scenario, rates are gradually moved up 200 basis points in the first year and then rates remain flat in the second year. In both the up and down scenarios, the model assumes a parallel shift in the yield curve. The results of these simulations are then compared to the base case.
At December 31, 2007, we were liability sensitive for the entire two year simulation period. Liability sensitive means that we have more liabilities repricing than assets. We have more of our liabilities in non-maturity or short-term deposit products than we have in floating rate assets. In a decreasing interest rate environment, net interest income would grow for a liability sensitive bank. In the down 200 basis point scenario, net interest income improves by not more than 8.2% for the one year period and by not more than 13.1% over the two year time horizon. In the up 200 basis point scenario, net interest income decreases by not less than 5.6% and by not less than 6.7% over the two year time horizon compared to the base case.
45
Provision Expense and Allowance for Loan Losses
Our policy is to maintain the allowance for loan losses at a level that represents our best estimate of known and inherent losses in the loan portfolio. Both the amount of the provision and the level of the allowance for loan losses are impacted by many factors, including general and industry-specific economic conditions, actual and expected credit losses, historical trends and specific conditions of individual borrowers.
The provision for loan losses was $2.5 million and $1.2 million for the years ended December 31, 2007 and 2006, respectively. The allowance for loan losses at December 31, 2007 was $11.6 million compared to $9.6 million at December 31, 2006. Our allowance for loan loss ratio at December 31, 2007 was 1.12% compared to 1.14% at December 31, 2006. The decrease in the allowance for loan loss ratio is primarily reflective of an improvement in overall credit quality and our evaluation of our loan portfolio and the qualitative factors we use to determine the adequacy of our loan loss reserve. We continued to experience strong loan quality with annualized net charged-off loans of 0.06% to average loans receivable for the year ended December 31, 2007, and no non-performing loans at December 31, 2007.
The provision for loan losses was $2.5 million for 2005. The growth in loans during 2005 was comprised primarily of increases in our construction, residential and commercial real estate loan portfolios, which require a higher allocation of the allowance than the remainder of the loan portfolio.
See "Critical Accounting Policies" above for more information on our allowance for loan losses methodology.
The following tables present additional information pertaining to the activity in and allocation of the allowance for loan losses by loan type and the percentage of the loan type to the total loan portfolio.
Table 4.
Allowance for Loan Losses
Years Ended December 31, 2007, 2006, 2005, 2004, and 2003
(In thousands)
| | 2007
| | 2006
| | 2005
| | 2004
| | 2003
| |
|---|
| Beginning balance, January 1 | | $ | 9,638 | | $ | 8,301 | | $ | 5,878 | | $ | 4,344 | | $ | 3,372 | |
| Provision for loan losses | | | 2,548 | | | 1,232 | | | 2,456 | | | 1,626 | | | 1,001 | |
| Loans charged off: | | | | | | | | | | | | | | | | |
| | Commercial and industrial | | | (449 | ) | | (42 | ) | | (120 | ) | | (100 | ) | | (74 | ) |
| | Consumer | | | (103 | ) | | (1 | ) | | (9 | ) | | (8 | ) | | (6 | ) |
| | |
| |
| |
| |
| |
| |
| | Total loans charged off | | | (552 | ) | | (43 | ) | | (129 | ) | | (108 | ) | | (80 | ) |
| Recoveries: | | | | | | | | | | | | | | | | |
| | Commercial and industrial | | | 7 | | | 148 | | | 82 | | | 14 | | | 43 | |
| | Consumer | | | — | | | — | | | 14 | | | 2 | | | 8 | |
| | |
| |
| |
| |
| |
| |
| | Total recoveries | | | 7 | | | 148 | | | 96 | | | 16 | | | 51 | |
| Net (charge offs) recoveries | | | (545 | ) | | 105 | | | (33 | ) | | (92 | ) | | (29 | ) |
| | |
| |
| |
| |
| |
| |
| Ending balance, December 31, | | $ | 11,641 | | $ | 9,638 | | $ | 8,301 | | $ | 5,878 | | $ | 4,344 | |
| | |
| |
| |
| |
| |
| |
Loans: |
|
|
2007 |
|
|
2006 |
|
|
2005 |
|
|
2004 |
|
|
2003 |
|
| | |
| |
| |
| |
| |
| |
| | Balance at year end | | $ | 1,039,684 | | $ | 845,449 | | $ | 705,644 | | $ | 489,896 | | $ | 336,002 | |
| | Allowance for loan losses to | | | | | | | | | | | | | | | | |
| | | loans receivable, net of fees | | | 1.12 | % | | 1.14 | % | | 1.18 | % | | 1.20 | % | | 1.29 | % |
| | Net charge-offs to average loans receivable | | | 0.06 | % | | 0.00 | % | | 0.01 | % | | 0.02 | % | | 0.01 | % |
46
Table 5.
Allocation of the Allowance for Loan Losses
At December 31, 2007, 2006, 2005, 2004, and 2003
(In thousands)
| | 2007
| | 2006
| | 2005
| |
|---|
| | Allocation
| | % of Total*
| | Allocation
| | % of Total*
| | Allocation
| | % of Total*
| |
|---|
| Commercial and industrial | | $ | 1,956 | | 13.51 | % | $ | 1,670 | | 12.09 | % | $ | 1,153 | | 9.83 | % |
| Real estate—commercial | | | 5,225 | | 39.95 | | | 3,687 | | 37.50 | | | 3,338 | | 39.01 | |
| Real estate—construction | | | 2,217 | | 17.93 | | | 1,764 | | 18.27 | | | 1,432 | | 18.13 | |
| Real estate—residential | | | 1,402 | | 20.50 | | | 2,025 | | 23.80 | | | 1,490 | | 21.65 | |
| Home equity lines | | | 772 | | 7.81 | | | 384 | | 7.75 | | | 721 | | 10.63 | |
| Consumer | | | 69 | | 0.30 | | | 108 | | 0.59 | | | 167 | | 0.75 | |
| | |
| |
| |
| |
| |
| |
| |
| Total allowance for loan losses | | $ | 11,641 | | 100.00 | % | $ | 9,638 | | 100.00 | % | $ | 8,301 | | 100.00 | % |
| | |
| |
| |
| |
| |
| |
| |
| | 2004
| | 2003
| |
| |
|
|---|
| | Allocation
| | % of Total*
| | Allocation
| | % of Total*
| |
| |
|
|---|
| Commercial and industrial | | $ | 963 | | 11.53 | % | $ | 1,046 | | 17.21 | % | | | |
| Real estate—commercial | | | 2,732 | | 44.88 | | | 1,662 | | 41.56 | | | | |
| Real estate—construction | | | 768 | | 14.18 | | | 497 | | 12.57 | | | | |
| Real estate—residential | | | 692 | | 15.69 | | | 418 | | 12.64 | | | | |
| Home equity lines | | | 612 | | 12.32 | | | 486 | | 12.84 | | | | |
| Consumer | | | 111 | | 1.40 | | | 235 | | 3.18 | | | | |
| | |
| |
| |
| |
| | | | |
| Total allowance for loan losses | | $ | 5,878 | | 100.00 | % | $ | 4,344 | | 100.00 | % | | | |
| | |
| |
| |
| |
| | | | |
- *
- Percentage of loan type to the total loan portfolio.
Non-Interest Income
Non-interest income includes service charges on deposits and loans, gains on sales of loans held for sale, investment fee income, management fee income, and gains on sales of investment securities available-for-sale, and continues to be an important factor in our operating results. Non-interest income for the years ended December 31, 2007 and 2006 was $19.5 million and $21.7 million, respectively. The decrease in non-interest income for the year ended December 31, 2007, compared to the same period of 2006, is primarily the result of decreased gains on sales of loans held for sale of $1.3 million and a decrease in management fee income of $1.1 million. The decrease in gains on sales of loans held for sale and management fee income is due to the slowdown in the regional housing market. Included in the net gains on sales of loans held for sale are any origination, underwriting, and discount points and other funding fees that were received and deferred at loan origination. Costs include direct costs associated with loan origination, such as commissions and salaries that are deferred at the time of origination. Management fees represent the income earned for services George Mason provides to other mortgage companies owned by local home builders and generally fluctuates based on the volume of loan sales.
Service charges on deposit accounts increased $395,000 to $2.0 million for the year ended December 31, 2007, compared to $1.6 million for the year ended December 31, 2006. Deposit service charges increased primarily as a result of an increased number of transaction accounts in 2007 compared to 2006. Loan service charges decreased $675,000 to $1.5 million for the year ended December 31, 2007, compared to $2.2 million in 2006. Loan service charges decreased due to decreases
47
in loan originations at George Mason during 2007, compared to originations during 2006 because of the aforementioned slowdown in the regional housing market. Investment fee income increased $957,000 to $4.3 million for the year ended December 31, 2007, compared to $3.3 million for the year ended December 31, 2006. The increase in investment fee income is primarily attributable to a full year of operations of the trust division in 2007 and higher monthly fee income. For the year ended December 31, 2007, the increase in the cash surrender value of our bank-owned life insurance was $1.7 million, an increase of $1.0 million when compared to the same period of 2006. This is primarily due to having our investment in bank-owned life insurance for a full twelve month period in 2007 compared to only five months of 2006.
Included in other income for the year ended December 31, 2006 are gains related to the extinguishment of two borrowings totaling $769,000. There were no similar transactions for the year ended December 31, 2007.
During the year ended December 31, 2006, we received a litigation settlement from a previously impaired investment of $855,000. For the year ended December 31, 2007, an additional amount of $83,000 was recovered for this same impaired investment.
Non-interest income for the years ended December 31, 2006 and 2005 was $21.7 million and $24.7 million, respectively. The decrease in non-interest income for the year ended December 31, 2006, compared to the same period of 2005, is primarily the result of decreased gains on sales of loans held for sale of $5.9 million. The decrease in gains on sales of loans held for sale is due to the slowdown in the regional housing market. Also contributing to the decrease in non-interest income, management fee income decreased by $811,000 in 2006 compared to 2005.
Service charges on deposit accounts increased $259,000 to $1.6 million for the year ended December 31, 2006, compared to $1.3 million for the year ended December 31, 2005. Deposit service charges increased primarily as a result of an increased number of transaction accounts in 2006 compared to 2005. Loan service charges decreased $524,000 to $2.2 million for the year ended December 31, 2006, compared to $2.7 million in 2005. Loan service charges decreased due to decreases in loan originations at George Mason during 2006, compared to originations during 2005 because of the aforementioned slowdown in the regional housing market. Investment fee income increased $1.9 million to $3.3 million for the year ended December 31, 2006, compared to $1.4 million for the year ended December 31, 2005. The increase in investment fee income is primarily attributable to the addition of the trust division in February 2006 and a full year of operations of Wilson/Bennett in 2006. Included in other income are gains related to the extinguishment of two borrowings totaling $769,000 for the year ended December 31, 2006 compared to $140,000 for the year ended December 31, 2005.
During 2006, we received a litigation settlement from a previously impaired investment of $855,000. In addition, we invested $30.0 million in bank-owned life insurance during the third quarter of 2006. The increase in the cash surrender value of the insurance policy for the year ended December 31, 2006 was $646,000. There were no similar transactions for the year ended December 31, 2005.
48
The following table provides additional detail on non-interest income for the years ended December 31, 2007, 2006, and 2005.
Table 6.
Non-Interest Income
Years Ended December 31, 2007, 2006, and 2005
(In thousands)
| | 2007
| | 2006
| | 2005
| |
|---|
| Insufficient funds fee income | | $ | 704 | | $ | 729 | | $ | 637 | |
| Service charges on deposit accounts | | | 312 | | | 207 | | | 167 | |
| Other fee income on deposit accounts | | | 381 | | | 131 | | | 123 | |
| ATM transaction fees | | | 579 | | | 463 | | | 356 | |
| Loan service charges | | | 1,502 | | | 2,177 | | | 2,701 | |
| Investment fee income | | | 813 | | | 1,341 | | | 1,417 | |
| Trust adminstration fee income | | | 3,474 | | | 1,989 | | | — | |
| Increase in cash surrender value of bank-owned life insurance | | | 1,670 | | | 646 | | | — | |
| Net gain on sales of loans | | | 8,779 | | | 10,059 | | | 15,975 | |
| Management fee income | | | 1,072 | | | 2,221 | | | 3,032 | |
| Net realized gain on investment securities available-for-sale | | | — | | | 61 | | | 33 | |
| Net gain (loss) on sales of assets | | | (2 | ) | | 15 | | | (13 | ) |
| Credit card fees | | | 61 | | | 63 | | | 51 | |
| Litigation recovery on previously impaired investment | | | 83 | | | 855 | | | — | |
| Gain on debt extinguishments | | | — | | | 769 | | | 140 | |
| Other income | | | 52 | | | (42 | ) | | 50 | |
| | |
| |
| |
| |
| Total non-interest income | | $ | 19,480 | | $ | 21,684 | | $ | 24,669 | |
| | |
| |
| |
| |
Non-Interest Expense
Non-interest expense includes, among other things, salaries and benefits, occupancy costs, professional fees, depreciation, data processing, telecommunications and miscellaneous expenses. Non-interest expense was $51.9 million and $51.2 million for the years ended December 31, 2007 and 2006, respectively, an increase of $639,000, or 1.3%. The marginal increase in non-interest expense for the year ended December 31, 2007, compared to 2006, was primarily the result of the increase in our FDIC insurance assessment of $629,000 compared to 2006. Other expenses decreased or increased slightly as a result of expense control measures put in place at George Mason, offset by non-interest expense increases related to the Bank's branch expansion that has occurred over the past two years and our acquisition of the trust division in February 2006.
In each of years ended December 31, 2007 and December 31, 2006, non-interest expense was impacted by one-time charges. For the year ended December 31, 2007, we recorded a loss of $3.5 million related to our escrow arrangement with Liberty Growth Fund, LP. For the year ended December 31, 2006, we recorded an impairment charge of $2.9 million related to Wilson/Bennett. See the "Financial Overview" section above for additional information on both of these transactions.
Non-interest expense was $51.2 million and $44.7 million for the years ended December 31, 2006 and 2005, respectively, an increase in 2006 of $6.6 million, or 14.8%. The increase in non-interest expense for the year ended December 31, 2006, compared to 2005, was primarily the result of branch expansion in those past two years and our acquisition of the trust division in February 2006.
49
The following table reflects the components of non-interest expense for the years ended December 31, 2007, 2006 and 2005.
Table 7.
Non-Interest Expense
Years Ended December 31, 2007, 2006, and 2005
(In thousands)
| | 2007
| | 2006
| | 2005
|
|---|
| Salary and benefits | | $ | 23,815 | | $ | 24,616 | | $ | 22,480 |
| Occupancy | | | 5,348 | | | 5,242 | | | 4,293 |
| Professional fees | | | 2,095 | | | 2,149 | | | 2,212 |
| Depreciation | | | 3,035 | | | 3,172 | | | 2,822 |
| Amortization of intangibles | | | 254 | | | 420 | | | 409 |
| Loss related to escrow arrangement | | | 3,500 | | | — | | | — |
| Impairment of goodwill and intangible assets | | | — | | | 2,927 | | | — |
| Data processing | | | 1,450 | | | 1,358 | | | 1,559 |
| Stationary and supplies | | | 1,091 | | | 1,374 | | | 1,551 |
| Advertising and marketing | | | 2,058 | | | 2,026 | | | 1,993 |
| Telecommunications | | | 1,182 | | | 1,247 | | | 1,189 |
| Other taxes | | | 1,701 | | | 1,572 | | | 1,422 |
| Travel and entertainment | | | 492 | | | 776 | | | 763 |
| Bank operations | | | 1,234 | | | 719 | | | 860 |
| Premises and equipment | | | 1,771 | | | 1,675 | | | 1,400 |
| FDIC insurance assessments | | | 768 | | | 139 | | | 121 |
| Miscellaneous | | | 2,090 | | | 1,833 | | | 1,579 |
| | |
| |
| |
|
| Total non-interest expense | | $ | 51,884 | | $ | 51,245 | | $ | 44,653 |
| | |
| |
| |
|
Income Taxes
We recorded a provision for income tax expense of $885,000 for the year ended December 31, 2007, a decrease of $2.3 million compared to 2006. Our effective tax rate for the years ended December 31, 2007 and 2006 was 16.5% and 30.0%, respectively. The decrease in our effective tax rate from 2006 to 2007 is primarily the result of our tax-exempt income from investments being a larger portion of our overall net income for the year ended December 31, 2007 compared to 2006.
We recorded a provision for income tax expense of $5.2 million for the year ended December 31, 2005. Our effective tax rate for the year ended December 31, 2005 was 34.4%. The decrease in effective tax rates from 2005 to 2006 is primarily the result of our adding tax-exempt investments to our balance sheet during 2006.
For more information, see "Critical Accounting Policies" above. In addition, note 10 to the notes to consolidated financial statements provides additional information with respect to the deferred tax accounts and the net operating loss carryforward.
50
Statements of Condition
Loans Receivable, Net
Total loans receivable, net of deferred fees and costs, were $1.04 billion at December 31, 2007, an increase of $194.2 million, or 23%, compared to $845.4 million at December 31, 2006. We achieved growth in all our loan categories with the exception of our consumer loans. Consumer loans decreased $1.8 million to $3.1 million at December 31, 2007 from $4.9 million at December 31, 2006, primarily as a result of repayments during 2007 and decreased originations. Loans held for sale decreased $168.2 million to $170.5 million at December 31, 2007 compared to $338.7 million at December 31, 2006, a result of the slowdown in the regional housing market during 2007.
Loans receivable accounted for on a non-accrual basis at December 31, 2007 and December 31, 2006 were $0 and $82,000, respectively. Accruing loans, which are contractually past due 90 days or more as to principal or interest payments, at December 31, 2007 were $963,000, all of which are included in our loans held for sale portfolio and were determined to be well secured and in the process of collection. At December 31, 2006, there were no loans contractually past due 90 days or more as to principal or interest payments that were still accruing. There were no loans at December 31, 2007 and December 31, 2006 that were "troubled debt restructurings" as defined in SFAS No. 15,Accounting by Debtors and Creditors for Troubled Debt Restructurings.
Interest income on non-accrual loans, if recognized, is recorded using the cash basis method of accounting. When a loan is placed on non-accrual, unpaid interest is reversed against interest income if it was accrued in the current year and is charged to the allowance for loan losses if it was accrued in prior years. While on non-accrual, the collection of interest is recorded as interest income only after all past-due principal has been collected. When all past contractual obligations are collected and, in our opinion, the borrower has demonstrated the ability to remain current, the loan is returned to an accruing status. Gross interest income that would have been recorded if the non-accrual loans had been current with their original terms and had been outstanding throughout the period or since origination if held for part of the period for the years ended December 31, 2007 and 2006 was $5,000 and $15,000, respectively. The interest income realized prior to the loans being placed on non-accrual status for the year ended December 31, 2007 and 2006 was $38,000 and $9,000, respectively.
Total loans receivable, net of deferred fees and costs, were $845.4 million at December 31, 2006, an increase of $139.8 million, or 19.8%, compared to $705.6 million at December 31, 2005. The strongest growth was in commercial and industrial loans, commercial real estate loans, residential real estate loans, and real estate construction loans.
Loans receivable accounted for on a non-accrual basis at December 31, 2005 was $214,000. Accruing loans, which were contractually past due 90 days or more as to principal or interest payments at December 31, 2005 was $33,000. There were no loans at December 31, 2005, 2004 and 2003 that were "troubled debt restructurings" as defined in SFAS No. 15. Gross interest income that would have been recorded if the non-accrual loans had been current with their original terms and had been outstanding throughout the period, or since origination if held for part of the period for 2005 was $18,000. No interest income was realized prior to these loans being placed on non-accrual status for the year ended December 31, 2005.
The ratio of non-performing loans to total loans was 0.00%, 0.01% and 0.03% at December 31, 2007, 2006 and 2005, respectively.
51
The following tables present the composition of our loans receivable portfolio at the end of each of the five years ended December 31, 2007 and additional information on non-performing loans receivable.
Table 8.
Loans Receivable
At December 31, 2007, 2006, 2005, 2004, and 2003
(In thousands)
| | | 2007
| | 2006
| | 2005
| |
| Commercial and industrial | | $ | 140,531 | | 13.51 | % | $ | 102,284 | | 12.09 | % | $ | 69,392 | | 9.83 | % |
| Real estate—commercial | | | 415,471 | | 39.95 | | | 317,201 | | 37.50 | | | 275,381 | | 39.01 | |
| Real estate—construction | | | 186,514 | | 17.93 | | | 154,525 | | 18.27 | | | 128,009 | | 18.13 | |
| Real estate—residential | | | 213,197 | | 20.50 | | | 201,320 | | 23.80 | | | 152,818 | | 21.65 | |
| Home equity lines | | | 81,247 | | 7.81 | | | 65,557 | | 7.75 | | | 75,048 | | 10.63 | |
| Consumer | | | 3,129 | | 0.30 | | | 4,904 | | 0.59 | | | 5,255 | | 0.75 | |
| | |
| |
| |
| |
| |
| |
| |
| Gross loans | | | 1,040,089 | | 100.00 | % | | 845,791 | | 100.00 | % | | 705,903 | | 100.00 | % |
| Net deferred (fees) costs | | | (405 | ) | | | | (342 | ) | | | | (259 | ) | | |
| Less: allowance for loan losses | | | (11,641 | ) | | | | (9,638 | ) | | | | (8,301 | ) | | |
| | |
| | | |
| | | |
| | | |
| Loans receivable, net | | $ | 1,028,043 | | | | $ | 835,811 | | | | $ | 697,343 | | | |
| | |
| | | |
| | | |
| | | |
| | | 2004
| | 2003
| |
| Commercial and industrial | | $ | 56,512 | | 11.53 | % | $ | 57,854 | | 17.21 | % |
| Real estate—commercial | | | 220,012 | | 44.88 | | | 139,725 | | 41.56 | |
| Real estate—construction | | | 69,535 | | 14.18 | | | 42,243 | | 12.57 | |
| Real estate—residential | | | 76,932 | | 15.69 | | | 42,495 | | 12.64 | |
| Home equity lines | | | 60,408 | | 12.32 | | | 43,176 | | 12.84 | |
| Consumer | | | 6,816 | | 1.40 | | | 10,690 | | 3.18 | |
| | |
| |
| |
| |
| |
| Gross loans | | | 490,215 | | 100.00 | % | | 336,183 | | 100.00 | % |
| Net deferred (fees) costs | | | (319 | ) | | | | (181 | ) | | |
| Less: allowance for loan losses | | | (5,878 | ) | | | | (4,344 | ) | | |
| | |
| | | |
| | | |
| Loans receivable, net | | $ | 484,018 | | | | $ | 331,658 | | | |
| | |
| | | |
| | | |
Table 9.
Nonperforming Loans
At December 31, 2007, 2006, 2005, 2004, and 2003
(In thousands)
| | 2007
| | 2006
| | 2005
| | 2004
| | 2003
|
|---|
| Nonaccruing loans | | $ | — | | $ | 82 | | $ | 214 | | $ | 547 | | $ | 390 |
| Loans contractually past-due 90 days or more | | | 963 | | | — | | | 33 | | | — | | | 4 |
| | |
| |
| |
| |
| |
|
| Total nonperforming loans | | $ | 963 | | $ | 82 | | $ | 247 | | $ | 547 | | $ | 394 |
| | |
| |
| |
| |
| |
|
52
The following table presents information on loan maturities and interest rate sensitivity.
Table 10.
Loan Maturities and Interest Rate Sensitivity
At December 31, 2007
(In thousands)
| | One Year
or Less
| | Between
One and
Five Years
| | After
Five Years
| | Total
|
|---|
| Commercial and industrial | | $ | 73,841 | | $ | 32,866 | | $ | 33,824 | | $ | 140,531 |
| Real estate—commercial | | | 95,078 | | | 225,817 | | | 94,576 | | | 415,471 |
| Real estate—construction | | | 162,619 | | | 7,291 | | | 16,604 | | | 186,514 |
| Real estate—residential | | | 76,247 | | | 131,241 | | | 5,709 | | | 213,197 |
| Home equity lines | | | 80,150 | | | 1,097 | | | — | | | 81,247 |
| Consumer | | | 1,646 | | | 832 | | | 651 | | | 3,129 |
| | |
| |
| |
| |
|
| Total loans receivable | | $ | 489,581 | | $ | 399,144 | | $ | 151,364 | | $ | 1,040,089 |
| | |
| |
| |
| |
|
| Fixed-rate loans | | | | | $ | 164,276 | | $ | 125,471 | | $ | 289,747 |
| Floating-rate loans | | | | | | 234,868 | | | 25,893 | | | 260,761 |
| | | | | |
| |
| |
|
| Total loans receivable | | | | | $ | 399,144 | | $ | 151,364 | | $ | 550,508 |
| | | | | |
| |
| |
|
- *
- Payments due by period are based on the repricing characteristics and not contractual maturities.
Investment Securities
Our investment securities portfolio is used as a source of income and liquidity. The investment portfolio consists of investment securities available-for-sale and investment securities held-to-maturity. Investment securities available-for-sale are those securities that we intend to hold for an indefinite period of time, but not necessarily until maturity. These securities are carried at fair value and may be sold as part of an asset/liability strategy, liquidity management or regulatory capital management. Investment securities held-to-maturity are those securities that we have the intent and ability to hold to maturity and are carried at amortized cost. Investment securities were $364.9 million at December 31, 2007, an increase of $35.7 million or 10.8%, from $329.3 million in investment securities at December 31, 2006.
Of the $364.9 million in the investment portfolio at December 31, 2007, $78.9 million were classified as held-to-maturity, and $286.0 million were classified as available-for-sale. At December 31, 2007, the weighted average yield on the available-for-sale investment portfolio was 5.14% and the weighted average yield on the held-to-maturity portfolio was 4.45%. Beginning in 2006 and continuing through 2007, we began purchasing bank-qualified tax-exempt municipal investment securities. At December 31, 2007 and 2006, the amortized cost of tax-exempt municipal securities was $33.7 million and $25.0 million, respectively.
At December 31, 2007 and 2006, investment securities with unrealized losses are investment grade securities. Investment securities with unrealized losses have interest rates that are less than current market interest rates and, therefore, the indicated temporary losses are not a result of permanent credit impairment. Mortgage-backed investment securities, which are the primary component of the unrealized losses in the investment securities portfolio at those dates, are primarily comprised of securities issued by the Federal National Mortgage Association (FNMA), Federal Home Loan Mortgage Corporation (FHLMC) and Government National Mortgage Association (GNMA).
53
Our investment portfolio consists primarily of securities backed or guaranteed by FNMA or FHLMC. For all non government or agency securities, we complete reviews for other than temporary impairment at least quarterly. As of December 31, 2007, our investment securities portfolio consists of all AAA rated securities. Investment securities which carry a AAA rating are judged to be of the best quality and carry the smallest degree of investment risk. We expect to receive full payment of interest and principal on the securities in the investment portfolio. The various protective elements on our non agency securities may change in the future if market conditions or the financial stability of credit insurers changes, which could impact the ratings of our securities.
Of the $33.7 million in our municipal securities portfolio, $31.2 million remain AAA rated while approximately $2.5 million were downgraded to single A status after December 31, 2007, due to the downgrades of the monoline insurance companies that insured those bonds. These bonds remain unlimited general obligations of the municipalities.
Investment securities increased to $329.3 million at December 31, 2006, from $294.2 million at December 31, 2005. At December 31, 2006, $97.7 million were classified as held-to-maturity, and $231.6 million were classified as available-for-sale. The yield on the available-for-sale investment portfolio was 4.73%, and the yield on the held-to-maturity portfolio was 4.28% at December 31, 2006.
The following table reflects the composition of the investment portfolio at December 31, 2007, 2006, and 2005.
Table 11.
Investment Securities
At December 31, 2007, 2006, and 2005
(In thousands)
Available-for-sale at December 31, 2007
| | Amortized
Cost
| | Fair
Value
| | Average
Yield
| |
|---|
| U.S. government-sponsored agencies | | | | | | | | | |
| | One to five years | | $ | 44,160 | | $ | 44,161 | | 5.59 | % |
| | Five to ten years | | | 39,116 | | | 39,850 | | 5.99 | |
| | |
| |
| |
| |
| | | | Total U.S. government-sponsored agencies | | | 83,276 | | | 84,011 | | 5.78 | |
| | |
| |
| |
| |
| Mortgage-backed securities(1) | | | | | | | | | |
| | One to five years | | | 3,552 | | | 3,526 | | 4.25 | |
| | Five to ten years | | | 10,902 | | | 10,746 | | 3.89 | |
| | After ten years | | | 154,435 | | | 153,912 | | 5.13 | |
| | |
| |
| |
| |
| | | | Total mortgage-backed securities | | | 168,889 | | | 168,184 | | 5.03 | |
| | |
| |
| |
| |
| Municipal securities(2) | | | | | | | | | |
| | After ten years | | | 33,671 | | | 33,219 | | 4.09 | |
| | |
| |
| |
| |
| | | | Total municipal securities | | | 33,671 | | | 33,219 | | 4.09 | |
| | |
| |
| |
| |
| U.S. treasury securities | | | | | | | | | |
| | One to five years | | | 592 | | | 584 | | 4.09 | |
| | |
| |
| |
| |
| | | | Total U.S. treasury securities | | | 592 | | | 584 | | 4.09 | |
| | |
| |
| |
| |
| | | | Total investment securities available-for-sale | | $ | 286,428 | | $ | 285,998 | | 5.14 | % |
| | |
| |
| |
| |
54
Held-to-maturity at December 31, 2007
| | Amortized
Cost
| | Fair
Value
| | Average
Yield
| |
|---|
| U.S. government-sponsored agencies | | | | | | | | | |
| | One to five years | | $ | 6,500 | | $ | 6,468 | | 3.63 | % |
| | Five to ten years | | | 11,011 | | | 10,998 | | 4.52 | |
| | After ten years | | | 2,000 | | | 2,002 | | 5.30 | |
| | |
| |
| |
| |
| | | | Total U.S. government-sponsored agencies | | | 19,511 | | | 19,468 | | 4.30 | |
| | |
| |
| |
| |
| Mortgage-backed securities(1) | | | | | | | | | |
| | One to five years | | | 379 | | | 383 | | 4.71 | |
| | Five to ten years | | | 7,618 | | | 7,555 | | 4.29 | |
| | After ten years | | | 43,436 | | | 43,133 | | 4.52 | |
| | |
| |
| |
| |
| | | | Total mortgage-backed securities | | | 51,433 | | | 51,071 | | 4.49 | |
| | |
| |
| |
| |
| Corporate bonds | | | | | | | | | |
| | After ten years | | | 8,004 | | | 7,629 | | 4.56 | |
| | |
| |
| |
| |
| | | | Total corporate bonds | | | 8,004 | | | 7,629 | | 4.56 | |
| | |
| |
| |
| |
| | | | Total investment securities held-to-maturity | | | 78,948 | | | 78,168 | | 4.45 | |
| | |
| |
| |
| |
| | | | Total investment securities | | $ | 365,376 | | $ | 364,166 | | 4.99 | % |
| | |
| |
| |
| |
Available-for-sale at December 31, 2006
| | Amortized
Cost
| | Fair
Value
| | Average
Yield
| |
|---|
| U.S. government-sponsored agencies | | | | | | | | | |
| | One to five years | | $ | 51,973 | | $ | 51,517 | | 4.90 | % |
| | Five to ten years | | | 15,520 | | | 15,480 | | 5.72 | |
| | |
| |
| |
| |
| | | | Total U.S. government-sponsored agencies | | | 67,493 | | | 66,997 | | 5.09 | |
| | |
| |
| |
| |
| Mortgage-backed securities(1) | | | | | | | | | |
| | One to five years | | | 4,406 | | | 4,312 | | 4.18 | |
| | Five to ten years | | | 10,599 | | | 10,291 | | 3.76 | |
| | After ten years | | | 127,197 | | | 124,511 | | 4.76 | |
| | |
| |
| |
| |
| | | | Total mortgage-backed securities | | | 142,202 | | | 139,114 | | 4.67 | |
| | |
| |
| |
| |
| Municipal securities(2) | | | | | | | | | |
| | After ten years | | | 25,047 | | | 25,031 | | 4.10 | |
| | |
| |
| |
| |
| | | | Total municipal securities | | | 25,047 | | | 25,031 | | 4.10 | |
| | |
| |
| |
| |
| U.S. treasury securities | | | | | | | | | |
| | One to five years | | | 489 | | | 489 | | 5.14 | |
| | |
| |
| |
| |
| | | | Total U.S. treasury securities | | | 489 | | | 489 | | 5.14 | |
| | |
| |
| |
| |
| | | | Total investment securities available-for-sale | | $ | 235,231 | | $ | 231,631 | | 4.73 | % |
| | |
| |
| |
| |
55
Held-to-maturity at December 31, 2006
| | Amortized
Cost
| | Fair
Value
| | Average
Yield
| |
|---|
| U.S. government-sponsored agencies | | | | | | | | | |
| | One to five years | | $ | 8,967 | | $ | 8,734 | | 3.50 | % |
| | Five to ten years | | | 13,018 | | | 12,777 | | 4.44 | |
| | After ten years | | | 2,000 | | | 1,971 | | 5.30 | |
| | |
| |
| |
| |
| | | | Total U.S. government-sponsored agencies | | | 23,985 | | | 23,482 | | 4.16 | |
| | |
| |
| |
| |
| Mortgage-backed securities(1) | | | | | | | | | |
| | Five to ten years | | | 6,702 | | | 6,544 | | 4.21 | |
| | After ten years | | | 58,974 | | | 57,560 | | 4.35 | |
| | |
| |
| |
| |
| | | | Total mortgage-backed securities | | | 65,676 | | | 64,104 | | 4.34 | |
| | |
| |
| |
| |
| Corporate bonds | | | | | | | | | |
| | After ten years | | | 8,004 | | | 7,864 | | 4.21 | |
| | |
| |
| |
| |
| | | | Total corporate bonds | | | 8,004 | | | 7,864 | | 4.21 | |
| | |
| |
| |
| |
| | | | Total investment securities held-to-maturity | | | 97,665 | | | 95,450 | | 4.28 | |
| | |
| |
| |
| |
| | | | Total investment securities | | $ | 332,896 | | $ | 327,081 | | 4.60 | % |
| | |
| |
| |
| |
Available-for-sale at December 31, 2005
| | Amortized
Cost
| | Fair
Value
| | Average
Yield
| |
|---|
| U.S. government-sponsored agencies | | | | | | | | | |
| | One to five years | | $ | 43,784 | | $ | 43,264 | | 4.79 | % |
| | Five to ten years | | | 15,175 | | | 15,147 | | 5.42 | |
| | |
| |
| |
| |
| | | | Total U.S. government-sponsored agencies | | | 58,959 | | | 58,411 | | 4.88 | |
| | |
| |
| |
| |
| Mortgage-backed securities(1) | | | | | | | | | |
| | One to five years | | | 5,441 | | | 5,269 | | 4.02 | |
| | Five to ten years | | | 8,980 | | | 8,678 | | 3.88 | |
| | After ten years | | | 108,309 | | | 104,613 | | 4.21 | |
| | |
| |
| |
| |
| | | | Total mortgage-backed securities | | | 122,730 | | | 118,560 | | 4.17 | |
| | |
| |
| |
| |
| U.S. treasury securities | | | | | | | | | |
| | One to five years | | | 2,015 | | | 1,984 | | 2.63 | |
| | |
| |
| |
| |
| | | | Total U.S. treasury securities | | | 2,015 | | | 1,984 | | 2.63 | |
| | |
| |
| |
| |
| | | | Total investment securities available-for-sale | | $ | 183,704 | | $ | 178,955 | | 4.38 | % |
| | |
| |
| |
| |
56
Held-to-maturity at December 31, 2005
| | Amortized
Cost
| | Fair
Value
| | Average
Yield
| |
|---|
| U.S. government-sponsored agencies | | | | | | | | | |
| | One to five years | | $ | 9,500 | | $ | 9,172 | | 3.52 | % |
| | Five to ten years | | | 13,020 | | | 12,698 | | 4.37 | |
| | After ten years | | | 3,000 | | | 2,936 | | 4.22 | |
| | |
| |
| |
| |
| | | | Total U.S. government-sponsored agencies | | | 25,520 | | | 24,806 | | 4.03 | |
| | |
| |
| |
| |
| Mortgage-backed securities(1) | | | | | | | | | |
| | Five to ten years | | | 7,662 | | | 7,470 | | 4.21 | |
| | After ten years | | | 74,082 | | | 71,937 | | 4.24 | |
| | |
| |
| |
| |
| | | | Total mortgage-backed securities | | | 81,744 | | | 79,407 | | 4.23 | |
| | |
| |
| |
| |
| Corporate bonds | | | | | | | | | |
| | After ten years | | | 8,005 | | | 7,812 | | 4.21 | |
| | |
| |
| |
| |
| Total corporate bonds | | | 8,005 | | | 7,812 | | 4.21 | |
| | |
| |
| |
| |
| | | | Total investment securities held-to-maturity | | | 115,269 | | | 112,025 | | 4.19 | |
| | |
| |
| |
| |
| | | | Total investment securities | | $ | 298,973 | | $ | 290,980 | | 4.31 | % |
| | |
| |
| |
| |
- (1)
- Based on contractual maturities.
- (2)
- Yields for our tax-exempt municipal securities are not reported on a tax-equivalent basis.
Deposits and Other Borrowed Funds
Total deposits were $1.10 billion at December 31, 2007, a decrease of $122.0 million, or 10.0%, from $1.22 billion at December 31, 2006. The decrease in our total deposit balances is primarily a result of losing high cost deposit balances of certain customers who were looking for increased yields on their funds. We chose during the third and fourth quarters of 2007 not to set premium tier pricing for our deposit products as part of our interest rate risk management strategy. At December 31, 2007, we had $10.0 million of brokered certificates of deposit, compared to $5.0 million at December 31, 2006.
Other borrowed funds, which primarily include fed funds purchased, repurchase agreements, FHLB advances and our payable to Cardinal Statutory Trust I, were $400.1 million at December 31, 2007, an increase of $205.4 million, from $194.6 million at December 31, 2006. The primary reason for the increase in other borrowed funds at December 31, 2007 was an increase in funding from advances from the Federal Home Loan Bank of Atlanta. Advances from the Federal Home Loan Bank of Atlanta were $233.5 million at December 31, 2007, compared to $122.7 million at December 31, 2006. Advances taken during 2007 were utilized primarily to leverage some of our larger commercial real estate fundings and to assist in financing the George Mason inventory of loans held for sale.
Other borrowed funds at each of December 31, 2007 and 2006, included $20.6 million payable to Cardinal Statutory Trust I, the issuer of our trust preferred securities. This debt had an interest rate of 7.39% and 7.76% at December 31, 2007 and 2006, respectively. In accordance with FIN No. 46,Consolidation of Variable Interest Entities, Cardinal Statutory Trust I is an unconsolidated entity as we are not the primary beneficiary of the trust.
57
At December 31, 2007, other borrowed funds also included $68.0 million in fed funds purchased, $66.8 million in customer repurchase agreements and $11.2 million borrowed under the Federal Reserve Treasury, Tax & Loan note option.
The following table reflects the short-term borrowings and other borrowed funds outstanding at December 31, 2007.
Table 12.
Short-Term Borrowings and Other Borrowed Funds
At December 31, 2007
(In thousands)
Short-term FHLB advances:
| |
|
|
| |
|
|---|
Advance Date
| | Term of Advance
| | Maturity or
Call Date
|
| Interest Rate
| | Amount
Outstanding
|
|---|
| Apr-05 | | 3 years | | Apr-08 | | 4.31 | % | $ | 5,000 |
| Apr-05 | | 3 years | | Apr-08 | | 4.08 | | | 5,000 |
| Jun-07 | | 1 year | | Jun-08 | | 4.40 | | | 2,000 |
| Jul-03 | | 5 years | | Jul-08 | | 2.29 | | | 1,458 |
| | | | | | |
| |
|
| Total short-term FHLB advances and weighted average rate | 4.02 | % | $ | 13,458 |
| | | | | | |
| |
|
Other short-term borrowed funds: |
|
|
|
|
| TT&L note option | 4.30 | % | $ | 11,175 |
| Customer repurchase agreements | 2.99 | | | 66,808 |
| Federal Funds Purchased | 4.13 | | | 68,000 |
| | | | | | |
| |
|
| Total other short-term borrowed funds and weighted average rate | 3.62 | % | $ | 145,983 |
| | | | | | |
| |
|
Other borrowed funds: |
|
|
|
|
| Trust preferred | 7.39 | % | $ | 20,619 |
| FHLB advances—long term | 4.21 | | | 220,000 |
| | | | | | |
| |
|
| Other borrowed funds and weighted average rate | 4.48 | % | $ | 240,619 |
| | | | | | |
| |
|
| Total other borrowed funds and weighted average rate | 4.15 | % | $ | 400,060 |
| | | | | | |
| |
|
Total deposits at December 31, 2006 were $1.22 billion compared to $1.07 billion at December 31, 2005, an increase of $149.0 million, or 13.9%. This growth is primarily attributable to the opening of two branch offices during 2006 and our promotional efforts. At December 31, 2006, we had $5.0 million of brokered certificates of deposit, compared to $9.8 million at December 31, 2005. Other borrowed funds increased $39.2 million to $194.6 million at December 31, 2006, from $155.4 million at December 31, 2005. The primary reason for the increase in other borrowed funds at December 31, 2006 was an increase in funding from advances from the Federal Home Loan Bank of Atlanta which were used to primarily leverage certain of our larger commercial real estate deals and to assist in the financing of George Mason's inventory of loans held for sale.
58
The following table reflects the maturities of the certificates of deposit of $100,000 or more as of December 31, 2007, 2006, and 2005.
Table 13.
Certificates of Deposit of $100,000 or More
At December 31, 2007, 2006, and 2005
(In thousands)
| | 2007
|
|---|
Maturities:
| | Fixed Term
| | No-Penalty*
| | Total
|
|---|
| Three months or less | | $ | 113,430 | | $ | 11,140 | | $ | 124,570 |
| Over three months through six months | | | 27,587 | | | 7,033 | | | 34,620 |
| Over six months through twelve months | | | 12,120 | | | 13,248 | | | 25,368 |
| Over twelve months | | | 22,314 | | | 731 | | | 23,045 |
| | |
| |
| |
|
| | | $ | 175,451 | | $ | 32,152 | | $ | 207,603 |
| | |
| |
| |
|
| | 2006
|
|---|
Maturities:
| | Fixed Term
| | No-Penalty*
| | Total
|
|---|
| Three months or less | | $ | 116,204 | | $ | 23,220 | | $ | 139,424 |
| Over three months through six months | | | 24,608 | | | 10,974 | | | 35,582 |
| Over six months through twelve months | | | 22,601 | | | 20,869 | | | 43,470 |
| Over twelve months | | | 43,530 | | | 774 | | | 44,304 |
| | |
| |
| |
|
| | | $ | 206,943 | | $ | 55,837 | | $ | 262,780 |
| | |
| |
| |
|
| | 2005
|
|---|
Maturities:
| | Fixed Term
| | No-Penalty*
| | Total
|
|---|
| Three months or less | | $ | 15,025 | | $ | 3,530 | | $ | 18,555 |
| Over three months through six months | | | 21,637 | | | 34,937 | | | 56,574 |
| Over six months through twelve months | | | 56,231 | | | 59,536 | | | 115,767 |
| Over twelve months | | | 58,390 | | | 34,341 | | | 92,731 |
| | |
| |
| |
|
| | | $ | 151,283 | | $ | 132,344 | | $ | 283,627 |
| | |
| |
| |
|
- *
- No-Penalty certificates of deposit can be redeemed at anytime at the request of the depositor.
Business Segment Operations
We provide banking and non-banking financial services and products through our subsidiaries. We operate in three business segments, commercial banking, mortgage banking and wealth management and trust services.
The commercial banking segment includes both commercial and consumer lending and provides customers such products as commercial loans, real estate loans, and other business financing and consumer loans. In addition, this segment also provides customers with various deposit products including demand deposit accounts, savings accounts and certificates of deposit.
The mortgage banking segment engages primarily in the origination and acquisition of residential mortgages for sale into the secondary market on a best efforts basis.
59
The wealth management and trust services segment provides investment and financial services to businesses and individuals, including financial planning, retirement/estate planning, trusts, estates, custody, investment management, escrows, and retirement plans. Wilson/Bennett has been included in this operating segment since the date of its acquisition on June 9, 2005. On February 9, 2006, we acquired certain fiduciary and other assets and assumed certain liabilities of FBR National Trust Company, formerly a subsidiary of Friedman, Billings, Ramsey Group, Inc.
Information about the reportable segments, and reconciliation of this information to the consolidated financial statements at December 31, 2007, 2006, and 2005 follows.
Table 14.
Segment Reporting
December 31, 2007, 2006, and 2005
(In thousands)
At and for the Year Ended December 31, 2007:
| | Commercial
Banking
| | Mortgage
Banking
| | Wealth
Management
and
Trust Services
| | Other
| | Intersegment
Elimination
| | Consolidated
|
|---|
| Net interest income | | $ | 38,707 | | $ | 3,005 | | $ | — | | $ | (1,393 | ) | $ | — | | $ | 40,319 |
| Provision for loan losses | | | 2,548 | | | — | | | — | | | — | | | — | | | 2,548 |
| Non-interest income | | | 4,032 | | | 11,112 | | | 4,287 | | | 49 | | | — | | | 19,480 |
| Non-interest expense | | | 30,316 | | | 11,587 | | | 7,096 | | | 2,885 | | | — | | | 51,884 |
| Provision for income taxes | | | 2,470 | | | 907 | | | (979 | ) | | (1,513 | ) | | — | | | 885 |
| | |
| |
| |
| |
| |
| |
|
| Net income (loss) | | $ | 7,405 | | $ | 1,623 | | $ | (1,830 | ) | $ | (2,716 | ) | $ | — | | $ | 4,482 |
| | |
| |
| |
| |
| |
| |
|
Total Assets |
|
$ |
1,663,834 |
|
$ |
184,602 |
|
$ |
3,893 |
|
$ |
176,366 |
|
$ |
(338,664 |
) |
$ |
1,690,031 |
At and for the Year Ended December 31, 2006:
| | Commercial
Banking
| | Mortgage
Banking
| | Wealth
Management
and
Trust Services
| | Other
| | Intersegment
Elimination
| | Consolidated
|
|---|
| Net interest income | | $ | 38,091 | | $ | 4,344 | | $ | — | | $ | (1,081 | ) | $ | — | | $ | 41,354 |
| Provision for loan losses | | | 1,232 | | | — | | | — | | | — | | | — | | | 1,232 |
| Non-interest income | | | 4,415 | | | 13,892 | | | 3,330 | | | 47 | | | — | | | 21,684 |
| Non-interest expense | | | 27,127 | | | 15,241 | | | 6,591 | | | 2,286 | | | — | | | 51,245 |
| Provision for income taxes | | | 4,571 | | | 1,060 | | | (1,307 | ) | | (1,151 | ) | | — | | | 3,173 |
| | |
| |
| |
| |
| |
| |
|
| Net income (loss) | | $ | 9,576 | | $ | 1,935 | | $ | (1,954 | ) | $ | (2,169 | ) | $ | — | | $ | 7,388 |
| | |
| |
| |
| |
| |
| |
|
Total Assets |
|
$ |
1,572,051 |
|
$ |
360,470 |
|
$ |
5,500 |
|
$ |
163,879 |
|
$ |
(463,471 |
) |
$ |
1,638,429 |
60
At and for the Year Ended December 31, 2005:
| | Commercial
Banking
| | Mortgage
Banking
| | Wealth
Management
and
Trust Services
| | Other
| | Intersegment
Elimination
| | Consolidated
|
|---|
| Net interest income | | $ | 32,171 | | $ | 6,203 | | $ | — | | $ | (891 | ) | $ | — | | $ | 37,483 |
| Provision for loan losses | | | 2,456 | | | — | | | — | | | — | | | — | | | 2,456 |
| Non-interest income | | | 1,964 | | | 21,255 | | | 1,367 | | | 83 | | | — | | | 24,669 |
| Non-interest expense | | | 23,802 | | | 17,332 | | | 1,422 | | | 2,097 | | | — | | | 44,653 |
| Provision for income taxes | | | 2,764 | | | 3,413 | | | (56 | ) | | (954 | ) | | — | | | 5,167 |
| | |
| |
| |
| |
| |
| |
|
| Net income (loss) | | $ | 5,113 | | $ | 6,713 | | $ | 1 | | $ | (1,951 | ) | $ | — | | $ | 9,876 |
| | |
| |
| |
| |
| |
| |
|
Total Assets |
|
$ |
1,387,504 |
|
$ |
376,618 |
|
$ |
6,882 |
|
$ |
160,856 |
|
$ |
(479,573 |
) |
$ |
1,452,287 |
During the third quarter of 2007, we recorded a loss of $3.5 million pretax ($2.3 million after tax) from our escrow arrangement with Liberty Growth Fund, LP. This loss was recorded in our wealth management and trust services segment.
During the third quarter of 2006, we recorded a non-cash impairment loss of $2.9 million pretax ($1.9 million after tax) in our wealth management and trust services segment.
Capital Resources
Capital adequacy is an important measure of financial stability and performance. Our objectives are to maintain a level of capitalization that is sufficient to sustain asset growth and promote depositor and investor confidence.
Regulatory agencies measure capital adequacy utilizing a formula that takes into account the individual risk profile of a financial institution. The guidelines define capital as both Tier 1 (which includes common shareholders' equity, defined to include certain debt obligations) and Tier 2 (to include certain other debt obligations and a portion of the allowance for loan losses and 45% of unrealized gains in equity securities).
Shareholders' equity at December 31, 2007 was $159.5 million, an increase of $3.6 million, compared to $155.9 million at December 31, 2006. The increase in shareholders' equity was primarily attributable to net income of $4.5 million for the year ended December 31, 2007 and increases in other comprehensive income of $1.8 million for the year ended December 31, 2007. These increases were offset by repurchases of our common stock totaling $2.7 million for the year. Total shareholders' equity to total assets at December 31, 2007 and 2006 was 9.4% and 9.5%, respectively. Book value per share at December 31, 2007 and 2006 was $6.59 and $6.37, respectively. Total risk-based capital to risk-weighted assets was 12.98% at December 31, 2007 compared to 14.06% at December 31, 2006. Accordingly, we were considered "well capitalized" for regulatory purposes at December 31, 2007, as we were at December 31, 2006.
Shareholders' equity at December 31, 2006 was $155.9 million, an increase of $8.0 million, compared to $147.9 million at December 31, 2005. The increase in shareholders' equity was primarily attributable to recorded net income of $7.4 million for the year ended December 31, 2006. Total shareholders' equity to total assets at December 31, 2006 and 2005 was 9.5% and 10.2%, respectively. Book value per share at December 31, 2006 and 2005 was $6.37 and $6.07, respectively. Total risk-based capital to risk-weighted assets was 14.06% at December 31, 2006 compared to 15.65% at December 31, 2005. Accordingly, we were considered "well capitalized" for regulatory purposes at December 31, 2006, as we were at December 31, 2005.
61
As noted above, regulatory capital levels for the bank and bank holding company meet those established for well-capitalized institutions. While we are currently considered well-capitalized, we may from time-to-time find it necessary to access the capital markets to meet our growth objectives or capitalize on specific business opportunities.
The following table shows the minimum capital requirements and our capital position at December 31, 2007, 2006, and 2005, for the Company and for the Bank.
Table 15.
Capital Components
At December 31, 2007, 2006, and 2005
(In thousands)
| | Actual
| | For Capital
Adequacy Purposes
| | To Be Well
Capitalized Under
Prompt Corrective
Action Provisions
|
|---|
Cardinal Financial Corporation (Consolidated):
| | Amount
| | Ratio
| | Amount
| | Ratio
| | Amount
| | Ratio
|
|---|
|
|
|
|
|
|
|
|
|
|
|
|
|
|
|
|
| At December 31, 2007 | | | | | | | | | | | | | | | |
| Total risk-based capital/ Total capital to risk-weighted assets | | $ | 174,523 | | 12.98% | | $ | 107,569 | ³ | 8.00% | | $ | 134,461 | ³ | 10.00% |
| Tier I capital/ Tier I capital to risk-weighted assets | | | 162,691 | | 12.10 | | | 53,785 | ³ | 4.00 | | | 80,677 | ³ | 6.00 |
| Tier I capital/ Total capital to average assets | | | 162,691 | | 10.26 | | | 63,456 | ³ | 4.00 | | | 79,320 | ³ | 5.00 |
At December 31, 2006 |
|
|
|
|
|
|
|
|
|
|
|
|
|
|
|
| Total risk-based capital/ Total capital to risk-weighted assets | | $ | 170,457 | | 14.06% | | $ | 97,010 | ³ | 8.00% | | $ | 121,263 | ³ | 10.00% |
| Tier I capital/ Tier I capital to risk-weighted assets | | | 160,656 | | 13.25 | | | 48,505 | ³ | 4.00 | | | 72,758 | ³ | 6.00 |
| Tier I capital/ Total capital to average assets | | | 160,656 | | 10.68 | | | 60,180 | ³ | 4.00 | | | 75,225 | ³ | 5.00 |
At December 31, 2005 |
|
|
|
|
|
|
|
|
|
|
|
|
|
|
|
| Total risk-based capital/ Total capital to risk-weighted assets | �� | $ | 159,155 | | 15.65% | | $ | 81,334 | ³ | 8.00% | | $ | 101,668 | ³ | 10.00% |
| Tier I capital/ Tier I capital to risk-weighted assets | | | 150,742 | | 14.83 | | | 40,667 | ³ | 4.00 | | | 61,001 | ³ | 6.00 |
| Tier I capital/ Total capital to average assets | | | 150,742 | | 10.71 | | | 56,308 | ³ | 4.00 | | | 70,386 | ³ | 5.00 |
| | Actual
| | For Capital
Adequacy Purposes
| | To Be Well
Capitalized Under
Prompt Corrective
Action Provisions
|
|---|
Cardinal Bank:
| | Amount
| | Ratio
| | Amount
| | Ratio
| | Amount
| | Ratio
|
|---|
|
|
|
|
|
|
|
|
|
|
|
|
|
|
|
|
| At December 31, 2007 | | | | | | | | | | | | | | | |
| Total risk-based capital/ Total capital to risk-weighted assets | | $ | 159,745 | | 11.91% | | $ | 107,308 | ³ | 8.00% | | $ | 134,135 | ³ | 10.00% |
| Tier I capital/ Tier I capital to risk-weighted assets | | | 147,913 | | 11.03 | | | 53,654 | ³ | 4.00 | | | 80,481 | ³ | 6.00 |
| Tier I capital/ Total capital to average assets | | | 147,913 | | 9.34 | | | 63,331 | ³ | 4.00 | | | 79,163 | ³ | 5.00 |
At December 31, 2006 |
|
|
|
|
|
|
|
|
|
|
|
|
|
|
|
| Total risk-based capital/ Total capital to risk-weighted assets | | $ | 141,885 | | 11.73% | | $ | 96,742 | ³ | 8.00% | | $ | 120,927 | ³ | 10.00% |
| Tier I capital/ Tier I capital to risk-weighted assets | | | 132,084 | | 10.92 | | | 48,371 | ³ | 4.00 | | | 72,556 | ³ | 6.00 |
| Tier I capital/ Total capital to average assets | | | 132,084 | | 8.80 | | | 60,038 | ³ | 4.00 | | | 75,048 | ³ | 5.00 |
At December 31, 2005 |
|
|
|
|
|
|
|
|
|
|
|
|
|
|
|
| Total risk-based capital/ Total capital to risk-weighted assets | | $ | 129,042 | | 12.73% | | $ | 81,097 | ³ | 8.00% | | $ | 101,372 | ³ | 10.00% |
| Tier I capital/ Tier I capital to risk-weighted assets | | | 120,628 | | 11.90 | | | 40,549 | ³ | 4.00 | | | 60,823 | ³ | 6.00 |
| Tier I capital/ Total capital to average assets | | | 120,628 | | 8.61 | | | 56,014 | ³ | 4.00 | | | 70,018 | ³ | 5.00 |
62
Liquidity
Liquidity in the banking industry is defined as the ability to meet the demand for funds of both depositors and borrowers. We must be able to meet these needs by obtaining funding from depositors or other lenders or by converting non-cash items into cash. The objective of our liquidity management program is to ensure that we always have sufficient resources to meet the demands of our depositors and borrowers. Stable core deposits and a strong capital position provide the base for our liquidity position. We believe we have demonstrated our ability to attract deposits because of our convenient branch locations, personal service and pricing.
In addition to deposits, we have access to the different wholesale funding markets. These markets include the brokered CD market, the repurchase agreement market and the federal funds market. We also maintain secured lines of credit with the Federal Reserve Bank of Richmond and the Federal Home Loan Bank of Atlanta. Having diverse funding alternatives reduces our reliance on any one source for funding.
Cash flow from amortizing assets or maturing assets can also provide funding to meet the needs of depositors and borrowers.
We have established a formal liquidity contingency plan which establishes a liquidity management team and provides guidelines for liquidity management. For our liquidity management program, we first determine our current liquidity position and then forecast liquidity based on anticipated changes in the balance sheet. In this forecast, we expect to maintain a liquidity cushion. We also stress test our liquidity position under several different stress scenarios. Guidelines for the forecasted liquidity cushion and for liquidity cushions for each stress scenario have been established. In addition, one stress test combines all other stress tests to see how liquidity would react to several negative scenarios occurring at the same time. We believe that we have sufficient resources to meet our liquidity needs.
In October 2007, George Mason and the Bank cancelled its one year $150 million floating rate revolving credit and security agreement with a third party. The purpose of this credit facility was to fund residential mortgage loans made by George Mason prior to their sale into the secondary market. However, we determined that as a result of the limited use of this credit facility and the available liquidity at the Bank, this credit facility was no longer needed.
In addition to this facility, this same lender had also provided a $100 million facility that was utilized by George Mason to warehouse residential mortgage loans held for sale to this lender. Again, this credit facility was cancelled in October 2007 as a result of the limited use by George Mason of this facility and the available liquidity at the Bank.
Liquid assets, which include cash and due from banks, federal funds sold and investment securities available for sale, totaled $308.4 million at December 31, 2007, or 18.3% of total assets. We held investments that are classified as held-to-maturity in the amount of $78.9 million at December 31, 2007. To maintain ready access to the Bank's secured lines of credit, the Bank has pledged roughly a third of its securities to the Federal Home Loan Bank of Atlanta with additional securities pledged to the Federal Reserve Bank of Richmond. Additional borrowing capacity at the Federal Home Loan Bank of Atlanta at December 31, 2007 was approximately $122.7 million. Borrowing capacity with the Federal Reserve Bank of Richmond was approximately $39.7 million at December 31, 2007. We anticipate maintaining liquidity at a level sufficient to protect depositors, provide for reasonable growth and fully comply with all regulatory requirements.
Contractual Obligations
We have entered into a number of long-term contractual obligations to support our ongoing activities. These contractual obligations will be funded through operating revenues and liquidity sources
63
held or available to us. The required payments under such obligations excluding interest were as follows:
Table 16.
Contractual Obligations
At December 31, 2007
(In thousands)
| |
| | Payments Due by Period
|
|---|
| | Total
| | Less than
1 Year
| | 1 - 3 Years
| | 3 - 5 Years
| | More than
5 Years
|
|---|
| Long-Term Debt Obligations: | | | | | | | | | | | | | | | |
| | Certificates of deposit | | $ | 443,213 | | $ | 387,921 | | $ | 52,167 | | $ | 3,125 | | $ | — |
| | Brokered certificates of deposit | | | 9,957 | | | 4,999 | | | 4,958 | | | — | | | — |
| | Advances from the Federal Home Loan Bank of Atlanta | | | 233,458 | | | 13,458 | | | — | | | 90,000 | | | 130,000 |
| | Trust preferred securities | | | 20,619 | | | — | | | — | | | — | | | 20,619 |
| Operating lease obligations | | | 17,139 | | | 4,845 | | | 3,240 | | | 5,345 | | | 3,709 |
| | |
| |
| |
| |
| |
|
| Total | | $ | 724,386 | | $ | 411,223 | | $ | 60,365 | | $ | 98,470 | | $ | 154,328 |
| | |
| |
| |
| |
| |
|
Financial Instruments with Off-Balance-Sheet Risk and Credit Risk
We are a party to financial instruments with off-balance-sheet risk in the normal course of business to meet the financing needs of our customers. These financial instruments include commitments to extend credit and standby letters of credit. Those instruments involve, to varying degrees, elements of credit risk in excess of the amount recognized in the balance sheet.
The Bank's exposure to credit loss in the event of nonperformance by the other party to the financial instrument for commitments to extend credit and standby letters of credit is represented by the contractual amount of those instruments. The Bank uses the same credit policies in making commitments and conditional obligations as it does for on-balance-sheet instruments.
We have derivative counter-party risk which may arise from the possible inability of George Mason's third-party investors to meet the terms of their forward sales contracts. George Mason works with third-party investors that are generally well-capitalized, are investment grade and exhibit strong financial performance to mitigate this risk. We do not expect any third-party investor to fail to meet its obligation.
George Mason maintains a reserve for loans sold that pay off earlier than the contractual agreed upon period, thereby requiring that George Mason refund part of the service release premium and/or premium pricing received from the investor. The reserve as of December 31, 2007 and 2006 was $23,000 and $57,000, respectively. In addition, as of December 31, 2007, George Mason has established a reserve of $100,000 for possible repurchases of loans previously sold to investors for which borrowers failed to provide full and accurate information on or related to their loan application or for which appraisals have not been acceptable. During 2007, George Mason either repurchased from or settled with investors on seven such loans. Our total expense associated with these loans was $347,000. No such reserve existed at December 31, 2006.
George Mason, as part of the service it provides to its managed companies, purchases the loans managed companies originate at the time of origination. These loans are then sold by George Mason to investors. George Mason has agreements with its managed companies requiring that, for any loans that were originated by a managed company and for which investors have requested George Mason to
64
repurchase due to the borrowers failure to provide full and accurate information on or related to their loan application or for which appraisals have not been acceptable, the managed company be responsible for buying back the loan. In the event that the managed company's financial condition deteriorates and it is unable to fund the repurchase of such loans, George Mason may have to provide the funds to repurchase these loans from investors. As of December 31, 2007, we do not believe we were obligated to fund any repurchased loans that were originated by a managed company.
A summary of the contract amount of the Bank's exposure to off-balance-sheet risk as of December 31, 2007 and 2006, is as follows:
| | 2007
| | 2006
|
|---|
| | (In thousands)
|
|---|
| Financial instruments whose contract amounts represent potential credit risk: | | | | | | |
| | Commitments to extend credit | | $ | 359,321 | | $ | 372,154 |
| | Standby letters of credit | | | 10,166 | | | 8,097 |
Commitments to extend credit of $29.5 million as of December 31, 2007 were related to George Mason's pipeline and were of a short term nature.
Commitments to extend credit are agreements to lend to a customer as long as there is no violation of any condition established in the contract. Commitments generally have fixed expiration dates or other termination clauses and may require payment of a fee. Since many of the commitments are expected to expire without being drawn upon, the total commitment amounts do not necessarily represent future cash requirements. We evaluate each customer's credit worthiness on a case-by-case basis. The amount of collateral obtained is based on management's credit evaluation of the counterparty. Collateral held varies but may include accounts receivable, inventory, property and equipment, and income-producing commercial properties.
Unfunded commitments under lines of credit are commitments for possible future extensions of credit to existing customers. Those lines of credit may not be drawn upon to the total extent to which we have committed.
Standby letters of credit are conditional commitments we issued to guarantee the performance of a customer to a third party. Those guarantees are primarily issued to support public and private borrowing arrangements, including commercial paper, bond financing, and similar transactions. The credit risk involved in issuing letters of credit is essentially the same as that involved in extending loan facilities to customers. We hold certificates of deposit, deposit accounts, and real estate as collateral supporting those commitments for which collateral is deemed necessary.
Quarterly Data
The following table provides quarterly data for the years ended December 31, 2007 and 2006. Quarterly per share results may not calculate to the year-end per share results due to rounding.
During the third quarter of 2007, we recorded a loss of $3.5 million pretax and $2.3 million after tax from our escrow arrangement with Liberty Growth Fund, LP. This loss was recorded in our wealth management and trust services segment.
During the third quarter of 2006, we recorded a non-cash impairment loss totaling $2.9 million pretax and $1.9 million after tax in our wealth management and trust services segment.
65
Table 17.
Quarterly Data
Years ended December 31, 2007 and 2006
(In thousands, except per share data)
| | 2007
| |
|---|
| | Fourth
Quarter
| | Third
Quarter
| | Second
Quarter
| | First
Quarter
| |
|---|
| Interest income | | $ | 24,105 | | $ | 25,545 | | $ | 25,048 | | $ | 23,945 | |
| Interest expense | | | 14,187 | | | 15,212 | | | 14,816 | | | 14,109 | |
| | |
| |
| |
| |
| |
| Net interest income | | | 9,918 | | | 10,333 | | | 10,232 | | | 9,836 | |
| Provision for loan losses | | | (878 | ) | | (915 | ) | | (475 | ) | | (280 | ) |
| | |
| |
| |
| |
| |
| Net interest income after provision for loan losses | | | 9,040 | | | 9,418 | | | 9,757 | | | 9,556 | |
| Non-interest income | | | 4,119 | | | 4,743 | | | 5,309 | | | 5,309 | |
| Non-interest expense | | | 11,743 | | | 15,469 | | | 12,308 | | | 12,364 | |
| | |
| |
| |
| |
| |
| Net income before income taxes | | | 1,416 | | | (1,308 | ) | | 2,758 | | | 2,501 | |
| Provision expense (benefit) for income taxes | | | 34 | | | (702 | ) | | 816 | | | 737 | |
| | |
| |
| |
| |
| |
| Net income (loss) | | $ | 1,382 | | $ | (606 | ) | $ | 1,942 | | $ | 1,764 | |
| | |
| |
| |
| |
| |
| Less nonrecurring items, after tax | | | | | | | | | | | | | |
| | Loss related to escrow arrangement | | | — | | | 2,293 | | | — | | | — | |
| | Legal expenses related to escrow arrangement | | | 129 | | | 229 | | | — | | | — | |
| | |
| |
| |
| |
| |
| Net income without recurring items | | $ | 1,511 | | $ | 1,916 | | $ | 1,942 | | $ | 1,764 | |
| | |
| |
| |
| |
| |
| Earnings (loss) per share—basic | | $ | 0.06 | | $ | (0.02 | ) | $ | 0.08 | | $ | 0.07 | |
| | |
| |
| |
| |
| |
| Earnings (loss) per share—diluted | | $ | 0.06 | | $ | (0.02 | ) | $ | 0.08 | | $ | 0.07 | |
| | |
| |
| |
| |
| |
| Less nonrecurring items, after tax | | | | | | | | | | | | | |
| | Loss related to escrow arrangement | | | — | | | 0.09 | | | — | | | — | |
| | Legal expenses related to escrow arrangement | | | — | | | 0.01 | | | — | | | — | |
| | |
| |
| |
| |
| |
| Earnings per share—basic, without recurring items | | $ | 0.06 | | $ | 0.08 | | $ | 0.08 | | $ | 0.07 | |
| | |
| |
| |
| |
| |
| Earnings per share—diluted, without recurring items | | $ | 0.06 | | $ | 0.08 | | $ | 0.08 | | $ | 0.07 | |
| | |
| |
| |
| |
| |
66
| | 2006
| |
|---|
| | Fourth
Quarter
| | Third
Quarter
| | Second
Quarter
| | First
Quarter
| |
|---|
| Interest income | | $ | 23,125 | | $ | 22,866 | | $ | 21,700 | | $ | 19,710 | |
| Interest expense | | | 13,297 | | | 12,446 | | | 10,989 | | | 9,315 | |
| | |
| |
| |
| |
| |
| Net interest income | | | 9,828 | | | 10,420 | | | 10,711 | | | 10,395 | |
| Provision for loan losses | | | (362 | ) | | (230 | ) | | (390 | ) | | (250 | ) |
| | |
| |
| |
| |
| |
| Net interest income after provision for loan losses | | | 9,466 | | | 10,190 | | | 10,321 | | | 10,145 | |
| Non-interest income | | | 6,020 | | | 4,961 | | | 5,539 | | | 5,164 | |
| Non-interest expense | | | 12,320 | | | 15,045 | | | 12,448 | | | 11,432 | |
| | |
| |
| |
| |
| |
| Net income before income taxes | | | 3,166 | | | 106 | | | 3,412 | | | 3,877 | |
| Provision expense (benefit) for income taxes | | | 965 | | | (149 | ) | | 1,048 | | | 1,309 | |
| | |
| |
| |
| |
| |
| Net income | | $ | 2,201 | | $ | 255 | | $ | 2,364 | | $ | 2,568 | |
| | |
| |
| |
| |
| |
| Less nonrecurring items, after tax | | | | | | | | | | | | | |
| | Impairment of goodwill | | | — | | | 624 | | | — | | | — | |
| | Impairment of customer relationships intangible | | | — | | | 946 | | | — | | | — | |
| | Impairment of employment/non-compete agreement | | | — | | | 333 | | | — | | | — | |
| | |
| |
| |
| |
| |
| Net income without recurring items | | $ | 2,201 | | $ | 2,158 | | $ | 2,364 | | $ | 2,568 | |
| | |
| |
| |
| |
| |
| Earnings per share—basic | | $ | 0.09 | | $ | 0.01 | | $ | 0.10 | | $ | 0.11 | |
| | |
| |
| |
| |
| |
| Earnings per share—diluted | | $ | 0.09 | | $ | 0.01 | | $ | 0.09 | | $ | 0.10 | |
| | |
| |
| |
| |
| |
| Less nonrecurring items, after tax | | | | | | | | | | | | | |
| | Impairment of goodwill | | | — | | | 0.03 | | | — | | | — | |
| | Impairment of customer relationships intangible | | | — | | | 0.04 | | | — | | | — | |
| | Impairment of employment/non-compete agreement | | | — | | | 0.01 | | | — | | | — | |
| | |
| |
| |
| |
| |
| Earnings per share—basic, without recurring items | | $ | 0.09 | | $ | 0.09 | | $ | 0.10 | | $ | 0.11 | |
| | |
| |
| |
| |
| |
| Earnings per share—diluted, without recurring items | | $ | 0.09 | | $ | 0.09 | | $ | 0.09 | | $ | 0.10 | |
| | |
| |
| |
| |
| |
67
Item 7A. Quantitative and Qualitative Disclosures About Market Risk
Our Asset/Liability Committee is responsible for reviewing our liquidity requirements and maximizing our net interest income consistent with capital requirements, liquidity, interest rate and economic outlooks, competitive factors and customer needs. Interest rate risk arises because the assets of the Bank and the liabilities of the Bank have different maturities and characteristics. In order to measure this interest rate risk, we use a simulation process that measures the impact of changing interest rates on net interest income. This model is run for the Bank by an independent consulting firm. The simulations incorporate assumptions related to expected activity in the balance sheet. For maturing assets, assumptions are developed for the redeployment of these assets. For maturing liabilities, assumptions are developed for the replacement of these funding sources. Assumptions are also developed for assets and liabilities that reprice during the modeled time period. These assumptions also cover how we expect rates to change on non-maturity deposits such as interest checking, money market checking, savings accounts as well as certificates of deposit. Based on inputs that include the most recent period end balance sheet, the current level of interest rates and the developed assumptions, the model then produces an expected level of net interest income assuming that interest rates remain unchanged. This becomes the base case. Next, the model determines the impact on net interest income given specified changes in interest rates. The rate simulations are performed for a two year period and include ramped rate changes of down 200 basis points and up 200 basis points. In the ramped down rate change, the model moves rates gradually down 200 basis points over the first year and then rates remain flat in the second year. For the up 200 basis point scenario, rates are gradually increased by 200 basis points in the first year and remain flat in the second year. In both the up and down scenarios, the model assumes a parallel shift in the yield curve. The results of these simulations are then compared to the base case.
At December 31, 2007, we were liability sensitive for the entire two year simulation period. Liability sensitive means that we have more liabilities repricing than assets. We have more of our liabilities in non-maturity or short-term deposit products than we have in floating rate assets. In a decreasing interest rate environment, net interest income would grow for a liability sensitive bank. In the down 200 basis point scenario, net interest income improves by not more than 8.2% for the one year period and by not more than 13.1% over the two year time horizon. In the up 200 basis point scenario, net interest income decreases by not less than 5.6% and by not less than 6.7% over the two year time horizon compared to the base case.
See also "Interest Rate Sensitivity" in Item 7 above for a discussion of our interest rate risk.
68
Item 8. Financial Statements and Supplementary Data
| | Page
|
|---|
| Reports of Independent Registered Public Accounting Firm | | 70 |
| Consolidated Statements of Condition | | 71 |
| Consolidated Statements of Income | | 72 |
| Consolidated Statements of Comprehensive Income | | 73 |
| Consolidated Statements of Changes in Shareholders' Equity | | 74 |
| Consolidated Statements of Cash Flows | | 75 |
| Notes to Consolidated Financial Statements | | 76 |
69
Report of Independent Registered Public Accounting Firm
The Board of Directors and Stockholders
Cardinal Financial Corporation:
We have audited the accompanying consolidated statements of condition of Cardinal Financial Corporation and subsidiaries (the Company) as of December 31, 2007 and 2006, and the related consolidated statements of income, comprehensive income, changes in shareholders' equity and cash flows for each of the years in the three-year period ended December 31, 2007. We also have audited the Company's internal control over financial reporting as of December 31, 2007, based on criteria established inInternal Control—Integrated Framework issued by the Committee of Sponsoring Organizations of the Treadway Commission (COSO). The Company's management is responsible for these consolidated financial statements, for maintaining effective internal control over financial reporting, and for its assessment of the effectiveness of internal control over financial reporting, included in the accompanying Management's Report on Internal Control over Financial Reporting. Our responsibility is to express an opinion on these consolidated financial statements and an opinion on the Company's internal control over financial reporting based on our audits.
We conducted our audits in accordance with the standards of the Public Company Accounting Oversight Board (United States). Those standards require that we plan and perform the audits to obtain reasonable assurance about whether the financial statements are free of material misstatement and whether effective internal control over financial reporting was maintained in all material respects. Our audits of the consolidated financial statements included examining, on a test basis, evidence supporting the amounts and disclosures in the financial statements, assessing the accounting principles used and significant estimates made by management, and evaluating the overall financial statement presentation. Our audit of internal control over financial reporting included obtaining an understanding of internal control over financial reporting, assessing the risk that a material weakness exists, and testing and evaluating the design and operating effectiveness of internal control based on the assessed risk. Our audits also included performing such other procedures as we considered necessary in the circumstances. We believe that our audits provide a reasonable basis for our opinions.
A company's internal control over financial reporting is a process designed to provide reasonable assurance regarding the reliability of financial reporting and the preparation of financial statements for external purposes in accordance with generally accepted accounting principles. A company's internal control over financial reporting includes those policies and procedures that (1) pertain to the maintenance of records that, in reasonable detail, accurately and fairly reflect the transactions and dispositions of the assets of the company; (2) provide reasonable assurance that transactions are recorded as necessary to permit preparation of financial statements in accordance with generally accepted accounting principles, and that receipts and expenditures of the company are being made only in accordance with authorizations of management and directors of the company; and (3) provide reasonable assurance regarding prevention or timely detection of unauthorized acquisition, use, or disposition of the company's assets that could have a material effect on the financial statements.
Because of its inherent limitations, internal control over financial reporting may not prevent or detect misstatements. Also, projections of any evaluation of effectiveness to future periods are subject to the risk that controls may become inadequate because of changes in conditions, or that the degree of compliance with the policies or procedures may deteriorate.
In our opinion, the consolidated financial statements referred to above present fairly, in all material respects, the financial position of the Company as of December 31, 2007 and 2006, and the results of its operations and its cash flows for each of the years in the three-year period ended December 31, 2007, in conformity with accounting principles generally accepted in the United States of America. Also in our opinion, the Company maintained, in all material respects, effective internal control over financial reporting as of December 31, 2007, based on criteria established inInternal Control—Integrated Framework issued by the Committee of Sponsoring Organizations of the Treadway Commission.
KPMG LLP
McLean, Virginia
March 17, 2008
70
CARDINAL FINANCIAL CORPORATION AND SUBSIDIARIES
CONSOLIDATED STATEMENTS OF CONDITION
December 31, 2007 and 2006
(In thousands, except share data)
| |
| |
| | 2007
| | 2006
| |
|---|
| Assets | | | | | | | | | | | |
| Cash and due from banks | | $ | 20,622 | | $ | 24,585 | |
| Federal funds sold | | | 1,799 | | | 11,491 | |
| | | | | | |
| |
| |
| | | | Total cash and cash equivalents | | | 22,421 | | | 36,076 | |
| Investment securities available-for-sale | | | 285,998 | | | 231,631 | |
| Investment securities held-to-maturity (market value of $78,168 and $95,450 at December 31, 2007 and December 31, 2006, respectively) | | | 78,948 | | | 97,665 | |
| | | | | | |
| |
| |
| | | | Total investment securities | | | 364,946 | | | 329,296 | |
| Other investments | | | 14,188 | | | 9,158 | |
| Loans held for sale | | | 170,487 | | | 338,731 | |
| Loans receivable, net of deferred fees and costs | | | 1,039,684 | | | 845,449 | |
| Allowance for loan losses | | | (11,641 | ) | | (9,638 | ) |
| | | | | | |
| |
| |
| | | | Loans receivable, net | | | 1,028,043 | | | 835,811 | |
| Premises and equipment, net | | | 18,463 | | | 20,039 | |
| Deferred tax asset | | | 6,638 | | | 6,415 | |
| Goodwill and intangibles, net | | | 17,239 | | | 17,493 | |
| Bank-owned life insurance | | | 32,316 | | | 30,646 | |
| Accrued interest receivable and other assets | | | 15,290 | | | 14,764 | |
| | | | | | |
| |
| |
| | | | Total assets | | $ | 1,690,031 | | $ | 1,638,429 | |
| | | | | | |
| |
| |
| Liabilities and Shareholders' Equity | | | | | | | |
| Non-interest bearing deposits | | $ | 123,994 | | $ | 123,301 | |
| Interest bearing deposits | | | 972,931 | | | 1,095,581 | |
| | | | | | |
| |
| |
| | | | | Total deposits | | | 1,096,925 | | | 1,218,882 | |
| Other borrowed funds | | | 400,060 | | | 194,631 | |
| Mortgage funding checks | | | 9,403 | | | 46,159 | |
| Escrow liabilities | | | 1,016 | | | 3,229 | |
| Accrued interest payable and other liabilities | | | 23,164 | | | 19,655 | |
| | | | | | |
| |
| |
| | | | Total liabilities | | | 1,530,568 | | | 1,482,556 | |
Common stock, $1 par value
|
|
2007
|
|
2006
|
|
|
|
|
|
|---|
| | Shares authorized | | 50,000,000 | | 50,000,000 | | | | | | | |
| | Shares issued and outstanding | | 24,201,561 | | 24,459,155 | | | 24,202 | | | 24,459 | |
| Additional paid-in capital | | | 131,516 | | | 132,985 | |
| Retained earnings | | | 4,213 | | | 705 | |
| Accumulated other comprehensive loss, net | | | (468 | ) | | (2,276 | ) |
| | | | | | |
| |
| |
| | | | Total shareholders' equity | | | 159,463 | | | 155,873 | |
| | | | | | |
| |
| |
| | | | Total liabilities and shareholders' equity | | $ | 1,690,031 | | $ | 1,638,429 | |
| | | | | | |
| |
| |
See accompanying notes to consolidated financial statements.
71
CARDINAL FINANCIAL CORPORATION AND SUBSIDIARIES
CONSOLIDATED STATEMENTS OF INCOME
Years Ended December 31, 2007, 2006, and 2005
(In thousands, except per share data)
| | 2007
| | 2006
| | 2005
|
|---|
| Interest income: | | | | | | | | | |
| | Loans receivable | | $ | 63,392 | | $ | 51,872 | | $ | 35,450 |
| | Loans held for sale | | | 16,686 | | | 19,288 | | | 19,379 |
| | Federal funds sold | | | 1,303 | | | 1,206 | | | 1,175 |
| | Investment securities available-for-sale | | | 12,905 | | | 10,306 | | | 6,195 |
| | Investment securities held-to-maturity | | | 3,722 | | | 4,351 | | | 4,914 |
| | Other investments | | | 635 | | | 378 | | | 261 |
| | |
| |
| |
|
| | | | Total interest income | | | 98,643 | | | 87,401 | | | 67,374 |
Interest expense: |
|
|
|
|
|
|
|
|
|
| | Deposits | | | 45,697 | | | 39,091 | | | 24,899 |
| | Other borrowed funds | | | 12,627 | | | 6,956 | | | 4,992 |
| | |
| |
| |
|
| | | | Total interest expense | | | 58,324 | | | 46,047 | | | 29,891 |
| | |
| |
| |
|
| | | | Net interest income | | | 40,319 | | | 41,354 | | | 37,483 |
| Provision for loan losses | | | 2,548 | | | 1,232 | | | 2,456 |
| | |
| |
| |
|
| | | | Net interest income after provision for loan losses | | | 37,771 | | | 40,122 | | | 35,027 |
Non-interest income: |
|
|
|
|
|
|
|
|
|
| | Service charges on deposit accounts | | | 1,988 | | | 1,593 | | | 1,334 |
| | Loan service charges | | | 1,502 | | | 2,177 | | | 2,701 |
| | Investment fee income | | | 4,287 | | | 3,330 | | | 1,417 |
| | Net gain on sales of loans | | | 8,779 | | | 10,059 | | | 15,975 |
| | Net realized gain on investment securities available-for-sale | | | — | | | 61 | | | 33 |
| | Management fee income | | | 1,072 | | | 2,221 | | | 3,032 |
| | Increase in cash surrender value of bank-owned life insurance | | | 1,670 | | | 646 | | | — |
| | Litigation recovery on previously impaired investment | | | 83 | | | 855 | | | — |
| | Other income | | | 99 | | | 742 | | | 177 |
| | |
| |
| |
|
| | | | Total non-interest income | | | 19,480 | | | 21,684 | | | 24,669 |
Non-interest expense: |
|
|
|
|
|
|
|
|
|
| | Salary and benefits | | | 23,815 | | | 24,616 | | | 22,480 |
| | Occupancy | | | 5,348 | | | 5,242 | | | 4,293 |
| | Professional fees | | | 2,095 | | | 2,149 | | | 2,212 |
| | Depreciation | | | 3,035 | | | 3,172 | | | 2,822 |
| | Data processing | | | 1,450 | | | 1,358 | | | 1,559 |
| | Telecommunications | | | 1,182 | | | 1,247 | | | 1,189 |
| | Loss related to escrow arrangement | | | 3,500 | | | — | | | — |
| | Amortization of intangibles | | | 254 | | | 420 | | | 409 |
| | Impairment of goowill and intangible assets | | | — | | | 2,927 | | | — |
| | Other operating expenses | | | 11,205 | | | 10,114 | | | 9,689 |
| | |
| |
| |
|
| | | | Total non-interest expense | | | 51,884 | | | 51,245 | | | 44,653 |
| | |
| |
| |
|
| | | | Net income before income taxes | | | 5,367 | | | 10,561 | | | 15,043 |
| Provision for income taxes | | | 885 | | | 3,173 | | | 5,167 |
| | |
| |
| |
|
| Net income | | $ | 4,482 | | $ | 7,388 | | $ | 9,876 |
| | |
| |
| |
|
| Earnings per common share—basic | | $ | 0.18 | | $ | 0.30 | | $ | 0.45 |
| | |
| |
| |
|
| Earnings per common share—diluted | | $ | 0.18 | | $ | 0.30 | | $ | 0.44 |
| | |
| |
| |
|
| Weighted-average common shares outstanding—basic | | | 24,606 | | | 24,424 | | | 22,113 |
| | |
| |
| |
|
| Weighted-average common shares outstanding—diluted | | | 25,012 | | | 24,987 | | | 22,454 |
| | |
| |
| |
|
See accompanying notes to consolidated financial statements.
72
CARDINAL FINANCIAL CORPORATION AND SUBSIDIARIES
CONSOLIDATED STATEMENTS OF COMPREHENSIVE INCOME
Years Ended December 31, 2007, 2006, and 2005
(In thousands)
| | 2007
| | 2006
| | 2005
| |
|---|
| Net income | | $ | 4,482 | | $ | 7,388 | | $ | 9,876 | |
| Other comprehensive income: | | | | | | | | | | |
| | Unrealized gain (loss) on available-for-sale investment securities: | | | | | | | | | | |
| | | Unrealized holding gain (loss) arising during the year, net of tax expense of $1,107 in 2007 and $390 in 2006 and net of tax benefit of $1,023 in 2005 | | | 2,084 | | | 741 | | | (1,974 | ) |
| | | Less: reclassification adjustment for gains included in net income net of tax expense of $21 in 2006, and $11 in 2005 | | | — | | | (40 | ) | | (22 | ) |
| | |
| |
| |
| |
| | | | 2,084 | | | 701 | | | (1,996 | ) |
| | |
| |
| |
| |
| | Unrealized gain (loss) on derivative instruments designated as cash flow hedges, net of tax benefit of $123 in 2007, net of tax expense of $105 in 2006 and net of tax benefit of $149 in 2005 | | | (276 | ) | | 348 | | | (288 | ) |
| | |
| |
| |
| |
| Comprehensive income | | $ | 6,290 | | $ | 8,437 | | $ | 7,592 | |
| | |
| |
| |
| |
See accompanying notes to consolidated financial statements.
73
CARDINAL FINANCIAL CORPORATION AND SUBSIDIARIES
CONSOLIDATED STATEMENTS OF CHANGES IN SHAREHOLDERS' EQUITY
Years Ended December 31, 2007, 2006, and 2005
(In thousands)
| | Common
Shares
| | Common
Stock
| | Additional
Paid-in
Capital
| | Retained
Earnings
(Deficit)
| | Accumulated
Other
Comprehensive
Income (Loss)
| | Total
| |
|---|
| Balance, December 31, 2004 | | 18,463 | | $ | 18,463 | | $ | 92,868 | | $ | (15,145 | ) | $ | (1,081 | ) | $ | 95,105 | |
| Stock options exercised | | 114 | | | 114 | | | 683 | | | — | | | — | | | 797 | |
| Public offering shares issued | | 5,175 | | | 5,175 | | | 34,592 | | | — | | | — | | | 39,767 | |
| Shares issued in acquisition | | 611 | | | 611 | | | 4,251 | | | — | | | — | | | 4,862 | |
| Dividends on common stock of $0.01 per share | | — | | | — | | | (244 | ) | | — | | | — | | | (244 | ) |
| Change in accumulated other comprehensive loss | | — | | | — | | | — | | | — | | | (2,284 | ) | | (2,284 | ) |
| Net income | | — | | | — | | | — | | | 9,876 | | | — | | | 9,876 | |
| | |
| |
| |
| |
| |
| |
| |
| Balance, December 31, 2005 | | 24,363 | | | 24,363 | | | 132,150 | | | (5,269 | ) | | (3,365 | ) | | 147,879 | |
| Cumulative effect at January 1, 2006, of change in method of quantifying errors | | — | | | — | | | 25 | | | (438 | ) | | — | | | (413 | ) |
| Stock options exercised | | 96 | | | 96 | | | 813 | | | — | | | — | | | 909 | |
| Payment of deferred compensation shares | | — | | | — | | | (3 | ) | | — | | | — | | | (3 | ) |
| Dividends on common stock of $0.04 per share | | — | | | — | | | — | | | (976 | ) | | — | | | (976 | ) |
| Change in accumulated other comprehensive loss | | — | | | — | | | — | | | — | | | 1,089 | | | 1,089 | |
| Net income | | — | | | — | | | — | | | 7,388 | | | — | | | 7,388 | |
| | |
| |
| |
| |
| |
| |
| |
| Balance, December 31, 2006 | | 24,459 | | | 24,459 | | | 132,985 | | | 705 | | | (2,276 | ) | | 155,873 | |
| Stock options exercised | | 21 | | | 21 | | | 91 | | | — | | | — | | | 112 | |
| Stock compensation expense, net of tax benefits | | — | | | — | | | 882 | | | — | | | — | | | 882 | |
| Payment of deferred compensation shares | | — | | | — | | | 4 | | | — | | | — | | | 4 | |
| Purchase and retirement of common stock | | (278 | ) | | (278 | ) | | (2,446 | ) | | — | | | — | | | (2,724 | ) |
| Dividends on common stock of $0.04 per share | | — | | | — | | | — | | | (974 | ) | | — | | | (974 | ) |
| Change in accumulated other comprehensive loss | | — | | | — | | | — | | | — | | | 1,808 | | | 1,808 | |
| Net income | | — | | | — | | | — | | | 4,482 | | | — | | | 4,482 | |
| | |
| |
| |
| |
| |
| |
| |
| Balance, December 31, 2007 | | 24,202 | | $ | 24,202 | | $ | 131,516 | | $ | 4,213 | | $ | (468 | ) | $ | 159,463 | |
| | |
| |
| |
| |
| |
| |
| |
See accompanying notes to consolidated financial statements.
74
CARDINAL FINANCIAL CORPORATION AND SUBSIDIARIES
CONSOLIDATED STATEMENTS OF CASH FLOWS
Years Ended December 31, 2007, 2006, and 2005
(In thousands)
| | 2007
| | 2006
| | 2005
| |
|---|
| Cash flows from operating activities: | | | | | | | | | | |
| | Net income | | $ | 4,482 | | $ | 7,388 | | $ | 9,876 | |
| | Adjustments to reconcile net income to net cash provided by operating activities: | | | | | | | | | | |
| | | Depreciation | | | 3,035 | | | 3,172 | | | 2,822 | |
| | | Amortization of premiums, discounts and intangibles | | | 533 | | | 1,073 | | | 1,757 | |
| | | Impairment of goodwill and intangible assets | | | — | | | 2,927 | | | — | |
| | | Provision for loan losses | | | 2,548 | | | 1,232 | | | 2,456 | |
| | | Loans held for sale originated | | | (2,180,476 | ) | | (2,982,830 | ) | | (4,520,954 | ) |
| | | Proceeds from the sale of loans held for sale | | | 2,357,499 | | | 3,015,826 | | | 4,540,715 | |
| | | Gain on sales of loans held for sale | | | (8,779 | ) | | (10,059 | ) | | (15,975 | ) |
| | | Proceeds from sale, maturity and call of investment securities trading | | | 10,099 | | | — | | | — | |
| | | Purchase of investment securities trading | | | (10,109 | ) | | — | | | — | |
| | | Loss on sale of investments securities trading | | | 10 | | | — | | | — | |
| | | Gain on sale of investment securities available-for-sale | | | — | | | (61 | ) | | (33 | ) |
| | | (Gain) loss on sale of other assets | | | 2 | | | (15 | ) | | 13 | |
| | | Stock compensation expense, net of tax benefits | | | 338 | | | 394 | | | — | |
| | | Provision for deferred income taxes | | | 223 | | | 2,016 | | | (1,235 | ) |
| | | Increase in cash surrender value of bank-owned life insurance | | | (1,670 | ) | | (646 | ) | | — | |
| | | Increase in accrued interest receivable and other assets | | | (2,286 | ) | | (6,490 | ) | | (2,418 | ) |
| | | Increase (decrease) in accrued interest payable, escrow liabilities and other liabilities | | | (3,903 | ) | | (7,760 | ) | | 12,743 | |
| | |
| |
| |
| |
| | | | Net cash provided by operating activities | | | 171,546 | | | 26,167 | | | 29,767 | |
| | |
| |
| |
| |
| Cash flows from investing activities: | | | | | | | | | | |
| | Net purchases of premises and equipment | | | (1,461 | ) | | (4,957 | ) | | (5,514 | ) |
| | Proceeds from sale, maturity and call of investment securities available-for-sale | | | 146,147 | | | 12,000 | | | 6,000 | |
| | Proceeds from sale, maturity and call of mortgage-backed securities available-for-sale | | | — | | | 9,701 | | | 4,896 | |
| | Proceeds from maturity and call of investment securities held-to-maturity | | | 4,467 | | | 1,533 | | | — | |
| | Proceeds from sale of other investments | | | 3,666 | | | 4,005 | | | 8,626 | |
| | Purchase of investment securities available-for-sale | | | (164,880 | ) | | (51,772 | ) | | (50,776 | ) |
| | Purchase of mortgage-backed securities available-for-sale | | | (50,286 | ) | | (54,250 | ) | | (12,715 | ) |
| | Purchase of other investments | | | (8,696 | ) | | (6,071 | ) | | (7,608 | ) |
| | Purchase of bank-owned life insurance | | | — | | | (30,000 | ) | | — | |
| | Redemptions of investment securities available-for-sale | | | 23,450 | | | 24,787 | | | 29,721 | |
| | Redemptions of investment securities held-to-maturity | | | 14,018 | | | 15,709 | | | 21,975 | |
| | Net cash paid in acquisition | | | — | | | (339 | ) | | (1,379 | ) |
| | Net increase in loans receivable, net of deferred fees and costs | | | (194,780 | ) | | (139,700 | ) | | (215,128 | ) |
| | |
| |
| |
| |
| | | | Net cash used in investing activities | | | (228,355 | ) | | (219,354 | ) | | (221,902 | ) |
| | |
| |
| |
| |
| Cash flows from financing activities: | | | | | | | | | | |
| | Net increase (decrease) in deposits | | | (121,957 | ) | | 149,010 | | | 245,662 | |
| | Net increase (decrease) in other borrowed funds—short term | | | 85,679 | | | 15,960 | | | (57,164 | ) |
| | Net decrease in warehouse financing | | | — | | | — | | | (30,245 | ) |
| | Net increase (decrease) in mortgage funding checks | | | (36,756 | ) | | 4,524 | | | (4,757 | ) |
| | Proceeds from FHLB advances—long term | | | 155,000 | | | 65,000 | | | 25,000 | |
| | Repayments of FHLB advances—long term | | | (35,250 | ) | | (41,750 | ) | | (13,500 | ) |
| | Proceeds from public offering | | | — | | | — | | | 39,767 | |
| | Stock options exercised | | | 112 | | | 819 | | | 693 | |
| | Purchase and retirement of common stock | | | (2,724 | ) | | — | | | — | |
| | Deferred compensation payments | | | 4 | | | (3 | ) | | — | |
| | Excess tax benefit from stock option exercises | | | 20 | | | 90 | | | 104 | |
| | Dividends on common stock | | | (974 | ) | | (976 | ) | | (244 | ) |
| | |
| |
| |
| |
| | | | Net cash provided by financing activities | | | 43,154 | | | 192,674 | | | 205,316 | |
| | |
| |
| |
| |
| Net (decrease) increase in cash and cash equivalents | | | (13,655 | ) | | (513 | ) | | 13,181 | |
| Cash and cash equivalents at beginning of year | | | 36,076 | | | 36,589 | | | 23,408 | |
| | |
| |
| |
| |
| Cash and cash equivalents at end of year | | $ | 22,421 | | $ | 36,076 | | $ | 36,589 | |
| | |
| |
| |
| |
| Supplemental disclosure of cash flow information: | | | | | | | | | | |
| | Cash paid during the year for interest | | $ | 57,743 | | $ | 45,973 | | $ | 30,096 | |
| | Cash paid for income taxes | | | 3,925 | | | 4,976 | | | 3,456 | |
| Supplemental schedule of noncash investing and financing activities: | | | | | | | | | | |
| | Unsettled purchases of investment securities available-for-sale | | $ | 6,183 | | $ | 460 | | $ | 8,175 | |
| |
On February 9, 2006, the Company acquired certain fiduciary and other assets and assumed the liabilities of FBR National Trust Company. In conjunction with the acquisition, the following noncash changes to our financial condition occurred: |
|
|
|
|
|
|
|
|
|
|
| | | Fair value of non-cash assets acquired | | | | | $ | 507 | | | | |
| | | Fair value of liabilities assumed | | | | | | 127 | | | | |
| |
On June 9, 2005, the Company acquired all of the issued and outstanding common stock of Wilson/Bennett Capital Management, Inc. In conjunction with the acquisition, the following noncash changes to our financial condition occurred: |
|
|
|
|
|
|
|
|
|
|
| | | Fair value of non-cash assets acquired, primarily goodwill and intangibles | | | | | | | | $ | 6,296 | |
| | | Fair value of liabilities assumed | | | | | | | | | 33 | |
| | | Common shares issued in acquisition | | | | | | | | | 4,862 | |
See accompanying notes to consolidated financial statements.
75
CARDINAL FINANCIAL CORPORATION AND SUBSIDIARIES
Notes to Consolidated Financial Statements
(1) Organization
Cardinal Financial Corporation (the "Company") is incorporated under the laws of the Commonwealth of Virginia as a financial holding company whose activities consist of investment in its wholly-owned subsidiaries. The principal operating subsidiary of the Company is Cardinal Bank (the "Bank"), a state-chartered institution and its subsidiary, George Mason Mortgage, LLC ("George Mason"), a mortgage banking company based in Fairfax, Virginia. On June 9, 2005, the Company acquired Wilson/Bennett Capital Management, Inc. ("Wilson/Bennett"), an asset management firm. The Company also owns Cardinal Wealth Services, Inc. ("CWS"), an investment services subsidiary. On February 9, 2006, the Bank acquired certain fiduciary and other assets and assumed certain liabilities of FBR National Trust Company, formerly a subsidiary of Friedman, Billings, Ramsey Group, Inc.
(2) Summary of Significant Accounting Policies
U.S. generally accepted accounting principles are complex and require management to make estimates, judgments and assumptions that affect the reported amounts of assets and liabilities, and disclosures of contingent assets and contingent liabilities, at the date of the consolidated financial statements and the reported amounts of revenues and expenses during the reporting period. Significant estimates affecting the Company's financial statements relate to accounting for business combinations and impairment testing of goodwill, the allowance for loan losses, derivative instruments and hedging activities, accounting for impairment of intangible assets, and the valuation of the deferred tax assets. Actual results could differ from those estimates.
- (b)
- Principles of Consolidation
The consolidated financial statements include the accounts of the Company and its subsidiaries. All significant intercompany transactions and balances have been eliminated in consolidation.
- (c)
- Accounting for Business Combinations
The acquisitions of Wilson/Bennett and Trust Services were accounted for as purchases as required by Statement of Financial Accounting Standards ("SFAS") No. 141,Business Combinations. The purchase method requires that the cost of an acquired entity be allocated to the assets acquired and liabilities assumed, based on their estimated fair values at the date of acquisition. The excess of the cost of an acquired entity over the net of the amounts assigned to assets acquired and liabilities assumed is recorded as goodwill.
- (d)
- Cash and Cash Equivalents
For the consolidated statements of cash flows, the Company has defined cash and cash equivalents as cash and due from banks and federal funds sold.
The Company classifies its investment securities in one of three categories: available-for-sale, held-to-maturity or held for trading. Held-to-maturity securities are those securities for which the Company has the ability and intent to hold until maturity. Held for trading securities are those securities for which the Company has purchased and holds for the purpose of selling in the near future. All other securities are classified as available-for-sale.
76
CARDINAL FINANCIAL CORPORATION AND SUBSIDIARIES
Notes to Consolidated Financial Statements (Continued)
(2) Summary of Significant Accounting Policies (Continued)
Held-to-maturity securities are carried at amortized cost. Available-for-sale and held for trading securities are carried at estimated fair value. Unrealized gains and losses, net of applicable tax, on available-for-sale securities are reported in other comprehensive income (loss). Unrealized market value adjustments, fees and realized gains and losses, on held for trading securities are reported in non-interest income. At December 31, 2007 and 2006, the Company did not have any investment securities classified as held for trading.
Gains and losses on the sale of securities are determined using the specific identification method. Declines in the fair value of individual securities below their cost that are deemed other than temporary are treated as realized losses, resulting in the establishment of a new cost basis for the security.
Premiums and discounts are recognized in interest income using the effective interest method. Prepayments of the mortgages securing mortgage-backed securities may affect the anticipated maturity date and, therefore, the yield to maturity. The Company uses actual principal prepayment experience and estimates of future principal prepayments in calculating the yield necessary to apply the effective interest method.
Loans originated and intended for sale into the secondary market are carried at the lower of cost or estimated fair value, determined on an aggregate loan basis. Estimated fair value is determined by outstanding commitments from investors. Net unrealized losses, if any, are recognized through a valuation allowance by charges to operations. The carrying amount of loans held for sale includes principal balances, valuation allowances, origination premiums or discounts and fees and direct costs that are deferred at the time of origination.
The Company accounts for the sale of mortgage loans to third-party investors pursuant to SFAS No. 140,Accounting for Transfers and Servicing of Financial Assets and Extinguishments of Liabilities, a replacement of FASB Statement 125 because the loan assets have been legally isolated from the Company; the Company has no ability to restrict or constrain the ability of third-party investors to pledge or exchange the mortgage loans; and, because the Company does not have the entitlement or ability to repurchase the mortgage loans or unilaterally cause third-party investors to put the mortgage loans back to the Company.
George Mason has established a reserve for possible repurchases of loans previously sold to investors for which borrowers failed to provide full and accurate information on or related to their loan application or for which appraisals have not been acceptable. During 2007, George Mason either repurchased from or settled with investors on seven such loans. The total expense associated with these loans was $347,000. As of December 31, 2007, the Company has also recorded a reserve of $100,000 for other loans which investors have notified the Company that documentation may not be accurate or complete. No such reserve existed at December 31, 2006.
George Mason, as part of the service it provides to its managed companies, purchases the loans managed companies originate at the time of origination. These loans are then sold by George Mason to investors. George Mason has agreements with its managed companies requiring that, for any loans that were originated by a managed company and for which investors have requested George Mason to repurchase due to the borrowers failure to provide full and accurate information on or related to their
77
CARDINAL FINANCIAL CORPORATION AND SUBSIDIARIES
Notes to Consolidated Financial Statements (Continued)
(2) Summary of Significant Accounting Policies (Continued)
loan application or for which appraisals have not been acceptable, the managed company be responsible for buying back the loan. In the event that the managed company's financial condition deteriorates and it is unable to fund the repurchase of such loans, George Mason may have to provide the funds to repurchase these loans from investors. As of December 31, 2007, the Company does not believe they were obligated to fund any repurchased loans that were originated by a managed company.
- (g)
- Loans Receivable and Allowance for Loan Losses
Loans receivable that management has the intent and ability to hold for the foreseeable future or until maturity or pay-off are reported at their outstanding principal balance adjusted for any charge-offs, and net of the allowance for loan losses and deferred fees and costs. Loan origination fees and certain direct origination costs are deferred and amortized as an adjustment of the yield using the payment terms required by the loan contract.
Loans are generally placed into non-accrual status when they are past-due 90 days as to either principal or interest or when, in the opinion of management, the collection of principal and/or interest is in doubt. A loan remains in non-accrual status until the loan is current as to payment of both principal and interest or past-due less than 90 days and the borrower demonstrates the ability to pay and remain current. Loans are charged-off when a loan or a portion thereof is considered uncollectible. When cash payments are received, they are applied to principal first, then to accrued interest. It is the Company's policy not to record interest income on non-accrual loans until principal has become current. In certain instances, accruing loans that are past due 90 days or more as to principal or interest may not go on nonaccrual status if the Chief Credit Officer determines that the loans are well secured and are in the process of collection.
The Company determines and recognizes impairment of certain loans when, based on current information and events, it is probable that the Company will be unable to collect all amounts due according to the loan agreement. A loan is not considered impaired during a period of delay in payment if the Company expects to collect all amounts due, including past-due interest. An impaired loan is measured at the present value of its expected future cash flows discounted at the loan's coupon rate, or at the loan's observable market price or fair value of the collateral if the loan is collateral dependent.
The allowance for loan losses is increased by provisions for loan losses and recoveries of previously charged-off loans, and decreased by loan charge-offs.
The Company maintains the allowance for loan losses at a level that represents management's best estimate of known and inherent losses in our loan portfolio. Both the amount of the provision expense and the level of the allowance for loan losses are impacted by many factors, including general and industry-specific economic conditions, actual and expected credit losses, historical trends and specific conditions of the individual borrowers. Unusual and infrequently occurring events, such as weather-related disasters, may impact the assessment of possible credit losses. As a part of its analysis, the Company uses comparative peer group data and qualitative factors, such as levels of and trends in delinquencies and non-accrual loans, national and local economic trends and conditions and concentrations of loans exhibiting similar risk profiles to support estimates.
For purposes of this analysis, the Company categorizes loans into one of five categories: commercial and industrial, commercial real estate (including construction), home equity lines of credit,
78
CARDINAL FINANCIAL CORPORATION AND SUBSIDIARIES
Notes to Consolidated Financial Statements (Continued)
(2) Summary of Significant Accounting Policies (Continued)
residential mortgages, and consumer loans. In the absence of meaningful historical loss factors, peer group loss factors are applied and are adjusted by the qualitative factors mentioned above. The indicated loss factors resulting from this analysis are applied to each of the five categories of loans. In addition, the Company individually assigns loss factors to all loans that have been identified as having loss attributes, as indicated by deterioration in the financial condition of the borrower or a decline in underlying collateral value if the loan is collateral dependent. Since the Company has limited historical data on which to base loss factors for classified loans, the Company generally applies, in accordance with regulatory guidelines, a 5% loss factor to all loans classified as special mention, a 15% loss factor to all loans classified as substandard and a 50% loss factor to all loans classified as doubtful. Loans classified as loss loans are fully reserved or charged off. In certain instances, the Company evaluates the impairment of certain loans on a loan by loan basis. For these loans, the Company analyzes the fair value of the collateral underlying the loan and considers estimated costs to sell the collateral on a discounted basis. If the net collateral value is less than the loan balance (including accrued interest and any unamortized premium or discount associated with the loan) the Company recognizes an impairment and establishes a specific reserve for the impaired loan.
In addition, various regulatory agencies, as part of their examination process, periodically review the Company's allowance for loan losses. These agencies may require the Company to recognize additions to the allowance based on their risk evaluation and credit judgment. Management believes that the allowance for loan losses at December 31, 2007 and 2006 is a reasonable estimate of known and inherent losses in the loan portfolio at those dates.
- (h)
- Premises and Equipment
Land is carried at cost. Premises, furniture, equipment, and leasehold improvements are carried at cost, less accumulated depreciation and amortization. Depreciation of premises, furniture and equipment is computed using the straight-line method over estimated useful lives from three to 25 years. Amortization of leasehold improvements is computed using the straight-line method over the useful lives of the improvements or the lease term, whichever is shorter. Purchased computer software which is capitalized is amortized over estimated useful lives of one to three years. Internally developed software is expensed.
- (i)
- Goodwill and Other Intangibles
Goodwill, which represents the excess of purchase price over fair value of net assets acquired, is not amortized but is evaluated at least annually for impairment by comparing its fair value with its recorded amount. An impairment loss is recognized to the extent that the carrying amount exceeds fair value.
The Company performs an annual impairment evaluation of the goodwill associated with the George Mason, Wilson/Bennett, and Trust Services reporting units in the quarter the purchase occurred, or more frequently as circumstances warrant. Note 22 discusses the impairment charges taken during the year ended December 31, 2006. No impairment was indicated in 2007 or 2005. The Company also has amortizable intangible assets. These intangible assets are being amortized on a straight-line basis over their estimated useful lives from three to ten years. These assets are reviewed for impairment whenever events or changes in circumstances indicate that the carrying amount may not be recoverable.
79
CARDINAL FINANCIAL CORPORATION AND SUBSIDIARIES
Notes to Consolidated Financial Statements (Continued)
(2) Summary of Significant Accounting Policies (Continued)
- (j)
- Bank-Owned Life Insurance
Bank-owned life insurance is a bank-eligible asset designed to recover the costs of providing pre- and post-retirement benefits and to finance general employee benefit expenses. Under the insurance policy, executives or other key individuals are the insureds and the Company is the owner and beneficiary of the policy. As such, the insured has no claim to the insurance policy, the policy's cash value, or a portion of the policy's death proceeds. The Company accounts for its bank-owned life insurance under Financial Accounting Standards Board ("FASB") Technical Bulletin 85-4,Accounting for Financial Purchases of Life Insurance. The cash surrender value of the policy is recorded in other assets. The increase in the cash surrender value over time is recorded as other non-interest income.
Gains or losses on the sale of loans are recognized at the date of settlement and are based on the difference between the selling price and the carrying amounts of the loans sold, which include deferred fees and direct origination costs.
Management fee income represents income earned for the management and operational support provided by George Mason to other mortgage banking companies (the "managed companies") owned by local homebuilders. The relationship of George Mason to these managed companies is solely as service provider and there is no fiduciary relationship. Fees earned by George Mason are accrued based on contractual arrangements with each of the managed companies and are generally determined as a percentage of the managed company's net income before income taxes.
Investment fee income represents commissions paid by customers of CWS and asset management fees paid by the customers of Wilson/Bennett for investment services. Revenue from Trust Services is also a component of investment fee income and is recognized in the period earned in accordance with contractual percentage of assets under management or custody. Trust Services revenue is generally determined based upon the fair value of assets under management or custody at the end of the period. Fees are recognized in income as they are earned.
Deferred tax assets and liabilities are recognized for the tax effects of differing carrying values of assets and liabilities for tax and financial statement purposes that will reverse in future periods. Deferred tax assets and liabilities are reflected at currently enacted income tax rates applicable to the period in which the deferred tax assets or liabilities are expected to be realized or settled. As changes in tax laws or rates are enacted, deferred tax assets and liabilities are adjusted through the provision for income taxes.
80
CARDINAL FINANCIAL CORPORATION AND SUBSIDIARIES
Notes to Consolidated Financial Statements (Continued)
(2) Summary of Significant Accounting Policies (Continued)
When uncertainty exists concerning the recoverability of a deferred tax asset, the carrying value of the asset may be reduced by a valuation allowance. The amount of any valuation allowance established is based upon an estimate of the deferred tax asset that is more likely than not to be recovered. Increases or decreases in the valuation allowance result in increases or decreases to the provision for income taxes.
The Company adopted the provisions of FASB Interpretation No. 48 ("FIN No. 48"),Accounting for Uncertainty in Income Taxes, on January 1, 2007. This interpretation clarifies the accounting for uncertainty in income taxes recognized in an entity's financial statements in accordance with SFAS No. 109,Accounting for Income Taxes. FIN No. 48 prescribes a recognition threshold and measurement principles for financial statement disclosure of tax positions taken or expected to be taken on a tax return. FIN No. 48 also provides guidance on derecognition, classification, interest and penalties, accounting in interim periods, disclosure and transition. As of December 31, 2007, the Company had no unrecognized tax benefits. The Company also had no interest expense and/or tax penalties during the year to date December 31, 2007. If the Company had such expenses, they would be classified in the consolidated statements of income as part of the provision for income tax expense.
- (o)
- Earnings Per Common Share
Basic earnings per common share is computed by dividing net income available to common shareholders by the weighted-average number of shares of common stock outstanding during the periods, including shares which will be issued to settle liabilities of the deferred compensation plans. Diluted earnings per share reflects the impact of dilutive potential common shares that would have been outstanding if common stock equivalents had been issued, as well as any adjustment to income that would result from the assumed issuance. Common stock equivalents that may be issued by the Company relate primarily to outstanding stock options, and the dilutive potential common shares resulting from outstanding stock options are determined using the treasury stock method. Common stock equivalents for diluted earnings per share purposes also includes common shares which may be issued, but are not required to be issued, to settle the Company's obligations under its deferred compensation plans.
- (p)
- Derivative Instruments and Hedging Activities
The Company accounts for derivatives and hedging activities in accordance with SFAS No. 133,Accounting for Derivative Instruments and Certain Hedging Activities, as amended, which requires that all derivative instruments be recorded on the statement of condition at their fair values. The Company does not enter into derivative transactions for speculative purposes. For derivatives designated as hedges, the Company contemporaneously documents the hedging relationship, including the risk management objective and strategy for undertaking the hedge, how effectiveness will be assessed at inception and at each reporting period and the method for measuring ineffectiveness. The Company evaluates the effectiveness of these transactions at inception and on an ongoing basis. Ineffectiveness is recorded through earnings. For derivatives designated as cash flow hedges, the fair value adjustment is recorded as a component of other comprehensive income, except for the ineffective portion. For derivatives designated as fair value hedges, the fair value adjustments for both the hedged item and the hedging instrument are recorded through the income statement with any difference considered the ineffective portion of the hedge.
81
CARDINAL FINANCIAL CORPORATION AND SUBSIDIARIES
Notes to Consolidated Financial Statements (Continued)
(2) Summary of Significant Accounting Policies (Continued)
In the normal course of business, the Company enters into contractual commitments, including rate lock commitments, to finance residential mortgage loans. These commitments, which contain fixed expiration dates, offer the borrower an interest rate guarantee provided the loan meets underwriting guidelines and closes within the timeframe established by the Company. Interest rate risk arises on these commitments and subsequently closed loans if interest rates change between the time of the interest rate lock and the delivery of the loan to the investor. Loan commitments related to residential mortgage loans intended to be sold are considered derivatives and are marked to market through earnings.
To mitigate the effect of interest rate risk inherent in providing rate lock commitments, the Company economically hedges its commitments by entering into best efforts forward delivery loan sales contracts. During the rate lock commitment period, these forward loan sales contracts are marked to market through earnings and are not designated as accounting hedges under SFAS No. 133, as amended. The fair values of loan commitments and the fair values of forward sales contracts generally move in opposite directions, and the net impact of the changes in these valuations on net income during the loan commitment period is generally inconsequential. At the closing of the loan, the loan commitment derivative expires and the Company records a loan held for sale and continues to be obligated under the same forward loan sales contract. Loans held for sale are accounted for at the lower of cost or market in accordance with SFAS No. 65,Accounting for Certain Mortgage Banking Activities. Prior to October 1, 2005, the changes in value of the forward loan sales contracts from the date the loan closed to the date it was sold to an investor were marked to market through earnings. On October 1, 2005, the Company began designating its forward sale contracts as hedges to mitigate the variability in cash flow to be received from the sale of mortgage loans.
The Company discontinues hedge accounting prospectively when it is determined that the derivative is no longer highly effective in offsetting changes in anticipated cash flows of the loans held for sale. In situations in which hedge accounting is discontinued, we continue to carry the derivative at its fair value on the statement of condition and recognize any subsequent changes in its fair value in earnings. When hedge accounting is discontinued because it is probable an anticipated loan sale will not occur, the Company recognizes immediately in earnings any gains and losses that were accumulated in other comprehensive income.
- (q)
- Stock-Based Compensation
On January 1, 2006, the Company adopted SFAS No. 123R,Share-Based Payment. This statement requires that companies recognize in the income statement the grant-date fair value of stock options and other equity-based compensation. The statement also requires stock awards to be classified as either an equity award or a liability award. Equity classified awards are valued as of the grant date using either an observable market price or a valuation methodology. Liability classified awards are valued at fair value at each reporting date. All of the Company's stock options are classified as equity awards.
The Company has adopted SFAS No. 123R using the modified prospective application method, which requires, among other things, recognition of compensation costs for all awards outstanding since January 1, 2006 for which the requisite service had not been rendered. The Company awards stock options with a graded-vesting period and as such has elected to recognize compensation costs over the requisite service period for the entire award. Total compensation cost charged against income as a
82
CARDINAL FINANCIAL CORPORATION AND SUBSIDIARIES
Notes to Consolidated Financial Statements (Continued)
(2) Summary of Significant Accounting Policies (Continued)
result of the adoption of SFAS No. 123R for the years ended December 31, 2007 and 2006 was $338,000 and $395,000, respectively. The total income tax benefit recognized in the income statement for share-based compensation arrangements was $118,000 and $138,000 for the years ended December 31, 2007 and 2006, respectively.
Prior to the adoption of SFAS No. 123R, the Company applied the intrinsic value-based method of accounting prescribed by Accounting Principles Board ("APB") Opinion No. 25,Accounting for Stock Issued to Employees, and related interpretations, in accounting for its fixed plan stock options. Under this method, compensation expense was recorded only if the current market price of the underlying stock exceeded the exercise price on the date of grant. There was no compensation expense related to stock-based compensation in 2005.
At December 31, 2007, the Company had two stock-based employee compensation plans, which are described more fully in Note 17.
Stock options are granted with an exercise price equal to the common stock's fair market value at the date of grant. Director stock options have ten year terms and vest and become fully exercisable at the grant date. Certain employee stock options have ten year terms and vest and become fully exercisable after three years. Other employee stock options have ten year terms and vest and become fully exercisable in 20% increments beginning as of the grant date. In addition, the Company has granted stock options to employees of the Company that have ten year terms and vest and become fully exercisable in 20% increments beginning after their first year of service. During 2005, certain stock options granted to employees had ten year terms and vested and became fully exercisable immediately.
The following table illustrates the effect on net income and earnings per share of common stock as if the Company had applied the fair value recognition provisions of SFAS No. 123R to stock-based employee compensation for 2005:
| | 2005
| |
|---|
| | (In thousands,
except per
share data)
| |
|---|
| Net income available to common shareholders as reported | | $ | 9,876 | |
| Deduct: Total stock-based employee compensation expense determined under fair value-based method, net of related tax | | | (4,066 | ) |
| | |
| |
| Pro forma net income | | $ | 5,810 | |
| | |
| |
Earnings per common share: |
|
|
|
|
| | Basic—as reported | | $ | 0.45 | |
| | |
| |
| | Basic—pro forma | | | 0.26 | |
| | |
| |
| | Diluted—as reported | | | 0.44 | |
| | |
| |
| | Diluted—pro forma | | | 0.26 | |
| | |
| |
Total pro forma stock-based employee compensation expense for 2005 reflects the immediate vesting attributes of the stock options that were granted during 2005.
83
CARDINAL FINANCIAL CORPORATION AND SUBSIDIARIES
Notes to Consolidated Financial Statements (Continued)
(2) Summary of Significant Accounting Policies (Continued)
The weighted average per share fair values of stock option grants made in 2007, 2006, and 2005 were $4.68, $5.76, and $4.73, respectively. The fair values of the options granted were estimated on the grant date using the Black-Scholes option-pricing model based on the following weighted average assumptions:
| | 2007
| | 2006
| | 2005
| |
|---|
| Estimated option life | | 6.5 years | | 6.5 years | | 5.75 years | |
| Risk free interest rate | | 4.81 - 4.14 | % | 5.03 - 4.44 | % | 4.30 | % |
| Expected volatility | | 42.10 | % | 43.20 | % | 43.10 | % |
| Expected dividend yield | | 0.40 | % | 0.40 | % | 0.00 | % |
Expected volatility is based upon the average annual historical volatility of the Company's common stock. The estimated option life is derived from the "simplified method" formula as described in Staff Accounting Bulletin No. 107. The risk free interest rate is based upon the five-year U.S. Treasury note rate in effect at the time of grant. The expected dividend yield is based upon implied and historical dividend declarations.
On October 19, 2005, the Company's board of directors authorized that any outstanding, unvested options with no intrinsic value (i.e., their per share exercise price is greater than the market price) on or before December 31, 2005 be amended to become fully vested. This modification resulted in the immediate vesting of 54,000 stock options that were held by employees of the Company. The options that vested had exercise prices ranging from $9.58 to $11.15. On October 19, 2005, the market value of the Company's common stock was $9.81. This modification did not result in the recognition of expense in 2005 because the options had no intrinsic value at the grant date or on the date of modification. Vesting of these options was accelerated to eliminate the need to recognize the remaining fair value compensation expense associated with these options following the adoption of SFAS No. 123R. The amount of compensation expense related to these options that would have been recognized in the financial statements after the Company's implementation of SFAS No. 123R, assuming no forfeitures, was $127,000.
Certain amounts for 2006 and 2005 were reclassified to conform to the presentation for 2007. At December 31, 2006, the Company had a liability of $524,000 related to stock-based compensation. This liability was reclassified to additional paid-in capital during 2007.
84
CARDINAL FINANCIAL CORPORATION AND SUBSIDIARIES
Notes to Consolidated Financial Statements (Continued)
(3) Investment Securities and Other Investments
The fair value and amortized cost of investment securities at December 31, 2007 and 2006 are shown below.
| | 2007
|
|---|
| | Gross
Amortized
cost
| | Gross
Unrealized
Gains
| | Gross
Unrealized
Losses
| | Fair
value
|
|---|
| | (In thousands)
|
|---|
| Investment Securities Available-for-Sale | | | | | | | | | | | | |
U.S. government-sponsored agencies |
|
$ |
83,276 |
|
$ |
753 |
|
$ |
(18 |
) |
$ |
84,011 |
| Mortgage-backed securities | | | 168,889 | | | 891 | | | (1,596 | ) | | 168,184 |
| Municipal securities | | | 33,671 | | | 67 | | | (519 | ) | | 33,219 |
| U.S. treasury securities | | | 592 | | | — | | | (8 | ) | | 584 |
| | |
| |
| |
| |
|
| | Total | | $ | 286,428 | | $ | 1,711 | | $ | (2,141 | ) | $ | 285,998 |
| | |
| |
| |
| |
|
Investment Securities Held-to-Maturity |
|
|
|
|
|
|
|
|
|
|
|
|
U.S. government-sponsored agencies |
|
$ |
19,511 |
|
$ |
14 |
|
$ |
(57 |
) |
$ |
19,468 |
| Mortgage-backed securities | | | 51,433 | | | 93 | | | (455 | ) | | 51,071 |
| Corporate bonds | | | 8,004 | | | — | | | (375 | ) | | 7,629 |
| | |
| |
| |
| |
|
| | Total | | $ | 78,948 | | $ | 107 | | $ | (887 | ) | $ | 78,168 |
| | |
| |
| |
| |
|
| |
2006
|
|---|
| | Gross
Amortized
cost
| | Gross
Unrealized
Gains
| | Gross
Unrealized
Losses
| | Fair
value
|
|---|
| | (In thousands)
|
|---|
| Investment Securities Available-for-Sale | | | | | | | | | | | | |
U.S. government-sponsored agencies |
|
$ |
67,493 |
|
$ |
— |
|
$ |
(496 |
) |
$ |
66,997 |
| Mortgage-backed securities | | | 142,202 | | | 152 | | | (3,240 | ) | | 139,114 |
| Municipal securities | | | 25,047 | | | 122 | | | (138 | ) | | 25,031 |
| U.S. treasury securities | | | 489 | | | — | | | — | | | 489 |
| | |
| |
| |
| |
|
| | Total | | $ | 235,231 | | $ | 274 | | $ | (3,874 | ) | $ | 231,631 |
| | |
| |
| |
| |
|
Investment Securities Held-to-Maturity |
|
|
|
|
|
|
|
|
|
|
|
|
U.S. government-sponsored agencies |
|
$ |
23,985 |
|
$ |
— |
|
$ |
(503 |
) |
$ |
23,482 |
| Mortgage-backed securities | | | 65,676 | | | 17 | | | (1,589 | ) | | 64,104 |
| Corporate bonds | | | 8,004 | | | 10 | | | (150 | ) | | 7,864 |
| | |
| |
| |
| |
|
| | Total | | $ | 97,665 | | $ | 27 | | $ | (2,242 | ) | $ | 95,450 |
| | |
| |
| |
| |
|
85
CARDINAL FINANCIAL CORPORATION AND SUBSIDIARIES
Notes to Consolidated Financial Statements (Continued)
(3) Investment Securities and Other Investments (Continued)
The fair value and amortized cost of investment securities by contractual maturity at December 31, 2007 are shown below. Expected maturities may differ from contractual maturities because many issuers have the right to call or prepay obligations with or without call or prepayment penalties.
| | Available-for-Sale
| | Held-to-Maturity
|
|---|
| | Amortized
cost
| | Fair
Value
| | Amortized
cost
| | Fair
Value
|
|---|
| | (In thousands)
|
|---|
| After 1 year but within 5 years | | $ | 44,752 | | $ | 44,745 | | $ | 6,500 | | $ | 6,468 |
| After 5 years but within 10 years | | | 39,116 | | | 39,850 | | | 11,011 | | | 10,998 |
| After 10 years | | | 33,671 | | | 33,219 | | | 10,004 | | | 9,631 |
| Mortgage-backed securities | | | 168,889 | | | 168,184 | | | 51,433 | | | 51,071 |
| | |
| |
| |
| |
|
| | Total | | $ | 286,428 | | $ | 285,998 | | $ | 78,948 | | $ | 78,168 |
| | |
| |
| |
| |
|
For the years ended December 31, 2007, 2006, and 2005, proceeds from sales of investment securities available-for-sale amounted to $0, $9.8 million, and $4.9 million, respectively. Gross realized gains in 2007, 2006, and 2005, amounted to $0, $61,000, and $33,000, respectively. There were no realized losses in 2007, 2006, and 2005.
The table below shows the Company's investment securities' gross unrealized losses and their fair value, aggregated by investment category and the length of time that individual securities have been in a continuous unrealized loss position, at December 31, 2007.
| | Less than 12 months
| | 12 months or more
| | Total
| |
|---|
| | Fair
Value
| | Unrealized
loss
| | Fair
Value
| | Unrealized
loss
| | Fair
Value
| | Unrealized
loss
| |
|---|
| | (In thousands)
| |
|---|
| Investment Securities Available-for-Sale | | | | | | | | | | | | | | | | | | | |
| U.S. government—sponsored agencies | | $ | — | | $ | — | | $ | 2,982 | | $ | (18 | ) | $ | 2,982 | | $ | (18 | ) |
| Mortgage-backed securities | | | 13,318 | | | (36 | ) | | 70,660 | | | (1,560 | ) | | 83,978 | | | (1,596 | ) |
| Municipal securities | | | 12,200 | | | (270 | ) | | 13,990 | | | (249 | ) | | 26,190 | | | (519 | ) |
| U.S. treasury securities | | | 584 | | | (8 | ) | | — | | | — | | | 584 | | | (8 | ) |
| | |
| |
| |
| |
| |
| |
| |
| Total temporarily impaired securities | | $ | 26,102 | | $ | (314 | ) | $ | 87,632 | | $ | (1,827 | ) | $ | 113,734 | | $ | (2,141 | ) |
| | |
| |
| |
| |
| |
| |
| |
| | Less than 12 months
| | 12 months or more
| | Total
| |
|---|
| | Fair
Value
| | Unrealized
loss
| | Fair
Value
| | Unrealized
loss
| | Fair
Value
| | Unrealized
loss
| |
|---|
| | (In thousands)
| |
|---|
| Investment Securities Held-to-Maturity | | | | | | | | | | | | | | | | | | | |
| U.S. government—sponsored agencies | | $ | 988 | | $ | (12 | ) | $ | 9,955 | | $ | (45 | ) | $ | 10,943 | | $ | (57 | ) |
| Mortgage-backed securities | | | 1,288 | | | (3 | ) | | 33,482 | | | (452 | ) | | 34,770 | | | (455 | ) |
| Corporate bonds | | | 1,915 | | | (85 | ) | | 5,710 | | | (290 | ) | | 7,625 | | | (375 | ) |
| | |
| |
| |
| |
| |
| |
| |
| Total temporarily impaired securities | | $ | 4,191 | | $ | (100 | ) | $ | 49,147 | | $ | (787 | ) | $ | 53,338 | | $ | (887 | ) |
| | |
| |
| |
| |
| |
| |
| |
Our investment portfolio consists primarily of securities backed or guaranteed by the Federal National Mortgage Association (FNMA) or the Federal Home Loan Mortgage Corporation (FHLMC). For all non government or agency securities, we complete reviews for other than temporary impairment at least quarterly. As of December 31, 2007, our investment securities portfolio consists of all AAA
86
CARDINAL FINANCIAL CORPORATION AND SUBSIDIARIES
Notes to Consolidated Financial Statements (Continued)
(3) Investment Securities and Other Investments (Continued)
rated securities. Investment securities which carry a AAA rating are judged to be of the best quality and carry the smallest degree of investment risk. We expect to receive full payment of interest and principal on the securities in the investment portfolio. The various protective elements on our non agency securities may change in the future if market conditions or the financial stability of credit insurers changes, which could impact the ratings of our securities.
Of the $33.7 million in our municipal securities portfolio, $31.2 million remain AAA rated while approximately $2.5 million were downgraded to single A status after December 31, 2007, due to the downgrades of the monoline insurance companies that insured those bonds. These bonds remain unlimited general obligations of the municipalities.
Investment securities with unrealized losses have interest rates that are less than current market interest rates and, therefore, the indicated temporary losses are not a result of permanent credit impairment. Mortgage-backed investment securities, which are the primary component of the unrealized losses in the investment securities portfolio, are primarily comprised of bonds issued by FNMA, FHLMC and the Government National Mortgage Association (GNMA). The Company has the ability and intent to hold these investment securities until their values recover or until maturity.
Investment securities that were pledged to secure borrowed funds and other balances as required at December 31, 2007 and 2006 had carrying values of $225.4 million and $191.7 million, respectively.
| | 2007
| | 2006
|
|---|
| | (In thousands)
|
|---|
| FHLB advances | | $ | 80,596 | | $ | 102,731 |
| Repurchase agreements | | | 85,242 | | | 55,645 |
| Debtor in possession, public deposits, trust division deposits and interest rate swap | | | 7,143 | | | 3,491 |
| FRB discount window and TT&L note option | | | 52,468 | | | 29,853 |
| | |
| |
|
| | | $ | 225,449 | | $ | 191,720 |
| | |
| |
|
Other investments at December 31, 2007 include $13.4 million of Federal Home Loan Bank stock and $63,000 of Community Bankers' Bank stock. At December 31, 2006, other investments included $8.4 million of Federal Home Loan Bank stock, and $63,000 of Community Bankers' Bank stock. As a member of the Federal Home Loan Bank of Atlanta ("FHLB"), the Company's banking subsidiary is required to hold stock in this entity. Stock membership in Community Bankers' Bank allows the Company to participate in loan purchases and sales. In addition, included in other investments at December 31, 2007 and 2006 is the Company's $619,000 investment in Cardinal Statutory Trust I. At December 31, 2007 the Company had an equity investment in a local bank holding company of $50,000. These investments are carried at cost since no active trading markets exist.
There were no held for trading securities for each of December 31, 2007 and 2006. The net loss on the sales of held for trading securities for the year ended December 31, 2007 was $10,000. There were no such net gains or losses for the years ended December 31, 2006 and 2005.
87
CARDINAL FINANCIAL CORPORATION AND SUBSIDIARIES
Notes to Consolidated Financial Statements (Continued)
(4) Loans Receivable
The loan portfolio at December 31, 2007 and 2006 consists of the following:
| | 2007
| | 2006
| |
|---|
| | (In thousands)
| |
|---|
| Commercial and industrial | | $ | 140,531 | | $ | 102,284 | |
| Real estate—commercial | | | 415,471 | | | 317,201 | |
| Real estate—construction | | | 186,514 | | | 154,525 | |
| Real estate—residential | | | 213,197 | | | 201,320 | |
| Home equity lines | | | 81,247 | | | 65,557 | |
| Consumer | | | 3,129 | | | 4,904 | |
| | |
| |
| |
| | | | 1,040,089 | | | 845,791 | |
| Net deferred fees | | | (405 | ) | | (342 | ) |
| | |
| |
| |
| | Loans receivable, net of fees | | | 1,039,684 | | | 845,449 | |
| Allowance for loan losses | | | (11,641 | ) | | (9,638 | ) |
| | |
| |
| |
| | Loans receivable, net | | $ | 1,028,043 | | $ | 835,811 | |
| | |
| |
| |
Substantially all of the Company's loans, commitments and standby letters of credit have been granted to customers located in the Washington, D.C. metropolitan area. As a matter of regulatory restriction, the Company's banking subsidiary limits the amount of credit extended to any single borrower or group of related borrowers. Loans in process at December 31, 2007 and 2006 were $354,000 and $210,000, respectively.
An analysis of the change in the allowance for loan losses follows:
| | 2007
| | 2006
| | 2005
| |
|---|
| | (In thousands)
| |
|---|
| Balance, beginning of year | | $ | 9,638 | | $ | 8,301 | | $ | 5,878 | |
| Provision for loan losses | | | 2,548 | | | 1,232 | | | 2,456 | |
| Loans charged-off | | | (552 | ) | | (43 | ) | | (129 | ) |
| Recoveries | | | 7 | | | 148 | | | 96 | |
| | |
| |
| |
| |
| Balance, end of year | | $ | 11,641 | | $ | 9,638 | | $ | 8,301 | |
| | |
| |
| |
| |
At December 31, 2007, the Company had no impaired loans and at December 31, 2006, had impaired loans of $82,000, which were on non-accrual status. At December 31, 2006, the impaired loans had a valuation allowance of $11,000. At December 31, 2007, the Company had accruing loans past due 90 days or more of $963,000, all of which are included in the loans held for sale portfolio and were determined to be well-secured and in the process of collection. At December 31, 2006, there were no loans contractually past due 90 days or more as to principal or interest payments that were still accruing. The average balance of impaired loans was $132,000, $293,000, and $329,000 for 2007, 2006, and 2005, respectively. Interest income that would have been recorded had these loans been performing for the years ended December 31, 2007, 2006, and 2005 would have been $5,000, $15,000, and $18,000, respectively. The interest income realized prior to these loans being placed on non-accrual status for December 31, 2007 and 2006 was $38,000 and $9,000, respectively. No interest income was realized prior to loans being placed on non-accrual status in 2005.
88
CARDINAL FINANCIAL CORPORATION AND SUBSIDIARIES
Notes to Consolidated Financial Statements (Continued)
(4) Loans Receivable (Continued)
Loans totaling $475.6 million serve as collateral for Federal Home Loan Bank advances at December 31, 2007.
(5) Loans Held for Sale
The loans held for sale portfolio at December 31, 2007 and 2006, consisted of the following:
| | 2007
| | 2006
|
|---|
| | (In thousands)
|
|---|
| Residential | | $ | 119,708 | | $ | 294,115 |
| Construction-to-permanent | | | 50,321 | | | 44,145 |
| | |
| |
|
| | | | 170,029 | | | 338,260 |
| Net deferred costs | | | 458 | | | 471 |
| | |
| |
|
| | Loans held for sale, net | | $ | 170,487 | | $ | 338,731 |
| | |
| |
|
Loans that are classified as construction-to-permanent are those loans that provide variable and fixed rate financing for customers to construct their residences. Once the home has been completed, the loan converts to fixed rate financing and is sold into the secondary market.
(6) Premises and Equipment
Components of premises and equipment at December 31, 2007 and 2006 were as follows:
| | 2007
| | 2006
|
|---|
| | (In thousands)
|
|---|
| Land | | $ | 4,350 | | $ | 4,350 |
| Buildings | | | 6,667 | | | 6,667 |
| Furniture and equipment | | | 14,823 | | | 14,484 |
| Leasehold improvements | | | 6,531 | | | 5,784 |
| | |
| |
|
| | Total cost | | | 32,371 | | | 31,285 |
| Less accumulated depreciation and amortization | | | 13,908 | | | 11,246 |
| | |
| |
|
| | Premises and equipment, net | | $ | 18,463 | | $ | 20,039 |
| | |
| |
|
Depreciation expense for the years ended December 31, 2007, 2006, and 2005 was $3.0 million, $3.2 million, and $2.8 million, respectively.
The Company has entered into operating leases for office space over various terms. The leases generally have options to renew and are subject to annual increases as well as allocations of real estate taxes and certain operating expenses.
89
CARDINAL FINANCIAL CORPORATION AND SUBSIDIARIES
Notes to Consolidated Financial Statements (Continued)
(6) Premises and Equipment (Continued)
Minimum future rental payments under the noncancelable operating leases, as of December 31, 2007 were as follows:
Year ending December 31,
| | Amount
|
|---|
| | (In thousands)
|
|---|
| 2008 | | $ | 4,845 |
| 2009 | | | 3,240 |
| 2010 | | | 2,448 |
| 2011 | | | 1,584 |
| 2012 | | | 1,313 |
| Thereafter | | | 3,709 |
| | |
|
| | | $ | 17,139 |
| | |
|
The total rent expense was $5.3 million, $5.2 million, and $4.5 million in 2007, 2006, and 2005, respectively and is recorded in occupancy expense in the consolidated statements of income.
The Company subleases excess office space to third parties. Future minimum lease payments to be received under noncancellable subleasing arrangements as of December 31, 2007 were as follows:
Year ending December 31,
| | Amount
|
|---|
| | (In thousands)
|
|---|
| 2008 | | $ | 285 |
| 2009 | | | 176 |
| 2010 | | | 182 |
| 2011 | | | 187 |
| 2012 | | | 110 |
| Thereafter | | | 168 |
| | |
|
| | | $ | 1,108 |
| | |
|
The total rent income was $409,000, $412,000, and $602,000 in 2007, 2006, and 2005, respectively and is recorded as a reduction of occupancy expense in the consolidated statements of income.
(7) Deposits
Deposits consist of the following at December 31, 2007 and 2006:
| | 2007
| | 2006
|
|---|
| | (In thousands)
|
|---|
| Non-interest-bearing demand deposits | | $ | 123,994 | | $ | 123,301 |
| Interest-bearing deposits: | | | | | | |
| | Interest checking | | | 124,405 | | | 137,092 |
| | Money market and statement savings | | | 395,356 | | | 395,652 |
| | Certificates of deposit | | | 453,170 | | | 562,837 |
| | |
| |
|
| Total interest-bearing deposits | | | 972,931 | | | 1,095,581 |
| | |
| |
|
| Total deposits | | $ | 1,096,925 | | $ | 1,218,882 |
| | |
| |
|
90
CARDINAL FINANCIAL CORPORATION AND SUBSIDIARIES
Notes to Consolidated Financial Statements (Continued)
(7) Deposits (Continued)
Interest expense by deposit categories is as follows:
| | 2007
| | 2006
| | 2005
|
|---|
| | (In thousands)
|
|---|
| Interest checking | | $ | 3,691 | | $ | 3,796 | | $ | 1,366 |
| Money market and statement savings | | | 17,791 | | | 10,153 | | | 4,503 |
| Certificates of deposit | | | 24,215 | | | 25,142 | | | 19,030 |
| | |
| |
| |
|
| | Total interest expense | | $ | 45,697 | | $ | 39,091 | | $ | 24,899 |
| | |
| |
| |
|
The aggregate amount of time deposits, each with a minimum denomination of $100,000 was $207.6 million and $262.8 million at December 31, 2007 and 2006, respectively.
Brokered certificates of deposits at December 31, 2007 and 2006 were $10.0 million and $5.0 million, respectively.
At December 31, 2007, the scheduled maturities of certificates of deposit were as follows:
| | (In thousands)
|
|---|
| 2008 | | $ | 392,920 |
| 2009 | | | 33,556 |
| 2010 | | | 8,289 |
| 2011 | | | 15,391 |
| 2012 | | | 3,014 |
| | |
|
| | | $ | 453,170 |
| | |
|
(8) Other Borrowed Funds
At December 31, 2007 and 2006, other borrowed funds consisted of the following:
| | 2007
| | 2006
|
|---|
| | (In thousands)
|
|---|
| Fixed rate FHLB advances | | $ | 221,458 | | $ | 106,708 |
| Variable rate FHLB advances | | | 12,000 | | | 16,000 |
| Federal funds purchased | | | 68,000 | | | — |
| Repurchase agreements | | | 66,808 | | | 46,323 |
| Payable to Statutory Trust I | | | 20,619 | | | 20,619 |
| Treasury, Tax & Loan note option | | | 11,175 | | | 4,981 |
| | |
| |
|
| | | $ | 400,060 | | $ | 194,631 |
| | |
| |
|
The Company had fixed rate advances from the FHLB of $221.5 million at December 31, 2007. These advances mature through 2017 and have interest rates ranging from 2.29% to 5.00%. Certain fixed rate FHLB advances have call options through 2010. The Company also has two variable rate FHLB advances totaling $12.0 million at December 31, 2007. The first variable rate advance is $2.0 million and matures in 2008, but can be paid off at any time by the Company. The interest rate the Company pays on this advance is tied to the federal funds purchased rate and reprices daily. The interest rate for this advance at December 31, 2007 was 4.40%. The second variable rate advance is $10.0 million and matures in 2016 and has call options beginning in 2008. The variable rate is based on the three month LIBOR (London Interbank Offered Rate) less 50 basis points for the first two years of the advance and then the interest rate is fixed at 4.00% if the advance is not called. The interest rate on this advance was 4.38% at December 31, 2007.
91
CARDINAL FINANCIAL CORPORATION AND SUBSIDIARIES
Notes to Consolidated Financial Statements (Continued)
(8) Other Borrowed Funds (Continued)
At December 31, 2006, the Company had $106.7 million in fixed rate advances from the FHLB with maturities through 2016 and interest rates ranging from 2.29% to 4.55%. The Company had two variable rate FHLB advances totaling $16.0 million at December 31, 2006.
The contractual maturities of the fixed and variable rate advances at December 31, 2007 and 2006 were as follows:
| | 2007
|
|---|
Type of Advance
| | Interest Rate
| | Advance Term
| | Maturity Date
| | Balance
|
|---|
| | (In thousands)
|
|---|
| Daily Rate Credit (variable rate advance) | | 4.40% | | 12 months | | 2008 | | $ | 2,000 |
| Fixed Rate Credit | | 4.08% - 4.31% | | 36 months | | 2008 | | | 10,000 |
| Principal Reducing Credit | | 2.29% | | 60 months | | 2008 | | | 1,458 |
| Convertible | | 4.24% - 4.52% | | 60 months | | 2011 | | | 15,000 |
| Convertible | | 3.64% - 5.00% | | 60 months | | 2012 | | | 75,000 |
| Flipper Advance (variable rate advance) | | 4.38% | | 120 months | | 2016 | | | 10,000 |
| Convertible | | 3.93% - 4.55% | | 120 months | | 2016 | | | 40,000 |
| Convertible | | 3.10% - 4.85% | | 120 months | | 2017 | | | 80,000 |
| | |
| | | | | |
|
| Total FHLB Advances | | 4.20% | | | | | | $ | 233,458 |
| | |
| | | | | |
|
| | 2006
|
|---|
Type of Advance
| | Interest Rate
| | Advance Term
| | Maturity Date
| | Balance
|
|---|
| | (In thousands)
|
|---|
| Daily Rate Credit (variable rate advance) | | 5.50% | | 12 months | | 2007 | | $ | 6,000 |
| Expandable | | 4.12% | | 24 months | | 2007 | | | 10,000 |
| Fixed Rate Credit | | 2.63% - 3.59% | | 36 - 48 months | | 2007 | | | 17,750 |
| Fixed Rate Credit | | 4.08% - 4.31% | | 36 months | | 2008 | | | 10,000 |
| Principal Reducing Credit | | 2.29% | | 60 months | | 2008 | | | 3,958 |
| Convertible | | 3.50% | | 60 months | | 2009 | | | 10,000 |
| Convertible | | 4.24% - 4.52% | | 60 months | | 2011 | | | 15,000 |
| Flipper Advance (variable rate advance) | | 4.86% | | 120 months | | 2016 | | | 10,000 |
| Convertible | | 3.93% - 4.55% | | 120 months | | 2016 | | | 40,000 |
| | |
| | | | | |
|
| Total FHLB Advances | | 4.08% | | | | | | $ | 122,708 |
| | |
| | | | | |
|
The average balances of FHLB advances for the years ended December 31, 2007 and 2006 were $171.0 million and $80.5 million, respectively. The maximum amount outstanding at any month-end during the years ended December 31, 2007 and 2006 was $234.2 million and $122.7 million, respectively. Total interest expense on FHLB advances for the years ended December 31, 2007, 2006, and 2005 was $7.2 million, $2.8 million, and $2.9 million, respectively.
For the year ended December 31, 2007 there were no extinguishments of FHLB advances. During 2006, the Company extinguished two FHLB advances totaling $20.0 million. The gain on the extinguishment of these advances for the year ended December 31, 2006 was $769,000 and was recorded in other non-interest income in the consolidated statements of income. During 2005, the Company extinguished one FHLB advance totaling $5.0 million. The gain on the 2005 extinguishment was $140,000.
92
CARDINAL FINANCIAL CORPORATION AND SUBSIDIARIES
Notes to Consolidated Financial Statements (Continued)
(8) Other Borrowed Funds (Continued)
Securities sold under agreements to repurchase generally mature within one to four days and are reflected in the consolidated statements of financial condition at the amount of cash received. At December 31, 2007 and 2006 the Company had repurchase agreements of $66.8 million and $46.3 million, respectively. The weighted-average interest rate of these repurchase agreements was 2.99% and 2.14% at December 31, 2007 and 2006, respectively. The average balances of the repurchase agreements during 2007 and 2006 were $57.7 million and $40.7 million, respectively, and the maximum amount outstanding at any month-end during 2007 and 2006 was $77.1 million and $52.7 million, respectively. Interest expense on repurchase agreements for 2007, 2006, and 2005 was $1.7 million, $870,000, and $429,000, respectively.
At December 31, 2007, the Company had federal funds purchased of $68.0 million. The Company had no outstanding federal funds purchased at December 31, 2006. However, the Company did have federal funds purchased outstanding at certain times during 2006. Interest expense on federal funds purchased in 2007, 2006, and 2005 was $1.0 million, $229,000, and $216,000, respectively. The Company had no outstanding short-term dealer repurchase agreements at December 31, 2007 and at December 31, 2006. However, the Company did have short-term dealer repurchase agreements outstanding at other times during those years. Interest expense on short-term dealer repurchase agreements in 2007 and 2006 was $822,000 and $711,000, respectively.
The Company has a Treasury, Tax, & Loan ("TT&L") note option with the Federal Reserve. At December 31, 2007 and 2006, the outstanding balance in the TT&L note option was $11.2 million and $5.0 million, respectively. Interest expense related to the TT&L note option in 2007, 2006, and 2005 was $206,000, $142,000, and $91,000, respectively. The Company has a line of credit at the Federal Reserve discount window in the amount of $39.7 million at December 31, 2007, which was not utilized as of that date. There was no interest expense related to the discount window in 2007, 2006 or 2005.
In July 2004, the Company formed a new wholly-owned subsidiary, Cardinal Statutory Trust I (the "Trust"), for the purpose of issuing $20.0 million of floating rate junior subordinated deferrable interest debentures ("trust preferred securities"). These trust preferred securities are due in 2034 and have an interest rate of LIBOR (London Interbank Offered Rate) plus 2.40%, which adjusts quarterly. At December 31, 2007, the interest rate on trust preferred securities was 7.39%. These securities are redeemable at par beginning September 2009. Under certain qualifying events, these securities are redeemable at a premium through March 2008 and at par thereafter. The Company has guaranteed payment of these securities. The $20.6 million payable by the Company to the Trust is included in other borrowed funds. The Trust is an unconsolidated subsidiary since the Company is not the primary beneficiary of this entity under FASB Interpretation No. 46RConsolidation of Variable Interest Entities. The additional $619,000 that is payable by the Company to the Trust represents the Company's capital investment in the Trust. The Company utilized the proceeds from the issuance of the trust preferred securities to make a capital contribution into the Bank. Interest expense on the trust preferred securities in 2007, 2006, and 2005 was $1.6 million, $1.6 million, and $1.2 million, respectively.
93
CARDINAL FINANCIAL CORPORATION AND SUBSIDIARIES
Notes to Consolidated Financial Statements (Continued)
(8) Other Borrowed Funds (Continued)
The scheduled maturities of other borrowed funds at December 31, 2007 were as follows:
| | 2008
| | 2009
| | 2010
| | 2011
| | 2012 and
thereafter
|
|---|
| | (In thousands)
|
|---|
| FHLB advances | | $ | 13,458 | | $ | — | | $ | — | | $ | 15,000 | | $ | 205,000 |
| Federal funds purchased | | | 68,000 | | | — | | | — | | | — | | | — |
| Repurchase agreements | | | 66,808 | | | — | | | — | | | — | | | — |
| Payable to Statutory Trust I | | | — | | | — | | | — | | | — | | | 20,619 |
| TT&L note option | | | 11,175 | | | — | | | — | | | — | | | — |
| | |
| |
| |
| |
| |
|
| | | $ | 159,441 | | $ | — | | $ | — | | $ | 15,000 | | $ | 225,619 |
| | |
| |
| |
| |
| |
|
(9) Warehouse Financing for Loans Held for Sale
George Mason and the Bank had a $150 million floating rate revolving credit and security agreement with a third party which was cancelled during the fourth quarter of 2007. The Company determined that as a result of the limited use of this credit facility and the available liquidity at the Bank, this credit facility was no longer needed. The purpose of this credit facility was to fund residential mortgage loans at George Mason prior to their sale into the secondary market. The credit facility required, among other things, that George Mason and the Bank have positive quarterly net income and maintain specified minimum tangible and regulatory net worth requirements. The Company had guaranteed repayment of this debt. The interest rate on this credit facility was LIBOR plus between 1.50% and 1.875%. At December 31, 2006, no amounts were drawn on this credit facility.
The same lender had also provided a $100 million facility that was utilized by George Mason to fund residential mortgage loans held for sale to this lender. The terms of this facility were substantially the same as the above-referenced revolving credit and security agreement and the cost of this facility was netted against interest earned on the loans pending settlement with the lender. Loans under this credit facility were considered sold when financed. Again, during the fourth quarter of 2007, the Company cancelled this line of credit as a result of the limited use of this facility and the available liquidity at the Bank. At December 31, 2006, no amounts were drawn on this facility.
Interest expense related to George Mason's warehouse financing was none, $164,000, and $109,000 for the years ended December 31, 2007, 2006, and 2005, respectively.
(10) Income Taxes
The Company and its subsidiaries file consolidated federal tax returns on a calendar-year basis. The Company recorded income tax expense of $885,000, $3.2 million, and $5.2 million for the years ended December 31, 2007, 2006, and 2005, respectively.
94
CARDINAL FINANCIAL CORPORATION AND SUBSIDIARIES
Notes to Consolidated Financial Statements (Continued)
(10) Income Taxes (Continued)
The provision for income tax expense is reconciled to the amount computed by applying the federal corporate tax rate to income before taxes as follows:
| | 2007
| | 2006
| | 2005
| |
|---|
| | (In thousands)
| |
|---|
| Income tax at federal corporate rate | | $ | 1,852 | | $ | 3,591 | | $ | 5,115 | |
| Change in valuation allowance | | | 302 | | | 195 | | | 100 | |
| Change in the carrying rate of deferred tax assets and liabilities | | | 15 | | | (67 | ) | | — | |
| Expected state tax benefit of losses of nonbank entities | | | (302 | ) | | (195 | ) | | (100 | ) |
| State tax expense, net of federal tax benefit | | | 37 | | | 73 | | | — | |
| Nontaxable income | | | (976 | ) | | (402 | ) | | — | |
| Nondeductible expenses | | | 17 | | | 26 | | | 15 | |
| Other | | | (60 | ) | | (48 | ) | | 37 | |
| | |
| |
| |
| |
| | | $ | 885 | | $ | 3,173 | | $ | 5,167 | |
| | |
| |
| |
| |
The components of income tax expense are as follows:
| | 2007
| | 2006
| | 2005
| |
|---|
| | (In thousands)
| |
|---|
| Included in net income | | | | | | | | | | |
| | Current | | | | | | | | | | |
| | | Federal | | $ | 2,030 | | $ | 5,550 | | $ | 5,178 | |
| | | State | | | 62 | | | 116 | | | — | |
| | |
| |
| |
| |
| | | | Total current | | | 2,092 | | | 5,666 | | | 5,178 | |
| | |
| |
| |
| |
| | Deferred | | | | | | | | | | |
| | | Federal | | | (1,201 | ) | | (2,487 | ) | | (11 | ) |
| | | State | | | (6 | ) | | (6 | ) | | — | |
| | |
| |
| |
| |
| | | | Total deferred | | | (1,207 | ) | | (2,493 | ) | | (11 | ) |
| | |
| |
| |
| |
| | | | Total included in net income | | $ | 885 | | $ | 3,173 | | $ | 5,167 | |
| | |
| |
| |
| |
| Included in shareholders' equity: | | | | | | | | | | |
| | Deferred tax expense (benefit) related to the change in the net unrealized gain (loss) on investment securities available for sale | | $ | 1,107 | | $ | 390 | | $ | (1,023 | ) |
| | Deferred tax expense (benefit) related to the change in the net unrealized gain (loss) on derivative instruments designated as cash flow hedges | | | (123 | ) | | 105 | | | (149 | ) |
| | |
| |
| |
| |
| | | | Total included in shareholders' equity | | $ | 984 | | $ | 495 | | $ | (1,172 | ) |
| | |
| |
| |
| |
95
CARDINAL FINANCIAL CORPORATION AND SUBSIDIARIES
Notes to Consolidated Financial Statements (Continued)
(10) Income Taxes (Continued)
The tax effects of temporary differences between the financial reporting basis and income tax basis of assets and liabilities relate to the following:
| | 2007
| | 2006
| |
|---|
| | (In thousands)
| |
|---|
| Deferred tax assets: | | | | | | | |
| | Allowance for loan losses | | $ | 4,178 | | $ | 3,364 | |
| | Net operating loss carryforwards | | | 1,332 | | | 1,030 | |
| | Unrealized losses on investment securities available-for-sale | | | 150 | | | 1,257 | |
| | Unrealized losses on derivative instruments designated as cash flow hedges | | | 165 | | | 42 | |
| | Deferred compensation | | | 1,959 | | | 1,553 | |
| | Goodwill and intangibles, net | | | (103 | ) | | 311 | |
| | Other | | | 773 | | | 396 | |
| | |
| |
| |
| | | | Total gross deferred tax assets | | | 8,454 | | | 7,953 | |
| Less valuation allowance | | | (1,332 | ) | | (1,030 | ) |
| | |
| |
| |
| | | | Net deferred tax assets | | | 7,122 | | | 6,923 | |
| | |
| |
| |
| Deferred tax liabilities: | | | | | | | |
| | Prepaid expenses | | | (134 | ) | | — | |
| | Depreciation | | | 306 | | | (45 | ) |
| | Loan origination costs | | | (656 | ) | | (463 | ) |
| | |
| |
| |
| | | | Total gross deferred tax liabilities | | | (484 | ) | | (508 | ) |
| | |
| |
| |
| Net deferred tax asset | | $ | 6,638 | | $ | 6,415 | |
| | |
| |
| |
Deferred tax assets and liabilities are recognized for the tax effects of differing carrying values of assets and liabilities for tax and financial statement purposes that will reverse in future periods. When uncertainty exists concerning the recoverability of a deferred tax asset, the carrying value of the asset may be reduced by a valuation allowance. Valuation allowances of $1.3 million and $1.0 million at December 31, 2007 and 2006, respectively, have been established for deferred tax assets. This valuation allowance relates primarily to the state portion of the net operating losses of the parent company, CWS and Wilson/Bennett as realization is dependent upon generating future taxable income within those entities. Management believes that future operations of the Company will generate sufficient taxable income to realize the net deferred tax assets at December 31, 2007 and 2006.
The Company adopted the provisions of FASB Interpretation No. 48 ("FIN No. 48"),Accounting for Uncertainty in Income Taxes, on January 1, 2007. This interpretation clarifies the accounting for uncertainty in income taxes recognized in an entity's financial statements in accordance with SFAS No. 109,Accounting for Income Taxes. FIN No. 48 prescribes a recognition threshold and measurement principles for financial statement disclosure of tax positions taken or expected to be taken on a tax return. FIN No. 48 also provides guidance on derecognition, classification, interest and penalties, accounting in interim periods, disclosure and transition.
As of December 31, 2007, the Company had no unrecognized tax benefits. The Company also had no interest expense and/or tax penalties during the year to date December 31, 2007. If the Company had such expenses, they would be classified in the consolidated statements of income as part of the provision for income tax expense.
96
CARDINAL FINANCIAL CORPORATION AND SUBSIDIARIES
Notes to Consolidated Financial Statements (Continued)
(11) Derivative Instruments and Hedging Activities
The Company is a party to forward loan sales contracts, which are utilized to mitigate exposure to fluctuations in interest rates related to closed loans which are held for sale.
At December 31, 2007 and 2006, accumulated other comprehensive income included an after tax unrealized gain (loss) of ($276,000) and $348,000, respectively, related to forward loan sale contracts. Loans held for sale are generally sold within sixty days of closing and, therefore, substantially all of the amount recorded in accumulated other comprehensive income at December 31, 2007 which is related to the Company's cash flow hedges will be recognized in earnings during the first quarter of 2008. At December 31, 2007, the Company recognized income of $8,000 and at December 31, 2006 recorded a charge to earnings of $1,000 due to hedge ineffectiveness.
At December 31, 2007, the Company had $29.5 million in loan commitments and associated forward sales and had $123.9 million in forward loan sales associated with $124.9 million of loans held for sale contracts. At December 31, 2007, the derivative asset was $1.5 million and the derivative liability was $1.9 million.
At December 31, 2006, the Company had $81.6 million in loan commitments and associated forward sales and had $301.9 million in forward loan sales associated with $301.9 million of loans held for sale contracts. At December 31, 2006, the derivative asset was $2.8 million and the derivative liability was $1.6 million.
(12) Regulatory Matters
The Bank, as a state-chartered bank, is subject to the dividend restrictions established by the State Corporation Commission of the Commonwealth of Virginia. Under such restrictions, the Bank may not, without the prior approval of the Bank's primary regulator, declare dividends in excess of the sum of the current year's earnings (as defined) plus the retained earnings (as defined) from the prior two years. At December 31, 2007, there were approximately $29.2 million of accumulated earnings at the Bank which could be paid as dividends to the Company.
The Bank is required to maintain a minimum non-interest earning average reserve balance with the Federal Reserve Bank. The average amount of the required reserve was $100,000 for 2007.
The Federal Deposit Insurance Corporation Improvement Act of 1991 ("FDICIA") requires banking regulators to stratify banks into five quality tiers based upon their relative capital strengths and increase the regulation of the weaker institutions. The key measures of capital are: (1) total capital (Tier I capital plus the allowance for loan losses up to certain limitations) as a percent of total risk-weighted assets, (2) Tier I capital (as defined) as a percent of total risk-weighted assets (as defined), and (3) Tier I capital (as defined) as a percent of total average assets (as defined).
97
CARDINAL FINANCIAL CORPORATION AND SUBSIDIARIES
Notes to Consolidated Financial Statements (Continued)
(12) Regulatory Matters (Continued)
The regulatory capital of the Company at December 31, 2007 and 2006 is as follows:
| | Actual
| | For Capital
Adequacy Purposes
| | To Be Well
Capitalized Under
Prompt Corrective
Action Provisions
|
|---|
At December 31, 2007
| | Amount
| | Ratio
| | Amount
| |
| | Ratio
| | Amount
| |
| | Ratio
|
|---|
| | (In thousands)
|
|---|
| Total capital to risk weighted assets | | $ | 174,523 | | 12.98% | | $ | 107,569 | | ³ | | 8.00% | | $ | 134,461 | | ³ | | 10.00% |
| Tier I capital to risk weighted assets | | | 162,691 | | 12.10 | | | 53,785 | | ³ | | 4.00 | | | 80,677 | | ³ | | 6.00 |
| Tier I capital to average assets | | | 162,691 | | 10.26 | | | 63,456 | | ³ | | 4.00 | | | 79,320 | | ³ | | 5.00 |
At December 31, 2006
| |
| |
| |
| |
| |
| |
| |
| |
|
|---|
| Total capital to risk weighted assets | | $ | 170,457 | | 14.06% | | $ | 97,010 | | ³ | | 8.00% | | $ | 121,263 | | ³ | | 10.00% |
| Tier I capital to risk weighted assets | | | 160,656 | | 13.25 | | | 48,505 | | ³ | | 4.00 | | | 72,758 | | ³ | | 6.00 |
| Tier I capital to average assets | | | 160,656 | | 10.68 | | | 60,180 | | ³ | | 4.00 | | | 75,225 | | ³ | | 5.00 |
The regulatory capital of the Bank at December 31, 2007 and 2006 is as follows:
| | Actual
| | For Capital
Adequacy Purposes
| | To Be Well
Capitalized Under
Prompt Corrective Action Provisions
|
|---|
At December 31, 2007
| | Amount
| | Ratio
| | Amount
| |
| | Ratio
| | Amount
| |
| | Ratio
|
|---|
| | (In thousands)
|
|---|
| Total capital to risk-weighted assets | | $ | 159,745 | | 11.91% | | $ | 107,308 | | ³ | | 8.00% | | $ | 134,135 | | ³ | | 10.00% |
| Tier I capital to risk-weighted assets | | | 147,913 | | 11.03 | | | 53,654 | | ³ | | 4.00 | | | 80,481 | | ³ | | 6.00 |
| Tier I capital to average assets | | | 147,913 | | 9.34 | | | 63,331 | | ³ | | 4.00 | | | 79,163 | | ³ | | 5.00 |
At December 31, 2006
| |
| |
| |
| |
| |
| |
| |
| |
|
|---|
| Total capital to risk-weighted assets | | $ | 141,885 | | 11.73% | | $ | 96,742 | | ³ | | 8.00% | | $ | 120,927 | | ³ | | 10.00% |
| Tier I capital to risk-weighted assets | | | 132,084 | | 10.92 | | | 48,371 | | ³ | | 4.00 | | | 72,556 | | ³ | | 6.00 |
| Tier I capital to average assets | | | 132,084 | | 8.80 | | | 60,038 | | ³ | | 4.00 | | | 75,048 | | ³ | | 5.00 |
At December 31, 2007 and 2006, the Company and the Bank met all regulatory capital requirements and are considered "well-capitalized" from a regulatory perspective.
George Mason is also required to maintain defined capital levels under Department of Housing and Urban Development guidelines. At December 31, 2007 and 2006, George Mason maintained capital in excess of these required guidelines.
(13) Related-Party Transactions
Certain directors, officers and employees and/or their related business interests are at present, as in the past, banking customers in the ordinary course of business of the Company. As such, the Company has had, and expects to have in the future, banking transactions in the ordinary course of its business with directors, officers, principal shareholders and their associates, on substantially the same terms, including interest rates and collateral on loans, as those prevailing at the same time for comparable transactions with non-related parties and do not involve more than normal risk of collectibility or present other unfavorable features.
98
CARDINAL FINANCIAL CORPORATION AND SUBSIDIARIES
Notes to Consolidated Financial Statements (Continued)
(13) Related-Party Transactions (Continued)
Analysis of activity for loans to related parties follows:
| | 2007
| | 2006
| |
|---|
| | (In thousands)
| |
|---|
| Balance, beginning of year | | $ | 40,482 | | $ | 34,998 | |
| New loans | | | 9,354 | | | 11,844 | |
| Loans paid off or paid down | | | (10,699 | ) | | (6,360 | ) |
| | |
| |
| |
| Balance, end of year | | $ | 39,137 | | $ | 40,482 | |
| | |
| |
| |
George Mason leases its headquarters office space from a director of the Company who is the manager and a 3.1% owner of the limited liability company that owns the building in which the space is leased. The lease was renewed during the second quarter of 2007 and will terminate on June 30, 2010 without any option to extend. The rent that George Mason pays for the use of this space ranges from $737,000 to $982,000 per year during the term of the lease. Rent payments totaled $792,000 in 2007 and $1.2 million in 2006.
(14) Earnings Per Common Share
The following is the calculation of basic and diluted earnings per common share.
| | 2007
| | 2006
| | 2005
|
|---|
| | (In thousands, except per share data)
|
|---|
| Net income | | $ | 4,482 | | $ | 7,388 | | $ | 9,876 |
| Weighted average shares for basic | | | 24,606 | | | 24,424 | | | 22,113 |
| Weighted average shares for diluted | | | 25,012 | | | 24,987 | | | 22,454 |
| Basic earnings per common share | | $ | 0.18 | | $ | 0.30 | | $ | 0.45 |
| | |
| |
| |
|
| Diluted earnings per common share | | $ | 0.18 | | $ | 0.30 | | $ | 0.44 |
| | |
| |
| |
|
Basic earnings per share is impacted by the number of shares required to be issued under the Company's various deferred compensation plans and diluted earnings per share is impacted by those common shares which may be, but are not required to be, issued under these plans.
The following shows the composition of basic outstanding shares for the years ended December 31, 2007, 2006, and 2005:
| | 2007
| | 2006
| | 2005
|
|---|
| | (in thousands)
|
|---|
| Weighted average shares outstanding—basic | | 24,333 | | 24,391 | | 22,104 |
| Weighted average shares attributable to deferred compensation plans | | 273 | | 33 | | 9 |
| | |
| |
| |
|
| Total weighted average shares—basic | | 24,606 | | 24,424 | | 22,113 |
| | |
| |
| |
|
99
CARDINAL FINANCIAL CORPORATION AND SUBSIDIARIES
Notes to Consolidated Financial Statements (Continued)
(14) Earnings Per Common Share (Continued)
The following shows the composition of diluted outstanding shares for the years ended December 31, 2007, 2006, and 2005:
| | 2007
| | 2006
| | 2005
|
|---|
| | (in thousands)
|
|---|
| Weighted average shares outstanding—basic | | 24,606 | | 24,424 | | 22,113 |
| Incremental weighted average shares attributable to deferred compensation plans | | 164 | | 183 | | 68 |
| Weighted average shares attributable to vested stock options | | 242 | | 380 | | 273 |
| | |
| |
| |
|
| Total weighted average shares—diluted | | 25,012 | | 24,987 | | 22,454 |
| | |
| |
| |
|
Employees who participate in the Company's deferred compensation plans can allocate their contributions to various investment options, including a Company Common Stock investment option. The incremental weighted average shares attributable to the deferred compensation plans included in diluted outstanding shares assumes the participants opt to invest all of their contributions into the Company's Common Stock investment option.
Antidilutive outstanding stock options excluded from the weighted average shares outstanding for the diluted earnings per share calculation were 51,346 at December 31, 2007 and 22,998 at December 31, 2005. There were no outstanding stock options excluded from the weighted average shares outstanding for the diluted earnings per share calculation at December 31, 2006. These stock options have exercise prices that were greater than the average market price of the Company's common stock for the year. In addition, for December 31, 2007 and 2006, there are no incremental shares related to stock options as calculated under SFAS No. 123R because the addition of these shares to the diluted weighted average share calculation would be antidilutive.
(15) 401(k) Plan
Employees who work twenty (20) hours or more a week and have been employed by the Company for a month can elect to participate in and make contributions into a 401(k) Plan. The Company contributes $0.50 for $1.00 of employee contributions up to a maximum of 3% of the employee's compensation. Expense related to the Company's match in 2007, 2006, and 2005 was $567,000, $546,000, and $521,000, respectively. Employees are immediately vested in the Company's matching contribution.
100
CARDINAL FINANCIAL CORPORATION AND SUBSIDIARIES
Notes to Consolidated Financial Statements (Continued)
(16) Deferred Compensation Plans
The Company has deferred compensation plans for its directors and certain employees. Under the directors' plan, a director may elect to defer all or a portion of any director-related fees including fees for serving on board committees. Under the employees' plan, certain employees may defer all or a portion of their compensation including any bonus or commission compensation. Director and employee deferrals, other than employees of George Mason, are matched 50% by the Company. Deferrals made by employees of George Mason are not eligible for the Company match. The amount of the Company match is deemed invested in Company common stock which vests immediately for the directors and after four years for employees. The maximum Company match per employee is $50,000 per year and $10,000 per year per director. Expense relating to the employee plans for the years ended December 31, 2007, 2006, and 2005 was $149,000, $136,000, and $52,000, respectively, the employee portion of which is included in salary and benefits expense and the directors portion of the expense is included in other operating expense in the consolidated statements of income.
(17) Director and Employee Stock-Based Compensation Plans
At December 31, 2007, the Company had two stock-based employee compensation plans, the 1999 Stock Option Plan (the "Option Plan") and the 2002 Equity Compensation Plan (the "Equity Plan").
In 1998, the Company adopted the Option Plan pursuant to which the Company may grant stock options for up to 625,000 shares of the Company's common stock to employees and members of the Company's and its subsidiaries' boards of directors. There are 16,371 shares of the Company's common stock available for future grants in the Option Plan as of December 31, 2007.
In 2002, the Company adopted the Equity Plan. The Equity Plan authorizes the granting of options, which may be incentive stock options or non-qualified stock options, stock appreciation rights, restricted stock awards, phantom stock awards or performance share awards to directors, eligible officers and key employees of the Company. In 2006, the shareholders approved an amendment to the Equity Plan to increase the number of shares of common stock reserved for issuance under it from 1,970,000 to 2,420,000. There are 217,058 shares of the Company's common stock available for future grants and awards in the Equity Plan as of December 31, 2007.
The following table presents a summary of the Company's stock option activity for the years ended December 31, 2005:
| | Number of
Shares
| | Weighted
Average
Exercise
Price
|
|---|
| Balance at December 31, 2004 | | 1,232,861 | | $ | 6.34 |
| Granted | | 1,210,245 | | | 10.06 |
| Exercised | | (113,977 | ) | | 6.08 |
| Forfeited | | (57,535 | ) | | 8.24 |
| | |
| |
|
| Balance at December 31, 2005 | | 2,271,594 | | $ | 8.29 |
101
CARDINAL FINANCIAL CORPORATION AND SUBSIDIARIES
Notes to Consolidated Financial Statements (Continued)
(17) Director and Employee Stock-Based Compensation Plans (Continued)
Stock option activity during the years ended December 31, 2006 and 2007 is summarized as follows:
| | Number of
Shares
| | Weighted
Average
Exercise Price
| | Weighted
Average
Remaining Contractual
Term (Years)
| | Aggregate
Intrinsic
Value
($000)
|
|---|
| Outstanding at December 31, 2005 | | 2,271,594 | | $ | 8.29 | | | | | |
| Granted | | 286,000 | | | 11.83 | | | | | |
| Exercised | | (96,230 | ) | | 8.49 | | | | | |
| Forfeited | | (42,090 | ) | | 10.24 | | | | | |
| | |
| | | | | | | | |
| Outstanding at December 31, 2006 | | 2,419,274 | | $ | 8.70 | | 7.62 | | $ | 3,754,056 |
| | |
| |
| |
| |
|
| Options exercisable at December 31, 2006 | | 2,008,668 | | $ | 8.44 | | 7.46 | | $ | 3,632,572 |
| | |
| |
| |
| |
|
| | Number of
Shares
| | Weighted
Average
Exercise
Price
| | Weighted
Average
Remaining Contractual
Term (Years)
| | Aggregate
Intrinsic
Value
($000)
|
|---|
| Outstanding at December 31, 2006 | | 2,419,274 | | $ | 8.70 | | | | | |
| Granted | | 50,500 | | | 10.00 | | | | | |
| Exercised | | (20,546 | ) | | 5.45 | | | | | |
| Forfeited | | (20,875 | ) | | 10.26 | | | | | |
| | |
| | | | | | | | |
| Outstanding at December 31, 2007 | | 2,428,353 | | $ | 8.53 | | 6.50 | | $ | 1,428,443 |
| | |
| |
| |
| |
|
| Options exercisable at December 31, 2007 | | 2,136,325 | | $ | 8.39 | | 6.46 | | $ | 1,994,521 |
| | |
| |
| |
| |
|
Information pertaining to stock options outstanding at December 31, 2007 is as follows:
| | Options Outstanding
| | Options Exercisable
|
|---|
| |
| | Weighed Average
| |
| |
|
|---|
Range of Exercise Prices
| | Number
Outstanding
| | Remaining
Contractual Life
| | Exercise
Price
| | Number
Exercisable
| | Weighted Average
Exercise
Price
|
|---|
| $2.41 - $3.56 | | 124,493 | | 4.1 years | | $ | 3.27 | | 124,493 | | $ | 3.27 |
| $3.95 - $5.50 | | 406,278 | | 4.8 years | | | 4.75 | | 404,928 | | | 4.75 |
| $6.38 - $8.28 | | 250,672 | | 5.8 years | | | 8.13 | | 232,994 | | | 8.13 |
| $8.64 - $9.59 | | 633,676 | | 7.1 years | | | 8.96 | | 631,976 | | | 8.96 |
| $9.78 - $10.91 | | 567,700 | | 7.4 years | | | 10.54 | | 512,800 | | | 10.59 |
| $11.05 - $12.65 | | 445,534 | | 8.2 years | | | 11.59 | | 229,134 | | | 11.32 |
| | |
| |
| |
| |
| |
|
| Outstanding at year end | | 2,428,353 | | 6.7 years | | | 8.73 | | 2,136,325 | | | 8.38 |
| | |
| |
| |
| |
| |
|
Total intrinsic value of options exercised during the years ended December 31, 2007, 2006, and 2005 was $80,000, $169,000, and $560,000 respectively.
102
CARDINAL FINANCIAL CORPORATION AND SUBSIDIARIES
Notes to Consolidated Financial Statements (Continued)
(17) Director and Employee Stock-Based Compensation Plans (Continued)
A summary of the status of the Company's non-vested stock options and changes during the year ended December 31, 2007 is as follows:
| | Number of
Shares
| | Weighted
Average
Grant Date
Fair Value
|
|---|
| Balance at December 31, 2006 | | 410,606 | | $ | 4.63 |
| Granted | | 50,500 | | | 4.68 |
| Vested | | (160,878 | ) | | 3.43 |
| Forfeited | | (8,200 | ) | | 4.77 |
| | |
| |
|
| Balance at December 31, 2007 | | 292,028 | | $ | 5.30 |
| | |
| |
|
At December 31, 2007, there was $1.8 million of total unrecognized compensation expense related to non-vested share-based compensation arrangements granted under the plans. The expense is expected to be recognized over a weighted average period of 3.4 years. The total fair value of shares that vested during the years ended December 31, 2007, 2006, and 2005 was $596,000, $387,000, and $5.2 million, respectively.
At the Board of Directors meeting held on December 13, 2006, the Board approved the re-pricing of 92,300 options with an exercise price of $3.25 per share to a new exercise price of $4.12 per share to equal the fair market value price per share of the Company's common stock on the original grant date in 2002. SFAS No. 123R requires the re-pricing of equity awards to be treated as a modification of the original award and provides that such a modification is an exchange of the original award for a new award. SFAS No. 123R considers the modification to be the repurchase of the old award for a new award of equal or greater value, incurring additional compensation cost for any incremental value. This incremental difference in value is measured as the excess, if any, of the fair value of the modified award determined in accordance with the provisions of SFAS No. 123R over the fair value of the original award immediately before its terms are modified, measured based on the share price and other pertinent factors at that date. SFAS No. 123R provides that this incremental fair value, plus the remaining unrecognized compensation cost from the original measurement of the fair value of the old option, must be recognized over the remaining vesting period. The modifications resulted in an incremental compensation cost of $58,000. Of the 92,300 options affected by the re-pricing, 61,500 options were vested at December 13, 2006. Therefore, additional compensation cost of $39,000 for the 61,500 stock options that were vested was recognized immediately and is included in the stock-based compensation expense for the year ended December 31, 2006.
(18) Segment Reporting
The Company operates in three business segments: commercial banking, mortgage banking, and wealth management and trust services.
The commercial banking segment includes both commercial and consumer lending and provides customers with such products as commercial loans, real estate loans, business financing and consumer loans. In addition, this segment provides customers with various deposit products including demand deposit accounts, savings accounts and certificates of deposit. The mortgage banking segment engages primarily in the origination and acquisition of residential mortgages for sale into the secondary market on a best efforts basis. The wealth management and trust services segment provides investment and financial advisory services to businesses and individuals, including financial planning, retirement/estate planning, trust, estates, custody, investment management, escrows, and retirement plans.
103
CARDINAL FINANCIAL CORPORATION AND SUBSIDIARIES
Notes to Consolidated Financial Statements (Continued)
(18) Segment Reporting (Continued)
Wilson/Bennett is included in the wealth management and trust services segment since the date of its acquisition, June 9, 2005. Results related to the assets acquired, and liabilities assumed, from FBR National Trust Company are reflected in the wealth management and trust services segment since the date of their acquisition and assumption, February 9, 2006.
Information about the reportable segments and reconciliation of this information to the consolidated financial statements as of and for the years ended December 31, 2007, 2006, and 2005 follows:
At and for the Year Ended December 31, 2007:
| | Commercial
Banking
| | Mortgage
Banking
| | Wealth
Management
and
Trust Services
| | Other
| | Intersegment
Elimination
| | Consolidated
|
|---|
| | (In thousands)
|
|---|
| Net interest income | | $ | 38,707 | | $ | 3,005 | | $ | — | | $ | (1,393 | ) | $ | — | | $ | 40,319 |
| Provision for loan losses | | | 2,548 | | | — | | | — | | | — | | | — | | | 2,548 |
| Non-interest income | | | 4,032 | | | 11,112 | | | 4,287 | | | 49 | | | — | | | 19,480 |
| Non-interest expense | | | 30,316 | | | 11,587 | | | 7,096 | | | 2,885 | | | — | | | 51,884 |
| Provision for income taxes | | | 2,470 | | | 907 | | | (979 | ) | | (1,513 | ) | | — | | | 885 |
| | |
| |
| |
| |
| |
| |
|
| Net income (loss) | | $ | 7,405 | | $ | 1,623 | | $ | (1,830 | ) | $ | (2,716 | ) | $ | — | | $ | 4,482 |
| | |
| |
| |
| |
| |
| |
|
| Total Assets | | $ | 1,663,834 | | $ | 184,602 | | $ | 3,893 | | $ | 176,366 | | $ | (338,664 | ) | $ | 1,690,031 |
At and for the Year Ended December 31, 2006:
| | Commercial
Banking
| | Mortgage
Banking
| | Wealth
Management
and
Trust Services
| | Other
| | Intersegment
Elimination
| | Consolidated
|
|---|
| | (In thousands)
|
|---|
| Net interest income | | $ | 38,091 | | $ | 4,344 | | $ | — | | $ | (1,081 | ) | $ | — | | $ | 41,354 |
| Provision for loan losses | | | 1,232 | | | — | | | — | | | — | | | — | | | 1,232 |
| Non-interest income | | | 4,415 | | | 13,892 | | | 3,330 | | | 47 | | | — | | | 21,684 |
| Non-interest expense | | | 27,127 | | | 15,241 | | | 6,591 | | | 2,286 | | | — | | | 51,245 |
| Provision for income taxes | | | 4,571 | | | 1,060 | | | (1,307 | ) | | (1,151 | ) | | — | | | 3,173 |
| | |
| |
| |
| |
| |
| |
|
| Net income (loss) | | $ | 9,576 | | $ | 1,935 | | $ | (1,954 | ) | $ | (2,169 | ) | $ | — | | $ | 7,388 |
| | |
| |
| |
| |
| |
| |
|
| Total Assets | | $ | 1,572,051 | | $ | 360,470 | | $ | 5,500 | | $ | 163,879 | | $ | (463,471 | ) | $ | 1,638,429 |
At and for the Year Ended December 31, 2005:
| | Commercial
Banking
| | Mortgage
Banking
| | Wealth
Management
and
Trust Services
| | Other
| | Intersegment
Elimination
| | Consolidated
|
|---|
| | (In thousands)
|
|---|
| Net interest income | | $ | 32,171 | | $ | 6,203 | | $ | — | | $ | (891 | ) | $ | — | | $ | 37,483 |
| Provision for loan losses | | | 2,456 | | | — | | | — | | | — | | | — | | | 2,456 |
| Non-interest income | | | 1,964 | | | 21,255 | | | 1,367 | | | 83 | | | — | | | 24,669 |
| Non-interest expense | | | 23,802 | | | 17,332 | | | 1,422 | | | 2,097 | | | — | | | 44,653 |
| Provision for income taxes | | | 2,764 | | | 3,413 | | | (56 | ) | | (954 | ) | | — | | | 5,167 |
| | |
| |
| |
| |
| |
| |
|
| Net income (loss) | | $ | 5,113 | | $ | 6,713 | | $ | 1 | | $ | (1,951 | ) | $ | — | | $ | 9,876 |
| | |
| |
| |
| |
| |
| |
|
| Total Assets | | $ | 1,387,504 | | $ | 376,618 | | $ | 6,882 | | $ | 160,856 | | $ | (479,573 | ) | $ | 1,452,287 |
104
CARDINAL FINANCIAL CORPORATION AND SUBSIDIARIES
Notes to Consolidated Financial Statements (Continued)
(18) Segment Reporting (Continued)
During the year ended December 31, 2007, the Company recorded a loss of $3.5 million pretax ($2.3 million after tax) from an escrow arrangement with Liberty Growth Fund, LP. This loss was recorded through the wealth management and trust services segment.
During the year ended December 31, 2006, the Company recorded a non-cash impairment loss totaling $2.9 million pretax ($1.9 million after tax) through the wealth management and trust services segment.
The Company did not have any operating segments other than those reported. Parent company financial information is included in the "Other" category and represents an overhead function rather than an operating segment. The parent company's most significant assets are its net investments in its subsidiaries. The parent company's net interest expense is comprised of interest income from short-term investments and interest expense on trust preferred securities.
(19) Financial Instruments with Off Balance Sheet Risk
The Company is a party to financial instruments with off-balance-sheet risk in the normal course of business to meet the financing needs of its customers. These financial instruments include commitments to extend credit and standby letters of credit and financial guarantees. Commitments to extend credit are agreements to lend to a customer so long as there is no violation of any condition established in the contract. Commitments usually have fixed expiration dates up to one year or other termination clauses and may require payment of a fee. Since many of the commitments are expected to expire without being drawn upon, the total commitment amounts do not necessarily represent future cash requirements.
Standby letters of credit are conditional commitments issued by the Company to guarantee the performance of the contractual obligations by a customer to a third party. The majority of these guarantees extend until satisfactory completion of the customer's contractual obligations. All standby letters of credit outstanding at December 31, 2007 are collateralized.
These instruments represent obligations of the Company to extend credit or guarantee borrowings and are not recorded on the consolidated statements of financial condition. The rates and terms of these instruments are competitive with others in the market in which the Company operates. Commitments to extend credit of $29.5 million as of December 31, 2007 are related to George Mason's pipeline and are of a short term nature. Commitments to extend credit of $329.9 million primarily have floating rates as of December 31, 2007.
Those instruments may involve, to varying degrees, elements of credit and interest rate risk in excess of the amount recognized in the consolidated statements of financial condition. Credit risk is defined as the possibility of sustaining a loss because the other parties to a financial instrument fail to perform in accordance with the terms of the contract. The Company's maximum exposure to credit loss under standby letters of credit and commitments to extend credit is represented by the contractual amounts of those instruments.
105
CARDINAL FINANCIAL CORPORATION AND SUBSIDIARIES
Notes to Consolidated Financial Statements (Continued)
(19) Financial Instruments with Off Balance Sheet Risk (Continued)
A summary of the contract amount of the Bank's exposure to off-balance-sheet risk as of December 31, 2007 and 2006 is as follows:
| | 2007
| | 2006
|
|---|
| | (In thousands)
|
|---|
| Financial instruments whose contract amounts represent potential credit risk: | | | | | | |
| | Commitments to extend credit | | $ | 359,321 | | $ | 372,154 |
| | Standby letters of credit | | | 10,166 | | | 8,097 |
The fair value of the liability associated with standby letters of credit at December 31, 2007 and 2006 was immaterial.
George Mason maintains a reserve for loans sold that pay off earlier than the contractual agreed upon period, thereby requiring that George Mason refund part of the service release premium and/or premium pricing received from the investor. The reserves as of December 31, 2007 and 2006 were $23,000 and $57,000, respectively. In addition, as of December 31, 2007, George Mason has established a reserve of $100,000 for possible repurchases of loans previously sold to investors for which borrowers failed to provide full and accurate information on their loan application or for which appraisals have not been acceptable. During 2007, George Mason either repurchased from or settled with investors on seven such loans. The total expense associated with these loans was $347,000. No such reserve existed at December 31, 2006.
George Mason, as part of the service it provides to its managed companies, purchases the loans managed companies originate at the time of origination. These loans are then sold by George Mason to investors. George Mason has agreements with its managed companies requiring that, for any loans that were originated by a managed company and for which investors have requested George Mason to repurchase due to the borrowers failure to provide full and accurate information on or related to their loan application or for which appraisals have not been acceptable, the managed company be responsible for buying back the loan. In the event that the managed company's financial condition deteriorates and it is unable to fund the repurchase of such loans, George Mason may have to provide the funds to repurchase these loans from investors. As of December 31, 2007, the Company did not believe it was obligated to fund any repurchased loans that were originated by a managed company.
The Company uses the same credit policies in making commitments and conditional obligations as it does for on-balance-sheet instruments. The Company evaluates each customer's creditworthiness on a case-by-case basis and requires collateral to support financial instruments when deemed necessary. The amount of collateral obtained upon extension of credit is based on management's evaluation of the counterparty. Collateral held varies but may include deposits held by the Company, marketable securities, accounts receivable, inventory, property, plant and equipment, and income-producing commercial properties.
The Company has derivative counter-party risk which may arise from the possible inability of George Mason's third-party investors to meet the terms of their forward sales contracts. George Mason works with third-party investors that are generally well-capitalized, are investment grade and exhibit strong financial performance to mitigate this risk. The Company does not expect any third-party investor to fail to meet its obligation.
106
CARDINAL FINANCIAL CORPORATION AND SUBSIDIARIES
Notes to Consolidated Financial Statements (Continued)
(19) Financial Instruments with Off Balance Sheet Risk (Continued)
The Company has guaranteed payment of the $20.0 million debt of Statutory Trust I.
(20) Disclosures of Fair Value of Financial Instruments
The assumptions used and the estimates disclosed represent management's best judgment of appropriate valuation methods. These estimates are based on pertinent information available to management at the valuation date. In certain cases, fair values are not subject to precise quantification or verification and may change as economic and market factors and management's evaluation of those factors change.
Although management uses its best judgment in estimating the fair value of financial instruments, there are inherent limitations in any estimation technique. Therefore, these fair value estimates are not necessarily indicative of the amounts the Company would realize in a market transaction. Because of the wide range of valuation techniques and the numerous estimates and assumptions which must be made, it may be difficult to make reasonable comparisons between the Company's fair value information and that of other banking institutions. It is important that the many uncertainties be considered when using the estimated fair value disclosures and that, because of these uncertainties, the aggregate fair value amount should not be construed as representative of the underlying value of the Company.
Fair Value of Financial Instruments
The following summarizes the significant methodologies and assumptions used in estimating the fair values presented in the following table.
Cash and Cash Equivalents
The carrying amount of cash and cash equivalents is used as a reasonable estimate of fair value.
Investment Securities and Other Investments
Fair values for investment securities are based on quoted market prices or prices quoted for similar financial instruments. Fair value for other investments is estimated at their cost since no active trading markets exist.
Loans Held for Sale
Loans held for sale are carried at the lower of cost or market. The estimated fair value is based upon the related purchase price commitments from secondary market investors.
Loans Receivable, Net
In order to determine the fair market value for loans receivable, the loan portfolio was segmented based on loan type, credit quality and maturities. For certain variable rate loans with no significant credit concerns and frequent repricings, estimated fair values are based on current carrying amounts. The fair values of other loans are estimated using discounted cash flow analyses, at interest rates currently being offered for loans with similar terms to borrowers of similar credit quality.
107
CARDINAL FINANCIAL CORPORATION AND SUBSIDIARIES
Notes to Consolidated Financial Statements (Continued)
(20) Disclosures of Fair Value of Financial Instruments (Continued)
Deposits
The fair values for demand deposits are equal to the carrying amount since they are payable on demand at the reporting date. The carrying amounts of variable rate, fixed-term money market accounts and certificates of deposit (CDs) approximate their fair value at the reporting date. Fair values for fixed-rate CDs are estimated using a discounted cash flow calculation that applies interest rates currently being offered on CDs to a schedule of aggregated expected monthly maturities on time deposits.
Other Borrowed Funds
The fair value of other borrowed funds is estimated using a discounted cash flow calculation that applies interest rates currently available for loans with similar terms.
Derivative Instruments Related to Loans Held for Sale
Derivative instruments related to loans held for sale are carried at fair value. Fair value is determined through quotes obtained from actively traded mortgage markets and, for rate lock commitments, is based upon the change in market interest rates between making the rate lock commitment and the loan closing and, for forward loan sale commitments, is based upon the change in market interest rates from entering into the forward loan sales contract and the sale of the loan to the investor.
Other Commitments to Extend Credit
The fair value of these financial instruments is based on the credit quality and relationship, fees, interest rates, probability of funding, compensating balance and other covenants or requirements. These commitments have expiration dates and generally expire within one year. Many commitments are expected to, and typically do, expire without being drawn upon. The rates and terms of these instruments are competitive with others in the market in which the Company operates. The carrying amounts are reasonable estimates of the fair value of these financial instruments and are zero at December 31, 2007 and 2006.
Accrued Interest Receivable
The carrying amount of accrued interest receivable approximates its fair value.
108
CARDINAL FINANCIAL CORPORATION AND SUBSIDIARIES
Notes to Consolidated Financial Statements (Continued)
(20) Disclosures of Fair Value of Financial Instruments (Continued)
The fair values of financial instruments as of December 31, 2007 and 2006 are summarized as follows:
| | 2007
|
|---|
| | Carrying
Amount
| | Estimated
Fair Value
|
|---|
| | (In thousands)
|
|---|
| Financial assets: | | | | | | |
| | Cash and cash equivalents | | $ | 22,421 | | $ | 22,421 |
| | Investment securities and other investments | | | 379,134 | | | 377,603 |
| | Loans held for sale | | | 170,487 | | | 170,551 |
| | Loans receivable, net | | | 1,039,684 | | | 1,035,428 |
| | Accrued interest receivable | | | 6,134 | | | 6,134 |
| | Derivative asset | | | 1,527 | | | 1,527 |
Financial liabilities: |
|
|
|
|
|
|
| | Demand deposits | | $ | 123,994 | | $ | 123,994 |
| | Interest checking | | | 124,405 | | | 124,405 |
| | Money market and statement savings | | | 395,356 | | | 395,356 |
| | Certificates of deposit | | | 453,170 | | | 454,426 |
| | Other borrowed funds | | | 400,060 | | | 407,282 |
| | Mortgage funding checks | | | 9,403 | | | 9,403 |
| | Accrued interest payable | | | 1,459 | | | 1,459 |
| | Derivative liability | | | 1,921 | | | 1,921 |
Other: |
|
|
|
|
|
|
| | Commitments to extend credit | | $ | — | | $ | — |
| | 2006
|
|---|
| | Carrying
Amount
| | Estimated
Fair Value
|
|---|
| | (In thousands)
|
|---|
| Financial assets: | | | | | | |
| | Cash and cash equivalents | | $ | 36,076 | | $ | 36,076 |
| | Investment securities and other investments | | | 338,454 | | | 336,239 |
| | Loans held for sale | | | 338,731 | | | 338,739 |
| | Loans receivable, net | | | 845,449 | | | 832,567 |
| | Accrued interest receivable | | | 5,667 | | | 5,667 |
| | Derivative asset | | | 2,807 | | | 2,807 |
Financial liabilities: |
|
|
|
|
|
|
| | Demand deposits | | $ | 123,301 | | $ | 123,301 |
| | Interest checking | | | 137,092 | | | 137,092 |
| | Money market and statement savings | | | 395,652 | | | 395,652 |
| | Certificates of deposit | | | 562,837 | | | 561,264 |
| | Other borrowed funds | | | 194,631 | | | 193,846 |
| | Mortgage funding checks | | | 46,159 | | | 46,159 |
| | Accrued interest payable | | | 878 | | | 878 |
| | Derivative liability | | | 1,592 | | | 1,592 |
Other: |
|
|
|
|
|
|
| | Commitments to extend credit | | $ | — | | $ | — |
109
CARDINAL FINANCIAL CORPORATION AND SUBSIDIARIES
Notes to Consolidated Financial Statements (Continued)
(21) Parent Company Only Financial Statements
The Cardinal Financial Corporation (Parent Company only) condensed financial statements are as follows:
PARENT COMPANY ONLY CONDENSED STATEMENTS OF CONDITION
December 31, 2007 and 2006
(In thousands)
| | 2007
| | 2006
|
|---|
Assets
| | | | | | |
| Cash and cash equivalents | | $ | 9,333 | | $ | 13,609 |
| Other investments | | | 113 | | | 113 |
| Investment in subsidiaries | | | 164,362 | | | 148,463 |
| Premises and equipment, net | | | 1,001 | | | 1,069 |
| Goodwill | | | 134 | | | 134 |
| Other assets | | | 5,139 | | | 13,104 |
| | |
| |
|
| | Total assets | | $ | 180,082 | | $ | 176,492 |
| | |
| |
|
| Liabilities and Shareholders' Equity | | | | | | |
| Debt to Cardinal Statutory Trust I | | $ | 20,619 | | $ | 20,619 |
| Other liabilities | | | — | | | — |
| | |
| |
|
| | Total liabilities | | | 20,619 | | | 20,619 |
| Total shareholders' equity | | $ | 159,463 | | $ | 155,873 |
| | |
| |
|
| | Total liabilities and shareholders' equity | | $ | 180,082 | | $ | 176,492 |
| | |
| |
|
110
CARDINAL FINANCIAL CORPORATION AND SUBSIDIARIES
Notes to Consolidated Financial Statements (Continued)
(21) Parent Company Only Financial Statements (Continued)
PARENT COMPANY ONLY CONDENSED STATEMENTS OF OPERATIONS
Years Ended December 31, 2007, 2006, and 2005
(In thousands)
| | 2007
| | 2006
| | 2005
| |
|---|
| Income: | | | | | | | | | | |
| Net interest expense | | $ | (1,393 | ) | $ | (1,081 | ) | $ | (891 | ) |
| Other income | | | 49 | | | 47 | | | 83 | |
| | |
| |
| |
| |
| | Total income | | | (1,344 | ) | | (1,034 | ) | | (808 | ) |
| Expense—general and administrative | | | 2,885 | | | 2,286 | | | 2,097 | |
| | |
| |
| |
| |
| | Net loss before income taxes and equity in undistributed earnings of subsidiaries | | | (4,229 | ) | | (3,320 | ) | | (2,905 | ) |
| | |
| |
| |
| |
| Income tax benefit | | | (1,513 | ) | | (1,151 | ) | | (954 | ) |
| Equity in undistributed earnings of subsidiaries | | | 7,198 | | | 9,557 | | | 11,827 | |
| | |
| |
| |
| |
| Net income | | $ | 4,482 | | $ | 7,388 | | $ | 9,876 | |
| | |
| |
| |
| |
111
CARDINAL FINANCIAL CORPORATION AND SUBSIDIARIES
Notes to Consolidated Financial Statements (Continued)
(21) Parent Company Only Financial Statements (Continued)
PARENT COMPANY ONLY CONDENSED STATEMENTS OF CASH FLOWS
Years ended December 31, 2007, 2006, and 2005
(In thousands)
| | 2007
| | 2006
| | 2005
| |
|---|
| Cash flows from operating activities: | | | | | | | | | | |
| | Net income | | $ | 4,482 | | $ | 7,388 | | $ | 9,876 | |
| | Adjustments to reconcile net income to net cash provided by (used in) operating activities: | | | | | | | | | | |
| | | Equity in undistributed earnings of subsidiaries | | | (7,198 | ) | | (9,557 | ) | | (11,827 | ) |
| | | Depreciation | | | 113 | | | 116 | | | 123 | |
| | | Increase in other assets and decrease in other liabilities | | | 9,134 | | | (5,082 | ) | | (4,806 | ) |
| | |
| |
| |
| |
| | | | Net cash provided by (used in) operating activities | | | 6,531 | | | (7,135 | ) | | (6,634 | ) |
| | |
| |
| |
| |
Cash flows from investing activities: |
|
|
|
|
|
|
|
|
|
|
| | Capital investments in subsidiaries | | | (7,500 | ) | | — | | | (22,000 | ) |
| | Dividends received from subsidiaries | | | 300 | | | — | | | — | |
| | Purchase of other investments | | | — | | | (50 | ) | | — | |
| | Net change in premises and equipment | | | (45 | ) | | — | | | — | |
| | Net cash paid in acquisition | | | — | | | — | | | (1,379 | ) |
| | |
| |
| |
| |
| | | | Net cash used in investing activities | | | (7,245 | ) | | (50 | ) | | (23,379 | ) |
| | |
| |
| |
| |
Cash flows from financing activities: |
|
|
|
|
|
|
|
|
|
|
| | Proceeds from public stock offerings | | | — | | | — | | | 39,767 | |
| | Purchase and retirement of common stock | | | (2,724 | ) | | — | | | — | |
| | Distribution of deferred compensation balance | | | 4 | | | (3 | ) | | — | |
| | Dividends on common stock | | | (974 | ) | | (976 | ) | | (244 | ) |
| | Stock options exercised | | | 132 | | | 909 | | | 797 | |
| | |
| |
| |
| |
| | | | Net cash (used in) provided by financing activities | | | (3,562 | ) | | (70 | ) | | 40,320 | |
| | |
| |
| |
| |
| Net increase (decrease) in cash and cash equivalents | | | (4,276 | ) | | (7,255 | ) | | 10,307 | |
| Cash and cash equivalents at beginning of year | | | 13,609 | | | 20,864 | | | 10,557 | |
| | |
| |
| |
| |
| Cash and cash equivalents at end of year | | $ | 9,333 | | $ | 13,609 | | $ | 20,864 | |
| | |
| |
| |
| |
Supplemental schedule of noncash investing and financing activities: |
|
|
|
|
|
|
|
|
|
|
| | Common shares issued in acqusition of Wilson/Bennett | | $ | — | | $ | — | | $ | 4,862 | |
| | |
| |
| |
| |
112
CARDINAL FINANCIAL CORPORATION AND SUBSIDIARIES
Notes to Consolidated Financial Statements (Continued)
(22) Goodwill and Intangible Assets
Goodwill is tested for impairment on an annual basis or more frequently if events or circumstances warrant. During 2007 and 2006, the Company performed evaluations of the goodwill associated with its acquisitions of George Mason, Wilson/Bennett and Trust Services. For the year ended December 31, 2007, no impairment was indicated. For the year ended December 31, 2006, there was no impairment indicated for the goodwill associated with George Mason. Additional information is found below for the wealth management and trust services segment for 2006.
Trust Services
On February 9, 2006, the Bank acquired certain fiduciary and other assets and assumed certain liabilities of FBR National Trust Company, formerly a subsidiary of Friedman, Billings, Ramsey Group, Inc. This transaction diversifies the Bank's sources of non-interest income and allows it to provide additional services to its customers.
This transaction was accounted for as a purchase and the acquired assets and assumed liabilities were recorded at their fair values as of the purchase date. This acquisition did not have a significant impact on operating results for the year ended December 31, 2006.
The operating results of the trust division are included in the Company's consolidated operating results and its wealth management and trust services segment information since the date of acquisition.
The fair value of the net assets acquired was $380,000. The acquisition resulted in the recognition of an intangible asset for purchased customer relationships of $161,000, which is being amortized on a straight-line basis over nine years, and in the recognition of goodwill of $178,000. The Company used the assistance of an independent valuation consultant to determine the value assigned to identifiable intangible assets. Goodwill will not be amortized but will be reviewed for impairment when evidence of impairment exists or, at a minimum, on an annual basis. The Company's annual assessments of the valuation of goodwill did not indicate impairment in 2007 or 2006, and no indications of potential impairment were indicated for the customer relationship intangible.
For federal income tax purposes, the Trust Services intangibles are deductible over a 15 year period.
Wilson/Bennett
On June 29, 2006, the Company entered into an Amendment to the Employment Agreement (the "Amendment") with John W. Fisher, president and chief executive officer of Wilson/Bennett. The Amendment amended the Employment Agreement dated as of June 8, 2005 between the Company and Mr. Fisher. As provided in the Amendment, Mr. Fisher retired from the business on September 30, 2006, and agreed to assist the Company in a consulting and business development function, as requested by the Company through April 30, 2007, and to honor his non-compete agreement with the Company, which ended on September 30, 2007.
During the third quarter of 2006 and as Mr. Fisher transitioned out of his involvement with Wilson/Bennett, Mr. Fisher's announced retirement had a negative impact on the operations, customer base and assets under management with Wilson/Bennett. In particular, several significant clients unexpectedly either terminated or advised the Company that they intended to terminate their asset management contracts with Wilson/Bennett during the third quarter of 2006. In addition and as a result of this customer loss, the value of purchased customer relationships and Mr. Fisher's employment and
113
CARDINAL FINANCIAL CORPORATION AND SUBSIDIARIES
Notes to Consolidated Financial Statements (Continued)
(22) Goodwill and Intangible Assets (Continued)
non-compete agreement decreased. Accordingly, the Company updated the analysis of the fair value of the goodwill and intangible assets associated with the acquisition of Wilson/Bennett. The analysis was prepared using valuation techniques, including the discounted cash flow approach. The updated analysis indicated that goodwill and intangibles related to Wilson/Bennett, a division of wealth management and trust services segment, were impaired. As a result, the Company recorded non-cash impairment charges of $2.0 million associated with Mr. Fisher's employment agreement and the customer relationship intangible assets recognized as part of the Wilson/Bennett acquisition. The Company also recorded an additional $960,000 of impairment charges associated with the goodwill of Wilson/Bennett.
George Mason
During the fourth quarter of 2007, the Company evaluated the customer relationship amortizing intangibles it has for George Mason. These intangible assets are related to the relationships that George Mason has with other mortgage lenders and its managed companies, which are mortgage companies that are owned by local home builders. George Mason provides services to these managed companies and earns management fee income, which generally fluctuates based on the volume of loan sales. As a result of the downturn in the regional housing market, fee income from managed companies decreased $1.1 million, or 52% for the year to date December 31, 2007 as compared to the same period of 2006. This adverse change in the business climate caused the Company to evaluate the intangible assets related to these managed companies for impairment under SFAS No. 144. The Company evaluated for possible impairment by comparing the estimated future cash flows on an undiscounted basis from the managed companies with the net book value of these intangible assets. This evaluation did not result in an impairment loss in 2007.
Amortizable intangibles at December 31, 2007 are as follows:
| | Mortgage Banking
| | Wealth Management and Trust Services
| | Total
|
|---|
| | Gross
Carrying
Amount
| | Accumulated
Amortization
| | Gross
Carrying
Amount
| | Accumulated
Amortization
| | Gross
Carrying
Amount
| | Accumulated
Amortization
|
|---|
| | (In thousands)
|
|---|
| Balances at December 31, 2005 | | $ | 1,781 | | $ | 247 | | $ | 2,602 | | $ | 211 | | $ | 4,383 | | $ | 458 |
2006 activity: |
|
|
|
|
|
|
|
|
|
|
|
|
|
|
|
|
|
|
| | Customer relationship intangibles | | | — | | | 198 | | | (1,294 | ) | | 120 | | | (1,294 | ) | | 318 |
| | Employment/non-compete agreement | | | — | | | — | | | (513 | ) | | 87 | | | (513 | ) | | 87 |
| | Trade name | | | — | | | — | | | — | | | 15 | | | — | | | 15 |
| | |
| |
| |
| |
| |
| |
|
| Balances at December 31, 2006 | | | 1,781 | | | 445 | | | 795 | | | 433 | | | 2,576 | | | 878 |
2007 activity: |
|
|
|
|
|
|
|
|
|
|
|
|
|
|
|
|
|
|
| | Customer relationship intangibles | | | — | | | 198 | | | — | | | 38 | | | — | | | 236 |
| | Trade name | | | — | | | — | | | — | | | 18 | | | — | | | 18 |
| | |
| |
| |
| |
| |
| |
|
| Balances at December 31, 2007 | | $ | 1,781 | | $ | 643 | | $ | 795 | | $ | 489 | | $ | 2,576 | | $ | 1,132 |
| | |
| |
| |
| |
| |
| |
|
The decrease in the gross carrying amounts of the customer relationship intangibles in 2006 of $1.3 million includes the impairment charge of $1.5 million related to Wilson/Bennett and acquired customer relationships related to the Trust Services acquisition of $161,000. The decrease in the gross
114
CARDINAL FINANCIAL CORPORATION AND SUBSIDIARIES
Notes to Consolidated Financial Statements (Continued)
(22) Goodwill and Intangible Assets (Continued)
carrying amount of the employment/non-compete agreement in 2006 of $513,000 is the impairment charge related to Wilson/Bennett.
The aggregate amortization expense for 2007, 2006, and 2005 was $254,000, $420,000, and $409,000, respectively. The estimated amortization expense for the next five years is as follows:
| | (In thousands)
|
|---|
| 2008 | | $ | 245 |
| 2009 | | | 238 |
| 2010 | | | 238 |
| 2011 | | | 238 |
| 2012 | | | 238 |
| Thereafter | | | 247 |
The changes in the carrying amount of goodwill for the years ended December 31, 2007 and 2006 were as follows:
| | Commercial
Banking
| | Mortgage
Banking
| | Wealth
Management and
Trust Services
| | Total
| |
|---|
| | (In thousands)
| |
|---|
| Balance at December 31, 2005 | | $ | 22 | | $ | 12,941 | | $ | 3,614 | | $ | 16,577 | |
2006 activity: |
|
|
|
|
|
|
|
|
|
|
|
|
|
| | Trust division acquisition | | | — | | | — | | | 178 | | | 178 | |
| | Goodwill impairment charge | | | — | | | — | | | (960 | ) | | (960 | ) |
| | |
| |
| |
| |
| |
| Balance at December 31, 2006 | | | 22 | | | 12,941 | | | 2,832 | | | 15,795 | |
| | |
| |
| |
| |
| |
2007 activity: |
|
|
|
|
|
|
|
|
|
|
|
|
|
| | None | | | — | | | — | | | — | | | — | |
| | |
| |
| |
| |
| |
| Balance at December 31, 2007 | | $ | 22 | | $ | 12,941 | | $ | 2,832 | | $ | 15,795 | |
| | |
| |
| |
| |
| |
115
CARDINAL FINANCIAL CORPORATION AND SUBSIDIARIES
Notes to Consolidated Financial Statements (Continued)
(23) Other Operating Expenses
The following shows the composition of other operating expenses for the years ended December 31, 2007, 2006, and 2005:
| | 2007
| | 2006
| | 2005
|
|---|
| | (In thousands)
|
|---|
| Stationary and supplies | | $ | 1,091 | | $ | 1,374 | | $ | 1,551 |
| Advertising and marketing | | | 2,058 | | | 2,026 | | | 1,993 |
| Other taxes | | | 1,701 | | | 1,572 | | | 1,422 |
| Travel and entertainment | | | 492 | | | 776 | | | 763 |
| Bank operations | | | 1,234 | | | 719 | | | 860 |
| Premises and equipment | | | 1,771 | | | 1,675 | | | 1,400 |
| FDIC insurance assessments | | | 768 | | | 139 | | | 121 |
| Miscellaneous | | | 2,090 | | | 1,833 | | | 1,579 |
| | |
| |
| |
|
| Total non-interest expense | | $ | 11,205 | | $ | 10,114 | | $ | 9,689 |
| | |
| |
| |
|
(24) SAB 108 Cumulative Effect Adjustment
In September 2006, the Securities and Exchange Commission (SEC) issued Staff Accounting Bulletin No. 108 ("SAB 108"),Considering the Effects of Prior Year Misstatements when Quantifying Misstatements in Current Year Financial Statements. SAB 108 was issued in order to eliminate the diversity in practice surrounding how public companies quantify financial statement misstatements.
Traditionally, there have been two widely-recognized methods for quantifying the effects of financial statement misstatements: the "roll-over" method and the "iron curtain" method. The roll-over method focuses primarily on the impact of a misstatement on the income statement—including the reversing effect of prior year misstatements—but its use can lead to the accumulation of misstatements in the balance sheet. The iron-curtain method, on the other hand, focuses primarily on the effect of correcting the period-end balance sheet with less emphasis on the reversing effects of prior year errors on the income statement. Prior to the application of the guidance in SAB 108, the Company used the roll-over method for quantifying financial statement misstatements.
In SAB 108, the SEC staff established an approach that requires quantification of financial statement misstatements based on the effects of the misstatements on each of the Company's financial statements and the related financial statement disclosures. This model is commonly referred to as a "dual approach" because it requires quantification of errors under both the iron curtain and the roll-over methods.
SAB 108 permits existing public companies to initially apply its provisions either by (i) restating prior financial statements as if the "dual approach" had always been applied or (ii) recording the cumulative effect of initially applying the "dual approach" as adjustments to the carrying values of assets and liabilities as of January 1, 2006 with an offsetting adjustment recorded to the opening balance of retained earnings.
The Company identified the following errors through the application of its internal controls over financial reporting and had concluded that the individual errors were immaterial under the roll-over method for the periods indicated. However, when applying the dual approach, and after considering all relevant quantitative and qualitative factors, the Company concluded that these misstatements are
116
CARDINAL FINANCIAL CORPORATION AND SUBSIDIARIES
Notes to Consolidated Financial Statements (Continued)
(24) SAB 108 Cumulative Effect Adjustment (Continued)
material to the 2006 financial statements when considering the aggregate impact. For this reason, the Company corrected the errors through the recording of cumulative effect adjustments to retained earnings as of January 1, 2006:
| | Period in which misstatement originated(1)
| | Adjustment Recorded as of January 1,
| |
|---|
| | 2002
| | 2003
| | 2004
| | 2005
| | 2006
| |
|---|
| | (In thousands)
| |
|---|
| Accounts receivable(2) | | $ | — | | $ | — | | $ | — | | $ | (72 | ) | $ | (72 | ) |
| Compensation expense(3) | | | (41 | ) | | (38 | ) | | (38 | ) | | (38 | ) | | (155 | ) |
| Deferred loan fees and costs(4) | | | — | | | — | | | (31 | ) | | (135 | ) | | (166 | ) |
| Deferred tax asset(5) | | | 14 | | | 13 | | | 24 | | | 86 | | | 137 | |
| Federal income taxes payable(6) | | | — | | | (69 | ) | | (113 | ) | | — | | | (182 | ) |
| | |
| |
| |
| |
| |
| |
| Impact on net income(7) | | $ | (27 | ) | $ | (94 | ) | $ | (158 | ) | $ | (159 | ) | $ | (438 | ) |
| | |
| |
| |
| |
| |
| |
| Non-net income impact: | | | | | | | | | | | | | | | | |
| Additional paid-in capital(8) | | $ | 5 | | $ | 7 | | $ | 6 | | $ | 7 | | $ | 25 | |
| | |
| |
| |
| |
| |
| |
| Net effect of adjustments(9) | | | | | | | | | | | | | | $ | (413 | ) |
| | | | | | | | | | | | | | |
| |
- (1)
- The Company quantified these errors under the roll-over method and concluded that they were immaterial individually and in the aggregate.
- (2)
- Accounts receivable related to the Company's Wilson/Bennett subsidiary was overstated by $72,000 during 2005, resulting in an overstatement of investment fee income by the same amount. The Company recorded a $72,000 reduction to accounts receivable as of January 1, 2006 with a corresponding reduction in retained earnings to correct these misstatements.
- (3)
- The Company did not recognize stock compensation expense related to stock options granted with an exercise price that was less than the fair market value of the Company's stock on the grant date in 2002. As a result of this error, compensation expense was understated by $155,000 (cumulative) in the years prior to 2006. The Company recorded a $155,000 increase in accrued compensation as of January 1, 2006 with a corresponding reduction in retained earnings to correct these misstatements.
- (4)
- The Company incorrectly recognized mortgage origination fees associated with loans held for investment into income rather than amortizing the fees over the lives of the loans, in accordance with SFAS No. 91Accounting for Nonrefundable Fees and Costs Associated with Originating or Acquiring Loans and Initial Direct Costs of Leases. As a result, the Company overstated gain on sale of loans by $166,000 (cumulative) in 2005 and 2004. The Company recorded an increase to deferred loan fees in the amount of $166,000 as of January 1, 2006 with a corresponding reduction in retained earnings to correct these misstatements.
- (5)
- As a result of the misstatements described above, the provision for income taxes was overstated by $137,000 (cumulative) in the years prior to 2006. The Company recorded an increase in deferred tax assets in the amount of $137,000 as of January 1, 2006 with a corresponding increase in retained earnings to correct these misstatements.
117
CARDINAL FINANCIAL CORPORATION AND SUBSIDIARIES
Notes to Consolidated Financial Statements (Continued)
(24) SAB 108 Cumulative Effect Adjustment (Continued)
- (6)
- The Company incorrectly recorded alternative minimum tax credits that were not properly established. As a result, the Company understated the tax provision by $69,000 in 2003 and $113,000 in 2004. The Company recorded an increase in federal income tax payable of $182,000 as of January 1, 2006, with a corresponding reduction in retained earnings to correct these misstatements.
- (7)
- Represents the net over-statement of net income for the indicated periods resulting from these misstatements.
- (8)
- Represents the reclassification from accrued compensation cost to additional paid-in capital for the options that were exercised with a fair market value greater than the assigned exercise price. Refer to (3) above for a summary related to the accrued stock compensation errors that were corrected.
- (9)
- Represents the net reduction in shareholder's equity recorded as of January 1, 2006 for the initial application of SAB 108.
118
Item 9. Changes in and Disagreements with Accountants on Accounting and Financial Disclosure
No changes in the Company's independent accountants or disagreements on accounting and financial disclosure required to be reported hereunder have taken place.
Item 9A. Controls and Procedures
Disclosure Controls and Procedures
The Company maintains disclosure controls and procedures that are designed to provide assurance that information required to be disclosed by the Company in the reports that it files or submits under the Securities Exchange Act of 1934 is recorded, processed, summarized and reported within the time periods required by the Securities and Exchange Commission. An evaluation of the effectiveness of the design and operation of the Company's disclosure controls and procedures as of the end of the period covered by this report was carried out under the supervision and with the participation of management, including the Company's Chief Executive Officer and Chief Financial Officer. Based on the evaluation, the aforementioned officers concluded that the Company's disclosure controls and procedures were effective as of the end of such period.
Management's Report on Internal Control over Financial Reporting
Management of the Company is responsible for establishing and maintaining adequate internal control over financial reporting as defined in Rule 13a-15(f) under the Securities Exchange Act of 1934. The Company's internal control over financial reporting is designed to provide reasonable assurance regarding the reliability of the Company's financial reporting and the preparation of published financial statements in accordance with generally accepted accounting principles.
Because of its inherent limitations, internal control over financial reporting may not prevent or detect misstatements. Therefore, even those systems determined to be effective can provide only reasonable assurance with respect to financial statement preparation and presentation. Also, projections of any evaluation of effectiveness to future periods are subject to the risk that controls may become inadequate because of changes in conditions, or that the degree of compliance with the policies or procedures may deteriorate.
Management assessed the effectiveness of the Company's internal control over financial reporting as of December 31, 2007. In making this assessment, management used the criteria set forth by the Committee of Sponsoring Organizations of the Treadway Commission (COSO) inInternal Control-Integrated Framework. Based on management's assessment, management believes that as of December 31, 2007, the Company's internal control over financial reporting was effective based on criteria set forth by COSO inInternal Control-Integrated Framework.
Management's assessment of the effectiveness of internal control over financial reporting as of December 31, 2007, has been audited by KPMG LLP, the independent registered public accounting firm that also audited the Company's consolidated financial statements. KPMG LLP's attestation report on management's assessment of the Company's internal control over financial reporting appears on page 70 hereof.
Changes in Internal Control Over Financial Reporting
There was no change in the Company's internal control over financial reporting identified in connection with the evaluation of internal controls that occurred during the fourth quarter of 2007 that has materially affected, or is reasonably likely to materially affect, the Company's internal control over financial reporting.
Item 9B. Other Information
None.
119
PART III
Item 10. Directors, Executive Officers and Corporate Governance
Pursuant to General Instruction G(3) of Form 10-K, the information contained in the "Election of Directors" section and under the headings "Executive Officers," "Independence of the Directors," "The Committees of the Board of Directors," "Code of Ethics" and "Section 16(a) Beneficial Ownership Reporting Compliance" in the Company's Proxy Statement for the 2008 Annual Meeting of Shareholders is incorporated herein by reference.
Item 11. Executive Compensation
Pursuant to General Instruction G(3) of Form 10-K, the information contained in the "Executive Compensation" section (except for the "Compensation Committee Report on Executive Compensation") and under the heading "Director Compensation" in the Company's Proxy Statement for the 2008 Annual Meeting of Shareholders is incorporated herein by reference.
Item 12. Security Ownership of Certain Beneficial Owners and Management and Related Stockholder Matters
Security Ownership of Certain Beneficial Owners and Management. Pursuant to General Instruction G(3) of Form 10-K, the information contained under the headings "Security Ownership of Directors and Executive Officers" and "Security Ownership of Certain Beneficial Owners" in the Company's Proxy Statement for the 2008 Annual Meeting of Shareholders is incorporated herein by reference.
Equity Compensation Plan Information. The following table sets forth information as of December 31, 2007, with respect to compensation plans under which shares of our Common Stock are authorized for issuance.
Plan Category
| | Number of Securities
to Be Issued upon
Exercise of
Outstanding Options,
Warrants and Rights
| | Weighted Average
Exercise Price of
Outstanding Options,
Warrants and Rights
| | Number of Securities
Remaining Available
for Future Issuance
Under Equity
Compensation Plans(1)
|
|---|
| Equity Compensation Plans Approved by Shareholders | | | | | | | |
| 1999 Stock Plan | | 324,494 | | $ | 4.60 | | 16,371 |
| 2002 Equity Compensation Plan | | 2,103,859 | | $ | 9.13 | | 217,058 |
| Equity Compensation Plans Not Approved by Shareholders(2) | | — | | | — | | — |
| | |
| |
| |
|
| Total | | 2,428,353 | | $ | 8.53 | | 233,429 |
| | |
| |
| |
|
- (1)
- Amounts exclude any securities to be issued upon exercise of outstanding options, warrants and rights.
- (2)
- The Company does not have any equity compensation plans that have not been approved by shareholders.
Item 13. Certain Relationships and Related Transactions, and Director Independence
Pursuant to General Instruction G(3) of Form 10-K, the information contained under the heading "Certain Relationships and Related Transactions" in the Company's Proxy Statement for the 2008 Annual Meeting of Shareholders is incorporated herein by reference.
Item 14. Principal Accounting Fees and Services
Pursuant to General Instruction G(3) of Form 10-K, the information contained under the headings "Fees of Independent Public Accountants" and "Audit Committee Pre-Approval Policies and Procedures," in the Company's Proxy Statement for the 2008 Annual Meeting of Shareholders is incorporated herein by reference.
120
Part IV
Item 15. Exhibits, Financial Statement Schedules
(a) |
|
(1) and (2) The response to this portion of Item 15 is included in Item 8 above. |
|
|
(3) |
|
Exhibits |
|
|
|
|
3.1 |
|
Articles of Incorporation of Cardinal Financial Corporation (incorporated by reference to Exhibit 3.1 to the Registration Statement on Form SB-2, Registration No. 333-82946 (the "Form SB-2")). |
|
|
|
|
3.2 |
|
Articles of Amendment to the Articles of Incorporation of Cardinal Financial Corporation, setting forth the designation for the Series A Preferred Stock (incorporated by reference to Exhibit 3.2 to the Form SB-2). |
|
|
|
|
3.3 |
|
Bylaws of Cardinal Financial Corporation (restated in electronic format as of December 19, 2007) (incorporated by reference to Exhibit 3.1 to the Current Report on Form 8-K filed December 21, 2007). |
|
|
|
|
4.1 |
|
Form of Common Stock Certificate (incorporated by reference to Exhibit 4.1 to the Form SB-2). |
|
|
|
|
10.1 |
|
Employment Agreement, dated as of February 12, 2002, between Cardinal Financial Corporation and Bernard H. Clineburg (incorporated by reference to Exhibit 10.1 to the Form SB-2).* |
|
|
|
|
10.2 |
|
Executive Employment Agreement, dated as of February 12, 2002, between Cardinal Financial Corporation and Christopher W. Bergstrom (incorporated by reference to Exhibit 10.5 to the Form SB-2).* |
|
|
|
|
10.3 |
|
Cardinal Financial Corporation 1999 Stock Option Plan, as amended (incorporated by reference to Exhibit 10.7 to the Form SB-2).* |
|
|
|
|
10.4 |
|
Cardinal Financial Corporation 2002 Equity Compensation Plan, as amended and restated April 21, 2006 (incorporated by reference to Exhibit 4.4 to the Registration Statement on Form S-8, Registration No. 333-134923).* |
|
|
|
|
10.5 |
|
Cardinal Financial Corporation Executive Deferred Income Plan, as amended and restated April 21, 2006 (incorporated by reference to Exhibit 4.4 to the Registration Statement on Form S-8, Registration No. 333-134934).* |
|
|
|
|
10.6 |
|
Cardinal Financial Corporation Directors Deferred Income Plan, as amended and restated April 21, 2006 (incorporated by reference to Exhibit 4.5 to the Registration Statement on Form S-8, Registration No. 333-134934).* |
|
|
|
|
10.7 |
|
George Mason Mortgage, LLC Executive Deferred Income Plan, as amended and restated April 21, 2006 (incorporated by reference to Exhibit 4.6 to the Registration Statement on Form S-8, Registration No. 333-134934).* |
|
|
|
|
10.8 |
|
Executive Employment Agreement, dated March 1, 2004, between Cardinal Financial Corporation and Kim C. Liddell (incorporated by reference to Exhibit 10.1 to the Quarterly Report on Form 10-Q for the period ended March 31, 2006).* |
|
|
|
|
10.9 |
|
Executive Employment Agreement, dated November 7, 2007, between Cardinal Financial Corporation and Kendal E. Carson (incorporated by reference to Exhibit 10.1 to the Quarterly Report on Form 10-Q for the period ended September 30, 2007).* |
121
|
|
|
|
10.10 |
|
Supplemental Executive Retirement Plan, dated November 7, 2007, between Cardinal Financial Corporation and Kendal E. Carson (incorporated by reference to Exhibit 10.2 to the Quarterly Report on Form 10-Q for the period ended September 30, 2007).* |
|
|
|
|
10.11 |
|
Form of Incentive Stock Option Agreement* |
|
|
|
|
21 |
|
Subsidiaries of Cardinal Financial Corporation. |
|
|
|
|
23 |
|
Consent of KPMG LLP. |
|
|
|
|
31.1 |
|
Rule 13a-14(a) Certification of Chief Executive Officer. |
|
|
|
|
31.2 |
|
Rule 13a-14(a) Certification of Chief Financial Officer. |
|
|
|
|
32.1 |
|
Statement of Chief Executive Officer Pursuant to 18 U.S.C. § 1350. |
|
|
|
|
32.2 |
|
Statement of Chief Financial Officer Pursuant to 18 U.S.C. § 1350. |
- *
- Management contracts and compensatory plans and arrangements.
- (b)
- Exhibits
- See Item 15(a)(3) above.
- (c)
- Financial Statement Schedules
- See Item 15(a)(2) above.
122
SIGNATURES
Pursuant to the requirements of Section 13 and 15 (d) of the Securities Exchange Act of 1934, as amended, the registrant has duly caused this report to be signed on its behalf by the undersigned, thereunto duly authorized.
| | | CARDINAL FINANCIAL CORPORATION |
March 17, 2008 |
|
By: |
/s/ BERNARD H. CLINEBURG
Name: Bernard H. Clineburg
Title:Chairman and Chief Executive Officer |
Pursuant to the requirements of the Securities Exchange Act of 1934, as amended, this report has been signed below by the following persons on behalf of the registrant and in the capacities indicated on March 17, 2008.
Signatures
| | Titles
|
|---|
|
|
|
/s/ BERNARD H. CLINEBURG
Name: Bernard H. Clineburg | | Chairman and Chief Executive Officer
(Principal Executive Officer) |
/s/ MARK A. WENDEL
Name: Mark A. Wendel |
|
Executive Vice President and Chief Financial Officer
(Principal Financial Officer) |
/s/ JENNIFER L. DEACON
Name: Jennifer L. Deacon |
|
Senior Vice President and Controller (Principal Accounting Officer) |
/s/ B.G. BECK
Name: B. G. Beck |
|
Director |
/s/ WILLIAM G. BUCK
Name: William G. Buck |
|
Director |
/s/ SIDNEY O. DEWBERRY
Name: Sidney O. Dewberry |
|
Director |
/s/ MICHAEL A. GARCIA
Name: Michael A. Garcia |
|
Director |
/s/ J. HAMILTON LAMBERT
Name: J. Hamilton Lambert |
|
Director |
123
/s/ ALAN G. MERTEN
Name: Alan G. Merten |
|
Director |
/s/ WILLIAM E. PETERSON
Name: William E. Peterson |
|
Director |
/s/ JAMES D. RUSSO
Name: James D. Russo |
|
Director |
/s/ JOHN H. RUST, JR.
Name: John H. Rust, Jr. |
|
Director |
/s/ GEORGE P. SHAFRAN
Name: George P. Shafran |
|
Director |
/s/ ALICE M. STARR
Name: Alice M. Starr |
|
Director |
124
EXHIBIT INDEX
Number
| | Description
|
|---|
| 3.1 | | Articles of Incorporation of Cardinal Financial Corporation (incorporated by reference to Exhibit 3.1 to the Registration Statement on Form SB-2, Registration No. 333-82946 (the "Form SB-2") ). |
3.2 |
|
Articles of Amendment to the Articles of Incorporation of Cardinal Financial Corporation, setting forth the designation for the Series A Preferred Stock (incorporated by reference to Exhibit 3.2 to the Form SB-2). |
3.3 |
|
Bylaws of Cardinal Financial Corporation (restated in electronic format as of December 19, 2007) (incorporated by reference to Exhibit 3.1 to the Current Report on Form 8-K filed December 21, 2007). |
4.1 |
|
Form of Common Stock Certificate (incorporated by reference to Exhibit 4.1 to the Form SB-2). |
10.1 |
|
Employment Agreement, dated as of February 12, 2002, between Cardinal Financial Corporation and Bernard H. Clineburg (incorporated by reference to Exhibit 10.1 to the Form SB-2).* |
10.2 |
|
Executive Employment Agreement, dated as of February 12, 2002, between Cardinal Financial Corporation and Christopher W. Bergstrom (incorporated by reference to Exhibit 10.5 to the Form SB-2).* |
10.3 |
|
Cardinal Financial Corporation 1999 Stock Option Plan, as amended (incorporated by reference to Exhibit 10.7 to the Form SB-2).* |
10.4 |
|
Cardinal Financial Corporation 2002 Equity Compensation Plan, as amended and restated April 21, 2006 (incorporated by reference to Exhibit 4.4 to the Registration Statement on Form S-8, Registration No. 333-134923).* |
10.5 |
|
Cardinal Financial Corporation Executive Deferred Income Plan, as amended and restated April 21, 2006 (incorporated by reference to Exhibit 4.4 to the Registration Statement on Form S-8, Registration No. 333-134934).* |
10.6 |
|
Cardinal Financial Corporation Directors Deferred Income Plan, as amended and restated April 21, 2006 (incorporated by reference to Exhibit 4.5 to the Registration Statement on Form S-8, Registration No. 333-134934).* |
10.7 |
|
George Mason Mortgage, LLC Executive Deferred Income Plan, as amended and restated April 21, 2006 (incorporated by reference to Exhibit 4.6 to the Registration Statement on Form S-8, Registration No. 333-134934).* |
10.8 |
|
Executive Employment Agreement, dated March 1, 2004, between Cardinal Financial Corporation and Kim C. Liddell (incorporated by reference to Exhibit 10.1 to the Quarterly Report on Form 10-Q for the period ended March 31, 2006).* |
10.9 |
|
Executive Employment Agreement, dated November 7, 2007, between Cardinal Financial Corporation and Kendal E. Carson (incorporated by reference to Exhibit 10.1 to the Quarterly Report on Form 10-Q for the period ended September 30, 2007).* |
10.10 |
|
Supplemental Executive Retirement Plan, dated November 7, 2007, between Cardinal Financial Corporation and Kendal E. Carson (incorporated by reference to Exhibit 10.2 to the Quarterly Report on Form 10-Q for the period ended September 30, 2007).* |
10.11 |
|
Form of Incentive Stock Option Agreement* |
21 |
|
Subsidiaries of Cardinal Financial Corporation. |
23 |
|
Consent of KPMG LLP. |
31.1 |
|
Rule 13a-14(a) Certification of Chief Executive Officer. |
31.2 |
|
Rule 13a-14(a) Certification of Chief Financial Officer. |
32.1 |
|
Statement of Chief Executive Officer Pursuant to 18 U.S.C. § 1350. |
32.2 |
|
Statement of Chief Financial Officer Pursuant to 18 U.S.C. § 1350. |
- *
- Management contracts and compensatory plans and arrangements.
QuickLinks
DOCUMENTS INCORPORATED BY REFERENCETABLE OF CONTENTSPART IPART IISelected Financial Data (In thousands, except per share data)Reconciliation of GAAP to Non-GAAP Financial Measures Years Ended December 31, 2007, 2006 and 2005 (In thousands, except per share data)Average Balance Sheets and Interest Rates on Interest-Earning Assets and Interest-Bearing Liabilities Years Ended December 31, 2007, 2006 and 2005 (In thousands)Rate and Volume Analysis Years Ended December 31, 2007, 2006 and 2005 (In thousands)Allowance for Loan Losses Years Ended December 31, 2007, 2006, 2005, 2004, and 2003 (In thousands)Allocation of the Allowance for Loan Losses At December 31, 2007, 2006, 2005, 2004, and 2003 (In thousands)Non-Interest Income Years Ended December 31, 2007, 2006, and 2005 (In thousands)Non-Interest Expense Years Ended December 31, 2007, 2006, and 2005 (In thousands)Loans Receivable At December 31, 2007, 2006, 2005, 2004, and 2003 (In thousands)Nonperforming Loans At December 31, 2007, 2006, 2005, 2004, and 2003 (In thousands)Loan Maturities and Interest Rate Sensitivity At December 31, 2007 (In thousands)Investment Securities At December 31, 2007, 2006, and 2005 (In thousands)Short-Term Borrowings and Other Borrowed Funds At December 31, 2007 (In thousands)Certificates of Deposit of $100,000 or More At December 31, 2007, 2006, and 2005 (In thousands)Segment Reporting December 31, 2007, 2006, and 2005 (In thousands)Capital Components At December 31, 2007, 2006, and 2005 (In thousands)Contractual Obligations At December 31, 2007 (In thousands)Quarterly Data Years ended December 31, 2007 and 2006 (In thousands, except per share data)Report of Independent Registered Public Accounting FirmCARDINAL FINANCIAL CORPORATION AND SUBSIDIARIES CONSOLIDATED STATEMENTS OF CONDITION December 31, 2007 and 2006 (In thousands, except share data)CARDINAL FINANCIAL CORPORATION AND SUBSIDIARIES CONSOLIDATED STATEMENTS OF INCOME Years Ended December 31, 2007, 2006, and 2005 (In thousands, except per share data)CARDINAL FINANCIAL CORPORATION AND SUBSIDIARIES CONSOLIDATED STATEMENTS OF COMPREHENSIVE INCOME Years Ended December 31, 2007, 2006, and 2005 (In thousands)CARDINAL FINANCIAL CORPORATION AND SUBSIDIARIES CONSOLIDATED STATEMENTS OF CHANGES IN SHAREHOLDERS' EQUITY Years Ended December 31, 2007, 2006, and 2005 (In thousands)CARDINAL FINANCIAL CORPORATION AND SUBSIDIARIES CONSOLIDATED STATEMENTS OF CASH FLOWS Years Ended December 31, 2007, 2006, and 2005 (In thousands)CARDINAL FINANCIAL CORPORATION AND SUBSIDIARIES Notes to Consolidated Financial StatementsPARENT COMPANY ONLY CONDENSED STATEMENTS OF CONDITION December 31, 2007 and 2006 (In thousands)PARENT COMPANY ONLY CONDENSED STATEMENTS OF OPERATIONS Years Ended December 31, 2007, 2006, and 2005 (In thousands)PARENT COMPANY ONLY CONDENSED STATEMENTS OF CASH FLOWS Years ended December 31, 2007, 2006, and 2005 (In thousands)PART IIIPart IVSIGNATURESEXHIBIT INDEX