SECURITIES AND EXCHANGE COMMISSION
Washington, D.C. 20549
(Exact name of registrant as specified in charter)
(Address of principal executive offices) (Zip code)
(Name and address of agent for service)


Badgley Growth Fund
| TABLE OF CONTENTS | |
3 | Letter to Shareholders |
4 | Performance Graphs |
6 | Statements of Assets and Liabilities |
7 | Statements of Operations |
8 | Statements of Changes in Net Assets |
10 | Financial Highlights |
12 | Schedule of Investments |
23 | Notes to the Financial Statements |
28 | Report of Independent Registered Public Accounting Firm |
29 | Directors and Officers |
This report is not authorized unless accompanied or preceded by a prospectus for Badgley Funds, Inc. The Badgley Funds are distributed by Rafferty Capital Markets, LLC. The date of first use of this annual report is July 30, 2004. | |
| 2 BADGLEY FUNDS ANNUAL REPORT | ||
| Dear Fellow Shareholders: |
We are pleased to provide you with the 2004 Annual Report of the Badgley Funds, Inc. (the “Funds”). To begin, we would like to take this opportunity to convey our gratitude for your investment in the Badgley Funds. We thank you for the trust you place in Badgley Funds, Inc. and your confidence in the team of portfolio managers at the Funds’ investment adviser, Seattle-based Badgley, Phelps and Bell, Inc. (“BP&B”). |
This Annual Report summarizes the activities of the Badgley Growth Fund (BMFGX) and the Badgley Balanced Fund (BMFBX) for the one year period ending May 31, 2004. As they have done since the inception of the Funds in 1998, PricewaterhouseCoopers LLP audited the Funds’ financial statements, contained in the following pages. |
| Performance and Market Trends |
The Funds earned positive total returns for the year ended May 31, 2004. The Badgley Growth Fund was up 16.27% and the Badgley Balanced Fund finished the year up 7.25%. For the same time period the S&P 500 Index rose 18.33%, while the Lehman Brothers Government/Credit Intermediate Index (LBGCI) fell slightly, posting a -0.44% return. (These figures and additional performance information are detailed in the graphs on the following pages.) |
| In the recent past we have reported to you about the effect of market cycle rotations on the performance of the high-quality stocks and bonds in the Badgley Funds. We have noted that in periods of recovery immediately following bear markets, lower quality investments and highly cyclical stocks tend to be favored. This trend continued to dominate the markets through the end of 2003 and accounts for the relative underperformance of the Funds for the year as compared to the benchmarks. Since it is impossible to predict the timing and duration of market cycles, BP&B maintains a deliberate and consistent investment strategy through all market environments and does not chase after uncertain short-term performance gains. The long-term investment philosophy utilized in the management of the Badgley Funds allows you to benefit from the long-term performance gains associated with strong, well-managed companies dom inant in their respective marketplaces. In addition, the Funds’ performance is not eroded by excessive transaction costs resulting from a high volume of trading, or turnover, in the portfolios. |
| The arrival of 2004 seems to have signaled the advent of the next phase of the market cycle: a return to favor by high quality stocks. Jarred by sobering political and economic headlines and seeking stability in their portfolios, investors have returned to the fundamentals of prudent investing. Once again, companies with strong underlying characteristics which speak to the long-term sustainability of earnings and dividend yields are being rewarded with rising stock prices for their consistent and dynamic management. Evidence of this positive rotation in the market cycle is seen in the 2004 year-to-date returns for the stocks in the Funds relative to the S&P 500. For the five-month period ending May 31, 2004, the all-stock Badgley Growth Fund was up 2.69%, while the S&P 500 posted a 1.47% return. Though high-quality bonds have not yet rotated back into favor, we remain convinced it is only a matter of time before they will. In the meantime, the inherent stability of a balanced portfolio is clearly demonstrated in the returns for the Badgley Balanced Fund for the five-month period ending May 31, 2004. The out-performance of the high-quality stocks in the Fund buoyed the Fund’s return, keeping it at a positive 0.99%. For this same period, the LBGCI bond-only index was down by -0.41%. |
| Compliance Update |
The SEC continues to strengthen its regulations for investment companies and advisers alike and we anticipate this trend will continue, particularly in light of the ongoing investigations into the various scandals that have, of late, plagued our industry. Recent regulatory changes address areas such as market timing, the disclosure of portfolio holdings, and new requirements governing the role of the Chief Compliance Officer. Your Board of Directors and everyone at Badgley Funds, Inc. continues to work diligently to meet these regulatory changes. |
A Note from New Fund President, J. Kevin Callaghan |
| In March of this year, your Badgley Funds Board of Directors elected me President of the Funds. Since the Funds’ inception, I have served as a director and co-chairman of the Board. In order to better focus my attention on my new role, I stepped down from the co-chair position when I accepted the role of president. It is an honor to have been chosen for the post and very exciting to step into the trenches. My long experience on the Board allows me to translate the Board’s vision for the Funds directly into the daily decision-making. I am delighted to be serving you in this new capacity and I welcome your feedback. |
*** |
| Once again, we would like to extend our sincere thanks to you for your investment in the Badgley Funds. We are available by email or phone, at 1-877-223-4539, or you may contact us by mail with any comments, suggestions or questions. We look forward to hearing from you and serving you in the year ahead. |
| Sincerely, |
| Badgley Funds, Inc. | |||
| /s/ J. KEVIN CALLAGHAN | /s/ LISA P. GUZMAN | ||
J. KEVIN CALLAGHAN | LISA P. GUZMAN Treasurer and Secretary lisag@badgley.com | ||
|
| BADGLEY FUNDS ANNUAL REPORT 3 | ||
Badgley Balanced Fund
One Year | Five Year | Since Inception June 25, 1998 | ||
| Badgley Balanced Fund | 7.25% | 2.24% | 3.32% | |
| Lehman Brothers Intermediate | ||||
| Gov’t./Credit Bond Index | -0.44% | 6.71% | 6.36% | |
| S&P 500 Index | 18.33% | -1.52% | 1.33% | |
| 4 BADGLEY FUNDS ANNUAL REPORT | ||
Badgley Growth Fund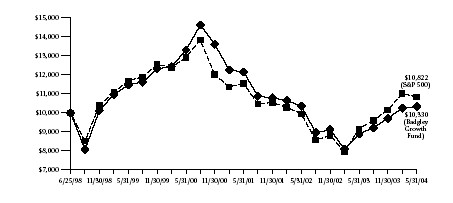
One Year | Five Year | Since Inception June 25, 1998 | ||
| Badgley Growth Fund | 16.27% | -2.06% | 0.55% | |
| S&P 500 Index | 18.33% | -1.52% | 1.33% | |
| ||
| BADGLEY FUNDS ANNUAL REPORT 5 | ||
Balanced Fund | Growth Fund | ||||||
ASSETS: | |||||||
| Investments, at market value | |||||||
| (cost of $27,981,677 and $12,547,671, respectively) | $ | 31,693,171 | $ | 15,853 | |||
| Interest receivable | 226,725 | 699 220 | |||||
| Receivable for Fund shares purchased | 13,333 | 437,639 | |||||
| Dividends receivable | 11,812 | 10,988 | |||||
| Receivable from Adviser | — | 10,666 | |||||
| Other assets | 14,842 | 14,007 | |||||
| Total assets | 31,959,883 | 16,327,219 | |||||
LIABILITIES: | |||||||
| Accrued expenses and other liabilities | 86,634 | 59,255 | |||||
| Payable to Adviser | 2,622 | — | |||||
| Payable for Fund shares redeemed | — | 36,015 | |||||
| Total liabilities | 89,256 | 95,270 | |||||
NET ASSETS | $ | 31,870,627 | $ | 16,231,949 | |||
NET ASSETS CONSIST OF: | |||||||
| Capital stock | $ | 31,701,056 | $ | 18,028,315 | |||
| Accumulated undistributed net investment income | 69,561 | — | |||||
| Accumulated net realized loss on investments | (3,611,484 | ) | (5,102,394 | ) | |||
| Net unrealized appreciation on investments | 3,711,494 | 3,306,028 | |||||
| Total net assets | $ | 31,870,627 | $ | 16,231,949 | |||
| Shares outstanding (par value of $.01, 500,000,000 shares authorized) | 2,924,882 | 1,577,441 | |||||
| Net Asset Value, Redemption Price and Offering Price Per Share | $ | 10.90 | $ | 10.29 | |||
| 6 BADGLEY FUNDS ANNUAL REPORT | See Notes to the Financial Statements | |
Balanced Fund | Growth Fund | ||||||
INVESTMENT INCOME: | $ | 674,457 | $ | 2,637 | |||
| Interest income | 152,885 | 167,583 | |||||
| Dividend income (net of withholding tax of $106 and $97, respectively) | |||||||
| Total investment income | 827,342 | 170,220 | |||||
EXPENSES: | |||||||
| Investment advisory fees | 274,081 | 171,242 | |||||
| Distribution fees | 76,134 | 42,811 | |||||
| Professional fees | 64,524 | 64,580 | |||||
| Shareholder servicing and accounting fees | 60,162 | 54,721 | |||||
| Administration fees | 32,248 | 32,121 | |||||
| Federal and state registration fees | 17,712 | 17,098 | |||||
| Directors’ fees and expenses | 10,274 | 10,292 | |||||
| Reports to shareholders | 9,636 | 15,094 | |||||
| Custody fees | 7,763 | 8,831 | |||||
| Other | 13,914 | 13,049 | |||||
| Total expenses before waiver and reimbursement | 566,448 | 429,839 | |||||
| Less: Waiver of expenses and reimbursement from Adviser | (170,562 | ) | (172,985 | ) | |||
| Net expenses | 395,886 | 256,854 | |||||
NET INVESTMENT INCOME (LOSS) | 431,456 | (86,634 | ) | ||||
REALIZED AND UNREALIZED GAIN ON INVESTMENTS: | |||||||
| Net realized gain on investments | 229,743 | 571,184 | |||||
| Change in net unrealized appreciation/depreciation on investments | 1,383,055 | 2,186,727 | |||||
| Net realized and unrealized gain on investments | 1,612,798 | 2,757,911 | |||||
NET INCREASE IN NET ASSETS RESULTING FROM OPERATIONS | $ | 2,044,254 | $ | 2,671,277 | |||
| See Notes to the Financial Statements | BADGLEY FUNDS ANNUAL REPORT 7 | |
Badgley Balanced FundYear Ended May 31, 2004 | Year Ended May 31, 2003 | ||||||
OPERATIONS: | |||||||
| Net investment income | $ | 431,456 | $ | 495,523 | |||
| Net realized gain (loss) on investments | 229,743 | (1,430,992 | ) | ||||
| Change in net unrealized appreciation/depreciation on investments | 1,383,055 | 584,708 | |||||
Net increase (decrease) in net assets resulting from operations | 2,044,254 | (350,761 | ) | ||||
DISTRIBUTIONS TO SHAREHOLDERS: | |||||||
| From net investment income | (431,375 | ) | (522,723 | ) | |||
Total dividends and distributions | (431,375 | ) | (522,723 | ) | |||
CAPITAL SHARE TRANSACTIONS: | |||||||
| Proceeds from shares sold | 6,024,638 | 3,859,913 | |||||
| Proceeds from shares issued to holders in reinvestment of dividends | 399,838 | 483,397 | |||||
| Cost of shares redeemed | (5,362,575 | ) | (2,862,049 | ) | |||
Net increase in net assets resulting from capital share transactions | 1,061,901 | 1,481,261 | |||||
TOTAL INCREASE IN NET ASSETS | 2,674,780 | 607,777 | |||||
NET ASSETS: | |||||||
| Beginning of year | 29,195,847 | 28,588,070 | |||||
| End of year (including undistributed net investment income of | |||||||
| $69,561 and $69,610, respectively) | $ | 31,870,627 | $ | 29,195,847 | |||
| 8 BADGLEY FUNDS ANNUAL REPORT | See Notes to the Financial Statements | |
Badgley Growth Fund| Year Ended May 31, 2004 | Year Ended May 31, 2003 | ||||||
| OPERATIONS: | |||||||
| Net investment loss | $ | (86,634 | ) | $ | (78,460 | ) | |
| Net realized gain (loss) on investments | 571,184 | (2,198,598 | ) | ||||
| Change in net unrealized appreciation/depreciation on investments | 2,186,727 | (186,055 | ) | ||||
| Net increase (decrease) in net assets resulting from operations | 2,671,277 | (2,463,113 | ) | ||||
CAPITAL SHARE TRANSACTIONS: | |||||||
| Proceeds from shares sold | 5,062,819 | 5,000,481 | |||||
| Cost of shares redeemed | (8,180,294 | ) | (3,399,045 | ) | |||
| Net increase (decrease) in net assets resulting from | |||||||
| capital share transactions | (3,117,475 | ) | 1,601,436 | ||||
TOTAL DECREASE IN NET ASSETS | (446,198 | ) | (861,677 | ) | |||
NET ASSETS: | |||||||
| Beginning of year | 16,678,147 | 17,539,824 | |||||
| End of year (including undistributed net investment income of | |||||||
| $0 and $0, respectively) | $ | 16,231,949 | $ | 16,678,147 | |||
See Notes to the Financial Statements | BADGLEY FUNDS ANNUAL REPORT 9 | |
Badgley Balanced FundYear Ended | Year Ended | Year Ended | Year Ended | Year Ended | ||||||||||||
PER SHARE DATA: | $ | 10.31 | $ | 10.65 | $ | 11.36 | $ | 11.47 | $ | 10.69 | ||||||
Income from investment operations: | ||||||||||||||||
Net investment income | 0.15 | 0.18 | 0.21 | 0.24 | 0.20 | |||||||||||
Net realized and unrealized gain | ||||||||||||||||
| (loss) on investments | 0.59 | (0.33 | ) | (0.71 | ) | (0.11 | ) | 0.78 | ||||||||
| Total from investment operations | 0.74 | (0.15 | ) | (0.50 | ) | 0.13 | 0.98 | |||||||||
| Less: | ||||||||||||||||
| Dividends from net investment income | (0.15 | ) | (0.19 | ) | (0.21 | ) | (0.24 | ) | (0.20 | ) | ||||||
| Dividends from net realized gains | - | - | - | (0.00 | )1 | - | ||||||||||
| Total dividends | (0.15 | ) | (0.19 | ) | (0.21 | ) | (0.24 | ) | (0.20 | ) | ||||||
| Net asset value, end of period | $ | 10.90 | $ 10.31 | $ 10.65 | $ 11.36 | $ 11.47 | ||||||||||
TOTAL RETURN | 7.25 | % | -1.33 | % | -4.44 | % | 1.13 | % | 9.23 | % | ||||||
SUPPLEMENTAL DATA AND RATIOS: | ||||||||||||||||
| Net assets, end of period | $ | 31,870,627 | $ 29,195,847 | $ 28,588,070 | $ 30,017,183 | $ 24,286,086 | ||||||||||
| Ratio of expenses to average net assets: | ||||||||||||||||
| Before expense reimbursement | 1.86 | % | 1.82 | % | 1.72 | % | 1.80 | % | 1.98 | % | ||||||
| After expense reimbursement | 1.30 | % | 1.30 | % | 1.30 | % | 1.30 | % | 1.30 | % | ||||||
Ratio of net investment income to average net assets: |
| |||||||||||||||
| Before expense reimbursement | 0.86 | % | 1.26 | % | 1.48 | % | 1.57 | % | 1.24 | % | ||||||
| After expense reimbursement | 1.42 | % | 1.78 | % | 1.90 | % | 2.07 | % | 1.92 | % | ||||||
| Portfolio turnover rate | 29.27 | % | 32.08 | % | 35.98 | % | 35.70 | % | 28.78 | % | ||||||
| 1 | Amount less than $(0.01) per share. | |||||||||||||||
| 10 BADGLEY FUNDS ANNUAL REPORT | See Notes to the Financial Statements | |
Badgley Growth Fund Year Ended | Year Ended | Year Ended | Year Ended | Year Ended | ||||||||||||
| PER SHARE DATA: | ||||||||||||||||
| Net asset value, beginning of period | $ | 8.85 | $ | 10.31 | $ | 12.10 | $ | 13.23 | $ | 11.42 | ||||||
| Income from investment operations: | ||||||||||||||||
| Net investment loss | (0.05 | ) | (0.04 | ) | (0.07 | ) | (0.07 | ) | (0.08 | ) | ||||||
| Net realized and unrealized gain | ||||||||||||||||
| (loss) on investments | 1.49 | (1.42 | ) | (1.72 | ) | (1.06 | ) | 1.89 | ||||||||
| Total from investment operations | 1.44 | (1.46 | ) | (1.79 | ) | (1.13 | ) | 1.81 | ||||||||
| Less: | ||||||||||||||||
| Dividends from net investment income | — | — | — | — | (0.00) 1 | |||||||||||
| Net asset value, end of period | $ | 10.29 | $ | 8.85 | $ | 10.31 | $ | 12.10 | $ | 13.23 | ||||||
TOTAL RETURN | 16.27 | % | -14.16 | % | -14.79 | % | --8.54 | % | 15.86 | % | ||||||
SUPPLEMENTAL DATA AND RATIOS: | ||||||||||||||||
| Net assets, end of period | $ | 16,231,949 | $ | 16,678,147 | $ | 17,539,824 | $ | 18,784,323 | $ | 12,251,424 | ||||||
| Ratio of expenses to average net assets: | ||||||||||||||||
| Before expense reimbursement | 2.51 | % | 2.43 | % | 2.23 | % | 2.33 | % | 2.84 | % | ||||||
| After expense reimbursement | 1.50 | % | 1.50 | % | 1.50 | % | 1.50 | % | 1.50 | % | ||||||
Ratio of net investment loss to average net assets: | ||||||||||||||||
| Before expense reimbursement | (1.52) | % | (1.42) | % | (1.41) | % | (1.57) | % | (2.06) | % | ||||||
| After expense reimbursement | (0.51) | % | (0.49) | % | (0.68) | % | (0.74) | % | (0.72) | % | ||||||
| Portfolio turnover rate | 45.58 | % | 29.52 | % | 39.51 | % | 27.21 | % | 25.88 | % | ||||||
| 1 | Amount less than $(0.01) per share. | |||||||||||||||
See Notes to the Financial Statement | BADGLEY FUNDS ANNUAL REPORT 11 | |
SCHEDULE OF INVESTMENTS
May 31, 2004
Badgley Balanced FundNumber of | ||||
Shares | Value | |||
LONG-TERM INVESTMENTS — 97.9% | ||||
COMMON STOCKS — 51.8% | ||||
Advertising — 1.7% | ||||
| 6,650 | Omnicom Group Inc. | $ | 531,136 | |
Auto/ Truck Parts & Equipment — 0.9% | ||||
| 5,525 | Johnson Controls, Inc. | 297,908 | ||
Chemical — Specialty — 1.9% | ||||
| 20,275 | Ecolab Inc. | 618,590 | ||
Computers — 2.6% | ||||
| 7,200 | Affiliated Computer Services, Inc. — Class A* | 358,704 | ||
| 13,400 | Dell Inc.* | 471,412 | ||
| 830,116 | ||||
Consumer Finance — 1.7% | ||||
| 20,687 | MBNA Corporation | 525,450 | ||
Diversified Conglomerates — 3.2% | ||||
| 6,575 | 3M Co. | 555,982 | ||
| 14,750 | General Electric Company | 459,020 | ||
| 1,015,002 | ||||
Drugs — 1.3% | ||||
| 11,700 | Pfizer Inc. | 413,478 | ||
E-Commerce — 1.3% | ||||
| 4,725 | eBay Inc.* | 419,580 | ||
Financials — Diversified — 3.0% | ||||
| 10,975 | Citigroup Inc. | 509,569 | ||
| 9,425 | State Street Corporation | 456,359 | ||
| 965,928 | ||||
Financial Services — 1.3% | ||||
| 6,025 | Fannie Mae | 407,892 | ||
| 12 BADGLEY FUNDS ANNUAL REPORT | See Notes to the Financial Statements | |
Badgley Balanced FundNumber of | ||||
Shares | Value | |||
Food & Beverage — 1.5% | ||||
| 9,075 | PepsiCo, Inc. | $ | 484,333 | |
Food Wholesale Distribution — 1.6% | ||||
| 13,650 | Sysco Corporation | 511,875 | ||
Freight Transportation — 2.9% | ||||
| 8,325 | Expeditors International of Washington, Inc. | 378,288 | ||
| 7,600 | United Parcel Service, Inc. — Class B | 545,072 | ||
| 923,360 | ||||
Industrial Gas — 1.4% | ||||
| 12,125 | Praxair, Inc. | 448,504 | ||
Insurance — Multi — 3.7% | ||||
| 13,275 | AFLAC INCORPORATED | 538,965 | ||
| 8,600 | American International Group, Inc. | 630,380 | ||
| 1,169,345 | ||||
Internet Security — 1.2% | ||||
| 8,075 | Symantec Corporation* | 369,835 | ||
Medical Products & Services — 4.7% | ||||
| 5,650 | Amgen Inc.* | 309,055 | ||
| 7,125 | Cardinal Health, Inc. | 482,434 | ||
| 7,450 | Stryker Corporation | 378,832 | ||
| 5,125 | Teva Pharmaceutical Industries Ltd., ADR | 339,121 | ||
| 1,509,442 | ||||
Motorcycles — 1.1% | ||||
| 6,150 | Harley-Davidson, Inc. | 353,563 | ||
Networking Equipment — 1.3% | ||||
| 19,275 | Cisco Systems, Inc.* | 426,941 | ||
Restaurants — 1.9% | ||||
| 14,900 | Starbucks Corporation* | 605,536 | ||
See Notes to the Financial Statements | BADGLEY FUNDS ANNUAL REPORT 13 | |
Badgley Balanced FundNumber of | ||||
Shares | Value | |||
Retail — Arts & Crafts — 1.3% | ||||
| 7,598 | Michaels Stores, Inc. | $ | 396,996 | |
Retail — Bedding — 1.0% | ||||
| 8,725 | Bed Bath & Beyond Inc.* | 325,006 | ||
Retail — Discount — 3.4% | ||||
| 10,775 | Costco Wholesale Corporation | 407,079 | ||
| 10,975 | Walgreen Co. | 384,235 | ||
| 5,500 | Wal-Mart Stores, Inc. | 306,515 | ||
| 1,097,829 | ||||
Semiconductors — 1.1% | ||||
| 12,175 | Intel Corporation | 347,596 | ||
Software — 2.4% | ||||
| 9,150 | Electronic Arts Inc. | 465,095 | ||
| 11,350 | Microsoft Corporation | 299,073 | ||
| 764,168 | ||||
Surgical/Medical Instruments — 1.3% | ||||
| 8,550 | Medtronic, Inc. | 409,545 | ||
Textiles — Home Furnishings — 1.1% | ||||
| 4,500 | Mohawk Industries, Inc.* | 334,080 | ||
Total Common Stocks (Cost $13,125,345) | 16,503,034 | |||
14 BAGLEY FUNDS ANNUAL REPORT | See Notes to the Financial Statements | |
May 31, 2004
Badgley Balanced FundPrincipal | ||||
Amount | Value | |||
CORPORATE BONDS — 21.2% | ||||
Chemical — Specialty — 1.4% | ||||
| $ 400,000 | Ecolab Inc. | |||
| 6.875%, 2/1/11 | $ | 436,111 | ||
| Computers — 0.7% | ||||
| 200,000 | IBM Corporation | |||
| 5.375%, 2/1/09 | 209,239 | |||
| Diversified Financial Services — 6.3% | ||||
| 170,000 | American General Finance | |||
| 5.375%, 9/1/09 | 175,355 | |||
| 200,000 | Bank of America Corp. | |||
| 4.750%, 10/15/06 | 206,914 | |||
| 300,000 | Bank of America Corp. | |||
| 5.250%, 2/1/07 | 312,881 | |||
| 500,000 | Citigroup Inc. | |||
| 7.250%, 10/1/10 | 561,931 | |||
| 525,000 | General Electric Capital Corporation | |||
| 7.375%, 1/19/10 | 596,717 | |||
| 140,000 | Wells Fargo Financial | |||
| 5.500%, 8/1/12 | 143,419 | |||
1,997,217 | ||||
| 100,000 | Food & Beverage — 0.3% PepsiCo, Inc. |
| ||
| 5.750%, 1/15/08 | 107,496 | |||
| 500,000 | Food Wholesale Distribution — 1.7% Sysco Corporation |
| ||
| 7.000%, 5/1/06 | 538,711 | |||
| 300,000 | Industrial Gas — 0.8% Praxair, Inc. |
| ||
| 3.950%, 6/1/13 | 272,122 | |||
See Notes to the Financial Statements | BADGLEY FUNDS ANNUAL REPORT 15 | |
SCHEDULE OF INVESTMENTS (continued)
May 31, 2004
Badgley Balanced FundPrincipal | ||||
Amount | Value | |||
Insurance — 2.3% | ||||
| $ 200,000 | AFLAC INCORPORATED | |||
| 6.500%, 4/15/09 | $ | 215,185 | ||
| 500,000 | Washington Mutual, Inc. | |||
| 5.625%, 1/15/07 | 525,792 | |||
| 740,977 | |||
| Linen Supply & Related Items — 0.4% | ||||
| 125,000 | Cintas Corporation No. 2 | |||
| 5.125%, 6/1/07 | 131,150 | |||
Medical — Drugs — 1.5% | ||||
| 300,000 | Abbott Laboratories | |||
| 5.625%, 7/1/06 | 316,528 | |||
| 135,000 | Cardinal Health, Inc. | |||
| 6.750%, 2/15/11 | 148,877 | |||
465,405 | ||||
Retail — Discount — 1.9% | ||||
| 400,000 | Costco Wholesale Corporation | |||
| 7.125%, 6/15/05 | 419,294 | |||
| 200,000 | Wal-Mart Stores, Inc. | |||
| 4.550%, 5/1/13 | 191,574 | |||
610,868 | ||||
Retail — Home Improvement — 2.2% | ||||
| 225,000 | The Home Depot, Inc. | |||
| 5.375%, 4/1/06 | 235,848 | |||
| 425,000 | Target Corporation | |||
| 6.350%, 1/15/11 | 463,210 | |||
| 699,058 | ||||
16 BAGLEY FUNDS ANNUAL REPORT | See Notes to the Financial Statements | |
SCHEDULE OF INVESTMENTS (continued)
May 31, 2004
Badgley Balanced FundPrincipal | ||||
| Amount | Value | |||
| $ 500,000 | Telecommunications Services — 1.7% SBC Communications Inc. 6.625%, 7/15/07 | $ | 539,899 | |
Total Corporate Bonds (Cost $6,510,312) | 6,748,253 | |||
GOVERNMENT SECURITIES — 24.9% | ||||
| 450,000 | U.S. Treasury Obligations — 13.4% U.S. Treasury Notes — 13.4% 6.500%, 8/15/05 | 474,029 | ||
| 650,000 | 5.625%, 2/15/06 | 685,649 | ||
| 650,000 | 5.500%, 2/15/08 | 697,861 | ||
| 250,000 | 3.250%, 8/15/08 | 246,875 | ||
| 750,000 | 6.000%, 8/15/09 | 824,707 | ||
| 355,000 | 6.500%, 2/15/10 | 399,944 | ||
| 250,000 | 5.750%, 8/15/10 | 272,246 | ||
| 450,000 | 4.375%, 8/15/12 | 446,467 | ||
| 230,000 | 4.250%, 8/15/13 | 223,603 | ||
4,271,381 | ||||
Total U.S. Treasury Obligations (Cost $4,186,015) | 4,271,381 | |||
| Government Agency — 11.5% | ||||
| Federal Home Loan Bank (FHLB) — 2.5% | ||||
450,000 | 5.750%, 5/15/12 | 473,511 | ||
330,000 | 4.500%, 9/16/13 | 313,627 | ||
787,138 | ||||
875,000 | Federal Home Loan Mortgage Corporation (FHLMC) — 2.8% | |||
| 5.250%, 1/15/06 | 912,679 | |||
| ||
See Notes to the Financial Statements | BADGLEY FUNDS ANNUAL REPORT 17 | |
SCHEDULE OF INVESTMENTS (continued)
Badgley Balanced FundPrincipal | ||||
Amount | Value | |||
| Federal National Mortgage Association (FNMA) — 4.9% | ||||
| $ 720,000 | 5.250%, 4/15/07 | $ 756,827 | ||
| 100,000 | 5.250%, 1/15/09 | 104,464 | ||
| 625,000 | 6.625%, 9/15/09 | 690,112 | ||
| 1,551,403 | ||||
Freddie Mac — 1.3%*** | ||||
| 425,000 | 3.500%, 2/13/08 | 421,416 | ||
Total Government Agency (Cost $3,662,138) | 3,672,636 | |||
Total Government Securities (Cost $7,848,153) | 7,944,017 | |||
Total Long-Term Investments (Cost $27,483,810) | 31,195,304 | |||
| SHORT-TERM INVESTMENT — 1.6% | ||||
Variable Rate Demand Note ** — 1.6% | ||||
| 497,867 | U.S. Bank, N.A., 0.850% | 497,867 | ||
Total Short-Term Investment (Cost $497,867) | 497,867 | |||
TOTAL INVESTMENTS — 99.5% | ||||
(Cost $27,981,677) | 31,693,171 | |||
Other assets in excess of liabilities — 0.5% | 177,456 | |||
TOTAL NET ASSETS — 100.0% | $ 31,870,627 | |||
| 18 BAGLEY FUNDS ANNUAL REPORT | See Notes to the Financial Statements | |
SCHEDULE OF INVESTMENTS
May 31, 2004
Badgley Growth FundNumber of | ||||
Shares | Value | |||
LONG-TERM INVESTMENTS — 95.0% | ||||
COMMON STOCKS — 95.0% | ||||
Advertising — 3.1% | ||||
| 6,200 | Omnicom Group Inc. | $ | 495,194 | |
Auto/Truck Parts & Equipment — 1.7% | ||||
| 5,175 | Johnson Controls, Inc. | 279,036 | ||
Chemical — Specialty — 3.6% | ||||
| 19,125 | Ecolab Inc. | 583,504 | ||
Computers — 4.8% | ||||
| 6,650 | Affiliated Computer Services, Inc.— Class A* | 331,303 | ||
| 12,500 | Dell Inc.* | 439,750 | ||
| 771,053 | ||||
Consumer Finance — 3.1% | ||||
| 19,512 | MBNA Corporation | 495,605 | ||
Diversified Conglomerates — 5.9% | ||||
| 6,200 | 3M Co. | 524,272 | ||
| 13,775 | General Electric Company | 428,678 | ||
| 952,950 | ||||
Drugs — 2.3% | ||||
| 10,775 | Pfizer Inc. | 380,789 | ||
E-Commerce — 2.4% | ||||
| 4,425 | eBay Inc.* | 392,940 | ||
| Financials — Diversified — 5.6% | ||||
| 10,350 | Citigroup Inc. | 480,550 | ||
| 8,800 | State Street Corporation | 426,096 | ||
| 906,646 | ||||
| See Notes to the Financial Statements | BADGLEY FUNDS ANNUAL REPORT 19 | |
SCHEDULE OF INVESTMENTS (continued)
May 31, 2004
Badgley Growth FundNumber of | ||||
Shares | Value | |||
Financial Services — 2.3% | ||||
| 5,650 | Fannie Mae | $ | 382,505 | |
Food & Beverage — 2.8% | ||||
| 8,475 | PepsiCo, Inc. | 452,311 | ||
Food Wholesale Distribution — 2.9% | ||||
| 12,750 | Sysco Corporation | 478,125 | ||
Freight Transportation — 5.3% | ||||
| 7,950 | Expeditors International of Washington, Inc. | 361,248 | ||
| 7,025 | United Parcel Service, Inc.— Class B | 503,833 | ||
| 865,081 | ||||
Industrial Gas — 2.6% | ||||
| 11,325 | Praxair, Inc. | 418,912 | ||
Insurance — Multi — 6.7% | ||||
| 12,275 | AFLAC INCORPORATED | 498,365 | ||
| 8,050 | American International Group, Inc. | 590,065 | ||
| 1,088,430 | ||||
Internet Security — 2.1% | ||||
| 7,575 | Symantec Corporation* | 346,935 | ||
Medical Products & Services — 8.7% | ||||
| 5,325 | Amgen Inc.* | 291,277 | ||
| 6,800 | Cardinal Health, Inc. | 460,428 | ||
| 6,900 | Stryker Corporation | 350,865 | ||
| 4,700 | Teva Pharmaceutical Industries Ltd., ADR | 310,999 | ||
| 1,413,569 | ||||
Motorcycles — 2.0% | ||||
| 5,725 | Harley-Davidson, Inc. | 329,130 | ||
20 BAGLEY FUNDS ANNUAL REPORT | See Notes to the Financial Statements | |
Badgley Growth FundNumber of | ||||
Shares | Value | |||
Networking Equipment — 2.5% | ||||
| 18,275 | Cisco Systems, Inc.* | $ | 404,791 | |
Restaurants — 3.5% | ||||
| 13,925 | Starbucks Corporation* | 565,912 | ||
Retail — Arts & Crafts — 2.3% | ||||
| 7,083 | Michaels Stores, Inc. | 370,087 | ||
Retail — Bedding — 1.9% | ||||
| 8,150 | Bed Bath & Beyond Inc.* | 303,587 | ||
Retail — Discount — 6.3% | ||||
| 10,100 | Costco Wholesale Corporation | 381,578 | ||
| 10,325 | Walgreen Co. | 361,478 | ||
| 4,925 | Wal-Mart Stores, Inc. | 274,470 | ||
| 1,017,526 | ||||
Semiconductors — 2.0% | ||||
| 11,400 | Intel Corporation | 325,470 | ||
Software — 4.4% | ||||
| 8,550 | Electronic Arts Inc.* | 434,597 | ||
| 10,675 | Microsoft Corporation | 281,286 | ||
| 715,883 | ||||
Surgical/Medical Instruments — 2.3% | ||||
| 7,825 | Medtronic, Inc. | 374,818 | ||
Textiles — Home Furnishings — 1.9% | ||||
| 4,100 | Mohawk Industries, Inc.* | 304,384 | ||
Total Common Stocks (Cost $12,109,145) | 15,415,173 | |||
Total Long-Term Investments (Cost $12,109,145) | 15,415,173 | |||
| See Notes to the Financial Statements | BADGLEY FUNDS ANNUAL REPORT 21 | |
Badgley Growth FundPrincipal | ||||
Amount | Value | |||
| SHORT-TERM INVESTMENT — 2.7% | ||||
Variable Rate Demand Note ** — 2.7% | ||||
| $ 438,526 | U.S. Bank, N.A., 0.850% | $ | 438,526 | |
Total Short-Term Investment (Cost $438,526) | 438,526 | |||
TOTAL INVESTMENTS — 97.7% | ||||
(Cost $12,547,671) | 15,853,699 | |||
Other assets in excess of liabilities — 2.3% | 378,250 | |||
TOTAL NET ASSETS — 100.0% | $ | 16,231,949 | ||
22 BAGLEY FUNDS ANNUAL REPORT | See Notes to the Financial Statements | |
BADGLEY FUNDS ANNUAL REPORT 23 | ||
Balanced Fund | Growth Fund | |
| Shares sold | 559,171 | 527,042 |
| Shares issued to holders in reinvestment of dividends | 37,714 | — |
| Shares redeemed | (502,592) | (835,110) |
| Net increase (decrease) | 94,293 | (308,068) |
| Transactions in shares of the Funds for the year ended May 31, 2003, were as follows: | ||
Balanced Fund | Growth Fund | |
| Shares sold | 384,736 | 581,042 |
| Shares issued to holders in reinvestment of dividends | 48,794 | — |
| Shares redeemed | (286,159) | (396,641) |
| Net increase | 147,371 | 184,401 |
| 24 BAGLEY FUNDS ANNUAL REPORT | ||
| Balanced Fund | Growth Fund | |
| Purchases | ||
U.S. Government | $ 1,795,092 | $ — |
Other | 7,925,264 | 7,596,761 |
Sales | ||
U.S. Government | 596,119 | — |
Other | 7,990,619 | 11,255,009 |
As of May 31, 2004, the components of accumulated earnings (losses) on a tax basis were as follows:
| Balanced Fund | Growth Fund | |
| Cost of Investments(a) | $ 28,152,275 | $ 12,706,240 |
| Gross unrealized appreciation | 3,828,960 | 3,237,332 |
| Gross unrealized depreciation | (288,064) | (89,873) |
| Net unrealized appreciation | 3,540,896 | 3,147,459 |
| Undistributed ordinary income | 69,561 | — |
| Undistributed long-term capital gain | — | — |
| Total distributable earnings | 69,561 | — |
| Other accumulated gains (losses) | (3,440,886) | (4,943,825) |
| Total accumulated earnings (losses) | $ 169,571 | $ (1,796,366) |
BADGLEY FUNDS ANNUAL REPORT 25 | ||
| Balanced Fund | Growth Fund | |
Income | $ 431,375 | $ — |
Long-term gains | — | — |
| Total distributions paid | $ 431,375 | $ — |
| Balanced Fund | Growth Fund | |
Income | $ 522,723 | $ — |
Long-term gains | — | — |
| Total distributions paid | $522,723 | $ — |
| Balanced Fund | 35% |
| Growth Fund | 0% |
| Balanced Fund | 34% |
| Growth Fund | 0% |
26 BAGLEY FUNDS ANNUAL REPORT | ||
| Year of Expiration | Balanced Fund | Growth Fund |
| 5/31/2005 | $ 123,485 | $ 127,555 |
| 5/31/2006 | 145,963 | 148,381 |
| 5/31/2007 | 170,562 | 172,985 |
BADGLEY FUNDS ANNUAL REPORT 27 | ||
| PricewaterhouseCoopers LLP |
| Portland, Oregon |
| July 14, 2004 |
28 BAGLEY FUNDS ANNUAL REPORT | ||
Name, Address* and Age | Position with the Corporation | Term of Office and Length of Time Served | Principal Occupation During Past Five Years | # of Portfolios in Fund Complex | Other Directorships Held | ||
DISINTERESTED DIRECTORS | |||||||
| Graham S. Anderson**, 70 | Director | Indefinite term since 1999. | Retired. Formerly Chairman and Chief Executive Officer of Pettit-Morry Co. | 2 | Former Director, The Commerce Bank. | ||
| Frank S. Bayley**, 64 | Director | Indefinite term since 1998. | Of Counsel, formerly Partner, Baker & McKenzie. | 2 | Director and Chairman, C.D. Stimson Company; Trustee, AIM Fund/INVESCO; Director, Korean-American Chamber of Commerce of Northern California; Trustee and Treasurer, San Francisco Performances; Trustee, Seattle Art Museum. | ||
| Victor E. Parker**, 62 | Director | Indefinite term since 2003. | Chairman and Chief Executive Officer of Parker, Smith & Feek, Inc. | 2 | Director, First Mutual Bancshares, Inc. and Trustee of Western Washington University Foundation. | ||
| Madelyn B. Smith**, 72 | Director | Indefinite term since 1998. | Retired. Formerly Financial Analyst/Portfolio Manager, Frank Russell Co., Inc. | 2 | Director and Advisory Board Member, Marvin and Palmer Associates, Inc. | ||
INTERESTED DIRECTORS | |||||||
| J. Kevin Callaghan***, 46 | President and Director | President since 2004; Director since 1998 | Investment Counselor, Badgley, Phelps and Bell, Inc. | 2 | Director, Badgley, Phelps and Bell, Inc. | ||
| Steven C. Phelps***, 42 | Director and Chairman | Indefinite term since 1998. | Investment Counselor, Badgley, Phelps and Bell, Inc. | 2 | Director, Badgley, Phelps and Bell, Inc. | ||
OFFICERS | |||||||
| Lisa P. Guzman, 49 | Secretary and Treasurer | Indefinite term since 1998. | Administrative Manager, Badgley, Phelps and Bell, Inc. | 2 | Director, Badgley, Phelps and Bell, Inc. | ||
* | Address for all listed persons is 1420 Fifth Avenue, Seattle, WA 98101. |
** | Denotes those Directors who are not “interested persons” of the Corporation as defined under the 1940 Act. |
*** | Denotes those Directors who are “interested persons” of the Corporation under the 1940 Act. |
BADGLEY FUNDS ANNUAL REPORT 29 | ||
| DIRECTORS | CUSTODIAN |
| Graham S. Anderson | U.S. Bank, N.A. |
| Frank S. Bayley | 425 Walnut Street |
| J. Kevin Callaghan | Cincinnati, Ohio 45202 |
| Victor E. Parker | |
| Steven C. Phelps | ADMINISTRATOR, TRANSFER AGENT |
| Madelyn B. Smith | AND DIVIDEND-DISBURSING AGENT |
| PRINCIPAL OFFICERS | U.S. Bancorp Fund Services, LLC |
| Third Floor | |
J. Kevin Callaghan, President | 615 East Michigan Street |
Lisa P.Guzman, Treasurer and Secretary | Milwaukee, Wisconsin 53202 |
| INVESTMENT ADVISER | INDEPENDENT A CCOUNTANTS |
Badgley, Phelps and Bell, Inc. | PricewaterhouseCoopers LLP |
| 1420 Fifth Avenue | 1300 SW Fifth Avenue, Suite 3100 |
| Seattle, Washington 98101 | Portland, Oregon 97201 |
| DISTRIBUTOR | LEGAL COUNSEL |
Rafferty Capital Markets, LLC | Kirkland & Ellis LLP |
| 59 Hilton Avenue, Suite 101 | 200 East Randolph Street |
| Garden City, New York 11530 | Chicago, Illinois 60601 |
30 BAGLEY FUNDS ANNUAL REPORT | ||
BADGLEY FUNDS ANNUAL REPORT 31 | ||
ANNUAL REPORT | ||
May 31, 2004 | ||
Badgley | ||
| | Badgley Balanced Fund | |
| Badgley Growth Fund | |
| ||
www.badgleyfunds.com | ||
| FYE 5/31/2004 | FYE 5/31/2003 | |
| Audit Fees | $28,600 | $27,550 |
| Audit-Related Fees | $0 | $0 |
| Tax Fees | $4,400 | $4,400 |
| All Other Fees | $0 | $0 |
- $4,400 for fiscal year 2003; and
- $4,400 for fiscal year 2004.
| Non-Audit Related Fees | FYE 5/31/2004 | FYE 5/31/2003 |
| Registrant | $4,400 | $4,400 |
| Registrant’s Investment Adviser (and control affiliates) | $0 | $0 |