Exhibit (c)(4)

Presentation to
The Transaction Committee of the Board of Directors of
February 17, 2003
The accompanying material was compiled on a confidential basis for use solely by the Transaction Committee of the Board of Directors and the Board of Directors of Multex (the “Company”) in evaluating the transaction referred to herein and not with a view to public disclosure or filing thereof with the Securities and Exchange Commission. It was compiled from information supplied by the Company, Reuters and from public sources believed by Bear, Stearns & Co. Inc. (“Bear Stearns”) to be reliable. Neither Bear Stearns nor any of its officers, directors, employees, affiliates, advisors, agents or representatives warrants the accuracy or completeness of any of the materials set forth herein. Nothing contained in the accompanying materials is, or shall be relied upon as, a promise or representation as to the past or the future.
It should be understood that any valuations and/or estimates or projections contained in the accompanying materials were prepared or derived from information supplied by the Company and Reuters or derived from other public sources, without any independent verification by Bear Stearns, and involve numerous and significant subjective determinations by and assumptions of the Company and Reuters, which may or may not be correct. Accordingly, no representation or warranty can be made or is made by Bear Stearns as to the accuracy or achievability of any such valuations and/or estimates or projections.
CONFIDENTIAL
Table of Contents
Section
| | | |
| 1 | | Overview of Proposed Transaction |
| 2 | | Multex Public Market Trading Analysis |
| 3 | | Multex Discounted Cash Flow Analysis |
| 4 | | Selected M&A Transaction Analysis |
| 5 | | Selected Public Company Analysis |
CONFIDENTIAL
Section 1
Overview of Proposed Transaction
Multex—Transaction Summary
| | | |
| Transaction Structure: | | Cash tender offer (the “Offer”) to purchase all of the outstanding shares of Multex common stock, other than those held by Reuters or any of its subsidiaries, to be followed by a merger into a U.S. acquisition subsidiary of Reuters
|
| Consideration: | | $7.35 per share in cash
|
| Source of Financing: | | Reuters available cash balances and lines of credit
|
| Tax Structure: | | Taxable
|
| Options Treatment: | | Options vesting in 2005 and thereafter will be fully accelerated and cashed out. The remaining options will be rolled over into restricted stock of Reuters with a 2-year vesting schedule and a value collar that limits the optionholder’s downside to $7.35 per share subject to each option
|
| Conditions to Closing: | | At least 50.1% of the total issued and outstanding shares of Multex common stock (assuming the exercise of all options) are required to be tendered
HSR approval
No material adverse change in the business (subject to exceptions)
Other customary conditions
|
| Termination: | | Multex fiduciary out for superior proposal
Two business day last look and matching right to Reuters
$5.5 million break-up fee to Reuters
No Reuters fiduciary out
|
| Other | | Employment Agreement for Isaak Karaev
Voting and Tender Agreements from Isaak Karaev and six other senior managers |
CONFIDENTIAL
1
Multex—Transaction Background
| | | |
| • December 2002: | | Reuters approached Multex and expressed an interest in acquiring the Company. |
| • December 17, 2002: | | Multex Board meeting and formation of Transaction Committee. |
| • December 23, 2002: | | Transaction Committee interviews financial advisors. |
| • January 13, 2003: | | Reuters communicated a preliminary indication of interest in the low $6.00 per share range with the threat to walk away if the process is opened up to other potential acquirors. |
| • January 17, 2003: | | The Transaction Committee formally engaged Bear Stearns as its financial advisor. |
| • January 24, 2003: | | Bear Stearns and J.P. Morgan, the financial advisor to Reuters, had follow-up conversations in which J.P. Morgan suggested Reuters interest at $6.60–$6.75 per share. |
| • January 28, 2003: | | Reuters indicated interest at $7.00 per share/2003 plan presented to Board. |
| • January 31, 2003: | | Bear Stearns made a presentation to the Transaction Committee and management to discuss negotiation tactics. |
| • February 3, 2003 | | Multex communicated to Reuters that it would seek to negotiate a transaction which valued Multex at least at $8 per share. |
| • February 4, 2003: | | Bear Stearns received unsolicited calls from Thomson and Merrill Lynch on Thomson’s behalf. The parties indicated that Thomson was interested in a dialogue regarding Multex. |
| • February 7, 2003: | | Merrill Lynch called Bear Stearns to communicate that Thomson decided not to initiate discussions at this time due to regulatory concerns, among others. |
| • February 8, 2003: | | Reuters indicated interest at $7.25 per share. |
| • February 10, 2003: | | Reuters indicated interest at $7.35 per share. |
CONFIDENTIAL
2
Multex—Transaction Summary
| | | | | | | | | | | | | |
| | | ($ in millions, except per share values) |
| | |
|
| | | | | | | Proposed | | | | |
| | | Current(1) | | Transaction | | % Premium |
| | |
| |
| |
|
Price per Share | | $ | 4.58 | | | $ | 7.35 | | | | 60.5 | % |
| 20-Day Average | | | 4.61 | | | | | | | | 59.4 | |
| 6-Month Average | | | 3.66 | | | | | | | | 101.0 | |
| 12-Month Average | | | 3.84 | | | | | | | | 91.5 | |
| 12-Month High | | | 5.00 | | | | | | | | 47.0 | |
| 12-Month Low | | | 2.84 | | | | | | | | 158.8 | |
Market Value of Equity(2) | | $ | 157.6 | | | $ | 260.9 | | | | 65.6 | % |
Less: Cash & Equivalents(3) | | | (50.6 | ) | | | (50.6 | ) | | | | |
| | | |
| | | |
| | | | | |
Enterprise Value | | $ | 107.0 | | | $ | 210.3 | | | | 96.5 | % |
Less: Value of Unconsolidated Investments(4) | | | (4.2 | ) | | | (4.2 | ) | | | | |
| | | |
| | | |
| | | | | |
Adjusted Enterprise Value(5) | | $ | 102.8 | | | $ | 206.1 | | | | | |
| (1) | | As of 2/14/2003. |
| |
| (2) | | Based on fully diluted shares outstanding (treasury method). |
| |
| (3) | | As of 12/31/2002 per Multex press release dated 1/30/2003. |
| |
| (4) | | Reflects investments in J.M. Lafferty Associates Inc. and TheMarkets.com, recorded at book value as of 12/31/2002. |
| |
| (5) | | Excludes NPV of potential NOL tax benefit (due to limited or no market attribution). Based on Multex Management projections and a mid-point discount rate of 17.5%, the NPV of the NOL tax benefits is approximately $15–$18 million. Including the mid-point of the NOL tax benefit valuation range, the current Enterprise Value is $123.4 million and the transaction Enterprise Value is $226.7 million, implying a premium of 83.7%. |
CONFIDENTIAL
3
Multex—Transaction Summary (cont.)
| | | | | | | | | | | | | |
| | | ($ in millions) |
| | |
|
| | | | | | | Multiples |
| | | | | | |
|
| | | | | | | | | | | Proposed |
| | | Metric(1) | | Current(2) | | Transaction |
| | |
| |
| |
|
Adjusted Enterprise Value/Revenue | | | | | | | | | | | | |
| 2002A | | $ | 92.4 | | | | 1.11 | x | | | 2.23 | x |
| 2003E | | | 103.8 | | | | 0.99 | | | | 1.99 | |
Adjusted Enterprise Value/EBITDA | | | | | | | | | | | | |
| 2002A | | $ | 11.5 | | | | 8.9 | x | | | 17.9 | x |
| 2003E | | | 18.5 | | | | 5.6 | | | | 11.2 | |
Net Equity Value/Free Cash Flow(3) | | | | | | | | | | | | |
| 2002A | | $ | 8.2 | | | | 19.3 | x | | | 32.0 | x |
| 2003E | | | 10.7 | | | | 14.7 | | | | 24.4 | |
| (1) | | Source: Multex Management and press release dated 1/30/2003. |
| |
| (2) | | As of 2/14/2003. |
| |
| (3) | | Free cash flow defined as cash flow from operations less capital expenditures. |
CONFIDENTIAL
4
Section 2
Multex Public Market Trading Analysis
Multex—Historical Stock Price Performance
Since IPO: March 17, 1999–February 14, 2003
Source: FactSet, Bloomberg, and Multex web site.
Note: Annotations on the following page.
CONFIDENTIAL
5
Multex—Historical Stock Price Performance (cont.)
Annotations
| | | | | |
| A | | 03/31/99: | | Multex appointed as exclusive anchor tenant, providing brokerage research for AOL’s personal finance channel. |
| B | | 04/14/99: | | Insider sales, including Multex’s CEO, reported on Form 4 with the SEC. |
| C | | 10/20/99: | | Reported revenues for the quarter ended September 30, 1999, up 96% to $10.9M, versus $5.6M in the quarter a year earlier. Recorded a net loss of $10.3M, or ($0.39) a share, compared with a loss of $1.8M, or ($0.32) a share, in the quarter a year earlier. |
| D | | 12/22/99: | | Entered multi-year, multi-million dollar partnership with Merrill Lynch to co-develop global research and information web sites for clients of Merrill’s institutional e-commerce portal. |
| E | | 01/10/00: | | Robertson Stephens signed agreement with Multex as a Platinum Sponsor, joining firms such as Merrill Lynch and Morgan Stanley, among others. |
| F | | 01/27/00: | | Reported revenues for the quarter ended December 31, 1999, up 112% to $13.5M versus $6.3M in the quarter a year earlier. Revenues for the fourth quarter rose 23% over 1999 third quarter revenues of $10.9M. |
| G | | 04/19/00: | | Reported revenues for the quarter ended March 31, 2000 of $16.1M, up from $7.6M from the same period in 1999, representing an improvement from $13.5M in the fourth quarter of 1999. |
| H | | 07/20/00: | | Announced agreement with Munder Net Fund for a $30M private placement of restricted stock. In addition, the Company announced a narrower net loss for the second quarter of $1.2M compared with $3.1M a year earlier. Revenues doubled to $19.2M from $8.8M. |
| I | | 10/19/00: | | Reported first profitable quarter, with third quarter revenues up 109% to $22.8M. Net income totaled $0.2M, or $0.01 a share, compared with a loss of $1.3M, or ($0.04) a share in the quarter a year earlier. Reported EBITDA of $2.7M compared with a loss of $4.6M a year earlier. |
| J | | 12/05/00: | | Signed multi-million dollar global contract with Merrill Lynch HSBC to provide research access technology for its online investment and banking service. |
| K | | 01/23/01: | | Formed alliance with Advent Software to provide real-time data integration for the asset management industry. |
| L | | 01/25/01: | | Reported revenues for quarter ended December 31, 2000, of $27.9M, an increase of 107% from the quarter a year earlier EBITDA totaled $4.4M compared to an EBITDA loss of $7.4M in the quarter a year earlier. |
| M | | 04/19/01: | | Reported revenues for quarter ended March 31, 2001, of $29.5M, an increase of 83% over the quarter a year earlier. Net income during the first quarter totaled $3.0M compared to a net loss of $2.1M in the quarter a year earlier. |
| N | | 07/03/01: | | JP Morgan cut its rating on Multex to “market underperform” from “buy” rating, citing deteriorating fundamentals, a day after the Company warned of a weaker-than-expected second quarter. |
| O | | 07/19/01: | | Reported revenues for quarter ended June 30, 2000, of approximately $23.5M, an increase of 23% over the quarter a year earlier and down from $29.5M reported in the first quarter of 2001. The Company recorded a net loss for the second quarter of $33.7M compared to a net loss of $1.2M in the quarter a year earlier. |
| P | | 10/24/01: | | Reported revenues for quarter ended September 30, 2001, of approximately $21.3M, a decrease of 7% over the quarter a year earlier and down 9% from second quarter of 2001. The Company estimated that approximately $2M in third quarter revenues were lost as a result of Sept. 11th. EBITDA for the quarter was $19K compared to a loss of $2.1M in the second quarter of 2001. |
| Q | | 01/31/02: | | Reported revenues for quarter ended December 31, 2001 of approximately $22.3M, in–line with Company’s expectations, represents an increase of 5% from the previous quarter. |
| R | | 04/25/02: | | Reported second quarter of sequential revenue growth. First quarter revenues of approximately $22.6M, in–line with Company’s expectations and representing a modest increase from the fourth quarter of 2001. |
| S | | 06/27/02: | | Merrill Lynch & Co. Inc. lowered its holdings in Multex to a 2.2% stake from 3.7% |
| T | | 07/25/02: | | Reported third quarter of sequential revenue growth. Second quarter revenues of approximately $22.8M, in–line with Company’s guidance, representing an increase of 1% from the first quarter of 2002. EBITDA for the second quarter was $2.6M compared to $2.5M in the first quarter and a loss of $2.1M in the quarter a year earlier. |
| U | | 10/24/02: | | Reported fourth consecutive quarter of sequential revenue growth. Third quarter gross revenues increased 9% to $23.3M compared to $21.3M in the quarter a year earlier. EBITDA totaled $3.0M compared to $19K in the quarter a year earlier. |
| V | | 01/22/03: | | Announced agreement with FactSet to offer Multex Estimates through FactSet. |
| W | | 01/30/03: | | Reported fifth consecutive quarter of sequential revenue growth. For the fiscal year ended December 31, 2002, gross revenues decreased 5% to $92.4M and EBITDA increased 110% to $11.5M. Revenues were below the $95M guidance provided at the beginning of 2002 while EBITDA exceeded the $10M guidance. Provided 2003E guidance for gross revenues of $98.0M to $102.0M and EBITDA of $16.0M to $19.0M. |
CONFIDENTIAL
6
Multex—Price/Volume Histogram(1)
| |
| Note: Total volume traded over the 6 and 12 month periods was 4.92 million and 16.79 million shares, respectively. | | |
| |
| (1) | | Based on closing price for the 6 month period of 8/14/2002–2/14/2003 and the 12 month period of 2/14/2002–2/14/2003. |
| |
|
| (2) | | Assumes 21, 126 and 252 trading days respectively for 1, 6 and 12 month periods. |
CONFIDENTIAL
7
Multex—Relative Trading Analysis(1)
($ in thousands)
| Source: FactSet, Bloomberg and public filings. | | |
| |
| (1) | | As of 2/14/2003. |
| |
| (2) | | Amounts represent 1-month average daily trading volume. |
CONFIDENTIAL
8
Multex—Relative Stock Price Performance
50%">
Last Three Years: February 14, 2000–February 14, 2003
Performance Summary
| | | | | | | | | |
| | | 3 Years(1) | | 2 Years(1) |
| | |
| |
|
| Multex | | | (86 | %) | | | (78 | %) |
Peer Index 1(2) | | | 23 | | | | 18 | |
Peer Index 2(3) | | | 1 | | | | (22 | ) |
| S&P 500 | | | (40 | ) | | | (37 | ) |
Peer Groups | | | | | | | | |
Peer Index 1 | | | | | | | | |
| D&B(4) | | | 96 | % | | | 39 | % |
| Interactive Data | | | 27 | | | | 135 | |
McGraw-Hill(5) | | | 1 | | | | (5 | ) |
| Moody’s | | | 114 | | | | 52 | |
| Reuters | | | (89 | ) | | | (84 | ) |
Thomson(6) | | | (8 | ) | | | (27 | ) |
Peer Index 2 | | | | | | | | |
| Barra | | | 11 | % | | | (47 | %) |
| FactSet | | | (9 | ) | | | (25 | ) |
| OneSource | | | (30 | ) | | | (24 | ) |
| Value Line | | | 32 | | | | 9 | |
| Source: FactSet. Peer Indices based on an equal price weighting. | | |
| |
| (1) | | As of 2/14/2003. |
| |
| (2) | | Peer Index 1 consists of D&B, Interactive Data, McGraw-Hill, Moody’s, Reuters and Thomson. |
| |
| (3) | | Peer Index 2 consists of Barra, FactSet, OneSource and Value Line. |
| |
| (4) | | D&B data begins on 9/18/2000. |
| |
| (5) | | McGraw-Hill’s Financial Services group represents approximately 32% of McGraw-Hill’s consolidated revenue per McGraw-Hill public filings. |
| |
| (6) | | Thomson Financial division represents approximately 22% of Thomson’s consolidated revenue per Thomson public filings. |
CONFIDENTIAL
9
Multex—Relative Stock Price Performance
Last Year: February 14, 2002–February 14, 2003

Performance Summary
| | | | | | | | | |
| | | LTM(1) | | 6 Months(1) |
| | |
| |
|
| Multex | | | (8 | %) | | | 45 | % |
Peer Index 1(2) | | | (18 | ) | | | (10 | ) |
Peer Index 2(3) | | | (24 | ) | | | – | |
| S&P 500 | | | (25 | ) | | | (9 | ) |
Peer Groups | | | | | | | | |
Peer Index 1 | | | | | | | | |
| D&B | | | (9 | %) | | | 3 | % |
| Interactive Data | | | (19 | ) | | | (5 | ) |
McGraw-Hill:(4) | | | (14 | ) | | | (13 | ) |
| Moody’s | | | 16 | | | | (14 | ) |
| Reuters | | | (68 | ) | | | (33 | ) |
Thomson(5) | | | (12 | ) | | | 2 | |
Peer Index 2 | | | | | | | | |
| Barra | | | (49 | %) | | | (24 | %) |
| FactSet | | | (28 | ) | | | 15 | |
| OneSource | | | (17 | ) | | | – | |
| Value Line | | | (1 | ) | | | 10 | |
| Source: FactSet. Peer Indices based on an equal price weighting. | | |
| |
| (1) | | As of 2/14/2003. |
| |
| (2) | | Peer Index 1 consists of D&B, Interactive Data, McGraw-Hill, Moody’s, Reuters and Thomson. |
| |
| (3) | | Peer Index 2 consists of Barra, FactSet, OneSource and Value Line. |
| |
| (4) | | McGraw-Hill’s Financial Services group represents approximately 32% of McGraw-Hill’s consolidated revenue per McGraw-Hill public filings. |
| |
| (5) | | Thomson Financial division represents approximately 22% of Thomson’s consolidated revenue per Thomson public filings. |
CONFIDENTIAL
10
Multex—Wall Street Commentary
| | | | | | | | | | | | | | | |
| | | Report | | | | Price @ | | Target | | Target Price | | |
| Firm/Analyst | | Date | | Rating | | Report | | Price | | Methodology | | Comment |
| |
| |
| |
| |
| |
| |
|
Greenwich Research
Analytics | | 2/10/2003 | | Sell | | $ | 4.55 | | | NA | | NA | | “This EV gives MLTX a Greenwich Research Analytics’ Daily Enterprise value (GRADE) of 23 out of 100, and our Sell rating for a poor value relative to its industry peers.” |
Merrill Lynch
Michael R. Hughes | | 1/30/2003 | | Neutral | | | 4.40 | | | NA | | NA | | “We continue to view Multex as well positioned to grow earnings once the equity markets improve as this should prompt buyside and sellside institutions to begin spending again on information and research technology. There may also be upside if the company can position itself to play a role in production and/or distribution of ‘independent research...”
“Earnings growth and stock appreciation should be limited until more information about the implications of the settlement become public and/or signs of a sustainable market turn appear.” |
| RBC Capital MarketsJon G. Arfstrom | | 10/24/2002 | | Sector Perform | | | 3.10 | | | $4.00 | | 1.5x 2003E Revenue | | “We continue to believe that management’s actions in this environment will position the Company for future growth, however, until meaningful signs of revenue growth begin to emerge, we would recommend waiting to purchase the stock.”
“The revision of our price target is due to the continued lack of clarity regarding the timing of a return in financial services IT spending.” |
| | | Source: Wall Street equity research. |
Confidential
11
| |
| Multex Actual Performance vs. Management Guidance—Annual Revenue |
| • | | 2002 EBITDA of $11.5 million surpassed guidance of $10 million.(5) |
| (1) | | Represents 67% of initial internal budget. |
| |
| (2) | | Source: Multex Management. Based on internal estimate not communicated to the public. |
| |
| (3) | | Source: Company press releases for the prior quarters. In these two years, Wall Street research projections were similar to Management guidance for each projection period. |
| |
| (4) | | Represents 98% of initial internal budget. |
| |
| (5) | | Guidance was constant at each quarterly release. The Company did not provide EBITDA guidance in 2001. |
Confidential
12
Section 3
Multex Discounted Cash Flow Analysis
Multex—Summary Historical and Projected Income Statements(1)
| | | | | | | | | | | | | | | | | | | | | | | | | | | | | | | | | | | | | | |
| | | | ($ in millions) |
| | | | Years Ended December 31, | | Projected Years Ending December 31, | | CAGR | | CAGR |
| | | |
| |
| |
| |
|
| | | | 2000A | | 2001A | | 2002A | | 2003E | | 2004E | | 2005E | | 2006E | | '00–'02 | | '02–'06 |
| | | |
| |
| |
| |
| |
| |
| |
| |
| |
|
Revenue | | | | | | | | | | | | | | | | | | | | | | | | | | | | | | | | | | | | |
| MultexEXPRESS | | $ | 29.1 | | | $ | 36.3 | (2) | | $ | 37.9 | | | $ | 42.1 | | | $ | 45.1 | | | $ | 44.8 | | | $ | 48.9 | | | | 14.2 | % | | | 6.5 | % |
| | | |
| | | |
| | | |
| | | |
| | | | | | | | | | | |
| | | |
| | | | | |
| | % growth | | | 217.3 | % | | | 24.9 | % | | | 4.5 | % | | | 11.0 | % | | | 7.0 | % | | | (0.6 | )% | | | 9.1 | % | | | | | | | | |
| | | |
| | | |
| | | |
| | | |
| | | | | | | | | | | |
| | | |
| | | | | |
| MultexNET | | | 22.9 | | | | 25.2 | | | | 26.8 | | | | 31.6 | | | | 38.7 | | | | 46.5 | | | | 54.3 | | | | 8.1 | % | | | 19.3 | % |
| | | |
| | | |
| | | |
| | | |
| | | | | | | | | | | |
| | | |
| | | | | |
| | % growth | | | 63.2 | % | | | 10.0 | % | | | 6.2 | % | | | 18.0 | % | | | 22.5 | % | | | 20.1 | % | | | 16.7 | % | | | | | | | | |
| | | |
| | | |
| | | |
| | | |
| | | | | | | | | | | |
| | | |
| | | | | |
| MultexInvestor | | | 17.6 | | | | 13.0 | | | | 8.8 | | | | 8.3 | | | | 10.1 | | | | 11.9 | | | | 13.7 | | | | (29.2 | )% | | | 11.7 | % |
| | | |
| | | |
| | | |
| | | |
| | | | | | | | | | | |
| | | |
| | | | | |
| | % growth | | | 201.4 | % | | | (26.0 | %) | | | (32.3 | )% | | | (5.6 | )% | | | 21.6 | % | | | 17.8 | % | | | 15.1 | % | | | | | | | | |
| | | |
| | | |
| | | |
| | | |
| | | | | | | | | | | |
| | | |
| | | | | |
| Content | | | 16.3 | | | | 22.1 | | | | 18.8 | | | | 21.7 | | | | 27.5 | | | | 35.4 | | | | 45.5 | | | | 7.4 | % | | | 24.7 | % |
| | | |
| | | |
| | | |
| | | |
| | | | | | | | | | | |
| | | |
| | | | | |
| | % growth | | | 38.4 | % | | | 35.0 | % | | | (14.6 | )% | | | 15.3 | % | | | 26.5 | % | | | 28.9 | % | | | 28.5 | % | | | | | | | | |
| | | |
| | | |
| | | |
| | | |
| | | | | | | | | | | |
| | | |
| | | | | |
Consolidated Revenue | | $ | 85.9 | | | $ | 96.6 | (2) | | $ | 92.4 | | | $ | 103.8 | | | $ | 121.4 | | | $ | 138.6 | | | $ | 162.4 | | | | 3.7 | % | | | 15.1 | % |
| | | |
| | | |
| | | |
| | | |
| | | | | | | | | | | |
| | | |
| | | | | |
| | % growth | | | 110.4 | % | | | 12.4 | % | | | (4.4 | )% | | | 12.3 | % | | | 17.0 | % | | | 14.2 | % | | | 17.1 | % | | | | | | | | |
| | | |
| | | |
| | | |
| | | |
| | | | | | | | | | | |
| | | | | | | | | |
EBITDA | | $ | 6.9 | | | $ | 5.5 | (3) | | $ | 11.5 | | | $ | 18.5 | | | $ | 24.8 | | | $ | 31.0 | | | $ | 42.1 | | | | 28.8 | % | | | 38.3 | % |
| | | |
| | | |
| | | |
| | | |
| | | | | | | | | | | |
| | | |
| | | | | |
| | %margin | | | 8.1 | % | | | 5.6 | % | | | 12.5 | % | | | 17.8 | % | | | 20.4 | % | | | 22.4 | % | | | 25.9 | % | | | | | | | | |
| | | |
| | | |
| | | |
| | | |
| | | | | | | | | | | |
| | | |
| | | | | |
| | % growth | | NM | | | (21.4 | ) | | | 111.1 | | | | 60.4 | | | | 34.4 | | | | 25.1 | | | | 35.6 | | | | | | | | | |
| | | |
| | | |
| | | |
| | | |
| | | | | | | | | | | |
| | | |
| | | | | |
EBIT | | $ | (4.2 | ) | | $ | (12.4) | (3) | | $ | (7.5 | ) | | $ | (1.8 | ) | | $ | 8.1 | | | $ | 18.9 | | | $ | 29.9 | | | NM | | NM |
| | | |
| | | |
| | | |
| | | |
| | | | | | | | | | | |
| | | |
| | | | | |
Net Income(4) | | $ | (1.2 | ) | | $ | (11.8) | (3)(5) | | $ | (7.2) | (6) | | $ | (1.0 | ) | | $ | 9.4 | | | $ | 21.0 | | | $ | 33.3 | | | NM | | NM |
| | | |
| | | |
| | | |
| | | |
| | | | | | | | | | | |
| | | |
| | | | | |
| (1) | | Source: Multex filings and Multex Management. |
| |
| (2) | | Excludes effects of $2.9 million contra-revenue effect of performance-based warrants. |
| |
| (3) | | Excludes effects of $27.4 million impairment and restructuring charges. |
| |
| (4) | | For projected period, book tax expense is assumed to be equal to cash taxes. |
| |
| (5) | | Excludes net $0.2 million effect of net gain on sales of investment and marketable securities. |
| |
| (6) | | Excludes $0.2 million loss on disposal of assets. |
Confidential
13
Multex—Historical and Projected Cash Flow Statements(1)
| | | | | | | | | | | | | | | | | | | | | | | | | | | | | | | | | |
| | | ($ in millions) |
| | | Years Ended December 31, | | Projected Years Ending December 31, | | CAGR(6) |
| | |
| |
| |
|
| | | 2000A | | 2001A | | 2002A | | 2003E | | 2004E | | 2005E | | 2006E | | ’02–’06 |
| | |
| |
| |
| |
| |
| |
| |
| |
|
Net Income | | $ | (1.2 | ) | | $ | (11.8) | (2) | | $ | (7.2 | ) | | $ | (1.0 | ) | | $ | 9.4 | | | $ | 21.0 | | | $ | 33.3 | | | | | |
| | | | | | | | | | | |
| | | |
| | | | | | | | | | | | | | | |
| |
| Plus: Depreciation & Amortization | | | 11.2 | | | | 17.9 | | | | 19.0 | | | | 20.2 | | | | 16.7 | | | | 12.2 | | | | 12.2 | | | | | |
| | | | | | | | | | | |
| | | |
| | | | | | | | | | | | | | | |
| |
Plus: Other Non-Cash Net Expenses(3) | | | 2.2 | | | | 4.6 | | | | 2.4 | | | | 1.2 | | | | 1.5 | | | | 1.7 | | | | 2.1 | | | | | |
| | | | | | | | | | | |
| | | |
| | | | | | | | | | | | | | | |
| |
| Less: Working Capital Investment | | | (16.5 | ) | | | (1.3 | ) | | | 2.2 | | | | (3.8 | ) | | | (3.3 | ) | | | (1.7 | ) | | | (2.2 | ) | | | | |
| | | |
| | | |
| | | |
| | | |
| | | |
| | | |
| | | |
| | | |
| |
Cash Flow from Operations | | $ | (4.3 | ) | | $ | (9.4 | ) | | $ | 16.4 | | | $ | 16.7 | | | $ | 24.2 | | | $ | 33.2 | | | $ | 45.4 | | | | | |
| | | | | | | | | | | |
| | | |
| | | | | | | | | | | | | | | |
| |
| Less: Capital Expenditures | | | (25.0 | ) | | | (15.6 | ) | | | (8.2 | ) | | | (6.0 | ) | | | (6.5 | ) | | | (7.0 | ) | | | (7.5 | ) | | | | |
| | | |
| | | |
| | | |
| | | |
| | | |
| | | |
| | | |
| | | |
| |
Free Cash Flow | | $ | (29.3 | ) | | $ | (6.2 | ) | | $ | 8.2 | | | $ | 10.7 | | | $ | 17.7 | | | $ | 26.2 | | | $ | 37.9 | | | | 46.8 | % |
| | | | | | | | | | | |
| | | |
| | | | | | | | | | | | | | | |
| |
Ending Cash Balance | | $ | 45.7 | | | $ | 41.8 | | | $ | 50.6 | | | $ | 61.3 | | | $ | 79.0 | | | $ | 105.1 | | | $ | 143.1 | | | | | |
| | | | | | | | | | | |
| | | |
| | | | | | | | | | | | | | | |
| |
Balance Sheet Assumptions | | | | | | | | | | | | | | | | | | | | | | | | | | | | | | | | |
| Days Receivable | | | 116.8 | | | | 69.0 | | | | 62.8 | | | | 60.0 | | | | 58.0 | | | | 56.0 | | | | 54.0 | | | | | |
| | | | | | | | | | | |
| | | |
| | | | | | | | | | | | | | | |
| |
Other Current Assets(4) | | | 36.7 | % | | | 16.7 | % | | | 16.4 | % | | | 20.0 | % | | | 20.0 | % | | | 20.0 | % | | | 20.0 | % | | | | |
| | | | | | | | | | | |
| | | |
| | | | | | | | | | | | | | | |
| |
| Days Payable | | | 98.3 | | | | 33.9 | | | | 29.5 | | | | 27.5 | | | | 27.5 | | | | 27.5 | | | | 27.5 | | | | | |
| | | | | | | | | | | |
| | | |
| | | | | | | | | | | | | | | |
| |
Accrued Expenses(4) | | | 55.2 | % | | | 23.7 | % | | | 31.3 | % | | | 30.0 | % | | | 30.0 | % | | | 30.0 | % | | | 30.0 | % | | | | |
| | | | | | | | | | | |
| | | |
| | | | | | | | | | | | | | | |
| |
ST Deferred Revenues(5) | | | 12.3 | | | | 9.4 | | | | 12.4 | | | | 11.0 | | | | 11.0 | | | | 11.0 | | | | 11.0 | | | | | |
| | | | | | | | | | | |
| | | |
| | | | | | | | | | | | | | | |
| |
| (1) | | Source: Multex filings and Multex Management. |
| |
| (2) | | Excludes all extraordinary items (see previous page footnotes for detail). |
| |
| (3) | | Represents deferred rent, bad debt expense, and amortization of equity consideration (warrants), non-cash revenue and equity in unconsolidated businesses. Excludes extraordinary items. |
| |
| (4) | | Represents% of cost of revenue (prepaid expenses). |
| |
| (5) | | Represents% of revenue. |
| |
| (6) | | 2000-2002 CAGR not meaningful. |
Confidential
14
Multex—DCF Analysis(1)
| | | | | | | | | | | | | | | | | | | | | | |
| ($ in millions) |
| Implied Enterprise Value(2) |
|
| | | | Trailing EBITDA Exit Multiple |
| | | |
|
| WACC | | 7.0x | | 8.0x | | 9.0x | | 10.0x | | 11.0x |
| |
| |
| |
| |
| |
|
| | 15.0% | | $ | 229.2 | | | $ | 253.2 | | | $ | 277.3 | | | $ | 301.4 | | | $ | 325.4 | |
| | 17.5% | | | 213.3 | | | | 235.4 | | | | 257.4 | | | | 279.5 | | | | 301.6 | |
| | 20.0% | | | 198.9 | | | | 219.2 | | | | 239.5 | | | | 259.8 | | | | 280.1 | |
| | |
| | | |
| | | |
| | | |
| | | |
| |
| | | | | | | | | | | | | | | | | | | | | | | | | | | | | | | | | | | | | | | | | | | | | | |
| Implied Equity Value per Share(3) | | Implied Enterprise Value/2003E EBITDA(4) |
| |
|
| | | | Trailing EBITDA Exit Multiple | | | | | | Trailing EBITDA Exit Multiple |
| | | |
| | | | | |
|
| WACC | | 7.0x | | 8.0x | | 9.0x | | 10.0x | | 11.0x | | WACC | | 7.0x | | 8.0x | | 9.0x | | 10.0x | | 11.0x |
| |
| |
| |
| |
| |
| |
| |
| |
| |
| |
| |
|
| | 15.0% | | $ | 7.97 | | | $ | 8.60 | | | $ | 9.24 | | | $ | 9.87 | | | $ | 10.50 | | | | 15.0 | % | | | 11.5 | x | | | 12.8 | x | | | 14.1 | x | | | 15.4 | x | | | 16.7 | x |
| | 17.5% | | | 7.54 | | | | 8.13 | | | | 8.72 | | | | 9.30 | | | | 9.88 | | | | 17.5 | % | | | 10.7 | | | | 11.9 | | | | 13.1 | | | | 14.3 | | | | 15.5 | |
| | 20.0% | | | 7.16 | | | | 7.70 | | | | 8.24 | | | | 8.78 | | | | 9.31 | | | | 20.0 | % | | | 9.9 | | | | 11.0 | | | | 12.1 | | | | 13.2 | | | | 14.3 | |
| | |
| | | |
| | | |
| | | |
| | | |
| | | |
| | | |
| | | |
| | | |
| | | |
| | | |
| |
| (1) | | Based on Multex Management projections. |
| |
| (2) | | Implied enterprise value includes the PV of UFCF for 2003E through 2006E, PV of terminal value based on trailing multiple on 2006E EBITDA and PV of NOLs assuming the mid-point of the indicated WACC range. |
| |
| (3) | | Implied equity value per share based on enterprise value plus cash and investments divided by net fully diluted shares at the indicated price. |
| |
| (4) | | Implied enterprise value/2003E EBITDA multiple excludes PV of NOLs. |
Confidential
15
Multex—Summary Historical and Projected Income Statements—Sensitivity Case(1)
| | | | | | | | | | | | | | | | | | | | | | | | | | | | | | | | | | | | | | |
| | | | ($ in millions) |
| | | | Years Ended December 31, | | Projected Years Ending December 31, | | CAGR | | CAGR |
| | | |
| |
| |
| |
|
| | | | 2000A | | 2001A | | 2002A | | 2003E | | 2004E | | 2005E | | 2006E | | '00–'02 | | '02–'06 |
| | | |
| |
| |
| |
| |
| |
| |
| |
| |
|
Revenue
| | | | | | | | | | | | | | | | | | | | | | | | | | | | | | | | | | | | |
| MultexEXPRESS | | $ | 29.1 | | | $ | 36.3 | | | $ | 37.9 | | | $ | 38.1 | | | $ | 37.1 | | | $ | 32.7 | | | $ | 36.1 | | | | 14.2 | % | | | (1.2 | )% |
| | | |
| | | |
| | | |
| | | |
| | | | | | | | | | | |
| | | |
| | | | | |
| | %growth | | | 217.3 | % | | | 24.9% | (2) | | | 4.5 | % | | | 0.4 | % | | | (2.5 | )% | | | (11.9 | )% | | | 10.4 | % | | | | | | | | |
| | | |
| | | |
| | | |
| | | |
| | | | | | | | | | | |
| | | |
| | | | | |
| MultexNET | | | 22.9 | | | | 25.2 | | | | 26.8 | | | | 29.9 | | | | 33.1 | | | | 36.5 | | | | 40.0 | | | | 8.1 | % | | | 10.5 | % |
| | | |
| | | |
| | | |
| | | |
| | | | | | | | | | | |
| | | |
| | | | | |
| | %growth | | | 63.2 | % | | | 10.0 | % | | | 6.2 | % | | | 11.8 | % | | | 10.4 | % | | | 10.5 | % | | | 9.5 | % | | | | | | | | |
| | | |
| | | |
| | | |
| | | |
| | | | | | | | | | | |
| | | |
| | | | | |
| MultexInvestor | | | 17.6 | | | | 13.0 | | | | 8.8 | | | | 8.3 | | | | 9.5 | | | | 10.7 | | | | 12.5 | | | | (29.2 | )% | | | 9.2 | % |
| | | |
| | | |
| | | |
| | | |
| | | | | | | | | | | |
| | | |
| | | | | |
| | %growth | | | 201.4 | % | | | (26.0 | )% | | | (32.3 | )% | | | (5.6 | )% | | | 14.4 | % | | | 12.6 | % | | | 16.8 | % | | | | | | | | |
| | | |
| | | |
| | | |
| | | |
| | | | | | | | | | | |
| | | |
| | | | | |
| Content | | | 16.3 | | | | 22.1 | | | | 18.8 | | | | 21.7 | | | | 26.3 | | | | 30.9 | | | | 35.5 | | | | 7.4 | % | | | 17.2 | % |
| | | |
| | | |
| | | |
| | | |
| | | | | | | | | | | |
| | | |
| | | | | |
| | %growth | | | 38.4 | % | | | 35.0 | % | | | (14.6 | )% | | | 15.3 | % | | | 21.1 | % | | | 17.5 | % | | | 14.9 | % | | | | | | | | |
| | | |
| | | |
| | | |
| | | |
| | | | | | | | | | | |
| | | |
| | | | | |
Consolidated Revenue | | $ | 85.9 | | | $ | 96.6 | (2) | | $ | 92.4 | | | $ | 98.1 | | | $ | 106.0 | | | $ | 110.9 | | | $ | 124.1 | | | | 3.7 | % | | | 7.7 | % |
| | | |
| | | |
| | | |
| | | |
| | | | | | | | | | | |
| | | |
| | | | | |
| | %growth | | | 110.4 | % | | | 12.4 | % | | | (4.4 | )% | | | 6.2 | % | | | 8.1 | % | | | 4.6 | % | | | 12.0 | % | | | | | | | | |
| | | |
| | | |
| | | |
| | | |
| | | | | | | | | | | |
| | | |
| | | | | |
EBITDA | | $ | 6.9 | | | $ | 5.5 | (3) | | $ | 11.5 | | | $ | 14.2 | | | $ | 15.3 | | | $ | 13.5 | | | $ | 18.0 | | | | 28.8 | % | | | 11.8 | % |
| | | |
| | | |
| | | |
| | | |
| | | | | | | | | | | |
| | | |
| | | | | |
| | %margin | | | 8.1 | % | | | 5.6 | % | | | 12.5 | % | | | 14.5 | % | | | 14.4 | % | | | 12.1 | % | | | 14.5 | % | | | | | | | | |
| | | |
| | | |
| | | |
| | | |
| | | | | | | | | | | |
| | | |
| | | | | |
| | %growth | | NM | | | (21.4 | ) | | | 111.1 | | | | 23.4 | | | | 7.8 | | | | (12.1 | ) | | | 33.7 | | | | | | | | | |
| | | |
| | | |
| | | |
| | | |
| | | | | | | | | | | |
| | | |
| | | | | |
EBIT | | | ($4.2 | ) | | | ($12.4) | (3) | | | ($7.5 | ) | | | ($6.0 | ) | | | ($1.4 | ) | | $ | 1.3 | | | $ | 5.8 | | | NM | | NM |
| | | |
| | | |
| | | |
| | | |
| | | | | | | | | | | |
| | | |
| | | | | |
Net Income(4) | | | ($1.2 | ) | | | ($11.8) | (3)(5) | | | ($7.2) | (6) | | | ($5.3 | ) | | | ($0.3 | ) | | $ | 3.1 | | | $ | 8.2 | | | NM | | NM |
| | | |
| | | |
| | | |
| | | |
| | | | | | | | | | | |
| | | |
| | | | | |
| (1) | | Source: Multex filings and Multex Management. |
| |
| (2) | | Excludes effects of $2.9 million contra-revenue effect of performance-based warrants. |
| |
| (3) | | Excludes effects of $27.4 million impairment and restructuring charges. |
| |
| (4) | | For projected period, book tax expense is assumed to be equal to cash taxes. |
| |
| (5) | | Excludes net $0.2 million effect of net gain on sales of investment and marketable securities. |
| |
| (6) | | Excludes $0.2 million loss on disposal of assets. |
Confidential
16
Multex—Historical and Projected Cash Flow Statements—Sensitivity Case(1)
| | | | | | | | | | | | | | | | | | | | | | | | | | | | | | | | | |
| | | ($ in millions) |
| | | Years Ended December 31, | | Projected Years Ending December 31, | | CAGR(6) |
| | |
| |
| |
|
| | | 2000A | | 2001A | | 2002A | | 2003E | | 2004E | | 2005E | | 2006E | | '02–'06 |
| | |
| |
| |
| |
| |
| |
| |
| |
|
Net Income | | $ | (1.2 | ) | | $ | (11.8) | (2) | | $ | (7.2 | ) | | $ | (5.3 | ) | | $ | (0.3 | ) | | $ | 3.1 | | | $ | 8.2 | | | | | |
| | | | | | | | | | | |
| | | |
| | | | | | | | | | | | | | | | | |
| Plus: Depreciation & Amortization | | | 11.2 | | | | 17.9 | | | | 19.0 | | | | 20.2 | | | | 16.7 | | | | 12.2 | | | | 12.2 | | | | | |
| | | | | | | | | | | |
| | | |
| | | | | | | | | | | | | | | | | |
Plus: Other Non-Cash Net Expenses(3) | | | 2.2 | | | | 4.6 | | | | 2.4 | | | | 1.1 | | | | 1.3 | | | | 1.0 | | | | 1.2 | | | | | |
| | | | | | | | | | | |
| | | |
| | | | | | | | | | | | | | | | | |
| Less: Working Capital Investment | | | (16.5 | ) | | | (1.3 | ) | | | 2.2 | | | | (3.5 | ) | | | (3.0 | ) | | | (1.1 | ) | | | (1.6 | ) | | | | |
| | | |
| | | |
| | | |
| | | |
| | | |
| | | |
| | | |
| | | | | |
Cash Flow from Operations | | $ | (4.3 | ) | | $ | (9.4 | ) | | $ | 16.4 | | | $ | 12.6 | | | $ | 14.6 | | | $ | 15.2 | | | $ | 20.0 | | | | | |
| | | | | | | | | | | |
| | | |
| | | | | | | | | | | | | | | | | |
| Less: Capital Expenditures | | | (25.0 | ) | | | (15.6 | ) | | | (8.2 | ) | | | (6.0 | ) | | | (6.5 | ) | | | (7.0 | ) | | | (7.5 | ) | | | | |
| | | |
| | | |
| | | |
| | | |
| | | |
| | | |
| | | |
| | | | | |
Free Cash Flow | | $ | (29.3 | ) | | $ | (6.2 | ) | | $ | 8.2 | | | $ | 6.6 | | | $ | 8.1 | | | $ | 8.2 | | | $ | 12.5 | | | | 11.2 | % |
| | | | | | | | | | | |
| | | |
| | | | | | | | | | | | | | | |
| |
Ending Cash Balance | | $ | 45.7 | | | $ | 41.8 | | | $ | 50.6 | | | $ | 57.2 | | | $ | 65.3 | | | $ | 73.5 | | | $ | 86.0 | | | | | |
| | | | | | | | | | | |
| | | |
| | | | | | | | | | | | | | | | | |
Balance Sheet Assumptions | | | | | | | | | | | | | | | | | | | | | | | | | | | | | | | | |
| Days Receivable | | | 116.8 | | | | 69.0 | | | | 62.8 | | | | 60.0 | | | | 58.0 | | | | 56.0 | | | | 54.0 | | | | | |
| | | | | | | | | | | |
| | | |
| | | | | | | | | | | | | | | | | |
Other Current Assets(4) | | | 36.7 | % | | | 16.7 | % | | | 16.4 | % | | | 20.0 | % | | | 20.0 | % | | | 20.0 | % | | | 20.0 | % | | | | |
| | | | | | | | | | | |
| | | |
| | | | | | | | | | | | | | | | | |
| Days Payable | | | 98.3 | | | | 33.9 | | | | 29.5 | | | | 27.5 | | | | 27.5 | | | | 27.5 | | | | 27.5 | | | | | |
| | | | | | | | | | | |
| | | |
| | | | | | | | | | | | | | | | | |
Accrued Expenses(4) | | | 55.2 | % | | | 23.7 | % | | | 31.3 | % | | | 30.0 | % | | | 30.0 | % | | | 30.0 | % | | | 30.0 | % | | | | |
| | | | | | | | | | | |
| | | |
| | | | | | | | | | | | | | | | | |
| ST Deferred Revenues(5) | | | 12.3 | | | | 9.4 | | | | 12.4 | | | | 11.0 | | | | 11.0 | | | | 11.0 | | | | 11.0 | | | | | |
| | | | | | | | | | | |
| | | |
| | | | | | | | | | | | | | | | | |
Confidential
17
| (1) | | Source: Multex filings and Multex Management. |
| |
| (2) | | Excludes all extraordinary items (see previous page footnotes for detail). |
| |
| (3) | | Represents deferred rent, bad debt expense, and amortization of equity consideration (warrants), noncash revenue and equity in unconsolidated businesses. Excludes extraordinary items. |
| |
| (4) | | Represents% of cost of revenue (prepaid expenses). |
| |
| (5) | | Represents% of revenue. |
| |
| (6) | | 2000–2002 CAGR not meaningful. |
Confidential
18
Multex—DCF Analysis—Sensitivity Case(1)
| | | | | | | | | | | | | | | | | | | | | | |
| | | | | | | | | | | | | | | | | | | | ($ in millions) |
| Implied Enterprise Value(2) |
|
| | | | Trailing EBITDA Exit Multiple |
| | | |
|
| WACC | | 6.0x | | 7.0x | | 8.0x | | 9.0x | | 10.0x |
| |
| |
| |
| |
| |
|
| | 15.0% | | $ | 93.5 | | | $ | 103.7 | | | $ | 114.0 | | | $ | 124.3 | | | $ | 134.6 | |
| | 17.5% | | | 87.6 | | | | 97.0 | | | | 106.5 | | | | 115.9 | | | | 125.3 | |
| | 20.0% | | | 82.3 | | | | 91.0 | | | | 99.6 | | | | 108.3 | | | | 117.0 | |
| | |
| | | |
| | | |
| | | |
| | | |
| |
| | | | | | | | | | | | | | | | | | | | | | |
| Implied Equity Value per Share(3) |
|
| | | | Trailing EBITDA Exit Multiple |
| | | |
|
| WACC | | 6.0x | | 7.0x | | 8.0x | | 9.0x | | 10.0x |
| |
| |
| |
| |
| |
|
| | 15.0% | | $ | 4.32 | | | $ | 4.61 | | | $ | 4.88 | | | $ | 5.16 | | | $ | 5.44 | |
| | 17.5% | | | 4.16 | | | | 4.42 | | | | 4.68 | | | | 4.94 | | | | 5.19 | |
| | 20.0% | | | 4.02 | | | | 4.25 | | | | 4.49 | | | | 4.73 | | | | 4.97 | |
| | |
| | | |
| | | |
| | | |
| | | |
| |
| | | | | | | | | | | | | | | | | | | | | |
| Implied Enterprise Value/2003 EBITDA(4) |
|
| | | Trailing EBITDA Exit Multiple |
| | |
|
| WACC | | 6.0x | | 7.0x | | 8.0x | | 9.0x | | 10.0x |
| |
| |
| |
| |
| |
|
15.0 % | | | 5.7x | | | | 6.4x | | | | 7.2x | | | | 7.9x | | | | 8.6x | |
17.5 % | | | 5.3 | | | | 6.0 | | | | 6.6 | | | | 7.3 | | | | 8.0 | |
20.0 % | | | 4.9 | | | | 5.5 | | | | 6.1 | | | | 6.8 | | | | 7.4 | |
| | |
| | | |
| | | |
| | | |
| | | |
| |
| (1) | | Based on Multex Management projections. |
| |
| (2) | | Implied enterprise value includes the PV of UFCF for 2003E through 2006E, PV of terminal value based on trailing multiple on 2006E EBITDA and PV of NOLs assuming the mid-point of the WACC range. |
| |
| (3) | | Implied equity value per share based on enterprise value plus cash and investments divided by net fully diluted shares at the indicated price. |
| |
| (4) | | Implied enterprise value/2003E EBITDA multiple excludes PV of NOLs. |
Confidential
19
Section 4
Selected M&A Transaction Analysis
Selected Financial Information Services M&A Transactions
| | | | | | | | | | | | | | | | | | | | | | | | | | | |
| | | | | | | | | | | | | | | | | | | | | | | | | ($ in millions) |
|
| | | | | | | | | | | | | Premium
| | LTM
| | Transaction Value/
|
Date
Announced | | Date
Completed | | Acquiror | | Target | | Consideration | | Transaction
Value | | Prior Close | | 1 Mo. Prior | | Revenue | | EBITDA(1) | | Revenue | | EBITDA |
| |
| |
| |
| |
| |
| |
| |
| |
| |
| |
| |
|
| 03/07/00 | | 04/12/00 | | Fitch IBCA
(subsidiary of
FIMALAC S.A.) | | Duff & Phelps
Credit Rating Co. | | Cash | | 520.2(2) | | | 26.6 | % | | | 19.0 | % | | 92.3(2) | | 36.2(2) | | 5.6 x | | 14.4 x |
| 03/23/00 | | 05/04/00 | | Thomson Corporation | | Dialog Info. Svcs.
Division | | Undisclosed | | 275.0(3) | | | NM | | | | NM | | | 233.0(3) | | 49.1(4) | | 1.2 x | | 5.6 x |
| 06/05/00 | | 09/14/00 | | Thomson Corporation | | Primark Corporation | | Cash | | 1,013.0(5) | | | 31.0 | % | | | 48.7 | % | | 510.1(6) | | 99.8(6) | | 2.0 x | | 10.2 x |
| 07/13/00 | | 09/11/00 | | Thomson Corporation | | Carson Group | | Undisclosed | | 175.0(7) | | | NM | | | | NM | | | 50.0(7) | | 12.5(7) | | 3.5 x | | 14.0 x |
| 06/21/01 | | 06/21/01 | | Thomson Corporation | | First Call(8) | | Undisclosed | | 200.0(9) | | | NM | | | | NM | | | NA | | NA | | 3.5 x(9) | | NA |
| 02/11/02 | | 04/15/02 | | Moody’s Corporation | | KMV LLC | | Cash | | 210.0(10) | | | NM | | | | NM | | | 60.0(10) | | 6.0 | | 3.5 x | | 35.0 x |
| 05/16/02 | | Terminated | | Fidelity National
Information
Solutions, Inc. | | Factual Data Corp. | | Cash/Stock | | 102.8(11) | | | 92.3 | % | | | 91.0 | % | | 51.7(11) | | 12.4(11) | | 2.0 x | | 8.3 x |
| 12/05/02 | | Pending | | D&B Corp. | | Hoover’s, Inc. | | Cash | | 81.4(12) | | | 30.8 | % | | | 36.7 | % | | 31.6(12) | | 2.6(12) | | 2.6 x | | 31.6 x |
| 01/16/03 | | Pending | | Interactive Data
Corporation | | S&P ComStock | | Cash | | 115.0(13) | | | NM | | | | NM | | | 52.5(14) | | NA | | 2.2 x | | NA |
| |
| |
| |
| |
| |
| | |
| | | |
| | |
| |
| |
| |
|
| (1) | | Excludes extraordinary and non-recurring items. |
| |
| (2) | | Source: Duff & Phelps Press Release dated 3/7/00 and 10-K dated 12/31/99. |
| |
| (3) | | Source: Thomson company press release dated March 23, 2000. Represents 1999 revenue number. |
| |
| (4) | | Source: Bright Station Plc 20-F dated 12/31/99. Numbers are converted from £ into US$ at US$1.638/£ (the average exchange rate for 1999). |
| |
| (5) | | Source: Thomson press release dated 9/14/00. Includes the assumption of approximately US$235 million of Primark’s debt. |
| |
| (6) | | Source: Primark 10-K dated 12/31/99 and 10-Q dated 6/30/00. Represents LTM ended 6/30/00. |
| |
| (7) | | Source: Morgan Stanley research report dated 3/21/02. No details were disclosed by Thomson. The Carson Group was a private company. |
| |
| (8) | | Thomson owned 52% of First Call and acquired the remaining 48%. |
| |
| (9) | | Source: Merrill Lynch research report dated 6/26/01. No details were disclosed by Thomson. Numbers are based on Merrill Lynch estimates (revenue multiple in the 3.0x-4.0x range). |
| |
| (10) | | Source: Moody’s 8-K dated 2/10/02. Revenue represents 2002 estimate and pre-tax cash flow is assumed to be equal to EBITDA. |
| |
| (11) | | Source: Factual Data Press Release dated 5/16/02, 10-K dated 12/31/01 and 10-Q dated 3/31/02. |
| |
| (12) | | Source: Hoover’s Press Release dated 12/5/02, 10-K dated 3/31/02 and 10-Q dated 9/30/02. On Ferbuary 7, 2003, Hoover’s announced that Austin Ventures and Marathon Partners, L.P. proposed to acquire all outstanding Hoover’s shares for $8.00 per share (compared to $7.00 from D&B). This consideration implied a transaction value of $99.5 million, unaffected prior close and 1 mo. prior premia of 49.5% and 56.3%, respectively and Transaction Revenue and EBITDA multiples of 3.1x and 38.7x, respectively. On February 13, 2003, Austin Ventures and Marathon Partners, L.P withdrew their offer. |
| |
| (13) | | Source: Interactive Data Corp. Press Release dated 1/16/03. |
| |
| (14) | | Source: Interactive Data Corp. Press Release dated 1/16/03. Represents 2003E revenues. |
Confidential
20
Cross-Industry Acquisition Premium Analysis(1)
| | | | | | | | | | | | | | | | | | | | | | | | | |
| | | Mean Premium to Stock Price: | | Median Premium to Stock Price: |
| | |
| |
|
| | | 1 Day Prior | | 1 Week Prior | | 1 Month Prior | | 1 Day Prior | | 1 Week Prior | | 1 Month Prior |
| | |
| |
| |
| |
| |
| |
|
| All Deals (>50% acquired) | | | 32.5 | % | | | 37.6 | % | | | 45.6 | % | | | 26.3 | % | | | 31.8 | % | | | 40.3 | % |
| All Deals (100% acquired) | | | 32.2 | | | | 37.6 | | | | 45.7 | | | | 26.2 | | | | 32.0 | | | | 40.1 | |
Cash Deals (>50% acquired)(2) | | | 36.9 | | | | 43.1 | | | | 54.6 | | | | 32.1 | | | | 36.3 | | | | 49.7 | |
Cash Deals (100% acquired)(2) | | | 36.8 | | | | 43.7 | | | | 55.8 | | | | 33.0 | | | | 37.6 | | | | 51.0 | |
| | |
| | | |
| | | |
| | | |
| | | |
| | | |
| |
| (1) | | Source: Dealogic. Based on $150-$350 million acquisitions of public U.S. targets since 1/1/2000. Excludes outliers, defined as large premiums due to stock prices <$0.50 per share and discounts (negative premiums) greater than 50%. |
| |
| (2) | | Excludes deals with mixed or all-stock consideration. |
Confidential
21
Section 5
Selected Public Company Analysis
Selected Financial Information Services Companies
Adjusted Enterprise Value(1)
($ in millions)
| | | |
| Company | | Description |
| |
|
| Thomson (TOC) | | Global, integrated information solutions company servicing business and professional customers worldwide. The business is organized in four principal product divisions (i) Thomson Legal & Regulatory, (ii) Thomson Learning, (iii) Thomson Financial and (iv) Thomson Scientific & Healthcare. Thomson Financial division represents approximately 22% of Thomson’s consolidated revenue(2) |
| | | |
| McGraw-Hill (MHP) | | Serves business, professional and educational markets worldwide with information products and services. The Company has three business segments (i) McGraw-Hill Education (ii) Financial Services and Information, and (iii) Media Services. McGraw-Hill’s Financial Services group represents approximately 32% of McGraw-Hill’s consolidated revenue(2) |
| | | |
| Moody’s (MCO) | | Global credit rating, research and risk analysis firm that publishes credit opinions, research and ratings on fixed-income securities, other credit obligations and issuers of securities. |
| | | |
| Reuters (RTR) | | Core business activities are the gathering and distribution of news, information and other content from multiple sources across the globe and the provision of technology to distribute, analyze, view and trade with information. |
| | | |
| Dun and Bradstreet (DNB) | | The Company collects and organizes business information, enabling businesses to make information-based decisions. The Company is organized in three business lines (i) Risk Management Solutions (ii) Sales and Marketing Solutions and (iii) Supply Management Solutions. |
| | | |
| Interactive Data (IDC) | | Global provider of financial information to institutional and retail investors. Supplies time-sensitive debt and equities pricing information as well as fixed income portfolio analytics. |
| | | |
| FactSet (FDS) | | Provider of global financial and economic information. Combining more than 200 databases into its own dedicated online service, the Company also offers the tools to download, combine and manipulate the data for investment analysis. |
| | | |
| Barra (BARZ) | | Investment risk management company that provides solutions to financial professionals worldwide. The Company is organized in two business units (i) Core Business, which provides portfolio risk management and enterprise risk management systems and (ii) Venture Business. |
| | | |
| Value Line (VALU) | | Produces investment-related periodical publications and provides investment advisory services to mutual funds, institutions and individual clients. The Company also offers current and historical financial databases. |
| | | |
| OneSource (ONES) | | Provides web-based business and financial information products to professionals. Products include industry and company profiles, research reports and financial information on over one million public and private companies. |
| | | Note: As of 2/14/2003. |
| |
| | | Source: Wall Street Research and public filings. |
| |
| (1) | | Adjusted enterprise value defined as market value of equity plus net debt and minority interests less unconsolidated assets. |
| |
| (2) | | Source: company public filings. |
Confidential
22
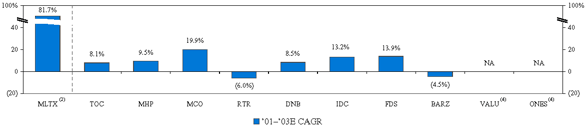
Selected Financial Information Services Companies(1)
Revenue
($ in millions)

Revenue Growth
| | | Source: Wall Street Research and public filings. |
| |
| (1) | | Projections based on most current available Wall Street consensus estimates. |
| |
| (2) | | Source: Multex Management. |
| |
| (3) | | LTM as of 10/31/2002. |
| |
| (4) | | Wall Street Research was not available. |
Confidential
23
Selected Financial Information Services Companies(1)
EV/Revenue(2)
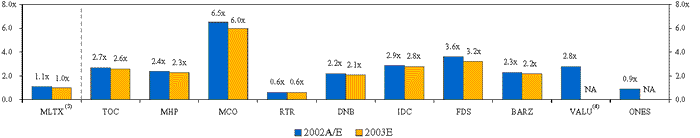
| | | Note: As of 2/14/2003. |
| |
| | | Source: Wall Street Research and public filings. |
| |
| (1) | | Projections based on most current available Wall Street consensus estimates. |
| |
| (2) | | Adjusted enterprise value defined as market value of equity plus net debt plus minority interests less unconsolidated assets. |
| |
| (3) | | Source: Multex Management. |
| |
| (4) | | LTM multiple as of 10/31/2002. |
Confidential
24
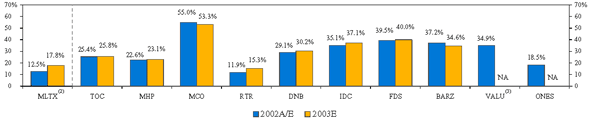
Selected Financial Information Services Companies(1)
EBITDA
($ in millions)

EBITDA Growth(2)
| | | Source: Wall Street Research and public filings. |
| |
| (1) | | Projections based on most current available Wall Street consensus estimates. |
| |
| (2) | | Based on Multex Management. |
| |
| (3) | | LTM as of 10/31/2002. |
| |
| (4) | | Wall Street Research was not available. |
Confidential
25
Selected Financial Information Services Companies(1)
EBITDA Margin
EV/EBITDA(4)
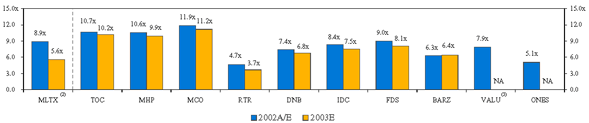
| | | Note: As of 2/14/2003. |
| |
| | | Source: Wall Street Research and public filings. |
| |
| (1) | | Projections based on most current available Wall Street consensus estimates. |
| |
| (2) | | Source: Multex Management. |
| |
| (3) | | LTM as of 10/31/2002. |
| |
| (4) | | Adjusted enterprise value defined as market value of equity plus net debt and minority interests less unconsolidated assets. |
Confidential
26