Exhibit 99.1
CGI Group Inc.
2012 Annual Report
CGI’s 2012 Annual Report is comprised
of two separate volumes:
Volume 1:Experience the commitment
&
Volume 2:Numbers
Volume 1 of the Annual Report
follows this page.
(this page does not form part of the Annual Report)
2012 annual report
Experience the commitment®
The CGI Constitution
Our dream
To create an environment in which we enjoy working together and, as owners, contribute to building a company we can be proud of.
Our mission
To help our clients with professional services of outstanding quality, competence and objectivity, delivering the best solutions to fully satisfy client objectives in information technology, business processes and management. In all we do, we foster a culture of partnership, intrapreneurship, teamwork and integrity, building a world class IT and business process services company.
Our vision
To be a world class IT and business process services leader helping our clients succeed.
Our values
Partnership and quality
For us, partnership and quality are both a philosophy and a way of life. We develop and follow the best management practices and we entrench these approaches into client relationships and service delivery frameworks in order to foster long-term and strong partnerships with our clients. We listen to our clients and we are committed to their total satisfaction in everything we do.
Objectivity and integrity
We exercise the highest degree of independent thinking in selecting the products, services and solutions we recommend to clients. In doing so, we adhere to the highest values of quality, objectivity and integrity. Consequently, strict rules of business and professional conduct are applied. We do not accept any remuneration from suppliers.
Intrapreneurship and sharing
Our success is based on the competence, commitment and enthusiasm of our members. Therefore, we promote a climate of innovation and initiative where we are empowered with a sense of ownership in supporting clients, thus ensuring the firm’s profitable growth. Through teamwork, sharing our know-how and expertise, we bring the best of CGI to our clients. As members, we share in the value we create through equity ownership and profit participation.
Respect
As a global company, we recognize the richness that diversity brings to the company and welcome this diversity while embracing the overall CGI culture. In all we do, we are respectful of our fellow members, clients, business partners and competitors.
Financial strength
We strive to deliver strong, consistent financial performance, which sustains long-term growth and rewards our members and shareholders. Financial strength enables us to continuously invest and improve services and business solutions to the benefit of our clients. To this end, we manage our business to generate industry superior returns.
Corporate social responsibility
Our business model is designed to ensure that we are close to our clients and communities. As members, we embrace our social responsibilities and contribute to the continuous development of the communities in which we live and work.
Visit our online annual report to access the complete financial report and learn how our committed approach achieves results for our clients.
cgi.com/2012-ar
For 36 years, CGI has been a reliable and trusted partner committed to our clients’ success, providing flexibility, accountability and quality through our client proximity business model and the application of our Management Foundation.
Historically, CGI has profitably doubled its size every three to five years. With the combination of CGI and Logica, we now have the scale to offer our clients greater presence, service capabilities and expertise around the world. We are also better positioned to provide our professionals, or members as we refer to them, with opportunities to build rewarding careers and to deliver shareholders superior results and industry-leading returns for the long term.
CGI: Experience the commitment®
CGI: Built to grow and last.
Experience has taught us that clients, employees and shareholders want to be associated with the best—the best partner, the best employer and the best investment. We are passionate about building and operating a sound, stable and growing business for the benefit of all stakeholders.
Clients:
Fostering long-term relationships with 10,000 global clients
For CGI, global growth is not an option; it is a necessity. As markets globalize, so does a significant portion of our client base. In fact, 60% of our largest clients have a presence in both North America and in Europe, while approximately a third are in North America, Europe and Asia. We are dedicated to growing and expanding our capabilities to serve all of our clients wherever they are.
In line with this commitment and consistent with our profitable growth strategy, 2012 will be remembered as a milestone year for CGI. On August 20, 2012 we enthusiastically welcomed 41,000 new colleagues into the CGI family as we merged with UK-based Logica. We did so, not with an eye on becoming the biggest, but to become the best. We strive to deliver performance that sustains long-term growth, increases client loyalty and rewards our members and shareholders.
In addition, we now have access to the European IT market, which we consider very attractive as it represents approximately 30% of the global IT spend. Perhaps more acutely than ever, Europe’s ongoing economic and social challenges will require IT investments to increase efficiency and achieve the cost curtailment required to remain competitive.
We are now stronger than ever, significantly expanding our reach and bringing critical mass to both local and global clients. As we expand alongside them, both at home and abroad, we understand that our success as a business is measured by our clients’ success and directly linked to their trust and confidence in CGI. Our track record of profitable and rapid growth, including more than 70 successful integrations, provide us the necessary execution experience and confidence to ensure synergies are delivered and efficiencies are gained quickly and seamlessly.
Together, as a team of 72,000 members across a network of 400 local offices in 40 countries, our model is designed to empower local decision making and accountability. With strong market positions in North America, Europe and Asia Pacific, CGI is now the fifth largest independent IT services provider worldwide, generating more than $10 billion in combined annual revenue and providing a balanced blend of onshore, nearshore and offshore delivery options that bring our vast experience and expertise to clients’ front doors.
We pride ourselves on the long-term and deep relationships we’ve developed with our clients, which have been the guiding force behind many of our innovations and service offerings. By aligning our future strategies to clients’ critical business imperatives, we have become a leader in such technologies as cloud computing and health information exchanges and are at the forefront of cybersecurity and biometrics.
This culture of innovation has helped us prepare not only for today’s needs, but also for the opportunities and challenges that tomorrow will bring. It is through innovative thinking and a consultative approach to doing business with our clients that we have booked $5.2 billion in new business during fiscal 2012, increasing our backlog to $17.6 billion.
In fiscal 2012, we continued our tradition of high client satisfaction, scoring an average of 9.1 out of 10 based on signed client assessments CGI rigorously conducts with its clients. As important, we received a 9.4 rating for client loyalty, denoting our clients’ intent to continue to use and recommend CGI’s services to others. Client loyalty is important in any business, but in a services business like ours, it is vital. That is why we are prioritizing the roll out of our client assessment program across the Logica client base in fiscal 2013.
Members:
Building a company we can be proud of
As members, we are encouraged to be owners, enjoy our work and benefit from the success that comes from building a company that best satisfies the needs of all our stakeholders. This is why the motivation of our members differentiates us. At CGI, we are easier to do business with because we are driven, individually and collectively, to satisfy our clients and grow our company.
While most companies have a vision and mission, CGI goes a step beyond. We have a company dream:
“To create an environment in which we enjoy working together and, as owners, contribute to building a company we can be proud of.”
A key aspect of our management approach is ownership, because it is empowering, fosters engagement and instills accountability among our members.
As a result, we have one of the lowest attrition rates in the industry. Our ability to attract and retain top talent provides clients with the best experts and long-term partners to drive the innovation, cost reductions and improved operations critical to their success. In fact, our clients’ satisfaction is the top driver of our members’ satisfaction based on our annual member consultation.
Shareholders:
Creating sustainable value for the long term
At CGI, we’ve always understood that to be a strong global company we need to be strong financially. Our financial strength is a cornerstone of our commitment to be the best. It has enabled us to continuously invest in and improve services, to innovate and to profitably grow CGI for the benefit of all stakeholders.
This consistent and disciplined approach has provided the necessary fuel to successfully execute our “Build and Buy” profitable growth strategy, delivering both strong organic growth and accretive acquisitions throughout our history.
During fiscal 2012, CGI’s share price increased by approximately 35%, adding $3 billion to the market value of CGI. Consistent with our acquisition history, we expect the Logica transaction to create additional shareholder value and be accretive to our earnings per share by 25-30% before acquisition related and integration costs in fiscal 2013 and continue accelerating throughout the three-year integration period.
Our ability to generate consistent results with industry leading margins is proof that adhering to the fundamentals of operational and delivery excellence is key to running a sound and stable business.
We greatly appreciate the trust our shareholders have placed in us. We are committed to creating long-term value, while maintaining the flexibility to capitalize on new opportunities as they arise.
Committed to being the best
In all we do, we strive to be the best—continuously expanding our capabilities so that we can meet our commitments, earn new business and, ultimately, exceed expectations. Going forward, this continues to be our goal and our passion.
We want to thank you for your continued interest and commitment to CGI. Together, we will remain a strong, stable company anchored in profitable growth—today and in the years to come.
Serge Godin
Founder and
Executive Chairman of the Board
Michael E. Roach
President and
Chief Executive Officer
Revenue growth
13%
Recurring revenue of
64%
Market cap up 58% to
$8.1 billion
Annual revenue to exceed
$10 billion
Satisfying clients is our business
Through a consistent, disciplined and accountable delivery approach, CGI has achieved an industry-leading track record of on-time, on-budget projects, helping clients leverage current investments while adopting new technology. As a result of this approach, our average client satisfaction score for the past 10 years has measured consistently higher than 9 out of 10.
CGI’s geographical reach covers 85% of global IT spending. With this global presence, CGI is well positioned to help our clients win and grow. In addition, our high level of recurring revenue enables us to maintain long-term relationships and invest in the future for the benefit of our clients.
Business highlights*
(based on fiscal 2012 revenue)
Contract types
64%
Management of IT and business functions (outsourcing)
46%
IT services
18%
Business process services
36%
Systems integration and consulting
Geographic markets (based on client domicile)
47%
United States
36%
Canada
17%
Rest of world
Targeted verticals
40%
Government
22%
Financial services
14%
Telecommunications and utilities
14%
Manufacturing, retail and distribution
10%
Health
Backlog of long-term signed contracts
$17.6 billion
New contract bookings
$5.2 billion
| * | Includes Logica revenue from August 20, 2012. |
cgi.com/2012-ar/at-a-glance
Global rank 5th among independent IT and BPS firms
Proven performance 95% on-time, on-budget
Client loyalty 9.4 out of 10 based on signed clients assessments
Our approach
Clients tell us the way we deliver services is a primary reason they select CGI. These are the key characteristics that distinguish our approach.
People—Our members are motivated, as owners, to build our company and best satisfy client needs.
Proximity—Our members across 400 local offices are empowered with local decision making while bringing global capabilities.
Quality—Consistent processes across our operations enable consistent outcomes which are measured and continuously improved.
Services—Industry and technology expertise, end to end services and rich IP-based solutions deliver performance.
Creativity—We drive innovation together with our clients to better support their business strategies.
Financial strength—36 years of disciplined performance and sustained growth facilitate long-term relationships and large-scaleengagements.
Our services
CGI offers a full spectrum of services, solutions and industry know-how to accelerate clients’ business transformation.
High-end business and IT consulting—Vast array of services, including business and IT strategy, enterprise architecture, process redesign, change management and performance measurement.
Systems integration—System architecture, system development and implementation of business and technology solutions.
Application development and management—Design, development, implementation, maintenance and improvement of business applications.
Infrastructure services—Comprehensive infrastructure management capabilities that adapt to business requirements and service priorities.
Business process services—Management of back-office business processes to streamline operations.
IP-based solutions—Deep portfolio of 100+ mission-critical solutions.
Our industries
CGI offers its end-to-end services to a selected set of economic sectors covering 90% of global IT spend.
Financial services—Helping financial institutions, including most major banks and top insurers, reduce cost, increase efficiency and improve customer service.
Government—Supporting over 2,000 government organizations in reducing costs and improving the efficiency, quality and accountability of public services, all while increasing citizen engagement.
Health—Helping more than 1,000 healthcare facilities, hospitals and departments of health implement solutions for better care, better business and better outcomes.
Telecommunications and utilities—Helping 6 of the top 10 global telecom providers and 9 of the top 10 European utilities deliver new revenue streams and improve productivity and service.
Manufacturing, retail and distribution—Enabling business transformation for more than 2,000 clients by improving efficiency and loyalty, lowering costs and boosting sustainable growth.
Oil and gas—Helping our clients, including 3 of the top 6 oil companies, extract more value from every aspect of their supply chains.
Creating significant shareholder value over time
The strength of our profitability, cash flow and recurrent revenue streams reflect the discipline that allowed us to build a sound and stable enterprise for the long term. Our successful “Build and Buy” profitable growth strategy balances strong organic growth and the successful integration of more than 70 acquisitions. We are committed to creating additional value for our shareholders over time as we continue to adhere to the same fundamentals that have guided us throughout our 36-year history.
Revenue
In billions of dollars
Contract backlog
In billions of dollars
New contract bookings
In billions of dollars
Cash provided by operating activities
In millions of dollars
Number of members at year end
CGI’s 2012 and 2011 financial results are reported under IFRS and the 2010 results are reported under Canadian GAAP.
Corporate social responsibility
Promoting a caring culture
As one of our core values, CSR represents a key aspect of our business model, which is designed to bring us closer to our members, clients, shareholders and communities. We’ve always believed that balancing this equilibrium between our stakeholders is key to our long term sustainability. Last year, we linked all our best practices to a new global policy formalizing our approach and identifying the following commitments:
Provide our professionals with training, health, wellness and ownership programs that positively influence their well-being and satisfaction
Partner with our clients to deliver energy and environmental sustainability solutions and to collectively support charitable causes
Support our communities through causes that improve their social, economic and environmental well-being
Improve the environment through environmentally-friendly operating practices, community service activities and green IT offerings
Continue operating with the highest level of integrity through a strong code of ethics and good corporate governance
Extend our CSR commitments to our supply chain
As a further step, we published a roadmap, which has brought our policy to life by defining objectives and measures to support our commitments. This coming year, we will publish our first global CSR report to present quantitative and qualitative results, identify achievements and list key indicators on which we aim to set our objectives going forward. We look forward to sharing our progress with you, and continuing our journey as a responsible and caring partner.
cgi.com/csr
Creativity to transform and add value
Driving innovation, reducing costs and improving operations are strategic business imperatives. CGI members work alongside our clients locally, while bringing the depth and breadth of our global resources to solve these complex challenges—and more.
CGI offers innovative solutions to gain operating efficiencies, reduce costs and improve competitive advantage. Technology is usually at the heart of every solution—this is where CGI adds value. We believe in finding practical answers not always found in the R&D lab. We operate under an open, collaborative approach that encompasses the entire business process. CGI gathers the best ideas from markets, clients, partners, academia and our members and tests them against real world scenarios to find the right solution. Best of all, we are smart about finding creative ways to make the most of our clients’ current assets—combining them with new technologies and business innovations that make the most business sense.
With a track record of 95% of projects delivered on time and within budget, we align our teams in lockstep with our clients’ business strategies to achieve significant top-to-bottom line results.
These are some representative wins from our $5.2 billion in fiscal 2012 bookings.
Visit cgi.com/newsroom for the full announcements.
CGI awarded US$143 million contract to deliver intelligence support to the U.S. Army Training and Doctrine Command
The UK Department of Health chooses Logica, now part of CGI, for delivery of payroll for its Arms Length Bodies
CGI’s U.S. public sector tax and revenue clients collect more than $2 billion in additional revenues
CGI launches fraud detection service for the insurance industry, solution powered by SAS
CGI’s ERP program honored as “Best Fit Integrator” for 5th year by the Center for Digital Government
ISS and CGI strike Nordic partnership deal
CGI secures IT partnership agreement with Countrywide
RSA renews IT services agreement with CGI for 6 years
Rio Tinto and CGI renew and expand their IT outsourcing contract
CGI selected to build U.S.-wide competitive health insurance exchange
The City of Västerås signs £27 million deal with Logica, now part of CGI, to manage its IT operations
CGI to transition the Nuclear Regulatory Commission’s financial systems to the Momentum Community Cloud
CGI partners with the Centers for Medicare & Medicaid Services to deliver Medicare.gov multi-platform experience for 47 million users
CGI signs new, expanded three-year partnership agreement with Société Générale Corporate & Investment Banking
CGI signs multi-million dollar managed collections agreement with World Omni Financial Corp.
National Bank of Canada and CGI sign new five-year agreement worth $350M
John Hancock selects CGI for data center consolidation and the provision of highly secure on-demand Cloud services
cgi.com/2012-ar/clients
A strong local presence in 400 communities around the world
AMERICAS
ARGENTINA
BRAZIL
CANADA
CHILE
COLOMBIA
PERU
UNITED STATES
VENEZUELA
EUROPE, MIDDLE EAST AND AFRICA
BELGIUM
CZECH REPUBLIC
DENMARK
EGYPT
ESTONIA
FINLAND
FRANCE
GERMANY
HUNGARY
IRELAND
ITALY
LUXEMBOURG
MOROCCO
NETHERLANDS
NORWAY
POLAND
PORTUGAL
SAUDI ARABIA
SLOVAKIA
SPAIN
SWEDEN
SWITZERLAND
UNITED ARAB EMIRATES
UNITED KINGDOM
ASIA PACIFIC
AUSTRALIA
INDIA
MALAYSIA
PHILIPPINES
SINGAPORE
| * | Indicates local CGI office(s) |
Board of directors
Claude Boivin (a)
Director since 1993
Director of Companies
Bernard Bourigeaud (b)
Director since 2008
Director of Companies
Jean Brassard (a)
Director since 1978
Director of Companies
Robert Chevrier (b)
Director since 2003
Chair of the Human Resources Committee, CGI
President, Roche Management Co. Inc.
Dominic D’Alessandro (b)
Director since 2010
Director of Companies
Thomas P. d’Aquino (c)
Director since 2006
Lead Director, CGI
Chief Executive, Intercounsel Ltd
Paule Doré (c)
Director since 1995
Director of Companies
Richard B. Evans (a)
Director since 2009
Director of Companies
Chairman of the Board, Resolute Forest Products
Serge Godin
Director since 1976
Founder and Executive Chairman of the Board, CGI
André Imbeau
Director since 1976
Founder, Executive Vice-Chairman of the Board and Corporate Secretary, CGI
Gilles Labbé (a)
Director since 2010
Chair of the Audit and Risk Management Committee, CGI
President and Chief Executive Officer, Héroux-Devtek Inc.
Eileen A. Mercier (c)
Director since 1996
Chair of the Corporate Governance Committee, CGI
Director of Companies
Donna Morea
Director since 2012
Director of Companies
Michael E. Roach
Director since 2006
President and
Chief Executive Officer, CGI
| (a) | Member of the Audit and Risk Management Committee |
| (b) | Member of the Human Resources Committee |
| (c) | Member of the Corporate Governance Committee |
Leadership team: Corporate Services
Serge Godin
Founder and Executive Chairman of the Board
André Imbeau
Founder, Executive Vice-Chairman of the Board and Corporate Secretary
Michael E. Roach
President and Chief Executive Officer
R. David Anderson
Executive VP and Chief Financial Officer
Jame Cofran
Senior VP and Chief Marketing Officer
Benoit Dubé
Executive VP and Chief Legal Officer
Julie Godin
Executive VP, Human Resources and Strategic Planning
Lorne Gorber
Senior VP, Global Communications and Investor Relations
Eva Maglis
Executive VP,
Global Chief Information Officer
Luc Pinard
Executive VP, Corporate
Performance and Knowledge Management
Daniel Rocheleau
Executive VP and Chief Business Engineering Officer
Claude Séguin
Senior VP, Corporate Development and Strategic Investments
Leadership team: Global Operations
United States
George Schindler
President
Pete Ihrig
US Enterprise Markets
Mark Boyajian
US Mid-Atlantic
Dave Delgado
US West
Robert Farrell
Global Infrastructure Services
Dave Henderson
US Central-South
Christopher James
IP Solutions
Gregg Mossburg
US Northeast
Donna Ryan
President, CGI Federal
Amy Bleken
Defense Agency Programs
Cheryl Campbell
Health & Compliance Programs
Barbara Fast
Army & Defense Intelligence Programs
Tim Hurlebaus
National Security Programs
Tom Kirk
Government Secure Solutions
Toni Townes-Whitley
Civilian Agency Programs
Asia Pacific & Middle East
Colin Holgate
President
S. Chandramouli
India
Michael Shepherd
Australia
Hervé Vincent
Southeast Asia
Canada
Douglas McCuaig
President
Claude Marcoux
Chief Operating Officer
Réjean Bernard
Global Infrastructure Services
Shawn Derby
Western Canada
Michael Godin
National Capital Region
Jamie Holland
IP Solutions
Roy Hudson
Communication Services Business
Bernard Labelle
Québec City
Marie MacDonald
Greater Toronto
Jay MacIsaac
Atlantic Canada
Guy Vigeant
Greater Montreal
Central & Eastern Europe
Serge Dubrana
President
Ron de Mos
Netherlands
Dariusz Gorzen
Poland
Torsten Strass
Germany & Switzerland
Stefan Szabó
Czech Republic & Slovakia
Hans Vets
Belgium
France
Jean-Marc Lazzari
President
Jean-Michel Baticle
Regions
Philippe Bouron
Paris
Mohamed Lakhlifi
Morocco
José Lopez
Business Consulting
Patrick Navarro
I2B
United Kingdom
Timothy Gregory
President
David Fitzpatrick
Global Infrastructure Services
Melba Foggo
Business Consulting
Andrew Marsh
Business Processing Services
Paula Sussex
Public Sector
Steve Thorn
Application Services
Mike Whitchurch
Commercial Sector
Nordics, Southern Europe & South America
João Baptista
President
Gisle Eckhoff
Norway
José Carlos Gonçalves
Southern Europe & Latin America
Björn Ivroth
Sweden
Edson Leite
Brazil
Heikki Nikku
Finland & Estonia
Martin Petersen
Denmark
Shareholder information
Shareholder information listing
IPO: 1986
Toronto Stock Exchange, April 1992: GIB.A
New York Stock Exchange, October 1998: GIB
Number of shares outstanding as of September 30, 2012:
273,771,106 Class A subordinate shares
33,608,159 Class B shares
High/low of share price from October 1, 2011 to September 30, 2012:
TSX (CDN$) NYSE (U.S.$)
High: 27.00 27.71
Low: 17.88 17.01
The certifications by CGI’s Chief Executive Officer and Chief Financial Officer concerning the quality of the Company’s public disclosure pursuant to Canadian regulatory requirements are filed in Canada on SEDAR (sedar.com). Similar certifications pursuant to Rule 13a-14 of the U.S. Securities Exchange Act of 1934 and Section 302 of the Sarbanes-Oxley Act of 2002 are exhibits to our Form 40-F filed on EDGAR (sec.gov). The Company has also filed with the New York Stock Exchange the certification required by Section 303A.12 of the exchange’s Listed Company Manual.
CGI’s corporate governance practices do not differ in any significant way from those required of domestic companies under New York Stock Exchange listing standards and they are set out in the CGI Management Proxy Circular, which is filed with Canadian and U.S. securities authorities and is therefore available on SEDAR and EDGAR, respectively, as well as on CGI’s website (cgi.com).
Auditors
Ernst & Young LLP
Transfer agent
Computershare Trust Company of Canada
100 University Avenue, 9th Floor
Toronto, Ontario M5J 2Y1
Telephone: 1 800 564-6253
www.investorcentre.com/service
Investor relations
For further information about the Company, additional copies of this report or other financial information, please contact:
CGI Group Inc.
Investor relations
Email: ir@cgi.com
Twitter: CGI_IR
Web: cgi.com/investors
1350 René-Lévesque Blvd West
Montréal, Québec H3G 1T4
Canada
Tel.: (514) 841-3200
Annual general meeting of shareholders
Wednesday, January 30, 2013 at 11:00 a.m.
Omni Mont-Royal Hotel
Saisons A & B
1050 Sherbrooke West
Montréal, Québec H3A 2R6
A live webcast of the Annual General Meeting will be available via cgi.com/investors. Complete instructions for viewing the webcast will be available on CGI’s website. To vote by phone or by using the Internet, please refer to the instructions provided in the CGI Management Proxy Circular.
The online version of CGI’s annual report is available at cgi.com/2012-ar
Le rapport annuel 2012 de CGI est aussi publié en français et disponible sur cgi.com/2012-ra.
Our aspiration: To be the best
At CGI, we are connected through a common culture, a disciplined management approach and a network of vast capabilities and expertise. These connections deliver results.
For our clients
A track record of 95% on-time, on-budget delivery fuels high client satisfaction, which has measured consistently greater than 9 out of 10 for the past 10 years.
For our members
With a majority of our members as owners, we foster a performance-based culture that allows members to benefit from their company’s success.
For our shareholders
CGI has a track record of industry-leading margins that demonstrates our ability to run a sound and stable business for the long term, and an average annual return of more than 30% over the last 15 years.
As a global leader, CGI will continue to strive to be the best to satisfy the needs of our clients, offer rewarding careers for our members and provide a superior return over time for our shareholders.
cgi.com
CGI Group Inc.
2012 Annual Report
CGI’s 2012 Annual Report is comprised
of two separate volumes:
Volume 1:Experience the commitment
&
Volume 2:Numbers
Volume 2 of the Annual Report
follows this page.
(this page does not form part of the Annual Report)
2012 annual report
Numbers

MANAGEMENT’S DISCUSSIONAND ANALYSIS
FISCAL YEAR 2012
November 28, 2012
Basis of Presentation
This Management’s Discussion and Analysis of the Financial Position and Results of Operations (“MD&A”) is the responsibility of management and has been reviewed and approved by the Board of Directors. This MD&A has been prepared in accordance with the requirements of the Canadian Securities Administrators. The Board of Directors is ultimately responsible for reviewing and approving the MD&A. The Board of Directors carries out its responsibility mainly through its Audit and Risk Management Committee, which is appointed by the Board of Directors and is comprised entirely of independent and financially literate directors.
Throughout this document, CGI Group Inc. is referred to as “CGI”, “we”, “our” or “Company”. This MD&A provides information management believes is relevant to an assessment and understanding of the consolidated results of operations and financial condition of the Company. This document should be read in conjunction with the audited consolidated financial statements and the notes thereto for the years ended September 30, 2012 and 2011. CGI’s accounting policies are in accordance with International Financials Reporting Standards (“IFRS”) of the International Accounting Standards Board (“IASB”). All dollar amounts are in Canadian dollars unless otherwise indicated.
First Year Reporting under IFRS
The year’s audited consolidated financial statements and this MD&A represent our first fiscal year reporting under IFRS. Under the rules and regulations of the U.S. Securities and Exchange Commission, CGI is classified as a foreign private issuer and is therefore permitted to use IFRS. CGI transitioned from Canadian Generally Accepted Accounting Principles (“Canadian GAAP”) to IFRS on October 1, 2010 and adjusted the financial results of fiscal 2011 to reflect the adoption of IFRS. Note 33 to the audited consolidated financial statements for the year ended September 30, 2012 contains a detailed description of our conversion to IFRS, including a reconciliation of key items from Canadian GAAP to IFRS. Periods prior to October 1, 2010 presented in this MD&A have not been adjusted and are in accordance with Canadian GAAP.
Although the adoption of IFRS resulted in adjustments to our consolidated financial statements, it did not materially impact the underlying cash flows or profitability trends of our operating performance, debt covenants or compensation arrangements.
Materiality of Disclosures
This MD&A includes information we believe is material to investors. We consider something to be material if it results in, or would reasonably be expected to result in, a significant change in the market price or value of our shares, or if it is likely that a reasonable investor would consider the information to be important in making an investment decision.
Forward-Looking Statements
All statements in this MD&A that do not directly and exclusively relate to historical facts constitute “forward-looking statements” within the meaning of that term in Section 27A of the United States Securities Act of 1933, as amended, and Section 21E of the United States Securities Exchange Act of 1934, as amended, and are “forward-looking information” within the meaning of Canadian securities laws. These statements and this information represent CGI’s intentions, plans, expectations and beliefs, and are subject to risks, uncertainties and other factors, of which many are beyond the control of the Company. These factors could cause actual results to differ materially from such forward-looking statements or forward-looking information. These factors include but are not restricted to: the timing and size of new contracts; acquisitions and other corporate developments; the ability to attract and retain qualified members; market competition in the rapidly evolving information technology industry; general economic and business conditions; foreign exchange and other risks identified in the MD&A, in CGI’s Annual Report on Form 40-F filed with the U.S. Securities and Exchange Commission (filed on EDGAR atwww.sec.gov), the Company’s Annual Information Form filed with the Canadian securities authorities (filed on SEDAR atwww.sedar.com), as well as
| CGI Group Inc. – Management’s Discussion and Analysis for the year ended September 30, 2012 | Page 2 of 48 |
assumptions regarding the foregoing. The words “believe,” “estimate,” “expect,” “intend,” “anticipate,” “foresee,” “plan,” and similar expressions and variations thereof, identify certain of such forward-looking statements or forward-looking information, which speak only as of the date on which they are made. In particular, statements relating to future performance are forward-looking statements and forward-looking information. CGI disclaims any intention or obligation to publicly update or revise any forward-looking statements or forward-looking information, whether as a result of new information, future events or otherwise, except as required by applicable law. Readers are cautioned not to place undue reliance on these forward-looking statements or on this forward-looking information. You will find more information about the risks that could cause our actual results to differ significantly from our current expectations in Section 10 – Risk Environment.
Non-GAAP Measures
The reader should note that the Company reports its financial results in accordance with IFRS. However, in this MD&A, certain non-GAAP financial measures are used:
| 1. | Earnings before acquisition-related and integration costs, finance costs, finance income, other income, share of profit on joint venture, and income tax expense (“adjusted EBIT”); |
| 2. | Constant currency growth; |
| 3. | Days Sales Outstanding (“DSO”); |
| 4. | Return on Invested Capital (“ROIC”); |
| 5. | Return on Equity (“ROE”); and |
| 6. | Net Debt to Capitalization ratio. |
Management believes that these non-GAAP measures provide useful information to investors regarding the Company’s financial condition and results of operations as they provide additional measures of its performance. These non-GAAP measures do not have any standardized meaning prescribed by IFRS and are therefore unlikely to be comparable to similar measures presented by other issuers. These measures should be considered as supplemental in nature and not as a substitute for the related financial information prepared in accordance with IFRS.
A reconciliation of adjusted EBIT to its closest IFRS measure can be found on page 20. Definitions of constant currency growth, DSO, ROIC, ROE, and net debt to capitalization are provided on pages 9 and 10. A discussion of DSO, ROIC, ROE and net debt to capitalization can be found on page 27.
Change in Reporting Segments
In 2012, we modified our basis of reporting such that the growth and profitability of the India activities were reallocated from our previously combined U.S. and India segment to each reporting segment, namely: Global Infrastructure Services (“GIS”), Canada, U.S., and Europe & Asia Pacific. This view reflects each segment’s utilization of our delivery centres in India; the segmented results for the year and three months ended September 30, 2011 were therefore retrospectively revised. In Q4 2012, our acquisition of Logica plc (“Logica”) became effective six weeks before our fiscal year-end. As at September 30, 2012, the operations of Logica were managed and reviewed as one component and is therefore being presented as its own operating segment. As a result of changes in the management reporting structure effective October 1, 2012, the Company will change its operating segments beginning in the first quarter of 2013 as follows: Canada; United States of America; Nordics, Southern Europe and South America; Central and Eastern Europe (including Netherlands, Germany and Belgium); United Kingdom; Asia Pacific (including Australia, India, Philippines and the Middle East); and France (including Luxembourg and Morocco). For more details on how our operations are managed, please refer to Note 27 of the audited consolidated financial statements.
| CGI Group Inc. – Management’s Discussion and Analysis for the year ended September 30, 2012 | Page 3 of 48 |
MD&A Objectives and Contents
| • | Provide a narrative explanation of the audited consolidated financial statements through the eyes of management; |
| • | Provide the context within which the audited consolidated financial statements should be analyzed, by giving enhanced disclosure about the dynamics and trends of the Company’s business; and |
| • | Provide information to assist the reader in ascertaining the likelihood that past performance is indicative of future performance. |
In order to achieve these objectives, this MD&A is presented in the following main sections:
Section | Contents | Pages | ||||||||
| 1. | Corporate Overview | This includes a description of our business and how we generate revenue as well as the markets in which we operate.
| ||||||||
| 1.1. | About CGI | 6 | ||||||||
| 1.2. | Vision and Strategy | 7 | ||||||||
| 1.3. | Competitive Environment | 7 | ||||||||
| 2. | Highlights and Key Performance Measures | A summary of key achievements during the quarter, the past three years’ key performance measures, and CGI’s share performance.
| ||||||||
| 2.1. | Fiscal 2012 Highlights | 8 | ||||||||
| 2.2. | Key Performance Measures Defined | 9 | ||||||||
| 2.3. | Selected Yearly Information & Key Performance Measures | 10 | ||||||||
| 2.4. | Stock Performance | 11 | ||||||||
| 3. | Financial Review | A discussion of year-over-year changes to operating results for the years ended September 30, 2012 and 2011, describing the factors affecting revenue and earnings on a consolidated and reportable segment basis, and also by describing the factors affecting changes in the major expense categories. Also discussed are bookings broken down by geography, vertical market, contract and service type. | ||||||||
| 3.1. | Bookings and Book-to-Bill Ratio | 12 | ||||||||
| 3.2. | Foreign Exchange | 13 | ||||||||
| 3.3. | Revenue Distribution | 14 | ||||||||
| 3.4. | Revenue Variation and Revenue by Segment | 15 | ||||||||
| 3.5. | Operating Expenses | 17 | ||||||||
| 3.6. | Adjusted EBIT by Segment | 18 | ||||||||
| 3.7. | Earnings before Income Taxes | 20 | ||||||||
| 3.8. | Net Earnings and Earnings Per Share (“EPS”) | 21 | ||||||||
| CGI Group Inc. – Management’s Discussion and Analysis for the year ended September 30, 2012 | Page 4 of 48 |
Section | Contents | Pages | ||||||||
| 4. | Liquidity | This includes a discussion of changes in cash flows from operating, investing and financing activities. This section also describes the Company’s available capital resources, financial instruments, and off-balance sheet financing and guarantees. Measures of liquidity (days sales outstanding) and capital structure (return on equity, net debt to capitalization, and return on invested capital) are analyzed on a year-over- year basis. | ||||||||
| 4.1. | Consolidated Statements of Cash Flows | 23 | ||||||||
| 4.2. | Capital Resources | 24 | ||||||||
| 4.3. | Contractual Obligations | 25 | ||||||||
| 4.4. | Financial Instruments and Hedging Transactions | 25 | ||||||||
| 4.5. | Selected Measures of Liquidity and Capital Resources | 27 | ||||||||
| 4.6. | Off-Balance Sheet Financing and Guarantees | 27 | ||||||||
| 4.7. | Capability to Deliver Results | 28 | ||||||||
| 5. | Fourth Quarter Results | A discussion of year-over-year changes to operating results for the three months ended September 30, 2012 and 2011, describing the factors affecting revenue and earnings on a consolidated and reportable segment basis.
| ||||||||
| 5.1 | Revenue Variation and Revenue by Segment | 29 | ||||||||
| 5.2 | Adjusted EBIT by Segment | 32 | ||||||||
| 5.3 | Net Earnings and Earnings per Share | 33 | ||||||||
| 6. | Eight Quarter Summary | A summary of the past eight quarters’ key performance measures and a discussion of the factors that could impact our quarterly results. | 35 | |||||||
| 7. | Changes in Accounting Policies | A summary of current accounting standards in effect and future accounting standards to be adopted.
| ||||||||
| 7.1 | Adoption of IFRS | 36 | ||||||||
| 7.2 | Future Accounting Standard Changes | 36 | ||||||||
| 8. | Critical Accounting Estimates | A discussion of the estimates and judgements made in the preparation of the consolidated financial statements. | 37 | |||||||
| 9. | Integrity of Disclosure | A discussion of the existence of appropriate information systems, procedures and controls to ensure that information used internally and disclosed externally is complete and reliable. | 40 | |||||||
| 10. | Risk Environment | A discussion of the risks affecting our business activities and what may be the impact if these risks are realized.
| ||||||||
| 10.1 | Risks and Uncertainties | 41 | ||||||||
| 10.2 | Legal Proceedings | 48 | ||||||||
| CGI Group Inc. – Management’s Discussion and Analysis for the year ended September 30, 2012 | Page 5 of 48 |
| 1. | Corporate Overview |
| 1.1. | ABOUT CGI |
Founded in 1976 and headquartered in Montreal, Canada, CGI is one of the largest independent providers of end-to-end information technology services (“IT services”) and business process services (“BPS”) to clients worldwide. CGI has approximately 72,000 members across the globe. The Company’s proximity model provides for work to be delivered onsite at clients’ premises, on-shore, near-shore or through one of its global offshore delivery centres. We also have a number of leading business solutions that support long-term client relationships. Our services are broken down as:
| • | Consulting – CGI provides a full range of IT and management consulting services, including business transformation, IT strategic planning, business process engineering and systems architecture. |
| • | Systems integration – CGI integrates and customizes leading technologies and software applications to create IT systems that respond to clients’ strategic needs. |
| • | Management of IT and business functions (“outsourcing”) – Clients delegate entire or partial responsibility for their IT or business functions to CGI to achieve significant savings and access the best suited technology, while retaining control over strategic IT and business functions. As part of such agreements, we implement our quality processes and practices to improve the efficiency of the clients’ operations. We also integrate clients’ operations into our technology network. Finally, we may take on specialized professionals from our clients, enabling our clients to focus on key operations. Services provided as part of an outsourcing contract may include development and integration of new projects and applications; applications maintenance and support; technology infrastructure management (enterprise and end-user computing and network services); transaction and business processing such as payroll, insurance processing, and document management services. Outsourcing contracts typically have terms from five to ten years. |
CGI offers its end-to-end services to a focused set of industry vertical markets where we have developed extensive and deep subject matter expertise. This allows us to fully understand our clients’ business realities and to have the knowledge and solutions needed to advance their business goals. Our targeted vertical markets include government, financial services, manufacturing, retail & distribution (“MRD”), telecommunications & utilities, and health.
CGI has a wide range of proprietary business solutions which help shape opportunities and drive value for our clients and shareholders. Examples of these include Enterprise Resource Planning solutions, energy management, credit and debt collections, tax management, claims auditing and fraud detection.
We take great pride in delivering high quality services to our clients. To do so consistently, we have implemented and continue to maintain the International Organization for Standardization (“ISO”) quality program. By designing and implementing rigorous service delivery and quality standards, followed by monitoring and measurement, we are better able to satisfy our clients’ needs. As a measure of the scope of our ISO 9001 program, all of the legacy CGI’s business units continue to be certified and we will initiate the work on improving Logica’s processes and applying for the same certification.
| CGI Group Inc. – Management’s Discussion and Analysis for the year ended September 30, 2012 | Page 6 of 48 |
| 1.2. | VISION AND STRATEGY |
At CGI, we derive our business vision from our dream which is to create an environment in which members enjoy working together and, as owners, contribute to building a company we can be proud of. That dream led to CGI’s vision of being a world-class IT and BPS leader, helping its clients win and grow. Our build and buy strategy is refined through a four-pillar growth strategy that combines organic growth and acquisitions.
The first two pillars of our strategy focus on organic growth. The first pillar focuses on smaller contract wins, renewals and extensions. The second involves the pursuit of new large, long-term outsourcing contracts, leveraging our end-to-end services, global delivery model and critical mass.
The third pillar of our growth strategy focuses on the acquisition of smaller firms or niche players. We identify niche acquisitions through a strategic mapping program that systematically searches for targets that will strengthen our vertical market knowledge or increase the richness of our service offerings.
The fourth pillar involves the pursuit of transformational acquisitions focused on expanding our geographic presence and critical mass. This approach further enables us to strengthen our qualifications to compete for large outsourcing contracts. CGI continues to be a consolidator in the IT services industry.
Throughout its history, CGI has been highly disciplined in following this four-pillar growth strategy, with an emphasis on earnings accretion and maximizing shareholder value.
| 1.3. | COMPETITIVE ENVIRONMENT |
As a global provider of end-to-end information technology and business process services, CGI operates in a highly competitive and rapidly evolving global industry. Our competition comprises a variety of global players, from niche companies providing specialized services to other end-to-end service providers, mainly in the U.S., Europe and India, all of whom are competing to deliver some or all of the services we provide.
Recent mergers and acquisition activity has resulted in CGI being positioned as one of the few remaining IT services firms that operates independently of any hardware or software vendor. This independence allows CGI to deliver the best-suited technology available globally to our clients.
CGI offers its end-to-end services to a select set of targeted vertical markets in which we have deep business and technical expertise covering 90% of global IT spend. To compete effectively, CGI focuses on high-end systems integration, consulting and outsourcing where vertical market industry knowledge and expertise are required.
Our client proximity metro markets business model combined with our global delivery model results in highly responsive and cost competitive delivery. CGI’s global delivery model provides clients with a unique blend of onshore, nearshore and offshore delivery options that caters to their strategic and cost requirements. CGI also has a number of leading business solutions that support long-term client relationships. Moreover, all of CGI’s business operations are executed based on the same management foundation, ensuring consistency and cohesion across the Company.
There are many factors involved in winning and retaining IT and BPS contracts, including the following: total cost of services; ability to deliver; track record; vertical market expertise; investment in business solutions; local presence; global delivery capability; and the strength of client relationships. CGI compares favourably with its competition with respect to all of these factors.
In summary, CGI’s competitive value proposition encompasses the following: end-to-end IT and BPS capability; expertise and proprietary business solutions in five vertical markets covering the majority of global IT spending; a unique global delivery model, which includes industry leading delivery capabilities; a disciplined management foundation; and our focus on client satisfaction which is supported by our client proximity business model. Based on this value proposition and CGI’s growing critical mass in our target markets which collectively cover approximately 84% of global IT spending – we are in a position to compete effectively on an international scale and win large contracts.
| CGI Group Inc. – Management’s Discussion and Analysis for the year ended September 30, 2012 | Page 7 of 48 |
| 2. | Highlights and Key Performance Measures |
| 2.1. | FISCAL 2012 HIGHLIGHTS |
| • | Revenue of $4.8 billion, increase of 12.1% year-over-year on a constant currency basis; |
| • | Bookings of $5.2 billion resulting in a book-to-bill ratio of 109%; |
| • | Backlog of $17.6 billion; |
| • | Strong underlying profitability delivered across legacy CGI operations; |
| • | Accelerating profitable growth and bookings in U.S. operations; and |
| • | Cash from operations of $613.3 million, or $2.24 per share. |
| 2.1.1. | Acquisition of Logica plc |
On August 20, 2012, CGI completed its acquisition of Logica for $1.63 (105 pence) per ordinary share equivalent to a total purchase price of $2.7 billion plus the assumption of Logica’s net debt of $0.9 billion. The cash acquisition of all the outstanding ordinary shares of Logica was effected by means of a Court-sanctioned scheme of arrangement in the United Kingdom. Our results for the year incorporate the operations of Logica subsequent to August 20, 2012.
Logica is a business and technology services company, employing 41,000 people. It provides business consulting, systems integration and outsourcing services to clients around the world, including many of Europe’s largest businesses.
The acquisition was funded through a combination of:
| • | The issuance of 46.7 million Class A shares in CGI for a consideration of $1.0 billion from the Caisse de dépôt et placement du Québec (“CDPQ”); |
| • | Additional debt funding through a term loan of $1.9 billion from a syndicate of international financial institutions; and |
| • | The remaining financing requirements of $0.8 billion were drawn from CGI’s existing credit facility and cash. |
Based on the impact of the issuance of the new debt and equity and the realization of some of the planned synergies, the transaction is expected to be accretive in the range of 25% to 30% in the first 12 months to CGI’s earnings per share excluding acquisition-related and integration costs. As the Company continues to realize an approximate amount of $300 million of annual business synergies over the next three years at an approximate cost of $400 million, we expect the accretion level of EPS to increase.
The combined company has approximately 72,000 members in more than 40 countries and pro-forma revenue of $10.4 billion, offering clients across the world the best mix of business and technology expertise as well as an unmatched combination of local and global delivery options. In addition to operational breadth and depth, the combined business has critical mass and blue chip client relationships. CGI incurred $0.3 billion in acquisition-related and integration costs over the last half of fiscal 2012.
| 2.1.2. | Credit Facility and Debt Private Placement |
On December 7, 2011, the Company renewed its unsecured revolving credit facility of $1.5 billion for an additional five years, through December 2016. The facility, which can be extended annually, includes an accordion feature providing for an additional $750.0 million, bringing the facility’s potential capacity to $2.25 billion. In addition, during the first quarter of fiscal 2012, the Company received the proceeds of the US$475.0 million debt private placement financing with U.S. institutional investors.
| CGI Group Inc. – Management’s Discussion and Analysis for the year ended September 30, 2012 | Page 8 of 48 |
| 2.2. | KEY PERFORMANCE MEASURES DEFINED |
We use a combination of financial measures, ratios, and non-GAAP measures to assess our Company’s performance. The table below summarizes our most relevant key performance measures. The calculated results and the discussion of each indicator follow in the subsequent sections.
| Profitability | • | Adjusted EBIT – is a measure of earnings before items not directly related to the cost of operations, such as financing costs, acquisition-related and integration costs and income taxes (see definition on page 3). Management believes this best reflects the profitability of our operations. | ||
| • | Diluted earnings per share – is a measure of earnings generated for shareholders on a per share basis, assuming all dilutive elements are exercised. | |||
| Liquidity | • | Cash provided by operating activities – is a measure of cash generated from managing our day-to-day business operations. We believe strong operating cash flow is indicative of financial flexibility, allowing us to execute our corporate strategy. | ||
| • | Days sales outstanding – is the average number of days to convert our trade receivables and work in progress into cash. Management tracks this metric closely to ensure timely collection, healthy liquidity, and is committed to a DSO target of 45 days. | |||
| Growth | • | Constant currency growth – is a measure of revenue growth before foreign currency impacts. This growth is calculated by translating current period results in local currency using the conversion rates in the equivalent period from the prior year. We believe that it is helpful to adjust revenue to exclude the impact of currency fluctuations to facilitate period-to-period comparisons of business performance. | ||
| • | Backlog – represents management’s best estimate of revenue to be realized in the future based on the terms of respective client agreements in effect at a point in time. | |||
| • | Book-to-Bill ratio – is a measure of the proportion of the value of our contract wins to our revenue in the period. This metric allows management to monitor the Company’s business development efforts to ensure we grow our backlog and our business over time. Management remains committed to maintaining a target ratio greater than 100% over a 12-month period. Management believes that the longer period is a more effective measure as the size and timing of bookings could cause this measurement to fluctuate significantly if taken for only a three-month period. | |||
| Capital Structure | • | Net Debt to Capitalization ratio – is a measure of our level of financial leverage net of our cash and cash equivalents, short-term investments and marketable long-term investments. Management uses this metric to monitor the proportion of debt versus capital used to finance our operations and it provides insight into our financial strength. | ||
| • | Return on Equity – is a measure of the rate of return on the ownership interest of our shareholders. Management looks at ROE to measure its efficiency at generating profits for the Company’s shareholders and how well the Company uses the invested funds to generate earnings growth. | |||
| • | Return on Invested Capital – is a measure of the Company’s efficiency at allocating the capital under its control to profitable investments. Management examines this ratio to assess how well it is using its money to generate returns. | |||
| CGI Group Inc. – Management’s Discussion and Analysis for the year ended September 30, 2012 | Page 9 of 48 |
| 2.3. | SELECTED YEARLY INFORMATION & KEY PERFORMANCE MEASURES |
| As at and for the years ended September 30, | 2012 | 2011 | Change | 2010 | ||||||||||||
(in thousands of dollars unless otherwise noted) | IFRS | IFRS | 2012 / 2011 | CDN GAAP | ||||||||||||
Growth | ||||||||||||||||
Backlog(in millions of dollars)1 | 17,647 | 13,398 | 4,249 | 13,320 | ||||||||||||
Bookings(in millions of dollars) | 5,180 | 4,875 | 305 | 4,643 | ||||||||||||
Book-to-bill ratio | 109 | % | 115 | % | (6 | %) | 124 | % | ||||||||
Revenue | 4,772,454 | 4,223,942 | 548,512 | 3,732,117 | ||||||||||||
Year-over-year growth2 | 13.0 | % | 15.8 | % | (2.8 | %) | (2.4 | %) | ||||||||
Constant currency growth2 | 12.1 | % | 18.9 | % | (6.8 | %) | 3.4 | % | ||||||||
Profitability | ||||||||||||||||
Adjusted EBIT3 | 546,729 | 536,347 | 10,382 | 511,902 | ||||||||||||
Adjusted EBIT margin | 11.5 | % | 12.7 | % | (1.2 | %) | 13.7 | % | ||||||||
Net earnings | 131,529 | 438,139 | (306,610 | ) | 362,766 | |||||||||||
Net earnings margin | 2.8 | % | 10.4 | % | (7.6 | %) | 9.7 | % | ||||||||
Basic EPS(in dollars) | 0.50 | 1.65 | (1.15 | ) | 1.27 | |||||||||||
Diluted EPS(in dollars) | 0.48 | 1.59 | (1.11 | ) | 1.24 | |||||||||||
Liquidity | ||||||||||||||||
Cash provided by operating activities | 613,262 | 570,002 | 43,260 | 552,367 | ||||||||||||
As a percentage of revenue | 12.9 | % | 13.5 | % | (0.6 | %) | 14.8 | % | ||||||||
Days sales outstanding4 | 70 | 53 | 17 | 47 | ||||||||||||
Capital structure | ||||||||||||||||
Net debt to capitalization ratio5 | 46.6 | % | 27.4 | % | 19.2 | % | 30.6 | % | ||||||||
Net debt | 3,105,313 | 918,968 | 2,186,345 | 1,010,816 | ||||||||||||
Return on equity6 | 5.0 | % | 19.6 | % | (14.6 | %) | 16.4 | % | ||||||||
Return on invested capital7 | 11.4 | % | 13.7 | % | (2.3 | %) | 16.3 | % | ||||||||
Balance sheet | ||||||||||||||||
Cash and cash equivalents, bank overdraft and short-term investments | 127,562 | 70,839 | 56,723 | 141,020 | ||||||||||||
Total assets | 10,453,442 | 4,657,354 | 5,796,088 | 4,607,191 | ||||||||||||
Long-term financial liabilities8 | 4,124,342 | 238,151 | 3,886,191 | 1,159,198 | ||||||||||||
| 1 | Backlog includes new contract wins, extensions and renewals (“bookings”), partially offset by the backlog consumed during the quarter as a result of client work performed and adjustments related to the volume, cancellation and/or the impact of foreign currencies to our existing contracts. Backlog incorporates estimates from management that are subject to change. Fiscal 2012 backlog includes the backlog from Logica. The bookings and book-to-bill ratio include the results of Logica for the period from August 20, 2012. |
| 2 | Constant currency growth is adjusted to remove the impact of foreign currency exchange rate fluctuations. Please refer to page 15 for details. The reader should note that both the year-over-year and constant currency growth rates for fiscal 2011 have not been restated as fiscal 2010 numbers under IFRS are not available. |
| 3 | Adjusted EBIT is a non-GAAP measure for which we provide the reconciliation to its closest IFRS measure on page 20. |
| 4 | Days sales outstanding are obtained by subtracting deferred revenue from trade accounts receivable and work in progress; the result is divided by the quarter’s revenue over 90 days. |
| 5 | The net debt to capitalization ratio represents the proportion of debt net of cash and cash equivalents, short-term and marketable long-term investments (“net debt”) over the sum of shareholders’ equity and debt. Net debt and capitalization are both net of the fair value of forward contracts. |
| 6 | The return on equity ratio is calculated as the proportion of earnings for the last 12 months over the last four quarters’ average equity. |
| 7 | The return on invested capital ratio represents the proportion of the after-tax adjusted EBIT for the last 12 months, over the last four quarters’ average invested capital, which is defined as the sum of equity and debt, less cash and cash equivalents, short-term and marketable long-term investments, net of the impact of the fair value of forward contracts. |
| 8 | Long-term financial liabilities include the long-term portion of debt, long-term provisions, retirement benefits obligations and other long-term liabilities. |
| CGI Group Inc. – Management’s Discussion and Analysis for the year ended September 30, 2012 | Page 10 of 48 |
| 2.4. | STOCK PERFORMANCE |
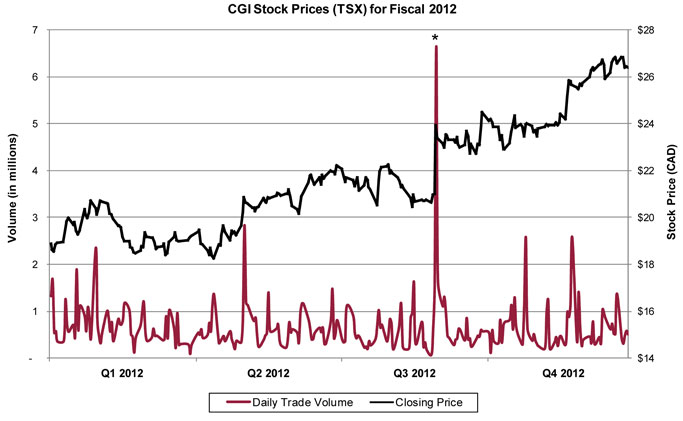
| * | May 31, 2012 – Logica acquisition announcement date; 6.7 million shares were traded on the TSX. |
| 2.4.1. | Fiscal 2012 Trading Summary |
CGI’s shares are listed on the Toronto Stock Exchange (“TSX”) (stock quote – GIB.A) and the New York Stock Exchange (“NYSE”) (stock quote – GIB) and are included in the S&P/TSX Composite Index, the S&P/TSX Capped Information Technology and Midcap Indices, and the Dow Jones Sustainability Index.
| TSX | (CDN$) | |||
Open: | 19.50 | |||
High: | 27.00 | |||
Low: | 17.88 | |||
Close: | 26.40 | |||
CDN average daily trading volumes: | 1,013,111 | |||
Includes the average daily volumes of both the TSX and alternative trading systems.
| NYSE | (US$) | |||
Open: | 18.56 | |||
High: | 27.71 | |||
Low: | 17.01 | |||
Close: | 26.86 | |||
U.S. average daily trading volumes: | 186,414 | |||
| 2.4.2. | Share Repurchase Program |
On February 1, 2012, the Company’s Board of Directors authorized and subsequently received the approval from the TSX for the renewal of the Normal Course Issuer Bid (“NCIB”) to purchase up to 10% of the public float of the Company’s Class A subordinate shares over the next 12 months. The NCIB enables CGI to purchase, on the open market, up to 22,064,163 Class A subordinate shares for cancellation. The Class A subordinate shares may be purchased under the NCIB commencing February 9, 2012 and ending on the earlier of February 8, 2013, or the date on which the Company has either acquired the maximum number of Class A subordinate shares allowable under the NCIB, or elects to terminate the NCIB.
| CGI Group Inc. – Management’s Discussion and Analysis for the year ended September 30, 2012 | Page 11 of 48 |
During fiscal 2012, the Company repurchased 5,368,000 of its Class A subordinate shares for $102.8 million at an average price of $19.16 under the previous and current programs. As at September 30, 2012, the Company may purchase up to an additional 21.0 million shares under the current NCIB.
| 2.4.3. | Capital Stock and Options Outstanding (as at November 23, 2012) |
273,976,033 Class A subordinate shares
33,608,159 Class B shares
18,578,393 options to purchase Class A subordinate shares
| 3. | Financial Review |
| 3.1. | BOOKINGS AND BOOK-TO-BILL RATIO |
The Company achieved a book-to-bill ratio of 109% for the year, while bookings for the fiscal year were $5.2 billion. The breakdown of the $5.2 billion in bookings signed during the year is as follows:
Information regarding our bookings is a key indicator of the volume of our business over time. However, due to the timing and transition period associated with outsourcing contracts, the realization of revenue related to these bookings may fluctuate from period to period. The values initially booked may change over time due to their variable attributes, including demand-driven usage, modifications in the scope of work to be performed caused by changes in client requirements as
| CGI Group Inc. – Management’s Discussion and Analysis for the year ended September 30, 2012 | Page 12 of 48 |
well as termination clauses at the option of the client. As such, information regarding our bookings is not comparable to, nor should it be substituted for an analysis of our revenue; it is instead a key indicator of our future revenue used by the Company’s management to measure growth.
| 3.2. | FOREIGN EXCHANGE |
The Company operates globally and is exposed to changes in foreign currency rates. We report all dollar amounts in Canadian dollars. Accordingly, we value assets, liabilities and transactions that are measured in foreign currencies using various exchange rates as prescribed by IFRS.
Closing foreign exchange rates
As at September 30, | 2012 | 2011 | Change | |||||||||
U.S. dollar | 0.9837 | 1.0389 | (5.3 | %) | ||||||||
Euro | 1.2646 | 1.3971 | (9.5 | %) | ||||||||
Indian rupee | 0.0186 | 0.0212 | (12.3 | %) | ||||||||
British pound | 1.5869 | 1.6231 | (2.2 | %) | ||||||||
Average foreign exchange rates
For the years ended September 30, | 2012 | 2011 | Change | |||||||||
U.S. dollar | 1.0074 | 0.9866 | 2.1 | % | ||||||||
Euro | 1.3077 | 1.3759 | (5.0 | %) | ||||||||
Indian rupee | 0.0192 | 0.0219 | (12.3 | %) | ||||||||
British pound | 1.5878 | 1.5845 | 0.2 | % | ||||||||
| CGI Group Inc. – Management’s Discussion and Analysis for the year ended September 30, 2012 | Page 13 of 48 |
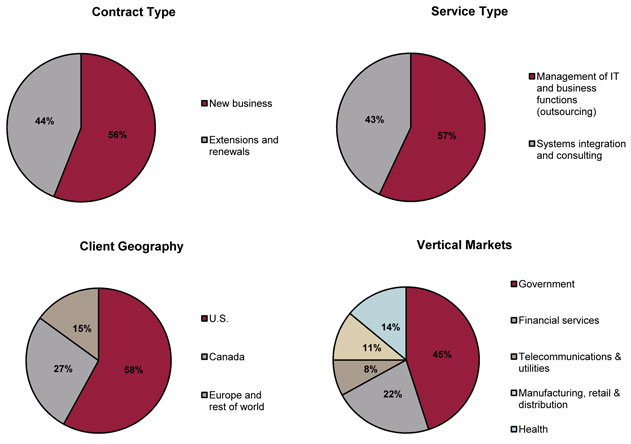
| 3.3. | REVENUE DISTRIBUTION |
The following charts provide additional information regarding our revenue mix for the year:
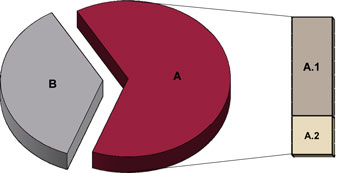 | Service Type
A. ��Management of IT and business functions (outsourcing) – 64%
1. IT services – 46%
2. Business process services – 18%
B. Systems integration and consulting – 36% | |
|
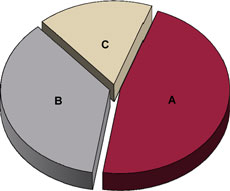
Client Geography
Based on client’s domicile
A. U.S. – 47%
B. Canada – 36%
C. Europe and rest of the world – 17% | |
|
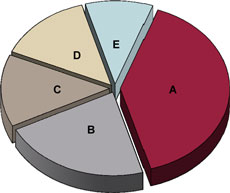
Vertical Markets
A. Government – 40%
B. Financial services – 22%
C. Telecommunications and utilities – 14%
D. Manufacturing, retail and distribution – 14%
E. Health – 10% |
| 3.3.1. | Client Concentration |
IFRS guidance on Segment Disclosures defines a single customer as a group of entities that are known to the reporting enterprise to be under common control. The Company considers the federal government, the provincial or territorial government, the local government, or a foreign government each to be a single customer. Our work for the U.S. federal government including its various agencies represented 28.0% of our revenue for fiscal 2012 as compared to 29.2% in fiscal 2011.
| CGI Group Inc. – Management’s Discussion and Analysis for the year ended September 30, 2012 | Page 14 of 48 |
| 3.4. | REVENUE VARIATION AND REVENUE BY SEGMENT |
Our operations are managed in four operating segments based on our delivery model incorporating domestic activities as well as services from utilizing our unique global delivery model. The GIS segment incorporates all services we provide to our clients globally for the management of their technology infrastructure. The other segments are based on our geographic delivery model: United States (“U.S.”), Europe & Asia Pacific (“Europe”), and Canada which include their respective utilization of our delivery centres in India. For the year ended September 30, 2012, we added another segment – Logica, which incorporates the results of the acquired company as of August 20, 2012.
The following table provides a summary of our revenue variation, in total and by segment, separately showing the impacts of foreign currency exchange rate variations between the fiscal 2012 and 2011 periods. The fiscal 2011 revenue by segment was recorded reflecting the actual foreign exchange rates for that period. The foreign exchange impact is the difference between the current period’s actual results and the current period’s results converted with the prior year’s foreign exchange rates.
For the years ended September 30, (in thousands of dollars except for percentage) | 2012 | 2011 | Change | |||||||||
Total CGI revenue | 4,772,454 | 4,223,942 | 13.0 | % | ||||||||
Variation prior to foreign currency impact | 12.1 | % | ||||||||||
Foreign currency impact | 0.9 | % | ||||||||||
Variation over previous period | 13.0 | % | ||||||||||
U.S. | ||||||||||||
Revenue prior to foreign currency impact | 2,044,878 | 1,896,002 | 7.9 | % | ||||||||
Foreign currency impact | 46,234 | |||||||||||
U.S. revenue | 2,091,112 | 1,896,002 | 10.3 | % | ||||||||
Canada | ||||||||||||
Revenue prior to foreign currency impact | 1,212,791 | 1,287,056 | (5.8 | %) | ||||||||
Foreign currency impact | (176 | ) | ||||||||||
Canada revenue | 1,212,615 | 1,287,056 | (5.8 | %) | ||||||||
Global Infrastructure Services | ||||||||||||
Revenue prior to foreign currency impact | 683,018 | 816,663 | (16.4 | %) | ||||||||
Foreign currency impact | 1,852 | |||||||||||
Global Infrastructure Services revenue | 684,870 | 816,663 | (16.1 | %) | ||||||||
Europe | ||||||||||||
Revenue prior to foreign currency impact | 224,080 | 224,221 | (0.1 | %) | ||||||||
Foreign currency impact | (8,098 | ) | ||||||||||
Europe revenue | 215,982 | 224,221 | (3.7 | %) | ||||||||
Logica | ||||||||||||
Revenue prior to foreign currency impact | 567,875 | — | N/A | |||||||||
Foreign currency impact | N/A | |||||||||||
Logica revenue | 567,875 | — | N/A | |||||||||
We ended fiscal 2012 with revenue of $4,772.5 million, an increase of $548.5 million or 13.0% over fiscal 2011. On a constant currency basis, revenue increased by 12.1%, while foreign currency rate fluctuations favourably impacted our revenue by $39.8 million or 0.9%. On a constant currency basis, our MRD vertical grew the most at 32.3%, followed by our healthcare vertical at 24.2% and telecommunications & utilities at 21.5%.
| CGI Group Inc. – Management’s Discussion and Analysis for the year ended September 30, 2012 | Page 15 of 48 |
Our U.S. segment posted the strongest growth year-over-year, representing 7.9% on a constant currency basis, coming primarily from the health and government vertical markets. This strong U.S. performance was partly offset by the expiry of an outsourcing contract in the financial services vertical within GIS, the non-renewal of a low margin contract in the government vertical market within the Canadian segment, and the sale of Conseillers en informatique d’affaires CIA Inc. (“CIA”), also within Canada. Excluding these items, our revenue would have grown by 18.2% or 17.2% on a constant currency basis.
Fiscal 2012 was notably marked by the acquisition of Logica completed on August 20, 2012. Separated into a standalone segment for reporting purposes, Logica’s results subsequent to the acquisition date represented $567.9 million, representing 13.4% to the total Company growth.
| 3.4.1. | U.S. |
Revenue in our U.S. segment was $2,091.1 million in fiscal 2012, an increase of $195.1 million or 10.3% from $1,896.0 million in fiscal 2011. When removing the favourable foreign exchange impact of $46.2 million, revenue grew $148.9 million or 7.9% year-over-year. The increase in revenue was primarily due to additional work from new contracts as well as due to the extended scope of existing engagements in the government and health vertical markets.
| 3.4.2. | Canada |
Revenue in our Canada segment for fiscal 2012 was $1,212.6 million, a decrease of $74.4 million or 5.8% compared to fiscal 2011. The decrease was mainly due to the run off of client projects as they were delivered, primarily in the health and government vertical markets. We also encountered delays in contract awards and the ramping up of new projects. In addition, the actions taken effective the third quarter of last year with the expiration of a government contract not meeting our profitability standards and the disposal of our interest in Conseillers en informatique d’affaires CIA Inc. (“CIA”), as previously disclosed, also contributed to the year-over-year revenue decline. These last two items alone had a year-over-year impact of $44.4 million. Excluding these two items, the revenue would have decreased by 2.4% on a constant currency basis.
| 3.4.3. | Global Infrastructure Services |
Revenue in our Global Infrastructure Services segment was $684.9 million, a decrease of $131.8 million or 16.1% compared to fiscal 2011. Foreign currency fluctuations had an insignificant impact for the year. As disclosed earlier in fiscal 2012, the expiry of a large outsourcing contract in the financial services vertical market, representing $140.9 million of the year-over-year variation, was the primary cause of the decrease. When excluding this impact, revenue would have increased by 1.1% on a constant currency basis.
| 3.4.4. | Europe |
Revenue in the Europe segment was $216.0 million for fiscal 2012. On a constant currency basis, revenue remained stable. Taking into account the effect of foreign currency, revenue decreased $8.2 million or 3.7% from the $224.2 million reported in prior year. Lower consulting and project work in the telecommunications and utilities vertical, primarily resulting from cautious investing behaviours in the European market, was offset by the ramp-up of work volumes with new and existing clients across all other vertical markets.
| CGI Group Inc. – Management’s Discussion and Analysis for the year ended September 30, 2012 | Page 16 of 48 |
| 3.4.5. | Logica |
The acquisition of Logica occurred during the peak vacation period in Europe where a significant number of the members as well as their clients were on leave. As a significant portion of Logica’s revenue is recognized on a time and material basis, the resulting revenue for this period was not reflective of business-as-usual.
Revenue generated by Logica operations for the six-week period subsequent to the acquisition date represented $567.9 million or 11.9% of total Company revenue for the year. During this period, Logica’s revenue consisted of 14.1% from financial services, 29.4% from government, 2.8% from healthcare, 29.9% from MRD, and 23.8% from telecommunications & utilities.
| 3.5. | OPERATING EXPENSES |
| % of | % of | Change | ||||||||||||||||||||||
(in thousands of dollars except for percentage) | 2012 | Revenue | 2011 | Revenue | $ | % | ||||||||||||||||||
Costs of services, selling and administrative | 4,226,859 | 88.6 | % | 3,690,960 | 87.4 | % | 535,899 | 14.5 | % | |||||||||||||||
Foreign exchange gain | (1,134 | ) | (0.0 | %) | (3,365 | ) | (0.1 | %) | 2,231 | (66.3 | %) | |||||||||||||
| 3.5.1. | Costs of Services, Selling and Administrative |
When compared to fiscal 2011, costs of services, selling and administrative expenses increased by $535.9 million. The translation of the results of our foreign operations from their local currencies to the Canadian dollar unfavourably impacted costs by $35.6 million, partially offsetting the favourable translation impact of $39.8 million on revenue. The increase in cost of services is caused by the inclusion of Logica’s results for the six-week period. Without considering the Logica results, cost of services as a percentage of revenue would have decreased year-over-year from 87.4% to 86.5%. This improvement mainly stemmed from the benefits of the Performance Improvement Plan kicked off in the fourth quarter of 2011.
As a percentage of revenue, costs of services, selling and administrative increased from 87.4% in 2011 to 88.6% in 2012. The increase in costs as a percentage of revenue was due to the inclusion of Logica’s results for the six-week period. Our integration plan will implement CGI’s business model into Logica which will help increase Logica’s margins in the future periods.
| 3.5.2. | Foreign Exchange Loss (Gain) |
This line item includes the realized and unrealized foreign exchange impact on our earnings. The Company, in addition to its natural hedges, has a strategy in place to manage its exposure, to the extent possible, to exchange rate fluctuations through the effective use of derivatives.
| CGI Group Inc. – Management’s Discussion and Analysis for the year ended September 30, 2012 | Page 17 of 48 |
| 3.6. | ADJUSTED EBIT BY SEGMENT |
| For the years ended September 30, | ||||||||||||
(in thousands of dollars except for percentage) | 2012 | 2011 | Change | |||||||||
U.S. | 242,965 | 167,734 | 44.9 | % | ||||||||
As a percentage of U.S. revenue | 11.6 | % | 8.8 | % | ||||||||
Canada | 257,011 | 249,103 | 3.2 | % | ||||||||
As a percentage of Canada revenue | 21.2 | % | 19.4 | % | ||||||||
Global Infrastructure Services | 53,265 | 110,880 | (52.0 | %) | ||||||||
As a percentage of GIS revenue | 7.8 | % | 13.6 | % | ||||||||
Europe | 12,333 | 8,630 | 42.9 | % | ||||||||
As a percentage of Europe revenue | 5.7 | % | 3.8 | % | ||||||||
Logica | (18,845 | ) | — | N/A | ||||||||
As a percentage of Logica revenue | (3.3 | %) | N/A | |||||||||
Adjusted EBIT | 546,729 | 536,347 | 1.9 | % | ||||||||
Adjusted EBIT margin | 11.5 | % | 12.7 | % | ||||||||
Adjusted EBIT for the year was $546.7 million, an increase of $10.4 million or 1.9% from the previous year. The margin decreased from 12.7% to 11.5%. Excluding the impact of the acquisition of Logica, the legacy operations of CGI would have generated an adjusted EBIT of $565.6 million, an increase of $29.2 million or 5.4% over the $536.3 million from fiscal 2011. The legacy CGI operations would have had a margin of 13.5% which improved over the previous year’s adjusted EBIT margin of 12.7%.
| 3.6.1. | U.S. |
Adjusted EBIT in the U.S. segment was $243.0 million for the year ended September 30, 2012, an increase of $75.2 million or 44.9% year-over-year, while the margin also increased from 8.8% to 11.6%. These improved results came primarily from the revenue growth in the government and health vertical markets as outlined above, and to a lower extent, the benefit related to the expiry of a low margin contract acquired through the Stanley, Inc. (“Stanley”) acquisition in Q4 2010. In addition, the benefits of our Performance Improvement Plan initiated in the fourth quarter of fiscal 2011 generated healthier margins over the past year. During fiscal 2011, approximately $16.9 million was incurred primarily for severance costs, impairments, leasehold improvements write-off and excess real estate whereas in fiscal 2012, $5.8 million was incurred for severances and cost alignment activities.
| 3.6.2. | Canada |
Adjusted EBIT in the Canada segment was $257.0 million for the fiscal year ended September 30, 2012, an increase of $7.9 million year-over-year, while the margin improved from 19.4% to 21.2%. The improved margin benefited from the cost reductions from our Performance Improvement Plan initiated in the fourth quarter of 2011 as well as the positive margin impacts related to the aforementioned expiration of a government contract and the disposal of our interest in CIA. Offsetting these improvements was the lower than average utilization level of our members in Canada as an above average number of members were on the bench between assignments. This was due to the delays noted above in contract awards and the ramping up of new projects. Despite these pressures, the Canadian segment has continued to generate significant margins over the recent past with 21.2% in 2012, 19.4% in 2011, and 19.3% in 2010 clearly demonstrating the success of our strategy to target IP-based revenue streams, global delivery and managed services. Initiatives to further improve our margins in this segment continue as we incurred costs related to severances and real estate optimization in the amount of $12.2 million this year, down by $22.4 million when compared with last year.
| CGI Group Inc. – Management’s Discussion and Analysis for the year ended September 30, 2012 | Page 18 of 48 |
| 3.6.3. | Global Infrastructure Services |
Adjusted EBIT in the GIS segment was $53.3 million for the year ended September 30, 2012, a decrease of $57.6 million year-over-year, while the margin also decreased from 13.6% to 7.8% over the same period. As previously disclosed, the expiration of an outsourcing contract in the third quarter of 2011 was the primary cause of the decrease in profitability for this segment. The loss of this contract created excess capacity within our infrastructure segment, causing the fixed cost structure to be absorbed by a smaller base of business. Actions were taken in the last half of fiscal 2011 to address the variable cost components related to the expiry of this contract. We continue to rationalize the business structure and have introduced some productivity initiatives within this segment to better align our costs. These initiatives started to generate savings in the fourth quarter but still had a net $1.9 million impact to the margin for the year. In addition, we incurred charges related to provisions for excess real estate, severance costs and leasehold improvements write-offs in the amount of $9.3 million for fiscal 2011, while charges related to severances and cost alignment activities in fiscal 2012 amounted to $9.0 million.
With our investment in cloud-based services and being awarded a place on the five-year blanket purchase agreement for infrastructure-as-a-service with the U.S. General Services Administration, GIS has been building a significant backlog of cloud related work in partnership with our U.S. segment. At this point of time, much of the awarded work is focused on the development and readiness of the client’s business applications and processes to migrate the services onto the cloud. Consequently, most of the revenue to date has been recognized by the U.S. segment while the GIS segment realized the cost of maintaining an infrastructure that is running under capacity. The negative impact on margin for this past year was $4.7 million or 0.7% of GIS revenue. As the clients’ applications are ported to the new infrastructure this next year, the load will increase and the investment will contribute to the margin of the segment.
| 3.6.4. | Europe |
For the year ended September 30, 2012, our Europe segment adjusted EBIT was $12.3 million, an increase of $3.7 million year-over-year with the margin increasing from 3.8% to 5.7%. The increase was mainly due the Performance Improvement Plan initiated in the fourth quarter of 2011, where the related charges totalled approximately $3.7 million compared to $0.7 million incurred this year in relation to severances and cost alignment activities. Higher volumes of work across the financial services and government vertical markets also helped increase profitability, partly offset by less consulting project work in the telecommunications sector causing excess capacity in certain offices.
| 3.6.5. | Logica |
As noted above in the revenue section, the impact on revenue caused by the vacation period was also reflected in a reduction in the adjusted EBIT for Logica. In addition, redundancy costs and other synergies, as expected, could not be optimized quickly as we needed to work through the various work councils. The result was a lower level of revenue in the period with no accompanying reductions in the cost base. While a number of initiatives had been launched, including the initial discussions with various work councils, the shortness of the period, the vacation impact and the intangible amortization of $10.6 million resulted in an adjusted loss before interest and taxes for the six weeks of $18.8 million or a negative margin of 3.3%. Subsequent to the end of the year we started to make adjustments to the cost structure.
| CGI Group Inc. – Management’s Discussion and Analysis for the year ended September 30, 2012 | Page 19 of 48 |
| 3.7. | EARNINGS BEFORE INCOME TAXES |
The following table provides, for the periods indicated, a reconciliation between our adjusted EBIT and earnings before income taxes, which is reported in accordance with IFRS.
For the year ended September 30, (in thousands of dollars except for percentage) | 2012 | % of Revenue | 2011 | % of Revenue | ||||||||||||
Adjusted EBIT | 546,729 | 11.5 | % | 536,347 | 12.7 | % | ||||||||||
Minus the following items: | ||||||||||||||||
Acquisition-related and integration costs | 254,973 | 5.3 | % | 3,675 | 0.1 | % | ||||||||||
Finance costs | 42,099 | 0.9 | % | 19,395 | 0.5 | % | ||||||||||
Finance income | (5,318 | ) | (0.1 | %) | (3,552 | ) | (0.1 | %) | ||||||||
Other income | (3,955 | ) | (0.1 | %) | (7,647 | ) | (0.2 | %) | ||||||||
Share of profit on joint venture | (3,996 | ) | (0.1 | %) | (13,359 | ) | (0.3 | %) | ||||||||
Earnings before income taxes | 262,926 | 5.5 | % | 537,835 | 12.7 | % | ||||||||||
Excluding the acquisition of Logica, the earnings before income taxes would have been $555.2 million or 13.2% of revenue. This is comprised of the adjusted EBIT before Logica less financing costs in addition to the finance income, other income and share of profit on joint venture noted in the above table.
| 3.7.1. | Acquisition-Related and Integration Costs |
The $255.0 million incurred in the year pertains to various professional fees and costs associated with the acquisition of Logica on August 20, 2012. Included in the fiscal 2012 amount are acquisition-related costs of $36.4 million, integration costs of $109.7 million, make whole costs on Logica’s debt and other financing costs of $108.9 million. The acquisition-related costs consist mainly of professional fees incurred for the acquisition and foreign exchange call options for an amount of $7.1 million in order to comply with the funds certain requirement under the UK City Code on Takeovers and Mergers. Integration costs driven by the restructuring of Logica’s operations mainly include the costs related to the termination of certain employees identified as redundant. The $3.7 million incurred in fiscal 2011 were costs incurred at the beginning of the year to realize the integration and synergies of the Stanley acquisition concluded in August 2010.
| 3.7.2. | Finance Costs |
The year-over-year increase in finance costs was mainly related to the incremental interest expense from the debt used to finance the Logica acquisition.
| 3.7.3. | Finance Income |
Finance income includes interest and other investment income related to cash balances, investments, and tax assessments.
| 3.7.4. | Other Income |
During the year ended September 30, 2012, the Company sold its 49% interest in Innovapost Inc. to Canada Post Corporation (“CPC”) for consideration of $26.0 million. A gain of $3.0 million was recognized in the first quarter of fiscal 2012.
| CGI Group Inc. – Management’s Discussion and Analysis for the year ended September 30, 2012 | Page 20 of 48 |
| 3.8. | NET EARNINGS AND EARNINGS PER SHARE |
The following table sets out the information supporting the earnings per share calculations:
For the year ended September 30, (in thousands of dollars unless otherwise indicated) | 2012 | 2011 | Change | |||||||||
Earnings before income taxes | 262,926 | 537,835 | (51.1 | %) | ||||||||
Income tax expense | 131,397 | 99,696 | 31.8 | % | ||||||||
Effective tax rate1 | 50.0 | % | 18.5 | % | ||||||||
Net earnings | 131,529 | 438,139 | (70.0 | %) | ||||||||
Margin | 2.8 | % | 10.4 | % | ||||||||
Weighted average number of shares | ||||||||||||
Class A subordinate shares and Class B shares(basic) | 263,431,660 | 265,333,074 | (0.7 | %) | ||||||||
Class A subordinate shares and Class B shares(diluted) | 273,644,002 | 275,820,247 | (0.8 | %) | ||||||||
Earnings per share(in dollars) | ||||||||||||
Basic EPS | 0.50 | 1.65 | (69.7 | %) | ||||||||
Diluted EPS | 0.48 | 1.59 | (69.8 | %) | ||||||||
| 1 | Tax rate reflects the impact of certain acquisition-related and integration costs not being deductible for tax purposes. |
| 3.8.1. | Income Tax Expense |
For fiscal 2012, income tax expense was $131.4 million, an increase of $31.7 million compared to $99.7 million in the prior year, while our effective income tax rate increased from 18.5% to 50.0%. The increase in income tax expense was due mainly to favourable tax adjustments recorded in fiscal 2011 that reduced our income taxes in the amount of $41.4 million, the impact of non-deductible transaction costs incurred and integration expenses on which no tax benefit was recognized with regards to the Logica acquisition in the amount of $52.7 million, and unrecognized tax benefits on losses from Logica’s operations in the amount of $3.8 million.
Based on enacted rates and our current business mix, we expect our effective tax rate before integration costs and any significant adjustments to be in the range of 24% to 27% in subsequent periods.
| 3.8.2. | Weighted Average Number of Shares |
CGI’s basic and diluted weighted average number of shares for fiscal 2012 decreased compared to the the prior year due to the repurchase of shares on the open market as part of the NCIB, partly offset by the issuance of Class A subordinate shares upon the exercise of stock options. During the year, 5.4 million shares were repurchased and 5.4 million options were exercised, while 46.7 million Class A subordinate shares were issued for the acquisition of Logica.
| CGI Group Inc. – Management’s Discussion and Analysis for the year ended September 30, 2012 | Page 21 of 48 |
| 3.8.3. | Net Earnings and Earnings per Share Excluding Certain Items |
Below is a table showing the year-over-year comparison excluding the items related to the acquisition of Logica, as well as the 2011 favourable tax adjustments:
For the year ended September 30, (in thousands of dollars unless otherwise indicated) | 2012 | 2011 | Change | |||||||||
Earnings before income taxes | 262,926 | 537,835 | (51.1 | %) | ||||||||
Add back: | ||||||||||||
Acquisition-related and integration costs1 | 254,973 | — | ||||||||||
Logica loss2 | 18,314 | — | ||||||||||
Interest rate impact3 | 19,010 | — | ||||||||||
Earnings before income taxes prior to adjustments | 555,223 | 537,835 | 3.2 | % | ||||||||
Margin | 13.2 | % | 12.7 | % | ||||||||
Income tax expense | 131,397 | 99,696 | 31.8 | % | ||||||||
Add back: | ||||||||||||
Income tax recovery on the Logica loss | 1,098 | — | ||||||||||
Tax adjustments | — | 41,415 | ||||||||||
Tax deduction on acquisition-related and integration costs, and interest rate impact | 21,396 | — | ||||||||||
Income tax expense prior to adjustments | 153,891 | 141,111 | 9.1 | % | ||||||||
Effective tax rate prior to adjustments | 27.7 | % | 26.2 | % | ||||||||
Net earnings prior to adjustments | 401,332 | 396,724 | 1.2 | % | ||||||||
Margin | 9.5 | % | 9.4 | % | ||||||||
Weighted average number of shares4 | ||||||||||||
Class A subordinate shares and Class B shares(basic) | 258,199,439 | 265,333,074 | (2.7 | %) | ||||||||
Class A subordinate shares and Class B shares(diluted) | 268,411,780 | 275,820,247 | (2.7 | %) | ||||||||
Earnings per share (in dollars)5 | ||||||||||||
Basic EPS | 1.55 | 1.50 | 3.3 | % | ||||||||
Diluted EPS | 1.50 | 1.44 | 4.2 | % | ||||||||
| 1 | Fiscal 2012 costs relate to the acquisition and integration of Logica. |
| 2 | Logica’s results for the six-week period ended September 30, 2012, excluding acquisition-related and integration costs. |
| 3 | The interest rate impact removes the incremental interest expense related to the debt drawn for the acquisition of Logica and the difference in the interest rate between our variable rate credit facility and the fixed interest rate on the long-term notes. |
| 4 | The weighted average number of shares was re-calculated without the issuance of the 46.7 million Class A shares to the CDPQ. |
| 5 | EPS amounts are prior to Logica results, fiscal 2011 favourable tax adjustments, interest rate impact, acquisition-related and integration costs, severances, excess real estate provisions, leasehold improvement write-offs and impairment charges. |
| CGI Group Inc. – Management’s Discussion and Analysis for the year ended September 30, 2012 | Page 22 of 48 |
| 4. | Liquidity |
| 4.1. | CONSOLIDATED STATEMENTS OF CASH FLOWS |
CGI’s growth is financed through a combination of our cash flow from operations, borrowing under our existing credit facilities, the issuance of long-term debt, and the issuance of equity. One of our primary financial goals is to maintain an optimal level of liquidity through the active management of our assets and liabilities as well as our cash flows.
As at September 30, 2012, cash and cash equivalents were $113.1 million. The following table provides a summary of the generation and utilization of cash for the fiscal year ended September 30, 2012 and 2011.
For the year ended September 30, (in thousands of dollars) | 2012 | 2011 | Change | |||||||||
Cash provided by operating activities | 613,262 | 570,002 | 43,260 | |||||||||
Cash used in investing activities | (2,849,034 | ) | (131,014 | ) | (2,718,020 | ) | ||||||
Cash provided by (used in) financing activities | 2,285,480 | (491,608 | ) | 2,777,088 | ||||||||
Effect of foreign exchange rate changes on cash and cash equivalents | 2,722 | 4,764 | (2,042 | ) | ||||||||
Net increase (decrease) in cash and cash equivalents and bank overdraft | 52,430 | (47,856 | ) | 100,286 | ||||||||
| 4.1.1. | Cash Provided by Operating Activities |
Cash provided by operating activities was $613.3 million in fiscal 2012, representing 12.9% of revenue. This is compared to $570.0 million or 13.5% of revenue in the prior year. The timing of our working capital inflows and outflows will always have an impact on the cash flow from operations. Excluding the payments in respect to the acquisition-related and integration costs, the cash provided by operating activities would have been $654.0 million, representing 13.7% of revenue. This increase was mainly due to the improvements in the DSO, lower tax payments, and cash coming from the other working capital items.
| 4.1.2. | Cash Used in Investing Activities |
Cash used in investing activities was $2,849.0 million in fiscal 2012, an increase of $2,718.0 million, compared to the $131.0 million used in fiscal 2011. The year-over-year increase was mainly due to the acquisition of Logica which accounted for $2,734.8 million of the increase.
Proceeds from the sale of investment in joint venture and businesses increased by $26.5 million year-over year due to the sale of our 49% interest in Innovapost Inc.
Short-term investments, comprised of term deposits, have original maturities over three months, but not more than one year, at the date of purchase. During the year ended September 30, 2012, the Company invested a net of $5.2 million compared to proceeds received of $2.0 million net in the same period last year on the redemption and purchase of short-term investments.
Cash used for the purchase of property, plant and equipment (“PP&E”) amounted to $64.6 million during the year, a decrease of $0.4 million over the $65.0 million invested last year. During the year, our investment for the purchase of a data centre facility in the Greater Toronto Area was offset by lower investments in leasehold improvements, furniture and office equipment, and computer equipment.
Investments in intangible assets amounted to $43.7 million, representing an increase of $16.8 million from last year. The increase was due to the adding and updating of functionality in our business solutions. We also invested in new solutions during the year.
| CGI Group Inc. – Management’s Discussion and Analysis for the year ended September 30, 2012 | Page 23 of 48 |
Investments in contract costs amounted to $25.3 million in fiscal 2012, compared to $27.9 million in fiscal 2011 reflecting a $2.6 million decrease. The decrease was due to less contract costs capitalized as contracts migrated out of their transition phase.
The Company purchased $1.0 million of long-term investments in the current year, whereas $14.2 million was invested in the prior year.
| 4.1.3. | Cash Provided by (Used in) Financing Activities |
During fiscal 2012, $2,285.5 million was provided by the Company’s financing activities, representing an increase of $2,777.1 million when compared to the $491.6 million consumed in fiscal 2011. The increase is due to the term loan and shares issued for the acquisition of Logica.
In fiscal 2012, we made net repayments of $158.6 million on our credit facilities and another $954.2 million on our outstanding long-term debt, of which $891.4 million was related to the debt assumed from the Logica acquisition. In fiscal 2011, we made net repayments totalling $104.3 million on our credit facilities and $129.7 million on our long-term debt.
During the year, we also used $102.8 million to repurchase 5.4 million CGI shares on the open market under the previous and current NCIB, while in fiscal 2011 the Company spent $305.0 million to purchase 16.4 million CGI shares under the NCIB then in effect. The Company’s cash management strategy is to maintain the flexibility to pay down debt and/or repurchase shares depending on economic conditions. In addition, we received $1,047.2 million in proceeds from the issuance of shares to fund the acquisition and the exercise of stock options in the year, compared to $52.1 million in the previous year.
At the beginning of fiscal 2011, $2.6 million was used to purchase CGI shares under the Performance Share Unit (“PSU”) Plan which is part of the compensation package of various executive officers. At the beginning of fiscal 2012, we sold the shares that were not paid out in the compensation packages and received $1.2 million. We also used $14.3 million to purchase the CGI shares for the fiscal 2012 PSU Plan.
| 4.1.4. | Effect of Foreign Exchange Rate Changes on Cash and Cash Equivalents |
For 2012 and 2011, the foreign exchange effect was negligible. These amounts had no effect on net earnings as they were recorded in other comprehensive income.
| 4.2. | CAPITAL RESOURCES |
(in thousands of dollars) | Total commitment | Available at September 30, 2012 | Outstanding at September 30, 2012 | |||||||||
| $ | $ | $ | ||||||||||
Cash and cash equivalents | — | 113,103 | — | |||||||||
Short-term investments | — | 14,459 | — | |||||||||
Long-term marketable investments | — | 15,533 | — | |||||||||
Unsecured committed revolving facilities1 | 1,500,000 | 786,089 | 713,911 | |||||||||
|
|
|
|
|
| |||||||
Total | 1,500,000 | 929,184 | 713,911 | |||||||||
|
|
|
|
|
| |||||||
| 1 | Consists of drawn portion of $692.0 million and Letters of Credit for $22.0 million outstanding on September 30, 2012. |
Our cash position and bank lines are sufficient to support our growth strategy. At September 30, 2012, cash and cash equivalents, short-term and long-term marketable investments were $143.1 million.
Cash equivalents typically include money market funds and term deposits as well as bankers’ acceptances and bearer deposit notes issued by major banks, all with initial maturities of 90 days or less.
| CGI Group Inc. – Management’s Discussion and Analysis for the year ended September 30, 2012 | Page 24 of 48 |
Short-term investments include fixed deposits, term deposits, municipal, provincial and government bills with initial maturities ranging from 91 days to 1 year.
Long-term marketable investments include corporate and government bonds with maturities ranging from one to five years, rated AA or higher.
The amount available under our credit facilities was $786.1 million. The long-term debt agreements contain covenants which require us to maintain certain financial ratios. At September 30, 2012, CGI was in compliance with these covenants.
Total debt increased by $2,242.7 million to $3,248.4 million at September 30, 2012, compared to $1,005.7 million at September 30, 2011. The variation was mainly due to the term loan for $1,933.9 million for the Logica acquisition, proceeds of US$475.0 million, and the net reimbursement of $158.6 million under the credit facility. Also, during the year, we reimbursed the last tranche of US$20.0 million of the 2004 private debt placement financing.
Additional funding for the acquisition came from the issuance of 46.7 million Class A shares in CGI for C$1.0 billion from the CDPQ.
The Company expects that cash generated from the combined operations will permit a significant deleveraging over the next three years and that funds generated will be adequate to meet our liquidity needs in the foreseeable future while maintaining adequate liquidity.
| 4.3. | CONTRACTUAL OBLIGATIONS |
We are committed under the terms of contractual obligations with various expiration dates, primarily for the rental of premises, computer equipment used in outsourcing contracts and long-term service agreements. For the year ended September 30, 2012, the Company increased its commitments by $3,311.4 million year-over year due mainly to the debt used to fund the Logica acquisition. Commitments also increased due to the inclusion of Logica’s commitments.
Commitment type (in thousands of dollars) | Total | Less than 1 year | 2nd and 3rd years | 4th and 5th years | After 5 years | |||||||||||||||
Long-term debt | 3,178,276 | 18,942 | 1,008,869 | 1,766,404 | 384,061 | |||||||||||||||
Capital lease obligations | 85,124 | 33,405 | 42,666 | 8,767 | 286 | |||||||||||||||
Operating leases | ||||||||||||||||||||
Rental of office space1 | 1,703,857 | 305,679 | 521,565 | 403,610 | 473,003 | |||||||||||||||
Computer equipment | 114,584 | 60,735 | 47,673 | 6,176 | — | |||||||||||||||
Automobiles | 113,895 | 69,284 | 41,530 | 3,066 | 15 | |||||||||||||||
Long-term service agreements and other | 35,457 | 17,597 | 13,120 | 4,740 | — | |||||||||||||||
Total contractual obligations | 5,231,193 | 505,642 | 1,675,423 | 2,192,763 | 857,365 | |||||||||||||||
|
|
|
|
|
|
|
|
|
| |||||||||||
| 1 | Included in these obligations are $81.5 million of office space leases from past acquisitions. |
| 4.4. | FINANCIAL INSTRUMENTS AND HEDGING TRANSACTIONS |
We use various financial instruments to manage its exposure to fluctuations of foreign currency exchange rates. We do not hold or use any derivative instruments for trading purposes. Foreign exchange translation gains or losses on the net investments and the effective portions of gains or losses on instruments hedging the net investments are recorded in the consolidated statement of comprehensive income. Any realized or unrealized gains or losses on instruments covering the U.S. denominated debt are also recognized in the consolidated statement of comprehensive income.
| CGI Group Inc. – Management’s Discussion and Analysis for the year ended September 30, 2012 | Page 25 of 48 |
We have the following outstanding hedging instruments:
Hedges on net investments in foreign operations
| • | US$818.0 million debt designated as the hedging instrument of our net investment in U.S. operations; |
| • | €45.0 million debt designated as the hedging instrument of our net investment in European operations; |
| • | $1,153.7 million cross-currency swaps to hedge our net investment in European operations. |
Cash flow hedges on future revenue
| • | US$32.1 million foreign currency forward contracts to hedge the variability in the expected foreign currency exchange rate between the U.S. dollar and the Canadian dollar; |
| • | US$51.9 million foreign currency forward contracts to hedge the variability in the expected foreign currency exchange rate between the U.S. dollar and the Indian rupee; |
| • | $53.1 million foreign currency forward contracts to hedge the variability in the expected foreign currency exchange rate between the Canadian dollar and the Indian rupee. |
Cash flow hedges on unsecured committed term loan credit facility
| • | $1,234.4 million interest rate swaps floating-to-fixed. |
Fair value hedges on Senior U.S. unsecured notes
| • | US$125.0 million interest rate swaps fixed-to-floating. |
Derivatives not designated as hedges
| • | £37.3 million foreign currency forward contracts to hedge the net exposure of some assets and liabilities not denominated in the functional currencies. |
The effective portion of the change in the fair value of the derivative instruments is recognized in other comprehensive income and the ineffective portion, if any, in net earnings. During the year ended September 30, 2012, our hedging instruments were effective.
We expect that approximately $2.1 million of the accumulated net unrealized losses on all derivative financial instruments designated as cash flow hedges at September 30, 2012 will be reclassified in net earnings in the next 12 months.
| CGI Group Inc. – Management’s Discussion and Analysis for the year ended September 30, 2012 | Page 26 of 48 |
| 4.5. | SELECTED MEASURES OF LIQUIDITY AND CAPITAL RESOURCES |
As at September 30, | 2012 | 2011 | ||||||
Net debt to capitalization ratio | 46.6 | % | 27.4 | % | ||||
Net debt(in thousands of dollars) | 3,105,313 | 918,968 | ||||||
Return on equity | 5.0 | % | 19.6 | % | ||||
Return on invested capital | 11.4 | % | 13.7 | % | ||||
Days sales outstanding | 70 | 53 | ||||||
We use the net debt to capitalization ratio as an indication of our financial leverage in order to pursue any large outsourcing contracts, expand global delivery centres, or make acquisitions. On August 20, 2012, we acquired Logica using a combination of debt and stock, causing our net debt to capitalization ratio to increase.
Return on equity is a measure of the return we are generating for our shareholders. ROE decreased from 19.6% at the end of fiscal 2011 to 5.0% at the end of fiscal 2012. The decrease is mainly due to the impact of the acquisition-related and integration costs. The decrease in the ratio is also attributable to the higher amount of equity which resulted from the issuance of $1.0 billion worth of Class A shares, as well as a higher amount of favourable tax adjustments recorded in the prior year.
ROIC is a measure of the Company’s efficiency in allocating the capital under our control to profitable investments. The return on invested capital was 11.4% as at September 30, 2012, a decrease compared to 13.7% a year ago. The decrease in this ratio was mainly a result of the issuance of 46.7 million of Class A shares for proceeds of $1.0 billion and the term loan of $1,933.9 million.
DSO increased to 70 days from 53 days last year. In calculating the DSO, we subtract the deferred revenue balance from trade accounts receivable and work in progress; for that reason, the timing of payments received from outsourcing clients in advance of the work to be performed and the timing of payments related to project milestones can affect the DSO fluctuations. The increase in the number of days is due to the inclusion of the full value of Logica’s trade receivables, work in progress, and deferred revenue in the calculation while only the six weeks of revenue from the acquisition is included. Without considering the impact of Logica, DSO would have improved to 47 days at the end of September 30, 2012. We remain committed to manage our DSO within our 45-day target.
| 4.6. | OFF-BALANCE SHEET FINANCING AND GUARANTEES |
We do not engage in the practice of off-balance sheet financing, except for the use of certain operating leases for office space, computer equipment and vehicles. In accordance with IFRS, neither the lease liability nor the underlying asset is carried on the balance sheet as the terms of the leases do not meet the criteria for capitalization. From time to time, we also enter into agreements to provide financial or performance assurances to third parties on the sale of assets, business divestitures, guarantees and U.S. Government contracts.
In connection with sales of assets and business divestitures, we may be required to pay counterparties for costs and losses incurred as the result of breaches in representations and warranties, intellectual property right infringement and litigation against counterparties. While some of the agreements specify a maximum potential exposure totalling approximately $6.5 million, others do not specify a maximum amount or limited period. It is impossible to reasonably estimate the maximum amount that may have to be paid under such guarantees. The amounts are dependent upon the outcome of future contingent events, the nature and likelihood of which cannot be determined at this time. The Company does not expect to incur any potential payment in connection with these guarantees that could have a materially adverse effect on its consolidated financial statements.
We are also engaged to provide services under contracts with the U.S. Government. The contracts are subject to extensive legal and regulatory requirements and, from time to time, agencies of the U.S. Government investigate whether our operations are being conducted in accordance with these requirements. Generally, the Government has the right to change the scope of, or terminate, these projects at its convenience. The termination or a reduction in the scope of a major government project could have a material adverse effect on our results of operations and financial condition.
| CGI Group Inc. – Management’s Discussion and Analysis for the year ended September 30, 2012 | Page 27 of 48 |
In the normal course of business, we may provide certain clients, principally governmental entities, with bid and performance bonds. In general, we would only be liable for the amount of the bid bonds if we refuse to perform the project once the bid is awarded. We would also be liable for the performance bonds in the event of default in the performance of our obligations. As at September 30, 2012, we had committed for a total of $49.0 million for these bonds. To the best of our knowledge, we complied with our performance obligations under all service contracts for which there was a performance or bid bond, and the ultimate liability, if any, incurred in connection with these guarantees would not have a material adverse effect on our consolidated results of operations or financial condition.
In addition, we provided a guarantee of $5.9 million on the residual value of leased equipment, accounted for as an operating lease, at the expiration of the lease term.
| 4.7. | CAPABILITY TO DELIVER RESULTS |
Sufficient capital resources and liquidity are required for supporting ongoing business operations and to execute our build and buy growth strategy. The Company has sufficient capital resources coming from the cash generated from operations, credit facilities, long-term debt agreements and invested capital from shareholders. Our principal uses of cash are for procuring new large outsourcing and managed services contracts; investing in our business solutions; pursuing accretive acquisitions; buying back CGI shares and paying down debt. Funds were also used to expand our global delivery network as more and more of our clients demand lower cost alternatives. In terms of financing, we are well positioned to continue executing our four-pillar growth strategy in fiscal 2013.
Strong and experienced leadership is essential to successfully implement our corporate strategy. CGI has a strong leadership team with members who are highly knowledgeable and have gained a significant amount of experience within the IT industry via various career paths and leadership roles. CGI fosters leadership development to ensure a continuous flow of knowledge and strength is maintained throughout the organization. As part of our succession planning in key positions, we established the Leadership Institute, our own corporate university, to develop leadership, technical and managerial skills inspired by CGI’s roots and traditions.
As a company built on human capital, our professionals and their knowledge are critical to delivering quality service to our clients. Our human resources program provides competitive compensation and benefits, a favourable working environment, and our training and career development programs combine to allow us to attract and retain the best talent. Employee satisfaction is monitored regularly through a company-wide survey and issues are addressed immediately. Prior to the Logica acquisition, approximately 85% of our employees, whom we refer to as members, are also owners of CGI through our Share Purchase Plan. This, along with the Profit Participation Program, allows members to share in the success of the Company and aligns member objectives with our strategic goals.
In addition to our capital resources and the talent of our human capital, CGI has established a Management Foundation encompassing governance policies, sophisticated management frameworks and an organizational model for its business unit and corporate processes. This foundation, along with our appropriate internal systems, helps in providing for a consistent high standard of quality service to our clients. CGI’s operations maintain appropriate certifications in accordance with service requirements such as the ISO and Capability Maturity Model Integration quality programs.
| 5. | Fourth Quarter Results |
In the fourth quarter of fiscal 2012, our priority was to successfully close the acquisition of Logica and begin executing the integration plan. In addition, the Company remained focused on its business development activities to increase our sales funnel and backlog.
| CGI Group Inc. – Management’s Discussion and Analysis for the year ended September 30, 2012 | Page 28 of 48 |
Average foreign exchange rates
For the three months ended September 30, | 2012 | 2011 | Change | |||||||||
U.S. dollar | 0.9948 | 0.9802 | 1.5 | % | ||||||||
Euro | 1.2452 | 1.3836 | (10.0 | %) | ||||||||
Indian rupee | 0.0181 | 0.0214 | (15.4 | %) | ||||||||
British pound | 1.5727 | 1.5773 | (0.3 | %) | ||||||||
Australian dollar | 1.0337 | 1.0279 | 0.6 | % | ||||||||
Swedish krona | 0.1476 | 0.1513 | (2.4 | %) | ||||||||
| 5.1. | REVENUE VARIATION AND REVENUE BY SEGMENT |
The following table provides a summary of our revenue growth, in total and by segment, separately showing the impacts of foreign currency variations between the fourth quarter of 2012 and the fourth quarter of 2011. The Q4 2011 revenue by segment is recorded reflecting the actual foreign exchange rates for that year. The foreign exchange impact is the difference between the current period’s actual results and the current period’s results converted with prior year’s foreign exchange rates.
| CGI Group Inc. – Management’s Discussion and Analysis for the year ended September 30, 2012 | Page 29 of 48 |
For the three months ended September 30, (in thousands of dollars except for percentage) | 2012 | 2011 | Change | |||||||||
Total CGI Revenue | 1,609,661 | 1,005,667 | 60.1 | % | ||||||||
Variation prior to foreign currency impact | 59.6 | % | ||||||||||
Foreign currency impact | 0.5 | % | ||||||||||
Variation over previous period | 60.1 | % | ||||||||||
U.S. | ||||||||||||
Revenue prior to foreign currency impact | 537,087 | 476,650 | 12.7 | % | ||||||||
Foreign currency impact | 9,508 | |||||||||||
U.S. revenue | 546,595 | 476,650 | 14.7 | % | ||||||||
Canada | ||||||||||||
Revenue prior to foreign currency impact | 279,748 | 300,810 | (7.0 | %) | ||||||||
Foreign currency impact | (525 | ) | ||||||||||
Canada revenue | 279,223 | 300,810 | (7.2 | %) | ||||||||
Global Infrastructure Services | ||||||||||||
Revenue prior to foreign currency impact | 164,492 | 173,245 | (5.1 | %) | ||||||||
Foreign currency impact | 255 | |||||||||||
Global Infrastructure Services revenue | 164,747 | 173,245 | (4.9 | %) | ||||||||
Europe | ||||||||||||
Revenue prior to foreign currency impact | 54,932 | 54,962 | (0.1 | %) | ||||||||
Foreign currency impact | (3,711 | ) | ||||||||||
Europe revenue | 51,221 | 54,962 | (6.8 | %) | ||||||||
Logica | ||||||||||||
Revenue prior to foreign currency impact | 567,875 | — | N/A | |||||||||
Foreign currency impact | N/A | |||||||||||
Logica revenue | 567,875 | — | N/A | |||||||||
Revenue for the fourth quarter of fiscal 2012 was $1,609.7 million, an increase of $604.0 million or 60.1% year over year. Foreign currency rate fluctuations favourably impacted revenue in the amount of $5.5 million, resulting in a constant currency growth rate of 59.6% year-over-year. This significant increase was attributable to the acquisition of Logica concluded on August 20, 2012, contributing $567.9 million in revenue. As well, our U.S. segment posted the strongest revenue performance, growing 12.7% on a constant currency basis.
Excluding the revenue from Logica, the legacy CGI operations recognized revenue of $1,041.8 million, an increase of $36.1 million or 3.6% from the fourth quarter of fiscal 2011. Overall, this growth came primarily from the government and health vertical markets.
| 5.1.1. | U.S. |
Revenue in our U.S. segment for the three months ended September 30, 2012 was $546.6 million, an increase of $69.9 million or 14.7%. On a constant currency basis, revenue increased by $60.4 million or 12.7% year-over-year. The slight strengthening of the U.S. dollar caused a favourable foreign exchange impact of $9.5 million. The increase came primarily from strong performance across the healthcare and financial services vertical markets, each posting constant currency growth of 37.9% and 18.3%, respectively, while the government vertical followed with a growth of 8.7%, as existing project work with various government agencies continued to expand.
| CGI Group Inc. – Management’s Discussion and Analysis for the year ended September 30, 2012 | Page 30 of 48 |
| 5.1.2. | Canada |
Revenue in our Canada segment was $279.2 million in the fourth quarter of 2012, a decrease of $21.6 million or 7.2% year-over-year. This decrease was mainly a result of engagements being delivered in the healthcare, government and telecommunications and utilities vertical markets while there were some delays in contract awards and the ramping up of new projects. This decrease was partially offset by new project start-ups with our existing financial services clients.
| 5.1.3. | Global Infrastructure Services |
Revenue in our GIS segment was $164.7 million in the fourth quarter of 2012, a decrease of $8.5 million or 4.9% year-over-year. The revenue change was primarily the result of the expiration of a document management services contract in the financial services vertical. This was partially offset by new contracts and expanded scope on existing projects in the manufacturing, retail & distribution vertical market.
| 5.1.4. | Europe |
For the three months ended September 30, 2012, revenue in our Europe segment was flat year-over-year on a constant currency basis, while unfavourable foreign exchange variation impacted the segment by $3.7 million. While the slowdown of project work in the telecommunications and utilities vertical market put downward pressure on our revenue in this segment, growth in the financial services and MRD verticals offset this impact.
| 5.1.5. | Logica |
The acquisition of Logica occurred during the peak vacation period in Europe where a significant number of the members as well as their clients were on leave. As a significant portion of Logica’s revenue is recognized on a time and material basis, the resulting revenue for this period was not reflective of business-as-usual.
Revenue generated by Logica operations for the six-week period subsequent to the acquisition date represented $567.9 million or 35.3% of total Company revenue for the quarter. During this period, Logica’s revenue consisted of 14.1% from financial services, 29.4% from government, 2.8% from healthcare, 29.9% from MRD, and 23.8% from telecommunications & utilities.
| CGI Group Inc. – Management’s Discussion and Analysis for the year ended September 30, 2012 | Page 31 of 48 |
| 5.2. | ADJUSTED EBIT BY SEGMENT |
For the three months ended September 30, (in thousands of dollars except for percentage) | 2012 | 2011 | Change | |||||||||
U.S. | 67,244 | 31,705 | 112.1 | % | ||||||||
As a percentage of U.S. revenue | 12.3 | % | 6.7 | % | ||||||||
Canada | 52,011 | 42,857 | 21.4 | % | ||||||||
As a percentage of Canada revenue | 18.6 | % | 14.2 | % | ||||||||
Global Infrastructure Services | 11,197 | 10,973 | 2.0 | % | ||||||||
As a percentage of GIS revenue | 6.8 | % | 6.3 | % | ||||||||
Europe | 2,533 | 3,062 | (17.3 | %) | ||||||||
As a percentage of Europe revenue | 4.9 | % | 5.6 | % | ||||||||
Logica | (18,845 | ) | — | N/A | ||||||||
As a percentage of Logica revenue | (3.3 | %) | N/A | |||||||||
Adjusted EBIT | 114,140 | 88,597 | 28.8 | % | ||||||||
Adjusted EBIT margin | 7.1 | % | 8.8 | % | ||||||||
Adjusted EBIT for the fourth quarter of fiscal 2012 was $114.1 million, an increase of $25.5 million or 28.8% from the same quarter in the previous year. The margin decreased from 8.8% to 7.1%. Excluding the impact of the acquisition of Logica, the legacy operations of CGI would have generated an adjusted EBIT of $133.0 million, an increase of $44.4 million or 50.1% over the $88.6 million from Q4 2011. The legacy CGI operations would have had a margin of 12.8% which improved over Q4 2011’s adjusted EBIT margin of 8.8%.
| 5.2.1. | U.S. |
U.S. adjusted EBIT was $67.2 million for the three months ended September 30, 2012, an increase of $35.5 million or 112.1% over the prior year, while margins have almost doubled, increasing from 6.7% to 12.3%. The improvement in profitability was due to the growth from our healthcare and government vertical markets as described in the revenue section, and more license sales compared to Q4 2011. Finally, charges taken in Q4 2011 as part of our Performance Improvement Plan helped address the cost structure of our U.S. business units.
| 5.2.2. | Canada |
Canada adjusted EBIT was $52.0 million in the fourth quarter of 2012, an increase of $9.2 million or 21.4%. As a percentage of revenue, the margin increased from 14.2% to 18.6%. The increase was mainly due to the Performance Improvement Plan in Q4 2011. Offsetting these improvements was the lower than average utilization level of our members in Canada as an above average number of members were on the bench between assignments. This was due to the delays from contract awards and the ramping up of new projects noted above in the revenue section.
| 5.2.3. | Global Infrastructure Services |
Adjusted EBIT in GIS was $11.2 million for the three months ended September 30, 2012, a slight increase of $0.2 million from the same period in the prior year. As a percentage of revenue, the margin increased from 6.3% to 6.8%. The overall profitability of this segment remained stable year-over-year as both periods were impacted by the expiration of a document management services contract in the financial services vertical market, creating excess in capacity.
| CGI Group Inc. – Management’s Discussion and Analysis for the year ended September 30, 2012 | Page 32 of 48 |
| 5.2.4. | Europe |
Europe adjusted EBIT was $2.5 million for the fourth quarter of 2012, a slight decrease of $0.5 million compared to the fourth quarter in the prior year, while as a percentage of revenue, the margin decreased from 5.6% to 4.9%. The segment adjusted EBIT grew from the revenue growth in the financial services and MRD verticals. This was offset by a non-recurring bad debt expense of $1.4 million from an insolvent client, as well as the resulting excess in capacity as members were placed on the bench.
| 5.2.5. | Logica |
As noted above in the revenue section, the impact on revenue caused by the vacation period was also reflected in a reduction in the adjusted EBIT for Logica. In addition, redundancy costs and other synergies, as expected, could not be optimized quickly as we needed to work through the various work councils. The result was a lower level of revenue in the period with no accompanying reductions in the cost base. While a number of initiatives had been launched, including the initial discussions with various work councils, the shortness of the period, the vacation impact and the intangible amortization of $10.6 million resulted in an adjusted loss before interest and taxes for the six weeks of $18.8 million or a negative margin of 3.3%. Subsequent to the end of the year we started to make adjustments to the cost structure.
| 5.3. | NET EARNINGS AND EARNINGS PER SHARE |
The following table sets out the information supporting the earnings per share calculations:
For the three months ended September 30 (in thousands of dollars unless otherwise indicated) | 2012 | 2011 | Change | |||||||||
Adjusted EBIT | 114,140 | 88,597 | 28.8 | % | ||||||||
Acquisition-related and integration costs | 248,320 | — | N/A | |||||||||
Finance costs | 17,901 | 4,132 | 333.2 | % | ||||||||
Finance income | (3,710 | ) | (626 | ) | 492.7 | % | ||||||
Other expenses (income) | 1,691 | (1,602 | ) | (205.6 | %) | |||||||
Share of profit on joint venture | — | (4,187 | ) | (100.0 | %) | |||||||
(Loss) Earnings before income taxes | (150,062 | ) | 90,880 | (265.1 | %) | |||||||
Income tax expense | 17,906 | 21,344 | (16.1 | %) | ||||||||
Effective tax rate1 | (11.9 | %) | 23.5 | % | ||||||||
Net (loss) earnings | (167,968 | ) | 69,536 | (341.6 | %) | |||||||
Margin | (10.4 | %) | 6.9 | % | ||||||||
Weighted average number of shares | ||||||||||||
Class A subordinate shares and Class B shares(basic) | 279,284,376 | 261,897,680 | 6.6 | % | ||||||||
Class A subordinate shares and Class B shares(diluted) | 289,815,528 | 271,838,839 | 6.6 | % | ||||||||
Earnings per share(in dollars) | ||||||||||||
Basic EPS | (0.60 | ) | 0.27 | (322.2 | %) | |||||||
Diluted EPS | (0.58 | ) | 0.26 | (323.1 | %) | |||||||
| 1 | Tax rate reflects the impact of certain acquisition-related and integration costs not being deductible for tax purposes. |
| CGI Group Inc. – Management’s Discussion and Analysis for the year ended September 30, 2012 | Page 33 of 48 |
The net loss was $168.0 million for the quarter ended September 30, 2012 compared to net earnings of $69.5 million in the same period of the prior year. The loss is due to the acquisition-related and integration costs.
The increase in weighted average number of shares is due to the issuance of 46.7 million Class A shares. During the current quarter, no shares were repurchased and 2.0 million options were exercised.
Below is a table showing the year-over-year comparison excluding the items related to the acquisition of Logica as well as the provisions on excess real estate, the related leasehold improvements write-off, the severance costs and the impairment charges:
For the three months ended September 30 (in thousands of dollars unless otherwise indicated) | 2012 | 2011 | Change | |||||||||
(Loss) Earnings before income taxes | (150,062 | ) | 90,880 | (265.1 | %) | |||||||
Add back: | ||||||||||||
Acquisition-related and integration costs1 | 248,320 | — | ||||||||||
Logica loss2 | 18,314 | — | ||||||||||
Interest rate impact3 | 10,996 | — | ||||||||||
Severances, excess real estate provisions, leasehold improvement write-offs and impairment charge4 | 13,421 | 50,753 | ||||||||||
Earnings before income taxes prior to adjustments | 140,989 | 141,633 | (0.5 | %) | ||||||||
Margin | 13.5 | % | 14.1 | % | ||||||||
Income tax expense | 17,906 | 21,344 | (16.1 | %) | ||||||||
Add back: | ||||||||||||
Income tax recovery on the Logica loss | 1,098 | — | ||||||||||
Tax deduction on acquisition-related and integration costs, interest rate impact, severances, excess real estate provisions, leasehold improvement write-offs and impairment charge | 22,023 | 15,328 | ||||||||||
Income tax expense prior to adjustments | 41,027 | 36,672 | 11.9 | % | ||||||||
Effective tax rate prior to adjustments5 | 29.1 | % | 25.9 | % | ||||||||
Net earnings prior to adjustments | 99,962 | 104,961 | (4.8 | %) | ||||||||
Margin | 9.6 | % | 10.4 | % | ||||||||
Weighted average number of shares6 | ||||||||||||
Class A subordinate shares and Class B shares(basic) | 258,469,235 | 261,897,680 | (1.3 | %) | ||||||||
Class A subordinate shares and Class B shares(diluted) | 269,000,386 | 271,838,839 | (1.0 | %) | ||||||||
Earnings per share (in dollars)7 | ||||||||||||
Basic EPS | 0.39 | 0.40 | (2.5 | %) | ||||||||
Diluted EPS | 0.37 | 0.39 | (5.1 | %) | ||||||||
| 1 | Costs related to the acquisition and integration of Logica. |
| 2 | Logica’s results for the six-week period ended September 30, 2012, excluding acquisition-related and integration costs. |
| 3 | The interest rate impact removes the incremental interest expense related to the debt drawn for the acquisition of Logica and the difference in the interest rate between our variable rate credit facility and the fixed interest rate on the long-term notes. |
| 4 | In Q4 2011, $50.8 million ($45.4 million under Canadian GAAP) of provisions on excess real estate, related leasehold improvements write-off, severance costs, and impairment charges were added back to earnings in order to calculate a more meaningful net earnings and margin number for the operations. Similar types of charges were added back to the fourth quarter of fiscal 2012 for comparative purposes. |
| 5 | Effective tax rate for the quarter is higher than the previous year due to higher profitability in jurisdictions with higher statutory tax rates. |
| 6 | The weighted average number of shares were re-calculated without the issuance of the 46.7 million Class A shares to the CDPQ. |
| 7 | EPS amounts are attributable to shareholders of CGI and prior to acquisition-related and integration costs, severances, excess real estate provisions, leasehold improvement write-offs and impairment charges. |
| CGI Group Inc. – Management’s Discussion and Analysis for the year ended September 30, 2012 | Page 34 of 48 |
| 6. | Eight Quarter Summary |
| As at and for the three months ended | ||||||||||||||||||||||||||||||||
(in thousands of dollars unless otherwise noted) | Sept. 30, 2012 | June 30, 2012 | Mar. 31, 2012 | Dec. 31, 2011 | Sept. 30, 2011 | June 30, 2011 | Mar. 31, 2011 | Dec. 31, 2010 | ||||||||||||||||||||||||
Growth | ||||||||||||||||||||||||||||||||
Backlog(in millions of dollars) | 17,647 | 13,610 | 13,118 | 13,558 | 13,398 | 12,587 | 12,459 | 12,980 | ||||||||||||||||||||||||
Bookings(in millions of dollars) | 1,523 | 1,478 | 787 | 1,392 | 1,472 | 1,442 | 771 | 1,191 | ||||||||||||||||||||||||
Book-to-bill ratio | 95 | % | 139 | % | 74 | % | 135 | % | 146 | % | 142 | % | 69 | % | 109 | % | ||||||||||||||||
Revenue | 1,609,661 | 1,064,863 | 1,065,791 | 1,032,139 | 1,005,667 | 1,012,845 | 1,111,715 | 1,093,715 | ||||||||||||||||||||||||
Year-over-year growth 1 | 60.1 | % | 5.1 | % | (4.1 | %) | (5.6 | %) | 2.4 | % | 15.1 | % | 24.5 | % | 22.7 | % | ||||||||||||||||
Constant currency growth 1 | 59.6 | % | 3.0 | % | (4.8 | %) | (6.1 | %) | 5.3 | % | 18.0 | % | 27.9 | % | 25.9 | % | ||||||||||||||||
Profitability | ||||||||||||||||||||||||||||||||
Adjusted EBIT | 114,140 | 136,253 | 156,390 | 139,946 | 88,597 | 139,189 | 153,745 | 154,815 | ||||||||||||||||||||||||
Adjusted EBIT margin | 7.1 | % | 12.8 | % | 14.7 | % | 13.6 | % | 8.8 | % | 13.7 | % | 13.8 | % | 14.2 | % | ||||||||||||||||
Net earnings | (167,968 | ) | 87,228 | 105,726 | 106,543 | 69,536 | 123,203 | 118,743 | 126,657 | |||||||||||||||||||||||
Net earnings margin | (10.4 | %) | 8.2 | % | 9.9 | % | 10.3 | % | 6.9 | % | 12.2 | % | 10.7 | % | 11.6 | % | ||||||||||||||||
Basic EPS(in dollars) | (0.60 | ) | 0.34 | 0.41 | 0.41 | 0.27 | 0.47 | 0.45 | 0.47 | |||||||||||||||||||||||
Diluted EPS(in dollars) | (0.58 | ) | 0.33 | 0.40 | 0.40 | 0.26 | 0.45 | 0.43 | 0.45 | |||||||||||||||||||||||
Liquidity | ||||||||||||||||||||||||||||||||
Cash provided by operating activities | 109,346 | 250,985 | 104,217 | 148,714 | 186,611 | 93,152 | 192,390 | 97,849 | ||||||||||||||||||||||||
As a percentage of revenue | 6.8 | % | 23.6 | % | 9.8 | % | 14.4 | % | 18.6 | % | 9.2 | % | 17.3 | % | 8.9 | % | ||||||||||||||||
Days sales outstanding | 70 | 49 | 53 | 51 | 53 | 52 | 43 | 42 | ||||||||||||||||||||||||
Capital structure | ||||||||||||||||||||||||||||||||
Net debt to capitalization ratio | 46.6 | % | 19.4 | % | 24.0 | % | 26.6 | % | 27.4 | % | 28.7 | % | 29.2 | % | 31.1 | % | ||||||||||||||||
Net debt | 3,105,313 | 633,354 | 795,339 | 879,523 | 918,968 | 928,979 | 940,567 | 1,017,666 | ||||||||||||||||||||||||
Return on equity | 5.0 | % | 15.4 | % | 17.4 | % | 18.4 | % | 19.6 | % | 20.5 | % | 19.0 | % | 17.2 | % | ||||||||||||||||
Return on invested capital | 11.4 | % | 11.8 | % | 12.5 | % | 12.8 | % | 13.7 | % | 15.7 | % | 15.9 | % | 15.7 | % | ||||||||||||||||
Balance sheet | ||||||||||||||||||||||||||||||||
Cash and cash equivalents, bank overdraft and short-term investments | 127,562 | 77,418 | 70,213 | 63,908 | 70,839 | 12,578 | 66,428 | 75,278 | ||||||||||||||||||||||||
Total assets | 10,453,442 | 4,550,384 | 4,550,394 | 4,578,816 | 4,657,354 | 4,408,387 | 4,538,875 | 4,511,600 | ||||||||||||||||||||||||
Long-term financial liabilities | 4,124,342 | 854,933 | 969,761 | 1,066,333 | 238,151 | 1,032,092 | 1,101,737 | 1,088,837 | ||||||||||||||||||||||||
| 1 | Reflects the acquisition of Logica on August 20, 2012. |
There are factors causing quarterly variances which may not be reflective of the Company’s future performance. First, there is seasonality in SI&C work, and the quarterly performance of these operations is impacted by occurrences such as vacations and the number of statutory holidays in any given quarter. Outsourcing contracts including BPS contracts are affected to a lesser extent by seasonality. Second, the workflow from some clients may fluctuate from quarter to quarter based on their business cycle and the seasonality of their own operations. Third, the savings that we generate for a client on a given outsourcing contract may temporarily reduce our revenue stream from this client, as these savings may not be immediately offset by additional work performed for this client.
In general, cash flow from operating activities could vary significantly from quarter to quarter depending on the timing of monthly payments received from large clients, cash requirements associated with large acquisitions, outsourcing contracts and projects, the timing of the reimbursements for various tax credits as well as profit sharing payments to members and the timing of restructuring cost payments.
| CGI Group Inc. – Management’s Discussion and Analysis for the year ended September 30, 2012 | Page 35 of 48 |
Foreign exchange fluctuations can also contribute to quarterly variances as our percentage of operations in foreign countries evolves. The effect from these variances is primarily on our revenue and to a much less extent, on our net margin as we benefit from natural hedges.
| 7. | Changes in Accounting Policies |
The audited consolidated financial statements for the years ended September 30, 2012 and 2011 include all adjustments that CGI’s management considers necessary for the fair presentation of its financial position, results of operations, and cash flows.
| 7.1. | ADOPTION OF IFRS |
In February 2008, the Canadian Accounting Standards Board confirmed that the use of IFRS would be required for Canadian publicly accountable enterprises for fiscal years beginning on or after January 1, 2011. Accordingly, the audited consolidated financial statements for the year ended September 30, 2011 have been adjusted as per the guidance provided in IFRS 1, “First-Time Adoption of International Financial Reporting Standards” (“IFRS 1”). The reconciliations from Canadian GAAP to IFRS, a discussion of the adjustments, and other initial elections upon IFRS adoption can be found in Note 33 of the audited consolidated financial statements for the year ended September 30, 2012.
| 7.2. | FUTURE ACCOUNTING STANDARD CHANGES |
The following standards have been issued but are not yet effective:
| • | IFRS 9, “Financial Instruments”, covers the classification and measurement of financial assets and financial liabilities. |
| • | IFRS 10, “Consolidated Financial Statements”, builds on existing principles by identifying the concept of control as the determining factor in whether an entity should be included in a company’s consolidated financial statements. |
| • | IFRS 12, “Disclosure of Interests in Other Entities”, provides guidance on disclosure requirements for all forms of interests in other entities, including joint arrangements, associates, special purpose vehicles and other off-balance sheet vehicles. |
| • | IFRS 13, “Fair Value Measurements”, provides guidance on fair value measurements by providing a definition of fair value and a single source of fair value measurement and disclosure requirements. |
| • | IAS 1, “Presentation of Financial Statements”, was amended to require grouping together items within the statement of comprehensive income that may be reclassified to the statement of income. |
| • | IAS 19, “Employee Benefits”, was amended to adjust the calculation of the financing cost component of defined benefit plans and to enhance disclosure requirements. |
Other than IFRS 9, the above standards are effective October 1, 2013, with earlier application permitted. IFRS 9 is effective October 1, 2015, also with earlier application permitted. The Company is currently evaluating the impact of these standards on its consolidated financial statements.
| CGI Group Inc. – Management’s Discussion and Analysis for the year ended September 30, 2012 | Page 36 of 48 |
| 8. | Critical Accounting Estimates |
The Company’s significant accounting policies are described in Note 3 of the audited consolidated financial statements for the year ended September 30, 2012. The preparation of the consolidated financial statements requires management to make estimates and judgements that affect the reported amounts of assets and liabilities and equity and disclosure of contingent assets and liabilities at the date of the consolidated financial statements and the reported amounts of revenue and expenses during the reporting period. Because of the use of estimates and judgements inherent in the financial reporting process, actual results could differ.
An accounting estimate is considered critical if the estimate requires management to make assumptions about matters that were highly uncertain at the time the estimate was made, if different estimates could reasonably have been used in the period, or changes in the accounting estimates that are reasonably likely to occur, could have a material impact on the presentation of our financial condition, changes in financial condition or results of operations.
Areas impacted by estimates | Consolidated balance sheets | Consolidated statements of earnings | ||||||
| Revenue | Cost of services, selling and administrative | Income taxes | ||||||
Business combinations | ü | ü | ||||||
Income taxes | ü | ü | ||||||
Contingencies and provisions | ü | ü | ||||||
Revenue recognition1 | ü | ü | ü | |||||
Share-based payments | ü | ü | ||||||
Investment tax credits and other government programs | ü | ü | ||||||
Impairment of PP&E, intangible assets and goodwill | ü | ü | ||||||
Employee benefits | ü | ü | ||||||
| 1 | Affects the balance sheet through accounts receivable, work in progress and deferred revenue. |
Business combinations
The Company accounts for its business combinations using the acquisition method. Under this method, estimates we make to determine the fair values of asset and liabilities acquired include judgements in our determinations of acquired intangible assets and assessment of the fair value of existing PP&E. Acquired liabilities can include litigation and other contingency reserves existing at the time of the acquisition. Goodwill is recognized as of the acquisition date as the excess of the cost of the acquisition over the net identifiable assets acquired and liabilities assumed at their acquisition-date fair values.
When establishing fair values, management will make significant estimates and assumptions, especially with respect to intangible assets. Intangible assets acquired and recorded by the Company may include client relationships and contracts, software licenses, trademarks and business solutions. Estimates include but are not limited to the forecasting of future cash flows and discount rates. From time to time, the Company may engage third-party firms to assist us in determining the fair value of assets and liabilities assumed. Management’s estimates of fair values are based upon assumptions believed to be reasonable, but which are inherently uncertain and unpredictable. As a result, actual results may differ from estimates impacting our earnings.
| CGI Group Inc. – Management’s Discussion and Analysis for the year ended September 30, 2012 | Page 37 of 48 |
Income taxes
Current income taxes are recognized with respect to the amounts expected to be paid or recovered under the tax rates and laws that have been enacted or substantively enacted at the balance sheet date. Deferred income tax assets and liabilities are determined using enacted or substantively enacted tax rates that will be in effect for the year in which the differences are expected to be recovered or settled.
In the course of the Company’s operations, uncertainties exist with respect to interpretation of complex tax regulations, the amount and timing of future taxable income. When a tax position is uncertain, the Company recognizes an income tax benefit or reduces an income tax liability only when it is probable that the tax benefit will be realized in the future or that the income tax liability is no longer probable.
The ultimate amount of future income taxes and income tax provision could be materially different from those recorded, as it is influenced by future operating results of the Company and its tax interpretations.
Contingencies and provisions
The Company accrues for costs and provisions requiring significant judgment.
Contingencies for pending or threatened litigation, guarantees and other possible liabilities involve uncertainty relating to possible gain or loss to the Company that will ultimately be resolved when one or more future events occur or fail to occur. Resolution of the uncertainty may confirm the reduction of a liability or the occurrence of a liability. The accrued legal claim provisions are based on historical experience, current trends and other assumptions that are believed to be reasonable under the circumstances.
Furthermore, there are various claims and pending actions against the Company arising in the ordinary course of its business as well as inherited from business acquisitions. Certain of these actions seek damages in significant amounts. Among other things, the Company considers the period in which the underlying cause of the claim occurred, the degree of probability of an unfavourable outcome and the ability to make a reasonable estimate of the loss to determine whether a loss accrual or disclosure in the condensed consolidated financial statements is required.
The Company accrues lease provisions which consist of estimated costs associated with vacated premises. The provisions reflect the present value of lease payments in excess of the expected sublease proceeds on the remaining term of the lease. Key assumptions include the discount rate and the estimate of potential revenues from the subleasing of vacated premises.
Revenue recognition
CGI provides services and products containing pricing mechanisms such as fixed-price arrangements under percentage-of-completion which requires estimates of revenue and costs over the entire arrangement, including estimates of resources and costs necessary to complete performance.
Another assessment, related to a contract which involves the provision of multiple services and products, is to determine how the estimated contract revenue is allocated to each separately identifiable component based on their fair value. Revenue is then recognized for each separately identifiable component as services and products are delivered.
Revenue from benefits-funded arrangements is recognized only to the extent that it is probable that the benefit stream associated with the transaction will generate amounts sufficient to fund the value on which revenue recognition is based.
Management regularly reviews arrangement profitability and the underlying estimates. Estimates of total revenue at the start of the contract may differ materially from actual revenue generated due to volume variations, changes in technology and other factors which may not be foreseen at inception. Provisions for estimated contract losses are recognized in the period when it is determined that a loss is probable and is presented in other long-term liabilities. Contract losses are measured at the amount by which the estimated total costs exceed the estimated total revenue from the contract.
| CGI Group Inc. – Management’s Discussion and Analysis for the year ended September 30, 2012 | Page 38 of 48 |
Share-based payments
The Company operates equity-settled stock option and PSU plans under which the Company receives services from employees and others as consideration for equity instruments. The fair value of the stock options is established on the grant date using the Black-Scholes pricing model. The variables in the model include, but are not limited to: the expected stock price volatility over the term of the awards, expected forfeitures, the expected life of the options and the risk-free interest rate. Different assumptions and changes in circumstances could create material differences in our results of operations.
Investment tax credits and other government programs
The Company receives refundable tax credits on salaries and tax credits on research and software development costs, which meet the criteria of investment tax credits and government programs. The Company is subject to annual audits to verify the amount for which it is entitled and whether it operates eligible activities under the terms of various government tax credit programs. Assessments of the proportion of eligible expenses and of the acceptability rate by these different governments are performed periodically.
Impairment of PP&E, intangible assets and goodwill
The Company tests the recoverability of PP&E, intangible assets and goodwill when events or changes in circumstances indicate that their carrying amounts may not be recoverable. The Company assesses at each reporting date whether any such events or changes in circumstances exist. The carrying amount of PP&E and intangible assets not available for use and goodwill are tested for impairment annually.
If there is any indication that impairment exists or when annual impairment for an asset is required, the Company estimates the recoverable amount of the asset or cash-generating unit (“CGU”) to which the asset relates to determine the extent of any impairment loss. The CGU for which goodwill is assessed for potential impairment is the operating segment level.
The Company uses the discounted cash flow method to estimate the recoverable amount which relies on the use of estimates such as the amount and timing of cash flows that are projected over the expected remaining life of the asset and the time value of money. Any change in the estimates used could have a material impact on the calculation of fair value and the resulting impairment charge.
An impairment loss is recognized as the amount by which the carrying amount of the asset exceeds its recoverable amount.
Additionally, an assessment is made at each reporting date for PP&E and intangible assets as to whether there is any indication that previously recorded impairment losses may no longer exist or may have decreased and therefore must be reversed. If such an indication exists, the Company estimates the asset’s recoverable amount using the discounted cash flow method.
Employee benefits
The present value of the retirement benefits obligations depends on a number of factors that are determined on an actuarial basis using a number of assumptions. The assumptions used in determining the expense for pension include the discount rate, expected long-term rate of return on plan assets, compensation and benefits increases, inflation rates as well as mortality rates.
The Company determines the appropriate discount rate at the end of each year. This is the interest rate that should be used to determine the present value of the expected future benefit payments and represent the market rates for high quality corporate fixed-income investments consistent with the currency and the estimated term of the retirement benefits obligations. A lower discount rate increases the benefit obligation and generally increases the expense. Other key assumptions for pension benefits are based in part on current market conditions. Additional information is disclosed in Note 29 to the audited consolidated financial statements.
| CGI Group Inc. – Management’s Discussion and Analysis for the year ended September 30, 2012 | Page 39 of 48 |
| 9. | Integrity of Disclosure |
Our management assumes the responsibility for the existence of appropriate information systems, procedures and controls to ensure that information used internally and disclosed externally is complete and reliable. The Board of Directors’ duties include the assessment of the integrity of the Company’s internal control and information systems.
CGI has a formal Corporate Disclosure Policy as a part of its Fundamental Texts whose goal is to raise awareness of the Company’s approach to disclosure among the Board of Directors, senior management and employees. The Board of Directors has established a Disclosure Policy Committee responsible for all regulatory disclosure requirements and overseeing the Company’s disclosure practices.
The Audit and Risk Management Committee of CGI is composed entirely of independent directors who meet the independence and experience requirements of the New York Stock Exchange as well as those that apply under Canadian securities regulation. The responsibilities of our Audit and Risk Management Committee include: a) the review of all our public disclosure documents containing audited or unaudited financial information; b) identifying and examining the financial and operating risks to which we are exposed and reviewing the various policies and practices that are intended to manage those risks; c) the review and assessment of the effectiveness of our accounting policies and practices concerning financial reporting; d) the review and monitoring of our internal control procedures, programs and policies and assessment of the adequacy and effectiveness thereof; e) reviewing the adequacy of our internal audit resources including the mandate and objectives of the internal auditor; f) recommendation to the Board of Directors of CGI on the appointment of external auditors, the assertion of the external auditors’ independence, the review of the terms of their engagement as well as pursuing ongoing discussions with them; g) the review of the audit procedures; h) the review of related party transactions; and i) such other responsibilities usually attributed to audit and risk committees or as directed by our Board of Directors.
The Company evaluated the effectiveness of its disclosure controls and procedures and internal controls over financial reporting, supervised by and with the participation of the Chief Executive Officer and the Chief Financial Officer as of September 30, 2012. The CEO and CFO concluded that, based on this evaluation, the Company’s disclosure controls and procedures and internal controls over financial reporting were adequate and effective, at a reasonable level of assurance, to ensure that material information related to the Company and its consolidated subsidiaries would be made known to them by others within those entities.
Management’s assessment and conclusion on the effectiveness of disclosure controls and procedures and internal controls over financial reporting excludes the controls, policies and procedures of Logica which was acquired six weeks prior to CGI’s fiscal year-end. Logica’s results since the acquisition date are included in the September 30, 2012, consolidated financial statements of CGI and constituted approximately 58% of total assets as of September 30, 2012, and approximately 12% of revenue for the year then ended. Please refer to Note 24 to the consolidated financial statements for further details of the acquisition.
| CGI Group Inc. – Management’s Discussion and Analysis for the year ended September 30, 2012 | Page 40 of 48 |
| 10. | Risk Environment |
| 10.1. | RISKS AND UNCERTAINTIES |
While we are confident about our long-term prospects, the following risks and uncertainties could affect our ability to achieve our strategic vision and objectives for growth and should be considered when evaluating our potential as an investment.
| 10.1.1. | Risks Related to the Market |
Economic risk
The level of business activity of our clients, which is affected by economic conditions, has a bearing upon the results of our operations. We can neither predict the impact that current economic conditions will have on our future revenue, nor predict when economic conditions will show meaningful improvement. During an economic downturn, our clients and potential clients may cancel, reduce or defer existing contracts and delay entering into new engagements. In general, companies also decide to undertake fewer IT systems projects during difficult economic times, resulting in limited implementation of new technology and smaller engagements. Since there are fewer engagements in a downturn, competition usually increases and pricing for services may decline as competitors, particularly companies with significant financial resources, decrease rates to maintain or increase their market share in our industry and this may trigger pricing adjustments related to the benchmarking obligations within our contracts. Our pricing, revenue and profitability could be negatively impacted as a result of these factors.
| 10.1.2. | Risks Related to our Industry |
The competition for contracts
CGI operates in a global marketplace in which competition among providers of IT services is vigorous. Some of our competitors possess greater financial, marketing, sales resources, and larger geographic scope in certain parts of the world than we do, which, in turn, provides them with additional leverage in the competition for contracts. In certain niche, regional or metropolitan markets, we face smaller competitors with specialized capabilities who may be able to provide competing services with greater economic efficiency. Some of our competitors have more significant operations than we do in lower cost countries that can serve as a platform from which to provide services worldwide on terms that may be more favourable. Increased competition among IT services firms often results in corresponding pressure on prices. There can be no assurance that we will succeed in providing competitively priced services at levels of service and quality that will enable us to maintain and grow our market share.
The availability and retention of qualified IT professionals
There is strong demand for qualified individuals in the IT industry. Hiring and retaining a sufficient amount of individuals with the desired knowledge and skill set may be difficult. Therefore, it is important that we remain able to successfully attract and retain highly qualified professionals and establish an effective succession plan. If our comprehensive programs aimed at attracting and retaining qualified and dedicated professionals do not ensure that we have staff in sufficient numbers and with the appropriate training, expertise and suitable government security clearances required to serve the needs of our clients, we may have to rely on subcontractors or transfers of staff to fill resulting gaps. If our succession plan fails to identify those with potential or to develop these key individuals, we may lose key members and be required to recruit and train these new resources. This might result in lost revenue or increased costs, thereby putting pressure on our earnings.
| CGI Group Inc. – Management’s Discussion and Analysis for the year ended September 30, 2012 | Page 41 of 48 |
The ability to continue developing and expanding service offerings to address emerging business demands and technology trends
The rapid pace of change in all aspects of information technology and the continually declining costs of acquiring and maintaining information technology infrastructure mean that we must anticipate changes in our clients’ needs. To do so, we must adapt our services and our solutions so that we maintain and improve our competitive advantage and remain able to provide cost effective services. The market for the services and solutions we offer is extremely competitive and there can be no assurance that we will succeed in developing and adapting our business in a timely manner. If we do not keep pace, our ability to retain existing clients and gain new business may be adversely affected. This may result in pressure on our revenue, profit margin and resulting cash flows from operations.
Infringing on the intellectual property rights of others
Despite our efforts, the steps we take to ensure that our services and offerings do not infringe on the intellectual property rights of third parties may not be adequate to prevent infringement and, as a result, claims may be asserted against us or our clients. We enter into licensing agreements for the right to use intellectual property and may otherwise offer indemnities against liability and damages arising from third-party claims of patent, copyright, trademark or trade secret infringement in respect of our own intellectual property or software or other solutions developed for our clients. In some instances, the amount of these indemnity claims could be greater than the revenue we receive from the client. Intellectual property claims or litigation could be time-consuming and costly, harm our reputation, require us to enter into additional royalty or licensing arrangements, or prevent us from providing some solutions or services. Any limitation on our ability to sell or use solutions or services that incorporate software or technologies that are the subject of a claim could cause us to lose revenue-generating opportunities or require us to incur additional expenses to modify solutions for future projects.
Benchmarking provisions within certain contracts
Some of our outsourcing contracts contain clauses allowing our clients to externally benchmark the pricing of agreed upon services against those offered by other providers in an appropriate peer comparison group. The uniqueness of the client environment is factored in and, if results indicate a difference outside the agreed upon tolerance, we may be required to work with clients to reset the pricing for their services.
Protecting our intellectual property rights
Our success depends, in part, on our ability to protect our proprietary methodologies, processes, know-how, tools, techniques and other intellectual property that we use to provide our services. CGI’s business solutions will generally benefit from available copyright protection and, in some cases, patent protection. Although CGI takes reasonable steps to protect and enforce its intellectual property rights, there is no assurance that such measures will be enforceable or adequate. The cost of enforcing our rights can be substantial and, in certain cases, may prove to be uneconomic. In addition, the laws of some countries in which we conduct business may offer only limited intellectual property rights protection. Despite our efforts, the steps taken to protect our intellectual property may not be adequate to prevent or deter infringement or other misappropriation of intellectual property, and we may not be able to detect unauthorized use of our intellectual property, or take appropriate steps to enforce our intellectual property rights.
| 10.1.3. | Risks Related to our Business |
Risks associated with our growth strategy
CGI’s Build and Buy strategy is founded on four pillars of growth: first, organic growth through contract wins, renewals and extensions in the areas of outsourcing and system integration; second, the pursuit of new large outsourcing contracts; third, acquisitions of smaller firms or niche players; and fourth, transformational acquisitions.
| CGI Group Inc. – Management’s Discussion and Analysis for the year ended September 30, 2012 | Page 42 of 48 |
Our ability to grow through organic growth and new large outsourcing transactions is affected by a number of factors outside of our control, including a lengthening of our sales cycle for major outsourcing contracts.
Our ability to grow through niche and transformational acquisitions requires that we identify suitable acquisition targets and that we correctly evaluate their potential as transactions that will meet our financial and operational objectives. There can be no assurance that we will be able to identify suitable acquisition candidates and consummate additional acquisitions that meet our economic thresholds, or that future acquisitions will be successfully integrated into our operations and yield the tangible accretive value that had been expected.
If we are unable to implement our Build and Buy strategy, we will likely be unable to maintain our historic or expected growth rates.
The variability of financial results
Our ability to maintain and increase our revenues is affected not only by our success in implementing our Build and Buy strategy, but also by a number of other factors, including: our ability to introduce and deliver new services and products; a lengthened sales cycle; the cyclicality of purchases of technology services and products; the nature of a customer’s business; and the structure of agreements with customers. These, and other factors, make it difficult to predict financial results for any given period.
Business mix variations
The proportion of revenue that we generate from shorter-term systems integration and consulting (“SI&C”) projects, versus revenue from long-term outsourcing contracts, will fluctuate at times, affected by acquisitions or other transactions. An increased exposure to revenue from SI&C projects may result in greater quarterly revenue variations.
The financial and operational risks inherent in worldwide operations
We manage operations in numerous countries around the world. The scope of our operations subjects us to various issues that can negatively impact our operations: the fluctuations of currency (see foreign exchange risk); the burden of complying with a wide variety of national and local laws (see regulatory risk); the differences in and uncertainties arising from local business culture and practices; political, social and economic instability including the threats of terrorism, civil unrest, war, natural disasters and pandemic illnesses. Any or all of these risks could impact our global business operations and cause our profitability to decline.
Organizational challenges associated with our size
With the acquisition of Logica, our organization has doubled in size with expanded operations in both Europe and Asia. Our culture, standards, core values, and our policies need to be instilled across the newly acquired businesses as well as maintained within our existing operations. To effectively communicate and manage these standards throughout a large global organization is both challenging and time consuming. Newly acquired businesses may be resistant to change and may remain attached to past methods, standards and practices which may compromise our business agility in pursuing opportunities. Cultural differences in various countries may also present barriers to introducing new ideas or aligning our vision and strategy with the rest of the organization. If we cannot overcome these obstacles in maintaining a strategic bond throughout the company worldwide, we may not be able to achieve our growth and profitability objectives.
| CGI Group Inc. – Management’s Discussion and Analysis for the year ended September 30, 2012 | Page 43 of 48 |
Taxes
In estimating our income tax payable, management uses accounting principles to determine income tax positions that are likely to be sustained by applicable tax authorities. However, there is no assurance that our tax benefits or tax liability will not materially differ from our estimates or expectations. The tax legislation, regulation and interpretation that apply to our operations are continually changing. In addition, future tax benefits and liabilities are dependent on factors that are inherently uncertain and subject to change, including future earnings, future tax rates, and anticipated business mix in the various jurisdictions in which we operate. Moreover, our tax returns are continually subject to review by applicable tax authorities; it is these tax authorities that will make the final determination of the actual amounts of taxes payable or receivable, of any future tax benefits or liabilities and of income tax expense that we may ultimately recognize. Any of the above factors could have a material adverse effect on our net income or cash flows by affecting our operations and profitability, the availability of tax credits, the cost of the services we provide, and the availability of deductions for operating losses as we develop our international service delivery capabilities.
Credit risk with respect to accounts receivable
In order to sustain our cash flows and net earnings from operations, we must collect the amounts owed to us in an efficient and timely manner. Although we maintain provisions to account for anticipated shortfalls in amounts collected, the provisions we take are based on management estimates and on our assessment of our clients’ creditworthiness which may prove to be inadequate in the light of actual results. To the extent that we fail to perform our services in accordance with our contracts and our clients’ reasonable expectations, and to the extent that we fail to invoice clients for our services correctly in a timely manner, our collections could suffer resulting in a direct and adverse impact to our revenue, net earnings and cash flows. In addition, a prolonged economic downturn may cause clients to curtail or defer projects, impair their ability to pay for services already provided, and ultimately cause them to default on existing contracts, in each case, causing a shortfall in revenue and impairing our future prospects.
Material developments regarding major commercial clients resulting from such causes as changes in financial condition, mergers or business acquisitions
Consolidation among our clients resulting from mergers and acquisitions may result in loss or reduction of business when the successor business’ information technology needs are served by another service provider or are provided by the successor company’s own personnel. Growth in a client’s information technology needs resulting from acquisitions or operations may mean that we no longer have a sufficient geographic scope or the critical mass to serve the client’s needs efficiently, resulting in the loss of the client’s business and impairing our future prospects. There can be no assurance that we will be able to achieve the objectives of our growth strategy in order to maintain and increase our geographic scope and critical mass in our targeted markets.
Early termination risk
If we should fail to deliver our services according to contractual agreements, some of our clients could elect to terminate contracts before their agreed expiry date, which would result in a reduction of our earnings and cash flow and may impact the value of our backlog. In addition, a number of our outsourcing contractual agreements have termination for convenience and change of control clauses according to which a change in the client’s intentions or a change in control of CGI could lead to a termination of the said agreements. Early contract termination can also result from the exercise of a legal right or when circumstances that are beyond our control or beyond the control of our client prevent the contract from continuing. In cases of early termination, we may not be able to recover capitalized contract costs and we may not be able to eliminate ongoing costs incurred to support the contract.
| CGI Group Inc. – Management’s Discussion and Analysis for the year ended September 30, 2012 | Page 44 of 48 |
Cost estimation risks
In order to generate acceptable margins, our pricing for services is dependent on our ability to accurately estimate the costs and timing for completing projects or long-term outsourcing contracts. In addition, a significant portion of our project-oriented contracts are performed on a fixed-price basis. Billing for fixed-price engagements is carried out in accordance with the contract terms agreed upon with our client, and revenue is recognized based on the percentage of effort incurred to date in relation to the total estimated costs to be incurred over the duration of the respective contract. These estimates reflect our best judgment regarding the efficiencies of our methodologies and professionals as we plan to apply them to the contracts in accordance with the CGI Client Partnership Management Framework (“CPMF”), a process framework which helps ensure that all contracts are managed according to the same high standards throughout the organization. If we fail to apply the CPMF correctly or if we are unsuccessful in accurately estimating the time or resources required to fulfil our obligations under a contract, or if unexpected factors, including those outside of our control, arise, there may be an impact on costs or the delivery schedule which could have an adverse impact on our expected profit margins.
Risks related to teaming agreements and subcontracts
We derive substantial revenues from contracts where we enter into teaming agreements with other providers. In some teaming agreements we are the prime contractor whereas in others we act as a subcontractor. In both cases, we rely on our relationships with other providers to generate business and we expect to do so in the foreseeable future. Where we act as prime contractor, if we fail to maintain our relationships with other providers, we may have difficulty attracting suitable participants in our teaming agreements. Similarly, where we act as subcontractor, if our relationships are impaired, other providers might reduce the work they award to us, award that work to our competitors, or choose to offer the services directly to the client in order to compete with our business. In either case, our business, prospects, financial condition and operating results could be harmed.
Our partners’ ability to deliver on their commitments
Increasingly large and complex contracts may require that we rely on third party subcontractors including software and hardware vendors to help us fulfil our commitments. Under such circumstances, our success depends on the ability of the third parties to perform their obligations within agreed upon budgets and timeframes. If our partners fail to deliver, our ability to complete the contract may be adversely affected, which may have an unfavourable impact on our profitability.
Guarantees risk
In the normal course of business, we enter into agreements that may provide for indemnification and guarantees to counterparties in transactions such as consulting and outsourcing services, business divestitures, lease agreements and financial obligations. These indemnification undertakings and guarantees may require us to compensate counterparties for costs and losses incurred as a result of various events, including breaches of representations and warranties, intellectual property right infringement, claims that may arise while providing services or as a result of litigation that may be suffered by counterparties.
Risk related to human resources utilization rates
In order to maintain our profit margin, it is important that we maintain the appropriate availability of professional resources in each of our geographies by having a high utilization rate while still being able to assign additional resources to new work. Maintaining an efficient utilization rate requires us to forecast our need for professional resources accurately and to manage recruitment activities, professional training programs, attrition rates and restructuring programs appropriately. To the extent that we fail to do so, or to the extent that laws and regulations, particularly those in Europe, restrict our ability to do so, our utilization rates may be reduced; thereby having an impact on our revenue and profitability. Conversely, we may find that we do not have sufficient resources to deploy against new business opportunities in which case our ability to grow our revenue would suffer.
| CGI Group Inc. – Management’s Discussion and Analysis for the year ended September 30, 2012 | Page 45 of 48 |
Client concentration risk
We derive a significant portion of our revenue from the services we provide to the U.S. federal government and its agencies, and we expect that this will continue for the foreseeable future. In the event that a major U.S. federal government agency were to limit, reduce, or eliminate the business it awards to us, we might be unable to recover the lost revenue with work from other agencies or other clients, and our business, prospects, financial condition and operating results could be materially and adversely affected. Although IFRS considers a national government and its agencies as a single client, our client base in the U.S. government economic sector is in fact diversified with contracts from many different departments and agencies.
Government business risk
Changes in government spending policies or budget priorities could directly affect our financial performance. Among the factors that could harm our government contracting business are the curtailment of governments’ use of consulting and IT services firms; a significant decline in spending by governments in general, or by specific departments or agencies in particular; the adoption of new legislation and/or actions affecting companies that provide services to governments; delays in the payment of our invoices by government payment offices; and general economic and political conditions. These or other factors could cause government agencies and departments to reduce their purchases under contracts, to exercise their right to terminate contracts, to issue temporary stop work orders, or not to exercise options to renew contracts, any of which would cause us to lose future revenue. Government spending reductions or budget cutbacks at these departments or agencies could materially harm our continued performance under these contracts, or limit the awarding of additional contracts from these agencies.
Regulatory risk
Our global operations require us to be compliant with laws in many jurisdictions on matters such as: anticorruption, trade restrictions, immigration, taxation, securities regulation, anti-competition, data privacy and labour relations, amongst others. Complying with these diverse requirements worldwide is a challenge and consumes significant resources. Some of these laws may impose conflicting requirements; we may face the absence in some jurisdictions of effective laws to protect our intellectual property rights; there may be restrictions on the movement of cash and other assets; or restrictions on the import and export of certain technologies; or restrictions on the repatriation of earnings and reduce our earnings, all of which may expose us to penalties for non-compliance and harm our reputation.
Our business with the US federal government and its agencies requires that we comply with complex laws and regulations relating to government contracts. These laws relate to the integrity of the procurement process, impose disclosure requirements, and address national security concerns, among others matters. For instance, we are routinely subject to audits by U.S. government agencies with respect to compliance with these rules. If we fail to comply with these requirements we may incur penalties and sanctions, including contract termination, suspension of payments, suspension or debarment from doing business with the federal government, and fines.
Legal claims made against our work
We create, implement and maintain IT solutions that are often critical to the operations of our clients’ business. Our ability to complete large projects as expected could be adversely affected by unanticipated delays, renegotiations, and changing client requirements or project delays. Also, our solutions may suffer from defects that adversely affect their performance; they may not meet our clients’ requirements or may fail to perform in accordance with applicable service levels. Such
| CGI Group Inc. – Management’s Discussion and Analysis for the year ended September 30, 2012 | Page 46 of 48 |
problems could subject us to legal liability, which could adversely impact our business, operating results and financial condition, and may negatively affect our professional reputation. We typically include provisions in our contracts which are designed to limit our exposure to legal claims relating to our services and the applications we develop. These provisions may not protect us adequately or may not be enforceable under some circumstances or under the laws of some jurisdictions.
Information and infrastructure risks
Our business often requires that our clients’ applications and information, which may include their proprietary information, be processed and stored on our networks and systems, and in data centres that we manage. Digital information and equipment is subject to loss, theft or destruction, and services that we provide may become temporarily unavailable as a result thereof or upon an equipment or system malfunction. Failures can arise from human error in the course of normal operations, maintenance and upgrading activities, or from hacking, vandalism (including denial of service attacks and computer viruses), theft and unauthorized access by third parties, as well as from power outages or surges, floods, fires, natural disasters or from any other causes. The measures that we take to protect information and software, including both physical and logical controls on access to premises and information and backup systems may prove in some circumstances to be inadequate to prevent the loss, theft or destruction of client information or service interruptions. Such events may expose the Company to financial loss or damages.
Risk of harm to our reputation
CGI’s reputation as a capable and trustworthy service provider and long term business partner is key to our ability to compete effectively in the market for information technology services. The nature of our operations exposes us to the potential loss, unauthorized access to, or destruction of our clients’ information, as well as temporary service interruptions. Depending on the nature of the information or services, such events may have a negative impact on how the Company is perceived in the marketplace. Under such circumstances, our ability to obtain new clients and retain existing clients could suffer with a resulting impact on our revenue and profit.
Risks associated with the integration of new operations
The successful integration of new operations arising from our acquisition strategy or from large outsourcing contracts requires that a substantial amount of management time and attention be focused on integration tasks. Management time that is devoted to integration activities may detract from management’s normal operations focus with resulting pressure on the revenues and earnings from our existing operations. In addition, we may face complex and potentially time-consuming challenges in implementing the uniform standards, controls, procedures and policies across new operations to harmonize their activities with those of our existing business units. Integration activities can result in unanticipated operational problems, expenses and liabilities. If we are not successful in executing our integration strategies in a timely and cost-effective manner, we will have difficulty achieving our growth and profitability objectives.
Liquidity and funding risks
The Company’s future growth is contingent on the execution of its business strategy, which, in turn, is dependent on its ability to grow the business organically as well as conclude business acquisitions. By its nature, our growth strategy requires us to fund the investments required to be made using a mix of cash generated from our existing operations, money borrowed under our existing or future credit agreements, and equity funding generated by the issuance of shares of our capital stock to counterparties in transactions, or to the general public. Our ability to raise the required funding depends on the capacity of the capital markets to meet our financing needs in a timely fashion and on the basis of interest rates and share prices that are reasonable in the context of profitability objectives. Increasing interest rates, volatility in our share price, and the capacity of our current lenders to meet our liquidity requirements are all factors that may have an adverse impact on our access to the funding we require. If we are unable to obtain the necessary funding, we may be unable to achieve our growth objectives.
| CGI Group Inc. – Management’s Discussion and Analysis for the year ended September 30, 2012 | Page 47 of 48 |
Foreign exchange risk
The majority of our revenue and costs are denominated in currencies other than the Canadian dollar. Foreign exchange fluctuations impact the results of our operations as they are reported in Canadian dollars. This risk is partially mitigated by a natural hedge in matching our costs with revenue denominated in the same currency and through the use of derivatives in our worldwide hedging strategy. However, as we continue our global expansion, natural hedges may begin to diminish. Other than the use of financial products to deliver on our hedging strategy, we do not trade derivative financial instruments.
With our expanded presence in Europe, uncertainty regarding the ability of certain European countries to continue servicing their sovereign debt and related austerity measures may destabilize the euro. Similarly, given the scope of our U.S. operations, if the U.S. dollar continues to weaken against the Canadian dollar, our worldwide financial results may not reach expectations.
| 10.2. | LEGAL PROCEEDINGS |
The Company is involved in legal proceedings, audits, claims and litigation arising in the ordinary course of its business. Certain of these matters seek damages in significant amounts. Although, the outcome of such matters is not predictable with assurance, the Company has no reason to believe that the disposition of any such current matter could reasonably be expected to have a materially adverse impact on the Company’s financial position, results of operations or the ability to carry on any of its business activities.
Transfer Agent
Computershare Investor Services Inc.
(800) 564-6253
Investor Relations
Lorne Gorber
Senior Vice-President, Global Communications & Investor Relations
Telephone: (514) 841-3355
lorne.gorber@cgi.com
| CGI Group Inc. – Management’s Discussion and Analysis for the year ended September 30, 2012 | Page 48 of 48 |
Consolidated Financial Statements of
CGI GROUP INC.
For the years ended September 30, 2012 and 2011
Management’s and Auditors’ reports
MANAGEMENT’S STATEMENT OF RESPONSIBILITY FOR FINANCIAL REPORTING
The management of CGI Group Inc. (“the Company”) is responsible for the preparation and integrity of the consolidated financial statements and the Management’s Discussion and Analysis (“MD&A”). The consolidated financial statements have been prepared in accordance with International Financial Reporting Standards and necessarily include some amounts that are based on management’s best estimates and judgment. Financial and operating data elsewhere in the MD&A are consistent with that contained in the accompanying consolidated financial statements.
To fulfill its responsibility, management has developed, and continues to maintain, systems of internal controls reinforced by the Company’s standards of conduct and ethics, as set out in written policies to ensure the reliability of the financial information and to safeguard its assets. The Company’s internal control over financial reporting and consolidated financial statements are subject to audit by the independent auditors, Ernst & Young LLP, whose report follows. They were appointed as independent auditors, by a vote of the Company’s shareholders, to conduct an integrated audit of the Company’s consolidated financial statements and of the Company’s internal control over financial reporting. In addition, the Management Committee of the Company reviews the disclosure of corporate information and oversees the functioning of the Company’s disclosure controls and procedures.
Members of the Audit and Risk Management Committee of the Board of Directors, all of whom are independent of the Company, meet regularly with the independent auditors and with management to discuss internal controls in the financial reporting process, auditing matters and financial reporting issues and formulates the appropriate recommendations to the Board of Directors. The independent auditors have unrestricted access to the Audit and Risk Management Committee. The consolidated financial statements and MD&A have been reviewed and approved by the Board of Directors.
| (signed) | (signed) | |||
Michael E. Roach President and Chief Executive Officer | R. David Anderson Executive Vice-President and Chief Financial Officer | |||
| November 27, 2012 | ||||
| CGI Group Inc. – Consolidated Financial Statements for the years ended September 30, 2012 and 2011 | 81 |
MANAGEMENT REPORT ON INTERNAL CONTROL OVER FINANCIAL REPORTING
The management of the Company is responsible for establishing and maintaining adequate internal control over financial reporting. The Company’s internal control over financial reporting is a process designed to provide reasonable assurance regarding the reliability of financial reporting and the preparation of the Company’s consolidated financial statements for external reporting purposes in accordance with accounting principles generally accepted in Canada.
The Company’s internal control over financial reporting includes policies and procedures that:
| • | Pertain to the maintenance of records that, in reasonable detail, accurately and fairly reflect transactions and dispositions of the assets of the Company; |
| • | Provide reasonable assurance that transactions are recorded as necessary to permit preparation of consolidated financial statements in accordance with accounting principles generally accepted in Canada, and that receipts and expenditures are being made only in accordance with authorizations of management and the directors of the Company; and, |
| • | Provide reasonable assurance regarding prevention or timely detection of unauthorized acquisition, use or disposition of the Company’s assets that could have a material effect on the Company’s consolidated financial statements. |
All internal control systems have inherent limitations; therefore, even where internal control over financial reporting is determined to be effective, it can provide only reasonable assurance. Projections of any evaluation of effectiveness to future periods are subject to the risk that the controls may become inadequate because of changes in conditions, or that the degree of compliance with the policies or procedures may deteriorate.
We acquired Logica plc (“Logica”) on August 20, 2012. We excluded from our assessment the internal control over financial reporting of Logica. Logica’s results since the acquisition date are included in the September 30, 2012, consolidated financial statements of CGI and constituted approximately 58% of total assets as of September 30, 2012 (including intangible assets and goodwill), approximately 12% of revenue and a net loss of $259,981,000 for the year then ended. See Note 24 to the consolidated financial statements for a discussion of this acquisition.
As of the end of the Company’s 2012 fiscal year, management conducted an assessment of the effectiveness of the Company’s internal control over financial reporting based on the framework established in Internal Control – Integrated Framework issued by the Committee of Sponsoring Organizations of the Treadway Commission. Based on this assessment, management has determined the Company’s internal control over financial reporting as at September 30, 2012, was effective.
The effectiveness of the Company’s internal control over financial reporting as at September 30, 2012, has been audited by the Company’s independent auditors, as stated in their report appearing on page 3.
| (signed) | (signed) | |||
Michael E. Roach President and Chief Executive Officer | R. David Anderson Executive Vice-President and Chief Financial Officer | |||
| November 27, 2012 | ||||
| CGI Group Inc. – Consolidated Financial Statements for the years ended September 30, 2012 and 2011 | 82 |
REPORT OF INDEPENDENT REGISTERED PUBLIC ACCOUNTING FIRM ON INTERNAL CONTROL OVER FINANCIAL REPORTING
To the Board of Directors and Shareholders of CGI Group Inc.
We have audited CGI Group Inc.’s (the “Company”) internal control over financial reporting as of September 30, 2012, based on criteria establishedin Internal Control – Integrated Framework issued by the Committee of Sponsoring Organizations of the Treadway Commission (“the COSO criteria”). The Company’s management is responsible for maintaining effective internal control over financial reporting, and for its assessment of the effectiveness of internal control over financial reporting included in the accompanying Management’s Report on Internal Control over Financial Reporting. Our responsibility is to express an opinion on the Company’s internal control over financial reporting based on our audit.
We conducted our audit in accordance with the standards of the Public Company Accounting Oversight Board (United States). Those standards require that we plan and perform the audit to obtain reasonable assurance about whether effective internal control over financial reporting was maintained in all material respects. Our audit included obtaining an understanding of internal control over financial reporting, assessing the risk that a material weakness exists, testing and evaluating the design and operating effectiveness of internal control based on the assessed risk, and performing such other procedures as we considered necessary in the circumstances. We believe that our audit provides a reasonable basis for our opinion.
A company’s internal control over financial reporting is a process designed to provide reasonable assurance regarding the reliability of financial reporting and the preparation of financial statements for external purposes in accordance with generally accepted accounting principles. A company’s internal control over financial reporting includes those policies and procedures that (1) pertain to the maintenance of records, that in reasonable detail, accurately and fairly reflect the transactions and dispositions of the assets of the company; (2) provide reasonable assurance that transactions are recorded as necessary to permit preparation of financial statements in accordance with generally accepted accounting principles, and that receipts and expenditures of the company are being made only in accordance with authorizations of management and directors of the company; and (3) provide reasonable assurance regarding prevention or timely detection of unauthorized acquisition, use or disposition of the company’s assets that could have a material effect on the financial statements.
Because of its inherent limitations, internal control over financial reporting may not prevent or detect misstatements. Also, projections of any evaluation of effectiveness to future periods are subject to the risk that controls may become inadequate because of changes in conditions, or that the degree of compliance with the policies or procedures may deteriorate.
As indicated in the accompanying Management’s Report on Internal Control Over Financial Reporting, management’s assessment of and conclusion on the effectiveness of internal control over financial reporting did not include the internal controls of Logica plc, which is included in the 2012 consolidated financial statements of the Company, and constituted approximately 58% of total assets as of September 30, 2012 (including intangible assets and goodwill), approximately 12% of revenue, and a net loss of $259,981,000 for the year then ended. Our audit of internal control over financial reporting of CGI Group Inc. also did not include an evaluation of the internal control over financial reporting of Logica plc.
In our opinion, the Company maintained, in all material respects, effective internal control over financial reporting as of September 30, 2012 based on the COSO criteria.
We also have audited, in accordance with Canadian generally accepted auditing standards and the standards of the Public Company Accounting Oversight Board (United States), the consolidated financial statements of the Company as at and for the year ended September 30, 2012, and our report dated November 27, 2012 expressed an unqualified opinion thereon.
 |
| Ernst & Young LLP |
| Montréal, Canada |
| November 27, 2012 |
1. CPA auditor, CA, public accountancy permit No. 112431
| CGI Group Inc. – Consolidated Financial Statements for the years ended September 30, 2012 and 2011 | 83 |
REPORT OF INDEPENDENT REGISTERED PUBLIC ACCOUNTING FIRM ON FINANCIAL STATEMENTS
To the Board of Directors and Shareholders of CGI Group Inc.
We have audited the accompanying consolidated financial statements of CGI Group Inc. (the “Company”), which comprise the consolidated balance sheets as of September 30, 2012 and 2011, and October 1, 2010 and the consolidated statements of earnings, comprehensive income, changes in equity and cash flows for the years ended September 30, 2012 and 2011, and a summary of significant accounting policies and other explanatory information.
Management’s responsibility for the consolidated financial statements
Management is responsible for the preparation and fair presentation of these consolidated financial statements in accordance with International Financial Reporting Standards as issued by the International Accounting Standards Board, and for such internal control as management determines is necessary to enable the preparation of consolidated financial statements that are free from material misstatement, whether due to fraud or error.
Auditors’ responsibility
Our responsibility is to express an opinion on these consolidated financial statements based on our audits. We conducted our audits in accordance with Canadian generally accepted auditing standards and the standards of the Public Company Accounting Oversight Board (United States). Those standards require that we comply with ethical requirements and plan and perform the audit to obtain reasonable assurance about whether the consolidated financial statements are free from material misstatement.
An audit involves performing procedures to obtain audit evidence about the amounts and disclosures in the consolidated financial statements. The procedures selected depend on the auditors’ judgment, including the assessment of the risks of material misstatement of the consolidated financial statements, whether due to fraud or error. In making those risk assessments, the auditors consider internal control relevant to the entity’s preparation and fair presentation of the consolidated financial statements in order to design audit procedures that are appropriate in the circumstances. An audit also includes examining, on a test basis, evidence supporting the amounts and disclosures in the consolidated financial statements, evaluating the appropriateness of accounting policies used and the reasonableness of accounting estimates made by management, as well as evaluating the overall presentation of the consolidated financial statements.
We believe that the audit evidence we have obtained in our audits is sufficient and appropriate to provide a basis for our audit opinion.
Opinion
In our opinion, the consolidated financial statements present fairly, in all material respects, the financial position of the Company as at September 30, 2012 and 2011, and October 1, 2010 and its financial performance and its cash flows for the years ended September 30, 2012 and 2011 in accordance with International Financial Reporting Standards as issued by the International Accounting Standards Board.
| CGI Group Inc. – Consolidated Financial Statements for the years ended September 30, 2012 and 2011 | 84 |
Other matter
We have also audited, in accordance with the standards of the Public Company Accounting Oversight Board (United States), CGI Group Inc.’s internal control over financial reporting as of September 30, 2012, based on the criteria established inInternal Control – Integrated Framework issued by the Committee of Sponsoring Organizations of the Treadway Commission and our report dated November 27, 2012 expressed an unqualified opinion on the Company’s internal control over financial reporting.
|
| Ernst & Young LLP |
| Montréal, Canada |
| November 27, 2012 |
1. CPA auditor, CA, public accountancy permit No. 112431
| CGI Group Inc. – Consolidated Financial Statements for the years ended September 30, 2012 and 2011 | 85 |
Consolidated Statements of Earnings
For the years ended September 30
(in thousands of Canadian dollars, except share data)
| 2012 | 2011 | |||||||
| $ | $ | |||||||
Revenue | 4,772,454 | 4,223,942 | ||||||
|
|
|
| |||||
Operating expenses | ||||||||
Costs of services, selling and administrative (Note 19) | 4,226,859 | 3,690,960 | ||||||
Acquisition-related and integration costs (Note 24) | 254,973 | 3,675 | ||||||
Finance costs (Note 21) | 42,099 | 19,395 | ||||||
Finance income | (5,318 | ) | (3,552 | ) | ||||
Other income | (3,955 | ) | (7,647 | ) | ||||
Foreign exchange gain | (1,134 | ) | (3,365 | ) | ||||
Share of profit on joint venture | (3,996 | ) | (13,359 | ) | ||||
|
|
|
| |||||
| 4,509,528 | 3,686,107 | |||||||
|
|
|
| |||||
Earnings before income taxes | 262,926 | 537,835 | ||||||
Income tax expense (Note 23) | 131,397 | 99,696 | ||||||
|
|
|
| |||||
Net earnings | 131,529 | 438,139 | ||||||
|
|
|
| |||||
Earnings per share (Note 17) | ||||||||
Basic earnings per share | 0.50 | 1.65 | ||||||
Diluted earnings per share | 0.48 | 1.59 | ||||||
|
|
|
| |||||
See Notes to the consolidated financial statements.
| CGI Group Inc. – Consolidated Financial Statements for the years ended September 30, 2012 and 2011 | 86 |
Consolidated Statements of Comprehensive Income
For the years ended September 30
(in thousands of Canadian dollars)
| 2012 | 2011 | |||||||
| $ | $ | |||||||
Net earnings | 131,529 | 438,139 | ||||||
|
|
|
| |||||
Net unrealized (losses) gains on translating financial statements of foreign operations (net of income taxes) | (20,195 | ) | 12,275 | |||||
Net unrealized gains (losses) on translating financial instruments designated as hedges of net investments in foreign operations (net of income taxes) | 10,766 | (4,695 | ) | |||||
Net unrealized losses on cash flow hedges (net of income taxes) | (11,615 | ) | (9,197 | ) | ||||
Net unrealized actuarial gains (losses) (net of income taxes) | 5,210 | (632 | ) | |||||
Net unrealized gains on investments available for sale (net of income taxes) | 987 | 2,352 | ||||||
|
|
|
| |||||
Other comprehensive (losses) gains | (14,847 | ) | 103 | |||||
|
|
|
| |||||
Comprehensive income | 116,682 | 438,242 | ||||||
|
|
|
| |||||
See Notes to the consolidated financial statements.
| CGI Group Inc. – Consolidated Financial Statements for the years ended September 30, 2012 and 2011 | 87 |
Consolidated Balance Sheets
(in thousands of Canadian dollars)
| As at September 30, 2012 | As at September 30, 2011 | As at October 1, 2010 | ||||||||||
| $ | $ | $ | ||||||||||
Assets | ||||||||||||
Current assets | ||||||||||||
Cash and cash equivalents (Note 4) | 113,103 | 136,211 | 108,529 | |||||||||
Short-term investments | 14,459 | 10,166 | 13,196 | |||||||||
Accounts receivable (Note 5) | 1,446,149 | 490,484 | 426,241 | |||||||||
Work in progress | 744,482 | 391,066 | 357,666 | |||||||||
Prepaid expenses and other current assets | 244,805 | 100,407 | 69,198 | |||||||||
Income taxes | 24,650 | 4,252 | 7,169 | |||||||||
|
|
|
|
|
| |||||||
Total current assets before funds held for clients | 2,587,648 | 1,132,586 | 981,999 | |||||||||
Funds held for clients (Note 6) | 202,407 | 247,622 | 248,695 | |||||||||
|
|
|
|
|
| |||||||
Total current assets | 2,790,055 | 1,380,208 | 1,230,694 | |||||||||
Property, plant and equipment (Note 7) | 500,995 | 249,901 | 236,632 | |||||||||
Contract costs (Note 8) | 167,742 | 107,242 | 133,109 | |||||||||
Intangible assets (Note 9) | 858,892 | 292,133 | 369,036 | |||||||||
Other long-term assets (Note 10) | 96,351 | 55,593 | 41,623 | |||||||||
Deferred tax assets (Note 23) | 219,590 | 9,882 | 22,888 | |||||||||
Investment in joint venture | — | 26,373 | 22,814 | |||||||||
Goodwill (Note 11) | 5,819,817 | 2,536,022 | 2,525,413 | |||||||||
|
|
|
|
|
| |||||||
| 10,453,442 | 4,657,354 | 4,582,209 | ||||||||||
|
|
|
|
|
| |||||||
Liabilities | ||||||||||||
Current liabilities | ||||||||||||
Bank overdraft (Note 4) | — | 75,538 | — | |||||||||
Accounts payable and accrued liabilities | 1,156,737 | 303,641 | 297,801 | |||||||||
Accrued compensation | 539,779 | 183,842 | 185,651 | |||||||||
Deferred revenue | 443,596 | 152,938 | 143,302 | |||||||||
Income taxes | 177,030 | 51,822 | 85,534 | |||||||||
Provisions (Note 12) | 160,625 | 12,125 | 10,998 | |||||||||
Current portion of long-term debt (Note 14) | 52,347 | 896,012 | 114,577 | |||||||||
|
|
|
|
|
| |||||||
Total current liabilities before clients’ funds obligations | 2,530,114 | 1,675,918 | 837,863 | |||||||||
Clients’ funds obligations | 197,986 | 244,660 | 248,695 | |||||||||
|
|
|
|
|
| |||||||
Total current liabilities | 2,728,100 | 1,920,578 | 1,086,558 | |||||||||
Deferred tax liabilities (Note 23) | 171,130 | 149,394 | 188,860 | |||||||||
Long-term provisions (Note 12) | 216,507 | 27,672 | 9,265 | |||||||||
Long-term debt (Note 14) | 3,196,061 | 109,669 | 1,039,299 | |||||||||
Retirement benefits obligations (Note 29) | 118,078 | 7,035 | 6,228 | |||||||||
Other long-term liabilities (Note 13) | 601,232 | 93,775 | 102,764 | |||||||||
|
|
|
|
|
| |||||||
| 7,031,108 | 2,308,123 | 2,432,974 | ||||||||||
|
|
|
|
|
| |||||||
Equity | ||||||||||||
Retained earnings | 1,113,225 | 1,057,599 | 845,290 | |||||||||
Accumulated other comprehensive (loss) income (Note 22) | (275 | ) | 14,572 | 14,469 | ||||||||
Capital stock (Note 15) | 2,201,694 | 1,178,559 | 1,195,069 | |||||||||
Contributed surplus | 107,690 | 98,501 | 94,407 | |||||||||
|
|
|
|
|
| |||||||
| 3,422,334 | 2,349,231 | 2,149,235 | ||||||||||
|
|
|
|
|
| |||||||
| 10,453,442 | 4,657,354 | 4,582,209 | ||||||||||
|
|
|
|
|
| |||||||
See Notes to the consolidated financial statements.
| Approved by the Board | (signed) | (signed) | ||
| Michael E. Roach | Serge Godin | |||
| Director | Director |
| CGI Group Inc. – Consolidated Financial Statements for the years ended September 30, 2012 and 2011 | 88 |
Consolidated Statements of Changes in Equity
For the years ended September 30
(in thousands of Canadian dollars)
| Retained earnings | Accumulated other comprehensive (loss) income | Capital stock | Contributed surplus | Total equity | ||||||||||||||||
| $ | $ | $ | $ | $ | ||||||||||||||||
Balance as at September 30, 2011 | 1,057,599 | 14,572 | 1,178,559 | 98,501 | 2,349,231 | |||||||||||||||
Net earnings for the year | 131,529 | — | — | — | 131,529 | |||||||||||||||
Other comprehensive loss for the year | — | (14,847 | ) | — | — | (14,847 | ) | |||||||||||||
|
|
|
|
|
|
|
|
|
| |||||||||||
| 1,189,128 | (275 | ) | 1,178,559 | 98,501 | 2,465,913 | |||||||||||||||
Share-based payment costs (Note 16c)) | — | — | — | 12,520 | 12,520 | |||||||||||||||
Income tax impact associated with stock options | — | — | — | 12,626 | 12,626 | |||||||||||||||
Issuance of Class A subordinate shares, net of transaction costs (Note 15) | — | — | 999,178 | — | 999,178 | |||||||||||||||
Exercise of stock options (Note 15) | — | — | 64,033 | (16,010 | ) | 48,023 | ||||||||||||||
Repurchase of Class A subordinate shares (Note 15) | (75,903 | ) | — | (26,942 | ) | — | (102,845 | ) | ||||||||||||
Purchase of Class A subordinate shares held in trust (Note 15) | — | — | (14,252 | ) | — | (14,252 | ) | |||||||||||||
Sale of Class A subordinate shares held in trust (Note 15) | — | — | 1,118 | 53 | 1,171 | |||||||||||||||
|
|
|
|
|
|
|
|
|
| |||||||||||
Balance as at September 30, 2012 | 1,113,225 | (275 | ) | 2,201,694 | 107,690 | 3,422,334 | ||||||||||||||
|
|
|
|
|
|
|
|
|
| |||||||||||
| Retained earnings | Accumulated other comprehensive income | Capital stock | Contributed surplus | Total equity | ||||||||||||||||
| $ | $ | $ | $ | $ | ||||||||||||||||
Balance as at October 1, 2010 | 845,290 | 14,469 | 1,195,069 | 94,407 | 2,149,235 | |||||||||||||||
Net earnings for the year | 438,139 | — | — | — | 438,139 | |||||||||||||||
Other comprehensive income for the year | — | 103 | — | — | 103 | |||||||||||||||
|
|
|
|
|
|
|
|
|
| |||||||||||
| 1,283,429 | 14,572 | 1,195,069 | 94,407 | 2,587,477 | ||||||||||||||||
Share-based payment costs (Note 16c)) | — | — | — | 16,645 | 16,645 | |||||||||||||||
Income tax impact associated with stock options | — | — | — | 1,790 | 1,790 | |||||||||||||||
Exercise of stock options (Note 15) | — | — | 66,065 | (14,341 | ) | 51,724 | ||||||||||||||
Repurchase of Class A subordinate shares (Note 15) | (225,019 | ) | — | (80,009 | ) | — | (305,028 | ) | ||||||||||||
Purchase of Class A subordinate shares held in trust (Note 15) | — | — | (2,566 | ) | — | (2,566 | ) | |||||||||||||
Change in subsidiary investment | (811 | ) | — | — | — | (811 | ) | |||||||||||||
|
|
|
|
|
|
|
|
|
| |||||||||||
Balance as at September 30, 2011 | 1,057,599 | 14,572 | 1,178,559 | 98,501 | 2,349,231 | |||||||||||||||
|
|
|
|
|
|
|
|
|
| |||||||||||
See Notes to the consolidated financial statements.
| CGI Group Inc. – Consolidated Financial Statements for the years ended September 30, 2012 and 2011 | 89 |
Consolidated Statements of Cash Flows
For the years ended September 30
(tabular amounts only are in thousands of Canadian dollars)
| 2012 | 2011 | |||||||
| $ | $ | |||||||
Operating activities | ||||||||
Net earnings | 131,529 | 438,139 | ||||||
Adjustments for: | ||||||||
Amortization and depreciation (Note 20) | 231,398 | 223,354 | ||||||
Deferred income taxes (Note 23) | (22,306 | ) | (22,423 | ) | ||||
Foreign exchange loss | 158 | (1,201 | ) | |||||
Share-based payment costs (Note 16c)) | 12,520 | 16,645 | ||||||
Gain on sale of business (Note 24) | — | (3,655 | ) | |||||
Gain on sale of investment in joint venture (Note 25) | (2,981 | ) | — | |||||
Share of profit on joint venture | (3,996 | ) | (13,359 | ) | ||||
Loss on repayment of debt assumed in business acquisition (Note 24) | 83,632 | — | ||||||
Dividend received from joint venture | 7,350 | 9,800 | ||||||
Net change in non-cash working capital items (Note 26) | 175,958 | (77,298 | ) | |||||
|
|
|
| |||||
Cash provided by operating activities | 613,262 | 570,002 | ||||||
|
|
|
| |||||
Investing activities | ||||||||
Net change in short-term investments | (5,203 | ) | 1,984 | |||||
Business acquisition (including bank overdraft assumed) (Note 24) | (2,734,795 | ) | (618 | ) | ||||
Purchase of call options related to proposed acquisition (Note 24) | (7,146 | ) | — | |||||
Proceeds from sale of investment in joint venture (Note 25) | 26,000 | — | ||||||
Proceeds from sale of business (Note 24) | 4,583 | 4,104 | ||||||
Purchase of property, plant and equipment | (64,555 | ) | (64,980 | ) | ||||
Additions to contract costs | (25,325 | ) | (27,897 | ) | ||||
Additions to intangible assets | (43,658 | ) | (26,893 | ) | ||||
Additions to other long-term assets | (2,208 | ) | (2,510 | ) | ||||
Purchase of long-term investments | (976 | ) | (14,204 | ) | ||||
Payment received from long-term receivable | 4,249 | — | ||||||
|
|
|
| |||||
Cash used in investing activities | (2,849,034 | ) | (131,014 | ) | ||||
|
|
|
| |||||
Financing activities | ||||||||
Net change in credit facilities | (158,618 | ) | (104,278 | ) | ||||
Increase of long-term debt | 2,416,781 | — | ||||||
Repayment of long-term debt | (62,817 | ) | (129,741 | ) | ||||
Repayment of debt assumed in business acquisition (Note 24) | (891,354 | ) | — | |||||
Settlement of forward contracts | 50,171 | (1,275 | ) | |||||
Purchase of Class A subordinate shares held in trust (Note 15) | (14,252 | ) | (2,566 | ) | ||||
Sale of Class A subordinate shares held in a trust (Note 15) | 1,171 | — | ||||||
Repurchase of Class A subordinate shares (Note 15) | (102,845 | ) | (305,028 | ) | ||||
Issuance of Class A subordinate shares, net of transaction costs | 1,047,243 | 52,091 | ||||||
Change in subsidiary investment | — | (811 | ) | |||||
|
|
|
| |||||
Cash provided by (used in) financing activities | 2,285,480 | (491,608 | ) | |||||
|
|
|
| |||||
Effect of foreign exchange rate changes on cash and cash equivalents | 2,722 | 4,764 | ||||||
|
|
|
| |||||
Net increase (decrease) in cash and cash equivalents net of bank overdraft | 52,430 | (47,856 | ) | |||||
Cash and cash equivalents net of bank overdraft, beginning of period | 60,673 | 108,529 | ||||||
|
|
|
| |||||
Cash and cash equivalents net of bank overdraft, end of period (Note 4) | 113,103 | 60,673 | ||||||
|
|
|
| |||||
Supplementary cash flow information (Note 26)
See Notes to the consolidated financial statements.
| CGI Group Inc. – Consolidated Financial Statements for the years ended September 30, 2012 and 2011 | 90 |
Notes to the Consolidated Financial Statements
For the years ended September 30, 2012 and 2011
(tabular amounts only are in thousands of Canadian dollars, except share data)
| 1. | Description of business |
CGI Group Inc. (the “Company”), directly or through its subsidiaries, manages information technology services (“IT services”) as well as business process services (“BPS”) to help clients effectively realize their strategies and create added value. The Company’s services include the management of IT and business processes (“outsourcing”), systems integration and consulting including the sale of software licenses. The Company was incorporated under Part IA of the Companies Act (Québec) predecessor to the Business Corporations Act (Québec) which came into force on February 14, 2011 and its shares are publicly traded. The executive and registered office of the Company is situated at 1350, René-Lévesque Blvd. West, Montréal, Québec, Canada, H3G 1T4.
| 2. | Basis of preparation |
These consolidated financial statements represent the Company’s first annual financial statements prepared in accordance with International Financial Reporting Standards (“IFRS”) and IFRS 1, “First-time Adoption of International Financial Reporting Standards”, as issued by the International Accounting Standards Board (“IASB”). In addition, the consolidated financial statements have been prepared in accordance with the accounting policies set out in Note 3, “Summary of significant accounting policies”, which are based on IFRS and International Financial Reporting Interpretations Committee (“IFRIC”) interpretations. The accounting policies were consistently applied to all periods presented.
The first date at which IFRS was applied was October 1, 2010. The consolidated financial statements were previously prepared in accordance with Canadian generally accepted accounting principles (“Canadian GAAP”). However, Canadian GAAP differs in some areas from IFRS. The comparative figures presented were adjusted to reflect these adjustments. Reconciliations and descriptions of the effect of the transition from Canadian GAAP to IFRS on consolidated equity, earnings, comprehensive income, cash flows and balance sheets are provided in Note 33, “Transition to IFRS”.
The Company’s consolidated financial statements for the years ended September 30, 2012 and 2011 were authorized for issue by the Board of Directors on November 27, 2012.
| 3. | Summary of significant accounting policies |
BASIS OF CONSOLIDATION
The consolidated financial statements include the accounts of the Company and its subsidiaries. All intercompany transactions and balances have been eliminated. The Company accounts for its jointly-controlled investments using the equity method.
BASIS OF MEASUREMENT
The consolidated financial statements have been prepared on a historical cost basis, except for certain financial assets and liabilities, which have been measured at fair value as described below.
| CGI Group Inc. – Consolidated Financial Statements for the years ended September 30, 2012 and 2011 | 91 |
Notes to the Consolidated Financial Statements
For the years ended September 30, 2012 and 2011
(tabular amounts only are in thousands of Canadian dollars, except share data)
| 3. | Summary of significant accounting policies (continued) |
USE OF ESTIMATES AND JUDGEMENTS
The preparation of the consolidated financial statements requires management to make estimates and judgements that affect the reported amounts of assets, liabilities and equity and disclosure of contingent assets and liabilities at the date of the consolidated financial statements and the reported amounts of revenue and expenses during the reporting period. Because of the use of estimates and judgements inherent in the financial reporting process, actual results could differ. Significant estimates and judgements include purchase price allocation of business combinations, income taxes, contingencies and provisions, revenue recognition (including provisions for estimated contract losses), share-based payments, investment tax credits and other government programs, defined benefits plan obligations and retirement benefits assets, impairment of property, plant and equipment, intangible assets and goodwill. A description of the significant estimates and judgements is included in the respective sections within the notes to the consolidated financial statements.
REVENUE RECOGNITION, WORK IN PROGRESS AND DEFERRED REVENUE
The Company generates revenue principally through the provision of IT services and BPS as described in Note 1.
The Company provides services and products under arrangements that contain various pricing mechanisms. The Company recognizes revenue when the following criteria are met: there is clear evidence that an arrangement exists, the amount of revenue and related costs can be measured reliably, it is probable that future economic benefits will flow to the Company, the stage of completion can be measured reliably where services are delivered and the significant risks and rewards of ownership, including effective control, are transferred to clients where products are sold. Revenue is measured at the fair value of the consideration received or receivable net of discounts, volume rebates and sales related taxes.
Some of the Company’s arrangements may include client acceptance clauses. Each clause is analyzed to determine whether the earnings process is complete when the service is performed. Formal client sign-off is not always necessary to recognize revenue provided that the Company objectively demonstrates that the criteria specified in the acceptance provisions are satisfied. Some of the criteria reviewed include historical experience with similar types of arrangements, whether the acceptance provisions are specific to the client or are included in all arrangements, the length of the acceptance term and historical experience with the specific client.
Revenue from benefits-funded arrangements is recognized only to the extent that it is probable that the benefit stream associated with the transaction will generate amounts sufficient to fund the value on which revenue recognition is based.
Revenue from sales of third party vendor products, such as software licenses and hardware, or services is recorded gross when the Company is a principal to the transaction and is recorded net of costs when the Company is acting as an agent between the client and vendor. Factors generally considered to determine whether the Company is a principal or an agent are if the Company is the primary obligor to the client, if it adds meaningful value to the vendor’s product or service or if it assumes delivery and credit risks.
Estimated losses on revenue-generating contracts are recognized in the period when it is determined that a loss is probable. They are presented in accounts payable and accrued liabilities and in other long-term liabilities. Contract losses are measured at the amount by which the estimated total costs exceed the estimated total revenue from the contract.
| CGI Group Inc. – Consolidated Financial Statements for the years ended September 30, 2012 and 2011 | 92 |
Notes to the Consolidated Financial Statements
For the years ended September 30, 2012 and 2011
(tabular amounts only are in thousands of Canadian dollars, except share data)
| 3. | Summary of significant accounting policies (continued) |
REVENUE RECOGNITION, WORK IN PROGRESS AND DEFERRED REVENUE (CONTINUED)
Multiple component arrangements
The Company’s arrangements often include a mix of the services and products listed below. If an arrangement involves the provision of multiple components, the total arrangement value is allocated to each separately identifiable component based on its relative selling price. A component is considered to be separately identifiable if it has value to the client on a stand-alone basis. Assessing whether an arrangement involving the provision of multiple components has separately identifiable components requires judgement by management. When estimating selling price, the Company maximizes the use of observable prices which are established using the Company’s prices for same or similar components. When observable prices are not available, the Company estimates selling prices based on its best estimate of selling price. The best estimate of selling price is the price at which the Company would normally expect to offer the services or products and is established by considering a number of internal and external factors including, but not limited to, geographies, the Company’s pricing policies, internal costs and margins. The appropriate revenue recognition method is applied for each separately identifiable component as described below.
Outsourcing
Revenue from outsourcing and BPS arrangements is generally recognized as the services are provided at the contractually stated price, unless there is a better measure of performance or delivery.
Systems integration and consulting services
Revenue from systems integration and consulting services under time and material arrangements is recognized as the services are rendered, and revenue under cost-based arrangements is recognized as reimbursable costs are incurred.
Revenue from systems integration and consulting services under fixed-fee arrangements where the outcome of the arrangements can be estimated reliably is recognized using the percentage-of-completion method over the service periods. The Company uses the labour costs or labour hours to measure the progress towards completion. This method relies on estimates of total expected labour costs or total expected labour hours to complete the service, which are compared to labour costs or labour hours incurred to date, to arrive at an estimate of the percentage of revenue earned to date. Management regularly reviews underlying estimates of total expected labour costs or hours. Revisions to estimates due to volume variations, changes in technology and other factors which may not be foreseen at inception are reflected in the consolidated statements of earnings in the period in which the facts that gave rise to the revision become known. If the outcome of an arrangement cannot be estimated reliably, revenue is recognized to the extent of arrangement costs incurred that are likely to be recoverable.
Software licenses
Most of the Company’s software license arrangements include other services such as implementation, customization and maintenance. For these types of arrangements, revenue from a software license is recognized upon delivery if it has been identified as a separately identifiable component. Otherwise, it is combined with the implementation and customization services and is accounted for as described in “Systems integration and consulting services” above. Revenue from maintenance services for software licenses sold and implemented is recognized ratably over the term of the maintenance period.
| CGI Group Inc. – Consolidated Financial Statements for the years ended September 30, 2012 and 2011 | 93 |
Notes to the Consolidated Financial Statements
For the years ended September 30, 2012 and 2011
(tabular amounts only are in thousands of Canadian dollars, except share data)
| 3. | Summary of significant accounting policies (continued) |
REVENUE RECOGNITION, WORK IN PROGRESS AND DEFERRED REVENUE (CONTINUED)
Work in progress and deferred revenue
Amounts recognized as revenue in excess of billings are classified as work in progress. Amounts received in advance of the delivery of products or performance of services are classified as deferred revenue.
CASH AND CASH EQUIVALENTS
Cash and cash equivalents consist of unrestricted cash and short-term investments having an initial maturity of three months or less.
SHORT-TERM INVESTMENTS
Short-term investments, comprised generally of term deposits, have remaining maturities over three months, but not more than one year, at the date of purchase.
FUNDS HELD FOR CLIENTS AND CLIENTS’ FUNDS OBLIGATIONS
In connection with the Company’s payroll, tax filing and claims services, the Company collects funds for payment of payroll, taxes and claims, temporarily holds such funds until payment is due, remits the funds to the clients’ employees, appropriate tax authorities or claim holders, files federal and local tax returns and handles related regulatory correspondence and amendments. The funds held for clients include short-term and long-term bonds and cash. The Company presents the funds held for clients and related obligations separately. Funds held for clients are classified as current assets since, based upon management’s intentions, these funds are held solely for the purpose of satisfying the clients’ funds obligations, which will be repaid within one year of the consolidated balance sheet date.
Interest income earned and realized gains and losses on the disposal of bonds are recorded in revenue in the period that the income is earned, since the collecting, holding and remitting of these funds are critical components of providing these services.
PROPERTY, PLANT AND EQUIPMENT (“PP&E”)
PP&E, including those items under finance leases, are recorded at cost and are depreciated over their estimated useful lives using the straight-line method.
| Land and buildings | 10 to 40 years | |
| Leasehold improvements | Lesser of the useful life or lease term | |
| Furniture, fixtures and equipment | 3 to 20 years | |
| Computer equipment | 3 to 5 years |
BORROWING COSTS
Borrowing costs directly attributable to the acquisition, construction or development of a qualifying asset are capitalized as part of the cost of the respective asset. A qualifying asset is an asset that necessarily takes a substantial period of time to get ready for its intended use or sale. All other borrowing costs are expensed in the period they occur.
| CGI Group Inc. – Consolidated Financial Statements for the years ended September 30, 2012 and 2011 | 94 |
Notes to the Consolidated Financial Statements
For the years ended September 30, 2012 and 2011
(tabular amounts only are in thousands of Canadian dollars, except share data)
| 3. | Summary of significant accounting policies (continued) |
CONTRACT COSTS
Contract costs are mainly incurred when acquiring or implementing long-term outsourcing contracts. Contract costs are comprised primarily of incentives and transition costs and are recorded at cost.
Incentives
Occasionally, incentives are granted to clients upon the signing of outsourcing contracts. These incentives are primarily granted either in the form of cash payments (including the excess of the amount paid over the fair value of PP&E or intangible assets acquired from client in connection with the outsourcing contract) or as an issuance of equity instruments. In the case of equity instruments, cost is measured at the estimated fair value at the time they are issued.
Transition costs
Transition costs consist of costs associated with the installation of systems and processes incurred after the award of outsourcing contracts, relocation of transitioned employees and exit from client facilities. Under BPS contracts, the costs consist primarily of costs related to activities such as the conversion of the client’s applications to the Company’s platforms. These costs are comprised essentially of labour costs, including compensation and related fringe benefits, as well as subcontractor costs.
Pre-contract costs
Pre-contract costs associated with acquiring or implementing long-term outsourcing contracts are expensed as incurred except where it is virtually certain that the contracts will be awarded and the costs are directly related to the acquisition of the contract.
Amortization of contract costs
Contract costs are amortized as services are provided. Amortization of transition costs and pre-contract costs is included in costs of services, selling and administrative and amortization of incentives is recorded as a reduction of revenue.
Impairment of contract costs
When a contract is not expected to be profitable, the expected loss is first applied to impair the related contract costs, with the excess recorded as a provision and presented in other long-term liabilities. At a future date if the contract returns to profitability, the previously recognized impairment loss must be reversed. The reversal of the impairment loss is limited so that the carrying amount does not exceed its recoverable amount, nor exceed the carrying amount that would have been determined, net of amortization, had no impairment loss been recognized for the contract costs in prior years.
INTANGIBLE ASSETS
Intangible assets consist mainly of internal-use software, business solutions, software licenses and client relationships. Internal-use software, business solutions and software licenses are recorded at cost. Business solutions developed internally and marketed are capitalized when they meet specific capitalization criteria related to technical, market and financial feasibility. Business solutions, software licenses and client relationships acquired through business combinations are initially recorded at their fair value based on the present value of expected future cash flows, which involve making estimates about the future cash flows, as well as discount rates.
Amortization of intangible assets
The Company amortizes its intangible assets using the straight-line method over the following estimated useful lives:
| Internal-use software | 2 to 7 years | |
| Business solutions | 2 to 10 years | |
| Software licenses | 3 to 8 years | |
| Client relationships and other | 2 to 10 years |
| CGI Group Inc. – Consolidated Financial Statements for the years ended September 30, 2012 and 2011 | 95 |
Notes to the Consolidated Financial Statements
For the years ended September 30, 2012 and 2011
(tabular amounts only are in thousands of Canadian dollars, except share data)
| 3. | Summary of significant accounting policies (continued) |
IMPAIRMENT OF PP&E, INTANGIBLE ASSETS AND GOODWILL
Timing of impairment testing
The carrying values of PP&E, intangible assets and goodwill are reviewed for impairment when events or changes in circumstances indicate that the carrying value may be impaired. The Company assesses at each reporting date whether any such events or changes in circumstances exist. The carrying values of PP&E and intangible assets not available for use and goodwill are tested for impairment annually as at September 30.
Impairment testing
If any indication of impairment exists or when annual impairment testing for an asset is required, the Company estimates the recoverable amount of the asset or cash-generating unit (“CGU”) to which the asset relates to determine the extent of any impairment loss. The recoverable amount is the higher of an asset’s or CGU’s fair value less costs to sell and its value in use (“VIU”) to the Company. The Company generally uses the VIU. In assessing VIU, estimated future cash flows are discounted to their present value using a discount rate that reflects current market assessments of the time value of money and the risks specific to the asset or CGU. In determining fair value less costs to sell, recent market transactions are taken into account, if available. If the recoverable amount of an asset or a CGU is estimated to be less than its carrying amount, the carrying amount is reduced to its recoverable amount. An impairment loss is recognized immediately in the consolidated statements of earnings.
For goodwill impairment testing purposes, the CGU that represents the lowest level within the Company at which management monitors goodwill is the operating segment level (Note 27). Goodwill acquired through business combinations is allocated to the CGU that is expected to benefit from synergies of the related business combination.
The VIU calculation for the recoverable amount of the CGUs to which goodwill has been allocated includes estimates about their future financial performance over a period of five years. Key assumptions used in the VIU calculations are the discount rate applied and the long-term growth rate of net operating cash flows. In determining these assumptions, management has taken into consideration the current economic climate and its resulting impact on expected growth and discount rates. In determining the discount rate applied to a CGU, management uses the Company’s weighted average cost of capital as a starting point and applies adjustments to take into account specific tax rates, geographical risk and any additional risks specific to the CGU. The cash flow projections reflect management’s expectations of the operating performance of the CGU and growth prospects in the CGU’s market.
For impaired assets, excluding goodwill, an assessment is made at each reporting date as to whether there is any indication that previously recognized impairment losses may no longer exist or may have decreased. If such indication exists, the Company estimates the asset’s recoverable amount. A previously recognized impairment loss is reversed only if there has been a change in the assumptions used to determine the asset’s recoverable amount since the last impairment loss was recognized. The reversal is limited so that the carrying amount of the asset does not exceed its recoverable amount, nor exceed the carrying amount that would have been determined, net of amortization, had no impairment loss been recognized for the asset in prior years. Such reversal is recognized in the consolidated statements of earnings. Impairment losses relating to goodwill cannot be reversed in future periods.
| CGI Group Inc. – Consolidated Financial Statements for the years ended September 30, 2012 and 2011 | 96 |
Notes to the Consolidated Financial Statements
For the years ended September 30, 2012 and 2011
(tabular amounts only are in thousands of Canadian dollars, except share data)
| 3. | Summary of significant accounting policies (continued) |
OTHER LONG-TERM ASSETS
Other long-term assets consist mainly of insurance contracts held to fund defined benefit pension and life assurance arrangements, deferred compensation plan assets, long-term investments, retirement benefits assets, long-term receivables, deferred financing fees, long-term maintenance agreements and forward contracts. Long-term investments, comprised of bonds, are classified as long-term based on management’s intentions.
BUSINESS COMBINATIONS
The Company accounts for its business combinations using the acquisition method. Under this method the consideration transferred is measured at fair value. Acquisition-related and integration costs associated with the business combination are expensed as incurred. The Company recognizes goodwill as of the acquisition date as the excess of the cost of the acquisition over the net identifiable assets acquired and liabilities assumed at their acquisition-date fair values. The determination of fair value involves making estimates relating to acquired intangible assets, PP&E, litigation and other contingency reserves. Subsequent changes in fair values are adjusted against the cost of acquisition if they qualify as measurement period adjustments. The measurement period is the period between the date of acquisition and the date where all significant information necessary to determine the fair values are available, not to exceed 12 months. All other subsequent changes are recognized in the consolidated statements of earnings. For all business acquisitions, the Company records the results of operations of the acquired entities as of their respective effective acquisition dates.
EARNINGS PER SHARE
Basic earnings per share is based on the weighted average number of shares outstanding during the period. Diluted earnings per share is determined using the treasury stock method to evaluate the dilutive effect of stock options and performance share units (“PSUs”).
RESEARCH AND SOFTWARE DEVELOPMENT COSTS
Research costs are charged to earnings in the period in which they are incurred, net of related tax credits. Software development costs are charged to earnings in the year they are incurred, net of related tax credits, unless they meet specific capitalization criteria related to technical, market and financial feasibility.
TAX CREDITS
The Company follows the income approach to account for tax credits, whereby investment tax credits are recorded when there is a reasonable assurance that the assistance will be received and that the Company will comply with all relevant conditions. Under this method, tax credits related to operating expenditures are recorded as a reduction of the related expense and recognized in the period in which the related expenditures are charged to operations. Tax credits related to capital expenditures are recorded as a reduction of the cost of the related asset. The tax credits recorded are based on management’s best estimates of amounts expected to be received and are subject to audit by the taxation authorities.
| CGI Group Inc. – Consolidated Financial Statements for the years ended September 30, 2012 and 2011 | 97 |
Notes to the Consolidated Financial Statements
For the years ended September 30, 2012 and 2011
(tabular amounts only are in thousands of Canadian dollars, except share data)
| 3. | Summary of significant accounting policies (continued) |
INCOME TAXES
Income taxes are accounted for using the liability method of accounting.
Current income taxes are recognized with respect to the amounts expected to be paid or recovered under the tax rates and laws that have been enacted or substantively enacted at the balance sheet date.
Deferred income tax assets and liabilities are determined based on deductible or taxable temporary differences between the amounts reported for financial statements purposes and tax values of the assets and liabilities using enacted or substantively enacted tax rates that will be in effect for the year in which the differences are expected to be recovered or settled. Deferred tax assets are generally recognized for all deductible temporary differences to the extent that it is probable that taxable profits will be available against which those deductible temporary differences can be utilized.
Deferred income tax assets and liabilities are recognized directly in earnings, other comprehensive income or in equity based on the classification of the item to which they relate.
In the course of the Company’s operations, uncertainties exist with respect to interpretation of complex tax regulations and the amount and timing of future taxable income. When a tax position is uncertain, the Company recognizes an income tax benefit or reduces an income tax liability only when it is probable that the tax benefit will be realized in the future or that the income tax liability is no longer probable.
PROVISIONS
Provisions are recognized when the Company has a present legal or constructive obligation as a result of a past event, it is probable that an outflow of resources embodying economic benefits will be required to settle the obligation and a reliable estimate can be made of the amount of the obligation. The Company’s provisions consist of liabilities for leases of premises that the Company has vacated, litigation and claim provisions arising in the ordinary course of business and decommissioning liabilities for operating leases of office buildings where certain arrangements require premises to be returned to their original state at the end of the lease term. The Company also records restructuring provisions related to business acquisition.
The amount recognized as a provision is the best estimate of the consideration required to settle the present obligation at the end of the reporting period, taking into account the risks and uncertainties surrounding the obligation. Provisions are discounted using a current pre-tax rate when the impact of the time value of money is material. The increase in the provision due to the passage of time is recognized as finance cost.
| CGI Group Inc. – Consolidated Financial Statements for the years ended September 30, 2012 and 2011 | 98 |
Notes to the Consolidated Financial Statements
For the years ended September 30, 2012 and 2011
(tabular amounts only are in thousands of Canadian dollars, except share data)
| 3. | Summary of significant accounting policies (continued) |
TRANSLATION OF FOREIGN CURRENCIES
The Company’s consolidated financial statements are presented in Canadian dollars, which is also the parent company’s functional currency. Each entity in the Company determines its own functional currency and items included in the financial statements of each entity are measured using that functional currency. Functional currency is the currency of the primary economic environment in which the entity operates.
Foreign currency transactions and balances
Revenue, expenses and non-monetary assets and liabilities denominated in foreign currencies are recorded at the rate of exchange prevailing at the transaction date. Monetary assets and liabilities denominated in foreign currencies are translated at exchange rates prevailing at the balance sheet date. Realized and unrealized translation gains and losses are reflected in the consolidated statements of earnings.
Foreign operations
For foreign operations that have functional currencies different from the Company, assets and liabilities denominated in a foreign currency are translated into Canadian dollars at exchange rates in effect at the balance sheet date. Revenue and expenses are translated at average exchange rates prevailing during the period. Resulting unrealized gains or losses are reported as net unrealized gains or losses on translating financial statements of foreign operations in other comprehensive income.
For the accounts of foreign operations with the same functional currency as the Company, monetary assets and liabilities are translated at the exchange rates in effect at the balance sheet date and non-monetary assets and liabilities are translated at historical exchange rates. Revenue and expenses are translated at average rates for the period. Translation exchange gains or losses of such operations are reflected in the consolidated statements of earnings.
SHARE-BASED PAYMENTS
The Company operates equity-settled stock option and PSU plans under which the Company receives services from employees and others as consideration for equity instruments.
The fair value of those share-based payments is established on the grant date using the Black-Scholes option pricing model for the stock options and the closing price of Class A subordinate shares of the Company on the Toronto Stock Exchange (“TSX”) for the PSUs. The number of stock options and PSUs expected to vest are estimated on the grant date and subsequently revised on a periodic basis. The fair values, adjusted for expectations related to performance conditions, are recognized as share-based payment costs in earnings with a corresponding credit to contributed surplus on a graded-vesting basis over the vesting period.
When stock options are exercised, any consideration paid by employees and members of the Board of Directors is credited to capital stock and the recorded fair value of the stock option is removed from contributed surplus and credited to capital stock. When PSUs are exercised, the recorded fair value of PSUs is removed from contributed surplus and credited to capital stock.
| CGI Group Inc. – Consolidated Financial Statements for the years ended September 30, 2012 and 2011 | 99 |
Notes to the Consolidated Financial Statements
For the years ended September 30, 2012 and 2011
(tabular amounts only are in thousands of Canadian dollars, except share data)
| 3. | Summary of significant accounting policies (continued) |
FINANCIAL INSTRUMENTS
All financial assets designated as held-to-maturity and loans and receivables, as well as financial liabilities designated as other liabilities, are initially measured at their fair values and subsequently at their amortized cost using the effective interest rate method. All financial assets and liabilities designated as fair value through earnings (“FVTE”) are measured at their fair values and gains and losses related to periodic revaluations are recorded in the consolidated statements of earnings. Financial instruments may be designated on initial recognition as FVTE if any of the following criteria are met: i) the financial instrument contains one or more embedded derivatives that otherwise would have to be accounted for separately; ii) the designation eliminates or significantly reduces a measurement or recognition inconsistency that would otherwise arise from measuring the financial asset or liability or recognizing the gains and losses on them on a different basis; or iii) the financial asset and financial liability are part of a group of financial assets or liabilities that is managed and its performance evaluated on a fair value basis, in accordance with a documented risk management or investment strategy. All financial assets designated as available for sale are measured at their fair value and any unrealized gains and losses, net of applicable income taxes, are reported in other comprehensive income. Interest income earned and realized gains and losses on the sale of available for sale assets are recorded in the consolidated statements of earnings.
Transaction costs are comprised primarily of legal, accounting and other costs directly attributable to the issuance of the respective financial assets and liabilities. Transaction costs are capitalized to the cost of financial assets and liabilities classified as other than FVTE.
Financial assets are derecognized if the contractual rights to the cash flows from the financial asset expire or the asset is transferred and the transfer qualifies for derecognition. The transfer qualifies for derecognition if substantially all the risks and rewards of ownership of the financial asset are transferred.
The Company has made the following classifications:
FVTE
Cash and cash equivalents, short-term investments (other than those included in funds held for clients), derivatives (unless they qualify for hedge accounting, refer to “Derivative Financial Instruments and Hedging Transactions”) and bank overdraft. In addition, deferred compensation plan assets were designated by management as FVTE upon initial recognition as this reflected management’s investment strategy.
Loan and receivables
Trade accounts receivable and cash included in funds held for clients.
Available for sale
Short-term and long-term bonds included in funds held for clients and long-term investments.
Other liabilities
Accounts payable and accrued liabilities, accrued compensation, long-term debt, excluding obligations under finance leases, and clients’ funds obligations.
| CGI Group Inc. – Consolidated Financial Statements for the years ended September 30, 2012 and 2011 | 100 |
Notes to the Consolidated Financial Statements
For the years ended September 30, 2012 and 2011
(tabular amounts only are in thousands of Canadian dollars, except share data)
| 3. | Summary of significant accounting policies (continued) |
FINANCIAL INSTRUMENTS (CONTINUED)
Fair value hierarchy
Fair value measurements recognized in the balance sheet are categorized in accordance with the following levels:
Level 1: quoted prices (unadjusted) in active markets for identical assets or liabilities;
Level 2: inputs other than quoted prices included in Level 1, but that are observable for the asset or liability, either directly or indirectly; and
Level 3: inputs for the asset or liability that are not based on observable market data.
All financial assets and liabilities measured at fair value are categorized in Level 1, except for derivatives, investments included in funds held for clients and long-term investments, which are categorized in Level 2.
DERIVATIVE FINANCIAL INSTRUMENTS AND HEDGING TRANSACTIONS
The Company enters into a variety of derivative financial instruments to manage its exposure to interest rate and foreign currency exchange risks.
Derivative financial instruments are initially recognized at fair value at the date the derivative contracts are entered into and are subsequently remeasured to their fair value at the end of each reporting period. The resulting gain or loss is recognized in the consolidated statements of earnings unless the derivative is designated and effective as a hedging instrument, in which event the timing of the recognition in the consolidated statements of earnings depends on the nature of the hedge relationship.
At the inception of a hedge relationship, the Company formally designates and documents the hedge relationship to which the Company wishes to apply hedge accounting and the risk management objective and strategy for undertaking the hedge. The documentation includes identification of the hedging instrument, the hedged item or transaction, the nature of the risk being hedged and how the Company will assess the effectiveness of changes in the hedging instrument’s fair value in offsetting the exposure to changes in the hedged item’s fair value or cash flows attributable to the hedged risk. Such hedges are expected to be highly effective in achieving offsetting changes in fair value or cash flows and are assessed on an ongoing basis to determine that they actually have been highly effective throughout the financial reporting periods for which they were designated.
The cash flows of the hedging transactions are classified in the same manner as the cash flows of the position being hedged.
Hedges on net investments in foreign operations
The Company uses cross-currency swaps and foreign currency denominated long-term debt to hedge portions of the Company’s net investments in its U.S and European operations. Foreign exchange translation gains or losses on the net investments and the effective portions of gains or losses on instruments hedging the net investments are recorded in other comprehensive income. To the extent that the hedge is ineffective, such differences are recognized in consolidated statements of earnings. When the hedged net investment is disposed of, the relevant amount in the other comprehensive income is transferred to earnings as part of the gain or loss on disposal.
Cash flow hedges on future revenue
The Company has also entered into various foreign currency forward contracts to hedge the variability in the foreign currency exchange rates. These hedges were documented as cash flow hedges and no component of the derivative instruments’ fair value is excluded from the assessment and measurement of hedge effectiveness.
| CGI Group Inc. – Consolidated Financial Statements for the years ended September 30, 2012 and 2011 | 101 |
Notes to the Consolidated Financial Statements
For the years ended September 30, 2012 and 2011
(tabular amounts only are in thousands of Canadian dollars, except share data)
| 3. | Summary of significant accounting policies (continued) |
DERIVATIVE FINANCIAL INSTRUMENTS AND HEDGING TRANSACTIONS (CONTINUED)
Cash flow hedges on future revenue (continued)
The effective portion of the change in fair value of the derivative instruments is recognized in other comprehensive income and the ineffective portion, if any, in the consolidated statements of earnings. The effective portion of the change in fair value of the derivatives is reclassified out of other comprehensive income into the consolidated statements of earnings as an adjustment to revenue when the hedged revenue is recognized.
Cash flow hedges on unsecured committed term loan credit facility
The Company has entered into interest rate swaps to hedge the cash flow exposure of the issued variable rate unsecured committed term loan credit facility. Under the interest rate swaps, the Company receives a variable rate of interest and pays interest at a fixed rate on the notional amount.
The hedges were documented as cash flow hedges and no component of the derivative instruments’ fair value are excluded from the assessment and measurement of hedge effectiveness.
Fair value hedges on Senior U.S. unsecured notes
The Company entered into interest rate swap to hedge the fair value exposure of the issued fixed rate Senior U.S. unsecured notes.
The changes in the fair value of the interest rate swaps are recognized in the consolidated statements of earnings as finance costs. The changes in the fair value of the hedged items attributable to the risk hedged is recorded as part of the carrying value of the Senior U.S. unsecured notes and are also recognized in the consolidated statements of earnings as finance costs. If the hedged items are derecognized, the unamortized fair value is recognized immediately in the consolidated statements of earnings.
The forward contracts, the cross-currency swaps and the interest rate swaps used as a cash flow hedging item are derivative instruments and, therefore, are recorded at fair value in the consolidated balance sheets under other current assets, other long-term assets, accrued liabilities or other long-term liabilities. Valuation models, such as discounted cash flow analysis using observable market inputs, are utilized to determine the fair values of the derivative instruments.
| CGI Group Inc. – Consolidated Financial Statements for the years ended September 30, 2012 and 2011 | 102 |
Notes to the Consolidated Financial Statements
For the years ended September 30, 2012 and 2011
(tabular amounts only are in thousands of Canadian dollars, except share data)
| 3. | Summary of significant accounting policies (continued) |
EMPLOYEE BENEFITS
The Company operates retirement benefit plans of both a defined contribution and defined benefit nature. Retirement benefit plans that are funded by the payment of insurance premiums are treated as defined contribution plans unless the Company has an obligation either to pay the benefits directly when they fall due or to pay further amounts if assets accumulated with the insurer do not cover all future employee benefits. In such circumstances, the plan is treated as a defined benefit plan. The cost of defined contribution plans is charged to the consolidated statements of earnings on the basis of contributions payable by the Company during the year. For defined benefits plans, the defined benefit obligations are calculated annually by independent actuaries using the projected unit credit method. The retirement benefit obligations in the consolidated balance sheets represent the present value of the defined benefit obligation as reduced by the fair value of plan assets. The retirement benefits assets are recognized to the extent that the Company can benefit from refunds or a reduction in future contributions.
Insurance policies are treated as plan assets of a defined benefit plan if the proceeds of the policy:
| • | Can only be used to fund employee benefits; |
| • | Are not available to the Company’s creditors; and |
| • | Either cannot be paid to the Company unless the proceeds represent surplus assets not needed to meet all the benefit obligations or are a reimbursement for benefits already paid by the Company. |
Insurance policies that do not meet the above criteria are treated as non-current investments and are held at fair value as a non-current financial asset in the consolidated balance sheets.
The current service cost is recognized in the consolidated statements of earnings as an employee benefit expense. The interest cost resulting from the increase in the present value of the defined benefit obligations over time and the expected return on plan assets, is recognized as net interest expense or income. Actuarial gains and losses arising from experience adjustments or changes in actuarial assumptions are charged or credited to the other comprehensive income in the period in which they arise.
FUTURE ACCOUNTING STANDARD CHANGES
The following standards have been issued but are not yet effective:
| • | IFRS 9, “Financial Instruments”, covers the classification and measurement of financial assets and financial liabilities. |
| • | IFRS 10, “Consolidated Financial Statements”, builds on existing principles by identifying the concept of control as the determining factor in whether an entity should be included in a company’s consolidated financial statements. |
| • | IFRS 12, “Disclosure of Interests in Other Entities”, provides guidance on disclosure requirements for all forms of interests in other entities, including joint arrangements, associates, special purpose vehicles and other off-balance sheet vehicles. |
| • | IFRS 13, “Fair Value Measurement”, provides guidance on fair value measurements by providing a definition of fair value and a single source of fair value measurement and disclosure requirements. |
| • | IAS 1, “Presentation of Financial Statements”, was amended to require grouping together items within the statement of comprehensive income that may be reclassified to the statement of income. |
| • | IAS 19, “Employee Benefits”, was amended to adjust the calculation of the financing cost component of defined benefit plans and to enhance disclosure requirements. |
Other than IFRS 9, the above standards are effective October 1, 2013, with earlier application permitted. IFRS 9 is effective October 1, 2015, also with earlier application permitted. The Company is currently evaluating the impact of these standards on its consolidated financial statements.
| CGI Group Inc. – Consolidated Financial Statements for the years ended September 30, 2012 and 2011 | 103 |
Notes to the Consolidated Financial Statements
For the years ended September 30, 2012 and 2011
(tabular amounts only are in thousands of Canadian dollars, except share data)
| 4. | Cash and cash equivalents and bank overdraft |
| As at September 30, 2012 | As at September 30, 2011 | As at October 1, 2010 | ||||||||||
| $ | $ | $ | ||||||||||
Cash | 86,060 | 95,643 | 22,061 | |||||||||
Cash equivalents | 27,043 | 40,568 | 86,468 | |||||||||
|
|
|
|
|
| |||||||
Cash and cash equivalents | 113,103 | 136,211 | 108,529 | |||||||||
Bank overdraft | — | (75,538 | ) | — | ||||||||
|
|
|
|
|
| |||||||
| 113,103 | 60,673 | 108,529 | ||||||||||
|
|
|
|
|
| |||||||
| 5. | Accounts receivable |
| As at September 30, 2012 | As at September 30, 2011 | As at October 1, 2010 | ||||||||||
| $ | $ | $ | ||||||||||
Trade | 1,272,325 | 387,229 | 340,957 | |||||||||
Other1 | 173,824 | 103,255 | 85,284 | |||||||||
|
|
|
|
|
| |||||||
| 1,446,149 | 490,484 | 426,241 | ||||||||||
|
|
|
|
|
| |||||||
| 1 | Other accounts receivable include refundable tax credits on salaries related to the Québec Development of E-Business program, Research and Development tax credits in North America and Europe, and other Job and Economic Growth Creation programs available. The tax credits represent approximately $106,491,000, $75,896,000 and $54,624,000 of other accounts receivable in 2012, 2011 and 2010, respectively. |
The fiscal measures under the Québec Development of E-Business program enable corporations with an establishment in the province of Québec that carry out eligible activities in the technology sector to obtain a refundable tax credit equal to 30% of eligible salaries, up to a maximum of $20,000 per year per eligible employee until December 31, 2015.
| 6. | Funds held for clients |
| As at September 30, 2012 | As at September 30, 2011 | As at October 1, 2010 | ||||||||||
| $ | $ | $ | ||||||||||
Cash | 11,670 | 67,140 | 248,695 | |||||||||
Short-term bonds | — | 10,070 | — | |||||||||
Long-term bonds | 190,737 | 170,412 | — | |||||||||
|
|
|
|
|
| |||||||
| 202,407 | 247,622 | 248,695 | ||||||||||
|
|
|
|
|
| |||||||
| CGI Group Inc. – Consolidated Financial Statements for the years ended September 30, 2012 and 2011 | 104 |
Notes to the Consolidated Financial Statements
For the years ended September 30, 2012 and 2011
(tabular amounts only are in thousands of Canadian dollars, except share data)
| 7. | Property, plant and equipment |
| Land and buildings | Leasehold improvements | Furniture, fixtures and equipment | Computer equipment | Total | ||||||||||||||||
| $ | $ | $ | $ | $ | ||||||||||||||||
Cost | ||||||||||||||||||||
As at September 30, 2011 | 14,773 | 125,808 | 84,046 | 293,944 | 518,571 | |||||||||||||||
Additions/transfers | 23,993 | 5,021 | 8,980 | 58,891 | 96,885 | |||||||||||||||
Additions – business acquisition (Note 24) | 20,456 | 84,952 | 106,974 | 38,426 | 250,808 | |||||||||||||||
Disposals/transfers1 | — | (9,344 | ) | (2,305 | ) | (46,537 | ) | (58,186 | ) | |||||||||||
Foreign currency translation adjustment | 308 | 427 | 1,723 | (4,146 | ) | (1,688 | ) | |||||||||||||
|
|
|
|
|
|
|
|
|
| |||||||||||
As at September 30, 2012 | 59,530 | 206,864 | 199,418 | 340,578 | 806,390 | |||||||||||||||
|
|
|
|
|
|
|
|
|
| |||||||||||
Accumulated amortization | ||||||||||||||||||||
As at September 30, 2011 | 4,047 | 65,678 | 31,767 | 167,178 | 268,670 | |||||||||||||||
Amortization expense (Note 20) | 1,236 | 18,655 | 16,717 | 56,445 | 93,053 | |||||||||||||||
Disposals/transfers1 | — | (7,052 | ) | (2,274 | ) | (44,580 | ) | (53,906 | ) | |||||||||||
Foreign currency translation adjustment | 15 | (384 | ) | 668 | (2,721 | ) | (2,422 | ) | ||||||||||||
|
|
|
|
|
|
|
|
|
| |||||||||||
As at September 30, 2012 | 5,298 | 76,897 | 46,878 | 176,322 | 305,395 | |||||||||||||||
|
|
|
|
|
|
|
|
|
| |||||||||||
Net carrying amount as at September 30, 2012 | 54,232 | 129,967 | 152,540 | 164,256 | 500,995 | |||||||||||||||
|
|
|
|
|
|
|
|
|
| |||||||||||
| Land and buildings | Leasehold improvements | Furniture, fixtures and equipment | Computer equipment | Total | ||||||||||||||||
| $ | $ | $ | $ | $ | ||||||||||||||||
Cost | ||||||||||||||||||||
As at October 1, 2010 | 17,309 | 139,522 | 75,334 | 255,182 | 487,347 | |||||||||||||||
Additions/transfers | 154 | 15,479 | 16,602 | 72,443 | 104,678 | |||||||||||||||
Disposals/transfers1 | (2,735 | ) | (29,011 | ) | (7,432 | ) | (34,064 | ) | (73,242 | ) | ||||||||||
Foreign currency translation adjustment | 45 | (182 | ) | (458 | ) | 383 | (212 | ) | ||||||||||||
|
|
|
|
|
|
|
|
|
| |||||||||||
As at September 30, 2011 | 14,773 | 125,808 | 84,046 | 293,944 | 518,571 | |||||||||||||||
|
|
|
|
|
|
|
|
|
| |||||||||||
Accumulated amortization | ||||||||||||||||||||
As at October 1, 2010 | 4,461 | 74,419 | 30,065 | 141,770 | 250,715 | |||||||||||||||
Amortization expense (Note 20) | 199 | 17,260 | 8,482 | 53,083 | 79,024 | |||||||||||||||
Disposals/transfers1 | (628 | ) | (25,975 | ) | (6,641 | ) | (28,003 | ) | (61,247 | ) | ||||||||||
Foreign currency translation adjustment | 15 | (26 | ) | (139 | ) | 328 | 178 | |||||||||||||
|
|
|
|
|
|
|
|
|
| |||||||||||
As at September 30, 2011 | 4,047 | 65,678 | 31,767 | 167,178 | 268,670 | |||||||||||||||
|
|
|
|
|
|
|
|
|
| |||||||||||
Net carrying amount as at September 30, 2011 | 10,726 | 60,130 | 52,279 | 126,766 | 249,901 | |||||||||||||||
|
|
|
|
|
|
|
|
|
| |||||||||||
| 1 | Includes derecognition of fully depreciated assets of $32,738,000 ($38,914,000 in 2011). |
Property, plant and equipment include the following assets acquired under finance leases:
| As at September 30, 2012 | As at September 30, 2011 | As at October 1, 2010 | ||||||||||||||||||||||||||||||||||
| Cost | Accumulated amortization | Net carrying amount | Cost | Accumulated amortization | Net carrying amount | Cost | Accumulated amortization | Net carrying amount | ||||||||||||||||||||||||||||
| $ | $ | $ | $ | $ | $ | $ | $ | $ | ||||||||||||||||||||||||||||
Furniture, fixtures and equipment | 16,909 | 5,198 | 11,711 | 12,521 | 2,812 | 9,709 | 9,258 | 1,551 | 7,707 | |||||||||||||||||||||||||||
Computer equipment | 103,759 | 52,201 | 51,558 | 87,688 | 40,550 | 47,138 | 79,058 | 33,645 | 45,413 | |||||||||||||||||||||||||||
|
|
|
|
|
|
|
|
|
|
|
|
|
|
|
|
|
| |||||||||||||||||||
| 120,668 | 57,399 | 63,269 | 100,209 | 43,362 | 56,847 | 88,316 | 35,196 | 53,120 | ||||||||||||||||||||||||||||
|
|
|
|
|
|
|
|
|
|
|
|
|
|
|
|
|
| |||||||||||||||||||
| CGI Group Inc. – Consolidated Financial Statements for the years ended September 30, 2012 and 2011 | 105 |
Notes to the Consolidated Financial Statements
For the years ended September 30, 2012 and 2011
(tabular amounts only are in thousands of Canadian dollars, except share data)
| 8. | Contract costs |
| As at September 30, 2012 | As at September 30, 2011 | As at October 1, 2010 | ||||||||||||||||||||||||||||||||||
| Cost | Accumulated amortization | Net carrying amount | Cost | Accumulated amortization | Net carrying amount | Cost | Accumulated amortization | Net carrying amount | ||||||||||||||||||||||||||||
| $ | $ | $ | $ | $ | $ | $ | $ | $ | ||||||||||||||||||||||||||||
Incentives | 102,061 | 81,425 | 20,636 | 101,599 | 72,622 | 28,977 | 142,696 | 107,766 | 34,930 | |||||||||||||||||||||||||||
Transition costs | 258,778 | 111,672 | 147,106 | 181,559 | 103,294 | 78,265 | 201,413 | 103,234 | 98,179 | |||||||||||||||||||||||||||
|
|
|
|
|
|
|
|
|
|
|
|
|
|
|
|
|
| |||||||||||||||||||
| 360,839 | 193,097 | 167,742 | 283,158 | 175,916 | 107,242 | 344,109 | 211,000 | 133,109 | ||||||||||||||||||||||||||||
|
|
|
|
|
|
|
|
|
|
|
|
|
|
|
|
|
| |||||||||||||||||||
| CGI Group Inc. – Consolidated Financial Statements for the years ended September 30, 2012 and 2011 | 106 |
Notes to the Consolidated Financial Statements
For the years ended September 30, 2012 and 2011
(tabular amounts only are in thousands of Canadian dollars, except share data)
| 9. | Intangible assets |
| Internal-use software | Business solutions | Software licenses | Client relationships and other | Total | ||||||||||||||||
| $ | $ | $ | $ | $ | ||||||||||||||||
Cost | ||||||||||||||||||||
As at September 30, 2011 | 90,775 | 299,788 | 162,699 | 390,374 | 943,636 | |||||||||||||||
Additions/transfers | 4,158 | — | 19,499 | — | 23,657 | |||||||||||||||
Additions – internally developed | — | 35,360 | — | — | 35,360 | |||||||||||||||
Additions – business acquisition (Note 24) | 33,812 | 36,392 | — | 533,479 | 603,683 | |||||||||||||||
Disposals/transfers1 | (4,012 | ) | (8,099 | ) | (5,115 | ) | (29,999 | ) | (47,225 | ) | ||||||||||
Foreign currency translation adjustment | (260 | ) | (8,049 | ) | (1,151 | ) | (1,136 | ) | (10,596 | ) | ||||||||||
|
|
|
|
|
|
|
|
|
| |||||||||||
As at September 30, 2012 | 124,473 | 355,392 | 175,932 | 892,718 | 1,548,515 | |||||||||||||||
|
|
|
|
|
|
|
|
|
| |||||||||||
Accumulated amortization | ||||||||||||||||||||
As at September 30, 2011 | 71,510 | 213,780 | 119,051 | 247,162 | 651,503 | |||||||||||||||
Amortization expense (Note 20) | 9,133 | 21,770 | 18,472 | 50,299 | 99,674 | |||||||||||||||
Disposals/transfers1 | (2,062 | ) | (8,917 | ) | (4,302 | ) | (31,811 | ) | (47,092 | ) | ||||||||||
Foreign currency translation adjustment | (364 | ) | (6,316 | ) | (592 | ) | (7,190 | ) | (14,462 | ) | ||||||||||
|
|
|
|
|
|
|
|
|
| |||||||||||
As at September 30, 2012 | 78,217 | 220,317 | 132,629 | 258,460 | 689,623 | |||||||||||||||
|
|
|
|
|
|
|
|
|
| |||||||||||
Net carrying amount as at September 30, 2012 | 46,256 | 135,075 | 43,303 | 634,258 | 858,892 | |||||||||||||||
|
|
|
|
|
|
|
|
|
| |||||||||||
| Internal-use software | Business solutions | Software licenses | Client relationships and other | Total | ||||||||||||||||
| $ | $ | $ | $ | $ | ||||||||||||||||
Cost | ||||||||||||||||||||
As at October 1, 2010 | 88,153 | 284,475 | 172,736 | 414,199 | 959,563 | |||||||||||||||
Additions/transfers | 6,503 | — | 21,354 | — | 27,857 | |||||||||||||||
Additions – internally developed | — | 14,975 | — | — | 14,975 | |||||||||||||||
Modifications to purchase price allocation | — | — | — | (1,743 | ) | (1,743 | ) | |||||||||||||
Disposals/transfers1 | (4,075 | ) | (1,849 | ) | (31,699 | ) | (23,182 | ) | (60,805 | ) | ||||||||||
Foreign currency translation adjustment | 194 | 2,187 | 308 | 1,100 | 3,789 | |||||||||||||||
|
|
|
|
|
|
|
|
|
| |||||||||||
As at September 30, 2011 | 90,775 | 299,788 | 162,699 | 390,374 | 943,636 | |||||||||||||||
|
|
|
|
|
|
|
|
|
| |||||||||||
Accumulated amortization | ||||||||||||||||||||
As at October 1, 2010 | 64,749 | 178,400 | 123,036 | 224,342 | 590,527 | |||||||||||||||
Amortization expense | 10,506 | 23,766 | 18,921 | 42,979 | 96,172 | |||||||||||||||
Disposals/transfers1 | (3,818 | ) | (1,849 | ) | (23,062 | ) | (21,675 | ) | (50,404 | ) | ||||||||||
Impairment | — | 11,719 | — | — | 11,719 | |||||||||||||||
Foreign currency translation adjustment | 73 | 1,744 | 156 | 1,516 | 3,489 | |||||||||||||||
|
|
|
|
|
|
|
|
|
| |||||||||||
As at September 30, 2011 | 71,510 | 213,780 | 119,051 | 247,162 | 651,503 | |||||||||||||||
|
|
|
|
|
|
|
|
|
| |||||||||||
Net carrying amount as at September 30, 2011 | 19,265 | 86,008 | 43,648 | 143,212 | 292,133 | |||||||||||||||
|
|
|
|
|
|
|
|
|
| |||||||||||
| 1 | Includes derecognition of fully depreciated assets of $45,857,000 ($32,183,000 in 2011). |
All intangible assets are subject to amortization.
| CGI Group Inc. – Consolidated Financial Statements for the years ended September 30, 2012 and 2011 | 107 |
Notes to the Consolidated Financial Statements
For the years ended September 30, 2012 and 2011
(tabular amounts only are in thousands of Canadian dollars, except share data)
| 10. | Other long-term assets |
| As at September 30, 2012 | As at September 30, 2011 | As at October 1, 2010 | ||||||||||
| $ | $ | $ | ||||||||||
Insurance contracts held to fund defined benefit pension and life assurance arrangements (Note 29) | 19,122 | — | — | |||||||||
Deferred compensation plan assets (Note 29) | 18,878 | 16,452 | 16,318 | |||||||||
Long-term investments | 15,533 | 15,309 | — | |||||||||
Retirement benefits assets (Note 29) | 9,165 | — | — | |||||||||
Long-term receivables | 8,502 | 4,610 | — | |||||||||
Deferred financing fees | 5,042 | 1,077 | 2,360 | |||||||||
Long-term maintenance agreements | 4,891 | 5,017 | 4,904 | |||||||||
Forward contracts (Note 31) | 2,098 | 6,179 | 13,317 | |||||||||
Deposits and other | 13,120 | 6,949 | 4,724 | |||||||||
|
|
|
|
|
| |||||||
| 96,351 | 55,593 | 41,623 | ||||||||||
|
|
|
|
|
| |||||||
| 11. | Goodwill |
Due to the change in operating segments during the year (Note 27), the Company reallocated goodwill to the revised CGUs using relative fair value and conducted a goodwill impairment test using the revised CGUs, which are the same as the operating segments. Based on the results of this test, no impairment charge was required. In addition, the Company completed the annual impairment test as at September 30, 2012 and did not identify any impairment. On August 20, 2012, CGI acquired 100% of the shares of Logica plc (“Logica”) and reported Logica as an operating segment (Note 27).
The variations in goodwill were as follows:
| U.S. | Canada | GIS | Europe & Asia Pacific | Logica | Total | |||||||||||||||||||
| $ | $ | $ | $ | $ | $ | |||||||||||||||||||
Balance as at October 1, 2010 | 1,282,773 | 964,085 | 202,715 | 75,840 | — | 2,525,413 | ||||||||||||||||||
Business acquisition | — | — | — | 656 | — | 656 | ||||||||||||||||||
Purchase price adjustments (Note 24) | 4,376 | — | — | — | — | 4,376 | ||||||||||||||||||
Disposal of business | — | (5,050 | ) | — | — | — | (5,050 | ) | ||||||||||||||||
Foreign currency translation adjustment | 10,682 | — | 120 | (175 | ) | — | 10,627 | |||||||||||||||||
|
|
|
|
|
|
|
|
|
|
|
| |||||||||||||
Balance as at September 30, 2011, as previously reported | 1,297,831 | 959,035 | 202,835 | 76,321 | — | 2,536,022 | ||||||||||||||||||
|
|
|
|
|
|
|
|
|
|
|
| |||||||||||||
Goodwill reallocation | (22,243 | ) | 21,613 | — | 630 | — | — | |||||||||||||||||
|
|
|
|
|
|
|
|
|
|
|
| |||||||||||||
Balance as at September 30, 2011, after goodwill reallocation | 1,275,588 | 980,648 | 202,835 | 76,951 | — | 2,536,022 | ||||||||||||||||||
|
|
|
|
|
|
|
|
|
|
|
| |||||||||||||
Business acquisition (Note 24) | — | — | — | — | 3,276,172 | 3,276,172 | ||||||||||||||||||
Foreign currency translation adjustment | (70,849 | ) | — | (880 | ) | (7,011 | ) | 86,363 | 7,623 | |||||||||||||||
|
|
|
|
|
|
|
|
|
|
|
| |||||||||||||
Balance as at September 30, 2012 | 1,204,739 | 980,648 | 201,955 | 69,940 | 3,362,535 | 5,819,817 | ||||||||||||||||||
|
|
|
|
|
|
|
|
|
|
|
| |||||||||||||
| CGI Group Inc. – Consolidated Financial Statements for the years ended September 30, 2012 and 2011 | 108 |
Notes to the Consolidated Financial Statements
For the years ended September 30, 2012 and 2011
(tabular amounts only are in thousands of Canadian dollars, except share data)
| 11. | Goodwill (continued) |
Key assumptions in goodwill impairment testing
The assumptions for the most significant CGUs are disclosed in the following table:
As at September 30, 2012 | U.S. | Canada | GIS | |||||||||
| % | % | % | ||||||||||
Assumptions | ||||||||||||
Pre-tax discount rate | 8.7 | 5.5 | 7.2 | |||||||||
Long-term growth rate of net operating cash flows | 2.0 | 2.0 | 2.0 | |||||||||
As at October 1, 2011 | U.S. | Canada | GIS | |||||||||
| % | % | % | ||||||||||
Assumptions | ||||||||||||
Pre-tax discount rate | 8.9 | 7.2 | 8.7 | |||||||||
Long-term growth rate of net operating cash flows | 2.0 | 2.0 | 2.0 | |||||||||
As at October 1, 2010 | U.S. & India | Canada | GIS | |||||||||
| % | % | % | ||||||||||
Assumptions | ||||||||||||
Pre-tax discount rate | 10.4 | 8.1 | 9.8 | |||||||||
Long-term growth rate of net operating cash flows | 2.0 | 2.0 | 2.0 | |||||||||
As Logica was acquired on August 20, 2012, the consideration paid is the best indicator of fair value for this CGU as at September 30, 2012.
| CGI Group Inc. – Consolidated Financial Statements for the years ended September 30, 2012 and 2011 | 109 |
Notes to the Consolidated Financial Statements
For the years ended September 30, 2012 and 2011
(tabular amounts only are in thousands of Canadian dollars, except share data)
| 12. | Provisions |
| Onerous leases1 | Litigations and claims2 | Decommissioning liabilities3 | Restructuring4 | Total | ||||||||||||||||
| $ | $ | $ | $ | $ | ||||||||||||||||
As at September 30, 2011 | 29,703 | 2,535 | 7,559 | — | 39,797 | |||||||||||||||
Additional provisions | 4,515 | 1,719 | 1,672 | 101,475 | 109,381 | |||||||||||||||
Provisions assumed in business acquisition | 59,138 | 106,408 | 31,446 | 47,652 | 244,644 | |||||||||||||||
Utilized amounts | (10,445 | ) | (2,217 | ) | — | (5,384 | ) | (18,046 | ) | |||||||||||
Reversals of unused amounts | (1,135 | ) | — | (2,908 | ) | — | (4,043 | ) | ||||||||||||
Discount rate adjustment and imputed interest | 148 | — | 205 | — | 353 | |||||||||||||||
Effect of foreign currency translation adjustment | 601 | 3,108 | (22 | ) | 1,359 | 5,046 | ||||||||||||||
|
|
|
|
|
|
|
|
|
| |||||||||||
As at September 30, 2012 | 82,525 | 111,553 | 37,952 | 145,102 | 377,132 | |||||||||||||||
|
|
|
|
|
|
|
|
|
| |||||||||||
Current portion | 35,011 | 3,273 | 3,420 | 118,921 | 160,625 | |||||||||||||||
Non-current portion | 47,514 | 108,280 | 34,532 | 26,181 | 216,507 | |||||||||||||||
|
|
|
|
|
|
|
|
|
| |||||||||||
| Onerous leases1 | Litigations and claims2 | Decommissioning liabilities3 | Restructuring4 | Total | ||||||||||||||||
| $ | $ | $ | $ | $ | ||||||||||||||||
As at October 1, 2010 | 13,078 | 3,478 | 3,707 | — | 20,263 | |||||||||||||||
Additional provisions | 23,192 | 930 | 3,659 | — | 27,781 | |||||||||||||||
Utilized amounts | (5,309 | ) | (58 | ) | — | — | (5,367 | ) | ||||||||||||
Reversals of unused amounts | (1,879 | ) | (1,850 | ) | — | — | (3,729 | ) | ||||||||||||
Discount rate adjustment and imputed interest | 328 | — | 190 | — | 518 | |||||||||||||||
Effect of foreign currency translation adjustment | 293 | 35 | 3 | — | 331 | |||||||||||||||
|
|
|
|
|
|
|
|
|
| |||||||||||
As at September 30, 2011 | 29,703 | 2,535 | 7,559 | — | 39,797 | |||||||||||||||
|
|
|
|
|
|
|
|
|
| |||||||||||
Current portion | 9,590 | 2,535 | — | — | 12,125 | |||||||||||||||
Non-current portion | 20,113 | — | 7,559 | — | 27,672 | |||||||||||||||
|
|
|
|
|
|
|
|
|
| |||||||||||
| 1 | Onerous leases consist of estimated costs associated with vacated premises. The timing of cash outflows relating to these provisions ranges between one and thirteen years (one and eight years and one and ten years in 2011 and 2010, respectively) and was discounted at a weighted average rate of 0.98% (1.48% and 2.75% in 2011 and 2010, respectively). |
| 2 | Litigation and claim provisions represent certain legal claims brought against the Company. |
| 3 | Decommissioning liabilities pertain to operating leases of office buildings where certain arrangements require premises to be returned to their original state at the end of the lease term. The decommissioning liability was based on the expected cash flows of $43,421,000 ($8,790,000 and $4,370,000 in 2011 and 2010, respectively) and was discounted at a weighted average rate of 1.24% (2.19% and 2.74% in 2011 and 2010, respectively). The timing of the settlement of these obligations ranges between one and fourteen years (one and twelve years and one and thirteen years in 2011 and 2010, respectively). |
| 4 | Restructuring costs include Logica’s restructuring program announced on December 14, 2011. It is comprised of property rationalization, a reduction in headcount and other measures to reduce the cost base which amounted to $47,652,000 as at August 20, 2012. In addition, in connection with the acquisition of Logica made during the year, the Company recorded costs related to the termination of certain employees identified as redundant. |
| CGI Group Inc. – Consolidated Financial Statements for the years ended September 30, 2012 and 2011 | 110 |
Notes to the Consolidated Financial Statements
For the years ended September 30, 2012 and 2011
(tabular amounts only are in thousands of Canadian dollars, except share data)
| 13. | Other long-term liabilities |
| As at September 30, 2012 | As at September 30, 2011 | As at October 1, 2010 | ||||||||||
| $ | $ | $ | ||||||||||
Deferred revenue | 349,507 | 29,887 | 40,702 | |||||||||
Estimated losses on revenue-generating contracts | 139,744 | — | — | |||||||||
Deferred compensation plan liabilities (Note 29) | 19,724 | 18,227 | 18,694 | |||||||||
Deferred rent | 55,850 | 40,767 | 39,346 | |||||||||
Forward contracts (Note 31) | 32,848 | 3,090 | 3,396 | |||||||||
Other | 3,559 | 1,804 | 626 | |||||||||
|
|
|
|
|
| |||||||
| 601,232 | 93,775 | 102,764 | ||||||||||
|
|
|
|
|
| |||||||
| CGI Group Inc. – Consolidated Financial Statements for the years ended September 30, 2012 and 2011 | 111 |
Notes to the Consolidated Financial Statements
For the years ended September 30, 2012 and 2011
(tabular amounts only are in thousands of Canadian dollars, except share data)
| 14. | Long-term debt |
| As at September 30, 2012 | As at September 30, 2011 | As at October 1, 2010 | ||||||||||
| $ | $ | $ | ||||||||||
Senior U.S. unsecured notes, bearing a weighted average interest rate of 4.57% and repayable by a payment of $83,615 (US$85,000) in 2016, $137,718 (US$140,000) in 2018 and $245,925 (US$250,000) in 20211 | 467,610 | 20,647 | 109,899 | |||||||||
Unsecured committed revolving facility2 | 691,960 | 859,277 | 964,223 | |||||||||
Unsecured committed term loan credit facility3 | 1,933,948 | — | — | |||||||||
Obligations bearing a weighted average interest rate of 3.34% and repayable in blended monthly installments maturing at various dates until 2018 | 60,812 | 58,575 | 22,049 | |||||||||
Obligations under finance leases, bearing a weighted average interest rate of 3.85% and repayable in blended monthly installments maturing at various dates until 2019 | 85,124 | 67,182 | 57,705 | |||||||||
Other long-term debt | 8,954 | — | — | |||||||||
|
|
|
|
|
| |||||||
| 3,248,408 | 1,005,681 | 1,153,876 | ||||||||||
Current portion | 52,347 | 896,012 | 114,577 | |||||||||
|
|
|
|
|
| |||||||
| 3,196,061 | 109,669 | 1,039,299 | ||||||||||
|
|
|
|
|
| |||||||
| 1 | On December 15, 2011, the Company drew down an amount of $491,008,000 (US$475,000,000) on a private placement financing with U.S. institutional investors. The private placement is comprised of three tranches of Senior U.S. unsecured notes, with a weighted average maturity as at September 30, 2012 of 7.4 years and a weighted average fixed coupon of 4.57%. With the proceeds of this private placement, the Company reimbursed an amount of $491,008,000 of the unsecured revolving facility. The Senior U.S. unsecured notes contain covenants that require the Company to maintain certain financial ratios (Note 32). As at September 30, 2012, the Company was in compliance with these covenants. |
On August 17, 2012, the Company repaid the last outstanding tranche in the amount of $19,770,000 (US$20,000,000) of the 2004 private placement financing with U.S. institutional investors and settled the related forward contracts taken to manage the Company’s exposure to fluctuations in foreign exchange rate resulting in a cash outflow of $333,000.
| 2 | On December 7, 2011, the Company renewed its unsecured revolving facility for an amount of $1,500,000,000 for an additional five years, expiring in December 2016. This facility is bearing interest at Bankers’ acceptance, LIBOR or to a lesser extent, Canadian prime; plus a variable margin that is determined based on the Company’s leverage ratios. As at September 30, 2012, an amount of $691,960,000 had been drawn upon this facility at a margin of 1.75% for LIBOR and Banker’s acceptance and 0.75% for the Canadian prime portion. Also, an amount of $21,951,000 has been committed against this facility to cover various letters of credit issued for clients and other parties. The revolving credit facility contains covenants that require the Company to maintain certain financial ratios (Note 32). As at September 30, 2012, the Company was in compliance with these covenants. |
| 3 | On May 31, 2012, contingent on closing of Logica acquisition, the Company signed a new term loan credit facility agreement of £1,245,000,000. As at September 30, 2012, an amount of $1,948,940,000 was drawn, less financing costs of $14,992,000. The term loan credit facility expires in tranches on May 2014 ($484,955,000), 2015 ($484,955,000) and 2016 ($979,030,000). The term loan credit facility is bearing interest at Bankers’ acceptance, LIBOR or to a lesser extent, Canadian prime; plus a variable margin that is determined based on the Company’s leverage ratios. As at September 30, 2012, the margin paid was 2.25% for LIBOR and Banker’s acceptance and 1.25% for the Canadian prime portion. The term loan credit facility contains covenants that require the Company to maintain certain financial ratios (Note 32). As at September 30, 2012, the Company was in compliance with these covenants. |
Principal repayments on long-term debt over the forthcoming years are as follows:
| $ | ||||
Less than one year | 18,942 | |||
Between one and two years | 510,029 | |||
Between two and five years | 2,265,244 | |||
Beyond five years | 384,061 | |||
|
| |||
Total principal payments on long-term debt | 3,178,276 | |||
|
| |||
Minimum finance lease payments are as follows:
| Principal | Interest | Payment | ||||||||||
| $ | $ | $ | ||||||||||
Less than one year | 33,405 | 3,143 | 36,548 | |||||||||
Between one and two years | 24,586 | 1,517 | 26,103 | |||||||||
Between two and five years | 26,847 | 830 | 27,677 | |||||||||
Beyond five years | 286 | 5 | 291 | |||||||||
|
|
|
|
|
| |||||||
Total minimum finance lease payments | 85,124 | 5,495 | 90,619 | |||||||||
|
|
|
|
|
| |||||||
| CGI Group Inc. – Consolidated Financial Statements for the years ended September 30, 2012 and 2011 | 112 |
Notes to the Consolidated Financial Statements
For the years ended September 30, 2012 and 2011
(tabular amounts only are in thousands of Canadian dollars, except share data)
| 15. | Capital stock |
Authorized, an unlimited number without par value:
First preferred shares, carrying one vote per share, ranking prior to second preferred shares, Class A subordinate shares and Class B shares with respect to the payment of dividends;
Second preferred shares, non-voting, ranking prior to Class A subordinate shares and Class B shares with respect to the payment of dividends;
Class A subordinate shares, carrying one vote per share, participating equally with Class B shares with respect to the payment of dividends and convertible into Class B shares under certain conditions in the event of certain takeover bids on Class B shares;
Class B shares, carrying ten votes per share, participating equally with Class A subordinate shares with respect to the payment of dividends, convertible at any time at the option of the holder into Class A subordinate shares.
For 2012 and 2011, the Class A subordinate and the Class B shares varied as follows:
| Class A subordinate shares | Class B shares | Total | ||||||||||||||||||||||
| Number | Carrying value | Number | Carrying value | Number | Carrying value | |||||||||||||||||||
| $ | $ | $ | ||||||||||||||||||||||
Balance as at October 1, 2010 | 237,684,791 | 1,148,182 | 33,608,159 | 46,887 | 271,292,950 | 1,195,069 | ||||||||||||||||||
Repurchased and cancelled1 | (16,373,400 | ) | (80,009 | ) | — | — | (16,373,400 | ) | (80,009 | ) | ||||||||||||||
Issued upon exercise of stock options2 | 5,743,649 | 66,065 | — | — | 5,743,649 | 66,065 | ||||||||||||||||||
Purchased and held in trust3 | — | (2,566 | ) | — | — | — | (2,566 | ) | ||||||||||||||||
|
|
|
|
|
|
|
|
|
|
|
| |||||||||||||
Balance as at September 30, 2011 | 227,055,040 | 1,131,672 | 33,608,159 | 46,887 | 260,663,199 | 1,178,559 | ||||||||||||||||||
Repurchased and cancelled1 | (5,368,000 | ) | (26,942 | ) | — | — | (5,368,000 | ) | (26,942 | ) | ||||||||||||||
Issued upon financing of business acquisition, net of transaction costs | 46,707,146 | 999,178 | — | — | 46,707,146 | 999,178 | ||||||||||||||||||
Issued upon exercise of stock options2 | 5,376,920 | 64,033 | — | — | 5,376,920 | 64,033 | ||||||||||||||||||
Purchased and held in trust3 | — | (14,252 | ) | — | — | — | (14,252 | ) | ||||||||||||||||
Sale of shares held in trust3 | — | 1,118 | — | — | — | 1,118 | ||||||||||||||||||
|
|
|
|
|
|
|
|
|
|
|
| |||||||||||||
Balance as at September 30, 2012 | 273,771,106 | 2,154,807 | 33,608,159 | 46,887 | 307,379,265 | 2,201,694 | ||||||||||||||||||
|
|
|
|
|
|
|
|
|
|
|
| |||||||||||||
| 1 | On February 1, 2012, the Company’s Board of Directors authorized the renewal of a Normal Course Issuer Bid (“NCIB”) for the purchase of up to 22,064,163 Class A subordinate shares during the next year (23,006,547 in 2011 and 25,151,058 in 2010) for cancellation on the open market through the Toronto Stock Exchange. The Class A subordinate shares were available for purchase commencing February 9, 2012, until no later than February 8, 2013, or on such earlier date when the Company completes its purchases or elects to terminate the bid. During fiscal year 2012, the Company repurchased 5,368,000 Class A subordinate shares (16,373,400 in 2011 and 35,602,085 in 2010) for cash consideration of $102,845,000 ($305,028,000 in 2011 and $516,699,000 in 2010). The excess of the purchase price over the carrying value, in the amount of $75,903,000 ($225,019,000 in 2011 and $347,940,000 in 2010), was charged to retained earnings. |
| 2 | The carrying value of Class A subordinate shares includes $16,010,000 ($14,341,000 in 2011 and $13,332,000 in 2010), which corresponds to a reduction in contributed surplus representing the value of accumulated compensation costs associated with the stock options exercised during the year. |
| 3 | The trustee, in accordance with the terms of the PSU plan and a Trust Agreement, purchased 761,358 Class A subordinate shares of the Company on the open market for $14,252,000 during the year ended September 30, 2012 (164,012 Class A subordinate shares for $2,566,000 during the year ended September 30, 2011). In addition, the trustee sold 61,504 Class A subordinate shares that were held in trust on the open market in accordance with the terms of the PSU plan (nil during the year ended September 30, 2011). The excess of the proceeds over the carrying value of the Class A subordinate shares, in the amount of $53,000, resulted in an increase of contributed surplus. As at September 30, 2012, 863,866 Class A subordinate shares were held in trust under the PSU plan (164,012 as at September 30, 2011) (Note 16b)). |
| CGI Group Inc. – Consolidated Financial Statements for the years ended September 30, 2012 and 2011 | 113 |
Notes to the Consolidated Financial Statements
For the years ended September 30, 2012 and 2011
(tabular amounts only are in thousands of Canadian dollars, except share data)
| 16. | Share-based payments |
a) Stock options
Under the Company’s stock option plan, the Board of Directors may grant, at its discretion, stock options to purchase Class A subordinate shares to certain employees, officers, directors and consultants of the Company and its subsidiaries. The exercise price is established by the Board of Directors and is equal to the closing price of the Class A subordinate shares on the TSX on the day preceding the date of the grant. Stock options generally vest over four years from the date of grant conditionally upon achievement of objectives and must be exercised within a ten-year period, except in the event of retirement, termination of employment or death. As at September 30, 2012, 40,881,609 Class A subordinate shares have been reserved for issuance under the stock option plan.
The following table presents information concerning all outstanding stock options granted by the Company:
| 2012 | 2011 | |||||||||||||||
| Number of options | Weighted average exercise price per share | Number of options | Weighted average exercise price per share | |||||||||||||
| $ | $ | |||||||||||||||
Outstanding, beginning of year | 24,163,317 | 11.42 | 26,555,483 | 10.03 | ||||||||||||
Granted | 2,551,547 | 19.74 | 6,634,974 | 15.53 | ||||||||||||
Exercised | (5,376,920 | ) | 8.93 | (5,743,649 | ) | 9.01 | ||||||||||
Forfeited | (2,720,714 | ) | 15.47 | (3,255,072 | ) | 12.68 | ||||||||||
Expired | — | — | (28,419 | ) | 9.19 | |||||||||||
|
|
|
|
|
|
|
| |||||||||
Outstanding, end of year | 18,617,230 | 12.69 | 24,163,317 | 11.42 | ||||||||||||
|
|
|
|
|
|
|
| |||||||||
Exercisable, end of year | 12,079,231 | 10.69 | 13,108,369 | 9.39 | ||||||||||||
|
|
|
|
|
|
|
| |||||||||
The weighted average share price at the date of exercise for share options exercised in 2012 was $22.46 ($19.03 in 2011).
The following table summarizes information about outstanding stock options granted by the Company as at September 30, 2012:
| Options outstanding | Options exercisable | |||||||||||||||||||||
| Weighted average remaining contractual life (years) | Weighted average exercise price | Number of options | Weighted average exercise price | |||||||||||||||||||
| Range of exercise price | Number of options | |||||||||||||||||||||
| $ | $ | $ | ||||||||||||||||||||
| 5.20 to 6.98 | 181,166 | 3.47 | 6.66 | 181,166 | 6.66 | |||||||||||||||||
| 7.00 to 7.87 | 1,594,412 | 3.22 | 7.74 | 1,594,412 | 7.74 | |||||||||||||||||
| 8.00 to 8.91 | 1,392,887 | 2.56 | 8.52 | 1,392,887 | 8.52 | |||||||||||||||||
| 9.05 to 9.43 | 2,844,597 | 6.00 | 9.31 | 2,844,597 | 9.31 | |||||||||||||||||
| 10.05 to 11.80 | 2,353,759 | 5.03 | 11.37 | 2,353,759 | 11.37 | |||||||||||||||||
| 12.54 to 13.26 | 3,997,509 | 6.99 | 12.55 | 2,563,564 | 12.55 | |||||||||||||||||
| 14.48 to 15.96 | 3,765,173 | 8.00 | 15.48 | 1,045,450 | 15.47 | |||||||||||||||||
| 19.28 to 23.99 | 2,487,727 | 9.01 | 19.76 | 103,396 | 20.58 | |||||||||||||||||
|
|
|
|
|
|
|
|
|
| |||||||||||||
| 18,617,230 | 6.38 | 12.69 | 12,079,231 | 10.69 | ||||||||||||||||||
|
|
|
|
|
|
|
|
|
| |||||||||||||
| CGI Group Inc. – Consolidated Financial Statements for the years ended September 30, 2012 and 2011 | 114 |
Notes to the Consolidated Financial Statements
For the years ended September 30, 2012 and 2011
(tabular amounts only are in thousands of Canadian dollars, except share data)
| 16. | Share-based payments (continued) |
a) Stock options (continued)
The fair value of stock options granted in the period and the assumptions used in the calculation of their fair value on the date of grant using the Black-Scholes option pricing model were as follows:
| Year ended September 30 | ||||||||
| 2012 | 2011 | |||||||
Weighted average assumptions | ||||||||
Grant date fair value ($) | 4.67 | 4.31 | ||||||
Dividend yield (%) | 0.00 | 0.00 | ||||||
Expected volatility (%)1 | 27.63 | 27.11 | ||||||
Risk-free interest rate (%) | 1.20 | 1.99 | ||||||
Expected life (years) | 4.00 | 5.00 | ||||||
Exercise price ($) | 19.74 | 15.53 | ||||||
Share price ($) | 19.74 | 15.53 | ||||||
| 1 | Expected volatility was determined using statistical formulas and based on the weekly historical average of closing daily share prices over the period of the expected life of stock option. |
b) Performance share units
Under the PSU plan, the Board of Directors may grant PSUs to senior executives and other key employees (“participants”) which entitle them to receive one Class A subordinate share for each PSU. The vesting performance conditions are determined by the Board of Directors at the time of each grant. PSUs expire on December 31 of the third calendar year following the end of the fiscal year during which the PSU award is made, except in the event of retirement, termination of employment or death. Granted PSUs vest annually over a period of four years from the date of grant conditionally upon achievement of objectives.
Class A subordinate shares purchased in connection with the PSU plan are held in trust for the benefit of the participants. The trust, considered as a special purpose entity, is consolidated in the Company’s consolidated financial statements with the cost of the purchased shares recorded as a reduction of capital stock (Note 15).
The following table presents information concerning the number of outstanding PSUs granted by the Company:
Outstanding as at October 1, 2010 | — | |||
Granted1 | 164,012 | |||
|
| |||
Outstanding as at September 30, 2011 | 164,012 | |||
Granted1 | 761,358 | |||
Forfeited | (61,504 | ) | ||
|
| |||
Outstanding as at September 30, 2012 | 863,866 | |||
|
|
| 1 | The PSUs granted in the period had a grant date fair value of $19.71 per unit in 2012 ($15.51 in 2011). |
c) Share-based payment costs
The share-based payment expense recorded in cost of services, selling and administrative expenses is as follows:
| Year ended September 30 | ||||||||
| 2012 | 2011 | |||||||
| $ | $ | |||||||
Stock options | 9,310 | 16,246 | ||||||
PSUs | 3,210 | 399 | ||||||
|
|
|
| |||||
| 12,520 | 16,645 | |||||||
|
|
|
| |||||
| CGI Group Inc. – Consolidated Financial Statements for the years ended September 30, 2012 and 2011 | 115 |
Notes to the Consolidated Financial Statements
For the years ended September 30, 2012 and 2011
(tabular amounts only are in thousands of Canadian dollars, except share data)
| 17. | Earnings per share |
The following table sets forth the computation of basic and diluted earnings per share for the year ended September 30:
| 2012 | 2011 | |||||||||||||||||||||||
| Net earnings | Weighted average number of shares outstanding1 | Earnings per share | Net earnings | Weighted average number of shares outstanding1 | Earnings per share | |||||||||||||||||||
| $ | $ | $ | $ | |||||||||||||||||||||
Basic | 131,529 | 263,431,660 | 0.50 | 438,139 | 265,333,074 | 1.65 | ||||||||||||||||||
Dilutive stock options and PSUs2 | 10,212,342 | 10,487,173 | ||||||||||||||||||||||
|
|
|
|
|
|
|
|
|
|
|
| |||||||||||||
| 131,529 | 273,644,002 | 0.48 | 438,139 | 275,820,247 | 1.59 | |||||||||||||||||||
|
|
|
|
|
|
|
|
|
|
|
| |||||||||||||
| 1 | The 5,368,000 Class A subordinate shares repurchased and 863,866 Class A subordinate shares held in trust during the year ended September 30, 2012 (16,373,400 and 164,012, respectively, during year ended September 30, 2011), were excluded from the calculation of weighted average number of shares outstanding as of the date of transaction. |
| 2 | The calculation of the diluted earnings per share excluded 2,400,489 stock options for the year ended September 30, 2012 (58,542 for the year ended September 30, 2011), as they were anti-dilutive. |
| 18. | Construction contracts in progress |
Revenue from systems integration and consulting services under fixed-fee arrangements where the outcome of the arrangements can be estimated reliably is recognized using the percentage-of-completion method over the service periods. The Company uses the labour costs or labour hours to measure the progress towards completion. If the outcome of an arrangement cannot be estimated reliably, revenue is recognized to the extent of arrangement costs incurred that are likely to be recoverable.
Amounts recognized as revenue in excess of billings are classified as work in progress. Amounts received in advance of the delivery of products or performance of services are classified as deferred revenue.
The status of the Company’s construction contracts in progress at the end of the reporting period was as follows:
| As at September 30, 2012 | As at September 30, 2011 | As at October 1, 2010 | ||||||||||
| $ | $ | $ | ||||||||||
Recognized as: | ||||||||||||
Revenue in the respective year | 637,764 | 443,183 | 445,294 | |||||||||
Recognized as: | ||||||||||||
Amounts due from customers under construction contracts1 | 366,398 | 104,327 | 100,616 | |||||||||
Amounts prepaid by customers under construction contracts2 | (206,235 | ) | (34,861 | ) | (27,908 | ) | ||||||
| 1 | As at September 30, 2012, retentions held by customers for contract work amounted to $21,402,000 ($17,186,000 as at September 30, 2011 and $14,788,000 as at October 1, 2010). |
| 2 | As at September 30, 2012, advances received from customers for contract work amounted to $11,740,000 ($14,196,000 as at September 30, 2011 and $5,489,000 as at October 1, 2010). |
| CGI Group Inc. – Consolidated Financial Statements for the years ended September 30, 2012 and 2011 | 116 |
Notes to the Consolidated Financial Statements
For the years ended September 30, 2012 and 2011
(tabular amounts only are in thousands of Canadian dollars, except share data)
| 19. | Costs of services, selling and administrative |
| Year ended September 30 | ||||||||
| 2012 | 2011 | |||||||
| $ | $ | |||||||
Salaries and other member costs1 | 2,771,802 | 2,343,015 | ||||||
Hardware, software and data center related costs | 400,015 | 457,248 | ||||||
Professional fees and other contracted labour | 592,374 | 494,292 | ||||||
Property costs | 204,944 | 170,859 | ||||||
Amortization and depreciation (Note 20) | 220,054 | 210,450 | ||||||
Other operating expenses | 37,670 | 15,096 | ||||||
|
|
|
| |||||
| 4,226,859 | 3,690,960 | |||||||
|
|
|
| |||||
| 1 | Net of tax credits of $98,750,000 in 2012 ($111,832,000 in 2011). |
| 20. | Amortization and depreciation |
| Year ended September 30 | ||||||||
| 2012 | 2011 | |||||||
| $ | $ | |||||||
Depreciation of PP&E1 | 93,053 | 79,024 | ||||||
Amortization of intangible assets | 99,674 | 107,891 | ||||||
Amortization of contract costs related to transition costs | 27,327 | 23,535 | ||||||
|
|
|
| |||||
Included in costs of services, selling and administrative (Note 19) | 220,054 | 210,450 | ||||||
Amortization of contract costs related to incentives (presented as a reduction of revenue) | 8,723 | 10,364 | ||||||
Amortization of deferred financing fees (presented in finance costs) | 1,211 | 1,283 | ||||||
Amortization of premiums and discounts on investments related to funds held for clients (presented net as a reduction of revenue) | 1,371 | 1,257 | ||||||
Amortization of premiums and discounts on long-term investments (presented net in finance costs) | 39 | — | ||||||
|
|
|
| |||||
| 231,398 | 223,354 | |||||||
|
|
|
| |||||
| 1 | Depreciation of property, plant and equipment acquired under finance leases was $20,799,000 in 2012 ($18,526,000 in 2011). |
| 21. | Finance costs |
| Year ended September 30 | ||||||||
| 2012 | 2011 | |||||||
| $ | $ | |||||||
Interest on long-term debt | 41,698 | 18,224 | ||||||
Other finance costs | 401 | 1,171 | ||||||
|
|
|
| |||||
| 42,099 | 19,395 | |||||||
|
|
|
| |||||
| CGI Group Inc. – Consolidated Financial Statements for the years ended September 30, 2012 and 2011 | 117 |
Notes to the Consolidated Financial Statements
For the years ended September 30, 2012 and 2011
(tabular amounts only are in thousands of Canadian dollars, except share data)
| 22. | Accumulated other comprehensive (loss) income |
| As at September 30, 2012 | As at September 30, 2011 | As at October 1, 2010 | ||||||||||
| $ | $ | $ | ||||||||||
Net unrealized (losses) gains on translating financial statements of foreign operations (net of accumulated income tax expense of $330 as at September 30, 2012 and $1,281 as at September 30, 2011) | (7,920 | ) | 12,275 | — | ||||||||
Net unrealized gains (losses) on translating long-term debt designated as hedges of net investments in foreign operations (net of accumulated income tax expense of $959 as at September 30, 2012 and net of accumulated income tax recovery of $1,086 as at September 30, 2011) | 6,071 | (4,695 | ) | — | ||||||||
Net unrealized (losses) gains on cash flow hedges (net of accumulated income tax recovery of $3,302 as at September 30, 2012 and net of income tax expense of $1,457 as at September 30, 2011 and $5,336 as at October 1, 2010) | (6,343 | ) | 5,272 | 14,469 | ||||||||
Net unrealized actuarial gains (losses) (net of income tax expense of $1,961 as at September 30, 2012 and net of income tax recovery of $217 as at September 30, 2011) | 4,578 | (632 | ) | — | ||||||||
Net unrealized gains on investments available for sale (net of accumulated income tax expense of $1,276 as at September 30, 2012 and $854 as at September 30, 2011) | 3,339 | 2,352 | — | |||||||||
|
|
|
|
|
| |||||||
| (275 | ) | 14,572 | 14,469 | |||||||||
|
|
|
|
|
| |||||||
For the year ended September 30, 2012, $794,000 of the net unrealized gains previously recognized in other comprehensive income (net of income taxes of $277,000) were reclassified to net earnings for derivatives designated as cash flow hedges ($7,476,000 net of income taxes of $3,314,000 for the year ended September 30, 2011).
| CGI Group Inc. – Consolidated Financial Statements for the years ended September 30, 2012 and 2011 | 118 |
Notes to the Consolidated Financial Statements
For the years ended September 30, 2012 and 2011
(tabular amounts only are in thousands of Canadian dollars, except share data)
| 23. | Income taxes |
| Year ended September 30 | ||||||||
| 2012 | 2011 | |||||||
| $ | $ | |||||||
Current income tax expense | ||||||||
Current income tax expense in respect of the current year | 151,736 | 154,349 | ||||||
Adjustments recognized in the current year in relation to the current income tax expense of prior years | 1,967 | (32,230 | ) | |||||
|
|
|
| |||||
Total current income tax expense | 153,703 | 122,119 | ||||||
Deferred income tax expense | ||||||||
Deferred income tax expense relating to the origination and reversal of temporary differences | (19,680 | ) | (17,568 | ) | ||||
Recognition of previously unrecognized temporary differences | (2,626 | ) | (4,855 | ) | ||||
|
|
|
| |||||
Total deferred income tax recovery | (22,306 | ) | (22,423 | ) | ||||
|
|
|
| |||||
Total income tax expense | 131,397 | 99,696 | ||||||
|
|
|
| |||||
The Company’s effective income tax rate on income from continuing operations differs from the combined Federal and Provincial Canadian statutory tax rate as follows:
| 2012 | 2011 | |||||||
| % | % | |||||||
Company’s statutory tax rate | 27.3 | 28.8 | ||||||
Effect of foreign tax rate differences | 2.9 | (2.4 | ) | |||||
Final determination from agreements with tax authorities and expirations of statutes of limitations | (0.2 | ) | (6.8 | ) | ||||
Non-deductible and tax exempt items | 1.5 | (1.2 | ) | |||||
Effect of unrecognized tax benefit and non-deductible acquisition-related and integration costs | 18.5 | — | ||||||
Impact on future tax assets and liabilities resulting from tax rate changes | — | 0.1 | ||||||
|
|
|
| |||||
Effective income tax rate | 50.0 | 18.5 | ||||||
|
|
|
| |||||
The decrease in Company’s statutory tax rate is explained by the reduction in the federal statutory tax rate from 16.9% to 15.4%.
| CGI Group Inc. – Consolidated Financial Statements for the years ended September 30, 2012 and 2011 | 119 |
Notes to the Consolidated Financial Statements
For the years ended September 30, 2012 and 2011
(tabular amounts only are in thousands of Canadian dollars, except share data)
| 23. | Income taxes (continued) |
The continuity of deferred income tax balances is as follows:
| As at September 30, 2011 | Additions from business acquisition | Recognized in earnings | Recognized in other comprehensive income | Recognized in equity | Foreign currency translation adjustment and other | As at September 30, 2012 | ||||||||||||||||||||||
| $ | $ | $ | $ | $ | $ | $ | ||||||||||||||||||||||
Accounts payable, accrued liabilities and other long-term liabilities | 24,884 | 11,957 | (7,473 | ) | — | — | (64 | ) | 29,304 | |||||||||||||||||||
Tax benefits on losses carried forward | 7,459 | 164,960 | 8,271 | — | — | 1,710 | 182,400 | |||||||||||||||||||||
Accrued compensation | 28,354 | 3,030 | 787 | — | 6,805 | — | 38,976 | |||||||||||||||||||||
Retirement benefits | — | 19,664 | — | (2,178 | ) | — | — | 17,486 | ||||||||||||||||||||
Allowance for doubtful accounts | 3,255 | — | (1,209 | ) | — | — | — | 2,046 | ||||||||||||||||||||
PP&E, contract costs, intangible assets and other long-term assets | (122,374 | ) | (46,428 | ) | 13,769 | — | — | 2,326 | (152,707 | ) | ||||||||||||||||||
Work in progress | (28,090 | ) | — | 2,921 | — | — | 1 | (25,168 | ) | |||||||||||||||||||
Goodwill | (33,490 | ) | — | (1,754 | ) | — | — | — | (35,244 | ) | ||||||||||||||||||
Refundable tax credits on salaries | (14,756 | ) | — | (3,027 | ) | — | — | — | (17,783 | ) | ||||||||||||||||||
Unrealized gains on cash flow hedges | (1,457 | ) | — | 3,236 | 2,695 | — | (95 | ) | 4,379 | |||||||||||||||||||
Other liabilities | (3,297 | ) | 411 | 6,785 | 548 | — | 324 | 4,771 | ||||||||||||||||||||
|
|
|
|
|
|
|
|
|
|
|
|
|
| |||||||||||||||
Deferred income taxes, net | (139,512 | ) | 153,594 | 22,306 | 1,065 | 6,805 | 4,202 | 48,460 | ||||||||||||||||||||
|
|
|
|
|
|
|
|
|
|
|
|
|
| |||||||||||||||
| As at October 1, 2010 | Recognized in earnings | Recognized in other comprehensive loss | Recognized in equity | Foreign currency translation adjustment and other | As at September 30, 2011 | |||||||||||||||||||
| $ | $ | $ | $ | $ | $ | |||||||||||||||||||
Accounts payable, accrued liabilities and other long-term liabilities | 13,720 | 10,944 | 217 | — | 3 | 24,884 | ||||||||||||||||||
Tax benefits on losses carried forward | 10,321 | (2,934 | ) | — | — | 72 | 7,459 | |||||||||||||||||
Accrued compensation | 33,550 | (7,659 | ) | — | 1,790 | 673 | 28,354 | |||||||||||||||||
Allowance for doubtful accounts | 1,793 | 1,462 | — | — | — | 3,255 | ||||||||||||||||||
PP&E, contract costs, intangible assets and other long-term assets | (143,654 | ) | 23,310 | — | — | (2,030 | ) | (122,374 | ) | |||||||||||||||
Work in progress | (25,165 | ) | (2,927 | ) | — | — | 2 | (28,090 | ) | |||||||||||||||
Goodwill | (27,774 | ) | (6,116 | ) | — | — | 400 | (33,490 | ) | |||||||||||||||
Refundable tax credits on salaries | (20,985 | ) | 6,229 | — | — | — | (14,756 | ) | ||||||||||||||||
Unrealized gains on cash flow hedges | (5,323 | ) | 226 | 3,640 | — | — | (1,457 | ) | ||||||||||||||||
Other liabilities | (2,455 | ) | (112 | ) | (813 | ) | — | 83 | (3,297 | ) | ||||||||||||||
|
|
|
|
|
|
|
|
|
|
|
| |||||||||||||
Deferred income taxes, net | (165,972 | ) | 22,423 | 3,044 | 1,790 | (797 | ) | (139,512 | ) | |||||||||||||||
|
|
|
|
|
|
|
|
|
|
|
| |||||||||||||
The deferred income taxes are presented as follows in the consolidated balance sheets:
| As at September 30, 2012 | As at September 30, 2011 | As at October 1, 2010 | ||||||||||
| $ | $ | $ | ||||||||||
Deferred tax assets | 219,590 | 9,882 | 22,888 | |||||||||
Deferred tax liabilities | (171,130 | ) | (149,394 | ) | (188,860 | ) | ||||||
|
|
|
|
|
| |||||||
Deferred income taxes, net | 48,460 | (139,512 | ) | (165,972 | ) | |||||||
|
|
|
|
|
| |||||||
| CGI Group Inc. – Consolidated Financial Statements for the years ended September 30, 2012 and 2011 | 120 |
Notes to the Consolidated Financial Statements
For the years ended September 30, 2012 and 2011
(tabular amounts only are in thousands of Canadian dollars, except share data)
| 23. | Income taxes (continued) |
At September 30, 2012, the Company had $1,465,577,000 in non-capital losses carried forward and other temporary differences, of which $254,410,000 expire at various dates up to 2029 and $1,211,167,000 have no expiry dates. The Company recognized a deferred tax asset of $364,028,000 on the losses carried forward and other temporary differences and recognized a valuation allowance of $181,628,000. The increase in the valuation allowance mainly results from the Logica acquisition. The resulting net deferred tax asset of $182,400,000 is the amount that is more likely than not to be realized, based on deferred tax liabilities reversal and future taxable profits.
The temporary differences associated with investments in subsidiaries and the interest in joint venture for which a deferred tax liability has not been recognized amount to $683,282,000 ($638,285,000 in 2011).
Undistributed earnings of the Company’s foreign subsidiaries are considered to be indefinitely reinvested. Upon distribution of these earnings in the form of dividends or otherwise, the Company may be subject to withholding taxes. It is not practicable for the Company to estimate the amount of withholding taxes related to these undistributed earnings.
| CGI Group Inc. – Consolidated Financial Statements for the years ended September 30, 2012 and 2011 | 121 |
Notes to the Consolidated Financial Statements
For the years ended September 30, 2012 and 2011
(tabular amounts only are in thousands of Canadian dollars, except share data)
| 24. | Investments in subsidiaries |
2012 TRANSACTIONS
a) Acquisition
On August 20, 2012, the Company acquired 100% of the outstanding ordinary shares of Logica, a business and technology services company, for a total cash consideration of $2,682,380,000 (£1,715,738,000) and the assumption of Logica’s net debt of $866,658,000. The acquisition and the repayment of Logica’s debt assumed were funded through a combination of sources; the Company issued 46,707,146 new Class A subordinate voting shares of the Company at a price of $21.41 to Caisse de dépôt et placement du Québec for a total consideration of $1,000,000,000, excluding transaction costs. In addition, the Company drew under a term loan agreement $1,933,858,000. The remaining funding came from the Company’s existing credit facility and cash. The acquisition of Logica will increase the ability of the Company to offer a mix of business and technology expertise to clients across the world through a combination of local and global delivery options.
The purchase price allocation shown below is preliminary and based on management’s best estimates. The final purchase price allocation is expected to be completed as soon as management has gathered all of the significant information available and considered necessary in order to finalize this allocation.
| Logica | ||||
| $ | ||||
Assets | ||||
Current assets1 | 1,374,838 | |||
Property, plant and equipment | 250,808 | |||
Contract costs | 71,697 | |||
Intangible assets | 603,683 | |||
Other long-term assets | 87,789 | |||
Deferred tax assets | 197,210 | |||
Goodwill2 | 3,276,172 | |||
|
| |||
| 5,862,197 | ||||
|
| |||
Liabilities | ||||
Current liabilities | (1,546,273 | ) | ||
Debt3 | (808,775 | ) | ||
Deferred tax liabilities | (43,616 | ) | ||
Long-term provisions | (182,880 | ) | ||
Retirement benefits obligations | (113,526 | ) | ||
Other long-term liabilities | (426,864 | ) | ||
|
| |||
| (3,121,934 | ) | |||
|
| |||
Bank overdraft assumed, net | (57,883 | ) | ||
|
| |||
Net assets acquired | 2,682,380 | |||
|
| |||
Cash consideration | 2,676,912 | |||
Consideration payable4 | 5,468 | |||
|
| |||
| 1 | The current assets include accounts receivable with a fair value of $899,089,000 which approximates the gross amount due under the contracts. |
| 2 | The preliminary goodwill arising from the acquisition mainly represents the future economic value associated to acquired work force and synergies with the Company’s operations. All of the goodwill is included in the Logica segment. None of the goodwill recognized is expected to be deductible for income tax purposes. |
| 3 | During the year, the Company made a repayment of $891,354,000 of Logica’s debt assumed in business acquisition, resulting in a loss of $83,632,000 which was recorded in acquisition-related and integration costs. |
| 4 | Payable within one year. |
| 5 | The purchase price allocation was translated using the exchange rate as at August 20, 2012. |
| CGI Group Inc. – Consolidated Financial Statements for the years ended September 30, 2012 and 2011 | 122 |
Notes to the Consolidated Financial Statements
For the years ended September 30, 2012 and 2011
(tabular amounts only are in thousands of Canadian dollars, except share data)
| 24. | Investments in subsidiaries (continued) |
2012 TRANSACTIONS (CONTINUED)
a) Acquisition (continued)
In connection with the acquisition of Logica, the Company expensed $254,973,000 during the year ended September 30, 2012. Included in that amount are acquisition-related costs of $36,403,000, integration costs of $109,714,000, make whole on Logica’s debt and other financing costs of $108,856,000. The acquisition-related costs consist mainly of professional fees incurred for the acquisition and foreign exchange call options for an amount of $7,146,000 in order to comply with the funds certain requirement under the UK City Code on Takeovers and Mergers.
Integration costs driven by the restructuring of Logica’s operations, estimated at approximately $400,000,000, mainly include the costs related to the termination of certain employees identified as redundant. The acquisition-related and integration costs are separately disclosed in the Company’s consolidated statements of earnings.
Logica’s revenue for the year ended September 30, 2012 represents approximately 12% of the total consolidated revenue of the Company. From the date of acquisition, included in the Company’s results are $567,875,000 of revenues and $259,981,000 of net loss from Logica, which includes acquisition-related and integration costs. On a pro forma basis, the revenue, the earnings before income taxes and the net loss of the combined Company for the year ended September 30, 2012 would have been approximately $10,231,555,000, $81,733,000 and $5,399,000, respectively, had the Logica acquisition occurred as of October 1, 2011. The pro forma financial information was constructed using the Company’s 2012 annual results and Logica’s results from July 1, 2011 to June 30, 2012 due to the differences in reporting periods and includes business combination adjustments such as amortization of acquired intangible assets, interest expense on borrowings, elimination of acquisition-related costs, integration costs, make whole and other financing costs as well as related tax effects. The changes to historical transactions and the benefits from integration initiatives, severances of redundant resources and savings related to the retirement of excess facilities have not been reflected in these pro forma amounts. The pro forma amounts are not necessarily indicative of the results of operations of the Company that would have resulted had the acquisition actually occurred on October 1, 2011, or the results that may be obtained in the future.
b) Disposal
There were no significant disposals during fiscal 2012.
2011 TRANSACTIONS
a) Acquisition
There were no significant acquisitions during fiscal 2011.
| CGI Group Inc. – Consolidated Financial Statements for the years ended September 30, 2012 and 2011 | 123 |
Notes to the Consolidated Financial Statements
For the years ended September 30, 2012 and 2011
(tabular amounts only are in thousands of Canadian dollars, except share data)
| 24. | Investments in subsidiaries (continued) |
2011 TRANSACTIONS (CONTINUED)
b) Disposal
On April 4, 2011, the Company concluded a transaction for a net consideration of $10,500,000 whereby Conseiller en informatique d’affaires CIA inc. (“CIA”) repurchased its shares held by the Company, which represented a 68% interest, excluding its Paris operations, and the Company simultaneously purchased 32% of the operations carried out in CIA’s Paris office not previously owned.
The Company received $5,917,000 during the year ended September 30, 2011 and the remaining balance of $4,583,000 in fiscal 2012. The sale resulted in a gain of $3,655,000 recognized within other income in the consolidated statements of earnings.
c) Modifications to purchase price allocation
During the year ended September 30, 2011, the Company finalized the purchase price allocation and made adjustments relating to the acquisition of Stanley, Inc. (“Stanley”). The resulting impact for the year ended September 30, 2011 was a decrease in intangible assets of $1,743,000, deferred tax assets of $299,000 and deferred tax liabilities of $682,000 and an increase of accrued compensation of $1,491,000, accounts payable and accrued liabilities of $50,000 and income taxes payable of $1,475,000, whereas goodwill increased by $4,376,000. The prior period figures have not been adjusted given that the effect of restatement was not significant.
d) Acquisition-related and integration costs
In connection with the acquisition of Stanley in fiscal year 2010, the Company expensed $3,675,000 during the year ended September 30, 2011. The expenses included costs to integrate the operations and to realize synergies.
| 25. | Joint venture: supplementary information |
During the year ended September 30, 2012, the Company sold its 49% interest in Innovapost Inc. (“Innovapost”) and received consideration of $26,000,000. The Company recorded a gain of $2,981,000 relating to the disposal within other income.
| CGI Group Inc. – Consolidated Financial Statements for the years ended September 30, 2012 and 2011 | 124 |
Notes to the Consolidated Financial Statements
For the years ended September 30, 2012 and 2011
(tabular amounts only are in thousands of Canadian dollars, except share data)
| 26. | Supplementary cash flow information |
a) Net change in non-cash working capital items is as follows for the years ended September 30:
| 2012 | 2011 | |||||||
| $ | $ | |||||||
Accounts receivable | (61,373 | ) | (87,828 | ) | ||||
Work in progress | (15,815 | ) | (31,971 | ) | ||||
Prepaid expenses and other assets | (10,020 | ) | 44,485 | |||||
Accounts payable, accrued liabilities and other long-term liabilities | 62,161 | 22,183 | ||||||
Accrued compensation | 89,836 | (1,595 | ) | |||||
Provisions | 85,715 | 15,620 | ||||||
Deferred revenue | 46,727 | (2,956 | ) | |||||
Income taxes | (21,273 | ) | (35,236 | ) | ||||
|
|
|
| |||||
| 175,958 | (77,298 | ) | ||||||
|
|
|
| |||||
b) Non-cash operating, investing and financing activities related to operations are as follows for the years ended September 30:
| 2012 | 2011 | |||||||
| $ | $ | |||||||
Operating activities | ||||||||
Accounts receivable | (284 | ) | (326 | ) | ||||
Prepaid expenses and other assets | (11,105 | ) | (26,400 | ) | ||||
|
|
|
| |||||
| (11,389 | ) | (26,726 | ) | |||||
|
|
|
| |||||
Investing activities | ||||||||
Purchase of property, plant and equipment | (32,207 | ) | (36,083 | ) | ||||
Additions of intangible assets | (15,359 | ) | (15,939 | ) | ||||
Additions of other long-term assets | (7,426 | ) | (3,646 | ) | ||||
|
|
|
| |||||
| (54,992 | ) | (55,668 | ) | |||||
|
|
|
| |||||
Financing activities | ||||||||
Increase in obligations under finance leases | 29,753 | 28,822 | ||||||
Increase in obligations | 36,344 | 53,246 | ||||||
Issuance of shares | 284 | 326 | ||||||
|
|
|
| |||||
| 66,381 | 82,394 | |||||||
|
|
|
| |||||
c) Interest paid and income taxes paid are classified within operating activities and are as follows for the years ended September 30:
| 2012 | 2011 | |||||||
| $ | $ | |||||||
Interest paid | 34,573 | 17,807 | ||||||
Interest received | 3,415 | 2,017 | ||||||
Income taxes paid | 144,010 | 135,433 | ||||||
| CGI Group Inc. – Consolidated Financial Statements for the years ended September 30, 2012 and 2011 | 125 |
Notes to the Consolidated Financial Statements
For the years ended September 30, 2012 and 2011
(tabular amounts only are in thousands of Canadian dollars, except share data)
| 27. | Segmented information |
In the prior year, management regularly reviewed the Company’s operating results through four operating segments, namely: U.S. & India, Canada, Global Infrastructure Services (“GIS”) and Europe & Asia Pacific. As a result of changes to the management reporting structure in the current year, the Company is managed through the following four operating segments: U.S., Canada, GIS, Europe & Asia Pacific.
The GIS operating segment incorporates all services provided to clients globally for the management of their technology infrastructure. The other operating segments are based on the Company’s geographic delivery model: U.S., Canada and Europe & Asia Pacific, which include their respective utilization of India’s delivery centers.
As at September 30, 2012, the operations of Logica were managed and reviewed as one component and is therefore being presented as its own operating segment. As a result of changes in the management reporting structure effective October 1, 2012, the Company will change its operating segments beginning in the first quarter of 2013 as follows:
Canada;
United States of America;
Nordics, Southern Europe and South America;
Central and Eastern Europe (including Netherlands, Germany and Belgium);
United Kingdom;
Asia Pacific (including Australia, India, Philippines and the Middle East);
France (including Luxembourg and Morocco).
The following presents information on the Company’s operations based on its current management structure. The Company has retrospectively revised the segmented information for the comparative periods to conform to the segmented information structure in effect as of September 30, 2012.
| Year ended September 30, 2012 | ||||||||||||||||||||||||
| U.S. | Canada | GIS | Europe & Asia Pacific | Logica | Total | |||||||||||||||||||
| $ | $ | $ | $ | $ | $ | |||||||||||||||||||
Segment revenue | 2,091,112 | 1,212,615 | 684,870 | 215,982 | 567,875 | 4,772,454 | ||||||||||||||||||
|
|
|
|
|
|
|
|
|
|
|
| |||||||||||||
Earnings (loss) before acquisition-related and integration costs, finance costs, finance income, other income, share of profit on joint venture and income tax expense1 | 242,965 | 257,011 | 53,265 | 12,333 | (18,845 | ) | 546,729 | |||||||||||||||||
Acquisition-related and integration costs | 254,973 | |||||||||||||||||||||||
Finance costs | 42,099 | |||||||||||||||||||||||
Finance income | (5,318 | ) | ||||||||||||||||||||||
Other income | (3,955 | ) | ||||||||||||||||||||||
Share of profit on joint venture | (3,996 | ) | ||||||||||||||||||||||
|
|
|
|
|
|
|
|
|
|
|
| |||||||||||||
Earnings before income taxes | 262,926 | |||||||||||||||||||||||
|
|
|
|
|
|
|
|
|
|
|
| |||||||||||||
| 1 | Amortization and depreciation included in the U.S., Canada, GIS, Europe & Asia Pacific and Logica operating segments is $82,258,000, $42,370,000, $76,674,000 $4,269,000 and $24,577,000 respectively, for the year ended September 30, 2012. |
| CGI Group Inc. – Consolidated Financial Statements for the years ended September 30, 2012 and 2011 | 126 |
Notes to the Consolidated Financial Statements
For the years ended September 30, 2012 and 2011
(tabular amounts only are in thousands of Canadian dollars, except share data)
| 27. | Segmented information (continued) |
Year ended September 30, 2011 | U.S. | Canada | GIS | Europe & Asia Pacific | Total | |||||||||||||||
| $ | $ | $ | $ | $ | ||||||||||||||||
Segment revenue | 1,896,002 | 1,287,056 | 816,663 | 224,221 | 4,223,942 | |||||||||||||||
|
|
|
|
|
|
|
|
|
| |||||||||||
Earnings before acquisition-related and integration costs, finance costs, finance income, other income, share of profit on joint venture and income tax expense1 | 167,734 | 249,103 | 110,880 | 8,630 | 536,347 | |||||||||||||||
Acquisition-related and integration costs | 3,675 | |||||||||||||||||||
Finance costs | 19,395 | |||||||||||||||||||
Finance income | (3,552 | ) | ||||||||||||||||||
Other income | (7,647 | ) | ||||||||||||||||||
Share of profit on joint venture | (13,359 | ) | ||||||||||||||||||
|
|
|
|
|
|
|
|
|
| |||||||||||
Earnings before income taxes | 537,835 | |||||||||||||||||||
|
|
|
|
|
|
|
|
|
| |||||||||||
| 1 | Amortization and depreciation included in the U.S., Canada, GIS, and Europe & Asia Pacific operating segments is $85,655,000, $53,451,000 $78,781,000 and $4,184,000 respectively, for the year ended September 30, 2011. |
The accounting policies of each operating segment are the same as those described in the summary of significant accounting policies (Note 3). Intersegment revenue is priced as if the revenue was from third parties.
GEOGRAPHIC INFORMATION
The following table provides information for property, plant and equipment, contract costs and intangible assets based on their location1:
| As at September 30, 2012 | As at September 30, 2011 | As at October 1, 2010 | ||||||||||
| $ | $ | $ | ||||||||||
U.S. | 291,690 | 313,860 | 361,702 | |||||||||
Canada | 292,990 | 305,046 | 348,936 | |||||||||
U.K.2 | 283,921 | — | — | |||||||||
France2 | 204,538 | — | — | |||||||||
Sweden2 | 93,231 | — | — | |||||||||
Other | 361,259 | 30,370 | 28,139 | |||||||||
|
|
|
|
|
| |||||||
| 1,527,629 | 649,276 | 738,777 | ||||||||||
|
|
|
|
|
| |||||||
| 1 | Excludes goodwill which has been allocated to operating segments (Note 11). |
| 2 | Balances as of September 30, 2011 and October 1, 2010 are not significant. |
| CGI Group Inc. – Consolidated Financial Statements for the years ended September 30, 2012 and 2011 | 127 |
Notes to the Consolidated Financial Statements
For the years ended September 30, 2012 and 2011
(tabular amounts only are in thousands of Canadian dollars, except share data)
| 27. | Segmented information (continued) |
GEOGRAPHIC INFORMATION (CONTINUED)
The following table provides revenue information based on the client’s location:
| 2012 | 2011 | |||||||
| $ | $ | |||||||
Revenue | ||||||||
U.S. | 2,240,668 | 2,041,609 | ||||||
Canada | 1,721,490 | 1,911,447 | ||||||
U.K.1 | 205,247 | — | ||||||
France1 | 153,879 | — | ||||||
Sweden1 | 59,822 | — | ||||||
Other | 391,348 | 270,886 | ||||||
|
|
|
| |||||
| 4,772,454 | 4,223,942 | |||||||
|
|
|
| |||||
| 1 | Amounts for the year ended September 30, 2011 are not significant. |
INFORMATION ABOUT SERVICES
The following table provides revenue information based on services provided by the Company:
| 2012 | 2011 | |||||||
| $ | $ | |||||||
Outsourcing | ||||||||
IT Services | 2,216,942 | 2,096,049 | ||||||
BPS | 838,879 | 749,728 | ||||||
Systems integration and consulting | 1,716,633 | 1,378,165 | ||||||
|
|
|
| |||||
| 4,772,454 | 4,223,942 | |||||||
|
|
|
| |||||
MAJOR CLIENT INFORMATION
Contracts with the U.S. federal government and its various agencies accounted for $1,336,941,000 of revenues included within the U.S. segment for the year ended September 30, 2012 ($1,233,784,000 for the year ending September 30, 2011).
| CGI Group Inc. – Consolidated Financial Statements for the years ended September 30, 2012 and 2011 | 128 |
Notes to the Consolidated Financial Statements
For the years ended September 30, 2012 and 2011
(tabular amounts only are in thousands of Canadian dollars, except share data)
| 28. | Related party transactions |
| A) | TRANSACTIONS WITH JOINT VENTURE |
Prior to its disposal, in the normal course of business, the Company was party to contracts with Innovapost, a joint venture, pursuant to which the Company was its preferred IT supplier.
Transactions and resulting balances, which were measured at commercial rates (exchange amount), are presented below. The amounts outstanding were unsecured and settled in cash. No guarantees were given or received and no expense was recognized in the current or prior periods for bad or doubtful debts in respect of the amounts owed.
Revenue was $20,014,000 and $80,075,000 for the years ended September 30, 2012 and 2011, respectively.
| 2012 | 2011 | |||||||
| $ | $ | |||||||
Accounts receivable | — | 4,570 | ||||||
Work in progress | — | 1,158 | ||||||
Contract costs | — | 3,713 | ||||||
Deferred revenue | — | 2,985 | ||||||
| B) | TRANSACTIONS WITH SUBSIDIARIES |
Balances and transactions between the Company and its subsidiaries, which are related parties of the Company, have been eliminated on consolidation. The Company owns 100% of the equity interests of its subsidiaries.
The Company’s principal subsidiaries are as follows:
Name of subsidiary | Country of incorporation | |
| Conseillers en Gestion et Informatique CGI Inc. | Canada | |
| CGI Information Systems and Management Consultants Inc. | Canada | |
| CGI Technologies and Solutions Inc. | United States | |
| Stanley Associates, Inc. | United States | |
| CGI Federal Inc. | United States | |
| Oberon Associates, Inc. | United States | |
| CGI Information Systems and Management Consultants Private Limited | India | |
| CGI Information Systems and Management Consultants (UK) Limited | United Kingdom | |
| Logica France SAS | France | |
| Logica Business Consulting France SAS | France | |
| Logica Nederland BV | Netherlands | |
| Logica Deutschland GmbH & Co KG | Germany | |
| LogicaTI Portugal SA | Portugal | |
| Logica Danmark A/S | Denmark | |
| Logica Norge AS | Norway | |
| Logica Australia Pty Limited | Australia | |
| Logica Private Limited | India | |
| Logica North America Inc. | United States | |
| Logica Suomi Oy | Finland | |
| Logica Sverige AB | Sweden | |
| Logica UK Limited | United Kingdom |
| CGI Group Inc. – Consolidated Financial Statements for the years ended September 30, 2012 and 2011 | 129 |
Notes to the Consolidated Financial Statements
For the years ended September 30, 2012 and 2011
(tabular amounts only are in thousands of Canadian dollars, except share data)
| 28. | Related party transactions (continued) |
| C) | COMPENSATION PAID TO KEY MANAGEMENT PERSONNEL |
Compensation paid to key management personnel, defined as the Board of Directors (the “Board”) and the Executive Vice-President and Chief Financial Officer, is as follows:
| 2012 | 2011 | |||||||
| $ | $ | |||||||
Short-term employee benefits | 3,909 | 6,915 | ||||||
Share-based payments | 5,732 | 4,702 | ||||||
| 29. | Employee benefits |
The Company operates various post-employment plans, including defined benefit and defined contribution pension plans as well as other benefits plans to its employees:
DEFINED BENEFIT PLANS
The following table presents amounts for post-retirement benefits plans and post-employment benefits plan other than pensions included in the consolidated balance sheets:
As at September 30, 2012 | U.K. | Netherlands | Other | Total | ||||||||||||
| $ | $ | $ | $ | |||||||||||||
Defined benefit obligations | (437,585 | ) | (326,620 | ) | (150,827 | ) | (915,032 | ) | ||||||||
Fair value of plan assets | 433,727 | 326,793 | 45,599 | 806,119 | ||||||||||||
|
|
|
|
|
|
|
| |||||||||
| (3,858 | ) | 173 | (105,228 | ) | (108,913 | ) | ||||||||||
Fair value of reimbursement rights | — | — | 19,122 | 19,122 | ||||||||||||
|
|
|
|
|
|
|
| |||||||||
Net asset/(liability) recognized in the balance sheets | (3,858 | ) | 173 | (86,106 | ) | (89,791 | ) | |||||||||
|
|
|
|
|
|
|
| |||||||||
Presented as: | ||||||||||||||||
Other long-term assets (Note 10) | ||||||||||||||||
Insurance contracts held to fund defined benefit pension and life assurance arrangements | — | — | 19,122 | 19,122 | ||||||||||||
Retirement benefits assets | 8,790 | 375 | — | 9,165 | ||||||||||||
Retirement benefits obligations | (12,648 | ) | (202 | ) | (105,228 | ) | (118,078 | ) | ||||||||
|
|
|
|
|
|
|
| |||||||||
| (3,858 | ) | 173 | (86,106 | ) | (89,791 | ) | ||||||||||
|
|
|
|
|
|
|
| |||||||||
a) Defined benefit plans of Logica
During the year the Company acquired Logica. Logica operates among others defined benefit retirement plans primarily for the benefit of employees in the U.K. and the Netherlands, with smaller plans in other countries.
The largest plans are funded plans, where contributions are made by the Company, and also in some cases by the employee, to build up a separate fund of assets which is used to pay the employee benefits. The plans’ assets are held in funds separate from those of the Company. Contribution rates are assessed by the actuary or insurer of each plan in regular funding reviews. Plan benefits typically provide for a pension on retirement based on years of qualifying service and final pensionable salary.
The Company also operates unfunded plans where the Company will be required to pay the future employee benefits from its future earnings.
| CGI Group Inc. – Consolidated Financial Statements for the years ended September 30, 2012 and 2011 | 130 |
Notes to the Consolidated Financial Statements
For the years ended September 30, 2012 and 2011
(tabular amounts only are in thousands of Canadian dollars, except share data)
| 29. | Employee benefits (continued) |
DEFINED BENEFIT PLANS (CONTINUED)
a) Defined benefit plans of Logica (continued)
The two largest plans are in the U.K. and the Netherlands and make up around 80% of the overall obligations. Some further details on these plans are provided below.
Stichting Pensioenfonds CMG (Netherlands) – last full actuarial valuation at December 31, 2011
The plan is closed to accrual and is currently in the process of being liquidated. At September 30, 2012, the plan held an insurance policy which matched the majority of the benefits due to members. Once the liquidation of the plan is completed, the Company will no longer be exposed to risks in respect of this plan.
LogicaCMG UK Pension and Life Assurance Plan (U.K.) – last full actuarial valuation at December 31, 2009
In 2011, a funding valuation which reported a deficit of $1,422,000 (£900,000) was concluded. A recovery plan has been agreed to fund the deficit over a five year period from January 1, 2011 to December 31, 2015 by making annual payments of $317,000 (£200,000).
CMG UK Pension Plan (U.K.) – last full actuarial valuation at June 30, 2010
The plan is closed to accrual and the last funding valuation reported a deficit of $76,479,000 (£47,300,000). A revised recovery plan was agreed with the Trustees and it was agreed to pay $11,426,000 (£7,200,000) annually for a period of 5 years and 9 months from July 1, 2011 to March 31, 2017.
Insurance policies taken out to fund retirement benefit plans that do not qualify as plan assets are presented as reimbursement rights within other long-term assets. Such policies fund pension plans in Germany and a life assurance plan in the U.S.
| CGI Group Inc. – Consolidated Financial Statements for the years ended September 30, 2012 and 2011 | 131 |
Notes to the Consolidated Financial Statements
For the years ended September 30, 2012 and 2011
(tabular amounts only are in thousands of Canadian dollars, except share data)
| 29. | Employee benefits (continued) |
DEFINED BENEFIT PLANS (CONTINUED)
a) Defined benefit plans of Logica (continued)
The following table presents a reconciliation of the movements in the defined benefit obligations between the beginning and end of the year, and an analysis of the defined benefit obligations between unfunded plans and those plans that are wholly funded:
Defined benefit obligations | U.K. | Netherlands | Other | Total | ||||||||||||
| $ | $ | $ | $ | |||||||||||||
As at October 1, 2011 | — | — | — | — | ||||||||||||
Liabilities assumed in a business acquisition | 436,695 | 304,686 | 134,780 | 876,161 | ||||||||||||
Current service cost | 140 | — | 643 | 783 | ||||||||||||
Interest cost | 2,267 | 1,289 | 493 | 4,049 | ||||||||||||
Actuarial (gains) losses due to change in assumptions | (10,788 | ) | 10,214 | 3,850 | 3,276 | |||||||||||
Actuarial losses (gains) due to experience adjustments | 173 | — | (190 | ) | (17 | ) | ||||||||||
Termination benefits | 95 | — | — | 95 | ||||||||||||
Plan participant contributions | 38 | — | 32 | 70 | ||||||||||||
Benefits paid from the plan | (421 | ) | (687 | ) | (410 | ) | (1,518 | ) | ||||||||
Benefits paid directly by employer | — | — | (160 | ) | (160 | ) | ||||||||||
Foreign currency translation adjustment | 9,386 | 11,118 | 4,367 | 24,871 | ||||||||||||
|
|
|
|
|
|
|
| |||||||||
As at September 30, 2012 | 437,585 | 326,620 | 143,405 | 907,610 | ||||||||||||
|
|
|
|
|
|
|
| |||||||||
Defined benefit obligation of unfunded plans | — | — | 39,548 | 39,548 | ||||||||||||
Defined benefit obligation of funded plans | 437,585 | 326,620 | 103,857 | 868,062 | ||||||||||||
|
|
|
|
|
|
|
| |||||||||
As at September 30, 2012 | 437,585 | 326,620 | 143,405 | 907,610 | ||||||||||||
|
|
|
|
|
|
|
| |||||||||
The following table presents a reconciliation of the movements in plan assets and reimbursement rights between the beginning and end of the year:
Plan assets and reimbursement rights | U.K. | Netherlands | Other | Total | ||||||||||||
| $ | $ | $ | $ | |||||||||||||
As at October 1, 2011 | — | — | — | — | ||||||||||||
Assets acquired in a business acquisition | 423,111 | 304,944 | 61,263 | 789,318 | ||||||||||||
Expected return on assets | 2,196 | 1,291 | 246 | 3,733 | ||||||||||||
Employer contributions | 233 | — | 649 | 882 | ||||||||||||
Experience (losses) gains on assets | (594 | ) | 10,119 | 1,122 | 10,647 | |||||||||||
Plan participants contributions | 38 | — | 32 | 70 | ||||||||||||
Benefits paid from the plan | (421 | ) | (687 | ) | (482 | ) | (1,590 | ) | ||||||||
Benefits paid directly by employer | — | — | (160 | ) | (160 | ) | ||||||||||
Foreign currency translation adjustment | 9,164 | 11,126 | 2,051 | 22,341 | ||||||||||||
|
|
|
|
|
|
|
| |||||||||
As at September 30, 2012 | 433,727 | 326,793 | 64,721 | 825,241 | ||||||||||||
|
|
|
|
|
|
|
| |||||||||
Plan assets | 433,727 | 326,793 | 45,599 | 806,119 | ||||||||||||
Reimbursement rights | — | — | 19,122 | 19,122 | ||||||||||||
|
|
|
|
|
|
|
| |||||||||
As at September 30, 2012 | 433,727 | 326,793 | 64,721 | 825,241 | ||||||||||||
|
|
|
|
|
|
|
| |||||||||
| CGI Group Inc. – Consolidated Financial Statements for the years ended September 30, 2012 and 2011 | 132 |
Notes to the Consolidated Financial Statements
For the years ended September 30, 2012 and 2011
(tabular amounts only are in thousands of Canadian dollars, except share data)
| 29. | Employee benefits (continued) |
DEFINED BENEFIT PLANS (CONTINUED)
a) Defined benefit plans of Logica (continued)
The plan assets at the end of the year consist of:
As at September 30, 2012 | U.K. | Netherlands | Other | Total | ||||||||||||
| $ | $ | $ | $ | |||||||||||||
Equities | 141,402 | — | 2,465 | 143,867 | ||||||||||||
Bonds | 262,845 | — | 20,065 | 282,910 | ||||||||||||
Property | 21,398 | — | 4,930 | 26,328 | ||||||||||||
Cash | 8,082 | 2,733 | 2,263 | 13,078 | ||||||||||||
Other | — | 324,060 | 15,876 | 339,936 | ||||||||||||
|
|
|
|
|
|
|
| |||||||||
| 433,727 | 326,793 | 45,599 | 806,119 | |||||||||||||
|
|
|
|
|
|
|
| |||||||||
The defined benefit pension plan in Netherlands is in the process of being liquidated and has been reinsured. As the plan is not fully settled yet, the Company will continue to disclose the gross position of the plan. Once the liquidation of the plan is completed, the Company will no longer be exposed to risks in respect of this plan.
Plan assets do not include any ordinary shares of the Company or property occupied by the Company or any other assets used by the Company.
The following table summarizes the actual return on assets:
As at September 30, 2012 | U.K. | Netherlands | Other | Total | ||||||||||||
| $ | $ | $ | $ | |||||||||||||
Actual return on plan assets and reimbursement rights | 1,602 | 11,410 | 1,368 | 14,380 | ||||||||||||
The following table summarizes the expense recognized in the consolidated statements of earnings:
Year ended September 30, 2012 | U.K. | Netherlands | Other | Total | ||||||||||||
| $ | $ | $ | $ | |||||||||||||
Current service cost | 140 | — | 643 | 783 | ||||||||||||
Termination benefits | 95 | — | — | 95 | ||||||||||||
Interest cost | 2,267 | 1,289 | 493 | 4,049 | ||||||||||||
Expected return on plan assets and reimbursement rights | (2,196 | ) | (1,291 | ) | (246 | ) | (3,733 | ) | ||||||||
|
|
|
|
|
|
|
| |||||||||
| 306 | (2 | ) | 890 | 1,194 | ||||||||||||
|
|
|
|
|
|
|
| |||||||||
Presented as: | ||||||||||||||||
Costs of services, selling and administrative | 235 | — | 643 | 878 | ||||||||||||
Finance costs | 71 | (2 | ) | 247 | 316 | |||||||||||
|
|
|
|
|
|
|
| |||||||||
| 306 | (2 | ) | 890 | 1,194 | ||||||||||||
|
|
|
|
|
|
|
| |||||||||
| CGI Group Inc. – Consolidated Financial Statements for the years ended September 30, 2012 and 2011 | 133 |
Notes to the Consolidated Financial Statements
For the years ended September 30, 2012 and 2011
(tabular amounts only are in thousands of Canadian dollars, except share data)
| 29. | Employee benefits (continued) |
DEFINED BENEFIT PLANS (CONTINUED)
a) Defined benefit plans of Logica (continued)
The following table summarizes the amounts recognized in other comprehensive income:
As at September 30, 2012 | U.K. | Netherlands | Other | Total | ||||||||||||
| $ | $ | $ | $ | |||||||||||||
Experience (gains) losses on assets and reimbursement rights | 594 | (10,119 | ) | (1,122 | ) | (10,647 | ) | |||||||||
Actuarial (gains) losses on liabilities due to experience and change of assumptions | (10,615 | ) | 10,214 | 3,660 | 3,259 | |||||||||||
|
|
|
|
|
|
|
| |||||||||
| (10,021 | ) | 95 | 2,538 | (7,388 | ) | |||||||||||
|
|
|
|
|
|
|
| |||||||||
Actuarial assumptions
The following are the principal actuarial assumptions at the reporting date (expressed as weighted averages). The assumed discount rate, rate of inflation, salary increases and mortality all have a significant effect on the accounting valuation.
Year ended September 30, 2012 | U.K. | Netherlands | Other | Total | ||||||||||||
| % | % | % | % | |||||||||||||
Discount rate | 4.55 | 3.55 | 3.35 | 4.00 | ||||||||||||
Expected return on plan assets | 4.55 | 3.55 | 3.26 | 4.07 | ||||||||||||
Future salary increases | 2.60 | — | — | — | ||||||||||||
Future pension increases | 2.57 | — | — | — | ||||||||||||
Inflation | 2.60 | 2.00 | 2.10 | 2.31 | ||||||||||||
Assumptions regarding future mortality experience are set based on actuarial advice in accordance with published statistics and experience in each territory. Mortality assumptions for the most important countries are based on the following post-retirement mortality tables: (1) UK: 110% PNXA00 (year of birth) plus CMI_2011 projections with 1% p.a. minimum long term improvement rate; and (2) Netherlands: AG Generation 2010-2060 with an age setback of 1 year.
The overall expected rate of return on plan assets is calculated as a weighted average of the expected rates of return of individual asset classes. The weighted average is calculated by reference to the amount in each class of plan assets at the end of the reporting period. The expected rates of return on bonds is determined by reference to market yields at the end of the reporting period for bonds of similar term to those held as plan assets. The expected rate of return on equities is determined by reference to real historical equity market returns.
The following table shows the sensitivity of the defined benefit obligations to changes in these assumptions:
As at September 30, 2012 | U.K. | Netherlands | Other | Total | ||||||||||||
| $ | $ | $ | $ | |||||||||||||
Increase of 0.25% in the discount rate | (18,043 | ) | (14,154 | ) | (5,200 | ) | (37,397 | ) | ||||||||
Decrease of 0.25% in the discount rate | 19,424 | 13,599 | 5,195 | 38,218 | ||||||||||||
Increase of 0.25% in inflation | 13,698 | — | 778 | 14,476 | ||||||||||||
Decrease of 0.25% in inflation | (11,902 | ) | — | (830 | ) | (12,732 | ) | |||||||||
Increase of one year in life expectancy | 8,901 | 6,855 | 2,222 | 17,978 | ||||||||||||
Decrease of one year in life expectancy | (9,004 | ) | (7,018 | ) | (2,184 | ) | (18,206 | ) | ||||||||
| CGI Group Inc. – Consolidated Financial Statements for the years ended September 30, 2012 and 2011 | 134 |
Notes to the Consolidated Financial Statements
For the years ended September 30, 2012 and 2011
(tabular amounts only are in thousands of Canadian dollars, except share data)
| 29. | Employee benefits (continued) |
DEFINED BENEFIT PLANS (CONTINUED)
a) Defined benefit plans of Logica (continued)
Actuarial assumptions (continued)
The Company expects to contribute $18,200,000 to defined benefit plans during the next year, of which $14,620,000 relates to UK plans, and $3,580,000 relating to other plans.
b) Post-employment benefits plan other than pensions
The Company maintains a post-employment benefits plan other than pensions to cover certain former retired employees associated with the divested Canadian claims adjusting and risk management services business. The benefits other than pensions include a health and dental care coverage as well as life insurance coverage.
The post-employment benefits liability totaled $7,422,000 as at September 30, 2012 ($7,035,000 and $6,228,000 at September 30, 2011 and October 1, 2010, respectively). The Company measures its benefits liability as at September 30 of each year. An actuarial valuation was performed at September 30, 2011, and the next actuarial valuation will be as at September 30, 2014. The accrued benefit obligation was determined based on an annual discount rate of 4.50%.
DEFINED CONTRIBUTION PLANS
The Company also operates defined contribution retirement plans in U.K. and overseas, under which contributions are paid by the Company undertakings. In some countries, contributions are made into state pension plans. The pension cost expense for defined contribution plans amounted to $29,000,000.
In Sweden, the Company contributes to the Alecta SE pension plan which is a defined benefit pension plan. This pension plan is classified as a defined contribution plan as it is a multi-employer plan. Any surplus or deficit in the plan will affect the amount of future contributions payable. Alecta use a collective funding ratio to determine the surplus or deficit in the pension plan. The collective funding is the difference between Alecta’s assets and the commitments to the policyholders and insured individuals. The collective solvency is normally allowed to vary between 125% and 155%, with the target being 140%. At September 30, 2012, Alecta’s collective funding ratio was 137%. The plan expense was $3,450,000 (SEK 23,000,000).
The Company also paid contributions to defined contribution plans for CGI’s employees of $16,194,000 in 2012 and $14,623,000 in 2011.
OTHER BENEFIT PLANS
The Company maintains two non-qualified deferred compensation plans covering some of its U.S. management.
One of these plans is an unfunded plan and the non-qualified deferred compensation liability totaled $846,000 as at September 30, 2012 ($1,775,000 and $2,376,000 at September 30, 2011 and October 1, 2010, respectively).
The other plan is a funded plan for which a trust was established so that the plan assets could be segregated; however, the assets are subject to the Company’s general creditors in the case of bankruptcy. The assets, included in other long-term assets, composed of investments, vary with employees’ contributions and changes in the value of the investments. The change in liability associated with the plan is equal to the change of the assets. The assets in the trust and the associated liabilities totaled $18,878,000 as at September 30, 2012 ($16,452,000 and $16,318,000 as at September 30, 2011 and October 1, 2010, respectively).
The deferred compensation plans assets and liabilities are presented in other long-term assets and other long-term liabilities, respectively.
| CGI Group Inc. – Consolidated Financial Statements for the years ended September 30, 2012 and 2011 | 135 |
Notes to the Consolidated Financial Statements
For the years ended September 30, 2012 and 2011
(tabular amounts only are in thousands of Canadian dollars, except share data)
| 30. | Commitments, contingencies and guarantees |
A) COMMITMENTS
At September 30, 2012, the Company is committed under the terms of operating leases with various expiration dates up to 2027, primarily for the rental of premises and computer equipment used in outsourcing contracts, in the aggregate amount of approximately $1,932,336,000. The future minimum lease payments under non-cancellable operating leases are due as follows:
| $ | ||||
Less than one year | 435,698 | |||
Between one and two years | 328,358 | |||
Between two and five years | 695,262 | |||
Beyond five years | 473,018 | |||
The majority of the lease agreements are renewable at the end of the lease period at market rates. The lease expenditure charged to the earnings during the year was $136,938,000 ($136,142,000 in 2011), net of sub-lease income of $8,014,000 ($8,401,000 in 2011). As at September 30, 2012, the total future minimum sub-lease payments expected to be received under non-cancellable sub-lease were $114,458,000 ($61,651,000 as at September 30, 2011).
The Company entered into long-term service and other agreements representing a total commitment of $35,457,000. Minimum payments under these agreements are due as follows:
| $ | ||||
Less than one year | 17,597 | |||
Between one and two years | 7,094 | |||
Between two and five years | 10,766 | |||
Beyond five years | — | |||
B) CONTINGENCIES
From time to time, the Company is involved in legal proceedings, audits, claims and litigation arising in the ordinary course of its business. Certain of these matters seek damages in significant amounts and will ultimately be resolved when one or more future events occur or fail to occur. Although the outcome of such matters is not predictable with assurance, the Company has no reason to believe that the disposition of any such current matter could reasonably be expected to have a materially adverse impact on the Company’s financial position, results of operations or the ability to carry on any of its business activities.
In addition, the Company is engaged to provide services under contracts with the U.S. Government. The contracts are subject to extensive legal and regulatory requirements and, from time to time, agencies of the U.S. Government investigate whether the Company’s operations are being conducted in accordance with these requirements. Generally, the Government has the right to change the scope of, or terminate, these projects at its convenience. The termination or reduction in the scope, of a major government project could have a materially adverse effect on the results of operations and financial condition of the Company.
| CGI Group Inc. – Consolidated Financial Statements for the years ended September 30, 2012 and 2011 | 136 |
Notes to the Consolidated Financial Statements
For the years ended September 30, 2012 and 2011
(tabular amounts only are in thousands of Canadian dollars, except share data)
| 30. | Commitments, contingencies and guarantees (continued) |
C) GUARANTEES
Sale of assets and business divestitures
In connection with the sale of assets and business divestitures, the Company may be required to pay counterparties for costs and losses incurred as the result of breaches in representations and warranties, intellectual property right infringement and litigation against counterparties. While some of the agreements specify a maximum potential exposure of approximately $6,527,000 in total, others do not specify a maximum amount or limited period. It is not possible to reasonably estimate the maximum amount that may have to be paid under such guarantees. The amounts are dependent upon the outcome of future contingent events, the nature and likelihood of which cannot be determined at this time. No amount has been accrued in the consolidated balance sheets relating to this type of indemnification as at September 30, 2012. The Company does not expect to incur any potential payment in connection with these guarantees that could have a materially adverse effect on its consolidated financial statements.
Other transactions
In the normal course of business, the Company may provide certain clients, principally governmental entities, with bid and performance bonds. In general, the Company would only be liable for the amount of the bid bonds if the Company refuses to perform the project once the bid is awarded. The Company would also be liable for the performance bonds in the event of default in the performance of its obligations. As at September 30, 2012, the Company provided for a total of $48,988,000 of these bonds. To the best of its knowledge, the Company is in compliance with its performance obligations under all service contracts for which there is a performance or bid bond, and the ultimate liability, if any, incurred in connection with these guarantees would not have a materially adverse effect on the Company’s consolidated results of operations or financial condition.
In addition, the Company provides a guarantee of $5,900,000 of the residual value of a leased property accounted for as an operating lease at the expiration of the lease term. The Company also has letters of credit for a total of $54,140,000. These guarantees are required in some of the Company’s contracts with customers.
| CGI Group Inc. – Consolidated Financial Statements for the years ended September 30, 2012 and 2011 | 137 |
Notes to the Consolidated Financial Statements
For the years ended September 30, 2012 and 2011
(tabular amounts only are in thousands of Canadian dollars, except share data)
| 31. | Financial instruments |
FAIR VALUE
At September 30, 2012 and 2011, the estimated fair values of trade accounts receivable, cash included in funds held for clients, accounts payable and accrued liabilities, accrued compensation, long-term debt obligation and clients’ funds obligations approximate their respective carrying values.
The fair values of Senior U.S. unsecured notes and the unsecured committed revolving facility and the unsecured committed term loan credit facility, estimated by discounting expected cash flows at rates currently offered to the Company for debts of the same remaining maturities and conditions, are $521,971,000 and $685,951,000 and $1,951,279,000 as at September 30, 2012, respectively ($22,236,000, $855,307,000 and nil as at September 30, 2011, respectively and $112,937,000, $941,396,000 and nil as at October 1, 2010, respectively), as compared to their carrying value $467,610,000, $691,960,000 and $1,933,948,000, respectively ($20,647,000, $859,277,000 and nil as at September 30, 2011, respectively and $109,899,000, $964,223,000 and nil as at October 1, 2010, respectively) (Note 14).
The following table summarizes the fair value of outstanding hedging instruments:
| As at September 30, 2012 | As at September 30, 2011 | As at October 1, 2010 | ||||||||||||
| Recorded in | $ | $ | $ | |||||||||||
Hedges on net investments in foreign operations | ||||||||||||||
US$818,000 debt designated as the hedging instrument of the Company’s net investment in U.S. operations (US$815,000 as at September 30, 2011 and US$920,000 as at October 1, 2010) | Long-term debt | 804,667 | 846,703 | 947,416 | ||||||||||
€45,000 debt designated as a hedging instrument of the Company’s net investment in European operations (€9,000 as at September 30, 2011 and €12,000 as at October 1, 2010) | Long-term debt | 56,907 | 12,574 | 16,807 | ||||||||||
$1,153,700 cross-currency swaps in euro designated as a hedging instrument of the Company’s net investment in European operations (nil as at September 30, 2011 and as at October 1, 2010) | Other long-term liabilities | 23,876 | — | — | ||||||||||
Cash flow hedges on future revenue | ||||||||||||||
US$32,100 foreign currency forward contracts to hedge the variability in the expected foreign currency exchange rate between the U.S. dollar and the Canadian dollar (US$76,740 as at September 30, 2011 and US$130,380 as at October 1, 2010) | Other current assets Other long-term assets |
| 6,514 1,024 |
|
| 6,497 5,613 |
|
| 8,918 11,433 |
| ||||
US$51,944 foreign currency forward contracts to hedge the variability in the expected foreign currency exchange rate between the U.S. dollar and the Indian rupee (US$45,000 as at September 30, 2011 and US$44,820 as at October 1, 2010) | Other current assets Other long-term assets Accrued liabilities Other long-term liabilities |
| — — 1,678 2,697 |
|
| 156 1 — 536 |
|
| 2,378 1,121 — — |
| ||||
$53,145 foreign currency forward contracts to hedge the variability in the expected foreign currency exchange rate between the Canadian dollar and the Indian rupee ($62,220 as at September 30, 2011 and $89,040 as at October 1, 2010) | Accrued liabilities Other long-term liabilities |
| 6,533 2,073 |
|
| 2,560 2,554 |
|
| 1,570 3,396 |
| ||||
| CGI Group Inc. – Consolidated Financial Statements for the years ended September 30, 2012 and 2011 | 138 |
Notes to the Consolidated Financial Statements
For the years ended September 30, 2012 and 2011
(tabular amounts only are in thousands of Canadian dollars, except share data)
| 31. | Financial instruments (continued) |
FAIR VALUE (CONTINUED)
| As at September 30, 2012 | As at September 30, 2011 | As at October 1, 2010 | ||||||||||||
| Recorded in | $ | $ | $ | |||||||||||
Cash flow hedges on Senior U.S. unsecured notes | ||||||||||||||
US$nil foreign currency forward contracts (US$20,000 as at September 30, 2011 and US$107,000 as at October 1, 2010) | Other current assets Other long-term assets |
| — — |
|
| — 565 |
|
| 1,277 763 |
| ||||
Cash flow hedges on unsecured committed term loan credit facility | ||||||||||||||
$1,234,400 interest rate swaps floating-to-fixed (nil as at September 30, 2011 and as at October 1, 2010) | Other long-term liabilities | 4,202 | — | — | ||||||||||
Fair value hedges on Senior U.S. unsecured notes | ||||||||||||||
US$125,000 interest rate swaps fixed-to-floating (nil as at September 30, 2011 and as at October 1, 2010) | Other long-term assets | 1,074 | — | — | ||||||||||
Derivatives not designated as hedges | ||||||||||||||
£37,288 foreign currency forward contracts to hedge the net exposure of some assets and liabilities not denominated in the functional currencies (nil as at September 30, 2011 and as at October 1, 2010) | Accrued liabilities | 2,182 | — | — | ||||||||||
Valuation techniques used to value financial instruments are as follows:
| • | The fair value of forward foreign exchange contracts is determined using forward exchange rates at the end of the reporting period; |
| • | The fair value of interest rate swaps is determined from market quotes of the instruments; and |
| • | The fair value of cross-currency swaps is determined based on market data (primarily yield curves and exchange rates) to calculate the present value of all estimated flows. |
The Company expects that approximately $2,063,000 of the accumulated net unrealized loss on all derivative financial instruments designated as cash flow hedges as at September 30, 2012 will be reclassified in the consolidated statements of earnings in the next 12 months.
During the year ended September 30, 2012, the Company’s hedging relationships were effective.
MARKET RISK (INTEREST RATE RISK AND CURRENCY RISK)
Market risk incorporates a range of risks. Movements in risk factors, such as interest rate risk and currency risk, affect the fair values of financial assets and liabilities.
Interest rate risk
The Company is exposed to interest rate risk on a portion of its long-term debt (Note 14) and holds interest rate swaps that mitigate this risk. In 2012, the Company entered into an interest rate swaps agreement whereby the Company receives a fixed rate of interest and pays interest at a variable rate on the notional amount. The swaps are being used to hedge the exposure to changes in the fair value of its Senior U.S. unsecured notes.
The Company analyzes its interest rate risk exposure on an ongoing basis using various scenarios to simulate refinancing or the renewal of existing positions. Based on these scenarios, a change in the interest rate of 1% would not have had a significant impact on net earnings and comprehensive income.
| CGI Group Inc. – Consolidated Financial Statements for the years ended September 30, 2012 and 2011 | 139 |
Notes to the Consolidated Financial Statements
For the years ended September 30, 2012 and 2011
(tabular amounts only are in thousands of Canadian dollars, except share data)
| 31. | Financial instrument (continued) |
MARKET RISK (INTEREST RATE RISK AND CURRENCY RISK) (CONTINUED)
Currency risk
The Company operates internationally and is exposed to risk from changes in foreign currency rates. The Company mitigates this risk principally through foreign debt and use of derivatives. The Company enters into foreign exchange forward contracts to hedge forecasted cash flows or contractual cash flows in currencies other than the functional currency of its subsidiaries. The Company has entered into the foreign currency forward contracts to hedge the variability in the foreign currency exchange rate between the U.S. dollar and the Indian rupee on future U.S. revenue, to hedge the variability in the foreign currency exchange rate between the U.S. dollar and the Canadian dollar on future U.S. revenue and to hedge the variability in foreign currency exchange rate between the Indian rupee and the Canadian dollar on future Canadian revenue.
The Company has also entered into foreign currency forward contracts to hedge the contractual principal repayments of certain Senior U.S. unsecured notes and into interest rate swaps to hedge the cash flow exposure of the issued variable rate unsecured committed term loan credit facility.
The Company also hedges a portion of the translation of the Company’s net investments in its U.S. and European operations. into Canadian dollar with unsecured committed revolving facility and Senior U.S. unsecured notes as well as cross-currency swaps. Hedging relationships are designated and documented at inception and quarterly effectiveness assessments are performed during the year. In 2012, the Company entered into fixed-to-fixed and floating-to-floating cross-currency swaps as the hedging instrument of the Company’s net investment in its European and Asia Pacific operations. These swaps convert Canadian dollar based fixed and variable interest payments to Euro based fixed and variable interest payments associated with the notional amount.
In addition, to mitigate foreign exchange risk arising from transactions denominated in currencies other than entity’s functional currency, assets and liabilities not denominated in the functional currencies are hedged economically by means of forward contracts. The Company has not applied hedge accounting to these contracts. These exposures are then aggregated and netted and the overall position is hedged externally.
The Company is mainly exposed to fluctuations in the U.S. dollar, the euro and the British pound. The following table details the Company’s sensitivity to a 10% strengthening of the U.S. dollar, the euro and the British pound foreign currency rates on net earnings and comprehensive income against the Canadian dollar. The sensitivity analysis presents the impact of foreign currency denominated financial instruments and adjusts their translation at period end for a 10% strengthening in foreign currency rates.
| 2012 | 2011 | |||||||||||||||||||||||
| U.S. dollar impact | Euro impact | British pound impact | U.S. dollar impact | Euro impact | British pound impact1 | |||||||||||||||||||
Increase in net earnings | 5,067 | 5,362 | 5,241 | 565 | 191 | — | ||||||||||||||||||
(Decrease) increase in other comprehensive income | (44,603 | ) | (100,593 | ) | (3,985 | ) | (62,887 | ) | 2,383 | — | ||||||||||||||
| 1 | The exposure in prior year was not significant. |
| CGI Group Inc. – Consolidated Financial Statements for the years ended September 30, 2012 and 2011 | 140 |
Notes to the Consolidated Financial Statements
For the years ended September 30, 2012 and 2011
(tabular amounts only are in thousands of Canadian dollars, except share data)
| 31. | Financial instruments (continued) |
LIQUIDITY RISK
Liquidity risk is the risk that the Company is not able to meet its financial obligations as they fall due or can do so only at excessive cost. The Company’s activities are financed through a combination of the cash flows from operations, borrowing under existing credit facilities, the issuance of debt and the issuance of equity. One of management’s primary goals is to maintain an optimal level of liquidity through the active management of the assets and liabilities as well as the cash flows.
The following table summarizes the carrying amount and the contractual maturities of both the interest and principal portion of significant financial liabilities. All amounts contractually denominated in foreign currency are presented in Canadian dollar equivalent amounts using the period-end spot rate.
As at September 30, 2012 | Carrying amount | Contractual cash flows | Less than one year | Between one and two years | Between two and five years | Beyond five years | ||||||||||||||||||
| $ | $ | $ | $ | $ | $ | |||||||||||||||||||
Non-derivative financial liabilities | ||||||||||||||||||||||||
Accounts payable and accrued liabilities | 1,156,737 | 1,156,737 | 1,156,737 | — | — | — | ||||||||||||||||||
Accrued compensation | 539,779 | 539,779 | 539,779 | — | — | — | ||||||||||||||||||
Senior U.S. unsecured notes | 467,610 | 635,519 | 21,299 | 21,299 | 145,980 | 446,941 | ||||||||||||||||||
Unsecured committed revolving facility | 691,960 | 762,215 | 16,783 | 16,783 | 728,649 | — | ||||||||||||||||||
Unsecured committed term loan credit facility | 1,933,948 | 2,146,967 | 67,870 | 547,177 | 1,531,920 | — | ||||||||||||||||||
Obligations repayable in blended monthly installments | 60,812 | 64,330 | 20,166 | 17,653 | 26,444 | 67 | ||||||||||||||||||
Other long-term debt | 8,954 | 8,954 | 476 | 8,478 | — | — | ||||||||||||||||||
Clients’ funds obligations | 197,986 | 197,986 | 197,986 | — | — | — | ||||||||||||||||||
Derivative financial liabilities | ||||||||||||||||||||||||
Cash flow hedges on future revenue | 5,443 | |||||||||||||||||||||||
Outflow | 14,265 | 8,620 | 2,915 | 2,730 | — | |||||||||||||||||||
(Inflow) | (7,603 | ) | (6,556 | ) | (1,047 | ) | — | — | ||||||||||||||||
Cross-currency swaps | 23,876 | |||||||||||||||||||||||
Outflow | 1,254,517 | 22,612 | 22,612 | 1,209,293 | — | |||||||||||||||||||
(Inflow) | (1,288,939 | ) | (38,519 | ) | (38,519 | ) | (1,211,901 | ) | — | |||||||||||||||
Interest rate swaps | 3,128 | |||||||||||||||||||||||
Outflow | 1,445,111 | 20,665 | 469,874 | 812,132 | 142,440 | |||||||||||||||||||
(Inflow) | (1,457,023 | ) | (21,489 | ) | (469,624 | ) | (815,336 | ) | (150,574 | ) | ||||||||||||||
Forward contracts | 2,182 | |||||||||||||||||||||||
Outflow | 406,881 | 406,881 | — | — | — | |||||||||||||||||||
(Inflow) | (404,741 | ) | (404,741 | ) | — | — | — | |||||||||||||||||
|
|
|
|
|
|
|
|
|
|
|
| |||||||||||||
| 5,092,415 | 5,474,955 | 2,008,569 | 597,601 | 2,429,911 | 438,874 | |||||||||||||||||||
|
|
|
|
|
|
|
|
|
|
|
| |||||||||||||
As at September 30, 2011 | Carrying amount | Contractual cash flows | Less than one year | Between one and two years | Between two and five years | Beyond five years | ||||||||||||||||||
| $ | $ | $ | $ | $ | $ | |||||||||||||||||||
Non-derivative financial liabilities | ||||||||||||||||||||||||
Bank overdraft | 75,538 | 75,538 | 75,538 | — | — | — | ||||||||||||||||||
Accounts payable and accrued liabilities | 303,641 | 303,641 | 303,641 | — | — | — | ||||||||||||||||||
Accrued compensation | 183,842 | 183,842 | 183,842 | — | — | — | ||||||||||||||||||
Senior U.S. unsecured notes | 20,647 | 23,895 | 1,247 | 1,247 | 21,401 | — | ||||||||||||||||||
Unsecured committed revolving facility | 859,277 | 866,560 | 866,560 | — | — | — | ||||||||||||||||||
Obligations repayable in blended monthly installments | 58,575 | 62,987 | 15,553 | 15,898 | 30,242 | 1,294 | ||||||||||||||||||
Clients’ funds obligations | 244,660 | 244,660 | 244,660 | — | — | — | ||||||||||||||||||
Derivative financial liabilities | ||||||||||||||||||||||||
Cash flow hedges on future revenue | (6,617 | ) | ||||||||||||||||||||||
Outflow | 6,237 | 2,675 | 2,423 | 1,139 | — | |||||||||||||||||||
(Inflow) | (12,535 | ) | (6,772 | ) | (4,972 | ) | (791 | ) | — | |||||||||||||||
|
|
|
|
|
|
|
|
|
|
|
| |||||||||||||
| 1,739,563 | 1,754,825 | 1,686,944 | 14,596 | 51,991 | 1,294 | |||||||||||||||||||
|
|
|
|
|
|
|
|
|
|
|
| |||||||||||||
| CGI Group Inc. – Consolidated Financial Statements for the years ended September 30, 2012 and 2011 | 141 |
Notes to the Consolidated Financial Statements
For the years ended September 30, 2012 and 2011
(tabular amounts only are in thousands of Canadian dollars, except share data)
| 31. | Financial instruments (continued) |
LIQUIDITY RISK (CONTINUED)
As at October 1, 2010 | Carrying amount | Contractual cash flows | Less than one year | Between one and two years | Between two and five years | Beyond five years | ||||||||||||||||||
| $ | $ | $ | $ | $ | $ | |||||||||||||||||||
Non-derivative financial liabilities | ||||||||||||||||||||||||
Accounts payable and accrued liabilities | 297,801 | 297,801 | 297,801 | — | — | — | ||||||||||||||||||
Accrued compensation | 185,651 | 185,651 | 185,651 | — | — | — | ||||||||||||||||||
Senior U.S. unsecured notes | 109,899 | 116,799 | 93,113 | 1,236 | 22,450 | — | ||||||||||||||||||
Unsecured committed revolving facility | 964,223 | 977,861 | 9,092 | 968,769 | — | — | ||||||||||||||||||
Obligations repayable in blended monthly installments | 22,049 | 23,961 | 6,292 | 5,052 | 11,211 | 1,406 | ||||||||||||||||||
Clients’ funds obligations | 248,695 | 248,695 | 248,695 | — | — | — | ||||||||||||||||||
Derivative financial liabilities | ||||||||||||||||||||||||
Cash flow hedges on future revenue | (18,884 | ) | ||||||||||||||||||||||
Outflow | 5,562 | 1,637 | 1,740 | 2,185 | — | |||||||||||||||||||
(Inflow) | (24,658 | ) | (11,447 | ) | (7,323 | ) | (5,888 | ) | — | |||||||||||||||
|
|
|
|
|
|
|
|
|
|
|
| |||||||||||||
| 1,809,434 | 1,831,672 | 830,834 | 969,474 | 29,958 | 1,406 | |||||||||||||||||||
|
|
|
|
|
|
|
|
|
|
|
| |||||||||||||
As at September 30, 2012, the Company holds cash and cash equivalents and short-term and long-term investments of $143,095,000 ($161,686,000 and $121,725,000 as at September 30, 2011 and October 1, 2010, respectively). The Company also has available $786,089,000 in unsecured committed revolving facility (Note 14) ($622,406,000 and $519,931,000 as at September 30, 2011 and October 1, 2010, respectively). The funds held for clients of $202,407,000 ($247,622,000 and $ 248,695,000 as at September 30, 2011 and October 1, 2010, respectively) fully cover the clients’ funds obligations. Given the Company’s available liquid resources as compared to the timing of the payments of liabilities, management assesses the Company’s liquidity risk to be low.
| CGI Group Inc. – Consolidated Financial Statements for the years ended September 30, 2012 and 2011 | 142 |
Notes to the Consolidated Financial Statements
For the years ended September 30, 2012 and 2011
(tabular amounts only are in thousands of Canadian dollars, except share data)
| 31. | Financial instruments (continued) |
CREDIT RISK
The Company takes on exposure to credit risk, which is the risk that a client will be unable to pay amounts in full when due. Financial instruments that potentially subject the Company to concentrations of credit risk consist of cash and cash equivalents, short-term investments, work in progress, accounts receivable and long-term investments. The maximum exposure of credit risk is generally represented by the carrying amounts of these items reported on the consolidated balance sheets.
Cash equivalents consist mainly of highly liquid investments, such as money market funds and term deposits, as well as bankers’ acceptances and bearer deposit notes issued by major banks (Note 4). The Company has deposited the cash equivalents with reputable financial institutions, from which management believes the risk of loss to be remote.
The Company is exposed to credit risk in connection with short-term and long-term investments through the possible inability of borrowers to meet the terms of their bonds. The Company mitigates this risk by investing primarily in high credit quality corporate and government bonds with a credit rating of A or higher.
The Company has accounts receivable and work in progress derived from clients engaged in various industries including governmental agencies, finance, telecommunications, manufacturing and utilities that are not concentrated in any specific geographic area. These specific industries may be affected by economic factors that may impact accounts receivable. However, management does not believe that the Company is subject to any significant credit risk in view of the Company’s large and diversified client base.
The following table sets forth details of the age of accounts receivable that are past due:
| 2012 | 2011 | |||||||
| $ | $ | |||||||
Not past due | 996,404 | 301,972 | ||||||
Past due 1-30 days | 161,872 | 42,653 | ||||||
Past due 31-60 days | 43,636 | 25,993 | ||||||
Past due 61-90 days | 26,091 | 7,437 | ||||||
Past due more than 90 days | 47,868 | 14,371 | ||||||
|
|
|
| |||||
| 1,275,871 | 392,426 | |||||||
Allowance for doubtful accounts | (3,546 | ) | (5,197 | ) | ||||
|
|
|
| |||||
| 1,272,325 | 387,229 | |||||||
|
|
|
| |||||
The carrying amount of accounts receivable is reduced by an allowance account and the amount of the loss is recognized in the consolidated statements of earnings within costs of services, selling and administrative. When a receivable balance is considered uncollectible, it is written off against the allowance for doubtful accounts. Subsequent recoveries of amounts previously written off are credited against costs of services, selling and administrative in the consolidated statements of earnings. Overall, management does not believe that any single industry or geographic region represents a significant credit risk to the Company.
| CGI Group Inc. – Consolidated Financial Statements for the years ended September 30, 2012 and 2011 | 143 |
Notes to the Consolidated Financial Statements
For the years ended September 30, 2012 and 2011
(tabular amounts only are in thousands of Canadian dollars, except share data)
| 32. | Capital risk management |
The Company is exposed to risks of varying degrees of significance which could affect its ability to achieve its strategic objectives for growth. The main objectives of the Company’s risk management process are to ensure that risks are properly identified and that the capital base is adequate in relation to these risks.
The Company manages its capital to ensure that there are adequate capital resources while maximizing the return to shareholders through the optimization of the debt and equity balance. At September 30, 2012, total managed capital was $6,813,837,000 ($3,441,060,000 and $3,424,836,000 as at September 30, 2011 and October 1, 2010, respectively). Managed capital consists of long-term debt, including the current portion (Note 14), cash and cash equivalents net of bank overdraft (Note 4), short-term investments, long-term investments and shareholders’ equity. The basis for the Company’s capital structure is dependent on the Company’s expected business growth and changes in the business environment. When capital needs have been specified, the Company’s management proposes capital transactions for the approval of the Company’s Audit and Risk Management Committee and Board of Directors. The capital risk policy remains unchanged from prior periods.
The Company monitors its capital by reviewing various financial metrics, including the following:
| • | Debt/Capitalization |
| • | Net Debt/Capitalization |
| • | Debt/EBITDA |
Debt represents long-term debt, including the current portion. Net debt, capitalization and EBITDA are non-GAAP measures. Net debt represents debt (including the impact of the fair value of forward contracts) less cash and cash equivalents net of bank overdraft, short-term investments and long-term investments. Capitalization is shareholders’ equity plus debt. EBITDA is calculated as earnings from continuing operations before income taxes, interest expense on long-term debt, depreciation, amortization and acquisition-related and integration costs. The Company believes that the results of the current internal ratios are consistent with its capital management objectives.
The Company is subject to external covenants on its Senior U.S. unsecured notes, its unsecured committed revolving facility and unsecured committed term loan credit facility. The ratios are as follows:
| • | A leverage ratio, which is the ratio of total debt to EBITDA for the four most recent quarters1. |
| • | An interest and rent coverage ratio, which is the ratio of the EBITDAR for the four most recent quarters to the total interest expense and the operating rentals in the same periods. EBITDAR, a non-GAAP measure, is calculated as EBITDA before rent expense1. |
| • | In the case of the Senior U.S. unsecured notes, a minimum net worth is required, whereby shareholders’ equity, excluding foreign exchange translation adjustments included in accumulated other comprehensive income, cannot be less than a specified threshold. |
These ratios are calculated on a consolidated basis.
The Company is in compliance with these covenants and monitors them on an ongoing basis. The ratios are also reviewed quarterly by the Company’s Audit and Risk Management Committee. The Company is not subject to any other externally imposed capital requirements.
| 1 | In the event of an acquisition, the available historical financial information of the acquired company will be used in the computation of the ratios. |
| CGI Group Inc. – Consolidated Financial Statements for the years ended September 30, 2012 and 2011 | 144 |
Notes to the Consolidated Financial Statements
For the years ended September 30, 2012 and 2011
(tabular amounts only are in thousands of Canadian dollars, except share data)
| 33. | Transition to IFRS |
As discussed in Note 2, these consolidated financial statements represent the first annual financial statements prepared in accordance with IFRS. IFRS 1 requires that comparative financial information be provided. The first date at which IFRS was applied was October 1, 2010 (“Transition Date”) and, as a result, reconciliations for the respective periods noted are included below.
RECONCILIATIONS OF CANADIAN GAAP TO IFRS
As required by IFRS 1, the following represents reconciliations from Canadian GAAP to IFRS for the respective periods noted for consolidated equity, net earnings, comprehensive income and cash flows from the perspective of each adjustment. A discussion of the adjustments, other initial elections upon IFRS adoption, as well as selected consolidated financial statements for comparative periods are presented further below.
Reconciliation of consolidated equity
| As at September 30, 2011 | As at October 1, 2010 | |||||||||
| $ | $ | |||||||||
Total equity previously reported under Canadian GAAP | 2,346,356 | 2,159,083 | ||||||||
Differences increasing (decreasing) reported equity: | ||||||||||
C | Employee benefits | (1,845 | ) | (1,213 | ) | |||||
D | Decommissioning liabilities included in the cost of PP&E | (899 | ) | (903 | ) | |||||
H | Reversal of intangible asset impairment | 452 | 539 | |||||||
I | Reversal of contract cost impairment | — | 1,265 | |||||||
K | Income taxes | 8,445 | 827 | |||||||
L | Commitment to purchase outstanding shares of non-controlling interest | — | (10,363 | ) | ||||||
N | Onerous leases | (3,278 | ) | — | ||||||
|
|
|
| |||||||
Total adjustments | 2,875 | (9,848 | ) | |||||||
|
|
|
| |||||||
Total equity under IFRS | 2,349,231 | 2,149,235 | ||||||||
|
|
|
| |||||||
Reconciliation of consolidated net earnings
| Year ended September 30, 2011 | ||||||
| $ | ||||||
Net earnings previously reported under Canadian GAAP | 435,065 | |||||
Differences increasing (decreasing) reported net earnings: | ||||||
H | Reversal of intangible asset impairment | (87 | ) | |||
I | Reversal of contract cost impairment | (1,208 | ) | |||
J | Share-based payments | (1,224 | ) | |||
K | Income taxes | 5,103 | ||||
L | Commitment to purchase outstanding shares of non-controlling interest | 3,655 | ||||
N | Onerous leases | (3,165 | ) | |||
|
| |||||
Total adjustments | 3,074 | |||||
|
| |||||
Net earnings under IFRS | 438,139 | |||||
|
| |||||
| CGI Group Inc. – Consolidated Financial Statements for the years ended September 30, 2012 and 2011 | 145 |
Notes to the Consolidated Financial Statements
For the years ended September 30, 2012 and 2011
(tabular amounts only are in thousands of Canadian dollars, except share data)
| 33. | Transition to IFRS (continued) |
Reconciliation of consolidated comprehensive income
| Year ended September 30, 2011 | ||||||
| $ | ||||||
Comprehensive income reported under Canadian GAAP | 435,241 | |||||
|
| |||||
Total differences increasing net earnings | 3,074 | |||||
|
| |||||
Differences increasing (decreasing) reported other comprehensive income: | ||||||
C | Employee benefits | (632 | ) | |||
D, I, K, N | Foreign currency translation adjustments | 559 | ||||
|
| |||||
| (73 | ) | |||||
|
| |||||
Comprehensive income under IFRS | 438,242 | |||||
|
| |||||
Reconciliation of consolidated cash flows
There were no significant changes in the consolidated statements of cash flows on adoption of IFRS other than as a result of accounting for the investment in the joint venture under the equity method as described in adjustment M below.
DISCUSSION OF ADJUSTMENTS
Initial elections upon IFRS adoption
Set forth below are the IFRS 1 optional exemptions applied in the conversion from Canadian GAAP to IFRS. Exemptions that were not elected, not applicable or not considered material to the Company are not included in the discussion.
| A. | Business combinations |
IFRS 1 provides the option to apply IFRS 3, “Business Combinations” (as revised in 2008), retrospectively or prospectively from the Transition Date. The retrospective basis would require restatement of all business combinations that occurred prior to the Transition Date. The Company elected not to retrospectively apply IFRS 3. As a result, there is no adjustment as at October 1, 2010 related to business combinations entered into prior to the Transition Date. IFRS 3 will be applied to business combinations entered into subsequently. Additionally, due to the Company’s election to apply IFRS 3 prospectively, IAS 27, “Consolidated and Separate Financial Statements”, will also be applied prospectively. With the early adoption of Section 1582, “Business Combinations”, under Canadian GAAP as at October 1, 2009, there was no adjustment required for the year ended September 30, 2011 as it is similar to the corresponding provisions of IFRS 3.
| B. | Currency translation differences |
Retrospective application of IFRS would require the Company to determine cumulative foreign currency translation differences in accordance with IAS 21, “The Effects of Changes in Foreign Exchange Rates”, from the date a subsidiary was formed or acquired to the Transition Date. IFRS 1 permits cumulative foreign translation gains and losses to be reset to zero at the Transition Date. The Company elected to apply this exemption. As a result, as at October 1, 2010, the Company reversed the balance of $413,021,000 within “net unrealized losses on translating financial statements of self-sustaining foreign operations” and $76,806,000 within “net unrealized gains on translating long-term debt designated as a hedge of net investments in self-sustaining foreign operations” included in accumulated other comprehensive loss. The net loss of $336,215,000 was recognized as a decrease to accumulated other comprehensive loss with a corresponding decrease to retained earnings. This adjustment did not have any further impact on the consolidated financial statements.
| CGI Group Inc. – Consolidated Financial Statements for the years ended September 30, 2012 and 2011 | 146 |
Notes to the Consolidated Financial Statements
For the years ended September 30, 2012 and 2011
(tabular amounts only are in thousands of Canadian dollars, except share data)
| 33. | Transition to IFRS (continued) |
| C. | Employee benefits |
IFRS 1 provides the option to recognize all cumulative actuarial gains and losses deferred as a result of applying the corridor approach in accounting for defined benefit plans in retained earnings at the Transition Date. The Company elected to apply this exemption. As a result, as at October 1, 2010, retirement benefits obligations decreased by $780,000 and after a related increase to deferred income tax liabilities of $209,000, retained earnings increased by $571,000. Additionally, the Company’s joint venture applied the same exemption and as a result, the investment in the joint venture decreased by $1,784,000 with a corresponding decrease to retained earnings. For the year ended September 30, 2011, the impact of this adjustment on the consolidated financial statements was not significant.
As a result of an actuarial valuation as at September 30, 2011, retirement benefits obligations increased by $849,000 and after a related decrease to deferred income tax liabilities of $217,000, accumulated other comprehensive loss increased by $632,000.
| D. | Decommissioning liabilities included in the cost of PP&E |
Upon adoption of IFRS, the Company’s decommissioning liability was revalued according to the discount rate specified in IAS 37, “Provisions, Contingent Liabilities and Contingent Assets”. IFRIC 1, “Changes in Existing Decommissioning, Restoration and Similar Liabilities”, requires specified changes in a decommissioning liability to be added to or deducted from the cost of the asset to which it relates; the adjusted depreciable amount of the asset is then depreciated prospectively over its remaining useful life. IFRS 1 allows a first-time adopter a simplified treatment of historic changes when estimating the decommissioning liability between initial inception of the liability and the Transition Date. The Company elected to apply the method specified within IFRS 1 for valuing the decommissioning liability. As a result, as at October 1, 2010, PP&E decreased by $723,000 and long-term provisions increased by $562,000. After a related decrease to deferred income tax liabilities of $184,000 and an increase to deferred income tax assets of $198,000, retained earnings decreased by $903,000.
As a result of a new decommissioning liability as at September 30, 2011, PP&E and long-term provisions increased by $319,000 when discounted in accordance with IFRS. For the year ended September 30, 2011, the impact of this adjustment on the consolidated statements of earnings was not significant.
Additionally, as at and for the year ended September 30, 2011, there was an insignificant adjustment to other comprehensive loss due to a foreign currency translation adjustment on the Transition Date adjustment.
| E. | Borrowing costs |
IFRS 1 allows the Company to choose the effective date of IAS 23, “Borrowing Costs”. As such, the Company elected to capitalize borrowing costs for qualifying assets for which acquisition, construction or development commenced on or after the Transition Date. For the year ended September 30, 2011, no borrowing costs were eligible for capitalization.
| CGI Group Inc. – Consolidated Financial Statements for the years ended September 30, 2012 and 2011 | 147 |
Notes to the Consolidated Financial Statements
For the years ended September 30, 2012 and 2011
(tabular amounts only are in thousands of Canadian dollars, except share data)
| 33. | Transition to IFRS (continued) |
Mandatory exceptions upon IFRS adoption
Set forth below are the applicable mandatory exceptions in IFRS 1 applied in the conversion from Canadian GAAP to IFRS.
| F. | Hedge accounting |
Hedge accounting can only be applied prospectively from the Transition Date to transactions that satisfy the hedge accounting criteria in IAS 39, “Financial Instruments: Recognition and Measurement”, at that date. Hedging relationships cannot be designated retrospectively and the supporting documentation cannot be created retrospectively. As a result, only hedging relationships that satisfy the hedge accounting criteria as of the Transition Date are reflected as hedges in the Company’s results under IFRS. The application of this mandatory exception did not result in any adjustments in the consolidated financial statements.
| G. | Estimates |
Hindsight is not used to create or revise estimates. The estimates previously made by the Company under Canadian GAAP were not revised for application of IFRS except where necessary to reflect any difference in accounting policies.
Other explanatory notes
| H. | Reversal of intangible asset impairment |
Under Canadian GAAP, the reversal of impairment losses was prohibited. Under IFRS, the reversal of impairment losses is recognized for assets other than goodwill if certain criteria are met. Upon adoption of IFRS, the Company reversed an impairment within the Canada operating segment recognized under Canadian GAAP as a result of changes in the expected cash flows relating to a business solution. As a result, as at October 1, 2010, intangible assets increased by $779,000 and after a related increase to deferred income tax liabilities of $240,000, retained earnings increased by $539,000.
The impairment reversal resulted in additional amortization expense during the fiscal 2011 year. As a result, as at and for the year ended September 30, 2011, intangible assets decreased and amortization within costs of services, selling and administrative increased by $126,000, while deferred tax liabilities and income tax expense decreased by $39,000.
| I. | Reversal of contract cost impairment |
Under Canadian GAAP, contract costs consisting of transition costs and incentives were classified as intangible assets. Under IFRS, contract costs are recognized in accordance with IAS 11, “Construction Contracts” and no longer qualify as intangible assets. Upon adoption of IFRS, the Company reversed an impairment loss on a contract cost that was recognized under Canadian GAAP due to the fact that at the Transition Date the contract was profitable. As a result, as at October 1, 2010, contract costs increased by $2,095,000 and after a related increase to deferred income tax liabilities of $830,000, retained earnings increased by $1,265,000.
The contract associated with the reversal was terminated in the last quarter of fiscal 2011. As a result, as at September 30, 2011, the reversal of the remaining net carrying amount resulted in a decrease to contract costs and deferred tax liabilities of $2,100,000 and $835,000, respectively. For the year ended September 30, 2011, revenue and income tax expense decreased by $806,000 and $793,000, respectively, and costs of services, selling and administrative increased by $1,195,000.
| CGI Group Inc. – Consolidated Financial Statements for the years ended September 30, 2012 and 2011 | 148 |
Notes to the Consolidated Financial Statements
For the years ended September 30, 2012 and 2011
(tabular amounts only are in thousands of Canadian dollars, except share data)
| 33. | Transition to IFRS (continued) |
| I. | Reversal of contract cost impairment (continued) |
Additionally, as at and for the year ended September 30, 2011, there was an insignificant adjustment to other comprehensive loss due to a foreign currency translation adjustment on the Transition Date adjustment.
| J. | Share-based payments |
Under Canadian GAAP, for grants of share-based awards with graded vesting, the total fair value of the award was recognized on a straight-line basis over the employment period necessary to vest the award. Under IFRS, each tranche in an award with graded vesting is considered a separate grant with a different vesting date and fair value, and each grant is accounted for on that basis. As a result of the difference of accounting for each grant of graded share-based awards, as at October 1, 2010, contributed surplus increased by $8,100,000 with a corresponding decrease to retained earnings.
As at and for the year ended September 30, 2011, the adjustment resulted in an increase of contributed surplus and costs of services, selling and administrative of $1,224,000.
| K. | Income Taxes |
Assets or liabilities acquired other than in a business combination
Under Canadian GAAP, the carrying amount of an asset or liability acquired other than in a business combination was adjusted for by the amount of the related recognized deferred tax asset or liability. Under IFRS, a deferred tax asset or liability cannot be recognized if it arises from the initial recognition of an asset or liability in a transaction that is not a business combination and if at the time of the transaction neither accounting profit nor taxable profit is affected. As a result, as at October 1, 2010, the Company decreased deferred tax liabilities by $3,423,000, intangible assets by $3,414,000, contract costs by $542,000 and deferred tax assets by $5,049,000 with a corresponding decrease to other long-term liabilities of $895,000 and retained earnings of $4,687,000.
The adjustment resulted in less amortization expense during the fiscal 2011 year. As a result, as at and for the year ended September 30, 2011, intangible assets increased and amortization within costs of services, selling and administrative decreased by $1,235,000, contract costs increased and revenue increased by $89,000 and deferred tax liabilities and income tax expense increased by $381,000.
Additionally, as at and for the year ended September 30, 2011, there was an insignificant adjustment to other comprehensive loss due to a foreign currency translation adjustment on the Transition Date adjustment.
Share-based payments
Under Canadian GAAP, a deferred tax asset was recognized on the difference between the accounting expense and the tax deduction relating to share-based payments. Under IFRS, the deferred tax asset recognized in relation to the share-based payments is adjusted each period to reflect the amount of the tax deduction the Company would receive if the award was tax deductible in the current period based on the current market price of the shares. If the estimated future tax deduction exceeds the related cumulative share-based payment costs, the excess deferred tax is recognized in contributed surplus. As a result, as at October 1, 2010, deferred tax liabilities decreased by $5,514,000 and retained earnings increased by $2,129,000 while contributed surplus increased by $3,385,000.
| CGI Group Inc. – Consolidated Financial Statements for the years ended September 30, 2012 and 2011 | 149 |
Notes to the Consolidated Financial Statements
For the years ended September 30, 2012 and 2011
(tabular amounts only are in thousands of Canadian dollars, except share data)
| 33. | Transition to IFRS (continued) |
| K. | Income Taxes (continued) |
Share-based payments (continued)
As at and for the year ended September 30, 2011, deferred tax liabilities decreased by $6,641,000, contributed surplus increased by $1,790,000 and income tax expense decreased by $4,160,000.
Additionally, as at and for the year ended September 30, 2011, there was an insignificant adjustment to other comprehensive loss due to a foreign currency translation adjustment on the Transition Date adjustment.
| L. | Commitment to purchase outstanding shares of non-controlling interest |
Under Canadian GAAP, the value of the put and call option to purchase the remaining shares of Conseillers en informatique d’Affaires (“CIA”) was disclosed as a commitment, but not recorded as a liability. Under IFRS, it must be recorded as a liability. As a result, as at October 1, 2010, accounts payable and accrued liabilities increased by $10,363,000, the equity attributable to non-controlling interest of $6,452,000 was eliminated and retained earnings decreased by the remaining balance of $3,911,000.
As at and for the year ended September 30, 2011, additional equity attributable to non-controlling interest of $256,000 was reversed through retained earnings. Additionally, CIA repurchased the Company’s shares in CIA and the Company simultaneously purchased the portion of the operations carried out in CIA’s Paris office. As a result, under IFRS the liability relating to the put and call option to purchase the remaining shares of CIA of $10,363,000 was reversed and a gain of $3,655,000 was recognized within other income in the consolidated statements of earnings.
| CGI Group Inc. – Consolidated Financial Statements for the years ended September 30, 2012 and 2011 | 150 |
Notes to the Consolidated Financial Statements
For the years ended September 30, 2012 and 2011
(tabular amounts only are in thousands of Canadian dollars, except share data)
| 33. | Transition to IFRS (continued) |
| M. | Accounting for joint venture |
Under Canadian GAAP, the Company accounted for its investment in its joint venture under the proportionate consolidation method. Under IFRS, IAS 31, “Interests in Joint Ventures”, allows a company to account for any joint venture interest under either the proportionate consolidation or equity method. As of the Transition Date, the Company elected to account for its investment in its joint venture under the equity method. As a result, the consolidated balance sheets have been adjusted to remove the effect of proportionate consolidation and to account for its joint venture as an investment as follows:
| Adjustment as at October 1, 2010 | Adjustment as at September 30, 2011 | |||||||
| $ | $ | |||||||
Current assets | ||||||||
Cash and cash equivalents | (19,295 | ) | (21,550 | ) | ||||
Accounts receivable | (9,527 | ) | (9,456 | ) | ||||
Work in progress | (1,318 | ) | (9,137 | ) | ||||
Prepaid expenses and other current assets | (7,646 | ) | (3,763 | ) | ||||
|
|
|
| |||||
Total current assets | (37,786 | ) | (43,906 | ) | ||||
Property, plant and equipment | (669 | ) | (645 | ) | ||||
Contract costs | (478 | ) | (479 | ) | ||||
Intangible assets | (1,207 | ) | (864 | ) | ||||
Other long-term assets | (638 | ) | (321 | ) | ||||
Deferred tax assets | (362 | ) | (381 | ) | ||||
Investment in joint venture | 24,598 | 28,157 | ||||||
|
|
|
| |||||
Total assets | (16,542 | ) | (18,439 | ) | ||||
|
|
|
| |||||
Current liabilities | ||||||||
Accounts payable and accrued liabilities | (5,940 | ) | (7,424 | ) | ||||
Accrued compensation | (5,835 | ) | (6,127 | ) | ||||
Deferred revenue | (2,491 | ) | (1,875 | ) | ||||
Income taxes | (1,343 | ) | (2,019 | ) | ||||
|
|
|
| |||||
Total current liabilities | (15,609 | ) | (17,445 | ) | ||||
Deferred tax liabilities | (404 | ) | (661 | ) | ||||
Other long-term liabilities | (529 | ) | (333 | ) | ||||
|
|
|
| |||||
Total liabilities | (16,542 | ) | (18,439 | ) | ||||
|
|
|
| |||||
| CGI Group Inc. – Consolidated Financial Statements for the years ended September 30, 2012 and 2011 | 151 |
Notes to the Consolidated Financial Statements
For the years ended September 30, 2012 and 2011
(tabular amounts only are in thousands of Canadian dollars, except share data)
| 33. | Transition to IFRS (continued) |
| M. | Accounting for joint venture (continued) |
Under Canadian GAAP, the amounts below were included in the consolidated statements of earnings. Under IFRS, as a result of the application of the equity method, the amounts were removed from their respective lines and accounted for in a single line to reflect the share of profit on joint venture in the consolidated statements of earnings.
| Year ended September 30, 2011 | ||||
| $ | ||||
Revenues | 98,578 | |||
|
| |||
Operating expenses | ||||
Costs of services, selling and administrative | 80,080 | |||
Finance income | (207 | ) | ||
Foreign exchange loss | 86 | |||
|
| |||
| 79,959 | ||||
|
| |||
Earnings before income taxes | 18,619 | |||
Income tax expense | 5,260 | |||
|
| |||
Share of profit on joint venture | 13,359 | |||
|
| |||
| N. | Onerous leases |
Under IFRS, the criteria for recognizing provisions for onerous leases result in provisions being recognized earlier than under Canadian GAAP. As at September 30, 2011, additional provisions for onerous leases were required. As a result, short-term provisions increased by $1,532,000, long-term provisions increased by $3,700,000 and deferred tax liabilities decreased by $1,987,000. Related leasehold improvements of $722,000 were deducted from PP&E. Additionally accounts payable and accrued liabilities and other long-term liabilities decreased due to related rent credits by $87,000 and $602,000, respectively. This resulted in an increase of $5,091,000 in cost of services, selling and administration and a decrease in income tax expense of $1,926,000 for the year ended September 30, 2011.
Additionally, there was an insignificant adjustment to other comprehensive loss due to a foreign currency translation adjustment on these adjustments.
Presentation reclassifications
| O. | Provisions |
Under Canadian GAAP, provisions for onerous leases and other were presented within accounts payable and accrued liabilities or other long-term liabilities. Under IFRS, these provisions require separate line disclosure on the face of the balance sheet according to their short-term or long-term classification. As a result, as at October 1, 2010, $10,998,000 was reclassified from accounts payable and accrued liabilities into short-term provisions and $8,703,000 was reclassified from other long-term liabilities to long-term provisions. As at September 30, 2011, $10,593,000 was reclassified from accounts payable and accrued liabilities into short-term provisions and $23,091,000 was reclassified from other long-term liabilities to long-term provisions.
| CGI Group Inc. – Consolidated Financial Statements for the years ended September 30, 2012 and 2011 | 152 |
Notes to the Consolidated Financial Statements
For the years ended September 30, 2012 and 2011
(tabular amounts only are in thousands of Canadian dollars, except share data)
| 33. | Transition to IFRS (continued) |
| P. | Tax reclassification |
Under Canadian GAAP, deferred taxes were split between current and non-current components on the basis of either the underlying asset or liability or the expected reversal of items not related to an asset or liability. Under IFRS, all deferred tax assets and liabilities are classified as non-current. As a result, as at October 1, 2010, the short-term portion of future income tax assets of $16,509,000 was reclassified to deferred income tax assets and the short-term portion of future income tax liabilities of $26,423,000 was reclassified to deferred income tax liabilities and as at September 30, 2011, the short-term portion of future income tax assets of $3,522,000 was reclassified to deferred income tax assets and the short-term portion of future income tax liabilities of $20,389,000 was reclassified to deferred income tax liabilities.
| Q. | Contract costs |
Under Canadian GAAP, contract costs consisting of transition costs and incentives were classified as intangible assets. Under IFRS, transition costs and incentives provided in the form of cash or equity instruments are presented separately as contract costs and incentives provided in the form of discounts are presented within accounts receivable. As a result, as at October 1, 2010, $97,420,000 of transition costs and $34,614,000 of incentives in the form of cash or equity instruments were reclassified from intangible assets to contract costs and $11,842,000 was reclassified from intangible assets to accounts receivable. As at September 30, 2011, $78,747,000 of transition costs and $29,432,000 of incentives in the form of cash or equity instruments were reclassified from intangible assets to contract costs and $5,185,000 was reclassified from intangible assets to accounts receivable.
| R. | Classification of long-term debt |
Under Canadian GAAP, an amount due under an existing unsecured revolving facility maturing within the next 12 months was classified as long-term as at September 30, 2011 due to the fact that the Company entered into a private placement financing that was to be drawn down no later than December 15, 2011 with management’s intention of reimbursing part of the unsecured revolving facility with the proceeds of the private placement. Under IFRS, since the intention to reimburse with the proceeds of the private placement cannot be considered, the amount due under the unsecured revolving facility is classified as short-term as at September 30, 2011. As a result, an amount of $493,478,000 was classified from long-term debt to the current portion of long-term debt as at September 30, 2011.
| S. | Costs of services, selling and administrative |
Under Canadian GAAP, amortization and other income were presented as separate lines within the consolidated statements of income. Under IFRS, the Company chooses to present expenses according to their function. As a result, for the year ended September 30, 2011, amortization of $211,372,000 and a portion of other income of $75,000 were reclassified into costs of services, selling and administrative.
| CGI Group Inc. – Consolidated Financial Statements for the years ended September 30, 2012 and 2011 | 153 |
Notes to the Consolidated Financial Statements
For the years ended September 30, 2012 and 2011
(tabular amounts only are in thousands of Canadian dollars, except share data)
| 33. | Transition to IFRS (continued) |
COMPARATIVE FINANCIAL STATEMENTS
The following reconciliations illustrate the impact of adjustments and reclassifications from Canadian GAAP to IFRS for the consolidated balance sheet as at the Transition Date and as at September 30, 2011 and for the consolidated statements of earnings for the year ended September 30, 2011.
Reconciliation of consolidated balance sheet
As at October 1, 2010 | Canadian GAAP | Adjustments | IFRS | |||||||||||||
| $ | $ | $ | ||||||||||||||
Assets | ||||||||||||||||
Current assets | ||||||||||||||||
Cash and cash equivalents | 127,824 | M | (19,295 | ) | 108,529 | |||||||||||
Short-term investments | 13,196 | — | 13,196 | |||||||||||||
Accounts receivable | 423,926 | M, Q | 2,315 | 426,241 | ||||||||||||
Work in progress | 358,984 | M | (1,318 | ) | 357,666 | |||||||||||
Prepaid expenses and other current assets | 76,844 | M | (7,646 | ) | 69,198 | |||||||||||
Income taxes | 7,169 | — | 7,169 | |||||||||||||
Future income taxes | 16,509 | P | (16,509 | ) | — | |||||||||||
|
|
|
|
|
| |||||||||||
Total current assets before funds held for clients | 1,024,452 | (42,453 | ) | 981,999 | ||||||||||||
Funds held for clients | 248,695 | — | 248,695 | |||||||||||||
|
|
|
|
|
| |||||||||||
Total current assets | 1,273,147 | �� | (42,453 | ) | 1,230,694 | |||||||||||
Property, plant and equipment | 238,024 | D, M | (1,392 | ) | 236,632 | |||||||||||
Contract costs | — | I, K, M, Q | 133,109 | 133,109 | ||||||||||||
Intangible assets | 516,754 | H, K, M, Q | (147,718 | ) | 369,036 | |||||||||||
Other long-term assets | 42,261 | M | (638 | ) | 41,623 | |||||||||||
Deferred tax assets | 11,592 | D, K, M, P | 11,296 | 22,888 | ||||||||||||
Investment in joint venture | — | C, M | 22,814 | 22,814 | ||||||||||||
Goodwill | 2,525,413 | — | 2,525,413 | |||||||||||||
|
|
|
|
|
| |||||||||||
| 4,607,191 | (24,982 | ) | 4,582,209 | |||||||||||||
|
|
|
|
|
| |||||||||||
Liabilities | ||||||||||||||||
Current liabilities | ||||||||||||||||
Accounts payable and accrued liabilities | 304,376 | L, M, O | (6,575 | ) | 297,801 | |||||||||||
Accrued compensation | 191,486 | M | (5,835 | ) | 185,651 | |||||||||||
Deferred revenue | 145,793 | M | (2,491 | ) | 143,302 | |||||||||||
Income taxes | 86,877 | M | (1,343 | ) | 85,534 | |||||||||||
Provisions | — | O | 10,998 | 10,998 | ||||||||||||
Future income taxes | 26,423 | P | (26,423 | ) | — | |||||||||||
Current portion of long-term debt | 114,577 | — | 114,577 | |||||||||||||
|
|
|
|
|
| |||||||||||
Total current liabilities before clients’ funds obligations | 869,532 | (31,669 | ) | 837,863 | ||||||||||||
Clients’ funds obligations | 248,695 | — | 248,695 | |||||||||||||
|
|
|
|
|
| |||||||||||
Total current liabilities | 1,118,227 | (31,669 | ) | 1,086,558 | ||||||||||||
Deferred tax liabilities | 170,683 | C, D,H, I, K,M,P | 18,177 | 188,860 | ||||||||||||
Long-term provisions | — | D, O | 9,265 | 9,265 | ||||||||||||
Long-term debt | 1,039,299 | — | 1,039,299 | |||||||||||||
Retirement benefits obligations | 7,008 | C | (780 | ) | 6,228 | |||||||||||
Other long-term liabilities | 112,891 | K, M, O | (10,127 | ) | 102,764 | |||||||||||
|
|
|
|
|
| |||||||||||
| 2,448,108 | (15,134 | ) | 2,432,974 | |||||||||||||
|
|
|
|
|
| |||||||||||
Equity | ||||||||||||||||
Attributable to shareholders of CGI Group Inc. | ||||||||||||||||
Retained earnings | 1,196,386 | B, C, D, H, I, J, K, L | (351,096 | ) | 845,290 | |||||||||||
Accumulated other comprehensive (loss) income | (321,746 | ) | B | 336,215 | 14,469 | |||||||||||
Capital stock | 1,195,069 | — | 1,195,069 | |||||||||||||
Contributed surplus | 82,922 | J, K | 11,485 | 94,407 | ||||||||||||
|
|
|
|
|
| |||||||||||
Attributable to shareholders of CGI Group Inc. | 2,152,631 | (3,396 | ) | 2,149,235 | ||||||||||||
Attributable to non-controlling interest | 6,452 | L | (6,452 | ) | — | |||||||||||
|
|
|
|
|
| |||||||||||
| 2,159,083 | (9,848 | ) | 2,149,235 | |||||||||||||
|
|
|
|
|
| |||||||||||
| 4,607,191 | (24,982 | ) | 4,582,209 | |||||||||||||
|
|
|
|
|
| |||||||||||
| CGI Group Inc. – Consolidated Financial Statements for the years ended September 30, 2012 and 2011 | 154 |
Notes to the Consolidated Financial Statements
For the years ended September 30, 2012 and 2011
(tabular amounts only are in thousands of Canadian dollars, except share data)
| 33. | Transition to IFRS (continued) |
Reconciliation of consolidated balance sheet
As at September 30, 2011 | Canadian GAAP | Adjustments | IFRS | |||||||||||||
| $ | $ | $ | ||||||||||||||
Assets | ||||||||||||||||
Current assets | ||||||||||||||||
Cash and cash equivalents | 157,761 | M | (21,550 | ) | 136,211 | |||||||||||
Short-term investments | 10,166 | — | 10,166 | |||||||||||||
Accounts receivable | 494,755 | M, Q | (4,271 | ) | 490,484 | |||||||||||
Work in progress | 400,203 | M | (9,137 | ) | 391,066 | |||||||||||
Prepaid expenses and other current assets | 104,170 | M | (3,763 | ) | 100,407 | |||||||||||
Income taxes | 4,252 | — | 4,252 | |||||||||||||
Future income taxes | 3,522 | P | (3,522 | ) | — | |||||||||||
|
|
|
|
|
| |||||||||||
Total current assets before funds held for clients | 1,174,829 | (42,243 | ) | 1,132,586 | ||||||||||||
Funds held for clients | 247,622 | — | 247,622 | |||||||||||||
|
|
|
|
|
| |||||||||||
Total current assets | 1,422,451 | (42,243 | ) | 1,380,208 | ||||||||||||
Property, plant and equipment | 251,668 | D, M, N | (1,767 | ) | 249,901 | |||||||||||
Contract costs | — | I, K, M, Q | 107,242 | 107,242 | ||||||||||||
Intangible assets | 407,887 | H, K, M, Q | (115,754 | ) | 292,133 | |||||||||||
Other long-term assets | 55,914 | M | (321 | ) | 55,593 | |||||||||||
Deferred tax assets | 11,601 | D, K, M, P | (1,719 | ) | 9,882 | |||||||||||
Investment in joint venture | — | C, M | 26,373 | 26,373 | ||||||||||||
Goodwill | 2,536,022 | — | 2,536,022 | |||||||||||||
|
|
|
|
|
| |||||||||||
| 4,685,543 | (28,189 | ) | 4,657,354 | |||||||||||||
|
|
|
|
|
| |||||||||||
Liabilities | ||||||||||||||||
Current liabilities | ||||||||||||||||
Bank overdraft | 75,538 | — | 75,538 | |||||||||||||
Accounts payable and accrued liabilities | 321,745 | L, M, N, O | (18,104 | ) | 303,641 | |||||||||||
Accrued compensation | 189,969 | M | (6,127 | ) | 183,842 | |||||||||||
Deferred revenue | 154,813 | M | (1,875 | ) | 152,938 | |||||||||||
Income taxes | 53,841 | M | (2,019 | ) | 51,822 | |||||||||||
Provisions | — | N, O | 12,125 | 12,125 | ||||||||||||
Future income taxes | 20,389 | P | (20,389 | ) | — | |||||||||||
Current portion of long-term debt | 402,534 | R | 493,478 | 896,012 | ||||||||||||
|
|
|
|
|
| |||||||||||
Total current liabilities before clients’ funds obligations | 1,218,829 | 457,089 | 1,675,918 | |||||||||||||
Clients’ funds obligations | 244,660 | — | 244,660 | |||||||||||||
|
|
|
|
|
| |||||||||||
Total current liabilities | 1,463,489 | 457,089 | 1,920,578 | |||||||||||||
Deferred tax liabilities | 146,889 | C, D, H, I, K, M, N, P | 2,505 | 149,394 | ||||||||||||
Long-term provisions | — | D, N, O | 27,672 | 27,672 | ||||||||||||
Long-term debt | 603,147 | R | (493,478 | ) | 109,669 | |||||||||||
Retirement benefits obligations | 6,966 | C | 69 | 7,035 | ||||||||||||
Other long-term liabilities | 118,696 | K, M, N, O | (24,921 | ) | 93,775 | |||||||||||
|
|
|
|
|
| |||||||||||
| 2,339,187 | (31,064 | ) | 2,308,123 | |||||||||||||
|
|
|
|
|
| |||||||||||
Equity | ||||||||||||||||
Retained earnings | 1,405,365 | B, C, D, H, I, J, K, L, N | (347,766 | ) | 1,057,599 | |||||||||||
Accumulated other comprehensive (loss) income | (321,570 | ) | B, C, D, I, K, N | 336,142 | 14,572 | |||||||||||
Capital stock | 1,178,559 | — | 1,178,559 | |||||||||||||
Contributed surplus | 84,002 | J, K | 14,499 | 98,501 | ||||||||||||
|
|
|
|
|
| |||||||||||
| 2,346,356 | 2,875 | 2,349,231 | ||||||||||||||
|
|
|
|
|
| |||||||||||
| 4,685,543 | (28,189 | ) | 4,657,354 | |||||||||||||
|
|
|
|
|
| |||||||||||
| CGI Group Inc. – Consolidated Financial Statements for the years ended September 30, 2012 and 2011 | 155 |
Notes to the Consolidated Financial Statements
For the years ended September 30, 2012 and 2011
(tabular amounts only are in thousands of Canadian dollars, except share data)
| 33. | Transition to IFRS (continued) |
Reconciliation of consolidated statements of earnings
Year ended September 30, 2011 | Canadian GAAP | Adjustments | IFRS | |||||||||||||
| $ | $ | $ | ||||||||||||||
Revenues | 4,323,237 | I, K, M | (99,295 | ) | 4,223,942 | |||||||||||
|
|
|
|
|
| |||||||||||
Operating expenses | ||||||||||||||||
Costs of services, selling and administrative | 3,553,192 | H, I, J, K, M, N, S | 137,768 | 3,690,960 | ||||||||||||
Amortization and depreciation | 211,372 | S | (211,372 | ) | — | |||||||||||
Acquisition-related and integration costs | 3,675 | — | 3,675 | |||||||||||||
Finance costs | 19,395 | — | 19,395 | |||||||||||||
Finance income | (3,759 | ) | M | 207 | (3,552 | ) | ||||||||||
Other income | (3,917 | ) | L, S | (3,730 | ) | (7,647 | ) | |||||||||
Foreign exchange gain | (3,279 | ) | M | (86 | ) | (3,365 | ) | |||||||||
Share of profit in joint venture | — | M | (13,359 | ) | (13,359 | ) | ||||||||||
|
|
|
|
|
| |||||||||||
| 3,776,679 | (90,572 | ) | 3,686,107 | |||||||||||||
|
|
|
|
|
| |||||||||||
Earnings before income taxes | 546,558 | (8,723 | ) | 537,835 | ||||||||||||
Income tax expense | 111,493 | H, I, K, M, N | (11,797 | ) | 99,696 | |||||||||||
|
|
|
|
|
| |||||||||||
Net earnings | 435,065 | 3,074 | 438,139 | |||||||||||||
|
|
|
|
|
| |||||||||||
Earnings per share | ||||||||||||||||
Basic earnings per share | 1.64 | 1.65 | ||||||||||||||
Diluted earnings per share | 1.58 | 1.59 | ||||||||||||||
|
|
|
|
|
| |||||||||||
| CGI Group Inc. – Consolidated Financial Statements for the years ended September 30, 2012 and 2011 | 156 |