EXHIBIT 99.1
CGI Group Inc.
2014 Annual Report
CGI’s 2014 Annual Report is comprised
of two separate volumes:
Volume 1:2014Annual Review
&
Volume 2:Fiscal 2014 Results
Volume 1 of the Annual Report
follows this page.
(this page does not form part of the Annual Report)

2014 Annual Review
OUR CLIENT COMMITMENT
TO LISTEN TO INNOVATE TO DELIVER
Business and IT consulting Systems integration IT managed services Business process services

In 2014, we conducted 820 in-person client interviews and 5,825 quality assessments
to align our services, solutions and delivery strategies to the exact needs of our clients. This builds upon an exercise we have repeated every year since our founding to continuously listen and respond to client priorities. This year’s Annual Review brings you the insights of 2014’s conversations. It provides an overview of our clients’ industry priorities and a snapshot of those strategic themes that, regardless of industry and location, are of signi?cant importance to all clients. The review offers a demonstration of how we partner with clients to deliver signi?cant value to their mission-critical, transformative work.
Revenue of CA$10.5 billion and backlog of CA$18.2 billion
Project delivery 95% on time and within budget
9/10 client satisfaction score
5th largest independent IT and business process services company
68,000 professionals
400 of?ces
40 countries
140 CGI-built business and IT solutions
CGI – 2014 ANNUAL REVIEW
CONTENTS
2 Satisfying clients is our business
Founder and Executive Chairman of the Board Serge Godin President and Chief Executive Of?cer Michael E. Roach
INDUSTRY INSIGHTS
4 Financial services
8 Health
10 Strategic theme – Digital transformation
12 Government
16 Communications
18 Utilities
20 Strategic theme – IT modernization
22 Oil and gas
24 Manufacturing
26 Strategic theme – Big data analytics
28 Transportation
30 Post and logistics
32 Retail and consumer services
34 Strategic theme – Cybersecurity
CGI SOLUTIONS
36 Mission-critical business and IT solutions
ABOUT CGI
38 Global footprint
40 Leadership team
42 Corporate social responsibility
43 CGI Constitution
1

Satisfying clients is our business
In 2014, CGI continued to build on a 38 year heritage of listening passionately to clients to evolve with their needs, innovating together to create business value, and delivering tangible results that help achieve long-term, sustainable growth.
The pages that follow offer highlights of our conversations with clients over the past year and our work in helping to drive their success. As we look ahead to 2015, Founder and Executive Chairman of the Board Serge Godin and President and Chief Executive Of?cer Michael E. Roach share their insights on CGI’s strategy and priorities in meeting client objectives.
One of the key messages of this year’s Annual Review is “We listen.” How does CGI invest in listening to clients to better understand and respond to their needs?
Serge: We conduct face-to-face interviews with clients every year as part of our strategic planning process. These interviews are very important to evolving our long-term vision as a company as they allow us to get a pulse on clients’ top business and IT priorities. In 2014, we completed 820 interviews. We use this input to align our priorities with clients’ priorities to ensure we invest in the capabilities and resources they need. This Annual Review is one way in which we report back to clients the results of these discussions.
Michael: As part of our day-to-day operating model, we also hold in-depth, in-person conversations with our clients as part of CGI’s Client Satisfaction Assessment Program (CSAP). This program underpins our commitment as a company to continuous improvement. Through our CSAP assessments, we obtain direct, signed feedback from clients detailing what we have done well and where we can improve. This, in turn, enables us to ensure high client satisfaction. In 2014, we conducted 5,825 assessments and achieved an average satisfaction rating of 9/10.
“Going into 2015, we are a solid, aligned company focused on operational excellence and positioned to further grow with our clients.”
��
| 2 |
CGI – 2014 ANNUAL REVIEW
CGI has doubled ?ve times over the past 20 years. How important is scale to our clients?
Serge: Today, CGI has a global platform of 400 of?ces in 40 countries to better serve our clients anywhere, anytime. We have implemented the CGI operating model and embedded the CGI Management Foundation across our global operations. The Foundation serves as the governing framework for all of our operations and our relationships with clients, members and shareholders. By focusing on the fundamentals outlined within the Foundation, we have the ?nancial strength and global alignment that enables us to consistently meet and exceed expectations.
“We will continue to work relentlessly to earn the satisfaction of all of our stakeholders.”
Michael: With this type of rapid growth, successful integration is a critical factor. We are a uni?ed company focused on operational excellence and on creating value. One particular focus area for 2015 is to continue to help bring innovation to our clients’ businesses. CGI’s services and solutions are transforming client operations around the world, and we want to focus more on this work in the coming year. To support this, we launched in 2014 a global Innovation, Creativity and Experimentation (ICE) program for our members to develop innovative solutions for clients—and with ourclients.
What can clients expect as CGI’s next area of growth?
Serge: We are going to build upon the global platform I just described. We’ve gone broad, now we are going to go deep. By this I mean we will build critical mass in those geographies that are key markets for our clients. Our objective is to go deep into metro markets with our industry expertise, end-to-end service offering, including IP services and solutions, and balanced global delivery model.
Michael: This notion of going deeper is important as our acquisition strategy will be very focused on increasing our capabilities to serve our clients better. Our goal is to be the best company, not necessarily the biggest. We know that clients want to partner with quality companies that can best serve them on a global basis. We are very focused on strengthening our presence, expertise and offerings within their markets to serve as their partner and expert of choice.
The CGI delivery model is a key strategic differentiator and enabler to creating additional value for our clients. What attracts clients to this model?
Michael: CGI is committed to delivering the best value to our clients in terms of service excellence, price and risk management. Through our client proximity model, we work closely with clients at the local level, providing deep industry and technology expertise and high responsiveness. Through our global delivery network, we offer the advantages of best-?t expertise and resources. We continue to open centers in strategic locations worldwide, adding three new centers this year to complement and expand our mix of onshore, nearshore and offshore centers. Serge: Our model is focused on providing the best value to clients. It is built upon rigorous quality management standards with fully certi?ed operations, demonstrating the highest standards in delivery processes and methodologies. All of this drives service excellence across CGI and is a key reason behind our project delivery track record of 95% on time and within budget.
What are your ?nal thoughts as CGI moves forward?
Michael: I am thankful for the ongoing trust and loyalty of our clients and shareholders, and the talent and dedication of our members. We will continue to listen, innovate and deliver in 2015.
Serge: We are committed to working relentlessly to drive the satisfaction of our clients, members and shareholders. We are grateful for their con?dence throughout our 38-year journey and we look forward to continuing to contribute to their success.
| 3 |
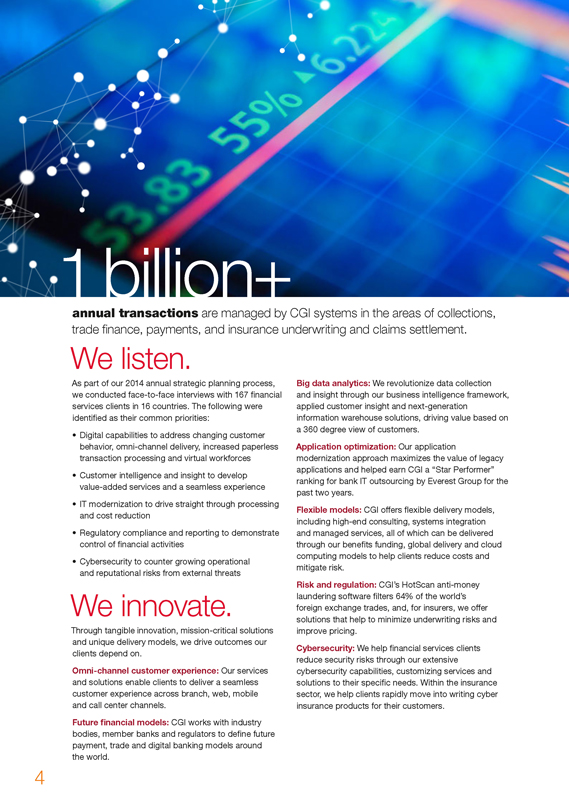
| 1 | billion+ |
annual transactions are managed by CGI systems in the areas of collections, trade ?nance, payments, and insurance underwriting and claims settlement.
We listen.
As part of our 2014 annual strategic planning process, we conducted face-to-face interviews with 167 ?nancial services clients in 16 countries. The following were identi?ed as their common priorities:
| • |
| Digital capabilities to address changing customer behavior, omni-channel delivery, increased paperless transaction processing and virtual workforces |
| • |
| Customer intelligence and insight to develop value-added services and a seamless experience |
| • |
| IT modernization to drive straight through processing and cost reduction |
| • |
| Regulatory compliance and reporting to demonstrate control of ?nancial activities |
| • |
| Cybersecurity to counter growing operational and reputational risks from external threats |
We innovate.
Through tangible innovation, mission-critical solutions and unique delivery models, we drive outcomes our clients depend on.
Omni-channel customer experience: Our services and solutions enable clients to deliver a seamless customer experience across branch, web, mobile and call center channels.
Future ?nancial models: CGI works with industry bodies, member banks and regulators to de?ne future payment, trade and digital banking models around the world.
Big data analytics: We revolutionize data collection and insight through our business intelligence framework, applied customer insight and next-generation information warehouse solutions, driving value based on a 360 degree view of customers.
Application optimization: Our application modernization approach maximizes the value of legacy applications and helped earn CGI a “Star Performer” ranking for bank IT outsourcing by Everest Group for the past two years.
Flexible models: CGI offers ?exible delivery models, including high-end consulting, systems integration and managed services, all of which can be delivered through our bene?ts funding, global delivery and cloud computing models to help clients reduce costs and mitigate risk.
Risk and regulation: CGI’s HotScan anti-money laundering software filters 64% of the world’s foreign exchange trades, and, for insurers, we offer solutions that help to minimize underwriting risks and improve pricing.
Cybersecurity: We help ?nancial services clients reduce security risks through our extensive cybersecurity capabilities, customizing services and solutions to their speci?c needs. Within the insurance sector, we help clients rapidly move into writing cyber insurance products for their customers.
| 4 |

CGI – 2014 ANNUAL REVIEW
FINANCIAL SERVICES
Digital transformation for banking: “Going digital” is more than a marketing strategy; it is a fundamental change in how organizations learn about and satisfy their customers. Although banks have been investing in digital capabilities, many want to improve their return on investment. CGI works with clients to guide their digital transformations through a wide range of services and solutions for strategy development, business intelligence, omni-channel delivery, cybersecurity and more. In 2014, CGI published a study, “Understanding Financial Consumers in the Digital Era,” which highlights key insights and recommendations for retail banks seeking to advance in the digital world.
Learn more at cgi.com/?nancialconsumersurvey.
Core transformation for insurance: Leading insurers are transforming their core systems to drive agility, reduce time-to-market, improve customer service, save costs and more. Core system transformation enables insurers to overcome legacy constraints and succeed in today’s dynamic marketplace. CGI helps to ensure their success through a broad range of services—from infrastructure and application services, to packaged solution implementation, application re-platforming and quality assurance. We work closely with insurers to develop and implement an effective transformation strategy and roadmap.
| 5 |

Expertise
across all ?nancial services sectors
Retail banking and consumer ?nance
We work with leading retail institutions across the globe, providing:
Digital, omni-channel and big data strategies and solutions
30+ delivery centers and 7,000+ members with deep expertise in core banking platforms and applications
Core retail banking platforms that support multi-channel, end-to-end banking activities
Hybrid security model providing control and audit capabilities, as well as hands-on support
Wealth and portfolio management solutions that manage more than $1 trillion in assets
Capital markets
Our capital markets experience across both the buy and sell sides includes:
Management of complex trading environments and assets for leading capital market organizations in Europe and North America
End-to-end services and solutions for asset managers
CGI’s CLS Manager, which provides a complete settlement solution for Continuous Linked Settlement (CLS) member banks
Corporate and transaction banking
CGI has deep transaction banking expertise, including:
High-volume payment engines and related services that enable banks to build and run payment service hubs
Best-in-class trade ?nance platform, CGI Trade360
Treasury and asset management software used by 160+ clients in 10 countries
Cash management capabilities that provide seamless front-to-back processing
Insurance (P&C, Life)
We provide services and solutions across the entire insurance value chain, including:
Full IT outsourcing and application management
Ratabase, an industry-leading rating and pricing platform
Systems integration services for leading core insurance solutions
Industry data and reporting services
Business and IT consulting to advance client strategies
6

CGI – 2014 ANNUAL REVIEW
FINANCIAL SERVICES
We deliver.
CGI delivers to 24 of the top 30 banks in the world and 12 of the top 20 global insurers.
We have completed 350+ implementations of our collections, recoveries and loan originations solutions. Our solutions typically reduce costs by 10-25% while improving recovery rates.
Every year, CGI software processes more than
5 million card payment transactions. More than $1 billion in fraud has been avoided through the use of CGI-developed systems.
CGI’s Ratabase rating and pricing engine has been implemented for 100+ P&C and life insurers.
Our trade ?nance SaaS platform, CGI Trade360, supports global trade ?nance services in more than 80 countries.
We partner with more than 100 credit unions, banks and trusts, representing approximately 3 million end customers and more than 30% of the market share of Canadian credit union members.
CGI delivers more than 15 million risk information reports annually to insurers, brokers and agents.
cgi.com/?nancial-services
“Since 2001, CGI has been instrumental in supporting ANZ in our global transaction banking business. By partnering with CGI, we have met the demands of the evolving trade finance marketplace and our growth strategy. CGI allows us to concentrate on our business solutions and customers while they take care of our trade finance technology. This year we extended our contract for CGI’s Trade360 SaaS platform to further support our growth strategy. The CGI Trade360 platform has been very important to ANZ’s global expansion and supporting our growth as a super-regional bank. We use the one platform across our trade business globally.”
Alan Huse Managing Director,
Global Transaction Banking ANZ
Melbourne, Australia
| 7 |

1,000+
health facilities are supported by CGI services and solutions. Our health industry clients include government health regulators, providers and payers; commercial individual care delivery institutions, integrated health systems and payers; and pharmaceutical and life sciences ?rms.
We listen.
As part of our 2014 annual strategic planning process, we conducted face-to-face interviews with health industry clients in 8 countries. The following were identi?ed as their common priorities:
| • |
| Extension or replacement of legacy systems to meet changing demands |
| • |
| Increase in operational ef?ciency through transformational managed services |
| • |
| Mobility across legacy platforms to extend services |
| • |
| Clinical and organizational insights through advanced enterprise analytics |
| • |
| Compliance with security and privacy legislation |
We innovate.
We help our clients respond to these priorities with mission-critical services and solutions such as IT modernization, managed services, data management, mobile computing and cybersecurity, supported by our global delivery network—always with the aim of improving business and clinical outcomes.
Electronic medical records (EMRs): We implement affordable, modular EMR solutions that give clients the ?exibility to adopt the latest platforms and leverage existing investments in clinical applications.
Patient-centric care management:
CGI CommunityCare360 brings together data and systems for home monitoring, care planning, workforce management and ambulance dispatch to advance health beyond hospital walls.
Diagnostic image exchange: Our interoperable solutions provide secure and rapid access to images across networks, improving clinical ef?ciency and the patient experience.
Enterprise content management (ECM):
For 170+ hospitals, CGI’s Sovera ECM solutions manage more than 6 billion health records and streamline processes, reduce costs, improve care, enhance the revenue cycle and increase physician satisfaction.
Health analytics: We apply advanced data analytics to help clients derive insights for improving operational ef?ciency, reducing fraud and waste, and avoiding harmful incidents.
Health information exchange (HIE): We help governments, health systems and payers to advance their visions of securely exchanging health information to improve healthcare quality.
Administrative excellence: CGI applies advanced technology and shared services models to help health clients transform their supply chain, logistics and other administrative functions.
| 8 |

CGI – 2014 ANNUAL REVIEW
HEALTH
We deliver.
CGI supports health clients with end-to-end implementation and integration services, as well as CGI designed solutions.
Here are representative examples of our client partnerships.
CGI’s Merlot Medi solution is used by the Hospital District of Helsinki and Uusimaa (HUS), which includes 24 municipalities, to support more than 223,000 emergency rescue missions annually.
University College London Hospital has managed the care of 60,000+ patients at the Macmillan Cancer Centre in London using CGI’s e-CareLogic technology.
CGI-supported pharmacy systems have helped with the dispensing of more than 75 million prescriptions to citizens in Alberta and Saskatchewan, Canada. For the New York State Of?ce of Mental Health, one of the largest healthcare delivery organizations in the U.S., CGI is implementing a new EMR system to provide a stable, ?exible platform for leveraging technology to improve patient care and safety.
cgi.com/health
“Working with CGI since 2001, we have been able to rapidly develop and amend our critical business applications in the event of legislative change. It is essential that our platforms are delivered on time and to a high quality, ensuring our citizens have access to the information and services they need in accordance with legislative timeframes and requirements. And I’m delighted to have our ministry and partnership with CGI recognized at the Information Technology Association of Canada INGENIOUS innovation awards in the Large Public Organization category for the development of the Alberta Organ and Tissue Donation Registry (AOTDR).”
Susan Anderson
Assistant Deputy Minister and CIO, Health Information Technology and Systems Division Alberta Health Alberta, Canada
9

CGI – 2014 ANNUAL REVIEW
DIGITAL TRANSFORMATION
10
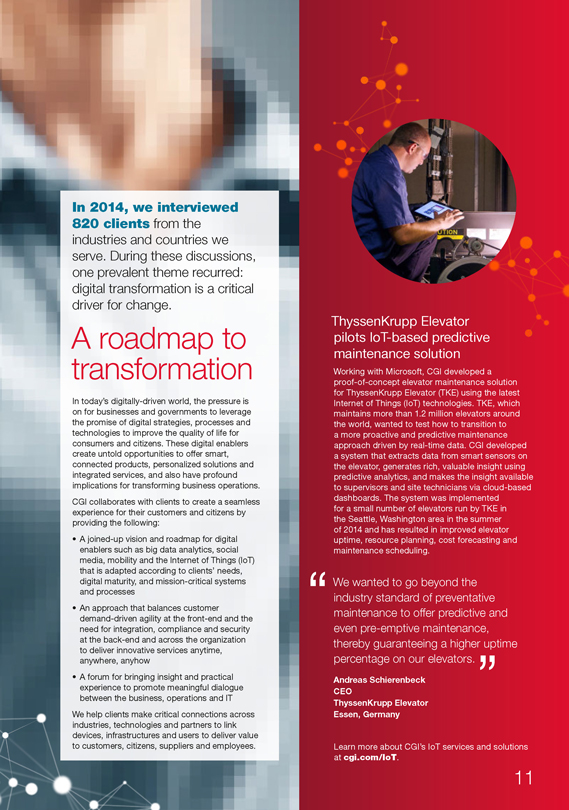
In 2014, we interviewed 820 clients from the industries and countries we serve. During these discussions, one prevalent theme recurred: digital transformation is a critical driver for change.
A roadmap to transformation
In today’s digitally-driven world, the pressure is on for businesses and governments to leverage the promise of digital strategies, processes and technologies to improve the quality of life for consumers and citizens. These digital enablers create untold opportunities to offer smart, connected products, personalized solutions and integrated services, and also have profound implications for transforming business operations. CGI collaborates with clients to create a seamless experience for their customers and citizens by providing the following:
| • |
| A joined-up vision and roadmap for digital enablers such as big data analytics, social media, mobility and the Internet of Things (IoT) that is adapted according to clients’ needs, digital maturity, and mission-critical systems and processes |
| • |
| An approach that balances customer demand-driven agility at the front-end and the need for integration, compliance and security at the back-end and across the organization to deliver innovative services anytime, anywhere, anyhow |
| • |
| A forum for bringing insight and practical experience to promote meaningful dialogue between the business, operations and IT |
We help clients make critical connections across industries, technologies and partners to link devices, infrastructures and users to deliver value to customers, citizens, suppliers and employees.
ThyssenKrupp Elevator pilots IoT-based predictive maintenance solution
Working with Microsoft, CGI developed a proof-of-concept elevator maintenance solution for ThyssenKrupp Elevator (TKE) using the latest Internet of Things (IoT) technologies. TKE, which maintains more than 1.2 million elevators around the world, wanted to test how to transition to a more proactive and predictive maintenance approach driven by real-time data. CGI developed a system that extracts data from smart sensors on the elevator, generates rich, valuable insight using predictive analytics, and makes the insight available to supervisors and site technicians via cloud-based dashboards. The system was implemented for a small number of elevators run by TKE in the Seattle, Washington area in the summer of 2014 and has resulted in improved elevator uptime, resource planning, cost forecasting and maintenance scheduling.
“We wanted to go beyond the industry standard of preventative maintenance to offer predictive and even pre-emptive maintenance, thereby guaranteeing a higher uptime percentage on our elevators.”
Andreas Schierenbeck CEO
ThyssenKrupp Elevator Essen, Germany
Learn more about CGI’s IoT services and solutions at cgi.com/IoT.
11
$700+ billion
in government ?nancials are managed by CGI systems. We have successfully implemented or modernized more than 500 ERP systems for U.S. federal, state and local governments.
We listen.
As part of our 2014 annual strategic planning process, we conducted face-to-face interviews with 231 government clients in 12 countries. The following were identi?ed as their common priorities:
| • |
| IT modernization to enable cost savings and greater agility |
| • |
| Digital transformation for enterprise processes and citizen interactions |
| • |
| Shared services to drive economies of scale |
| • |
| Cybersecurity to protect sensitive data and systems |
| • |
| Data analytics for faster, better decisions |
We innovate.
We respond to these priorities with tangible innovation, mission-critical solutions and agile delivery and funding models to help clients improve public services and increase ef?ciency.
CGI solutions: CGI’s purpose-built applications for critical government functions support administrative, ?nancial and revenue management; case management and public safety; citizen participation; identity and access management; patient-centric care; public space, facilities and energy management; mobile workforce management; and much more.
Modernization expertise: CGI helps governments modernize both systems and processes, while leveraging current assets, to streamline how they do business across the enterprise. Digital transformation: We help public sector clients adopt secure web, mobile, social and other digital technologies to achieve modern interaction models, transparency and accountability for public services.
Flexible delivery models: CGI offers a range of delivery models, including secure government clouds, managed services and onshore delivery centers, as well as bene?ts-funding approaches, to help clients reduce costs, mitigate risk, improve performance and adapt to evolving requirements. Cybersecurity: Our government-certi?ed cybersecurity experts and mission-grade solutions help agencies defend against ever-evolving cyber attacks in a model best suited to the degree of classi?cation of their mission and systems and budget requirements.
Big data analytics: CGI helps government clients better capture, integrate and analyze large amounts of data to gain real-time visibility and insight for better decisions.
12

CGI – 2014 ANNUAL REVIEW
GOVERNMENT
Future cities: CGI helps cities and regions build more sustainable futures. Using methodologies and tools based on international standards, we partner with clients to develop roadmaps and innovative solutions in energy and water management, intelligent transportation, health and social services, and more. As an example, CGI uses mobile technologies and gami?cation to help governments motivate citizens to participate in local decisions and contribute to their communities. Learn more at cgi.com/future-cities.
13

Expertise
across all government sectors
Central and federal
We have partnered with nearly 200 U.S. and Canadian federal agencies, plus the European Commission and central governments in 8 countries to:
Deliver self-service and open government strategies and solutions to meet changing expectations and reduce costs
Provide IT modernization, digital transformation and shared services to improve ef?ciency and effectiveness
Manage cybersecurity risks and threats
State, provincial and local
46 U.S. states and 200 local governments, a majority of Canadian provinces and territories, and numerous local governments throughout Europe and Australia have partnered with CGI to help:
Manage costs by modernizing IT and collaborating in multi-agency environments
Shift the role of IT to citizen services, where disruptive technology will enable innovation
Better manage the knowledge base due to an aging workforce
Defense and intelligence
National agencies in Canada, France, the Netherlands, Sweden, the UK and the U.S., as well as NATO, have relied on CGI to help them:
Adapt to budget pressures and a force realignment while enabling a rapid response to support forces
Deliver data insight and security to provide secure, timely and relevant data in complex and often hostile environments
Ensure interoperability of systems with other defense agencies
14

CGI – 2014 ANNUAL REVIEW
GOVERNMENT
We deliver.
CGI supports public sector clients by providing deep domain knowledge, purpose-built solutions and end-to-end services for mission-critical functions. Here are representative examples of the results of our client partnerships. The Police National Database, built and operated by CGI, is a critical intelligence system serving every police force in the UK. With a database of over 2.5 billion combined records, it allows forces to work together to make connections between suspects, events and locations.
23 U.S. states have partnered with CGI to advance their ERP systems and processes. In fact, 6 of the last 7 U.S. states to move forward with ERP modernizations chose CGI as their technology partner.
The World Anti-Doping Agency launched a CGI-developed “whereabouts” mobile application for more than 25,000 athletes worldwide. The app enables athletes to enter, check and change information on their whereabouts as part of their regulatory obligations.
The core infrastructure for the ?rst demonstrator for the Galileo Commercial Service, part of the emerging European Global Navigation Satellite System, is being built by CGI.
In 2014, more than 12.7 million citizens in France electronically ?led income tax declarations using CGI’s TéléIR application. For the U.S. Department of State, CGI provides services to approximately 5 million U.S. visa applicants annually in 68 countries and in 39 languages.
cgi.com/government
“Based on CGI Advantage ERP, CORE (Colorado Operations Resource Engine) will help Colorado departments and agencies reach new levels of efficiency and effectiveness. It’s a transformative solution that will serve our citizens for years to come and I applaud the outstanding work of our state team and CGI.”
Kathy Nesbitt Executive Director
Colorado Department of Personnel & Administration Denver, Colorado, United States
“CGI’s integration services enable us to deliver our agenda more effectively. The provision of desktop services hosted on CGI’s Secure Government Cloud offers a more flexible and open platform in line with UK Government’s IT disaggregation strategy. We have chosen the right partner for our diverse IT needs.”
Martin Ritchie CTO
UK Department of Energy and Climate Change London, United Kingdom
15
7+ million
communications (email, text and multimedia messages, interactive voice response and print) sent monthly to Bell customers, through a solution developed and maintained by CGI, are helping to improve the customer experience.
We listen.
As part of our 2014 annual strategic planning process, we conducted face-to-face interviews with communications industry clients in 11 countries. The following were identi?ed as their common priorities:
| • |
| Agile, convergent systems leveraging new technologies, including the Internet of Things (IoT), to support innovative services and improve the customer experience |
| • |
| IT simpli?cation and rationalization to reduce costs and accelerate time to market |
| • |
| Data analytics to develop new offers and strengthen customer relationships |
| • |
| Cybersecurity to protect data, systems and networks |
| • |
| Managed services to do more with less and to increase agility to respond to market changes |
We innovate.
We respond to these priorities with tangible innovation and cost-effective, mission-critical operational support system/business support system (OSS/BSS) solutions to help communications service providers (CSPs) transform to new business models, develop new revenue streams and accelerate time to market. Our clients include traditional and cable CSPs, network equipment providers, and media and content providers that support the wireless, wireline, Internet and entertainment (IPTV) segments.
Telecom operations transformation: CGI helps
CSPs drive new revenue streams through high-value environments ranging from full IoT and mass data billing to digital commerce and customer care, enabling a seamless multi-channel customer experience.
Business optimization and cost reduction: Our order orchestration, billing, collections and testing services help CSPs drive greater operational ef?ciencies to accelerate time to market, enhance customer service effectiveness and reduce risks and costs.
Big data analytics: Our comprehensive data management solutions help CSPs leverage customer analytics to support marketing and sales strategies and improve the customer experience.
Cybersecurity: We help clients manage complex security needs, from audit and compliance to policy and architecture, with a business-focused approach. Managed services: CGI helps CSPs reduce their cost of delivery and speed time to market with high-quality application, infrastructure and business process services supported by our global delivery network.
16

CGI – 2014 ANNUAL REVIEW
COMMUNICATIONS
We deliver.
CGI partners with CSPs in all phases of their transformation programs, from de?nition to delivery. Here are representative examples of how we help our clients.
7 million+ active machine-to-machine devices are supported by CGI globally. CGI has supported the billing, order orchestration, revenue assurance or customer care transformation for six of the world’s largest CSPs.
30 million business messages per day pass through a business-critical enterprise service bus CGI has helped TeliaSonera develop. 25 million+ numbers have been ported by CGI for leading CSPs.
cgi.com/communications
“Bell and CGI are both leading Canadian companies focused on technological investment and innovation that delivers clear bene?ts for our customers. The recent renewal of our IT agreements with CGI to 2026 extends a collaboration of more than 15 years between our two Montréal-based companies to enhance the Bell customer experience while maximizing our operational ef?ciency.”
Michael Cole
Chief Information Of?cer BCE and Bell Canada Toronto, Canada
17
53 million
gas and electricity smart meters will be deployed across the UK between 2015 and 2020, and CGI is responsible for designing, building, hosting and running the data services enabling the rollout.
We listen.
As part of our 2014 annual strategic planning process, we conducted face-to-face interviews with utilities clients in 14 countries. The following were identi?ed as their common priorities:
| • |
| Evolution of business and IT operational models to drive ?exibility and cost savings |
| • |
| Digital, mobile and smart technologies to transform operations and the customer experience |
| • |
| Convergence of operational and information technologies to gain greater visibility and control |
| • |
| Enhanced systems for enterprise asset management, enterprise resource planning, customer service, billing, regulatory compliance and other core operations |
We innovate.
We focus on tangible innovation, mission-critical services and solutions, and best-?t global delivery options to help our utilities clients succeed.
Optimized network utility: CGI has developed a comprehensive vision for the optimized network utility—one that addresses changing industry paradigms—and is implementing that vision for clients through advanced transformation strategies, roadmaps and technologies.
Central energy markets: CGI has been at the forefront of developing market infrastructures for more than two decades.
Smart technologies: Recognized as a leader for smart grids, CGI is involved with high-pro?le smart grid projects such as Low Carbon London (UK) and supports smart metering for multiple utilities in the UK.
Network operations: We deliver a broad range of advanced network operations solutions, including our industry-leading PragmaLINE outage management system and mobile-based PragmaCAD workforce management solution.
Enterprise asset management (EAM):
As a founding member of the Institute of Asset Management, we contribute to the development of international EAM standards, including the new ISO 55000 series.
Production/generation: CGI developed an award-winning Renewables Management System for Energias de Portugal Renewables (EDPR) that controls more than 6,000 turbines on nearly 300 windfarms in 9 countries.
18

CGI – 2014 ANNUAL REVIEW
UTILITIES
We deliver.
We partner with 250 electric, gas and water clients across the Americas, Europe and Asia Paci?c to deliver service excellence, value and results.
We deliver asset, workforce and outage management systems for 60 of the top 100 utilities in North America. CGI has implemented SAP customer care and services projects for large utilities in Brazil, Portugal, Belgium and Germany.
CGI built and implemented 11 of the 17 central market energy clearing houses in the world today.
cgi.com/utilities
One of the keys to success of this project was the full involvement of the project team. In addition, the company was able at the appropriate moment to allocate all the necessary resources for each stage of the project. It should also be noted that the close working relationship that existed with CGI allowed all obstacles to be overcome along the way. CGI, a partner of EDP for many years, has considerable experience in outage management systems, and this was also a factor that allowed this highly complex project to be completed within the expected timeframe and to a high standard.
Ferreira Pinto
Managing Director, Operations EDP Distribution Lisbon, Portugal
19

CGI – 2014 ANNUAL REVIEW
IT MODERNIZATION
20
IT modernization is a top priority for our clients based on our 2014 client interviews. As clients adapt for the digital world, they are examining their legacy investments to ?nd enablers for cost savings and agility. They are also under tremendous pressure to improve the quality and ef?ciency of their IT environments.
Enabling business agility
Because each client has unique business drivers, technology needs and resources, CGI offers a wide range of modernization approaches, from point solutions to end-to-end services. We help clients develop clear roadmaps for transforming their business processes, applications and infrastructures.
| • |
| Business processes: We go beyond infrastructure and application modernization to transform the business processes supported by these systems. Strong industry expertise combined with high-quality process execution and leading-edge process automation help our clients reduce operating costs, deliver new services quickly, improve customer satisfaction and place greater focus on core business activities. |
| • |
| Applications: We help clients reduce high maintenance costs for mission-critical legacy applications by providing ?exible and proven approaches for rationalizing, consolidating and modernizing those applications. This includes our comprehensive framework for managing and transforming application portfolios. |
| • |
| Infrastructures: Using our analytics-based approach, we provide actionable information and expert guidance for reducing client data center footprints and refreshing their IT environments, all while maximizing the use of existing investments. Our virtualization, cloud and legacy migration services help clients transform infrastructures faster and with less risk and cost. |
| • |
| Delivery management toolset, delivery centers of excellence and a best-?t global delivery model |
| • |
| Infrastructure services centers located in 13 countries across the Americas, Europe and Asia Paci?c |
| • |
| Maximum score on “service execution and delivery excellence” in Forrester’s Wave™ reports on North American and EMEA application services for 2014 |
| • |
| Comprehensive cloud brokerage services—from strategic consulting to technology implementation to ongoing management—that transform cloud service procurement and delivery |
APG and CGI partner to achieve greater agility and cost savings
CGI has a long and successful partnership with APG, the largest Dutch pension fund manager, in delivering IT services and projects, including IT modernization. One such project involved the migration of a mission-critical APG mainframe system to an open Unix environment. CGI’s innovative mainframe modernization approach enabled the migration to be completed in a short timeframe—eight months—without disrupting any of the affected applications. APG never missed a pension payment during the migration and has realized targeted cost savings. The migration’s success led APG and CGI to jointly receive a 2013 Computable Award for best ICT business project. With this success, APG selected CGI for strategic application services in December 2013. Together, APG and CGI are driving various transformation projects, including pension management and insurance, as well as the company’s shared services center.
CGI has extensive IT experience in the areas of pensions and insurance and has helped us in the IT ?eld in recent years to achieve good results. They helped us successfully migrate our Gross Net Distribution System as an outsourced mainframe to a Unix environment within the organization. This work received a Computable Award. We look forward to continuing to build our long-standing relationship.
Mark Boerekamp Chief Operations Of?cer APG
Amsterdam, Netherlands
21

95%
of all UK oil and gas offshore personnel movements are tracked by
VantagePoB, a widely used health, safety and environmental (HSE) workforce management solution developed by CGI.
We listen.
As part of our 2014 annual strategic planning process, we conducted face-to-face interviews with oil and gas clients in numerous countries. The following were identi?ed as their common priorities:
| • |
| Increased cybersecurity across the value chain to minimize risks, improve safety and prevent fraud |
| • |
| Real-time data analytics to improve productivity, asset management and customer focus |
| • |
| Better regulatory compliance tools to address the complexity and cost of compliance |
| • |
| Enhanced customer experience to drive customer loyalty and market expansion |
| • |
| Modernized systems to address exploration and production complexities, improve time to market and drive innovation |
We innovate.
We help drive our clients’ growth and success through tangible innovation, mission-critical services and solutions, and best-?t global delivery options. Cybersecurity: CGI’s unique SECURE-ICS approach improves the cyber resilience of industrial control systems (ICS), enabling oil and gas companies to secure their digital oil ?elds and production and storage activities.
Big data analytics: We use sophisticated data modeling and visualization solutions to reduce exploration costs and speed up “time to first oil” and also integrate systems and data to create a single view of operations and information.
Regulatory compliance: Embedded within every CGI service and solution are robust regulatory compliance features that ensure timely and consistent compliance with new and evolving regulations.
Customer experience: We provide systems that support the entire card payment lifecycle and results-driven loyalty programs, and offer mobile payment solutions and the mining of payment transaction data to segment offers by market and targets.
Application modernization: We modernize back-of?ce systems and enable the fast adoption of smart, cloud, mobile and other ef?ciency and pro?t-driving technologies for rapid and standardized deployment in proven and emerging markets.
22
CGI – 2014 ANNUAL REVIEW
OIL AND GAS
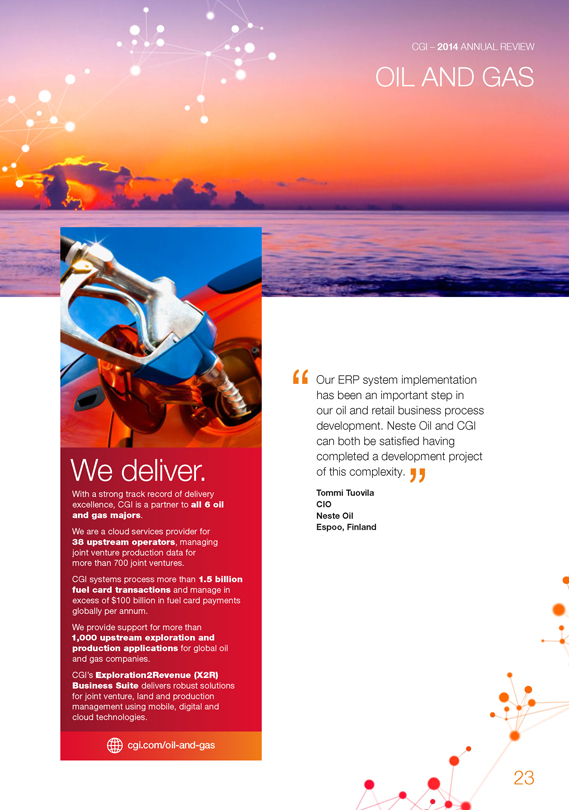
We deliver.
With a strong track record of delivery excellence, CGI is a partner to all 6 oil and gas majors.
We are a cloud services provider for
38 upstream operators, managing joint venture production data for more than 700 joint ventures.
CGI systems process more than 1.5 billion fuel card transactions and manage in excess of $100 billion in fuel card payments globally per annum.
We provide support for more than
1,000 upstream exploration and production applications for global oil and gas companies.
CGI’s Exploration2Revenue (X2R) Business Suite delivers robust solutions for joint venture, land and production management using mobile, digital and cloud technologies.
cgi.com/oil-and-gas
Our ERP system implementation has been an important step in our oil and retail business process development. Neste Oil and CGI can both be satis?ed having completed a development project of this complexity.
Tommi Tuovila CIO
Neste Oil Espoo, Finland
23

CGI – 2014 ANNUAL REVIEW
MANUFACTURING
100,000+
users at Airbus Group across the globe are supported by CGI’s application management services.
We listen.
As part of our 2014 annual strategic planning process, we conducted face-to-face interviews with manufacturing clients in 9 countries. The following were identi?ed as their common priorities:
| • |
| Operational improvements to reduce costs, increase productivity and speed up time to market |
| • |
| Integration of enterprise systems to enable digital continuity across silos |
| • |
| Internet of Things (IoT) and mobility to drive smarter manufacturing |
| • |
| Master data management and big data analytics to improve data quality and usage |
| • |
| Rationalization, standardization and modernization of application portfolios |
| • |
| Agile infrastructures, including software as a service and other cloud models |
We innovate.
We respond to these priorities by helping clients optimize the supply chain, improve operations, reduce costs and increase agility and customer focus. We do this across mining, metals, pulp, paper and chemicals, and for aerospace, automotive, high tech, electronics and other industrial products.
Business process transformation: We help manufacturing clients drive down costs, gain ?exibility and become more demand driven, using technology and services that enable dynamic and collaborative value chains.
Supply chain acceleration: CGI’s extensive subject matter expertise, services and solutions help clients transform operations across the value chain in engineering, procurement, manufacturing, logistics, marketing, sales and services.
Manufacturing execution system (MES) excellence:
CGI provides end-to-end MES services that help clients with business strategy, technology selection and implementation, and lifetime management. We actively participate in the Manufacturing Enterprise Solutions Association (MESA) and serve as a board member. (Learn about our 15th annual MES product survey at cgi.com/MES.) Digital transformation: We use IoT, mobile and other advanced technologies to help clients transition to smart manufacturing, including automation, remote monitoring and real-time predictive maintenance.
Big data analytics and cybersecurity: CGI helps manufacturers promote secure data sharing and extract actionable insights from the large volumes of information contained in their processes, products and business systems.
24
We deliver.
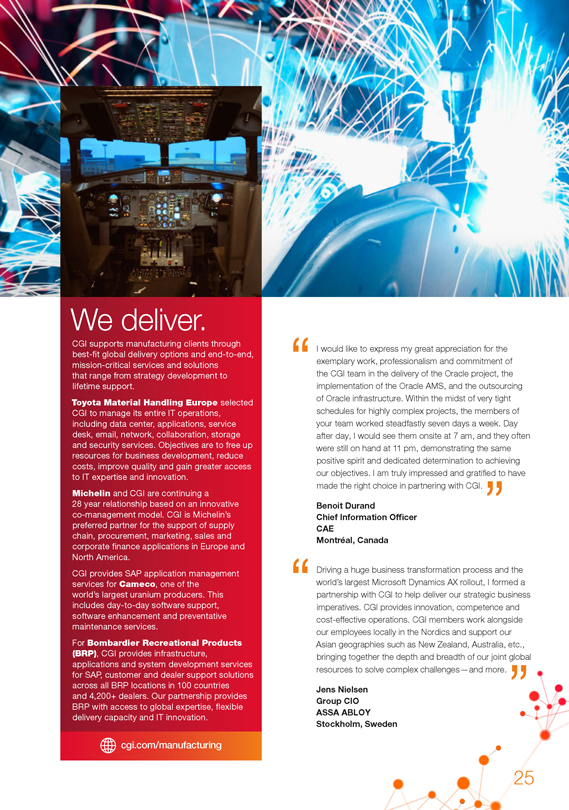
CGI supports manufacturing clients through best-?t global delivery options and end-to-end, mission-critical services and solutions that range from strategy development to lifetime support.
Toyota Material Handling Europe selected CGI to manage its entire IT operations, including data center, applications, service desk, email, network, collaboration, storage and security services. Objectives are to free up resources for business development, reduce costs, improve quality and gain greater access to IT expertise and innovation.
Michelin and CGI are continuing a 28 year relationship based on an innovative co-management model. CGI is Michelin’s preferred partner for the support of supply chain, procurement, marketing, sales and corporate finance applications in Europe and North America.
CGI provides SAP application management services for Cameco, one of the world’s largest uranium producers. This includes day-to-day software support, software enhancement and preventative maintenance services.
For Bombardier Recreational Products (BRP), CGI provides infrastructure, applications and system development services for SAP, customer and dealer support solutions across all BRP locations in 100 countries and 4,200+ dealers. Our partnership provides BRP with access to global expertise, ?exible delivery capacity and IT innovation.
cgi.com/manufacturing
I would like to express my great appreciation for the exemplary work, professionalism and commitment of the CGI team in the delivery of the Oracle project, the implementation of the Oracle AMS, and the outsourcing of Oracle infrastructure. Within the midst of very tight schedules for highly complex projects, the members of your team worked steadfastly seven days a week. Day after day, I would see them onsite at 7 am, and they often were still on hand at 11 pm, demonstrating the same positive spirit and dedicated determination to achieving our objectives. I am truly impressed and grati?ed to have made the right choice in partnering with CGI.
Benoit Durand
Chief Information Of?cer CAE
Montréal, Canada
Driving a huge business transformation process and the world’s largest Microsoft Dynamics AX rollout, I formed a partnership with CGI to help deliver our strategic business imperatives. CGI provides innovation, competence and cost-effective operations. CGI members work alongside our employees locally in the Nordics and support our Asian geographies such as New Zealand, Australia, etc., bringing together the depth and breadth of our joint global resources to solve complex challenges—and more.
Jens Nielsen Group CIO ASSA ABLOY Stockholm, Sweden
25

CGI – 2014 ANNUAL REVIEW
BIG DATA ANALYTICS
26

In 2014, we conducted 820 face-to-face client interviews and, no matter the industry and geography, clients told us that getting more value from their data is one of their chief business priorities.
Two primary reasons were cited: The ?rst is the need to ?nd and use valuable insights about their customers, citizens, employees and operations, and the second is the need to tame the costs and complexity of managing ever-growing volumes of data generated by our digital world.
Helping clients get more value from their data
CGI helps clients on both fronts with expertise, solutions and partnerships using our Data2Diamonds approach to simplifying data management and realizing value from analytics. This framework provides a blueprint for success in putting information to work. Our objectives are to:
| • |
| Shorten the “distance” between data assets and the people who need them |
| • |
| Discover insights into important behaviors of people and machines |
| • |
| Help clients use those insights to improve results |
Helping Vitens to better detect leakages
Guaranteeing the reliable supply of drinking water to 5.5 million customers in the Netherlands is the job of Vitens, the water supply company. Before ?owing out of a customer’s faucet, water is first purified at a production facility and then sent through kilometers of pipe. With big data and predictive analytics, CGI has helped Vitens detect leaks in these pipes sooner and with fewer dif?culties.
Supporting health data accuracy, reliability and privacy for Alberta citizens
For Alberta Health, the ministry responsible for setting policy, legislation and standards for the province’s health system, CGI supports more than 100 clinical and administrative applications. CGI’s business intelligence services for Alberta Health help ensure reliable and accurate data for use by health system stakeholders and data privacy for Albertans.
Helping Alaska’s State Government make faster, better decisions
For the State of Alaska, a CGI-developed statewide data warehouse and business intelligence system puts reporting in the hands of business users for ?nancial, human resources and payroll information. Accessed by 1,200 government employees, the system has reduced report wait times from months to minutes, providing both current and historical data to support smarter decisions on investments that matter to Alaskans.
27
CGI – 2014 ANNUAL REVIEW
TRANSPORTATION
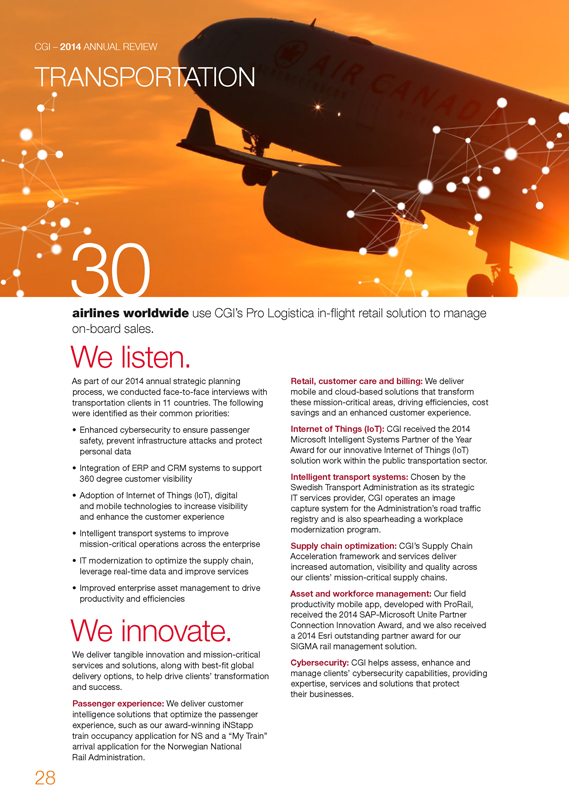
30
airlines worldwide use CGI’s Pro Logistica in-flight retail solution to manage on-board sales.
We listen.
As part of our 2014 annual strategic planning process, we conducted face-to-face interviews with transportation clients in 11 countries. The following were identi?ed as their common priorities:
| • |
| Enhanced cybersecurity to ensure passenger safety, prevent infrastructure attacks and protect personal data |
| • |
| Integration of ERP and CRM systems to support 360 degree customer visibility |
| • |
| Adoption of Internet of Things (loT), digital and mobile technologies to increase visibility and enhance the customer experience |
| • |
| Intelligent transport systems to improve mission-critical operations across the enterprise |
| • |
| IT modernization to optimize the supply chain, leverage real-time data and improve services |
| • |
| Improved enterprise asset management to drive productivity and ef?ciencies |
We innovate.
We deliver tangible innovation and mission-critical services and solutions, along with best-?t global delivery options, to help drive clients’ transformation and success.
Passenger experience: We deliver customer intelligence solutions that optimize the passenger experience, such as our award-winning iNStapp train occupancy application for NS and a “My Train” arrival application for the Norwegian National Rail Administration.
Retail, customer care and billing: We deliver mobile and cloud-based solutions that transform these mission-critical areas, driving ef?ciencies, cost savings and an enhanced customer experience.
Internet of Things (IoT): CGI received the 2014
Microsoft Intelligent Systems Partner of the Year Award for our innovative Internet of Things (IoT) solution work within the public transportation sector.
Intelligent transport systems: Chosen by the
Swedish Transport Administration as its strategic IT services provider, CGI operates an image capture system for the Administration’s road traffic registry and is also spearheading a workplace modernization program.
Supply chain optimization: CGI’s Supply Chain
Acceleration framework and services deliver increased automation, visibility and quality across our clients’ mission-critical supply chains.
Asset and workforce management: Our ?eld productivity mobile app, developed with ProRail, received the 2014 SAP-Microsoft Unite Partner Connection Innovation Award, and we also received a 2014 Esri outstanding partner award for our SIGMA rail management solution.
Cybersecurity: CGI helps assess, enhance and manage clients’ cybersecurity capabilities, providing expertise, services and solutions that protect their businesses.
28

We deliver.
We work with 140 clients in the aviation, rail, and road and regional transit sectors.
CGI’s smart data solution for the bus system in Helsinki, Finland captures and analyzes fuel consumption and driver performance data, enabling the city to reduce fuel costs, improve safety and enhance the customer experience.
Used by 3 of the 8 national road tolling schemes in Europe, CGI’s
Traf?c360 service combines automated and manual processes to capture data from millions of license plate numbers, ensuring 100% data reliability for road toll operators. CGI’s GO solution is a fully integrated airport management solution that covers all processes—from arrival to departure—and is used by 10 airports in the Portuguese ANA Group.
CGI-developed systems have supported the City of New York since 1987, collecting $11+ billion for a variety of parking-related violations.
cgi.com/transportation
CGI’s back-office system first installed in 2006 is still enabling us to deliver an easy-to-administer, national, concessionary travel scheme that brings enormous benefits to all concerned: the people of Scotland, the Scottish Government and all of the transport operators involved. In particular, the system has played a key part in helping us operate an effective fraud strategy, resulting in substantial savings to the public purse.
Gordon Hanning
Head of Concession Travel and Integrated Ticketing Transport Scotland Glasgow, United Kingdom
29
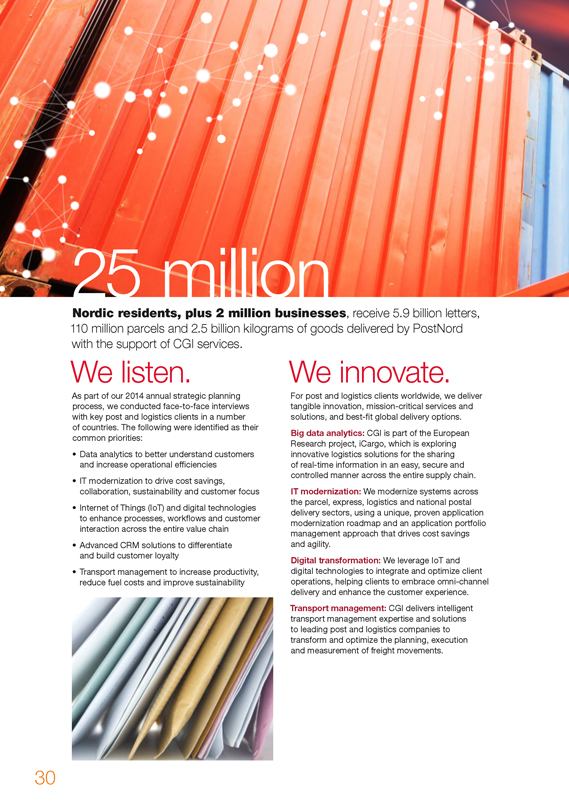
25 million
Nordic residents, plus 2 million businesses, receive 5.9 billion letters,
110 million parcels and 2.5 billion kilograms of goods delivered by PostNord with the support of CGI services.
We listen.
As part of our 2014 annual strategic planning process, we conducted face-to-face interviews with key post and logistics clients in a number of countries. The following were identi?ed as their common priorities:
| • |
| Data analytics to better understand customers and increase operational ef?ciencies |
| • |
| IT modernization to drive cost savings, collaboration, sustainability and customer focus |
| • |
| Internet of Things (IoT) and digital technologies to enhance processes, work?ows and customer interaction across the entire value chain |
| • |
| Advanced CRM solutions to differentiate and build customer loyalty |
| • |
| Transport management to increase productivity, reduce fuel costs and improve sustainability |
We innovate.
For post and logistics clients worldwide, we deliver tangible innovation, mission-critical services and solutions, and best-?t global delivery options. Big data analytics: CGI is part of the European Research project, iCargo, which is exploring innovative logistics solutions for the sharing of real-time information in an easy, secure and controlled manner across the entire supply chain. IT modernization: We modernize systems across the parcel, express, logistics and national postal delivery sectors, using a unique, proven application modernization roadmap and an application portfolio management approach that drives cost savings and agility.
Digital transformation: We leverage IoT and digital technologies to integrate and optimize client operations, helping clients to embrace omni-channel delivery and enhance the customer experience. Transport management: CGI delivers intelligent transport management expertise and solutions to leading post and logistics companies to transform and optimize the planning, execution and measurement of freight movements.
30

CGI – 2014 ANNUAL REVIEW
POST AND LOGISTICS
We deliver.
We have decades of experience in delivering results to post and logistics clients across the globe.
Point of sale (POS) solutions implemented by CGI for Itella in Finland are used in 500 postal service outlets and by 1,500 users across the country; and through CGI’s process automation, Itella now receives more than 5 million electronic acknowledgements within its service outlet network every year. CGI’s River Information Services (RIS) solution for Schelderadarketen (SRK) harmonizes and enriches data, enabling interoperability between SRK applications and various partner systems and improving the safety, effectiveness and environmental friendliness of inland waterway freight movement.
CGI’s IT4CARGO TARIC service helps clients such as Nurminen Logistics use the correct codes in custom declarations to ensure proper duty and tax payments. CGI is delivering an innovative business intelligence approach with state-of-the-art technologies and a CO2 optimized infrastructure in partnership with the
Deutsche Bahn Group.
cgi.com/post-and-logistics
With this new system, developed and deployed by CGI, we are able to manage the Posti’s service outlet network in a chainlike manner. The new system integrates many of our core business functions, and we are therefore able to handle the constant growth of parcel traffic.
Jukka Rosenberg
Mail Communications Director Itella Helsinki, Finland
31
CGI – 2014 ANNUAL REVIEW
RETAIL AND
CONSUMER SERVICES
3 million
lines of orders are successfully delivered every day to 5,000 Carrefour stores in France through systems supported by CGI, enabling Carrefour to consistently meet its customers’ expectations and needs.
We listen.
As part of our 2014 annual strategic planning process, we conducted face-to-face interviews with retail and consumer services clients in 10 countries. The following were identi?ed as their common priorities:
Omni-channel delivery to create a seamless customer experience
Mobile solutions to enable customers to shop anytime, anywhere
Behavioral insight to better understand past behaviors, predict future buying patterns and meet high customer expectations
Supply chain optimization to increase ?exibility to support and further enable customer-centric operations
We innovate.
We work with leading brands worldwide to deliver tangible innovation, mission-critical services and solutions, and best-?t global delivery options. Omni-channel delivery: CGI builds, integrates, supports and maintains digital, mobile, e-commerce and in-store channels, creating a seamless customer experience, providing customers the ability to shop anywhere, anytime, and improving customer loyalty and retention.
Customer-facing mobility: Through our end-to-end enterprise mobility solutions, CGI develops, implements, manages and evolves mobile strategies, platforms and application suites for our clients.
Behavioral insight: CGI leverages the latest techniques and technologies, such as advanced data analytics for digital, mobile and in-store channels, helping our clients harness, analyze and transform data into valuable insight to gain a better understanding of customer behavior and develop new channels, services and products.
Supply chain optimization: CGI’s Supply Chain
Acceleration portfolio optimizes the entire value chain from end to end and reduces total cost of delivery through a broad range of business and IT services that enable a seamless customer experience in an omni-channel environment.
32
We deliver.
We offer a broad range of services and solutions that are delivering results to major retailers and consumer services companies across the globe.
CGI delivers all in-store IT services to more than 530 Reitan Convenience stores, which include the 7-Eleven and Narvesen brands in Norway.
Through Apple’s iBeacon open standard, CGI developed a mobile app for Liseberg, the largest amusement park in Sweden. With such features as a map of attractions, information on queue times, the ability to position friends and family, and integration with social media, the app has been downloaded more than 300,000 times and has distinguished Liseberg from its competitors by being the ?rst to leverage the iBeacon technology.
CGI has helped the Auchan Group better understand changes in consumer behavior within the digital journey through the development and implementation of omni-commerce solutions such as “click and collect.” CGI and ADEO, the world’s third largest DIY retailer, are collaborating to implement a corporate community platform aimed at connecting ADEO’s 90,000 employees. After a pilot period that connected 24,000 employees across 4 business units, this innovative solution is ready to be implemented across ADEO’s 27 companies.
cgi.com/retail
Over the past few years, CGI has become a key partner we rely on to implement Carrefour’s multi-format and multi-local strategy in France. Our ambition is to enable our stores to even better satisfy our local customers every day. CGI is helping us to simplify our processes and strengthen our core back-office systems to deliver on our promises across all types of stores and channels. Our great cultural fit with CGI, shared professionalism, and mutual commitment to our clients is driving this successful collaboration.
Hervé Thoumyre Group & France CIO Carrefour Paris, France
33

CGI – 2014 ANNUAL REVIEW
CYBERSECURITY
34
Across industries and geographies, protecting data and critical infrastructure from cyber attacks was identi?ed as a top priority in our face-to-face client interviews in 2014.
The digital transformation of our interconnected economies has created new vulnerabilities to be identi?ed and protected as cyber crimes become more sophisticated and prevalent.
As a result, our clients are rethinking their cybersecurity postures in the context of broader risk management strategies. In the private sector, missteps can mean ?nancial loss and reputational damage. In government, no margin of error in public safety is acceptable.
Security is part of everything we do for our clients.
At CGI, our business-focused approach provides the insight, foresight and advanced threat capabilities to protect against cyber attacks and take decisive action when they occur. Our full life cycle cybersecurity services help clients assess the risk, protect the business and operate with con?dence.
9,000+ biometrics systems and devices
have been deployed and supported for the U.S. military.
10 Security Operations Centers
continuously identify and monitor cyber threats and 3 accredited security certi?cation facilities provide extensive assessment services.
20–40% cost savings
are achieved by clients that rely on CGI managed security services provided by local cyber teams, backed by our 1,400 cyber experts globally.
Reducing cyber risks for our clients
In 2014, we continued to see momentum and activity to further help our clients safeguard their businesses. Here are representative headlines from the year:
| • |
| CGI’s new UK security facilities to deliver protective monitoring and cyber threat analysis services |
| • |
| CGI and Aon partner to provide cyber insurance risk assessment services for Finnish companies |
| • |
| Volvo Car Group selects CGI for security services |
| • |
| CGI awarded DISA Operational Security certi?cation for defense cloud services |
Certi?ed, secure cloud services
CGI was the ?rst large cloud provider to receive the U.S. Federal Risk and Authorization Management Program (FedRAMPSM) cloud security certi?cation, and one of the first to receive the Defense Information Systems Agency’s (DISA) cloud security accreditation. CGI also offers secure cloud services through the UK’s G-Cloud initiative, which helps public bodies quickly and simply select proven and ?exible cloud-based IT services.
35

CGI – 2014 ANNUAL REVIEW
CGI SOLUTIONS
Our full-service offering includes a large portfolio of CGI-developed solutions. These software applications, reusable frameworks and delivery methods represent years of investment in capturing our industry and technology expertise. Whether deploying our own solutions or solutions that combine CGI and partner capabilities, CGI exemplifies know-how in the design, implementation and management of the solutions that power our clients’ businesses.
36
Powering clients’ businesses with purpose-built solutions
We have developed mission-critical solutions and frameworks for all of the industries we serve and to support clients’ cross-industry functions. As part of the face-to-face interviews we conducted with our clients, many of our solutions were cited as being in top demand for supporting key functions, including:
Credit, payment and trade
Cybersecurity, identity and access management, including biometrics
Government enterprise resource planning and collections
Electronic records, patient-care management and pathology
Asset and workforce management
Smart metering
Supply chain acceleration
Intelligent transport systems
Oil and gas lifecycle management
Solution recognition
CGI solutions received distinguished recognition during 2014 by industry bodies and technology partners, including:
Alliander and CGI received the ICT Milieu Award 2014 for their Open Smart Grid Platform.
ProRail and CGI received the 2014 SAP-Microsoft Unite Partner Connection Innovation Award for a mobile solution that improves ?eld worker productivity.
CGI received the 2014 Microsoft Intelligent Systems Partner of the Year Award for our innovative Internet of Things (IoT) solution that delivers signi?cant client bene?ts.
CGI was awarded the 2014 Esri outstanding partner award for our SIGMA rail management solution.
CGI was named as a leader in the IDC MarketScape: Worldwide IT Professional Services for Utility Smart Grid 2014 Vendor Assessment.
CGI received the 2014 Center for Digital Government “Best Fit Integrator” Performance and Modernization Award for our work on the California Franchise Tax Board’s Enterprise Data to Revenue program.
eVA (Virginia’s electronic purchasing solution), developed in partnership with CGI, was named as part of the 2014 Supply & Demand Chain Executive 100.
CGI HotScan for Watchlist Filtering has been awarded the SWIFT Alliance Add-on Label every year since 2005.
Solution spotlights
CGI Trade360
Powering a bank’s global trade business
CGI Trade360 is a global SaaS platform for running banks’ trade and open account business. It enables banks to provide a global standard of service, bring products to market quickly and improve customer interactions. It also helps them mitigate risk and reduce total cost of ownership with CGI providing all software, infrastructure and support. The solution currently supports bank trade services for more than 30,000 portal users in 80 countries across Asia, Europe, North America and Oceania.
Learn more at cgi.com/CGITrade360.
Sm@rtering
Delivering advanced meter infrastructure management
CGI offers Sm@rtering, a comprehensive meter data management platform, to help utilities benefit from the advantages of smart meters, including improved efficiencies and customer service. Sm@rtering’s robust capabilities support data collection, meter and energy data management, meter infrastructure supervision and smart grid management. Built on a ?exible, service-oriented architecture, Sm@rtering is a web-based, user-friendly platform. All operations can be performed through graphical user or machine-to-machine interfaces that are easy to implement and navigate.
Learn more at cgi.com/smartering.
To view our extensive portfolio of CGI solutions, go to cgi.com/solutions.
37
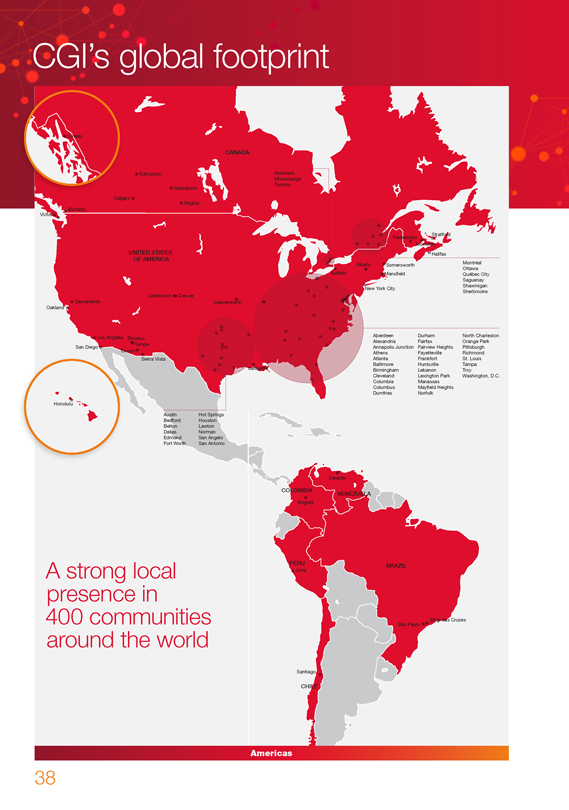
CGI’s global footprint
Juneau
CANADA
Edmonton Markham Mississauga Toronto Saskatoon Calgary Regina Burnaby Victoria
Stratford Fredericton Moncton
UNITED STATES Halifax OF AMERICA
Albany Montréal Somersworth Buffalo Ottawa Mansfield Québec City Saguenay Shawinigan New York City Sherbrooke Lakewood Denver Sacramento Leavenworth Oakland
Los Angeles Aberdeen Durham North Charleston Phoenix Alexandria Fairfax Orange Park Tempe San Diego Annapolis Junction Fairview Heights Pittsburgh Tucson Athens Fayetteville Richmond Sierra Vista Atlanta Frankfort St. Louis Baltimore Huntsville Tampa Lafayette Birmingham Lebanon Troy Cleveland Lexington Park Washington, D.C.
Columbia Manassas Columbus Mayfield Heights Dumfries Norfolk
Honolulu
Austin Hot Springs Bedford Houston Belton Lawton Dallas Norman Edmond San Angelo Fort Worth San Antonio
Caracas
COLOMBIA
VENEZUELA
Bogotá
PERU BRAZIL
A strong local Lima presence in
400 communities São Paulo Mogi das Cruzes
around the world
Santiago
CHILE
Americas
38
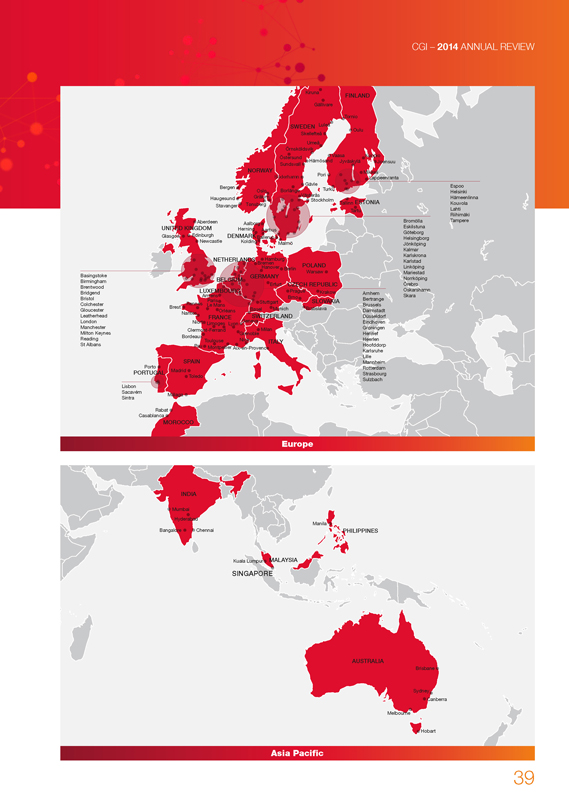
CGI – 2014 ANNUAL REVIEW
Kiruna
FINLAND
Gällivare
Tornio
SWEDEN Luleå
Oulu Skellefteå Umeå Örnsköldsvik Östersund Vaasa Kuopio Härnösand Jyväskylä Joensuu Sundsvall NORWAY Mikkeli
Söderhamn Pori
Lappeenranta
Gävle Espoo Bergen Turku Oslo Borlänge Västerås Helsinki Haugesund Grålum Hämeenlinna Stockholm ESTONIA
Tønsberg Tallinn Kouvola Stavanger Tartu Lahti Riihimäki Aberdeen Bromölla Tampere Aalborg UNITED KINGDOM Herning Eskilstuna Aarhus Göteborg Glasgow Edinburgh DENMARKBallerup Helsingborg Newcastle Kolding Malmö Jönköping Kalmar Karlskrona NETHERLANDS Hamburg Karlstad Bremen POLAND
Hanover Berlin Warsaw Linköping Mariestad Basingstoke GERMANY
BELGIUM Norrköping Birmingham Erfurt CZECH REPUBLIC Örebro Brentwood LUXEMBOURG Prague Krakow Oskarshamn Bridgend Arnhem Amiens Brno Skara Bristol Paris SLOVAKIA Bertrange Rennes Stuttgart Colchester Le Mans Brussels Brest Basel Munich Bratislava Gloucester Orléans Darmstadt Nantes Leatherhead FRANCE SWITZERLAND Düsseldorf London Niort Geneva Eindhoven Limoges Lyon Manchester Milan Groningen Clermont-Ferrand Milton Keynes Grenoble Hennef Bordeaux Reading Toulouse Nice Heerlen
ITALY
St Albans Pau Hoofddorp Montpellier Aix-en-Provence Karlsruhe
SPAIN Lille Porto Mannheim Rotterdam
PORTUGAL Madrid
Strasbourg Toledo Sulzbach Lisbon Sacavém Málaga Sintra
Rabat Casablanca
MOROCCO
Europe
INDIA
Mumbai
Hyderabad Manila
Bangalore Chennai PHILIPPINES
Kuala Lumpur MALAYSIA
SINGAPORE
AUSTRALIA
Brisbane
Sydney Canberra
Melbourne
Hobart
Asia Paci?c
39
CGI’s leadership team
CGI’s management team includes seasoned experts within the IT services industry who develop strategies to satisfy the needs of our three stakeholders – clients, members and shareholders – and work to ensure all stakeholders’ success.
Corporate services
Serge Godin
Founder and Executive Chairman of the Board
Michael E. Roach
President and Chief Executive Of?cer
François Boulanger
Executive VP and Chief Financial Of?cer
Benoit Dubé
Executive VP and Chief Legal Of?cer
Julie Godin
Executive VP, Global Human Resources and Strategic Planning
Global operations
ASIA PACIFIC AND MIDDLE EAST
Colin Holgate
President
Mark Aston
South East Asia
Scott Ayer
Australia
David Butcher
Middle East
S. Chandramouli
India
CANADA
Claude Marcoux
Chief Operating Of?cer
Réjean Bernard
Global Infrastructure Services
Alain Bouchard
Québec City
Shawn Derby
Western Canada
Michael Godin
National Capital Region
Roy Hudson
Communications Services Business
Marie MacDonald
Greater Toronto
Jay Maclsaac
Atlantic Canada
Guy Vigeant
Greater Montréal
CENTRAL AND EASTERN EUROPE
Serge Dubrana
President
Sake Algra
Netherlands
Dariusz Gorzen
Poland
Torsten Strass
Germany and Switzerland
Stefan Szabó
Czech Republic and Slovakia
Hans Vets
Belgium
FRANCE
Jean-Michel Baticle
President
Philippe Bouron
Business Consulting
Fabien Debû
Grand East
Stéphane Jaubert
CPG Retail and North
David Kirchhoffer
Financial Services
Mohamed Lakhli?
Morocco
Gilles Le Franc
Grand West
Michel Malhomme
Global Delivery Center
Pierre-Dominique Martin
Public Sector / HR / Transportation
Sassan Mohseni
Energy and Utilities /
Telecommunications and Media
Hervé Vincent
Manufacturing
40
CGI – 2014 ANNUAL REVIEW
Lorne Gorber Eva Maglis Doug McCuaig Luc Pinard Claude Séguin
Senior VP, Global Executive VP, Global Chief Executive VP, Global Client Executive VP, Senior VP, Corporate
Communications and Information Of?cer Transformation Services Corporate Performance Development and
Investor Relations Strategic Investments
NORDICS,
SOUTHERN EUROPE AND SOUTH AMERICA
João Baptista
President
Pär Fors
Sweden
José Carlos Gonçalves
Southern Europe
Edson Leite
South America
Heikki Nikku
Finland and Estonia
Martin Petersen
Denmark
Olav Sandbakken
Norway
UNITED KINGDOM
Timothy Gregory
President
David Fitzpatrick
Global Infrastructure Services
Tara McGeehan
Energy and Utilities
Steve Smart
Space, Defence and National Security
Steve Thorn
Public Sector
Mike Whitchurch
Commercial Sector
UNITED STATES
George Schindler
President
Mark Boyajian
Mid-Atlantic
Dave Delgado
West
Ned Hammond
Global Infrastructure Services
Dave Henderson
Central-South
Christopher James
Business Solutions and Onshore Delivery
Steven Starace
Northeast
Dr. James Peake
President, CGI Federal
Patrick Dougherty
Army and Defense Intelligence Programs
Sandra Gillespie
Health and
Compliance Programs
Tim Hurlebaus
National Security and Defense Programs
Tom Kirk
Government Secure Solutions, CGI Inc.
Toni Townes-Whitley
Chief Operating Of?cer and Civilian Agency Programs
SERVICES TO SHELL
Ron de Mos
Senior VP
41

CGI – 2014 ANNUAL REVIEW
Corporate social responsibility (CSR)
Building a sustainable future together
CSR represents a key aspect of our business model, which is designed to bring us closer to our members, clients, shareholders and communities. It is also one of our six core values, guiding us as we strive daily to operate as a strong, productive and sustainable company that bene?ts society as a whole.
Our commitments
To provide our professionals with health, wellness and ownership programs that positively in?uence their well-being and satisfaction
To partner with our clients to deliver energy and environmental sustainability solutions and to collectively support charitable causes
To support our communities through causes that improve their social, economic and environmental well-being
To improve the environment through environmentally friendly operating practices, community service activities and green IT offerings
To operate ethically through a strong code of ethics and good corporate governance Learn more about these commitments and examples of how we ful?ll them at cgi.com/CSR.
In 2014, CGI invested in numerous initiatives to further our CSR commitments. Highlights include:
Launch of the Innovation, Creativity and Experimentation (ICE) program that harnesses, evaluates and funds new ideas that bring the greatest bene?ts to our stakeholders (Read more at cgi.com/ICE.)
Expansion of our global delivery network with the announcement of 3 new centers that will create 1,300 high-quality jobs and will join some 30 centers of excellence around the globe that contribute to the economic development of our communities
Global rollout of CGI’s Member Assistance Program that provides a wide range of free and confidential support services to members to support their professional and personal lives
Expanded coverage of our ISO 14001 environmental management certi?cation in Europe with certi?cation now including our 21 of?ces in France
Continued focus on partnering with clients and other community stakeholders to contribute to community development (Read more at cgi.com/community-stories.)
42
The CGI Constitution
While most companies have a vision and mission, CGI goes a step beyond. We have a company dream, which emphasizes the enjoyment and ownership principles essential to our success. The CGI dream, together with our vision, mission and values, make up the CGI Constitution. With frameworks and programs founded upon this Constitution, CGI’s professionals have the opportunity to participate in the life and development of their company, which, in turn, results in client loyalty and shareholder growth.
Our dream
To create an environment in which we enjoy working together and, as owners, contribute to building a company we can be proud of.
Our vision
To be a global world class information technology and business process services leader helping our clients succeed.
Our mission
To help our clients succeed through outstanding quality, competence and objectivity, providing thought leadership and delivering the best services and solutions to fully satisfy client objectives in information technology, business processes and management. In all we do, we foster a culture of partnership, intrapreneurship, teamwork and integrity, building a global world class information technology and business process services company.
Our values
PARTNERSHIP AND QUALITY
For us, partnership and quality are both a philosophy and a way of life. We constantly deepen our understanding of our clients’ business and we develop and follow the best management practices. We entrench these approaches into client relationship and service delivery frameworks in order to foster long term and strong partnerships with our clients. We listen to our clients and we are committed to their total satisfaction in everything we do.
OBJECTIVITY AND INTEGRITY
We exercise the highest degree of independent thinking in selecting the products, services and solutions we recommend to clients. In doing so, we adhere to the highest values of quality, objectivity and integrity. We do not accept any remuneration from suppliers. We always act honestly and ethically. We never seek to gain undue advantages and we avoid con?icts of interest, whether real or perceived.
INTRAPRENEURSHIP AND SHARING
Our collective success is based on our competence, commitment and enthusiasm. We promote a culture of innovation and initiative where we are empowered with a sense of ownership in supporting clients, thus ensuring our pro?table growth. Through teamwork, sharing our know-how and expertise across our global operations, we bring the best of CGI to our clients. As members, we share in the value we create through equity ownership and pro?t participation.
RESPECT
In all we do, we are respectful of our fellow members, clients, business partners and competitors. As a global company, we recognize the richness that diversity brings to the company and welcome this diversity while embracing the overall CGI business culture.
FINANCIAL STRENGTH
We strive to deliver strong, consistent ?nancial performance which sustains long term growth and bene?ts both members and shareholders. Financial strength enables us to continuously invest in our members’ capabilities, our services and our business solutions to the bene?t of our clients. To this end, we manage our business to generate industry superior returns.
CORPORATE SOCIAL RESPONSIBILITY
Our business model is designed to ensure that we are close to our clients and communities. As members, we embrace our social responsibilities and contribute to the continuous development of the communities in which we live and work.
43
Founded in 1976, CGI is a global IT and business process services provider delivering high-quality business consulting, systems integration and managed services. With 68,000 professionals in 40 countries, CGI has an industry-leading track record of delivering 95% of projects on time and within budget, aligning our teams with clients’ business strategies to achieve top-to-bottom line results.
cgi.com
© 2014 CGI Group Inc.
CGI Advantage, CGI CommunityCare360, CGI Trade360, Data2Diamonds, Experience the commitment,
Exploration2Revenue, HotScan, IT4CARGO, Pragma, Pro Logistica, Ratabase and Sovera are trademarks or registered trademarks of CGI Group Inc. or its related companies.
CGI Group Inc.
2014 Annual Report
CGI’s 2014 Annual Report is comprised
of two separate volumes:
Volume 1:2014Annual Review
&
Volume 2:Fiscal 2014 Results
Volume 2 of the Annual Report
follows this page.
(this page does not form part of the Annual Report)

Fiscal 2014 Results
Business and IT consulting Systems integration IT managed services Business process services

| 1 | Management’s Discussion and Analysis |
of Financial Position and Results of Operations
| 56 | Management’s and Auditors’ Reports |
| 61 | Consolidated Financial statements |
| 127 | Shareholder information |

FISCAL 2014 RESULTS
Management’s Discussion and Analysis of Financial
Position and Results of Operations
November 13, 2014
Basis of Presentation
This Management’s Discussion and Analysis of the Financial Position and Results of Operations (“MD&A”) is the responsibility of management and has been reviewed and approved by the Board of Directors. This MD&A has been prepared in accordance with the requirements of the Canadian Securities Administrators. The Board of Directors is ultimately responsible for reviewing and approving the MD&A. The Board of Directors carries out this responsibility mainly through its Audit and Risk Management Committee, which is appointed by the Board of Directors and is comprised entirely of independent and financially literate directors.
Throughout this document, CGI Group Inc. is referred to as “CGI”, “we”, “our” or “Company”. This MD&A provides information management believes is relevant to an assessment and understanding of the consolidated results of operations and financial condition of the Company. This document should be read in conjunction with the audited consolidated financial statements and the notes thereto for the years ended September 30, 2014 and 2013. CGI’s accounting policies are in accordance with International Financial Reporting Standards (“IFRS”) as issued by the International Accounting Standards Board (“IASB”). All dollar amounts are in Canadian dollars unless otherwise indicated.
Materiality of Disclosures
This MD&A includes information we believe is material to investors. We consider something to be material if it results in, or would reasonably be expected to result in, a significant change in the market price or value of our shares, or if it is likely that a reasonable investor would consider the information to be important in making an investment decision.
Forward-Looking Statements
All statements in this MD&A that do not directly and exclusively relate to historical facts constitute “forward-looking statements” within the meaning of that term in Section 27A of the United States Securities Act of 1933, as amended, and Section 21E of the United States Securities Exchange Act of 1934, as amended, and are “forward-looking information” within the meaning of Canadian securities laws. These statements and this information represent CGI’s intentions, plans, expectations and beliefs, and are subject to risks, uncertainties and other factors, of which many are beyond the control of the Company. These factors could cause actual results to differ materially from such forward-looking statements or forward-looking information. These factors include but are not restricted to: the timing and size of new contracts; acquisitions and other corporate developments; the ability to attract and retain qualified members; market competition in the rapidly evolving information technology industry; general economic and business conditions; foreign exchange and other risks identified in the MD&A, in CGI’s Annual Report on Form 40-F filed with the U.S. Securities and Exchange Commission (filed on EDGAR atwww.sec.gov), the Company’s Annual Information Form filed with the Canadian securities authorities (filed on SEDAR atwww.sedar.com), as well as assumptions regarding the foregoing. The words “believe”, “estimate”, “expect”, “intend”, “anticipate”, “foresee”, “plan”, and similar expressions and variations thereof, identify certain of such forward-looking statements or forward-looking information, which speak only as of the date on which they are made. In particular, statements relating to future performance are forward-looking statements and forward-looking information. CGI disclaims any intention or obligation to publicly update or revise any forward-looking statements or forward-looking information, whether as a result of new information, future events or otherwise, except as required by applicable law. Readers are cautioned not to place undue reliance on these forward-looking statements or on this forward-looking information. You will find more information about the risks that could cause our actual results to differ significantly from our current expectations in Section 10 – Risk Environment.
1
Management’s Discussion and Analysis
Non-GAAP and Key Performance Measures
The reader should note that the Company reports its financial results in accordance with IFRS. However, we use a combination of financial measures, ratios, and non-GAAP measures to assess our Company’s performance. The non-GAAP measures used in this MD&A do not have any standardized meaning prescribed by IFRS and are therefore unlikely to be comparable to similar measures presented by other issuers. These measures should be considered as supplemental in nature and not as a substitute for the related financial information prepared in accordance with IFRS.
The table below summarizes our non-GAAP measures and most relevant key performance measures:
Profitability | • | Adjusted EBIT (non-GAAP) – is a measure of earnings before integration-related costs, finance costs, finance income and income tax expense as these items are not directly related to the cost of operations. Management believes this measure is useful to investors as it best reflects the profitability of our operations and allows for better comparability from period to period as well as to analyze the trends in our operations. A reconciliation of the yearly and current quarter’s adjusted EBIT to its closest IFRS measure can be found on pages 22 and 38. | ||
• | Net earnings prior to specific items1 (non-GAAP) – is a measure of earnings before the integration-related costs, adjustments related to tax and the resolution of acquisition-related provisions. Management believes that this measure is useful to investors as it best reflects the Company’s operating profitability and allows for better comparability from period to period. A reconciliation of the yearly and current quarter’s net earnings prior to specific items to its closest IFRS measure can be found on pages 24 and 39. | |||
•
| Basic and diluted earnings per share prior to specific items1 (non-GAAP) – is defined as the net earnings excluding integration-related costs, adjustments related to tax and the resolution of acquisition-related provisions on a per share basis, assuming all dilutive elements are exercised. Management believes that this measure is useful to investors as it best reflects the Company’s operating profitability on a per share basis and allows for better comparability from period to period. The yearly and current quarter’s diluted net earnings reported in accordance with IFRS can be found on pages 23 and 38 while the yearly and current quarter’s diluted net earnings prior to specific items can be found on pages 24 and 39.
| |||
•
| Net earnings – is a measure of earnings generated for shareholders.
| |||
•
| Diluted earnings per share – is a measure of earnings generated for shareholders on a per share basis, assuming all dilutive elements are exercised.
| |||
Liquidity | • | Cash provided by operating activities – is a measure of cash generated from managing our day-to-day business operations. We believe strong operating cash flow is indicative of financial flexibility, allowing us to execute our corporate strategy. | ||
•
| Days sales outstanding (“DSO”) (non-GAAP) – is the average number of days needed to convert our trade receivables and work in progress into cash. DSO is obtained by subtracting deferred revenue from trade accounts receivable and work in progress; the result is divided by the quarter’s revenue over 90 days. Deferred revenue is net of the fair value adjustments on revenue-generating contracts. Management tracks this metric closely to ensure timely collection, healthy liquidity, and is committed to a DSO target of 45 days or less. We believe this measure is useful to investors as it demonstrates the Company’s ability to timely convert its trade receivables and work in progress into cash.
| |||
| 1 | Specific items related to the resolution of acquisition-related provisions are described on page 20. |
2
FISCAL 2014 RESULTS
Growth | • |
Constant currency growth (non-GAAP) – is a measure of revenue growth before foreign currency impacts. This growth is calculated by translating current period results in local currency using the conversion rates in the equivalent period from the prior year. Management believes that it is helpful to adjust revenue to exclude the impact of currency fluctuations to facilitate period-to-period comparisons of business performance. We believe that this measure is useful to investors for the same reason. | ||
• | Backlog (non-GAAP) – Backlog includes new contract wins, extensions and renewals (“bookings”(non- GAAP)), partially offset by the backlog consumed during the year as a result of client work performed and adjustments related to the volume, cancellation and/or the impact of foreign currencies to our existing contracts. Backlog incorporates estimates from management that are subject to change. Management tracks this measure as it is a key indicator of management’s best estimate of revenue to be realized in the future and believes that this measure is useful to investors for the same reason. | |||
•
| Book-to-bill ratio (non-GAAP) – is a measure of the proportion of the value of our contract wins to our revenue in the period. This metric allows management to monitor the Company’s business development efforts to ensure we grow our backlog and our business over time. Management remains committed to maintaining a target ratio greater than 100% over a trailing 12-month period. Management believes that the longer period is a more effective measure as the size and timing of bookings could cause this measurement to fluctuate significantly if taken for only a three-month period.
| |||
| Capital Structure | • | Net debt (non-GAAP) – is obtained by subtracting our cash and cash equivalents, short-term investments and long-term investments from our debt. Management uses the net debt metric to monitor the Company’s financial leverage. We believe that this metric is useful to investors as it provides insight into our financial strength. A reconciliation of net debt to its closest IFRS measure can be found on page 30. | ||
• | Net debt to capitalization ratio (non-GAAP) – is a measure of our level of financial leverage and is obtained by dividing the net debt by the sum of shareholder’s equity and debt. Management uses the net debt to capitalization metric to monitor the proportion of debt versus capital used to finance our operations and to assess the Company’s financial strength. We believe that this metric is useful to investors as it provides insight into our financial strength. | |||
• | Return on equity (“ROE”) (non-GAAP) – is a measure of the rate of return on the ownership interest of our shareholders and is calculated as the proportion of earnings for the last 12 months over the last four quarter’s average equity. Management looks at ROE to measure its efficiency at generating profits for the Company’s shareholders and how well the Company uses the invested funds to generate earnings growth. We believe that this measure is useful to investors for the same reasons. | |||
•
| Return on invested capital (“ROIC”) (non-GAAP) – is a measure of the Company’s efficiency at allocating the capital under its control to profitable investments and is calculated as the proportion of the after-tax adjusted EBIT for the last 12 months, over the last four quarter’s average invested capital, which is defined as the sum of equity and net debt. Management examines this ratio to assess how well it is using its funds to generate returns. We believe that this measure is useful to investors for the same reason.
| |||
Reporting Segments
The Company is managed through the following seven operating segments, namely: United States of America (“U.S.”); Nordics, Southern Europe and South America (“NSESA”); Canada; France (including Luxembourg and Morocco) (“France”); United Kingdom (“U.K.”); Central and Eastern Europe (primarily the Netherlands and Germany) (“CEE”); and Asia Pacific (including Australia, India and the Philippines) (“Asia Pacific”). Please refer to section 3.4 and 3.6 of the present document and to Note 28 of our audited consolidated financial statements for additional information on our segments.
To assist in better understanding the operational performance of our company since the acquisition of Logica plc (“Logica”) in 2012, we refer to our operations in two broad groupings. Our activities prior to Logica were predominantly comprised of the Canada and the U.S. segments which we refer to as our North American operations or segments. The acquired operations which we refer herein as our European operations or segments is comprised of the NSESA, France, U.K., CEE and Asia Pacific segments.
3
Management’s Discussion and Analysis
MD&A Objectives and Contents
| • | Provide a narrative explanation of the audited consolidated financial statements through the eyes of management; |
| • | Provide the context within which the audited consolidated financial statements should be analyzed, by giving enhanced disclosure about the dynamics and trends of the Company’s business; and |
| • | Provide information to assist the reader in ascertaining the likelihood that past performance is indicative of future performance. |
In order to achieve these objectives, this MD&A is presented in the following main sections:
Section
|
Contents
| Pages
| ||||
1. Corporate Overview |
This includes a description of our business and how we generate revenue as well as the markets in which we operate. | |||||
1.1. About CGI | 6 | |||||
1.2. Vision and Strategy | 6 | |||||
1.3. Competitive Environment
| 7
| |||||
2. Highlights and Key Performance |
A summary of key achievements during the year and past three years’ key performance measures as well as CGI’s share performance. | |||||
2.1. Fiscal 2014 Highlights | 9 | |||||
2.2. Selected Yearly Information & Key Performance Measures | 11 | |||||
2.3. Stock Performance
| 12
| |||||
3. Financial Review |
A discussion of year-over-year changes to operating results between the years ended September 30, 2014 and 2013, describing the factors affecting revenue and adjusted EBIT on a consolidated and reportable segment basis, and also by describing the factors affecting changes in the major expense categories. Also discussed are bookings broken down by geography, by vertical market, by contract type and by service type. | |||||
3.1. Bookings and Book-to-Bill Ratio | 14 | |||||
3.2. Foreign Exchange | 15 | |||||
3.3. Revenue Distribution | 16 | |||||
3.4. Revenue Variation and Revenue by Segment | 17 | |||||
3.5. Operating Expenses | 19 | |||||
3.6. Adjusted EBIT by Segment | 20 | |||||
3.7. Earnings before Income Taxes | 22 | |||||
3.8. Net Earnings and Earnings Per Share (“EPS”)
| 23
| |||||
4
FISCAL 2014 RESULTS
Section
|
Contents
| Pages
| ||||
4. Liquidity |
This includes a discussion of changes in cash flows from operating, investing and financing activities. This section also describes the Company’s available capital resources, financial instruments, and off-balance sheet financing and guarantees. Measures of liquidity (days sales outstanding) and capital structure (return on equity, net debt to capitalization, and return on invested capital) are analyzed on a year-over-year basis.
| |||||
4.1. Consolidated Statements of Cash Flows | 25 | |||||
4.2. Capital Resources | 28 | |||||
4.3. Contractual Obligations | 29 | |||||
4.4. Financial Instruments and Hedging Transactions | 29 | |||||
4.5. Selected Measures of Liquidity and Capital Resources | 30 | |||||
4.6. Off-Balance Sheet Financing and Guarantees | 31 | |||||
4.7. Capability to Deliver Results
| 31 | |||||
5. Fourth Quarter |
A discussion of year-over-year changes to operating results between the three months ended September 30, 2014 and 2013, describing the factors affecting revenue, adjusted EBIT earnings on a consolidated and reportable segment basis as well as cash from operating activities. Also discussed are bookings for the three months ended September 30, 2014. | |||||
5.1. Foreign Exchange | 33 | |||||
5.2. Revenue Variation and Revenue by Segment | 34 | |||||
5.3. Adjusted EBIT by Segment | 36 | |||||
5.4. Net Earnings and Earnings Per Share | 38 | |||||
5.5. Consolidated Statements of Cash Flows
| 40 | |||||
6. Eight Quarter
|
A summary of the past eight quarters’ key performance measures and a discussion of the factors that could impact our quarterly results.
| 41 | ||||
7. Changes in
|
A summary of the new and amended accounting standards adopted and the future accounting standard changes.
| 42 | ||||
8. Critical Accounting Estimates and Judgements
|
A discussion of the estimates and judgements made in the preparation of the audited consolidated financial statements. | 44 | ||||
9. Integrity of Disclosure |
A discussion of the existence of appropriate information systems, procedures and controls to ensure that information used internally and disclosed externally is complete and reliable. | 47 | ||||
10. Risk Environment |
A discussion of the risks affecting our business activities and what may be the impact if these risks are realized. | |||||
10.1. Risks and Uncertainties
| 48 | |||||
10.2. Legal Proceedings
| 54 | |||||
5
Management’s Discussion and Analysis
| 1. | Corporate Overview |

1.1. ABOUT CGI
Founded in 1976 and headquartered in Montreal, Canada, CGI is the fifth largest independent information technology (“IT”) and business process services (“BPS”) firm in the world. CGI has approximately 68,000 employees, whom we refer to as members, worldwide. The Company’s client-proximity model provides for CGI services and solutions to be delivered in a number of ways and considering a number of factors: onsite at clients’ premises; or from any combination of onsite, near-shore and/or offshore delivery centers. We also have a number of leading business solutions that support long-term client relationships. Our services are broken down as:
| • | Consulting - CGI provides a full range of IT and management consulting services, including business transformation, IT strategic planning, business process engineering and systems architecture. |
| • | Systems integration - CGI integrates and customizes leading technologies and software applications to create IT systems that respond to clients’ strategic needs. |
| • | Management of IT and business functions (“outsourcing”) - Clients delegate entire or partial responsibility for their IT or business functions to CGI to achieve significant savings and access the best suited technology, while retaining control over strategic IT and business functions. As part of these agreements, we implement our quality processes and practices to improve the efficiency of the clients’ operations. We may also integrate clients’ operations into our technology network. Finally, we may take on specialized professionals from our clients, enabling our clients to focus on key operations. Services provided as part of an outsourcing contract may include development and integration of new projects and applications; applications maintenance and support; technology infrastructure management(enterprise and end-user computing and network services); transaction and business processing such as payroll, claims processing, and document management services. Outsourcing contracts typically have terms from five to ten years. |
CGI offers its end-to-end services to a focused set of industry vertical markets where we have developed extensive and deep subject matter expertise. This allows us to fully understand our clients’ business realities and to have the knowledge and solutions needed to advance their business goals. Our targeted vertical markets include: financial services, government, health, telecommunications & utilities, manufacturing, retail and distribution (“MRD”), which together account for more than 90% of global IT spend.
CGI has a wide range of proprietary business solutions that help shape opportunities and drive value for our clients and shareholders. Examples of these include Enterprise Resource Planning solutions, energy management, credit and debt collections, tax management, claims auditing and fraud detection.
We take great pride in delivering high quality services to our clients. To do so consistently, we have implemented and continue to maintain the International Organization for Standardization (“ISO”) quality program. By designing and implementing rigorous service delivery and quality standards, followed by monitoring and measurement, we are better able to satisfy our clients’ needs. As a measure of the scope of our ISO program, all of CGI’s legacy business units continue to be certified and most of the business units acquired through the acquisition of Logica are certified as well. The work on certifying the remaining business units is in progress.
1.2. VISION AND STRATEGY
At CGI, we have a vision of being a global world-class IT and BPS leader, who helps its clients succeed. This business vision begins with our dream, which is “to create an environment in which we enjoy working together and, as owners, contribute to building a Company we can be proud of.” From this dream we developed our build and buy strategy, comprised of four pillars that combine organic growth (“build”) and acquisitions (“buy”).
6
FISCAL 2014 RESULTS
The first two pillars of our strategy focus on organic growth. The first pillar focuses on smaller contract wins, renewals and extensions. The second involves the pursuit of new large, long-term outsourcing contracts, leveraging our end-to-end services, global delivery model and critical mass.
The third pillar of our growth strategy focuses on the acquisition of smaller firms or niche players. We identify niche acquisitions through a strategic mapping program that systematically searches for targets that will strengthen our vertical market knowledge or increase the richness of our service offerings.
The fourth pillar involves the pursuit of transformational acquisitions focused on expanding our geographic presence and critical mass. This approach further enables us to strengthen our qualifications to compete for large outsourcing contracts. CGI continues to be a consolidator in the IT services industry.
This four-pillar growth strategy has resulted in our ability to build critical mass in key client geographies, gain a deep knowledge of clients’ business sectors and develop specialized practices and innovative solutions.
CGI remains committed to profitable growth and the fundamentals that help all of CGI’s stakeholders succeed; while fulfilling CGI’s strategic objective of doubling the size of the Company.
Today, with a presence in 40 countries, strong expertise in all of our target markets and a complete range of IT services, CGI is able to meet our clients’ business needs anywhere, anytime. While remaining true to our Constitution, CGI continues to adapt to best respond to changes in the IT market, the local and global business climate of clients, and to our professionals’ and shareholders’ expectations.
1.3. COMPETITIVE ENVIRONMENT
As a global provider of end-to-end information technology and business process services, CGI operates in a highly competitive and rapidly evolving global industry. Our competition comprises a variety of global players, from niche companies providing specialized services to other end-to-end service providers, mainly in the U.S., Europe and India, all of whom are competing to deliver some or all of the services we provide.
Recent mergers and acquisition activity has resulted in CGI being positioned as one of the few remaining IT services firms that operates independently of any hardware or software vendor. Our independence allows CGI to deliver the best-suited technology available to our clients.
CGI offers its end-to-end services to a select set of targeted vertical markets in which we have deep business and technical expertise. To compete effectively, CGI focuses on high-end systems integration, consulting and outsourcing where vertical market industry knowledge and expertise are required.
Our business model is designed to listen to the needs of our clients and adapt our offerings to provide the best solutions to meet each client’s unique needs. Our client approach focuses on:
— Local accountability: We live and work near our clients to provide a high level of responsiveness. We speak our clients’ language, understand their business environment, and collaborate with them to meet their goals and advance their business.
—Global capabilities: Our local presence is backed by an expansive global delivery network that ensures our clients have access to resources that best fit their needs and offer proximity.
—Quality processes: Our investment in quality frameworks and rigorous client satisfaction assessments provides for a consistent track record of on-time and on-budget project delivery, enabling our clients to focus on their business objectives.
—Committed experts: Our professionals have vast industry, business and technology expertise to help our clients. In addition, a majority of our professionals are shareholders of the Company, providing an added level of commitment to our clients’ success.
—Practical innovation: We provide a full set of innovative solutions in areas of big data, predictive analytics and mobility, which are complemented by our expertise in business consulting, systems integration and outsourcing services to offer creative business strategies to our clients.
7
Management’s Discussion and Analysis
CGI’s business operations are based on the Management Foundation (the “Management Foundation”), encompassing governance policies, sophisticated management frameworks and an organizational model for its business units and corporate processes. This foundation, along with our appropriate internal systems is followed by all our business units and helps in providing a disciplined high standard of quality service to our clients across all of our operations, and additional value to our stakeholders.
There are many factors involved in winning and retaining IT and BPS contracts, including the following: total cost of services; ability to deliver; track record; vertical market expertise; investment in business solutions; local presence; global delivery capability; and the strength of client relationships. CGI compares favourably with its competition with respect to all of these factors.
In summary, CGI’s competitive value proposition encompasses the following: end-to-end IT and BPS capability; expertise and proprietary business solutions in our targeted vertical markets covering the majority of global IT spending; a unique global delivery model, which includes industry leading delivery capabilities; a disciplined Management Foundation; and our focus on client satisfaction which is supported by our client proximity business model.
8
FISCAL 2014 RESULTS
| 2. | Highlights and Key Performance Measures |
2.1. FISCAL 2014 HIGHLIGHTS
Key performance figures for the year include:
| • | Revenue of $10,499.7 million, up 4.1%; |
| • | Adjusted EBIT of $1,356.9 million, up 26.1%; |
| • | Adjusted EBIT margin of 12.9%, up 220 basis points; |
| • | Net earnings prior to specific items1 of $893.5 million, or diluted EPS of $2.80, up 22.8%; |
| • | Net earnings of $859.4 million, or diluted EPS of $2.69, up 88.5%; |
| • | Cash provided by operating activities of $1,174.8 million, up 75.0%; |
| • | Bookings of $10.2 billion and backlog of $18.2 billion; |
| • | Net debt reduced by $626.6 million; |
| • | Return on invested capital of 14.5%; |
| • | Return on equity of 18.8%. |
1 Specific items include the integration costs related to the acquisition of Logica, the tax adjustments and the resolution of acquisition-related provisions which are discussed on page 20.
2.1.1. Acquisition of Logica plc
On August 20, 2012, CGI completed its acquisition of Logica for 105 pence ($1.63) per ordinary share which is equivalent to a total purchase price of $2.7 billion plus the assumption of Logica’s net debt of $0.9 billion. Subsequent to August 20, 2012, our results incorporated the operations of Logica.
As of September 30, 2014, we completed the integration of Logica, a full year earlier than planned. In addition to the previously announced $525 million program, we actioned an incremental $26.5 million of new opportunities while foreign currency fluctuations unfavorably impacted the program by approximately $24.0 million over the two-year period. In summary, a total of $575.5 million in one-time costs were spent to drive annual savings in excess of $400 million and EPS accretion to CGI.
The following table provides a summary of the integration program:
| Summary of the integration program |
Total program
| |
(In millions of CAD) | ||
Integration-related provision at the beginning of the program |
— | |
Plus: | ||
Integration-related expenses |
575.5 | |
Minus: | ||
Integration-related payments |
472.7 | |
Non-cash integration-related costs |
7.2 | |
Plus :FX impacta
|
10.0
| |
Integration-related provision at the end of the year | 105.6 | |
a This amount was recorded in other comprehensive income.
9
Management’s Discussion and Analysis
2.1.2. Long-term Debt
In the first quarter of fiscal 2014, the unsecured revolving credit facility of $1,500.0 million was extended by one year to December 2017. On July 25, 2014, the facility was further extended by another year to December 2018 and can be further extended annually. All other terms and conditions including interest rates and banking covenants remain unchanged.
In April 2014, we repaid the first maturing tranche of the term loan credit facility of $486.7 million using the proceeds from our credit facilities.
In September 2014, the Company entered into a $955 million debt private placement comprised of four tranches of Senior U.S. unsecured notes for US$745 million, and one tranche of Senior euro unsecured note for€85 million, with a weighted average maturity of 7.9 years and a weighted average fixed coupon of 3.62%. The Company used the proceeds of the issuance of the new private placement notes to repay the May 2015 maturing tranche of the term loan credit facility of $494.7 million and the outstanding balance of the credit facilities. Further details are provided in section 4.1.3 of the present document.
10
FISCAL 2014 RESULTS
2.2. SELECTED YEARLY INFORMATION & KEY PERFORMANCE MEASURES
Fiscal 2014 marks the second full year incorporating Logica’s results. Planned as part of our integration activities we have been exiting low margin business to improve our revenue quality. In addition, we have been restructuring the prior Logica operations to align their cost structures to appropriate levels. As a result, our profitability and cash from operating activities have improved. The acquisition of Logica was completed on August 20, 2012, six weeks prior to the end of fiscal 2012. The significant year-over-year changes for fiscal 2012 through fiscal 2013 are primarily attributable to this acquisition.
| As at and for the years ended September 30, | 2014 | 2013 | 2012 |
Change
|
Change
| |||||||||||||
| In millions of CAD unless otherwise noted | ||||||||||||||||||
Growth | ||||||||||||||||||
Backlog | 18,237 | 18,677 | 17,647 | (440) | 1,030 | |||||||||||||
Bookings | 10,169 | 10,310 | 5,180 | (141) | 5,130 | |||||||||||||
Book-to-bill ratio | 96.8% | 102.2% | 108.5% | (5.4%) | (6.3)% | |||||||||||||
Revenue | 10,499.7 | 10,084.6 | 4,772.5 | 415.1 | 5,312.1 | |||||||||||||
Year-over-year growth | 4.1% | 111.3% | 13.0% | (107.2%) | 98.3% | |||||||||||||
Constant currency growth1
| (2.9%)
|
| 110.1%
|
|
| 12.1%
|
|
| (113.0%)
|
| 98.0% | |||||||
Profitability | ||||||||||||||||||
Adjusted EBIT2 | 1,356.9 | 1,075.6 | 546.7 | 281.3 | 528.9 | |||||||||||||
Adjusted EBIT margin | 12.9% | 10.7% | 11.5% | 2.2% | (0.8%) | |||||||||||||
Net earnings | 859.4 | 455.8 | 131.5 | 403.6 | 324.3 | |||||||||||||
Net earnings margin | 8.2% | 4.5% | 2.8% | 3.7% | 1.7% | |||||||||||||
Basic EPS (in dollars) | 2.78 | 1.48 | 0.50 | 1.30 | 0.98 | |||||||||||||
Diluted EPS (in dollars)
| 2.69
|
| 1.44
|
|
| 0.48
|
|
| 1.25
|
|
| 0.96
|
| |||||
Liquidity | ||||||||||||||||||
Cash provided by operating activities | 1,174.8 | 671.3 | 613.3 | 503.5 | 58.0 | |||||||||||||
As a % of revenue | 11.2% | 6.7% | 12.9% | 4.5% | (6.2%) | |||||||||||||
Days sales outstanding3,8
| 43
|
| 49
|
|
| 74
|
|
| (6)
|
|
| (25)
|
| |||||
Capital structure | ||||||||||||||||||
Net debt4,8 | 2,113.3 | 2,739.9 | 3,105.3 | (626.6) | (365.4) | |||||||||||||
Net debt to capitalization ratio5,8 | 27.6% | 39.6% | 46.5% | (12.0%) | (6.9%) | |||||||||||||
Return on equity6 | 18.8% | 12.3% | 5.0% | 6.5% | 7.3% | |||||||||||||
Return on invested capital7
| 14.5%
|
| 11.8%
|
|
| 11.4%
|
|
| 2.7%
|
|
| 0.4%
|
| |||||
Balance sheet | ||||||||||||||||||
Cash and cash equivalents, and short-term investments | 535.7 | 106.2 | 127.6 | 429.5 | (21.4) | |||||||||||||
Total assets8 | 11,234.1 | 10,879.3 | 10,690.2 | 354.8 | 189.1 | |||||||||||||
Long-term financial liabilities8,9
| 2,748.4
|
| 2,489.5
|
|
| 3,228.9
|
|
| 258.9
|
|
| (739.4)
|
| |||||
| 1 | Constant currency growth is adjusted to remove the impact of foreign currency exchange rate fluctuations. Please refer to page 17 for details. |
| 2 | Adjusted EBIT is a measure for which we provide the reconciliation to its closest IFRS measure on page 22. |
| 3 | Days sales outstanding (“DSO”) is a measure which is discussed on page 31. |
| 4 | Net debt is a measure for which we provide the reconciliation to its closest IFRS measure on page 30. |
| 5 | The net debt to capitalization ratio is a measure which is discussed on page 30. |
| 6 | The return on equity ratio is a measure which is discussed on page 30. |
| 7 | The return on invested capital ratio is a measure which is discussed on page 31. |
| 8 | The reader should note that the figures for fiscal 2012 were restated to reflect the final purchase price allocation adjustments made in fiscal 2013 to the opening balance sheet of Logica. |
| 9 | Long-term financial liabilities include the long-term portion of the debt and the long-term derivative financial instruments. |
11
Management’s Discussion and Analysis
2.3. STOCK PERFORMANCE
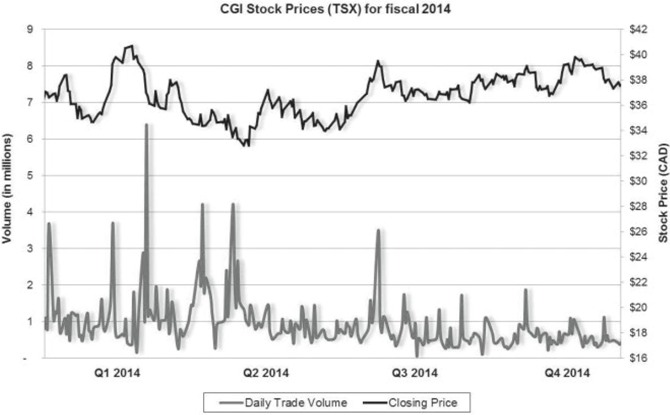
2.3.1. Fiscal 2014 Trading Summary
CGI’s shares are listed on the Toronto Stock Exchange (“TSX”) (stock quote – GIB.A) and the New York Stock Exchange (“NYSE”) (stock quote – GIB) and are included in the S&P/TSX Composite Index, the S&P/TSX 60 Index, the S&P/TSX Capped Information Technology and Midcap Indices, and the Dow Jones Sustainability Index.
| TSX | (CDN$) | NYSE | (US$) | |||||||||
Open: | 35.84 | Open: | 34.83 | |||||||||
High: | 41.47 | High: | 39.47 | |||||||||
Low: | 32.71 | Low: | 29.40 | |||||||||
Close: | 37.84 | Close: | 33.77 | |||||||||
CDN average daily trading volumes1: | 1,545,689 | U.S. average daily trading volumes: | 267,355 | |||||||||
1 Includes the average daily volumes of both the TSX and alternative trading systems.
2.3.2. Share Repurchase Program
On January 29, 2014, the Company’s Board of Directors authorized and subsequently received the approval from the TSX for the renewal of the Normal Course Issuer Bid (“NCIB”) to purchase up to 21,798,645 Class A subordinate shares for cancellation, representing 10% of the Company’s public float as of the close of business on January 24, 2014. The Class A subordinate shares may be purchased under the NCIB commencing February 11, 2014 and ending on the earlier of February 10, 2015, or the date on which the Company has either acquired the maximum number of Class A subordinate shares allowable under the NCIB, or elects to terminate the NCIB.
12
FISCAL 2014 RESULTS
During fiscal 2014, the Company repurchased 2,837,360 Class A subordinate shares for $111.5 million at an average price of $39.29 under the annual aggregate limit of the previous NCIB. As at September 30, 2014, the Company may purchase up to 21.8 million shares under the current NCIB.
2.3.3. Capital Stock and Options Outstanding
The following table provides a summary of the Capital Stock and Options Outstanding as at November 7, 2014:
Capital Stock and Options Outstanding |
As at November 7, 2014 | |
Class A subordinate shares | 279,479,153 | |
Class B shares | 33,272,767 | |
Options to purchase Class A subordinate shares
| 19,510,102
| |
13
Management’s Discussion and Analysis
| 3. | Financial Review |
3.1. BOOKINGS AND BOOK-TO-BILL RATIO
Bookings for the year were $10.2 billion, representing a book-to-bill ratio of 96.8%. The breakdown of the new bookings signed during the year is as follows:
|
| |||||||
| Contract Type | ||||||||
| A. | Extensions and renewals | 61 | % | |||||
| B. | New business | 39 | % | |||||
|
|
| ||||||
| Service Type | ||||||||
| A. | Management of IT and business functions (outsourcing) | 50 | % | |||||
| B. | Systems integration and consulting | 50 | % | |||||
|
|
| ||||||
| Segment | ||||||||
| A. | NSESA | 26 | % | |||||
| B. | U.S | 19 | % | |||||
| C. | France | 15 | % | |||||
| D. | Canada | 14 | % | |||||
| E. | U.K | 14 | % | |||||
| F. | CEE | 11 | % | |||||
| G. | Asia Pacific | 1 | % | |||||
|
|
| ||||||
| Vertical Markets | ||||||||
| A. | Manufacturing, retail & distribution | 28 | % | |||||
| B. | Government | 28 | % | |||||
| D. | Financial services | 20 | % | |||||
| C. | Telecommunications & utilities | 16 | % | |||||
| E. | Health | 8 | % | |||||
Information regarding our bookings is a key indicator of the volume of our business over time. However, due to the timing and transition period associated with outsourcing contracts, the realization of revenue related to these bookings may fluctuate from period to period. The values initially booked may change over time due to their variable attributes, including demand-driven usage, modifications in the scope of work to be performed caused by changes in client requirements as well as termination clauses at the option of the client. As such, information regarding our bookings is not comparable to, nor should it be substituted for an analysis of our revenue; it is instead a key indicator of our future revenue used by the Company’s management to measure growth. For the year ended September 30, 2014, the book-to-bill ratio of our North American operations was at 76.0% while it was at 112.2% for our European operations for a total book-to-bill ratio of 96.8%.
The following table provides a summary of the bookings and book-to-bill ratio by segment:
In thousands of CAD except for percentages
|
Bookings for the
|
Book-to-bill ratio
| ||
Total CGI bookings | 10,168,998 | 96.8% | ||
North American bookings | 3,371,848 | 76.0% | ||
U.S. |
1,916,498 |
69.9% | ||
Canada
| 1,455,350
| 85.7%
| ||
European bookings |
6,797,150 |
112.2% | ||
NSESA |
2,610,607 |
122.4% | ||
France | 1,467,329 | 109.7% | ||
U.K. | 1,437,209 | 104.0% | ||
CEE | 1,142,889 | 109.9% | ||
Asia Pacific | 139,116 | 82.4% | ||
14
FISCAL 2014 RESULTS
3.2. FOREIGN EXCHANGE
The Company operates globally and is exposed to changes in foreign currency rates. We report all dollar amounts in Canadian dollars. Accordingly, we value assets, liabilities and transactions that are measured in foreign currencies using various exchange rates as prescribed by IFRS.
Closing foreign exchange rates
As at September 30,
| 2014
| 2013
| Change
| |||
U.S. dollar | 1.1209 | 1.0285 | 9.0% | |||
Euro | 1.4156 | 1.3920 | 1.7% | |||
Indian rupee | 0.0181 | 0.0164 | 10.4% | |||
British pound | 1.8182 | 1.6639 | 9.3% | |||
Swedish krona | 0.1554 | 0.1604 | (3.1%) | |||
Australian dollar | 0.9791 | 0.9607 | 1.9% | |||
Average foreign exchange rates
| ||||||
For the years ended September 30,
| 2014
| 2013
| Change
| |||
U.S. dollar | 1.0833 | 1.0155 | 6.7% | |||
Euro | 1.4700 | 1.3326 | 10.3% | |||
Indian rupee | 0.0178 | 0.0180 | (1.1%) | |||
British pound | 1.7953 | 1.5846 | 13.3% | |||
Swedish krona | 0.1635 | 0.1551 | 5.4% | |||
Australian dollar | 0.9971 | 1.0105 | (1.3%) | |||
15
Management’s Discussion and Analysis
3.3. REVENUE DISTRIBUTION
The following charts provide additional information regarding our revenue mix for the year:
|
|
| ||||||||||||||||||||||||||
| Service Type | Client Geography | Vertical Markets | ||||||||||||||||||||||||||
| A. | Management of IT and business | A. | U.S | 27% | A. | Government | 33% | |||||||||||||||||||||
| functions (outsourcing) | 52% | B. | Canada | 15% | B. | Manufacturing, | ||||||||||||||||||||||
1. IT services | 41% | C. | U.K | 13% | retail & distribution | 24% | ||||||||||||||||||||||
2. Business process services | 11% | D. | France | 12% | C. | Financial services | 18% | |||||||||||||||||||||
| E. | Sweden | 9% | D. | Telecommunications & utilities | 15% | |||||||||||||||||||||||
| B. | Systems integration and consulting | 48% | F. | Finland | 6% | E. | Health | 10% | ||||||||||||||||||||
| G. | Rest of the world | 18% | ||||||||||||||||||||||||||
3.3.1. Client Concentration
IFRS guidance on Segment Disclosures defines a single customer as a group of entities that are known to the reporting enterprise to be under common control. The Company considers the federal, regional or local governments each to be a single customer. Our work for the U.S. federal government including its various agencies represented 13.4% of our revenue for fiscal 2014 as compared to 13.8% in fiscal 2013.
16
FISCAL 2014 RESULTS
3.4. REVENUE VARIATION AND REVENUE BY SEGMENT
Our seven segments are based on our geographic delivery model: U.S., NSESA, Canada, France, U.K., CEE and Asia Pacific.
The following table provides a summary of the year-over-year changes in our revenue, in total and by segment, separately showing the impacts of foreign currency exchange rate variations between fiscal 2014 and fiscal 2013. The fiscal 2013 revenue by segment was recorded reflecting the actual average foreign exchange rates for that period. The foreign exchange impact is the difference between the current period’s actual results and the current period’s results converted with the prior year’s average foreign exchange rates.
| For the years ended September 30, | Change
| |||||||||||||||
| 2014 | 2013 | $ | % | |||||||||||||
In thousands of CAD except for percentages | ||||||||||||||||
Total CGI revenue | 10,499,692 | 10,084,624 | 415,068 | 4.1% | ||||||||||||
Variation prior to foreign currency impact | (2.9% | ) | ||||||||||||||
Foreign currency impact | 7.0% | |||||||||||||||
Variation over previous period | 4.1% | |||||||||||||||
U.S. | ||||||||||||||||
Revenue prior to foreign currency impact | 2,493,426 | 2,512,530 | (19,104 | ) | (0.8% | ) | ||||||||||
Foreign currency impact | 171,450 | |||||||||||||||
U.S. revenue | 2,664,876 | 2,512,530 | 152,346 | 6.1% | ||||||||||||
NSESA | ||||||||||||||||
Revenue prior to foreign currency impact | 1,944,864 | 2,010,693 | (65,829 | ) | (3.3% | ) | ||||||||||
Foreign currency impact | 145,376 | |||||||||||||||
NSESA revenue | 2,090,240 | 2,010,693 | 79,547 | 4.0% | ||||||||||||
Canada | ||||||||||||||||
Revenue prior to foreign currency impact | 1,632,794 | 1,685,723 | (52,929 | ) | (3.1% | ) | ||||||||||
Foreign currency impact | 5,526 | |||||||||||||||
Canada revenue | 1,638,320 | 1,685,723 | (47,403 | ) | (2.8% | ) | ||||||||||
France | ||||||||||||||||
Revenue prior to foreign currency impact | 1,207,907 | 1,273,604 | (65,697 | ) | (5.2% | ) | ||||||||||
Foreign currency impact | 125,885 | |||||||||||||||
France revenue | 1,333,792 | 1,273,604 | 60,188 | 4.7% | ||||||||||||
U.K. | ||||||||||||||||
Revenue prior to foreign currency impact | 1,121,213 | 1,158,520 | (37,307 | ) | (3.2% | ) | ||||||||||
Foreign currency impact | 162,634 | |||||||||||||||
U.K. revenue | 1,283,847 | 1,158,520 | 125,327 | 10.8% | ||||||||||||
CEE | ||||||||||||||||
Revenue prior to foreign currency impact | 968,727 | 1,003,950 | (35,223 | ) | (3.5% | ) | ||||||||||
Foreign currency impact | 94,806 | |||||||||||||||
CEE revenue | 1,063,533 | 1,003,950 | 59,583 | 5.9% | ||||||||||||
Asia Pacific | ||||||||||||||||
Revenue prior to foreign currency impact | 425,676 | 439,604 | (13,928 | ) | (3.2% | ) | ||||||||||
Foreign currency impact | (592 | ) | ||||||||||||||
Asia Pacific revenue | 425,084 | 439,604 | (14,520 | ) | (3.3% | ) | ||||||||||
17
Management’s Discussion and Analysis
We ended fiscal 2014 with revenue of $10,499.7 million, an increase of $415.1 million or 4.1% over fiscal 2013. On a constant currency basis, revenue decreased by $290.0 million or 2.9%, as foreign currency rate fluctuations favourably impacted our revenue by $705.1 million or 7.0%. For the current year, the top two vertical markets were government and MRD, which together accounted for approximately 56% of our revenue.
As part of the Company’s strategic focus to continuously improve its revenue quality, and as previously disclosed, we have been exiting low margin business as part of our integration activities. As a result, our yearly revenue has been reduced. Partially offsetting this, new higher quality revenue was booked or existing business expanded and/or extended across the geographies.
3.4.1. U.S.
Revenue in our U.S. segment was $2,664.9 million in fiscal 2014, an increase of $152.3 million or 6.1% over fiscal 2013. On a constant currency basis, revenue decreased by $19.1 million or 0.8%. The decrease in revenue reflects the run-off of a large low margin government project and the ramp down of Federal and state health projects partly offset by the ramp up of work within the financial services vertical markets and the increased sales of IP based business solutions.
For the current year, the top two U.S. vertical markets were government and health, which together accounted for approximately 77% of its revenue.
3.4.2. NSESA
Revenue in our NSESA segment was $2,090.2 million, an increase of $79.5 million or 4.0% over fiscal 2013. On a constant currency basis, revenue decreased by $65.8 million or 3.3%. The decrease in revenue was mainly due to project completions and the run-off of low margin business as previously described, partially offset by the recently awarded multi-year outsourcing contracts.
For fiscal 2014, revenue coming from Sweden and Finland accounted for 74% of this segment while NSESA’s top two vertical markets were MRD and government, which together accounted for approximately 58% of its revenue.
3.4.3. Canada
Revenue in our Canada segment was $1,638.3 million, a decrease of $47.4 million or 2.8% over fiscal 2013. On a constant currency basis, revenue decreased by $52.9 million or 3.1%. The revenue decrease was mainly due to lower work volumes as a result of the expiration of contracts that were partially offset by the start-up of new contracts.
For the current year, Canada’s top two vertical markets were financial services and telecommunication and utilities, which together accounted for approximately 57% of its revenue.
3.4.4. France
Revenue in our France segment was $1,333.8 million, an increase of $60.2 million or 4.7% over fiscal 2013. On a constant currency basis, revenue decreased by $65.7 million or 5.2%. The decrease in revenue was primarily the result of lower work volumes due to the completion of projects and the run-off of low margin business partly offset by the start-up of new contracts.
For the current year, France’s top two vertical markets were MRD and financial services, which together accounted for approximately 65% of its revenue.
3.4.5. U.K.
Revenue in our U.K. segment was $1,283.8 million, an increase of $125.3 million or 10.8% over fiscal 2013. On a constant currency basis, revenue decreased by $37.3 million or 3.2%. The decrease in revenue was due to the run-off of low margin business, partly offset by new and extended contracts within the government vertical market.
For the current year, U.K.’s top two vertical markets were government and MRD, which together accounted for approximately 69% of its revenue.
18
FISCAL 2014 RESULTS
3.4.6. CEE
Revenue in our CEE segment was $1,063.5 million, an increase of $59.6 million or 5.9% over fiscal 2013. On a constant currency basis, revenue decreased by $35.2 million or 3.5%. The decrease in revenue was mostly due to lower work volumes due to the completion of projects within the telecommunication and utilities vertical market as well as the run-off of low margin business as previously described.
For fiscal 2014, revenue coming from the Netherlands and Germany accounted for 87% of this segment while CEE’s top two vertical markets were MRD and government, which together accounted for approximately 57% of its revenue.
3.4.7. Asia Pacific
Revenue in our Asia Pacific segment was $425.1 million, a decrease of $14.5 million or 3.3% over fiscal 2013. On a constant currency basis, revenue decreased by $13.9 million or 3.2%. The decrease in revenue was mainly due to the completion of projects within the Australian MRD vertical markets and the planned run-off of projects within the Middle East, partly offset by the increased use of our Asian delivery centers.
For the current year, Asia Pacific’s top two vertical markets were telecommunications & utilities and MRD, which together accounted for approximately 79% of its revenue.
3.5. OPERATING EXPENSES
| For the years ended September 30, | % of | % of | Change | |||||||||||||||||||||
| 2014 | Revenue | 2013 | Revenue | $ | % | |||||||||||||||||||
In thousands of CAD except for percentages | ||||||||||||||||||||||||
Costs of services, selling and administrative | 9,129,791 | 87.0% | 9,012,310 | 89.4% | 117,481 | 1.3 | % | |||||||||||||||||
Foreign exchange loss (gain) | 13,042 | 0.1% | (3,316 | ) | (0.0%) | 16,358 | (493.3 | )% | ||||||||||||||||
3.5.1. Costs of Services, Selling and Administrative
For the year ended September 30, 2014, costs of services, selling and administrative expenses amounted to $9,129.8 million, an increase of $117.5 million or 1.3% compared to fiscal 2013. The translation of the results of our foreign operations from their local currencies to the Canadian dollar unfavourably impacted costs by $650.4 million, substantially offsetting the favourable translation impact of $705.1 million on revenue. As a percentage of revenue, cost of services, selling and administrative expenses decreased from 89.4% to 87.0%, mainly due to the business synergies achieved through the ongoing integration of Logica.
Compared to fiscal 2013 our costs of services, as a percentage of revenue, remained relatively stable while our selling and administrative expenses decreased as a result of the business synergies achieved through the integration of Logica.
The majority of our costs are denominated in currencies other than the Canadian dollar. The risk of foreign exchange fluctuation impacting the results is substantially mitigated by a natural hedge in matching our costs with revenue denominated in the same currency. In certain cases where there is a substantial imbalance between the costs incurred and the revenue earned in a specific currency, the Company may enter into foreign exchange forward contracts to hedge cash flows.
3.5.2. Foreign Exchange Loss (gain)
The Company, in addition to its natural hedges, has a strategy in place to manage its exposure, to the extent possible, to exchange rate fluctuations through the effective use of derivatives. In fiscal 2014, the foreign exchange loss was mainly attributable to the higher volatility of the exchange rates in Q4 2014, causing losses in the settlement of day-to-day transactions.
19
Management’s Discussion and Analysis
3.6. ADJUSTED EBIT BY SEGMENT
| Change | ||||||||||||||||
| For the years ended September 30, | ||||||||||||||||
| 2014 | 2013 | $ | % | |||||||||||||
In thousands of CAD except for percentages | ||||||||||||||||
U.S. | 303,515 | 283,690 | 19,825 | 7.0% | ||||||||||||
As a percentage of U.S. revenue | 11.4% | 11.3% | ||||||||||||||
NSESA | 195,400 | 139,418 | 55,982 | 40.2% | ||||||||||||
As a percentage of NSESA revenue | 9.3% | 6.9% | ||||||||||||||
Canada | 361,136 | 320,306 | 40,830 | 12.7% | ||||||||||||
As a percentage of Canada revenue | 22.0% | 19.0% | ||||||||||||||
France | 155,695 | 109,760 | 45,935 | 41.9% | ||||||||||||
As a percentage of France revenue | 11.7% | 8.6% | ||||||||||||||
U.K. | 164,977 | 102,820 | 62,157 | 60.5% | ||||||||||||
As a percentage of U.K. revenue | 12.9% | 8.9% | ||||||||||||||
CEE | 107,977 | 67,341 | 40,636 | 60.3% | ||||||||||||
As a percentage of CEE revenue | 10.2% | 6.7% | ||||||||||||||
Asia Pacific | 68,159 | 52,295 | 15,864 | 30.3% | ||||||||||||
As a percentage of Asia Pacific revenue
|
| 16.0%
|
|
| 11.9%
|
| ||||||||||
Adjusted EBIT | 1,356,859 | 1,075,630 | 281,229 | 26.1% | ||||||||||||
Adjusted EBIT margin | 12.9% | 10.7% | ||||||||||||||
Adjusted EBIT for the year was $1,356.9 million, an increase of $281.2 million or 26.1% from the previous year, while the margin increased from 10.7% to 12.9% over the same period. The growth in adjusted EBIT and margin was primarily due to the benefits of the Logica integration program, which focused on resource utilization, profitable revenue and optimizing selling, general and administrative expenses. Adjusted EBIT from our European segments was $692.2 million or an adjusted EBIT margin of 11.2%, up from $471.6 million or 8.0% over the same period of fiscal 2013. Our North American segments contributed $664.7 million in fiscal 2014 compared to $604.0 million for fiscal 2013, or 15.4% of revenue compared to 14.4% over the same period.
Included in these results for fiscal 2014 is $62.1 million of non-recurring benefits related to the resolution of acquisition-related provisions. When excluding the benefits of the adjustments to the acquisition-related provisions, the fiscal 2014 adjusted EBIT for the European segments would have been $630.1 million or an adjusted EBIT margin of 10.2% up from $471.6 million or 8.0% from fiscal 2013.
These benefits came from the adjustment of provisions that were established as part of the purchase price allocation for the Logica acquisition. Subsequent to the finalization of the purchase price allocation such adjustments flow through the statement of earnings. To provide better visibility to our operating performance as well as to provide comparability to previous periods, these adjustments have been specifically segregated and disclosed. In addition, these benefits which are not the result of operating management’s daily activities are excluded from any compensation arrangements.
Examples of the items included in these benefits comprise the resolution of provisions on client contracts, the settlement of tax credits and the early termination of lease agreements.
20
FISCAL 2014 RESULTS
3.6.1. U.S.
Adjusted EBIT in the U.S. segment was $303.5 million for fiscal 2014, an increase of $19.8 million compared to fiscal 2013, while the margin increased from 11.3% to 11.4% over the same period. The increase in adjusted EBIT mainly came from the growth in revenue.
3.6.2. NSESA
Adjusted EBIT in the NSESA segment was $195.4 million for fiscal 2014, an increase of $56.0 million compared to fiscal 2013, while the margin increased from 6.9% to 9.3% over the same period. This increase in adjusted EBIT and margin was mainly the result of the cost synergies realized from the integration program, the implementation of the CGI Management Foundation, the run-off of low margin business as previously described as well as the positive impact coming from a $8.5 million settlement gain on a pension plan obligation. Included in the $56.0 million increase in adjusted EBIT was $15.0 million of non-recurring benefits related to the resolution of acquisition-related provisions mainly for the renegotiation of office leases and client contracts.
3.6.3. Canada
Adjusted EBIT in the Canada segment was $361.1 million for fiscal 2014, an increase of $40.8 million compared to fiscal 2013, while the margin increased from 19.0% to 22.0% over the same period. The improvement in adjusted EBIT and margin reflects the focus on the management of resource utilization over the fiscal year, the improved execution on in-flight projects and some further cost reduction from additional real estate optimization.
3.6.4. France
Adjusted EBIT in the France segment was $155.7 million for fiscal 2014, an increase of $45.9 million compared to fiscal 2013, while the margin increased from 8.6% to 11.7% over the same period. This increase in adjusted EBIT and margin was primarily the result of the cost synergies realized from the integration program, the implementation of the CGI Management Foundation and the run-off of low margin business. France’s adjusted EBIT was also positively impacted by $14.7 million, coming from the non-recurring benefits related to the resolution of acquisition-related provisions mainly for client contracts and the settlement of tax credits.
3.6.5. U.K.
Adjusted EBIT in the U.K. segment was $165.0 million for fiscal 2014, an increase of $62.2 million compared to fiscal 2013, while the margin increased from 8.9% to 12.9%. This increase in adjusted EBIT and margin was mainly the result of the cost synergies realized from the integration program, the implementation of the CGI Management Foundation and the benefits of running-off business that was not meeting our profitability standards. The U.K. adjusted EBIT for fiscal 2014 was also positively impacted by $17.1 million of non-recurring benefits related to the resolution of acquisition-related provisions mainly for the renegotiation of office leases and the settlement of tax credits.
3.6.6. CEE
Adjusted EBIT in the CEE segment was $108.0 million for fiscal 2014, an increase of $40.6 million compared to fiscal 2013, while the margin increased from 6.7% to 10.2% over the same period. This increase in adjusted EBIT and margin was primarily the result of the cost synergies realized from the integration program, the implementation of the CGI Management Foundation as well as the benefits of running-off business that was not meeting our profitability standards. In addition, our year-to-date adjusted EBIT was positively impacted by $14.3 million of non-recurring benefits related to the resolution of acquisition-related provisions mainly for client contracts.
3.6.7. Asia Pacific
Adjusted EBIT in the Asia Pacific segment was $68.2 million for fiscal 2014, an increase of $15.9 million compared to fiscal 2013, while the margin increased from 11.9% to 16.0% over the same period. This increase in adjusted EBIT and margin was mainly the result of the costs synergies realized from the integration program, the implementation of the CGI Management Foundation and the implementation of certain productivity improvements in the global delivery centers.
21
Management’s Discussion and Analysis
3.7. EARNINGS BEFORE INCOME TAXES
The following table provides a reconciliation between our adjusted EBIT and earnings before income taxes, which is reported in accordance with IFRS.
For the years ended September 30, | Change | |||||||||||||||||||||||
| 2014 | % of Revenue | 2013 | % of Revenue | $ | % | |||||||||||||||||||
In thousands of CAD except for percentages | ||||||||||||||||||||||||
Adjusted EBIT | 1,356,859 | 12.9% | 1,075,630 | 10.7% | 281,229 | 26.1% | ||||||||||||||||||
Minus the following items: | ||||||||||||||||||||||||
Integration-related costs | 127,341 | 1.2% | 338,439 | 3.4% | (211,098 | ) | (62.4% | ) | ||||||||||||||||
Finance costs | 101,278 | 1.0% | 113,931 | 1.1% | (12,653 | ) | (11.1% | ) | ||||||||||||||||
Finance income | (2,010 | ) | (0.0% | ) | (4,362 | ) | (0.0% | ) | 2,352 | (53.9% | ) | |||||||||||||
Earnings before income taxes | 1,130,250 | 10.8% | 627,622 | 6.2% | 502,628 | 80.1% | ||||||||||||||||||
3.7.1. Integration-Related Costs
For the years ended September 30, 2014 and 2013 the Company incurred $127.3 million and $338.4 million respectively of integration-related costs. These costs pertain to the restructuring and transformation of Logica’s operations to the CGI operating model.
3.7.2. Finance Costs
Finance costs mainly include the interest on our long-term debt used to finance the Logica acquisition. The decrease in finance costs for the year ended September 30, 2014 mainly came as a result of the repayments made on our outstanding long-term debt.
3.7.3. Finance Income
Finance income includes interest and other investment income related to cash balances, investments, and tax assessments.
22
FISCAL 2014 RESULTS
3.8. NET EARNINGS AND EARNINGS PER SHARE
The following table sets out the information supporting the earnings per share calculations:
For the years ended September 30, | Change
| |||||||||||||||
2014
| 2013
| $
| %
| |||||||||||||
In thousands of CAD except for percentages | ||||||||||||||||
Earnings before income taxes | 1,130,250 | 627,622 | 502,628 | 80.1% | ||||||||||||
Income tax expense | 270,807 | 171,802 | 99,005 | 57.6% | ||||||||||||
Effective tax rate | 24.0% | 27.4% | ||||||||||||||
Net earnings | 859,443 | 455,820 | 403,623 | 88.5% | ||||||||||||
Net earnings margin | 8.2% | 4.5% | ||||||||||||||
Weighted average number of shares outstanding | ||||||||||||||||
Class A subordinate shares and Class B shares (basic) | 308,743,126 | 307,900,034 | 0.3% | |||||||||||||
Class A subordinate shares and Class B shares (diluted) | 318,927,737 | 316,974,179 | 0.6% | |||||||||||||
Earnings per share (in dollars) | ||||||||||||||||
Basic EPS | 2.78 | 1.48 | 1.30 | 87.8% | ||||||||||||
Diluted EPS
|
| 2.69
|
|
| 1.44
|
|
| 1.25
|
|
| 86.8%
|
| ||||
3.8.1. Income Tax Expense
For the year ended September 30, 2014, the income tax expense was $270.8 million, an increase of $99.0 million compared to $171.8 million in fiscal 2013, while our effective tax rate decreased from 27.4% to 24.0%. The increase in income tax expense was mainly due to the higher earnings before income taxes. The decrease in the income tax rate for fiscal 2014 was due to favourable tax adjustments of $11.9 million mainly resulting from the settlement of tax liabilities from the legacy Logica European operations. The decrease in the income tax rate for fiscal 2014 was also attributable to net unfavorable tax adjustments of $11.1 million in fiscal 2013 which were comprised of a $18.4 million expense resulting from the revaluation of deferred tax assets following the enactment of a future rate reduction in the U.K., of taxes paid on the repatriation of funds from the legacy Logica Indian operations of $7.6 million partly offset by a favorable adjustment of $14.9 million in the U.S. resulting from the expiration of a statute of limitation period.
The table on page 24 shows the year-over-year comparison of the tax rate with the impact of integration-related costs, tax adjustments and benefits related to the resolution of acquisition-related provisions removed.
Based on the enacted rates at the end of fiscal 2014 and our current business mix, we expect our effective tax rate before any significant adjustments to be in the range of 25% to 27% in subsequent periods.
3.8.2. Weighted Average Number of Shares
For fiscal 2014, CGI’s basic and diluted weighted average number of shares increased compared to fiscal 2013 due to the issuance of Class A subordinate shares upon the exercise of stock options, partly offset by the repurchase of 2,837,360 Class A subordinate shares. During the year, 4,999,544 options were exercised.
23
Management’s Discussion and Analysis
3.8.3. Net Earnings and Earnings per Share Prior to Specific Items
Below is a table showing the year-over-year comparison prior to specific items such as the integration-related costs, favourable tax adjustments and benefits related to the resolution of acquisition-related provisions:
| Change | ||||||||||||||||
| For the years ended September 30, | ||||||||||||||||
| 2014 | 2013 | $ | % | |||||||||||||
In thousands of CAD except for percentages | ||||||||||||||||
Earnings before income taxes | 1,130,250 | 627,622 | 502,628 | 80.1% | ||||||||||||
Add back: | ||||||||||||||||
Integration-related costs | 127,341 | 338,439 | (211,098 | ) | (62.4%) | |||||||||||
Remove: | ||||||||||||||||
Resolution of acquisition-related provisions1 | 62,075 | — | 62,075 | — | ||||||||||||
Earnings before income taxes prior to specific items | 1,195,516 | 966,061 | 229,455 | 23.8% | ||||||||||||
Margin | 11.4% | 9.6% | ||||||||||||||
Income tax expense | 270,807 | 171,802 | 99,005 | 57.6% | ||||||||||||
Add back: | ||||||||||||||||
Tax adjustments2 | 11,900 | (11,113 | ) | 23,013 | (207.1%) | |||||||||||
Tax deduction on integration-related costs | 29,430 | 77,707 | (48,277 | ) | (62.1%) | |||||||||||
Remove: | ||||||||||||||||
Income taxes on the resolution of acquisition-related provisions | 10,097 | — | 10,097 | — | ||||||||||||
Income tax expense prior to specific items | 302,040 | 238,396 | 63,644 | 26.7% | ||||||||||||
Effective tax rate prior to specific items | 25.3% | 24.7% | ||||||||||||||
Net earnings prior to specific items | 893,476 | 727,665 | 165,811 | 22.8% | ||||||||||||
Net earnings margin | 8.5% | 7.2% | ||||||||||||||
Weighted average number of shares outstanding | ||||||||||||||||
Class A subordinate shares and Class B shares (basic) | 308,743,126 | 307,900,034 | 0.3% | |||||||||||||
Class A subordinate shares and Class B shares (diluted) | 318,927,737 | 316,974,179 | 0.6% | |||||||||||||
Earnings per share prior to specific items (in dollars) | ||||||||||||||||
Basic EPS | 2.89 | 2.36 | 0.53 | 22.5% | ||||||||||||
Diluted EPS
|
| 2.80
|
|
| 2.30
|
|
| 0.50
|
|
| 21.7%
|
| ||||
| 1 | The resolution of acquisition-related provisions is discussed on page 20. |
| 2 | The tax adjustments are discussed on page 23. |
24
FISCAL 2014 RESULTS
| 4. | Liquidity |
4.1. CONSOLIDATED STATEMENTS OF CASH FLOWS
CGI’s growth is financed through a combination of our cash flow from operations, borrowing under our existing credit facilities, the issuance of long-term debt, and the issuance of equity. One of our financial priorities is to maintain an optimal level of liquidity through the active management of our assets and liabilities as well as our cash flows.
As at September 30, 2014, cash and cash equivalents were $535.7 million. The following table provides a summary of the generation and use of cash for the years ended September 30, 2014 and 2013.
For the years ended September 30,
|
2014
|
2013
|
Change
| |||||||||
In thousands of CAD | ||||||||||||
Cash provided by operating activities | 1,174,835 | 671,257 | 503,578 | |||||||||
Cash used in investing activities | (321,153) | (233,855) | (87,298) | |||||||||
Cash used in financing activities | (414,064) | (445,971) | 31,907 | |||||||||
Effect of foreign exchange rate changes on cash and cash equivalents
|
| (10,102)
|
|
| 1,665
|
|
| (11,767)
|
| |||
Net increase (decrease) in cash and cash equivalents
|
|
429,516
|
|
|
(6,904)
|
|
|
436,420
|
| |||
4.1.1. Cash Provided by Operating Activities
For the years ended September 30, 2014, and 2013, cash provided by operating activities was $1,174.8 million compared to $671.3 million, or 11.2% of revenue compared to 6.7% last year. The increase was mainly due to the ongoing improvement in profitability as a result of the integration program being realized and the implementation of the CGI Management Foundation in the European operations. The year-over-year reduction of the integration-related payments in fiscal 2014 also contributed to the increase in cash provided by operating activities. The timing of our working capital inflows and outflows will always have an impact on the cash flow from operations. Excluding the integration-related cash disbursements, the cash provided by operating activities would have been $1,332.8 million in fiscal 2014, representing 12.7% of revenue compared to $977.7 million or 9.7% of revenue last year.
The following table provides a summary of the generation and use of cash from operating activities.
For the years ended September 30,
|
2014
|
2013
|
Change
| |||||||||
In thousands of CAD | ||||||||||||
Net earnings | 859,443 | 455,820 | 403,623 | |||||||||
Amortization and depreciation | 444,232 | 435,944 | 8,288 | |||||||||
Other adjustments1 | 103,827 | 61,049 | 42,778 | |||||||||
Cash flow from operating activities before net change in non-cash working capital items | 1,407,502 | 952,813 | 454,689 | |||||||||
Net change in non-cash working capital items: | ||||||||||||
Accounts receivable, work in progress and deferred revenue | 209,189 | (52,830) | 262,019 | |||||||||
Accounts payable and accrued liabilities, accrued compensation, provisions and | (463,685) | (233,631) | (230,054) | |||||||||
Other2 | 21,829 | 4,905 | 16,924 | |||||||||
Net change in non-cash working capital items
|
| (232,667)
|
|
| (281,556)
|
|
| 48,889
|
| |||
Cash provided by operating activities
|
|
1,174,835
|
|
|
671,257
|
|
|
503,578
|
| |||
| 1 | Other adjustments are comprised of deferred income taxes, foreign exchange loss (gain) and share-based payment costs. |
| 2 | Comprised of prepaid expenses and other assets, long-term financial assets, retirement benefits obligations, derivative financial instruments and income taxes. |
25
Management’s Discussion and Analysis
For the current year, the Company’s net earnings increased by $403.6 million when compared to fiscal 2013. The increase in net earnings was primarily due to the reduction in integration-related costs, the result of the cost synergies realized as part of the Logica integration program and the implementation of the CGI Management Foundation in the European operations.
The $42.8 million increase coming from the other adjustments was due to the higher deferred income taxes expense as a result of the utilization of previously recognized tax losses due to the increased profitability of our European operations and to the higher volatility of the foreign exchange rates, causing losses in the settlement of day-to-day transactions.
For fiscal 2014, the $209.2 million of cash coming from the accounts receivable, work in progress and deferred revenue was mainly due to a decrease of 6 days in our DSO from 49 days in fiscal 2013 to 43 days this year.
The $52.8 million of cash used in fiscal 2013 for the accounts receivable, work in progress and deferred revenue was mainly the result of the timing of billing milestones on certain large U.S. contracts.
For the current year, the $463.7 million used in cash for the accounts payable and accrued liabilities, accrued compensation, provisions and other long-term liabilities was mostly due to the utilization of $102.6 million for the provision for estimated losses on revenue-generating contracts, the net decrease of $65.0 million for performance-based compensation accruals to our members, the net utilization of $53.7 million for provisions for onerous leases, the net decrease of $35.7 million for provisions for litigation and claims mainly driven by the reversal of unused amounts due to the favorable settlement of claims and finally from the net payments of $30.7 million for integration-related items.
The $233.6 million of cash used in fiscal 2013 for the accounts payable and accrued liabilities, accrued compensation, provisions and other long-term liabilities was due to the utilization of $94.0 million for the estimated losses on revenue-generating contracts, payments of $37.9 million in regards to the legacy Logica restructuring program, payments in connection with the settlement of inherited claims for $31.3 million, payments of $27.0 million for acquisition-related items, partly offset by the net increase of $32.0 million in integration-related provisions. To a lesser extent, the decrease in accounts payable and accrued liabilities came from the transition and transformation of our business practices related to the acquired Logica operations in areas such as the reduction of subcontractors and the implementation of spend management practices.
The following table provides a summary of the movements in the integration-related provision:
For the years ended September 30,
| 2014 | 2013 | ||||||
In millions of CAD
| ||||||||
Integration-related provision at the beginning of the year | 135.8 | 101.9 | ||||||
Integration-related expenses |
|
127.3 |
|
|
338.4 |
| ||
Integration-related payments
|
| (158.0)
|
|
| (306.4)
|
| ||
Net impact on non-cash working capital | (30.7) | 32.0 | ||||||
Plus:FX impact1 | 0.5 | 9.1 | ||||||
Minus:Non-cash integration-related costs
|
| —
|
|
| 7.2
|
| ||
Integration-related provision at the end of the year
|
|
105.6
|
|
|
135.8
|
| ||
| 1 | The foreign currency translation was recorded in other comprehensive income. |
26
FISCAL 2014 RESULTS
4.1.2. Cash Used in Investing Activities
For the years ended September 30, 2014, and 2013, $321.2 million were used in investing activities compared to $233.9 million respectively. The following table provides a summary of the generation and use of cash from investing activities.
For the years ended September 30,
| 2014 | 2013 | Change | |||||||||
In thousands of CAD | ||||||||||||
Business acquisition | — | (5,140 | ) | 5,140 | ||||||||
Proceeds from sale of property, plant and equipment | 13,673 | — | 13,673 | |||||||||
Purchase of property, plant and equipment | (181,471 | ) | (141,965 | ) | (39,506 | ) | ||||||
Additions to contract costs | (73,900 | ) | (31,207 | ) | (42,693 | ) | ||||||
Additions to intangible assets | (77,726 | ) | (71,447 | ) | (6,279 | ) | ||||||
Net change in short-term investments and (purchase) proceeds from sale of long-term investments | (8,106 | ) | 7,727 | (15,833 | ) | |||||||
Payments received from long-term receivable | 6,377 | 8,177 | (1,800 | ) | ||||||||
Cash used in investing activities
|
| (321,153
| )
|
| (233,855
| )
|
| (87,298
| )
| |||
For the current year, we invested $333.1 million in the purchase of property, plant and equipment, the additions of intangible assets and contract costs compared to $244.6 million last year or an increase of $88.5 million which was mostly driven by the ramp-up of new long term contracts.
4.1.3. Cash Used in Financing Activities
For the year ended September 30, 2014, $414.1 million was used in financing activities compared to $446.0 million in fiscal 2013. The following table provides a summary of the generation and use of cash from financing activities.
For the years ended September 30,
| 2014 | 2013 | Change | |||||||||
In thousands of CAD | ||||||||||||
Net change in unsecured committed revolving credit facility | (283,049 | ) | (467,027 | ) | 183,978 | |||||||
Net change in long-term debt | (25,343 | ) | 12,276 | (37,619 | ) | |||||||
| (308,392 | ) | (454,751 | ) | 146,359 | ||||||||
Settlement of derivative financial instruments | (37,716 | ) | — | (37,716 | ) | |||||||
Purchase of Class A subordinate shares held in trust | (23,016 | ) | (7,663 | ) | (15,353 | ) | ||||||
Resale of Class A subordinate shares held in trust | 1,390 | — | 1,390 | |||||||||
Repurchase of Class A subordinate shares | (111,468 | ) | (22,869 | ) | (88,599 | ) | ||||||
Issuance of Class A subordinate shares | 65,138 | 39,312 | 25,826 | |||||||||
Cash used in financing activities
|
| (414,064
| )
|
| (445,971
| )
|
| 31,907
|
| |||
During 2014, the Company repaid the first maturing tranche of the term loan credit facility of $486.7 million using the proceeds from the credit facilities. The Company also entered into a $955 million debt private placement comprised of four tranches of Senior U.S. unsecured notes for US$745 million, and one tranche of Senior euro unsecured note for€85 million, with a weighted average maturity of 7.9 years and a weighted average fixed coupon of 3.62%. The Company used the proceeds of the issuance of the new private placement notes to repay the May 2015 maturing tranche of the term loan credit facility of $494.7 million and the outstanding balance of the credit facilities. Following these repayments, the Company used $37.7 million to settle the related floating-to-fixed interest rate swap contracts and the related cross-currency swap contract. During the year, we reduced our long-term debt by $308.4 million while in fiscal 2013, we made net payments of $454.8 million.
For 2014, we repurchased 2,837,360 Class A subordinate shares for $111.5 million under the annual aggregate limit of the previous NCIB, while for fiscal 2013, $22.9 million was used to purchase 723,100 Class A subordinate shares under the NCIB then in effect.
27
Management’s Discussion and Analysis
For fiscal 2014, a net amount of $21.6 million was used to purchase CGI shares under the Company’s Performance Share Unit Plan (the “PSU” Plan) which is part of the compensation package of certain senior executive officers, while for the comparable period of last year, $7.7 million was used to purchase shares under the PSU Plan.
For 2014, we received $65.1 million in proceeds from the exercise of stock options, compared to $39.3 million in fiscal 2013.
4.1.4. Effect of Foreign Exchange Rate Changes on Cash and Cash Equivalents
For fiscal 2014, we had a $10.1 million decrease in cash coming from the effect of foreign exchange rate changes on cash and cash equivalents, while for fiscal 2013 we had a $1.7 million increase. These amounts had no effect on net earnings as they were recorded in other comprehensive income.
4.2. CAPITAL RESOURCES
| In thousands of CAD | Total commitment | Available at September 30, 2014 | Outstanding at September 30, 2014 | |||||||||
Cash and cash equivalents | — | 535,715 | — | |||||||||
Long-term investments | — | 30,689 | — | |||||||||
Unsecured committed revolving facilitiesa | 1,500,000 | 1,463,280 | 36,720 | |||||||||
Total | 1,500,000 | 2,029,684 | 36,720 | |||||||||
a Consists of Letters of Credit for $36.7 million outstanding on September 30, 2014.
Our cash position and bank lines are sufficient to support our growth strategy. At September 30, 2014, cash and cash equivalents and long-term marketable investments represented $566.4 million.
Cash equivalents typically include term deposits, all with maturities of 90 days or less. Long-term marketable investments include corporate and government bonds with maturities ranging from one to five years, rated “A” or higher.
The amount of capital readily available was $2,029.7 million. The long-term debt agreements contain covenants which require us to maintain certain financial ratios. At September 30, 2014, CGI was in compliance with these covenants.
Total debt decreased by $186.8 million to $2,679.7 million at September 30, 2014, compared to $2,866.6 million at September 30, 2013. The variation was mainly due to the reimbursement of $281.2 million and $981.5 million under the unsecured revolving credit facility and term loan credit facility respectively partially offset by the proceeds of a private placement of US $745 million and EUR85 million for a total of $955 million and an unrealized loss of $87.1 million on foreign exchange translation.
In the first quarter of 2014, the unsecured committed revolving credit facility of $1,500.0 million was extended by one year to December 2017. On July 25, 2014, the facility was further extended by another year to December 2018 and can be further extended annually. All terms and conditions including interest rates and banking covenants remain unchanged.
As at September 30, 2014, CGI had a positive working capital1 of $89.4 million. The Company has also $1.5 billion available under its unsecured committed revolving facility and is generating a significant level of cash that will allow it to fund its operations and further decrease the amount of debt outstanding in the foreseeable future while maintaining adequate levels of liquidity.
| 1 | Working capital is defined as total current assets minus total current liabilities. |
28
FISCAL 2014 RESULTS
4.3. CONTRACTUAL OBLIGATIONS
We are committed under the terms of contractual obligations with various expiration dates, primarily for the rental of premises, computer equipment used in outsourcing contracts and long-term service agreements. For the year ended September 30, 2014, the Company decreased its commitments by $130.4 million due to real estate optimization, the renegotiation of office leases and the reduction of the long-term debt taken on to acquire Logica in fiscal 2012. These were partly offset by the increase in estimated interest on our long-term debt as a result of the new debt private placement and from the new long-term service agreements signed during the year.
| Commitment type |
Total
|
Less than 1
|
2nd and 3rd
|
4th and 5th
|
After 5
| |||||||||||||||
In thousands of CAD | ||||||||||||||||||||
Long-term debt | 2,632,873 | 48,048 | 1,162,658 | 337,010 | 1,085,157 | |||||||||||||||
Estimated interests on long-term debt | 477,658 | 89,709 | 137,788 | 105,742 | 144,419 | |||||||||||||||
Finance lease obligations | 61,698 | 32,319 | 28,506 | 873 | — | |||||||||||||||
Estimated interests on finance lease obligations | 2,699 | 1,494 | 1,184 | 21 | — | |||||||||||||||
Operating leases | ||||||||||||||||||||
Rental of office space | 1,287,438 | 278,159 | 459,651 | 326,096 | 223,532 | |||||||||||||||
Computer equipment | 42,153 | 21,349 | 17,223 | 3,427 | 154 | |||||||||||||||
Automobiles | 84,091 | 36,862 | 33,250 | 10,151 | 3,828 | |||||||||||||||
Long-term service agreements and other | 190,083 | 74,291 | 92,875 | 22,917 | — | |||||||||||||||
Total contractual obligations | 4,778,693 | 582,231 | 1,933,135 | 806,237 | 1,457,090 | |||||||||||||||
Our required benefit plan contributions have not been included in this table as such contributions depend on periodic actuarial valuations for funding purposes. Our contributions to defined benefit plans are estimated at $20.1 million for fiscal 2015 as described in note 17 to the financial statements.
4.4. FINANCIAL INSTRUMENTS AND HEDGING TRANSACTIONS
We use various financial instruments to manage our exposure to fluctuations of foreign currency exchange rates and interest rates. We do not hold or use any derivative instruments for trading purposes. Foreign exchange translation gains or losses on the net investments and the effective portions of gains or losses on instruments hedging the net investments are recorded in the consolidated statement of comprehensive income. Any realized or unrealized gains or losses on instruments covering the U.S. denominated debt are also recognized in the consolidated statement of comprehensive income.
We have the following outstanding derivative financial instruments:
Hedges on net investments in foreign operations
— $968.8 million cross-currency swaps in Euro designated as a hedging instrument of the Company’s net investment in European operations ($1,153.7 million as at September 30, 2013)
Cash flow hedges on future revenue
— U.S.$32.0 million foreign currency forward contracts to hedge the variability in the expected foreign currency exchange rate between the U.S. dollar and the Canadian dollar (U.S.$56.8 million as at September 30, 2013)
— U.S.$75.2 million foreign currency forward contracts to hedge the variability in the expected foreign currency exchange rate between the U.S. dollar and the Indian rupee (U.S.$94.4 million as at September 30, 2013)
— $94.6 million foreign currency forward contracts to hedge the variability in the expected foreign currency exchange rate between the Canadian dollar and the Indian rupee ($142.5 million as at September 30, 2013)
— Kr142.6 million foreign currency forward contracts to hedge the variability in the expected foreign currency exchange rate between the Swedish krona and the Indian rupee (kr nil as at September 30, 2013)
29
Management’s Discussion and Analysis
—€121.1 million foreign currency forward contracts to hedge the variability in the expected foreign currency rate between the euro and the British pound (€ nil as at September 30, 2013)
—€15.0 million foreign currency forward contracts to hedge the variability in the expected foreign currency exchange rate between the euro and the Swedish krona (€31.0 million as at September 30, 2013)
Cash flow hedges on unsecured committed term loan credit facility
— $484.4 million interest rate swaps floating-to-fixed ($1,234.4 million as at September 30, 2013)
Fair value hedges on Senior U.S. unsecured notes
— U.S.$250.0 million interest rate swaps fixed-to-floating (U.S.$250.0 million as at September 30, 2013)
Derivatives not designated as hedges
The Company does not have any derivatives not designated as hedges as at September 30, 2014.
The effective portion of the change in the fair value of the derivative instruments is recognized in other comprehensive income and the ineffective portion, if any, in net earnings. During the year ended September 30, 2014, the Company’s hedging relationships were effective.
The Company expects that approximately $4.9 million of the accumulated net gain on all derivative financial instruments designated as cash flow hedges as at September 30, 2014 will be reclassified in the consolidated statements of earnings in the next 12 months.
4.5. SELECTED MEASURES OF LIQUIDITY AND CAPITAL RESOURCES
As at September 30,
|
2014
|
2013
| ||||||
In thousands of CAD except for percentages
| ||||||||
Reconciliation between net debt and long-term debt including the current portion:
| ||||||||
Net debt
|
| 2,113,299
|
|
| 2,739,949
|
| ||
Add back:
| ||||||||
Cash and cash equivalents
|
| 535,715
|
|
| 106,199
|
| ||
Short-term investments
|
| —
|
|
| 69
|
| ||
Long-term investments
|
| 30,689
|
|
| 20,333
|
| ||
Long-term debt including the current portion | 2,679,703 | 2,866,550 | ||||||
Net debt to capitalization ratio
|
| 27.6%
|
|
| 39.6%
|
| ||
Return on equity
|
| 18.8%
|
|
| 12.3%
|
| ||
Return on invested capital
|
| 14.5%
|
|
| 11.8%
|
| ||
Days sales outstanding (in days)
|
| 43
|
|
| 49
|
| ||
We use the net debt to capitalization ratio as an indication of our financial leverage in order to pursue any large outsourcing contracts, expand global delivery centers, or make acquisitions. On August 20, 2012, we acquired Logica using a combination of debt and stock, causing our net debt to capitalization ratio to increase significantly. At the end of fiscal 2012, our net debt to capitalization ratio was 46.5%, while subsequent repayments resulted in a ratio of 39.6% for fiscal 2013. The net debt to capitalization ratio decreased further to 27.6% for fiscal 2014 due to the increase in equity mainly driven by the net earnings and the net debt repayments as a result of the improved cash generation.
Return on equity is a measure of the return we are generating for our shareholders. ROE increased from 12.3% in fiscal 2013 to 18.8% in fiscal 2014. The increase was mainly due to the higher net earnings over the last four quarters as the benefits of the integration of Logica with CGI were being realized.
30
FISCAL 2014 RESULTS
ROIC is a measure of the Company’s efficiency in allocating the capital under our control to profitable investments. The return on invested capital was 14.5% as at September 30, 2014, compared to 11.8% a year ago. The improvement in the ROIC was mainly the result of our higher after-tax adjusted EBIT compared to last year as the benefits of the integration of Logica with CGI were being realized.
DSO decreased from 49 days as at September 30, 2013 to 43 days at the end of fiscal 2014. In calculating the DSO, we subtract the deferred revenue balance from trade accounts receivable and work in progress; for that reason, the timing of payments received from outsourcing clients in advance of the work to be performed and the timing of payments related to project milestones can affect the DSO fluctuations. We remain committed to manage our DSO within our 45 day target or less.
4.6. OFF-BALANCE SHEET FINANCING AND GUARANTEES
CGI engages in the practice of off-balance sheet financing in the normal course of operations for a variety of transactions such as operating leases for office space, computer equipment and vehicles as well as accounts receivable factoring. From time to time, we also enter into agreements to provide financial or performance assurances to third parties on the sale of assets, business divestitures, guarantees and U.S. Government contracts.
In connection with sales of assets and business divestitures, we may be required to pay counterparties for costs and losses incurred as the result of breaches in representations and warranties, intellectual property right infringement and litigation against counterparties. While some of the agreements specify a maximum potential exposure totalling $10.4 million, others do not specify a maximum amount or limited period. It is impossible to reasonably estimate the maximum amount that may have to be paid under such guarantees. The amounts are dependent upon the outcome of future contingent events, the nature and likelihood of which cannot be determined at this time. The Company does not expect to incur any potential payment in connection with these guarantees that could have a materially adverse effect on its consolidated financial statements.
We are also engaged to provide services under contracts with the U.S. Government. The contracts are subject to extensive legal and regulatory requirements and, from time to time, agencies of the U.S. Government investigate whether our operations are being conducted in accordance with these requirements. Generally, the Government has the right to change the scope of, or terminate, these projects at its convenience. The termination or a reduction in the scope of a major government project could have a material adverse effect on our results of operations and financial condition.
In the normal course of business, we may provide certain clients, principally governmental entities, with bid and performance bonds. In general, we would only be liable for the amount of the bid bonds if we refuse to perform the project once the bid is awarded. We would also be liable for the performance bonds in the event of default in the performance of our obligations. As at September 30, 2014, we had committed for a total of $55.9 million for these bonds. To the best of our knowledge, we complied with our performance obligations under all service contracts for which there was a performance or bid bond, and the ultimate liability, if any, incurred in connection with these guarantees would not have a material adverse effect on our consolidated results of operations or financial condition.
4.7. CAPABILITY TO DELIVER RESULTS
Sufficient capital resources and liquidity are required for supporting ongoing business operations and to execute our build and buy growth strategy. The Company has sufficient capital resources coming from the cash generated from operations, credit facilities, long-term debt agreements and invested capital from shareholders. Our principal uses of cash are for procuring new large outsourcing and managed services contracts; investing in our business solutions; pursuing accretive acquisitions; buying back CGI shares and paying down debt. Funds were also used to expand our global delivery network as more and more of our clients demand lower cost alternatives. In terms of financing, we are well positioned to continue executing our four-pillar growth strategy in fiscal 2015.
Strong and experienced leadership is essential to successfully implement our corporate strategy. CGI has a strong leadership team with members who are highly knowledgeable and have gained a significant amount of experience within the IT industry via various career paths and leadership roles. CGI fosters leadership development to ensure a continuous flow of knowledge and strength is maintained throughout the organization. As part of our succession planning in key positions, we established the Leadership Institute, our own corporate university, to develop leadership, technical and managerial skills inspired by CGI’s roots and traditions.
31
Management’s Discussion and Analysis
As a Company built on human capital, our professionals and their knowledge are critical to delivering quality service to our clients. Our human resources program provides competitive compensation and benefits, a favourable working environment, and our training and career development programs combine to allow us to attract and retain the best talent. Employee satisfaction is monitored regularly through a Company-wide survey and issues are addressed immediately. Approximately 45,000 of our members or 70% were also owners of CGI through our Share Purchase Plan. The Share Purchase Plan, along with the Profit Participation Program, allows members to share in the success of the Company and aligns member objectives with our strategic goals.
In addition to our capital resources and the talent of our human capital, CGI has established a Management Foundation encompassing governance policies, sophisticated management frameworks and an organizational model for its business units and corporate processes. This foundation, along with our appropriate internal systems, helps in providing a disciplined high standard of quality service to our clients across all of our operations, and additional value to our stakeholders. CGI’s operations maintain appropriate certifications in accordance with service requirements such as the ISO and Capability Maturity Model Integration quality programs.
32
FISCAL 2014 RESULTS
| 5. | Fourth Quarter Results |
5.1. FOREIGN EXCHANGE
The Company operates globally and is exposed to changes in foreign currency rates. We report all dollar amounts in Canadian dollars. Accordingly, we value assets, liabilities and transactions that are measured in foreign currencies using various exchange rates as prescribed by IFRS.
Average foreign exchange rates
For the three months ended September 30,
|
2014
|
2013
|
Change
| |||||||||
U.S. dollar | 1.0894 | 1.0385 | 4.9% | |||||||||
Euro | 1.4427 | 1.3762 | 4.8% | |||||||||
Indian rupee | 0.0180 | 0.0167 | 7.8% | |||||||||
British pound | 1.8175 | 1.6117 | 12.8% | |||||||||
Swedish krona | 0.1568 | 0.1586 | (1.1% | ) | ||||||||
Australian dollar | 1.0070 | 0.9517 | 5.8% | |||||||||
33
Management’s Discussion and Analysis
5.2. REVENUE VARIATION AND REVENUE BY SEGMENT
The following table provides a summary of the year-over-year changes in our revenue, in total and by segment, separately showing the impacts of foreign currency exchange rate variations between the Q4 2014 and Q4 2013 periods. The Q4 2013 revenue by segment was recorded reflecting the actual average foreign exchange rates for that period. The foreign exchange impact is the difference between the current period’s actual results and the current period’s results converted with the prior year’s average foreign exchange rates.
| Change | ||||||||||||||||
| For the three months ended September 30, | ||||||||||||||||
2014
| 2013
| $
| %
| |||||||||||||
In thousands of CAD except for percentages | ||||||||||||||||
Total CGI revenue | 2,483,669 | 2,458,207 | 25,462 | 1.0% | ||||||||||||
Variation prior to foreign currency impact | (3.4%) | |||||||||||||||
Foreign currency impact | 4.4% | |||||||||||||||
Variation over previous period | 1.0% | |||||||||||||||
U.S. | ||||||||||||||||
Revenue prior to foreign currency impact | 623,231 | 679,255 | (56,024) | (8.2%) | ||||||||||||
Foreign currency impact | 31,864 | |||||||||||||||
U.S. revenue | 655,095 | 679,255 | (24,160) | (3.6%) | ||||||||||||
NSESA | ||||||||||||||||
Revenue prior to foreign currency impact | 438,278 | 436,905 | 1,373 | 0.3% | ||||||||||||
Foreign currency impact | 7,868 | |||||||||||||||
NSESA revenue | 446,146 | 436,905 | 9,241 | 2.1% | ||||||||||||
Canada | ||||||||||||||||
Revenue prior to foreign currency impact | 381,780 | 407,751 | (25,971) | (6.4%) | ||||||||||||
Foreign currency impact | 1,107 | |||||||||||||||
Canada revenue | 382,887 | 407,751 | (24,864) | (6.1%) | ||||||||||||
France | ||||||||||||||||
Revenue prior to foreign currency impact | 297,925 | 285,414 | 12,511 | 4.4% | ||||||||||||
Foreign currency impact | 14,074 | |||||||||||||||
France revenue | 311,999 | 285,414 | 26,585 | 9.3% | ||||||||||||
U.K. | ||||||||||||||||
Revenue prior to foreign currency impact | 282,821 | 304,334 | (21,513) | (7.1%) | ||||||||||||
Foreign currency impact | 38,861 | |||||||||||||||
U.K. revenue | 321,682 | 304,334 | 17,348 | 5.7% | ||||||||||||
CEE | ||||||||||||||||
Revenue prior to foreign currency impact | 243,803 | 245,683 | (1,880) | (0.8%) | ||||||||||||
Foreign currency impact | 11,008 | |||||||||||||||
CEE revenue | 254,811 | 245,683 | 9,128 | 3.7% | ||||||||||||
Asia Pacific | ||||||||||||||||
Revenue prior to foreign currency impact | 108,311 | 98,865 | 9,446 | 9.6% | ||||||||||||
Foreign currency impact | 2,738 | |||||||||||||||
Asia Pacific revenue | 111,049 | 98,865 | 12,184 | 12.3% | ||||||||||||
We ended the fourth quarter of fiscal 2014 with revenue of $2,483.7 million, an increase of $25.5 million or 1.0% over the same period of fiscal 2013. On a constant currency basis, revenue decreased by $82.1 million or 3.4%, as foreign currency rate fluctuations favourably impacted our revenue by $107.5 million or 4.4%. For the current quarter, the top two vertical
34
FISCAL 2014 RESULTS
markets were government and MRD, which together accounted for approximately 56% of our revenue. Compared to Q3 2014, revenue from the current quarter has decreased by $183.4 million, mainly due to the expected impact of the vacation period and the unfavourable impact of foreign currency rate fluctuations.
As part of the Company’s strategic focus to continuously improve its revenue quality, and as previously disclosed, we have been exiting low margin business as part of our integration activities. As a result, our quarterly year-over-year revenue has been reduced. Partially offsetting this, new higher quality revenue was booked or existing business expanded and/or extended across the geographies.
5.2.1. U.S.
Revenue in our U.S. segment was $655.1 million in Q4 2014, a decrease of $24.2 million or 3.6% compared to the same period of fiscal 2013. On a constant currency basis, revenue decreased by $56.0 million or 8.2%. The change in revenue reflects the ramp down of Federal and state health projects and the run-off of a large low margin government project partly offset by the increased sales of IP based business solutions.
For the current quarter, the top two U.S. vertical markets were government and health, which together accounted for approximately 77% of its revenue.
5.2.2. NSESA
Revenue from our NSESA segment was $446.1 million in Q4 2014, an increase of $9.2 million compared to the same period of fiscal 2013 while on a constant currency basis, revenue remained relatively stable.
For the current quarter, revenue coming from Sweden and Finland accounted for 73% of this segment while the NSESA’s top two vertical markets were MRD and financial services, which together accounted for approximately 55% of its revenue.
5.2.3. Canada
Revenue in our Canada segment for Q4 2014 was $382.9 million, a decrease of $24.9 million or 6.1% compared to the same period of fiscal 2013. On a constant currency basis, revenue decreased by $26.0 million or 6.4%. The revenue decrease was mainly due to lower work volumes as a result of the expiration of contracts that were partially offset by the start-up of new contracts.
For the current quarter, Canada’s top two vertical markets were financial services and telecommunication and utilities, which together accounted for approximately 57% of its revenue.
5.2.4. France
Revenue from our France segment was $312.0 million in Q4 2014, an increase of $26.6 million or 9.3% compared to the same period of fiscal 2013. On a constant currency basis, revenue increased by $12.5 million or 4.4%. The increase in revenue reflects the bookings in the previous quarters that are now coming on stream and the ramp up of existing engagements, primarily in the MRD and telecommunication & utilities vertical markets.
For the current quarter, France’s top two vertical markets were MRD and financial services, which together accounted for approximately 64% of its revenue.
5.2.5. U.K.
Revenue from our U.K. segment was $321.7 million in Q4 2014, an increase of $17.3 million or 5.7% compared to the same period of fiscal 2013. On a constant currency basis, revenue decreased by $21.5 million or 7.1%. The decrease in revenue mainly reflects the completion of projects within the MRD vertical market and to a lesser extent the run-off of low margin business.
For the current quarter, U.K.’s top two vertical markets were government and MRD, which together accounted for approximately 69% of its revenue.
35
Management’s Discussion and Analysis
5.2.6. CEE
Revenue from our CEE segment was $254.8 million in Q4 2014, an increase of $9.1 million or 3.7% compared to the same period of fiscal 2013 while on a constant currency basis, revenue remained relatively stable.
For the current quarter, revenue coming from the Netherlands and Germany accounted for 87% of this segment while CEE’s top two vertical markets were MRD and government, which together accounted for approximately 58% of its revenue.
5.2.7. Asia Pacific
Revenue from our Asia Pacific segment was $111.0 million in Q4 2014, an increase of $12.2 million or 12.3% compared to the same period of fiscal 2013. On a constant currency basis, revenue increased by $9.4 million or 9.6%. The change in revenue was mainly due to the increased use of our Asian delivery centers, partly offset by the completion of projects within the Australian MRD vertical markets and the planned run-off of projects within the Middle East.
For the current quarter, Asia Pacific’s top two vertical markets were telecommunications & utilities and MRD, which together accounted for approximately 78% of its revenue.
5.3. ADJUSTED EBIT BY SEGMENT
| For the three months ended September 30, | Change
| |||||||||||||||
2014
| 2013
| $
| %
| |||||||||||||
In thousands of CAD except for percentages | ||||||||||||||||
U.S. | 97,575 | 82,965 | 14,610 | 17.6 | % | |||||||||||
As a percentage of U.S. revenue | 14.9% | 12.2% | ||||||||||||||
NSESA | 33,539 | 43,526 | (9,987 | ) | (22.9 | %) | ||||||||||
As a percentage of NSESA revenue | 7.5% | 10.0% | ||||||||||||||
Canada | 87,060 | 80,419 | 6,641 | 8.3 | % | |||||||||||
As a percentage of Canada revenue | 22.7% | 19.7% | ||||||||||||||
France | 39,143 | 34,974 | 4,169 | 11.9 | % | |||||||||||
As a percentage of France revenue | 12.5% | 12.3% | ||||||||||||||
U.K. | 60,665 | 35,826 | 24,839 | 69.3 | % | |||||||||||
As a percentage of U.K. revenue | 18.9% | 11.8% | ||||||||||||||
CEE | 26,564 | 21,697 | 4,867 | 22.4 | % | |||||||||||
As a percentage of CEE revenue | 10.4% | 8.8% | ||||||||||||||
Asia Pacific | 25,678 | 13,985 | 11,693 | 83.6 | % | |||||||||||
As a percentage of Asia Pacific revenue
|
| 23.1%
|
|
| 14.1%
|
| ||||||||||
Adjusted EBIT | 370,224 | 313,392 | 56,832 | 18.1 | % | |||||||||||
Adjusted EBIT margin | 14.9% | 12.7% | ||||||||||||||
Adjusted EBIT for the quarter was $370.2 million, an increase of $56.8 million or 18.1% from Q4 2013, while the margin increased from 12.7% to 14.9% over the same period last year. The adjusted EBIT of our European segments was $185.6 million or a margin of 12.8%, up from $150.0 million or 10.9% from the same period of fiscal 2013. Our North American segments contributed $184.6 million in Q4 2014 compared to $163.4 million in Q4 2013, or a margin of 17.8% compared to the 15.0% margin last year.
Included in these results for the three months ended September 30, 2014 is $34.0 million of non-recurring benefits related to the adjustments of acquisition-related provisions. When excluding the benefits of the adjustments to the acquisition-related provisions, the Q4 2014 adjusted EBIT for the European segments was $151.6 million or an adjusted EBIT margin of 10.5% compared with $150.0 million or 10.9% from the same period of fiscal 2013.
36
FISCAL 2014 RESULTS
These benefits came from the resolution of provisions that were established as part of the purchase price allocation for the Logica acquisition. Subsequent to the finalization of the purchase price allocation such adjustments flow through the statement of earnings. To provide better visibility to our operating performance as well as to provide comparability to previous periods, these adjustments have been specifically segregated and disclosed. In addition, these benefits which are not the result of operating management’s daily activities are excluded from any compensation arrangements.
The items included in these benefits are similar to those described in section 3.6 of the present document.
5.3.1. U.S.
Adjusted EBIT in the U.S. segment was $97.6 million for Q4 2014, an increase of $14.6 million year-over-year, while the margin increased from 12.2% to 14.9%. The increase in adjusted EBIT and margin came primarily from additional sales of IP based solutions and the run-off of a large low margin government project.
5.3.2. NSESA
Adjusted EBIT in the NSESA segment was $33.5 million for Q4 2014, a decrease of $10.0 million year-over-year, while the margin decreased from 10.0% to 7.5%. The decrease in adjusted EBIT and margin primarily reflected the previous year’s positive impact from the reduction of the 2013 performance based compensation accruals in the amount of $16.0 million and, to a lesser extent, the result of the temporary lower utilization rates in Q4 2014 due to the timing of projects completion and the start-up of new contracts. The Q4 2014 adjusted EBIT was also positively impacted by $8.7 million coming from the non-recurring benefits related to the resolution of acquisition-related provisions mainly for the renegotiation of office leases and client contracts.
5.3.3. Canada
Adjusted EBIT in the Canada segment was $87.1 million for Q4 2014, an increase of $6.6 million year-over-year, while the margin increased from 19.7% to 22.7%. The improvement in adjusted EBIT and margin reflects the focus on the management of resource utilization and improved project execution.
5.3.4. France
Adjusted EBIT in the France segment was $39.1 million for Q4 2014, an increase of $4.2 million year-over-year, while the margin increased from 12.3% to 12.5%. This increase in adjusted EBIT and margin was primarily the result of a favorable impact of $7.6 million coming from the non-recurring benefits related to the resolution of acquisition-related provisions mainly for client contracts and the renegotiation of office leases, offset by the unfavorable impact of $4.3 million due to one less working day in Q4 2014.
5.3.5. U.K.
Adjusted EBIT in the U.K. segment was $60.7 million for Q4 2014, an increase of $24.8 million year-over-year, while the margin increased from 11.8% to 18.9%. This increase in adjusted EBIT and margin was mainly the result of the non-recurring benefits related to the resolution of acquisition-related provisions for $11.2 million mainly for the renegotiation of office leases, the additional tax credits on salaries of $4.9 million and to a lesser extent the costs synergies realized from the integration program and the implementation of the CGI Management Foundation.
5.3.6. CEE
Adjusted EBIT in the CEE segment was $26.6 million for Q4 2014, an increase of $4.9 million year-over-year, while the margin increased from 8.8% to 10.4%. This increase in adjusted EBIT and margin was primarily the result of the cost synergies realized from the integration program and the implementation of the CGI Management Foundation. The CEE adjusted EBIT and margin was also positively impacted by a $2.0 million impact coming from the non-recurring benefits related to the resolution of acquisition-related provisions mainly for client contracts and the renegotiation of office leases.
5.3.7. Asia Pacific
Adjusted EBIT in the Asia Pacific segment was $25.7 million for Q4 2014, an increase of $11.7 million year-over-year, while the margin increased from 14.1% to 23.1%. This increase in adjusted EBIT and margin was mainly the result of the costs synergies realized from the integration program and the implementation of the CGI Management Foundation as well as a $4.5 million favourable impact coming from the non-recurring benefits related to the resolution of acquisition-related provisions mainly for client contracts.
37
Management’s Discussion and Analysis
5.4. NET EARNINGS AND EARNINGS PER SHARE
The following table sets out the information supporting the earnings per share calculations:
| Change | ||||||||||||||||
For the three months ended September 30,
| 2014
| 2013
| $ | %
| ||||||||||||
In thousands of CAD except for percentages | ||||||||||||||||
Adjusted EBIT | 370,224 | 313,392 | 56,832 | 18.1% | ||||||||||||
Minus the following items: | ||||||||||||||||
Integration-related costs | 64,259 | 50,184 | 14,075 | 28.0% | ||||||||||||
Finance costs | 22,485 | 28,184 | (5,699 | ) | (20.2% | ) | ||||||||||
Finance expense (income)
|
| 302
|
|
| (576
| )
|
| 878
|
|
| (152.4%
| )
| ||||
Earnings before income taxes | 283,178 | 235,600 | 47,578 | 20.2% | ||||||||||||
Income tax expense | 69,470 | 94,578 | (25,108 | ) | (26.5% | ) | ||||||||||
Effective tax rate
|
| 24.5%
|
|
| 40.1%
|
|
| (38.9%
| )
| |||||||
Net earnings | 213,708 | 141,022 | 72,686 | 51.5% | ||||||||||||
Margin |
|
8.6% |
|
|
5.7% |
|
|
50.9% |
| |||||||
Weighted average number of shares | ||||||||||||||||
Class A subordinate shares and Class B shares (basic) | 310,320,352 | 309,046,350 | 0.4% | |||||||||||||
Class A subordinate shares and Class B shares (diluted) | 319,540,764 | 319,114,642 | 0.1% | |||||||||||||
Earnings per share (in dollars) | ||||||||||||||||
Basic EPS | 0.69 | 0.46 | 0.23 | 50.0% | ||||||||||||
Diluted EPS
|
| 0.67
|
|
| 0.44
|
|
| 0.23
|
|
| 52.3%
|
| ||||
For the current quarter, the $47.6 million increase in earnings before income taxes was mainly coming from the $56.8 million increase in adjusted EBIT as described in section 5.3 of the present document and a decrease of $5.7 million in finance costs, partly offset by an increase of $14.1 million in the integration-related costs.
In Q4 2014, the income tax expense was $69.5 million, a decrease of $25.1 million compared to $94.6 million in Q4 2013, while our effective income tax rate decreased from 40.1% to 24.5%. The decrease in the income tax expense and rate was mainly due to $26.0 million of unfavorable adjustments in fiscal 2013 that are comprised of a $18.4 million expense resulting from the revaluation of deferred tax assets following the enactment of a future rate reduction in the U.K. and from taxes paid on the repatriation of funds from the legacy Logica Indian operations of $7.6 million.
As a result of the above-mentioned items, the net earnings were $213.7 million, an increase of $72.7 million compared to $141.0 million last year.
The table on page 39 shows the quarterly year-over-year comparison of the tax rate with the impact of integration-related costs, tax adjustments and benefits related to the resolution of acquisition-related provisions removed.
During the quarter, no Class A subordinate shares were repurchased while 1,002,533 options were exercised.
38
FISCAL 2014 RESULTS
5.4.1. Net Earnings and Earnings per Share Prior to Specific Items
The following table sets out the information supporting the net earnings and earnings per share prior to specific items such as the integration-related costs, adjustments related to tax and the resolution of acquisition-related provisions:
| Change | ||||||||||||||||
| For the three months ended September 30, | ||||||||||||||||
2014
| 2013
| $
| %
| |||||||||||||
Earnings before income taxes | 283,178 | 235,600 | 47,578 | 20.2% | ||||||||||||
Add back: | ||||||||||||||||
Integration-related costs | 64,259 | 50,184 | 14,075 | 28.0% | ||||||||||||
Remove: | ||||||||||||||||
Resolution of acquisition-related provisions1 | 33,991 | — | 33,991 | — | ||||||||||||
Earnings before income taxes prior to specific items | 313,446 | 285,784 | 27,662 | 9.7% | ||||||||||||
Margin | 12.6% | 11.6% | ||||||||||||||
Income tax expense | 69,470 | 94,578 | (25,108 | ) | (26.5% | ) | ||||||||||
Add back: | ||||||||||||||||
Tax adjustments2 | — | (26,013 | ) | 26,013 | (100.0% | ) | ||||||||||
Tax deduction on integration-related costs | 15,075 | 3,619 | 11,456 | 316.6% | ||||||||||||
Remove: | ||||||||||||||||
Income taxes on the resolution of acquisition-related provisions | 5,091 | — | 5,091 | — | ||||||||||||
Income tax expense prior to specific items | 79,454 | 72,184 | 7,270 | 10.1% | ||||||||||||
Effective tax rate prior to specific items | 25.3% | 25.3% | ||||||||||||||
Net earnings prior to specific items | 233,992 | 213,600 | 20,392 | 9.5% | ||||||||||||
Net earnings margin | 9.4% | 8.7% | ||||||||||||||
Weighted average number of shares outstanding | ||||||||||||||||
Class A subordinate shares and Class B shares (basic) | 310,320,352 | 309,046,350 | 0.4% | |||||||||||||
Class A subordinate shares and Class B shares (diluted) | 319,540,764 | 319,114,642 | 0.1% | |||||||||||||
Earnings per share prior to specific items (in dollars) | ||||||||||||||||
Basic EPS | 0.75 | 0.69 | 0.06 | 8.7% | ||||||||||||
Diluted EPS
|
|
0.73
|
|
|
0.67
|
|
|
0.06
|
|
|
9.0%
|
| ||||
| 1 | The resolution of acquisition-related provisions is discussed on pages 36 and 37. |
| 2 | The tax adjustments are discussed on page 38. |
39
Management’s Discussion and Analysis
5.5. CONSOLIDATED STATEMENTS OF CASH FLOWS
As at September 30, 2014, cash and cash equivalents were $535.7 million. The following table provides a summary of the generation and use of cash for the quarters ended September 30, 2014 and 2013.
For the three months ended September 30,
|
2014
|
2013
|
Change
| |||||||||
In thousands of CAD | ||||||||||||
Cash provided by operating activities | 412,000 | 166,350 | 245,650 | |||||||||
Cash used in investing activities | (66,439) | (27,062) | (39,377) | |||||||||
Cash provided by (used in) financing activities | 47,138 | (155,689) | 202,827 | |||||||||
Effect of foreign exchange rate changes on cash and cash equivalents | 11,724 | (17,340) | 29,064 | |||||||||
Net increase (decrease) in cash and cash equivalents | 404,423 | (33,741) | 438,164 | |||||||||
5.5.1. Cash Provided by Operating Activities
For Q4 2014, cash provided by operating activities was $412.0 million compared to $166.4 million in Q4 2013, or 16.6% of revenue compared to 6.8% last year. The increase in cash from operating activities was mainly due to an improved DSO and to the growth in net earnings as described in section 5.4 of the present document. The timing of our working capital inflows and outflows will always have an impact on the cash flow from operations. Excluding the $19 million integration-related cash disbursements, the cash provided by operating activities would have been $431 million in Q4 2014, representing 17.4% of revenue compared to $204 million or 8.3% of revenue in Q4 2013.
The following table provides a summary of the generation and use of cash from operating activities.
For the three months ended September 30,
|
2014
|
2013
|
Change
| |||||||||
In thousands of CAD | ||||||||||||
Net earnings | 213,708 | 141,022 | 72,686 | |||||||||
Amortization and depreciation | 107,877 | 117,292 | (9,415) | |||||||||
Other adjustments1 | 37,156 | 36,224 | 932 | |||||||||
Cash flow from operating activities before net change in non-cash working capital items | 358,741 | 294,538 | 64,203 | |||||||||
Net change in non-cash working capital items: | ||||||||||||
Accounts receivable, work in progress and deferred revenue | 177,898 | 36,206 | 141,692 | |||||||||
Accounts payable and accrued liabilities, accrued compensation, provisions and | (143,327) | (166,086) | 22,759 | |||||||||
other long-term liabilities | ||||||||||||
Other2 | 18,688 | 1,692 | 16,996 | |||||||||
Net change in non-cash working capital items | 53,259 | (128,188) | 181,447 | |||||||||
Cash provided by operating activities | 412,000 | 166,350 | 245,650 | |||||||||
| 1 | Other adjustments are comprised of deferred income taxes, foreign exchange loss (gain) and share-based payment costs. |
| 2 | Comprised of prepaid expenses and other assets, long-term financial assets, retirement benefits obligations, derivative financial instruments and income taxes. |
For the current quarter, as described in section 5.4 of the present document, the Company’s net earnings increased by $72.7 million when compared to Q4 2013.
For Q4 2014, the $177.9 million of cash coming from the accounts receivable, work in progress and deferred revenue was mainly due to a decrease of 4 days in our DSO from 47 days in Q3 2014 to 43 in Q4 2014.
For the current quarter, the $143.3 million used in cash for the accounts payable and accrued liabilities, accrued compensation, provisions and other long-term liabilities was mostly due to the net $85.0 million decrease in accounts payable and accrued liabilities and the net decrease of $47.5 million in accrued compensation that were mainly driven by the reduction in the vacation accruals. These were partly offset by the net increase of $45.2 million in integration-related accruals.
40
FISCAL 2014 RESULTS
| 6. | Eight Quarter Summary |
As at and for the three months |
Sept. 30, |
June 30, | Mar. 31, | Dec. 31, | Sept. 30, | June 30, | Mar. 31, | Dec. 31, | ||||||||
ended,
| 2014
| 2014
| 2014
| 2013
| 2013
| 2013
| 2013
| 2012
| ||||||||
| In millions of CAD unless otherwise noted | ||||||||||||||||
Growth | ||||||||||||||||
Backlog | 18,237 | 18,781 | 19,476 | 19,253 | 18,677 | 18,747 | 18,019 | 18,281 | ||||||||
Bookings | 2,049 | 2,451 | 2,850 | 2,818 | 2,501 | 2,754 | 2,210 | 2,845 | ||||||||
Book-to-bill ratio | 82.5% | 91.9% | 105.4% | 106.5% | 101.7% | 107.3% | 87.5% | 112.3% | ||||||||
Revenue | 2,483.7 | 2,667.0 | 2,704.3 | 2,644.7 | 2,458.2 | 2,567.3 | 2,526.2 | 2,532.9 | ||||||||
Year-over-year growth | 1.0% | 3.9% | 7.0% | 4.4% | 52.7% | 141.1% | 137.0% | 145.4% | ||||||||
Constant currency growth | (3.4%) | (3.9%) | (2.3%) | (1.9%) | 48.2% | 140.3% | 137.1% | 147.5% | ||||||||
Profitability | ||||||||||||||||
Adjusted EBIT | 370.2 | 342.2 | 341.5 | 302.9 | 313.4 | 291.2 | 261.6 | 209.5 | ||||||||
Adjusted EBIT margin | 14.9% | 12.8% | 12.6% | 11.5% | 12.7% | 11.3% | 10.4% | 8.3% | ||||||||
Net earnings | 213.7 | 225.1 | 230.9 | 189.8 | 141.0 | 178.2 | 114.2 | 22.4 | ||||||||
Net earnings margin | 8.6% | 8.4% | 8.5% | 7.2% | 5.7% | 6.9% | 4.5% | 0.9% | ||||||||
Basic EPS (in dollars) | 0.69 | 0.73 | 0.75 | 0.62 | 0.46 | 0.58 | 0.37 | 0.07 | ||||||||
Diluted EPS (in dollars) | 0.67 | 0.71 | 0.73 | 0.60 | 0.44 | 0.56 | 0.36 | 0.07 | ||||||||
Liquidity | ||||||||||||||||
Cash provided by operating activities | 412.0 | 345.9 | 350.7 | 66.3 | 166.4 | 133.2 | 147.2 | 224.5 | ||||||||
As a % of revenue | 16.6% | 13.0% | 13.0% | 2.5% | 6.8% | 5.2% | 5.8% | 8.9% | ||||||||
Days sales outstanding | 43 | 47 | 47 | 55 | 49 | 49 | 46 | 46 | ||||||||
Capital structure | ||||||||||||||||
Net debt | 2,113.3 | 2,389.0 | 2,678.2 | 2,890.4 | 2,739.9 | 2,873.0 | 2,914.3 | 2,964.9 | ||||||||
Net debt to capitalization ratio | 27.6% | 32.6% | 35.6% | 38.9% | 39.6% | 41.1% | 43.0% | 44.7% | ||||||||
Return on equity | 18.8% | 18.1% | 17.9% | 16.0% | 12.3% | 4.3% | 1.8% | 1.7% | ||||||||
Return on invested capital | 14.5% | 13.3% | 13.4% | 12.7% | 11.8% | 12.3% | 11.1% | 10.9% | ||||||||
Balance sheet | ||||||||||||||||
| Cash and cash equivalents, and short- term investments | 535.7 | 131.3 | 133.8 | 206.5 | 106.2 | 165.3 | 167.7 | 161.6 | ||||||||
Total assets | 11,234.1 | 11,162.2 | 11,560.4 | 11,801.0 | 10,879.3 | 11,132.8 | 10,936.6 | 10,981.8 | ||||||||
Long-term financial liabilities | 2,748.4 | 2,164.8 | 2,562.4 | 2,796.6 | 2,489.5 | 2,648.2 | 3,093.5 | 3,162.6 | ||||||||
There are factors causing quarterly variances which may not be reflective of the Company’s future performance. First, there is seasonality in SI&C work, and the quarterly performance of these operations is impacted by occurrences such as vacations and the number of statutory holidays in any given quarter. Outsourcing contracts including BPS contracts are affected to a lesser extent by seasonality. Second, the workflow from some clients may fluctuate from quarter to quarter based on their business cycle and the seasonality of their own operations. Third, the savings that we generate for a client on a given outsourcing contract may temporarily reduce our revenue stream from this client, as these savings may not be immediately offset by additional work performed for this client.
In general, cash flow from operating activities could vary significantly from quarter to quarter depending on the timing of monthly payments received from large clients, cash requirements associated with large acquisitions, outsourcing contracts and projects, the timing of the reimbursements for various tax credits as well as profit sharing payments to members and the timing of restructuring cost payments.
Foreign exchange fluctuations can also contribute to quarterly variances as our percentage of operations in foreign countries evolves. The effect from these variances is primarily on our revenue and to a much less extent, on our net margin as we benefit from natural hedges.
41
Management’s Discussion and Analysis
| 7. | Changes in Accounting Policies |
The audited consolidated financial statements for the year ended September 30, 2014 include all adjustments that CGI’s management considers necessary for the fair presentation of its financial position, results of operations, and cash flows.
a) NEW STANDARDS AND AMENDMENTS ADOPTED
The following new and amended standards have been adopted by the Company effective October 1, 2013:
IFRS 10 – Consolidated Financial Statements
The new standard builds on existing principles by identifying the concept of control as the determining factor in whether an entity should be included in a company’s consolidated financial statements. The adoption of IFRS 10 did not result in any significant impact on the Company’s consolidated financial statements.
IFRS 12 – Disclosure of Interests in Other Entities
The new standard provides guidance on disclosure requirements for all forms of interests in other entities, including subsidiaries, joint arrangements, associates and structured entities. The standard requires disclosure of the nature and risks associated with the Company’s interests in other entities and the effects of those interests on its financial position, financial performance and cash flows. The adoption of IFRS 12 did not result in any significant impact on the Company’s consolidated financial statements.
IFRS 13 – Fair Value Measurement
The new standard provides guidance for fair value measurements by providing a definition of fair value and a single source of fair value measurement and disclosure requirements. IFRS 13 applies when other IFRS standards require or permit fair value measurements. The adoption of IFRS 13 did not result in any significant impact on the Company’s consolidated financial statements other than to give rise to additional disclosures.
IAS 1 – Presentation of Financial Statements
The amendment requires grouping together items within the statement of comprehensive income that may be reclassified to the statement of earnings. As a result, the Company has grouped items within its consolidated statements of comprehensive income and accumulated other comprehensive income by items that will and will not be reclassified subsequently to the consolidated statements of earnings.
IAS 19 – Employee Benefits
Two amendments of IAS 19 have been adopted by the Company.
The first amendment requires to adjust the calculation of the financing cost component of defined benefit plans and to enhance disclosure requirements. As a result, the Company calculated a net interest expense or income on the net defined benefit liability or asset. The net interest on the defined benefit liability or asset replaces the interest cost on the defined benefit obligation and the expected return on plan assets. The adoption of IAS 19 did not result in any significant impact on the Company’s consolidated financial statements, other than to give rise to additional disclosures.
The second amendment permits the recognition of certain contributions from employees as a reduction of the service cost in the period in which the related service is rendered. The amendment applies to contributions from employees set out in the formal terms of the plan, linked to service and independent of the number of years of service. The Company has early adopted the amendment of IAS 19 which is effective on or after July 1, 2014. The amendment did not result in any significant impact on the Company’s consolidated financial statements.
42
FISCAL 2014 RESULTS
b) FUTURE ACCOUNTING STANDARD CHANGES
The following standards have been issued but are not yet effective:
IFRS 15 - Revenue from Contracts with Customers
In May 2014, the IASB issued IFRS 15, “Revenue from Contracts with Customers”, to specify how and when to recognize revenue as well as requiring the provision of more informative and relevant disclosures. IFRS 15 supersedes IAS 18, “Revenue”, IAS 11, “Construction Contracts”, and other revenue related interpretations. The standard will be effective on October 1, 2017 for the Company with earlier adoption permitted. The Company is currently evaluating the impact of this standard on its consolidated financial statements.
IFRS 9 - Financial Instruments
In July 2014, the IASB amended IFRS 9, “Financial Instruments”, to bring together the classification and measurement, impairment and hedge accounting phases of the IASB’s project to replace IAS 39, “Financial Instruments: Recognition and Measurement”. The standard supersedes all previous versions of IFRS 9 and will be effective on October 1, 2018 for the Company with earlier application permitted. The Company is currently evaluating the impact of this standard on its consolidated financial statements.
43
Management’s Discussion and Analysis
| 8. | Critical Accounting Estimates and Judgements |
The Company’s significant accounting policies are described in Note 3 of the audited consolidated financial statements for the year ended September 30, 2014. The preparation of the consolidated financial statements requires management to make judgements and estimates that affect the reported amounts of assets, liabilities and equity and the accompanying disclosures at the date of the consolidated financial statements and the reported amounts of revenue and expenses during the reporting period. Because the use of judgements and estimates is inherent in the financial reporting process, actual results could differ.
An accounting estimate is considered critical if the estimate requires management to make assumptions about matters that were highly uncertain at the time the estimate was made, if different estimates could reasonably have been used in the period, or changes in the accounting estimates that are reasonably likely to occur, could have a material impact on the presentation of our financial condition, changes in financial condition or results of operations.
Areas impacted by estimates
| Consolidated balance sheets
| Consolidated statements of earnings
| ||||||
| Revenue | Cost of services, selling and administrative | Income taxes | ||||||
Revenue recognition1
| ü | ü | ü | |||||
Estimated losses on revenue-generating contracts
| ü | ü | ||||||
Goodwill impairment
| ü | ü | ||||||
Business combinations
| ü | ü | ü | ü | ||||
Income taxes
| ü | ü | ||||||
Litigations and claims
| ü | ü | ü | |||||
| 1 | Affects the balance sheet through accounts receivable, work in progress and deferred revenue. |
The use of judgments, apart from those involving estimations, that have the most significant effect on the amounts recognized in the financial statements are:
Multiple component arrangements
Assessing whether the deliverables within an arrangement are separately identifiable components requires judgement by management. A component is considered as separately identifiable if it has value to the client on a stand-alone basis. The Company first reviews the contract clauses to evaluate if the deliverable is accepted separately by the client. Then, the Company assesses if the deliverable could have been provided by another vendor and if it would have been possible for the client to decide to not purchase the deliverable.
Deferred tax assets
Deferred tax assets are recognized for unused tax losses to the extent that it is probable that taxable profit will be available against which the losses can be utilized. Management judgment is required concerning uncertainties that exist with respect to the timing of future taxable income required to recognize a deferred tax asset. The Company recognizes an income tax benefit only when it is probable that the tax benefit will be realized in the future. In making this judgement, the Company assesses forecast and the availability of future tax planning strategies.
44
FISCAL 2014 RESULTS
Significant estimates about the future and other major sources of estimation uncertainty at the end of the reporting period could have a significant risk of causing a material adjustment to the carrying amounts of the following:
Revenue recognition
Revenue is measured at the fair value of the consideration received or receivable net of discounts, volume rebates and sales related taxes.
The Company’s arrangements often include a mix of the services and products. If an arrangement involves the provision of multiple components, the total arrangement value is allocated to each separately identifiable component based on its relative selling price. When estimating selling price of each component, the Company maximizes the use of observable prices which are established using the Company’s prices for same or similar components. When observable prices are not available, the Company estimates selling prices based on its best estimate. The best estimate of selling price is the price at which the Company would normally expect to offer the services or products and is established by considering a number of internal and external factors including, but not limited to, geographies, the Company’s pricing policies, internal costs and margins.
Revenue from systems integration and consulting services under fixed-fee arrangements where the outcome of the arrangements can be estimated reliably is recognized using the percentage-of-completion method over the service periods. The Company uses the labour costs or labour hours to measure the progress towards completion. This method relies on estimates of total expected labour costs or total expected labour hours to complete the service, which are compared to labour costs or labour hours incurred to date, to arrive at an estimate of the percentage of revenue earned to date. Management regularly reviews underlying estimates of total expected labour costs or hours. If the outcome of an arrangement cannot be estimated reliably, revenue is recognized to the extent of arrangement costs incurred that are likely to be recoverable.
Estimated losses on revenue-generating contracts
Estimated losses on revenue-generating contracts may occur due to additional contract costs which were not foreseen at inception of the contract. Contract losses are measured at the amount by which the estimated total costs exceed the estimated total revenue from the contract. The estimated losses on revenue-generating contracts are recognized in the period when it is determined that a loss is probable. Management regularly reviews arrangement profitability and the underlying estimates.
Goodwill impairment
The carrying value of goodwill is tested for impairment annually on September 30, or earlier if events or changes in circumstances indicate that the carrying value may be impaired.
The recoverable amount of each segment has been allocated has been determined based on the its value in use (“VIU”) calculation which includes estimates about their future financial performance based on cash flows approved by management covering a period of five years as the Company generates revenue mainly through long-term contracts. Key assumptions used in the VIU calculations are the discount rate applied and the long-term growth rate of net operating cash flows. In determining these assumptions, management has taken into consideration the current economic environment and its resulting impact on expected growth and discount rates. The cash flow projections reflect management’s expectations of the operating segment’s operating performance and growth prospects in the operating segment’s market. The discount rate applied to an operating segment is the weighted average cost of capital (“WACC”). Management considers factors such as country risk premium, risk-free rate, size premium and cost of debt to derive the WACC.
For goodwill impairment testing purposes, the group of CGUs that represent the lowest level within the Company at which management monitors goodwill is the operating segment level.
Business combinations
Management makes assumptions when allocating the fair value of the consideration to tangible and intangible assets acquired and liabilities assumed. The goodwill recognized is composed of the future economic value associated to acquire work force and synergies with the Company’s operations which are primarily due to reduction of costs and new business opportunities.
The determination of fair value involves making estimates relating to acquired intangible assets, PP&E, litigation, provision for estimated losses on revenue-generating contracts, other onerous contracts and contingency reserves. Estimates include the forecasting of future cash flows and discount rates.
45
Management’s Discussion and Analysis
Income taxes
Deferred tax assets are recognized for unused tax losses to the extent that it is probable that taxable profit will be available against which the losses can be utilized. Once this assessment is made, the Company considers the analysis of forecast and future tax planning strategies. Such estimates are made based on the forecast by jurisdiction on an undiscounted basis. Management considers factors such as the number of years to include in the forecast period, the history of the taxable profits and availability of tax strategies.
The Company is subject to taxation in numerous jurisdictions and there are transactions and calculations for which the ultimate tax determination is uncertain. When a tax position is uncertain, the Company recognizes an income tax benefit or reduces an income tax liability only when it is probable that the tax benefit will be realized in the future or that the income tax liability is no longer probable. The provision for uncertain tax position is made using the best estimate of the amount expected to be paid based on qualitative assessment of all relevant factors.
Litigations and claims
Provisions are recognized when the Company has a present legal or constructive obligation as a result of a past event, it is probable that an outflow of resources embodying economic benefits will be required to settle the obligation and a reliable estimate can be made of the amount of the obligation. The amount recognized as a provision is the best estimate of the consideration required to settle the present obligation at the end of the reporting period, taking into account the risks and uncertainties surrounding the obligation. Provisions are discounted using a current pre-tax rate when the impact of the time value of money is material.
The accrued litigation and legal claim provisions are based on historical experience, current trends and other assumptions that are believed to be reasonable under the circumstances. Estimates include the period in which the underlying cause of the claim occurred and the degree of probability of an unfavourable outcome.
46
FISCAL 2014 RESULTS
| 9. | Integrity of Disclosure |
Our management assumes the responsibility for the existence of appropriate information systems, procedures and controls to ensure that information used internally and disclosed externally is complete and reliable.
CGI has a formal corporate disclosure policy whose goal is to raise awareness of the Company’s approach to disclosure among the members of the Board of Directors, senior management and employees.
The Board of Directors has the responsibility under its charter and under the securities laws that govern CGI’s continuous disclosure obligations to oversee CGI’s compliance with its continuous and timely disclosure obligations as well as the integrity of the Company’s internal controls and management information systems. The Board of Directors carries out this responsibility mainly through its Audit and Risk Management Committee.
The Audit and Risk Management Committee of CGI is composed entirely of independent directors who meet the independence and experience requirements of the New York Stock Exchange as well as those that apply under Canadian securities regulation. The responsibilities of our Audit and Risk Management Committee include: a) reviewing of all our public disclosure documents containing audited or unaudited financial information; b) identifying and examining all risks to which we are exposed and reviewing the various policies and practices that are intended to manage those risks; c) reviewing and assessing of the effectiveness of our accounting policies and practices concerning financial reporting; d) reviewing and monitoring our internal control procedures, programs and policies and assessing of the adequacy and effectiveness thereof; e) reviewing the adequacy of our internal audit resources including the mandate and objectives of the internal auditor; f) recommending to the Board of Directors of CGI on the appointment of external auditors, the assertion of the external auditors’ independence, the review of the terms of their engagement as well as pursuing ongoing discussions with them; g) reviewing of the audit procedures; h) reviewing of related party transactions; and i) carrying out such other responsibilities usually attributed to audit and risk committees or as directed by our Board of Directors. In making its recommendation to the Board of Directors in relation to the annual appointment of the external auditor, the Audit and Risk Management Committee will conduct an annual assessment of the external auditor in keeping with the recommendations of the Chartered Professional Accountants of Canada. The initial formal assessment will be concluded in advance of our upcoming Annual General Meeting of shareholders and will be conducted with the assistance of key CGI personnel.
The Company evaluated the effectiveness of its disclosure controls and procedures and internal controls over financial reporting, supervised by and with the participation of the Chief Executive Officer and the Chief Financial Officer as of September 30, 2014. The Chief Executive Officer and Chief Financial Officer concluded that, based on this evaluation, the Company’s disclosure controls and procedures and internal controls over financial reporting were adequate and effective, at a reasonable level of assurance, to ensure that material information related to the Company and its consolidated subsidiaries would be made known to them by others within those entities.
47
Management’s Discussion and Analysis
| 10. | Risk Environment |
10.1. RISKS AND UNCERTAINTIES
While we are confident about our long-term prospects, the following risks and uncertainties could affect our ability to achieve our strategic vision and objectives for growth and should be considered when evaluating our potential as an investment.
10.1.1. Risks Related to the Market
Economic risk
The level of business activity of our clients, which is affected by economic conditions, has a bearing upon the results of our operations. We can neither predict the impact that current economic conditions will have on our future revenue, nor predict when economic conditions will show meaningful improvement. During an economic downturn, our clients and potential clients may cancel, reduce or defer existing contracts and delay entering into new engagements. In general, companies also decide to undertake fewer IT systems projects during difficult economic times, resulting in limited implementation of new technology and smaller engagements. Since there are fewer engagements in a downturn, competition usually increases and pricing for services may decline as competitors, particularly companies with significant financial resources, decrease rates to maintain or increase their market share in our industry and this may trigger pricing adjustments related to the benchmarking obligations within our contracts. Our pricing, revenue and profitability could be negatively impacted as a result of these factors.
10.1.2. Risks Related to our Industry
The competition for contracts
CGI operates in a global marketplace in which competition among providers of IT services is vigorous. Some of our competitors possess greater financial, marketing, sales resources, and larger geographic scope in certain parts of the world than we do, which, in turn, provides them with additional leverage in the competition for contracts. In certain niche, regional or metropolitan markets, we face smaller competitors with specialized capabilities who may be able to provide competing services with greater economic efficiency. Some of our competitors have more significant operations than we do in lower cost countries that can serve as a platform from which to provide services worldwide on terms that may be more favourable. Increased competition among IT services firms often results in corresponding pressure on prices. There can be no assurance that we will succeed in providing competitively priced services at levels of service and quality that will enable us to maintain and grow our market share.
The availability and retention of qualified IT professionals
There is strong demand for qualified individuals in the IT industry. Hiring and retaining a sufficient amount of individuals with the desired knowledge and skill set may be difficult. Therefore, it is important that we remain able to successfully attract and retain highly qualified professionals and establish an effective succession plan. If our comprehensive programs aimed at attracting and retaining qualified and dedicated professionals do not ensure that we have staff in sufficient numbers and with the appropriate training, expertise and suitable government security clearances required to serve the needs of our clients, we may have to rely on subcontractors or transfers of staff to fill resulting gaps. If our succession plan fails to identify those with potential or to develop these key individuals, we may lose key members and be required to recruit and train these new resources. This might result in lost revenue or increased costs, thereby putting pressure on our earnings.
The ability to continue developing and expanding service offerings to address emerging business demands and technology trends
The rapid pace of change in all aspects of information technology and the continually declining costs of acquiring and maintaining information technology infrastructure mean that we must anticipate changes in our clients’ needs. To do so, we must adapt our services and our solutions so that we maintain and improve our competitive advantage and remain able to provide cost effective services. The market for the services and solutions we offer is extremely competitive and there can be no assurance that we will succeed in developing and adapting our business in a timely manner. If we do not
48
FISCAL 2014 RESULTS
keep pace, our ability to retain existing clients and gain new business may be adversely affected. This may result in pressure on our revenue, profit margin and resulting cash flows from operations.
Infringing on the intellectual property rights of others
Despite our efforts, the steps we take to ensure that our services and offerings do not infringe on the intellectual property rights of third parties may not be adequate to prevent infringement and, as a result, claims may be asserted against us or our clients. We enter into licensing agreements for the right to use intellectual property and may otherwise offer indemnities against liability and damages arising from third-party claims of patent, copyright, trademark or trade secret infringement in respect of our own intellectual property or software or other solutions developed for our clients. In some instances, the amount of these indemnity claims could be greater than the revenue we receive from the client. Intellectual property claims or litigation could be time-consuming and costly, harm our reputation, require us to enter into additional royalty or licensing arrangements, or prevent us from providing some solutions or services. Any limitation on our ability to sell or use solutions or services that incorporate software or technologies that are the subject of a claim could cause us to lose revenue-generating opportunities or require us to incur additional expenses to modify solutions for future projects.
Benchmarking provisions within certain contracts
Some of our outsourcing contracts contain clauses allowing our clients to externally benchmark the pricing of agreed upon services against those offered by other providers in an appropriate peer comparison group. The uniqueness of the client environment is factored in and, if results indicate a difference outside the agreed upon tolerance, we may be required to work with clients to reset the pricing for their services.
Protecting our intellectual property rights
Our success depends, in part, on our ability to protect our proprietary methodologies, processes, know-how, tools, techniques and other intellectual property that we use to provide our services. CGI’s business solutions will generally benefit from available copyright protection and, in some cases, patent protection. Although CGI takes reasonable steps to protect and enforce its intellectual property rights, there is no assurance that such measures will be enforceable or adequate. The cost of enforcing our rights can be substantial and, in certain cases, may prove to be uneconomic. In addition, the laws of some countries in which we conduct business may offer only limited intellectual property rights protection. Despite our efforts, the steps taken to protect our intellectual property may not be adequate to prevent or deter infringement or other misappropriation of intellectual property, and we may not be able to detect unauthorized use of our intellectual property, or take appropriate steps to enforce our intellectual property rights.
10.1.3. Risks Related to our Business
Risks associated with our growth strategy
CGI’s Build and Buy strategy is founded on four pillars of growth: first, organic growth through contract wins, renewals and extensions in the areas of outsourcing and system integration; second, the pursuit of new large outsourcing contracts; third, acquisitions of smaller firms or niche players; and fourth, transformational acquisitions.
Our ability to grow through organic growth and new large outsourcing transactions is affected by a number of factors outside of our control, including a lengthening of our sales cycle for major outsourcing contracts.
Our ability to grow through niche and transformational acquisitions requires that we identify suitable acquisition targets and that we correctly evaluate their potential as transactions that will meet our financial and operational objectives. There can be no assurance that we will be able to identify suitable acquisition candidates and consummate additional acquisitions that meet our economic thresholds, or that future acquisitions will be successfully integrated into our operations and yield the tangible accretive value that had been expected.
If we are unable to implement our Build and Buy strategy, we will likely be unable to maintain our historic or expected growth rates.
The variability of financial results
Our ability to maintain and increase our revenues is affected not only by our success in implementing our Build and Buy strategy, but also by a number of other factors, including: our ability to introduce and deliver new services and products; a lengthened sales cycle; the cyclicality of purchases of technology services and products; the nature of a customer’s
49
Management’s Discussion and Analysis
business; and the structure of agreements with customers. These, and other factors, make it difficult to predict financial results for any given period.
Business mix variations
The proportion of revenue that we generate from shorter-term systems integration and consulting (“SI&C”) projects, versus revenue from long-term outsourcing contracts, will fluctuate at times, affected by acquisitions or other transactions. An increased exposure to revenue from SI&C projects may result in greater quarterly revenue variations.
The financial and operational risks inherent in worldwide operations
We manage operations in numerous countries around the world. The scope of our operations subjects us to various issues that can negatively impact our operations: the fluctuations of currency (see foreign exchange risk); the burden of complying with a wide variety of national and local laws (see regulatory risk); the differences in and uncertainties arising from local business culture and practices; political, social and economic instability including the threats of terrorism, civil unrest, war, natural disasters and pandemic illnesses. Any or all of these risks could impact our global business operations and cause our profitability to decline.
Organizational challenges associated with our size
With the acquisition of Logica, our organization has more than doubled in size with expanded operations in both Europe and Asia. Our culture, standards, core values, internal controls and our policies need to be instilled across the newly acquired businesses as well as maintained within our existing operations. To effectively communicate and manage these standards throughout a large global organization is both challenging and time consuming. Newly acquired businesses may be resistant to change and may remain attached to past methods, standards and practices which may compromise our business agility in pursuing opportunities. Cultural differences in various countries may also present barriers to introducing new ideas or aligning our vision and strategy with the rest of the organization. If we cannot overcome these obstacles in maintaining a strategic bond throughout the Company worldwide, we may not be able to achieve our growth and profitability objectives.
Taxes
In estimating our income tax payable, management uses accounting principles to determine income tax positions that are likely to be sustained by applicable tax authorities. However, there is no assurance that our tax benefits or tax liability will not materially differ from our estimates or expectations. The tax legislation, regulation and interpretation that apply to our operations are continually changing. In addition, future tax benefits and liabilities are dependent on factors that are inherently uncertain and subject to change, including future earnings, future tax rates, and anticipated business mix in the various jurisdictions in which we operate. Moreover, our tax returns are continually subject to review by applicable tax authorities; it is these tax authorities that will make the final determination of the actual amounts of taxes payable or receivable, of any future tax benefits or liabilities and of income tax expense that we may ultimately recognize. Any of the above factors could have a material adverse effect on our net income or cash flows by affecting our operations and profitability, the availability of tax credits, the cost of the services we provide, and the availability of deductions for operating losses as we develop our international service delivery capabilities.
Credit risk with respect to accounts receivable and work in progress
In order to sustain our cash flows and net earnings from operations, we must invoice and collect the amounts owed to us in an efficient and timely manner. Although we maintain provisions to account for anticipated shortfalls in amounts collected, the provisions we take are based on management estimates and on our assessment of our clients’ creditworthiness which may prove to be inadequate in the light of actual results. To the extent that we fail to perform our services in accordance with our contracts and our clients’ reasonable expectations, and to the extent that we fail to invoice clients for our services correctly in a timely manner, our collections could suffer resulting in a direct and adverse effect to our revenue, net earnings and cash flows. In addition, a prolonged economic downturn may cause clients to curtail or defer projects, impair their ability to pay for services already provided, and ultimately cause them to default on existing contracts, in each case, causing a shortfall in revenue and impairing our future prospects.
50
FISCAL 2014 RESULTS
Material developments regarding major commercial clients resulting from such causes as changes in financial condition, mergers or business acquisitions
Consolidation among our clients resulting from mergers and acquisitions may result in loss or reduction of business when the successor business’ information technology needs are served by another service provider or are provided by the successor Company’s own personnel. Growth in a client’s information technology needs resulting from acquisitions or operations may mean that we no longer have a sufficient geographic scope or the critical mass to serve the client’s needs efficiently, resulting in the loss of the client’s business and impairing our future prospects. There can be no assurance that we will be able to achieve the objectives of our growth strategy in order to maintain and increase our geographic scope and critical mass in our targeted markets.
Early termination risk
If we should fail to deliver our services according to contractual agreements, some of our clients could elect to terminate contracts before their agreed expiry date, which would result in a reduction of our earnings and cash flow and may impact the value of our backlog. In addition, a number of our outsourcing contractual agreements have termination for convenience and change of control clauses according to which a change in the client’s intentions or a change in control of CGI could lead to a termination of the said agreements. Early contract termination can also result from the exercise of a legal right or when circumstances that are beyond our control or beyond the control of our client prevent the contract from continuing. In cases of early termination, we may not be able to recover capitalized contract costs and we may not be able to eliminate ongoing costs incurred to support the contract.
Cost estimation risks
In order to generate acceptable margins, our pricing for services is dependent on our ability to accurately estimate the costs and timing for completing projects or long-term outsourcing contracts. In addition, a significant portion of our project-oriented contracts are performed on a fixed-price basis. Billing for fixed-price engagements is carried out in accordance with the contract terms agreed upon with our client, and revenue is recognized based on the percentage of effort incurred to date in relation to the total estimated costs to be incurred over the duration of the respective contract. These estimates reflect our best judgment regarding the efficiencies of our methodologies and professionals as we plan to apply them to the contracts in accordance with the CGI Client Partnership Management Framework (“CPMF”), a process framework which helps ensure that all contracts are managed according to the same high standards throughout the organization. If we fail to apply the CPMF correctly or if we are unsuccessful in accurately estimating the time or resources required to fulfil our obligations under a contract, or if unexpected factors, including those outside of our control, arise, there may be an impact on costs or the delivery schedule which could have an adverse effect on our expected profit margins.
Risks related to teaming agreements and subcontracts
We derive substantial revenues from contracts where we enter into teaming agreements with other providers. In some teaming agreements we are the prime contractor whereas in others we act as a subcontractor. In both cases, we rely on our relationships with other providers to generate business and we expect to do so in the foreseeable future. Where we act as prime contractor, if we fail to maintain our relationships with other providers, we may have difficulty attracting suitable participants in our teaming agreements. Similarly, where we act as subcontractor, if our relationships are impaired, other providers might reduce the work they award to us, award that work to our competitors, or choose to offer the services directly to the client in order to compete with our business. In either case, our business, prospects, financial condition and operating results could be harmed.
Our partners’ ability to deliver on their commitments
Increasingly large and complex contracts may require that we rely on third party subcontractors including software and hardware vendors to help us fulfil our commitments. Under such circumstances, our success depends on the ability of the third parties to perform their obligations within agreed upon budgets and timeframes. If our partners fail to deliver, our ability to complete the contract may be adversely affected, which may have an unfavourable impact on our profitability.
Guarantees risk
In the normal course of business, we enter into agreements that may provide for indemnification and guarantees to counterparties in transactions such as consulting and outsourcing services, business divestitures, lease agreements and financial obligations. These indemnification undertakings and guarantees may require us to compensate counterparties
51
Management’s Discussion and Analysis
for costs and losses incurred as a result of various events, including breaches of representations and warranties, intellectual property right infringement, claims that may arise while providing services or as a result of litigation that may be suffered by counterparties.
Risk related to human resources utilization rates
In order to maintain our profit margin, it is important that we maintain the appropriate availability of professional resources in each of our geographies by having a high utilization rate while still being able to assign additional resources to new work. Maintaining an efficient utilization rate requires us to forecast our need for professional resources accurately and to manage recruitment activities, professional training programs, attrition rates and restructuring programs appropriately. To the extent that we fail to do so, or to the extent that laws and regulations, particularly those in Europe, restrict our ability to do so, our utilization rates may be reduced; thereby having an impact on our revenue and profitability. Conversely, we may find that we do not have sufficient resources to deploy against new business opportunities in which case our ability to grow our revenue would suffer.
Client concentration risk
We derive a significant portion of our revenue from the services we provide to the U.S. federal government and its agencies, and we expect that this will continue for the foreseeable future. In the event that a major U.S. federal government agency were to limit, reduce, or eliminate the business it awards to us, we might be unable to recover the lost revenue with work from other agencies or other clients, and our business, prospects, financial condition and operating results could be materially and adversely affected. Although IFRS considers a national government and its agencies as a single client, our client base in the U.S. government economic sector is in fact diversified with contracts from many different departments and agencies.
Government business risk
Changes in government spending policies or budget priorities could directly affect our financial performance. Among the factors that could harm our government contracting business are the curtailment of governments’ use of consulting and IT services firms; a significant decline in spending by governments in general, or by specific departments or agencies in particular; the adoption of new legislation and/or actions affecting companies that provide services to governments; delays in the payment of our invoices by government payment offices; and general economic and political conditions. These or other factors could cause government agencies and departments to reduce their purchases under contracts, to exercise their right to terminate contracts, to issue temporary stop work orders, or not to exercise options to renew contracts, any of which would cause us to lose future revenue. Government spending reductions or budget cutbacks at these departments or agencies could materially harm our continued performance under these contracts, or limit the awarding of additional contracts from these agencies.
Regulatory risk
Our global operations require us to be compliant with laws in many jurisdictions on matters such as: anticorruption, trade restrictions, immigration, taxation, securities regulation, anti-competition, data privacy and labour relations, amongst others. Complying with these diverse requirements worldwide is a challenge and consumes significant resources. Some of these laws may impose conflicting requirements; we may face the absence in some jurisdictions of effective laws to protect our intellectual property rights; there may be restrictions on the movement of cash and other assets; or restrictions on the import and export of certain technologies; or restrictions on the repatriation of earnings and reduce our earnings, all of which may expose us to penalties for non-compliance and harm our reputation.
Our business with the U.S. federal government and its agencies requires that we comply with complex laws and regulations relating to government contracts. These laws relate to the integrity of the procurement process, impose disclosure requirements, and address national security concerns, among others matters. For instance, we are routinely subject to audits by U.S. government agencies with respect to compliance with these rules. If we fail to comply with these requirements we may incur penalties and sanctions, including contract termination, suspension of payments, suspension or debarment from doing business with the federal government, and fines.
52
FISCAL 2014 RESULTS
Legal claims made against our work
We create, implement and maintain IT solutions that are often critical to the operations of our clients’ business. Our ability to complete large projects as expected could be adversely affected by unanticipated delays, renegotiations, and changing client requirements or project delays. Also, our solutions may suffer from defects that adversely affect their performance; they may not meet our clients’ requirements or may fail to perform in accordance with applicable service levels. Such problems could subject us to legal liability, which could adversely affect our business, operating results and financial condition, and may negatively affect our professional reputation. We typically use reasonable efforts to include provisions in our contracts which are designed to limit our exposure to legal claims relating to our services and the applications we develop. We may not always be able to include such provisions and, where we are successful, they may not protect us adequately or may not be enforceable under some circumstances or under the laws of some jurisdictions.
Information and infrastructure risks
Our business often requires that our clients’ applications and information, which may include their proprietary information, be processed and stored on our networks and systems, and in data centres that we manage. Digital information and equipment is subject to loss, theft or destruction, and services that we provide may become temporarily unavailable as a result thereof or upon an equipment or system malfunction. Failures can arise from human error in the course of normal operations, maintenance and upgrading activities, or from hacking, vandalism (including denial of service attacks and computer viruses), theft and unauthorized access by third parties, as well as from power outages or surges, floods, fires, natural disasters or from any other causes. The measures that we take to protect information and software, including both physical and logical controls on access to premises and information and backup systems may prove in some circumstances to be inadequate to prevent the loss, theft or destruction of client information or service interruptions. Such events may expose the Company to financial loss or damages.
Risk of harm to our reputation
CGI’s reputation as a capable and trustworthy service provider and long term business partner is key to our ability to compete effectively in the market for information technology services. The nature of our operations exposes us to the potential loss, unauthorized access to, or destruction of our clients’ information, as well as temporary service interruptions. Depending on the nature of the information or services, such events may have a negative impact on how the Company is perceived in the marketplace. Under such circumstances, our ability to obtain new clients and retain existing clients could suffer with a resulting impact on our revenue and profit.
Risks associated with the integration of new operations
The successful integration of new operations arising from our acquisition strategy or from large outsourcing contracts requires that a substantial amount of management time and attention be focused on integration tasks. Management time that is devoted to integration activities may detract from management’s normal operations focus with resulting pressure on the revenues and earnings from our existing operations. In addition, we may face complex and potentially time-consuming challenges in implementing the uniform standards, controls, procedures and policies across new operations to harmonize their activities with those of our existing business units. Integration activities can result in unanticipated operational problems, expenses and liabilities. If we are not successful in executing our integration strategies in a timely and cost-effective manner, we will have difficulty achieving our growth and profitability objectives.
Internal controls risks
Due to the inherent limitations of internal controls including the circumvention or overriding of controls, or fraud, there can only be reasonable assurance that the Company’s internal controls will detect and prevent a misstatement. If the Company is unable to design, implement, monitor and maintain effective internal controls throughout its different business environments, the efficiency of our operations might suffer, resulting in a decline in revenue and profitability, and the accuracy of our financial reporting could be impaired.
Liquidity and funding risks
The Company’s future growth is contingent on the execution of its business strategy, which, in turn, is dependent on its ability to grow the business organically as well as conclude business acquisitions. By its nature, our growth strategy requires us to fund the investments required to be made using a mix of cash generated from our existing operations, money borrowed
53
Management’s Discussion and Analysis
under our existing or future credit agreements, and equity funding generated by the issuance of shares of our capital stock to counterparties in transactions, or to the general public. Our ability to raise the required funding depends on the capacity of the capital markets to meet our financing needs in a timely fashion and on the basis of interest rates and share prices that are reasonable in the context of profitability objectives. Increasing interest rates, volatility in our share price, and the capacity of our current lenders to meet our liquidity requirements are all factors that may have an adverse effect on our access to the funding we require. If we are unable to obtain the necessary funding, we may be unable to achieve our growth objectives.
Foreign exchange risk
The majority of our revenue and costs are denominated in currencies other than the Canadian dollar. Foreign exchange fluctuations impact the results of our operations as they are reported in Canadian dollars. This risk is partially mitigated by a natural hedge in matching our costs with revenue denominated in the same currency and through the use of derivatives in our hedging strategy. As we continue our global expansion, natural hedges may begin to diminish and the use of hedging contracts exposes us to the risk that financial institutions will fail to perform their obligations under our hedging instruments. Other than the use of financial products to deliver on our hedging strategy, we do not trade derivative financial instruments.
With our expanded presence in Europe, if uncertainty regarding the ability of certain European countries to continue servicing their sovereign debt or if austerity measures persist, the euro may weaken against the Canadian dollar. Similarly, if other currencies of countries where we operate weaken against the Canadian dollar, our consolidated financial results could be materially adversely impaired.
10.2. LEGAL PROCEEDINGS
The Company is involved in legal proceedings, audits, claims and litigation arising in the ordinary course of its business. Certain of these matters seek damages in significant amounts. Although the outcome of such matters is not predictable with assurance, the Company has no reason to believe that the disposition of any such current matter could reasonably be expected to have a material adverse effect on the Company’s financial position, results of operations or the ability to carry on any of its business activities. Please refer to Note 13 and 30 to the audited consolidated financial statements for more detailed information for legal proceedings.
Transfer Agent
Computershare Investor Services Inc.
(800) 564-6253
Investor Relations
Lorne Gorber
Senior Vice-President, Global Communications & Investor Relations
Telephone: (514) 841-3355
lorne.gorber@cgi.com
1350 René-Lévesque Boulevard West
15th Floor
Montreal, Quebec
H3G 1T4
Canada
54
FISCAL 2014 RESULTS
[This page intentionally left blank]
55
Consolidated Financial Statements
Management’s and Auditors’ reports
MANAGEMENT’S STATEMENT OF RESPONSIBILITY FOR FINANCIAL REPORTING
The management of CGI Group Inc. (“the Company”) is responsible for the preparation and integrity of the consolidated financial statements and the Management’s Discussion and Analysis (“MD&A”). The consolidated financial statements have been prepared in accordance with International Financial Reporting Standards and necessarily include some amounts that are based on management’s best estimates and judgement. Financial and operating data elsewhere in the MD&A are consistent with that contained in the accompanying consolidated financial statements.
To fulfill its responsibility, management has developed, and continues to maintain, systems of internal controls reinforced by the Company’s standards of conduct and ethics, as set out in written policies to ensure the reliability of the financial information and to safeguard its assets. The Company’s internal control over financial reporting and consolidated financial statements are subject to audit by the independent auditors, Ernst & Young LLP, whose report follows. They were appointed as independent auditors, by a vote of the Company’s shareholders, to conduct an integrated audit of the Company’s consolidated financial statements and of the Company’s internal control over financial reporting. In addition, the Executive Committee of the Company reviews the disclosure of corporate information and oversees the functioning of the Company’s disclosure controls and procedures.
Members of the Audit and Risk Management Committee of the Board of Directors, all of whom are independent of the Company, meet regularly with the independent auditors and with management to discuss internal controls in the financial reporting process, auditing matters and financial reporting issues and formulates the appropriate recommendations to the Board of Directors. The independent auditors have unrestricted access to the Audit and Risk Management Committee. The consolidated financial statements and MD&A have been reviewed and approved by the Board of Directors.
 |  | |||
Michael E. Roach | François Boulanger | |||
| President and Chief Executive Officer | Executive Vice-President and Chief Financial Officer | |||
November 12, 2014 | ||||
56
FISCAL 2014 RESULTS
Management’s and Auditors’ reports
MANAGEMENT REPORT ON INTERNAL CONTROL OVER FINANCIAL REPORTING
The management of the Company is responsible for establishing and maintaining adequate internal control over financial reporting. The Company’s internal control over financial reporting is a process designed to provide reasonable assurance regarding the reliability of financial reporting and the preparation of the Company’s consolidated financial statements for external reporting purposes in accordance with accounting principles generally accepted in Canada.
The Company’s internal control over financial reporting includes policies and procedures that:
- Pertain to the maintenance of records that, in reasonable detail, accurately and fairly reflect transactions and dispositions of the assets of the Company;
- Provide reasonable assurance that transactions are recorded as necessary to permit preparation of consolidated financial statements in accordance with accounting principles generally accepted in Canada, and that receipts and expenditures are being made only in accordance with authorizations of management and the directors of the Company; and,
- Provide reasonable assurance regarding prevention or timely detection of unauthorized acquisition, use or disposition of the Company’s assets that could have a material effect on the Company’s consolidated financial statements.
All internal control systems have inherent limitations; therefore, even where internal control over financial reporting is determined to be effective, it can provide only reasonable assurance. Projections of any evaluation of effectiveness to future periods are subject to the risk that the controls may become inadequate because of changes in conditions, or that the degree of compliance with the policies or procedures may deteriorate.
As of the end of the Company’s 2014 fiscal year, management conducted an assessment of the effectiveness of the Company’s internal control over financial reporting based on the framework established in Internal Control – Integrated Framework issued by the Committee of Sponsoring Organizations of the Treadway Commission (1992 Framework). Based on this assessment, management has determined the Company’s internal control over financial reporting as at September 30, 2014, was effective.
The effectiveness of the Company’s internal control over financial reporting as at September 30, 2014, has been audited by the Company’s independent auditors, as stated in their report appearing on page 58.
 |  | |||
Michael E. Roach | François Boulanger | |||
| President and Chief Executive Officer | Executive Vice-President and Chief Financial Officer | |||
November 12, 2014 | ||||
57
Consolidated Financial Statements
Management’s and Auditors’ reports
REPORT OF INDEPENDENT REGISTERED PUBLIC ACCOUNTING FIRM ON INTERNAL CONTROL OVER FINANCIAL REPORTING
To the Board of Directors and Shareholders of CGI Group Inc.
We have audited CGI Group Inc.’s (the “Company”) internal control over financial reporting as of September 30, 2014, based on criteria established in Internal Control – Integrated Framework issued by the Committee of Sponsoring Organizations of the Treadway Commission (1992 Framework) (“the COSO criteria”). The Company’s management is responsible for maintaining effective internal control over financial reporting, and for its assessment of the effectiveness of internal control over financial reporting included in the accompanying Management Report on Internal Control over Financial Reporting. Our responsibility is to express an opinion on the Company’s internal control over financial reporting based on our audit.
We conducted our audit in accordance with the standards of the Public Company Accounting Oversight Board (United States). Those standards require that we plan and perform the audit to obtain reasonable assurance about whether effective internal control over financial reporting was maintained in all material respects. Our audit included obtaining an understanding of internal control over financial reporting, assessing the risk that a material weakness exists, testing and evaluating the design and operating effectiveness of internal control based on the assessed risk, and performing such other procedures as we considered necessary in the circumstances. We believe that our audit provides a reasonable basis for our opinion.
A company’s internal control over financial reporting is a process designed to provide reasonable assurance regarding the reliability of financial reporting and the preparation of financial statements for external purposes in accordance with generally accepted accounting principles. A company’s internal control over financial reporting includes those policies and procedures that (1) pertain to the maintenance of records, that in reasonable detail, accurately and fairly reflect the transactions and dispositions of the assets of the Company; (2) provide reasonable assurance that transactions are recorded as necessary to permit preparation of financial statements in accordance with generally accepted accounting principles, and that receipts and expenditures of the Company are being made only in accordance with authorizations of management and directors of the Company; and (3) provide reasonable assurance regarding prevention or timely detection of unauthorized acquisition, use, or disposition of the Company’s assets that could have a material effect on the financial statements.
Because of its inherent limitations, internal control over financial reporting may not prevent or detect misstatements. Also, projections of any evaluation of effectiveness to future periods are subject to the risk that controls may become inadequate because of changes in conditions, or that the degree of compliance with the policies or procedures may deteriorate.
In our opinion, the Company maintained, in all material respects, effective internal control over financial reporting as of September 30, 2014 based on the COSO criteria.
We also have audited, in accordance with Canadian generally accepted auditing standards and the standards of the Public Company Accounting Oversight Board (United States), the consolidated financial statements of the Company as at and for the year ended September 30, 2014, and our report dated November 12, 2014 expressed an unqualified opinion thereon.
/s/ Ernst & Young LLP1 |
Ernst & Young LLP |
Montréal, Canada |
November 12, 2014 |
1. CPA auditor, CA, public accountancy permit No. A112431
58
FISCAL 2014 RESULTS
Management’s and Auditors’ reports
REPORT OF INDEPENDENT REGISTERED PUBLIC ACCOUNTING FIRM ON FINANCIAL STATEMENTS
To the Board of Directors and Shareholders of CGI Group Inc.
We have audited the accompanying consolidated financial statements of CGI Group Inc. (the “Company”), which comprise the consolidated balance sheets as of September 30, 2014 and 2013 and the consolidated statements of earnings, comprehensive income, changes in equity and cash flows for the years ended September 30, 2014 and 2013, and a summary of significant accounting policies and other explanatory information.
Management’s responsibility for the consolidated financial statements
Management is responsible for the preparation and fair presentation of these consolidated financial statements in accordance with International Financial Reporting Standards as issued by the International Accounting Standards Board, and for such internal control as management determines is necessary to enable the preparation of consolidated financial statements that are free from material misstatement, whether due to fraud or error.
Auditors’ responsibility
Our responsibility is to express an opinion on these consolidated financial statements based on our audits. We conducted our audits in accordance with Canadian generally accepted auditing standards and the standards of the Public Company Accounting Oversight Board (United States). Those standards require that we comply with ethical requirements and plan and perform the audit to obtain reasonable assurance about whether the consolidated financial statements are free from material misstatement.
An audit involves performing procedures to obtain audit evidence about the amounts and disclosures in the consolidated financial statements. The procedures selected depend on the auditors’ judgement, including the assessment of the risks of material misstatement of the consolidated financial statements, whether due to fraud or error. In making those risk assessments, the auditors consider internal control relevant to the entity’s preparation and fair presentation of the consolidated financial statements in order to design audit procedures that are appropriate in the circumstances. An audit also includes examining, on a test basis, evidence supporting the amounts and disclosures in the consolidated financial statements, evaluating the appropriateness of accounting policies used and the reasonableness of accounting estimates made by management, as well as evaluating the overall presentation of the consolidated financial statements.
We believe that the audit evidence we have obtained in our audits is sufficient and appropriate to provide a basis for our audit opinion.
Opinion
In our opinion, the consolidated financial statements present fairly, in all material respects, the financial position of CGI Group Inc. as at September 30, 2014 and 2013, and its financial performance and its cash flows for the years ended September 30, 2014 and 2013, in accordance with International Financial Reporting Standards as issued by the International Accounting Standards Board.
59
Consolidated Financial Statements
Management’s and Auditors’ reports
Other matter
We have also audited, in accordance with the standards of the Public company Accounting Oversight Board (United States), CGI Group Inc.’s internal control over financial reporting as of September 30, 2014, based on the criteria established inInternal Control – Integrated Framework issued by the Committee of Sponsoring Organizations of the Treadway Commission (1992 Framework) and our report dated November 12, 2014 expressed an unqualified opinion on the Company’s internal control over financial reporting.
 |
Ernst & Young LLP |
Montréal, Canada |
November 12, 2014 |
1. CPA auditor, CA, public accountancy permit No. A112431
60
FISCAL 2014 RESULTS
Consolidated Statements of Earnings
For the years ended September 30
(in thousands of Canadian dollars, except per share data)
| 2014 | 2013 | |||||||||
| $ | $ | |||||||||
Revenue | 10,499,692 | 10,084,624 | ||||||||
Operating expenses | ||||||||||
Costs of services, selling and administrative(Note 23) | 9,129,791 | 9,012,310 | ||||||||
Integration-related costs(Note 26b) | 127,341 | 338,439 | ||||||||
Finance costs(Note 25) | 101,278 | 113,931 | ||||||||
Finance income | (2,010) | (4,362) | ||||||||
Foreign exchange loss (gain) | 13,042 | (3,316) | ||||||||
| 9,369,442 | 9,457,002 | |||||||||
Earnings before income taxes | 1,130,250 | 627,622 | ||||||||
Income tax expense(Note 16) | 270,807 | 171,802 | ||||||||
Net earnings | 859,443 | 455,820 | ||||||||
Earnings per share(Note 21) | ||||||||||
Basic earnings per share | 2.78 | 1.48 | ||||||||
Diluted earnings per share | 2.69 | 1.44 | ||||||||
See Notes to the Consolidated Financial Statements.
61
Consolidated Financial Statements
Consolidated Statements of Comprehensive Income
For the years ended September 30
(in thousands of Canadian dollars)
| 2014 | 2013 | |||||||||
| $ | $ | |||||||||
Net earnings | 859,443 | 455,820 | ||||||||
Items that will be reclassified subsequently to net earnings (net of income taxes): | ||||||||||
Net unrealized gains on translating financial statements of foreign operations | 221,279 | 297,761 | ||||||||
Net losses on derivative financial instruments and on translating long-term debt designated as hedges of net investments in foreign operations | (100,869) | (143,785) | ||||||||
Net unrealized gains on cash flow hedges | 20,729 | 134 | ||||||||
Net unrealized gains (losses) on investments available for sale | 941 | (1,704) | ||||||||
Items that will not be reclassified subsequently to net earnings (net of income taxes): | ||||||||||
Net remeasurement losses | (35,311) | (30,845) | ||||||||
Other comprehensive income | 106,769 | 121,561 | ||||||||
Comprehensive income | 966,212 | 577,381 | ||||||||
See Notes to the Consolidated Financial Statements.
62
FISCAL 2014 RESULTS
Consolidated Balance Sheets
As at September 30
(in thousands of Canadian dollars)
| 2014 | 2013 | |||||||||
| $ | $ | |||||||||
Assets | ||||||||||
Current assets | ||||||||||
Cash and cash equivalents(Note 4) | 535,715 | 106,199 | ||||||||
Current derivative financial instruments(Note 31) | 9,397 | 1,344 | ||||||||
Accounts receivable(Note 5) | 1,036,068 | 1,205,625 | ||||||||
Work in progress | 807,989 | 911,848 | ||||||||
Prepaid expenses and other current assets | 174,137 | 218,446 | ||||||||
Income taxes | 8,524 | 17,233 | ||||||||
Total current assets before funds held for clients | 2,571,830 | 2,460,695 | ||||||||
Funds held for clients(Note 6) | 295,754 | 222,469 | ||||||||
Total current assets | 2,867,584 | 2,683,164 | ||||||||
Property, plant and equipment(Note 7) | 486,880 | 475,143 | ||||||||
Contract costs(Note 8) | 156,540 | 140,472 | ||||||||
Intangible assets(Note 9) | 630,074 | 708,165 | ||||||||
Other long-term assets(Note 10) | 74,158 | 58,429 | ||||||||
Long-term financial assets(Note 11) | 84,077 | 51,892 | ||||||||
Deferred tax assets(Note 16) | 323,416 | 368,217 | ||||||||
Goodwill(Note 12) | 6,611,323 | 6,393,790 | ||||||||
| 11,234,052 | 10,879,272 | |||||||||
Liabilities | ||||||||||
Current liabilities | ||||||||||
Accounts payable and accrued liabilities | 1,060,380 | 1,119,034 | ||||||||
Current derivative financial instruments(Note 31) | 4,588 | 6,882 | ||||||||
Accrued compensation | 583,979 | 713,933 | ||||||||
Deferred revenue | 457,056 | 508,267 | ||||||||
Income taxes | 156,283 | 156,358 | ||||||||
Provisions(Note 13) | 143,309 | 223,074 | ||||||||
Current portion of long-term debt(Note 14) | 80,367 | 534,173 | ||||||||
Total current liabilities before clients’ funds obligations | 2,485,962 | 3,261,721 | ||||||||
Clients’ funds obligations | 292,257 | 220,279 | ||||||||
Total current liabilities | 2,778,219 | 3,482,000 | ||||||||
Long-term provisions(Note 13) | 70,586 | 109,011 | ||||||||
Long-term debt(Note 14) | 2,599,336 | 2,332,377 | ||||||||
Other long-term liabilities(Note 15) | 308,387 | 434,653 | ||||||||
Long-term derivative financial instruments(Note 31) | 149,074 | 157,110 | ||||||||
Deferred tax liabilities(Note 16) | 155,972 | 155,329 | ||||||||
Retirement benefits obligations(Note 17) | 183,753 | 153,095 | ||||||||
| 6,245,327 | 6,823,575 | |||||||||
Equity | ||||||||||
Retained earnings | 2,356,008 | 1,551,956 | ||||||||
Accumulated other comprehensive income(Note 18) | 228,624 | 121,855 | ||||||||
Capital stock(Note 19) | 2,246,197 | 2,240,494 | ||||||||
Contributed surplus | 157,896 | 141,392 | ||||||||
| 4,988,725 | 4,055,697 | |||||||||
| 11,234,052 | 10,879,272 | |||||||||
See Notes to the Consolidated Financial Statements.
| Approved by the Board |
|
| ||||
| Michael E. Roach | Serge Godin | |||||
Director | Director | |||||


63
Consolidated Financial Statements
Consolidated Statements of Changes in Equity
For the years ended September 30
(in thousands of Canadian dollars)
| Retained earnings | Accumulated other comprehensive | Capital stock | Contributed surplus | Total equity | ||||||||||||||||
| $ | $ | $ | $ | $ | ||||||||||||||||
Balance as at September 30, 2013 | 1,551,956 | 121,855 | 2,240,494 | 141,392 | 4,055,697 | |||||||||||||||
Net earnings | 859,443 | — | — | — | 859,443 | |||||||||||||||
Other comprehensive income | — | 106,769 | — | — | 106,769 | |||||||||||||||
Comprehensive income | 859,443 | 106,769 | — | — | 966,212 | |||||||||||||||
Share-based payment costs | — | — | — | 31,716 | 31,716 | |||||||||||||||
Income tax impact associated with stock options | — | — | — | 3,269 | 3,269 | |||||||||||||||
Exercise of stock options(Note 19) | — | — | 83,305 | (18,380) | 64,925 | |||||||||||||||
Exercise of performance share units (“PSUs”)(Note 19) | — | — | 583 | (583) | — | |||||||||||||||
Repurchase of Class A subordinate shares(Note 19) | (55,391) | — | (56,077) | — | (111,468) | |||||||||||||||
Purchase of Class A subordinate shares held in trust(Note 19) | — | — | (23,016) | — | (23,016) | |||||||||||||||
Resale of Class A subordinate shares held in trust(Note 19) | — | — | 908 | 482 | 1,390 | |||||||||||||||
Balance as at September 30, 2014 | 2,356,008 | 228,624 | 2,246,197 | 157,896 | 4,988,725 | |||||||||||||||
| Retained earnings | Accumulated other comprehensive income | Capital stock | Contributed surplus | Total equity | ||||||||||||||||
| $ | $ | $ | $ | $ | ||||||||||||||||
Balance as at September 30, 2012 | 1,113,225 | 294 | 2,201,694 | 107,690 | 3,422,903 | |||||||||||||||
Net earnings | 455,820 | — | — | — | 455,820 | |||||||||||||||
Other comprehensive income | — | 121,561 | — | — | 121,561 | |||||||||||||||
Comprehensive income | 455,820 | 121,561 | — | — | 577,381 | |||||||||||||||
Share-based payment costs | — | — | — | 31,273 | 31,273 | |||||||||||||||
Income tax impact associated with stock options | — | — | — | 15,232 | 15,232 | |||||||||||||||
Exercise of stock options(Note 19) | — | — | 51,971 | (12,531) | 39,440 | |||||||||||||||
Exercise of performance share units (“PSUs”)(Note 19) | — | — | 272 | (272) | — | |||||||||||||||
Repurchase of Class A subordinate shares(Note 19) | (17,089) | — | (5,780) | — | (22,869) | |||||||||||||||
Purchase of Class A subordinate shares held in trust(Note 19) | — | — | (7,663) | — | (7,663) | |||||||||||||||
Balance as at September 30, 2013 | 1,551,956 | 121,855 | 2,240,494 | 141,392 | 4,055,697 | |||||||||||||||
See Notes to the Consolidated Financial Statements.
64
FISCAL 2014 RESULTS
Consolidated Statements of Cash Flows
For the years ended September 30
(in thousands of Canadian dollars)
| 2014 | 2013 | |||||||
| $ | $ | |||||||
Operating activities | ||||||||
Net earnings | 859,443 | 455,820 | ||||||
Adjustments for: | ||||||||
Amortization and depreciation(Note 24) | 444,232 | 435,944 | ||||||
Deferred income taxes(Note 16) | 54,360 | 34,714 | ||||||
Foreign exchange loss (gain) | 17,751 | (4,938) | ||||||
Share-based payment costs | 31,716 | 31,273 | ||||||
Net change in non-cash working capital items(Note 27) | (232,667) | (281,556) | ||||||
Cash provided by operating activities | 1,174,835 | 671,257 | ||||||
Investing activities | ||||||||
Net change in short-term investments | 73 | 11,843 | ||||||
Business acquisition | — | (5,140) | ||||||
Purchase of property, plant and equipment | (181,471) | (141,965) | ||||||
Proceeds from sale of property, plant and equipment | 13,673 | — | ||||||
Additions to contract costs | (73,900) | (31,207) | ||||||
Additions to intangible assets | (77,726) | (71,447) | ||||||
Purchase of long-term investments | (15,059) | (10,518) | ||||||
Proceeds from sale of long-term investments | 6,880 | 6,402 | ||||||
Payments received from long-term receivable | 6,377 | 8,177 | ||||||
Cash used in investing activities | (321,153) | (233,855) | ||||||
Financing activities | ||||||||
Net change in unsecured committed revolving credit facility | (283,049) | (467,027) | ||||||
Increase of long-term debt | 1,021,918 | 80,333 | ||||||
Repayment of long-term debt | (1,047,261) | (68,057) | ||||||
Settlement of derivative financial instruments(Note 31) | (37,716) | — | ||||||
Purchase of Class A subordinate shares held in trust(Note 19) | (23,016) | (7,663) | ||||||
Resale of Class A subordinate shares held in trust | 1,390 | — | ||||||
Repurchase of Class A subordinate shares(Note 19) | (111,468) | (22,869) | ||||||
Issuance of Class A subordinate shares | 65,138 | 39,312 | ||||||
Cash used in financing activities | (414,064) | (445,971) | ||||||
Effect of foreign exchange rate changes on cash and cash equivalents | (10,102) | 1,665 | ||||||
Net increase (decrease) in cash and cash equivalents | 429,516 | (6,904) | ||||||
Cash and cash equivalents, beginning of year | 106,199 | 113,103 | ||||||
Cash and cash equivalents, end of year(Note 4) | 535,715 | 106,199 | ||||||
Supplementary cash flow information (Note 27).
See Notes to the Consolidated Financial Statements.
65
Consolidated Financial Statements
Notes to the Consolidated Financial Statements
For the years ended September 30, 2014 and 2013
(tabular amounts only are in thousands of Canadian dollars, except per share data)
| 1. | Description of business |
CGI Group Inc. (the “Company”), directly or through its subsidiaries, manages information technology (“IT”) services as well as business process services (“BPS”) to help clients effectively realize their strategies and create added value. The Company’s services include the management of IT and business functions (“outsourcing”), systems integration and consulting, as well as the sale of software solutions. The Company was incorporated under Part IA of the Companies Act (Québec) predecessor to the Business Corporations Act (Québec) which came into force on February 14, 2011 and its shares are publicly traded. The executive and registered office of the Company is situated at 1350 René-Lévesque Blvd. West, Montréal, Québec, Canada, H3G 1T4.
| 2. | Basis of preparation |
These consolidated financial statements have been prepared in accordance with International Financial Reporting Standards (“IFRS”) and the International Financial Reporting Interpretations Committee interpretations as issued by the International Accounting Standards Board (“IASB”). The accounting policies were consistently applied to all periods presented.
The Company’s consolidated financial statements for the years ended September 30, 2014 and 2013 were authorized for issue by the Board of Directors on November 12, 2014.
| 3. | Summary of significant accounting policies |
BASIS OF CONSOLIDATION
The consolidated financial statements include the accounts of the Company and its subsidiaries. All intercompany transactions and balances have been eliminated on consolidation.
Subsidiaries are entities controlled by the Company. The Company controls an entity when it is exposed or has right, to variable returns from its involvement with the entity and has the ability to affect those returns through its power over the relevant activities of the entity. Subsidiaries are fully consolidated from the date of acquisition and continue to be consolidated until the date control over the subsidiaries ceases.
BASIS OF MEASUREMENT
The consolidated financial statements have been prepared on a historical cost basis, except for certain financial assets and liabilities, which have been measured at fair value as described below.
66
FISCAL 2014 RESULTS
Notes to the Consolidated Financial Statements
For the years ended September 30, 2014 and 2013
(tabular amounts only are in thousands of Canadian dollars, except per share data)
| 3. | Summary of significant accounting policies (continued) |
USE OF JUDGEMENTS AND ESTIMATES
The preparation of the consolidated financial statements requires management to make judgements and estimates that affect the reported amounts of assets, liabilities, equity, the accompanying disclosures at the date of the consolidated financial statements and the reported amounts of revenue and expenses during the reporting period. Because the use of judgements and estimates is inherent in the financial reporting process, actual results could differ.
Significant judgements and estimates about the future and other major sources of estimation uncertainty at the end of the reporting period could have a significant risk of causing a material adjustment to the carrying amounts of the following: deferred tax assets, revenue recognition, estimated losses on revenue-generating contracts, goodwill impairment, business combinations, provisions for income tax uncertainties and litigations and claims.
The use of judgments, apart from those involving estimations, that have the most significant effect on the amounts recognized in the financial statements are:
Multiple component arrangements
Assessing whether the deliverables within an arrangement are separately identifiable components requires judgement by management. A component is considered as separately identifiable if it has value to the client on a stand-alone basis. The Company first reviews the contract clauses to evaluate if the deliverable is accepted separately by the client. Then, the Company assesses if the deliverable could have been provided by another vendor and if it would have been possible for the client to decide to not purchase the deliverable.
Deferred tax assets
Deferred tax assets are recognized for unused tax losses to the extent that it is probable that taxable profit will be available against which the losses can be utilized. Management judgment is required concerning uncertainties that exist with respect to the timing of future taxable income required to recognize a deferred tax asset. The Company recognizes an income tax benefit only when it is probable that the tax benefit will be realized in the future. In making this judgement, the Company assesses forecast and the availability of future tax planning strategies.
A description of estimations is included in the respective sections within the Notes to the Consolidated Financial Statements and in Note 3, “Summary of significant accounting policies”.
67
Consolidated Financial Statements
Notes to the Consolidated Financial Statements
For the years ended September 30, 2014 and 2013
(tabular amounts only are in thousands of Canadian dollars, except per share data)
| 3. | Summary of significant accounting policies (continued) |
REVENUE RECOGNITION, WORK IN PROGRESS AND DEFERRED REVENUE
The Company generates revenue principally through the provision of IT services and BPS as described in Note 1.
The Company provides services and products under arrangements that contain various pricing mechanisms. The Company recognizes revenue when the following criteria are met: there is clear evidence that an arrangement exists, the amount of revenue and related costs can be measured reliably, it is probable that future economic benefits will flow to the Company, the stage of completion can be measured reliably where services are delivered and the significant risks and rewards of ownership, including effective control, are transferred to clients where products are sold. Revenue is measured at the fair value of the consideration received or receivable net of discounts, volume rebates and sales related taxes.
Some of the Company’s arrangements may include client acceptance clauses. Each clause is analyzed to determine whether the earnings process is complete when the service is performed. Formal client sign-off is not always necessary to recognize revenue provided that the Company objectively demonstrates that the criteria specified in the acceptance provisions are satisfied. Some of the criteria reviewed include historical experience with similar types of arrangements, whether the acceptance provisions are specific to the client or are included in all arrangements, the length of the acceptance term and historical experience with the specific client.
Revenue from sales of third party vendor products, such as software licenses, hardware, or services is recorded gross when the Company is a principal to the transaction and is recorded net of costs when the Company is acting as an agent between the client and vendor. Factors generally considered to determine whether the Company is a principal or an agent are if the Company is the primary obligor to the client, if it adds meaningful value to the vendor’s product or service and if it assumes delivery and credit risks.
Relative selling price
The Company’s arrangements often include a mix of the services and products listed below. If an arrangement involves the provision of multiple components, the total arrangement value is allocated to each separately identifiable component based on its relative selling price. When estimating selling price of each component, the Company maximizes the use of observable prices which are established using the Company’s prices for same or similar components. When observable prices are not available, the Company estimates selling prices based on its best estimate. The best estimate of selling price is the price at which the Company would normally expect to offer the services or products and is established by considering a number of internal and external factors including, but not limited to, geographies, the Company’s pricing policies, internal costs and margins. The appropriate revenue recognition method is applied for each separately identifiable component as described below.
Outsourcing
Revenue from outsourcing and BPS arrangements is generally recognized as the services are provided at the contractually stated price, unless there is a better measure of performance or delivery.
Systems integration and consulting services
Revenue from systems integration and consulting services under time and material arrangements is recognized as the services are rendered, and revenue under cost-based arrangements is recognized as reimbursable costs are incurred.
Revenue from systems integration and consulting services under fixed-fee arrangements where the outcome of the arrangements can be estimated reliably is recognized using the percentage-of-completion method over the service periods. The Company uses the labour costs or labour hours to measure the progress towards completion. This method relies on estimates of total expected labour costs or total expected labour hours to complete the service, which are compared to labour costs or labour hours incurred to date, to arrive at an estimate of the percentage of revenue earned to date. Management regularly reviews underlying estimates of total expected labour costs or hours. If the outcome of an arrangement cannot be estimated reliably, revenue is recognized to the extent of arrangement costs incurred that are likely to be recoverable.
Revenue from benefits-funded arrangements is recognized only to the extent that it is probable that the benefit stream associated with the transaction will generate amounts sufficient to fund the value on which revenue recognition is based.
68
FISCAL 2014 RESULTS
Notes to the Consolidated Financial Statements
For the years ended September 30, 2014 and 2013
(tabular amounts only are in thousands of Canadian dollars, except per share data)
| 3. | Summary of significant accounting policies (continued) |
REVENUE RECOGNITION, WORK IN PROGRESS AND DEFERRED REVENUE (CONTINUED)
Software licenses
Most of the Company’s software license arrangements include other services such as implementation, customization and maintenance. For these types of arrangements, revenue from a software license is recognized upon delivery if it has been identified as a separately identifiable component. Otherwise, it is combined with the implementation and customization services and is accounted for as described in “Systems integration and consulting services” above. Revenue from maintenance services for software licenses sold and implemented is recognized ratably over the term of the maintenance period.
Work in progress and deferred revenue
Amounts recognized as revenue in excess of billings are classified as work in progress. Amounts received in advance of the delivery of products or performance of services are classified as deferred revenue.
Estimated losses on revenue-generating contracts
Estimated losses on revenue-generating contracts may occur due to additional contract costs which were not foreseen at inception of the contract. Contract losses are measured at the amount by which the estimated total costs exceed the estimated total revenue from the contract. The estimated losses on revenue-generating contracts are recognized in the period when it is determined that a loss is probable. The expected loss is first applied to impair the related capitalized contract costs with the excess recorded in accounts payable and accrued liabilities and in other long-term liabilities. Management regularly reviews arrangement profitability and the underlying estimates.
CASH AND CASH EQUIVALENTS
Cash and cash equivalents consist of unrestricted cash and short-term investments having an initial maturity of three months or less.
FUNDS HELD FOR CLIENTS AND CLIENTS’ FUNDS OBLIGATIONS
In connection with the Company’s payroll, tax filing and claims services, the Company collects funds for payment of payroll, taxes and claims, temporarily holds such funds until payment is due, remits the funds to the clients’ employees, appropriate tax authorities or claim holders, and files federal and local tax returns and handles related regulatory correspondence and amendments. The funds held for clients include cash and long-term bonds. The Company presents the funds held for clients and related obligations separately. Funds held for clients are classified as current assets since, based upon management’s intentions, these funds are held solely for the purpose of satisfying the clients’ funds obligations, which will be repaid within one year of the consolidated balance sheets date.
Interest income earned and realized gains and losses on the disposal of bonds are recorded in revenue in the period that the income is earned, since the collecting, holding and remitting of these funds are critical components of providing these services.
PROPERTY, PLANT AND EQUIPMENT
Property, plant and equipment (“PP&E”), including those under finance leases, are recorded at cost and are depreciated over their estimated useful lives using the straight-line method.
Buildings | 10 to 40 years | |
Leasehold improvements | Lesser of the useful life or lease term | |
Furniture, fixtures and equipment | 3 to 20 years | |
Computer equipment | 3 to 5 years |
69
Consolidated Financial Statements
Notes to the Consolidated Financial Statements
For the years ended September 30, 2014 and 2013
(tabular amounts only are in thousands of Canadian dollars, except per share data)
| 3. | Summary of significant accounting policies (continued) |
LEASES
Leases are classified as finance leases whenever the terms of the lease transfer substantially all the risks and rewards of ownership to the lessee. All other leases are classified as operating leases.
Assets held under finance leases are initially recognized in PP&E at an amount equal to the fair value of the leased assets or, if lower, the present value of minimum lease payments at the inception of the lease, and then depreciated over the economic useful life of the asset or term of the lease, whichever is shorter. The capital element of future lease payments is included in the consolidated balance sheets within long-term debt. Interest is charged to the consolidated statements of earnings so as to achieve a constant rate of interest on the remaining balance of the liability.
Lease payments under operating leases are charged to the consolidated statements of earnings on a straight-line basis over the lease term. Operating lease incentives are recognized as a reduction in the rental expense over the lease term.
CONTRACT COSTS
Contract costs are mainly incurred when acquiring or implementing long-term outsourcing contracts. Contract costs are comprised primarily of transition costs and incentives.
Transition costs
Transition costs consist of costs associated with the installation of systems and processes incurred after the award of outsourcing contracts, relocation of transitioned employees and exit from client facilities. Under BPS contracts, the costs consist primarily of costs related to activities such as the conversion of the client’s applications to the Company’s platforms. Transition costs are comprised essentially of labour costs, including compensation and related fringe benefits, as well as subcontractor costs.
Incentives
Occasionally, incentives are granted to clients upon the signing of outsourcing contracts. These incentives are granted in the form of cash payments.
Pre-contract costs
Pre-contract costs associated with acquiring or implementing long-term outsourcing contracts are expensed as incurred except where it is virtually certain that the contracts will be awarded and the costs are directly related to the acquisition of the contract. For outsourcing contracts, the Company is virtually certain that a contract will be awarded when the Company is selected by the client following a tender process but the contract has not yet been signed.
Amortization of contract costs
Contract costs are amortized as services are provided. Amortization of transition costs and pre-contract costs is included in costs of services, selling and administrative and amortization of incentives is recorded as a reduction of revenue.
Impairment of contract costs
When a contract is not expected to be profitable, the expected loss is first applied to impair the related capitalized contract costs. The excess of the expected loss over the capitalized contract costs is recorded as estimated losses on revenue-generating contracts in accounts payable and accrued liabilities and in other long-term liabilities. If at a future date the contract returns to profitability, the previously recognized impairment loss must be reversed. First the estimated losses on revenue-generating contracts must be reversed, and if there is still additional projected profitability then any capitalized contract costs that were impaired must be reversed. The reversal of the impairment loss is limited so that the carrying amount does not exceed its recoverable amount, nor exceed the carrying amount that would have been determined, net of amortization, had no impairment loss been recognized for the contract costs in prior years.
70
FISCAL 2014 RESULTS
Notes to the Consolidated Financial Statements
For the years ended September 30, 2014 and 2013
(tabular amounts only are in thousands of Canadian dollars, except per share data)
| 3. | Summary of significant accounting policies (continued) |
INTANGIBLE ASSETS
Intangible assets consist mainly of internal-use software, business solutions, software licenses and client relationships. Internal-use software, business solutions and software licenses are recorded at cost. Business solutions developed internally and marketed are capitalized when they meet specific capitalization criteria related to technical, market and financial feasibility. Internal-use software developed internally is capitalized when it meets specific capitalization criteria related to technical and financial feasibility and when the Company demonstrates its ability and intention to use it. Internal-use software, business solutions, software licenses and client relationships acquired through business combinations are initially recorded at their fair value based on the present value of expected future cash flows, which involve making estimates about the future cash flows, as well as discount rates.
Amortization of intangible assets
The Company amortizes its intangible assets using the straight-line method over the following estimated useful lives:
Internal-use software | 2 to 7 years | |
Business solutions | 2 to 10 years | |
Software licenses | 3 to 8 years | |
Client relationships and other | 2 to 10 years |
IMPAIRMENT OF PP&E, INTANGIBLE ASSETS AND GOODWILL
Timing of impairment testing
The carrying values of PP&E, intangible assets and goodwill are reviewed for impairment when events or changes in circumstances indicate that the carrying value may be impaired. The Company assesses at each reporting date whether any such events or changes in circumstances exist. The carrying value of PP&E and intangible assets not available for use and goodwill is tested for impairment annually as at September 30.
Impairment testing
If any indication of impairment exists or when annual impairment testing for an asset is required, the Company estimates the recoverable amount of the asset or cash-generating unit (“CGU”) to which the asset relates to determine the extent of any impairment loss. The recoverable amount is the higher of an asset’s or CGU’s fair value less costs of disposal and its value in use (“VIU”) to the Company. The Company mainly uses the VIU. In assessing VIU, estimated future cash flows are discounted to their present value using a discount rate that reflects current market assessments of the time value of money and the risks specific to the asset or CGU. In determining fair value less costs of disposal, recent market transactions are taken into account, if available. If the recoverable amount of an asset or a CGU is estimated to be less than its carrying amount, the carrying amount is reduced to its recoverable amount. An impairment loss is recognized immediately in the consolidated statements of earnings.
Goodwill acquired through business combinations is allocated to the CGU or group of CGUs that are expected to benefit from synergies of the related business combination. The group of CGUs that benefit from the synergies correspond to the Company’s operating segments. For goodwill impairment testing purposes, the group of CGUs that represent the lowest level within the Company at which management monitors goodwill is the operating segment level.
The recoverable amount of each segment has been determined based on the VIU calculation which includes estimates about their future financial performance based on cash flows approved by management covering a period of five years as the Company generates revenue mainly through long-term contracts. Key assumptions used in the VIU calculations are the discount rate applied and the long-term growth rate of net operating cash flows. In determining these assumptions, management has taken into consideration the current economic environment and its resulting impact on expected growth and discount rates. The cash flow projections reflect management’s expectations of the segment’s operating performance and growth prospects in the operating segment’s market. The discount rate applied to an operating segment is the weighted average cost of capital (“WACC”). Management considers factors such as country risk premium, risk-free rate, size premium and cost of debt to derive the WACC. Impairment losses relating to goodwill cannot be reversed in future periods.
71
Consolidated Financial Statements
Notes to the Consolidated Financial Statements
For the years ended September 30, 2014 and 2013
(tabular amounts only are in thousands of Canadian dollars, except per share data)
| 3. | Summary of significant accounting policies (continued) |
IMPAIRMENT OF PP&E, INTANGIBLE ASSETS AND GOODWILL (CONTINUED)
Impairment testing (continued)
For impaired assets, other than goodwill, an assessment is made at each reporting date as to whether there is any indication that previously recognized impairment losses may no longer exist or may have decreased. If such indication exists, the Company estimates the asset’s recoverable amount. A previously recognized impairment loss is reversed only if there has been a change in the assumptions used to determine the asset’s recoverable amount since the last impairment loss was recognized. The reversal is limited so that the carrying amount of the asset does not exceed its recoverable amount, nor exceed the carrying amount that would have been determined, net of amortization, had no impairment loss been recognized for the asset in prior years. Such reversal is recognized in the consolidated statements of earnings.
LONG-TERM FINANCIAL ASSETS
Long-term investments presented in long-term financial assets are comprised of bonds which are classified as long-term based on management’s intentions.
BUSINESS COMBINATIONS
The Company accounts for its business combinations using the acquisition method. Under this method the consideration transferred is measured at fair value. Acquisition-related and integration costs associated with the business combination are expensed as incurred. The Company recognizes goodwill as the excess of the cost of the acquisition over the net identifiable tangible and intangible assets acquired and liabilities assumed at their acquisition-date fair values. The fair value allocated to tangible and intangible assets acquired and liabilities assumed are based on assumptions of management. These assumptions include the future expected cash flows arising from the intangible assets identified as client relationships, business solutions, and trademarks. The preliminary goodwill recognized is composed of the future economic value associated to acquired work force and synergies with the Company’s operations which are primarily due to reduction of costs and new business opportunities. The determination of fair value involves making estimates relating to acquired intangible assets, PP&E, litigation, provision for estimated losses on revenue-generating contracts, other onerous contracts and contingency reserves. Estimates include the forecasting of future cash flows and discount rates. Subsequent changes in fair values are adjusted against the cost of acquisition if they qualify as measurement period adjustments. The measurement period is the period between the date of acquisition and the date where all significant information necessary to determine the fair values is available, not to exceed 12 months. All other subsequent changes are recognized in the consolidated statements of earnings.
EARNINGS PER SHARE
Basic earnings per share is based on the weighted average number of shares outstanding during the period. Diluted earnings per share is determined using the treasury stock method to evaluate the dilutive effect of stock options and PSUs.
RESEARCH AND SOFTWARE DEVELOPMENT COSTS
Research costs are charged to earnings in the period in which they are incurred, net of related tax credits. Software development costs are charged to earnings in the year they are incurred, net of related tax credits, unless they meet specific capitalization criteria related to technical, market and financial feasibility.
TAX CREDITS
The Company follows the income approach to account for tax credits, whereby investment tax credits are recorded when there is a reasonable assurance that the assistance will be received and that the Company will comply with all relevant conditions. Under this method, tax credits related to operating expenditures are recorded as a reduction of the related expense and recognized in the period in which the related expenditures are charged to operations. Tax credits related to capital expenditures are recorded as a reduction of the cost of the related asset. The tax credits recorded are based on management’s best estimates of amounts expected to be received and are subject to audit by the taxation authorities.
72
FISCAL 2014 RESULTS
Notes to the Consolidated Financial Statements
For the years ended September 30, 2014 and 2013
(tabular amounts only are in thousands of Canadian dollars, except per share data)
| 3. | Summary of significant accounting policies (continued) |
INCOME TAXES
Income taxes are accounted for using the liability method of accounting.
Current income taxes are recognized with respect to the amounts expected to be paid or recovered under the tax rates and laws that have been enacted or substantively enacted at the balance sheet date.
Deferred income tax assets and liabilities are determined based on deductible or taxable temporary differences between the amounts reported for financial statement purposes and tax values of the assets and liabilities using enacted or substantively enacted tax rates that will be in effect for the year in which the differences are expected to be recovered or settled. Deferred income tax assets and liabilities are recognized in earnings, other comprehensive income or in equity based on the classification of the item to which they relate.
Deferred tax assets are recognized for unused tax losses to the extent that it is probable that taxable profit will be available against which the losses can be utilized. Once this assessment is made, the Company considers the analysis of forecast and future tax planning strategies. Such estimates are made based on the forecast by jurisdiction on an undiscounted basis. Management considers factors such as the number of years to include in the forecast period, the history of the taxable profits and availability of tax strategies.
The Company is subject to taxation in numerous jurisdictions and there are transactions and calculations for which the ultimate tax determination is uncertain. When a tax position is uncertain, the Company recognizes an income tax benefit or reduces an income tax liability only when it is probable that the tax benefit will be realized in the future or that the income tax liability is no longer probable. The provision for uncertain tax positions is made using the best estimate of the amount expected to be paid based on qualitative assessment of all relevant factors.
PROVISIONS
Provisions are recognized when the Company has a present legal or constructive obligation as a result of a past event, it is probable that an outflow of resources embodying economic benefits will be required to settle the obligation and a reliable estimate can be made of the amount of the obligation. The Company’s provisions consist of liabilities for leases of premises that the Company has vacated, litigation and claim provisions arising in the ordinary course of business and decommissioning liabilities for operating leases of office buildings. The Company also records restructuring provisions mainly related to business acquisitions.
The amount recognized as a provision is the best estimate of the consideration required to settle the present obligation at the end of the reporting period, taking into account the risks and uncertainties surrounding the obligation. Provisions are discounted using a current pre-tax rate when the impact of the time value of money is material. The increase in the provision due to the passage of time is recognized as finance cost.
The Company accrues provisions for onerous leases which consist of estimated costs associated with vacated premises. The provisions reflect the present value of lease payments in excess of the expected sublease proceeds on the remaining term of the lease.
The accrued litigation and legal claim provisions are based on historical experience, current trends and other assumptions that are believed to be reasonable under the circumstances. Estimates include the period in which the underlying cause of the claim occurred and the degree of probability of an unfavourable outcome.
Decommissioning liabilities pertain to operating leases of office buildings where certain arrangements require premises to be returned to their original state at the end of the lease term. The provision is determined using the present value of the estimated future cash outflows.
Restructuring provisions, consisting of severances, are recognized when a detailed formal plan identifies the business or part of the business concerned, the location and number of employees affected, a detailed estimate of the associated costs, an appropriate timeline and has been communicated.
73
Consolidated Financial Statements
Notes to the Consolidated Financial Statements
For the years ended September 30, 2014 and 2013
(tabular amounts only are in thousands of Canadian dollars, except per share data)
| 3. | Summary of significant accounting policies (continued) |
TRANSLATION OF FOREIGN CURRENCIES
The Company’s consolidated financial statements are presented in Canadian dollars, which is also the parent company’s functional currency. Each entity in the Company determines its own functional currency and items included in the financial statements of each entity are measured using that functional currency. Functional currency is the currency of the primary economic environment in which the entity operates.
Foreign currency transactions and balances
Revenue, expenses and non-monetary assets and liabilities denominated in foreign currencies are recorded at the rate of exchange prevailing at the transaction date. Monetary assets and liabilities denominated in foreign currencies are translated at exchange rates prevailing at the balance sheet date. Unrealized and realized translation gains and losses are reflected in the consolidated statements of earnings.
Foreign operations
For foreign operations that have functional currencies different from the Company, assets and liabilities denominated in a foreign currency are translated into Canadian dollars at exchange rates in effect at the balance sheet date. Revenue and expenses are translated at average exchange rates prevailing during the period. Resulting unrealized gains or losses on translating financial statements of foreign operations are reported in other comprehensive income.
For foreign operations with the same functional currency as the Company, monetary assets and liabilities are translated at the exchange rates in effect at the balance sheet date and non-monetary assets and liabilities are translated at historical exchange rates. Revenue and expenses are translated at average exchange rates for the period. Translation exchange gains or losses of such operations are reflected in the consolidated statements of earnings.
SHARE-BASED PAYMENTS
Equity-settled plans
The Company operates equity-settled stock option and PSU plans under which the Company receives services from employees and others as consideration for equity instruments.
The fair value of those share-based payments is established on the grant date using the Black-Scholes option pricing model for the stock options and the closing price of Class A subordinate shares of the Company on the Toronto Stock Exchange (“TSX”) for the PSUs. The number of stock options and PSUs expected to vest are estimated on the grant date and subsequently revised on each reporting date. For stock options, the estimation of fair value requires making assumptions for the most appropriate inputs to the valuation model including the expected life of the option and expected stock price volatility. The fair values, adjusted for expectations related to performance conditions and for expected forfeitures, are recognized as share-based payment costs in earnings with a corresponding credit to contributed surplus on a graded-vesting basis over the vesting period.
When stock options are exercised, any consideration paid is credited to capital stock and the recorded fair value of the stock option is removed from contributed surplus and credited to capital stock. When PSUs are exercised, the recorded fair value of PSUs is removed from contributed surplus and credited to capital stock.
Share purchase plan
The Company operates a share purchase plan for eligible employees. Under this plan, the Company matches the contributions made by employees up to a maximum percentage of the employee’s salary. The Company contributions to the plan are recognized in salaries and other member costs within cost of services, selling and administrative.
Cash-settled deferred share units
The Company operates a deferred share unit (“DSU”) plan to compensate the members of the Board of Directors.
The Company measures the compensation granted at the fair value of the liability. The fair value of the liability is established by dividing the total fee payable by the closing price of Class A subordinate shares of the Company on the TSX on the day immediately preceding the fee payment date. Until the liability is settled, the Company remeasures the fair value of the liability at each reporting date using the market value of the shares issued. The DSU liability is presented in accrued compensation and fluctuations in fair value are recognized in salaries and other member costs within cost of services, selling and administrative.
74
FISCAL 2014 RESULTS
Notes to the Consolidated Financial Statements
For the years ended September 30, 2014 and 2013
(tabular amounts only are in thousands of Canadian dollars, except per share data)
| 3. | Summary of significant accounting policies (continued) |
FINANCIAL INSTRUMENTS
All financial instruments are initially measured at their fair values. Subsequently, financial assets classified as loans and receivables and financial liabilities classified as other liabilities are measured at their amortized cost using the effective interest rate method. Financial assets and liabilities classified as fair value through earnings (“FVTE”) and classified as available for sale are measured subsequently at their fair values.
Financial instruments may be designated on initial recognition as FVTE if any of the following criteria are met: i) the financial instrument contains one or more embedded derivatives that otherwise would have to be accounted for separately; ii) the designation eliminates or significantly reduces a measurement or recognition inconsistency that would otherwise arise from measuring the financial asset or liability or recognizing the gains and losses on them on a different basis; or iii) the financial asset and financial liability are part of a group of financial assets or liabilities that is managed and its performance evaluated on a fair value basis, in accordance with a documented risk management or investment strategy. Gains and losses related to periodic revaluations of financial assets and liabilities designated as FVTE are recorded in the consolidated statements of earnings.
The unrealized gains and losses, net of applicable income taxes, on available for sale assets are reported in other comprehensive income. Interest income earned and realized gains and losses on the sale of available for sale assets are recorded in the consolidated statements of earnings.
Transaction costs are comprised primarily of legal, accounting and other costs directly attributable to the issuance of the respective financial assets and liabilities. Transaction costs are capitalized to the cost of financial assets and liabilities classified as other than FVTE.
Financial assets are derecognized if the contractual rights to the cash flows from the financial asset expire or the asset is transferred and the transfer qualifies for derecognition. The transfer qualifies for derecognition if substantially all the risks and rewards of ownership of the financial asset are transferred.
The Company has made the following classifications:
FVTE
Cash and cash equivalents and derivative financial instruments (unless they qualify for hedge accounting, refer to “Derivative Financial Instruments and Hedging Transactions”). In addition, deferred compensation plan assets were designated by management as FVTE upon initial recognition as this reflected management’s investment strategy.
Loans and receivables
Trade accounts receivable, cash included in funds held for clients and long-term receivables.
Available for sale
Long-term bonds included in funds held for clients and in long-term investments.
Other liabilities
Accounts payable and accrued liabilities, accrued compensation, long-term debt and clients’ funds obligations.
75
Consolidated Financial Statements
Notes to the Consolidated Financial Statements
For the years ended September 30, 2014 and 2013
(tabular amounts only are in thousands of Canadian dollars, except per share data)
| 3. | Summary of significant accounting policies (continued) |
FINANCIAL INSTRUMENTS (CONTINUED)
Fair value hierarchy
Fair value measurements recognized in the balance sheet are categorized in accordance with the following levels:
Level 1: quoted prices (unadjusted) in active markets for identical assets or liabilities;
Level 2: inputs other than quoted prices included in Level 1, but that are observable for the asset or liability, either directly or indirectly; and
Level 3: inputs for the asset or liability that are not based on observable market data.
DERIVATIVE FINANCIAL INSTRUMENTS AND HEDGING TRANSACTIONS
The Company enters into a variety of derivative financial instruments to manage its exposure to interest rate and foreign currency exchange risks.
Derivative financial instruments are initially recognized at fair value at the date the derivative contracts are entered into and are subsequently remeasured to their fair value at the end of each reporting date. The resulting gain or loss is recognized in the consolidated statements of earnings unless the derivative is designated and is effective as a hedging instrument, in which event the timing of the recognition in the consolidated statements of earnings depends on the nature of the hedge relationship.
At the inception of a hedge relationship, the Company formally designates and documents the hedge relationship to which the Company wishes to apply hedge accounting and the risk management objective and strategy for undertaking the hedge. The documentation includes identification of the hedging instrument, the hedged item or transaction, the nature of the risk being hedged and how the Company will assess the effectiveness of changes in the hedging instrument’s fair value in offsetting the exposure to changes in the hedged item’s fair value or cash flows attributable to the hedged risk. Such hedges are expected to be highly effective in achieving offsetting changes in fair value or cash flows and are assessed on an ongoing basis to determine that they actually have been highly effective throughout the financial reporting periods for which they were designated.
The cash flows of the hedging transactions are classified in the same manner as the cash flows of the position being hedged.
NET INVESTMENT HEDGES
Hedges on net investments in foreign operations
The Company uses cross-currency swaps and foreign currency denominated long-term debt to hedge portions of the Company’s net investments in its U.S. and European operations. Foreign exchange translation gains or losses on the net investments and the effective portions of gains or losses on instruments hedging the net investments are recorded in other comprehensive income. To the extent that the hedge is ineffective, such differences are recognized in consolidated statements of earnings. When the hedged net investment is disposed of, the relevant amount in other comprehensive income is transferred to earnings as part of the gain or loss on disposal.
76
FISCAL 2014 RESULTS
Notes to the Consolidated Financial Statements
For the years ended September 30, 2014 and 2013
(tabular amounts only are in thousands of Canadian dollars, except per share data)
| 3. | Summary of significant accounting policies (continued) |
DERIVATIVE FINANCIAL INSTRUMENTS AND HEDGING TRANSACTIONS (CONTINUED)
CASH FLOW HEDGES
Cash flow hedges on future revenue
The Company has entered into various foreign currency forward contracts to hedge the variability in the foreign currency exchange rates.
Cash flow hedge on unsecured committed term loan credit facility
The Company has entered into interest rate swaps to hedge the cash flow exposure of the issued variable rate unsecured committed term loan credit facility. Under the interest rate swaps, the Company receives a variable rate of interest and pays interest at a fixed rate on the notional amount.
The above hedges were documented as cash flow hedges and no component of the derivative contracts’ fair value are excluded from the assessment and measurement of hedge effectiveness. The effective portion of the change in fair value of the derivative financial instruments is recognized in other comprehensive income and the ineffective portion, if any, in the consolidated statements of earnings. The effective portion of the change in fair value of the derivatives is reclassified out of other comprehensive income into the consolidated statements of earnings when the hedged element is recognized in the consolidated statements of earnings.
FAIR VALUE HEDGES
Fair value hedges on Senior U.S. unsecured notes
The Company entered into interest rate swaps to hedge the fair value exposure of the issued fixed rate Senior U.S. unsecured notes. Under the interest rate swaps, the Company receives a fixed rate of interest and pays interest at a variable rate on the notional amount.
The changes in the fair value of the interest rate swaps are recognized in the consolidated statements of earnings as finance costs. The changes in the fair value of the hedged items attributable to the risk hedged is recorded as part of the carrying value of the Senior U.S. unsecured notes and are also recognized in the consolidated statements of earnings as finance costs. If the hedged items are derecognized, the unamortized fair value is recognized immediately in the consolidated statements of earnings.
Derivative financial instruments used as hedging items are recorded at fair value in the consolidated balance sheets under current derivative financial instruments, long-term financial assets or long-term derivative financial instruments. Valuation models, such as discounted cash flow analysis using observable market inputs, are utilized to determine the fair values of the derivative financial instruments.
77
Consolidated Financial Statements
Notes to the Consolidated Financial Statements
For the years ended September 30, 2014 and 2013
(tabular amounts only are in thousands of Canadian dollars, except per share data)
| 3. | Summary of significant accounting policies (continued) |
EMPLOYEE BENEFITS
The Company operates post-employment benefit plans of both a defined contribution and defined benefit nature.
The cost of defined contribution plans is charged to the consolidated statements of earnings on the basis of contributions payable by the Company during the year.
For defined benefits plans, the defined benefit obligations are calculated by independent actuaries using the projected unit credit method. The retirement benefits obligations in the consolidated balance sheets represent the present value of the defined benefit obligation as reduced by the fair value of plan assets. The retirement benefits assets are recognized to the extent that the Company can benefit from refunds or a reduction in future contributions. Retirement benefit plans that are funded by the payment of insurance premiums are treated as defined contribution plans unless the Company has an obligation either to pay the benefits directly when they fall due or to pay further amounts if assets accumulated with the insurer do not cover all future employee benefits. In such circumstances, the plan is treated as a defined benefit plan.
Insurance policies are treated as plan assets of a defined benefit plan if the proceeds of the policy:
| - | Can only be used to fund employee benefits; |
| - | Are not available to the Company’s creditors; and |
| - | Either cannot be paid to the Company unless the proceeds represent surplus assets not needed to meet all the benefit obligations or are a reimbursement for benefits already paid by the Company. |
Insurance policies that do not meet the above criteria are treated as non-current investments and are held at fair value as long-term financial assets in the consolidated balance sheets.
The actuarial valuations used to determine the cost of defined benefit pension plans and their present value involve making assumptions about discount rates, future salary and pension increases, inflation rates and mortality. Any changes in these assumptions will impact the carrying amount of pension obligations. In determining the appropriate discount rate management considers the interest rates of high quality corporate bonds that are denominated in the currency in which the benefits will be paid, and that have terms to maturity approximating the terms of the related pension liability.
The current service cost is recognized in the consolidated statements of earnings as an employee benefit expense. The net interest cost calculated by applying the discount rate to the net defined benefit liability or asset is recognized as net finance cost or income. When the benefits of a plan are changed or when a plan is curtailed, the resulting change in benefit that relates to past service or the gain or loss on curtailment is recognized immediately in the consolidated statements of earnings. The gains or losses on the settlement of a defined benefit plan are recognized when the settlement occurs.
Remeasurements include actuarial gains and losses, changes in the effect of the asset ceiling and the return on plan assets, excluding the amount included in net interest on the net defined liability or assets. Remeasurements are charged or credited to other comprehensive income in the period in which they arise.
78
FISCAL 2014 RESULTS
Notes to the Consolidated Financial Statements
For the years ended September 30, 2014 and 2013
(tabular amounts only are in thousands of Canadian dollars, except per share data)
| 3. | Summary of significant accounting policies (continued) |
| A) | NEW STANDARDS AND AMENDMENTS ADOPTED |
The following new and amended standards have been adopted by the Company effective October 1, 2013:
IFRS 10 - Consolidated Financial Statements
The new standard builds on existing principles by identifying the concept of control as the determining factor in whether an entity should be included in a company’s consolidated financial statements. The adoption of IFRS 10 did not result in any significant impact on the Company’s consolidated financial statements.
IFRS 12 - Disclosure of Interests in Other Entities
The new standard provides guidance on disclosure requirements for all forms of interests in other entities, including subsidiaries, joint arrangements, associates and structured entities. The standard requires disclosure of the nature and risks associated with the Company’s interests in other entities and the effects of those interests on its financial position, financial performance and cash flows. The adoption of IFRS 12 did not result in any significant impact on the Company’s consolidated financial statements.
IFRS 13 - Fair Value Measurement
The new standard provides guidance for fair value measurements by providing a definition of fair value and a single source of fair value measurement and disclosure requirements. IFRS 13 applies when other IFRS standards require or permit fair value measurements. The adoption of IFRS 13 did not result in any significant impact on the Company’s consolidated financial statements other than to give rise to additional disclosures.
IAS 1 - Presentation of Financial Statements
The amendment requires grouping together items within the statement of comprehensive income that may be reclassified to the statement of earnings. As a result, the Company has grouped items within its consolidated statements of comprehensive income and accumulated other comprehensive income by items that will and will not be reclassified subsequently to the consolidated statements of earnings.
IAS 19 - Employee Benefits
Two amendments of IAS 19 have been adopted by the Company.
The first amendment requires to adjust the calculation of the financing cost component of defined benefit plans and to enhance disclosure requirements. As a result, the Company calculated a net interest expense or income on the net defined benefit liability or asset. The net interest on the defined benefit liability or asset replaces the interest cost on the defined benefit obligation and the expected return on plan assets. The adoption of IAS 19 did not result in any significant impact on the Company’s consolidated financial statements, other than to give rise to additional disclosures.
The second amendment permits the recognition of certain contributions from employees as a reduction of the service cost in the period in which the related service is rendered. The amendment applies to contributions from employees set out in the formal terms of the plan, linked to service and independent of the number of years of service. The Company has early adopted the amendment of IAS 19 which is effective on or after July 1, 2014. The amendment did not result in any significant impact on the Company’s consolidated financial statements.
79
Consolidated Financial Statements
Notes to the Consolidated Financial Statements
For the years ended September 30, 2014 and 2013
(tabular amounts only are in thousands of Canadian dollars, except per share data)
| 3. | Summary of significant accounting policies (continued) |
| B) | FUTURE ACCOUNTING STANDARD CHANGES |
The following standards have been issued but are not yet effective:
IFRS 15 - Revenue from Contracts with Customers
In May 2014, the IASB issued IFRS 15, “Revenue from Contracts with Customers”, to specify how and when to recognize revenue as well as requiring the provision of more informative and relevant disclosures. IFRS 15 supersedes IAS 18, “Revenue”, IAS 11, “Construction Contracts”, and other revenue related interpretations. The standard will be effective on October 1, 2017 for the Company with earlier adoption permitted. The Company is currently evaluating the impact of this standard on its consolidated financial statements.
IFRS 9 - Financial Instruments
In July 2014, the IASB amended IFRS 9, “Financial Instruments”, to bring together the classification and measurement, impairment and hedge accounting phases of the IASB’s project to replace IAS 39, “Financial Instruments: Recognition and Measurement”. The standard supersedes all previous versions of IFRS 9 and will be effective on October 1, 2018 for the Company with earlier application permitted. The Company is currently evaluating the impact of this standard on its consolidated financial statements.
80
FISCAL 2014 RESULTS
Notes to the Consolidated Financial Statements
For the years ended September 30, 2014 and 2013
(tabular amounts only are in thousands of Canadian dollars, except per share data)
| 4. | Cash and cash equivalents |
As at September 30, 2014 | As at September 30, 2013 | |||||||
| $ | $ | |||||||
Cash | 265,715 | 105,677 | ||||||
Cash equivalents | 270,000 | 522 | ||||||
| 535,715 | 106,199 | |||||||
| 5. | Accounts receivable |
As at September 30, 2014 | As at September 30, 2013 | |||||||
| $ | $ | |||||||
Trade | 873,466 | 1,018,990 | ||||||
Other1 | 162,602 | 186,635 | ||||||
| 1,036,068 | 1,205,625 | |||||||
| 1 | Other accounts receivable include refundable tax credits on salaries related to the Québec Development of E-Business program, research and development tax credits and other job and economic growth creation programs available. The tax credits represent approximately $113,511,000 and $110,615,000 of other accounts receivable in 2014 and 2013, respectively. |
The fiscal measures under the Québec Development of E-Business program enable corporations with an establishment in the province of Québec that carry out eligible activities in the technology sector to obtain a refundable tax credit equal to 30% of eligible salaries, up to a maximum of $20,000 per year per eligible employee until December 31, 2015. For all eligible salaries incurred after June 4, 2014, the refundable tax credit was reduced to 24% and the maximum of $20,000 per year was maintained until December 31, 2025.
| 6. | Funds held for clients |
As at September 30, 2014 | As at September 30, 2013 | |||||||
| $ | $ | |||||||
Cash | 97,577 | 34,653 | ||||||
Long-term bonds | 198,177 | 187,816 | ||||||
| 295,754 | 222,469 | |||||||
81
Consolidated Financial Statements
Notes to the Consolidated Financial Statements
For the years ended September 30, 2014 and 2013
(tabular amounts only are in thousands of Canadian dollars, except per share data)
| 7. | Property, plant and equipment |
Land and buildings | Leasehold improvements | Furniture, fixtures and equipment | Computer equipment | Total | ||||||||||||||||
| $ | $ | $ | $ | $ | ||||||||||||||||
Cost | ||||||||||||||||||||
As at September 30, 2013 | 62,077 | 193,221 | 140,970 | 485,736 | 882,004 | |||||||||||||||
Additions/transfers | 8,962 | 10,630 | 19,926 | 155,939 | 195,457 | |||||||||||||||
Disposals/transfers | — | (6,932) | (38,420) | (34,984) | (80,336) | |||||||||||||||
Foreign currency translation adjustment | 1,318 | 8,323 | 8,757 | 16,141 | 34,539 | |||||||||||||||
As at September 30, 2014 | 72,357 | 205,242 | 131,233 | 622,832 | 1,031,664 | |||||||||||||||
Accumulated depreciation | ||||||||||||||||||||
As at September 30, 2013 | 6,670 | 99,015 | 56,272 | 244,904 | 406,861 | |||||||||||||||
Depreciation expense (Note 24) | 3,275 | 29,669 | 26,811 | 127,131 | 186,886 | |||||||||||||||
Disposals/transfers | — | (6,920) | (35,105) | (24,077) | (66,102) | |||||||||||||||
Foreign currency translation adjustment | 197 | 3,617 | 5,626 | 7,699 | 17,139 | |||||||||||||||
As at September 30, 2014 | 10,142 | 125,381 | 53,604 | 355,657 | 544,784 | |||||||||||||||
Net carrying amount as at September 30, 2014 | 62,215 | 79,861 | 77,629 | 267,175 | 486,880 | |||||||||||||||
Land and buildings | Leasehold improvements | Furniture, fixtures and equipment | Computer equipment | Total | ||||||||||||||||
| $ | $ | $ | $ | $ | ||||||||||||||||
Cost | ||||||||||||||||||||
As at September 30, 2012 | 56,638 | 182,553 | 134,071 | 413,613 | 786,875 | |||||||||||||||
Additions/transfers | 4,038 | 16,197 | 18,570 | 121,060 | 159,865 | |||||||||||||||
Disposals/transfers | — | (8,276) | (13,941) | (60,767) | (82,984) | |||||||||||||||
Foreign currency translation adjustment | 1,401 | 2,747 | 2,270 | 11,830 | 18,248 | |||||||||||||||
As at September 30, 2013 | 62,077 | 193,221 | 140,970 | 485,736 | 882,004 | |||||||||||||||
Accumulated depreciation | ||||||||||||||||||||
As at September 30, 2012 | 5,240 | 76,431 | 40,992 | 182,732 | 305,395 | |||||||||||||||
Depreciation expense (Note 24) | 1,467 | 28,299 | 27,788 | 118,133 | 175,687 | |||||||||||||||
Disposals/transfers | — | (6,393) | (12,730) | (58,871) | (77,994) | |||||||||||||||
Foreign currency translation adjustment | (37) | 678 | 222 | 2,910 | 3,773 | |||||||||||||||
As at September 30, 2013 | 6,670 | 99,015 | 56,272 | 244,904 | 406,861 | |||||||||||||||
Net carrying amount as at September 30, 2013 | 55,407 | 94,206 | 84,698 | 240,832 | 475,143 | |||||||||||||||
82
FISCAL 2014 RESULTS
Notes to the Consolidated Financial Statements
For the years ended September 30, 2014 and 2013
(tabular amounts only are in thousands of Canadian dollars, except per share data)
| 7. | Property, plant and equipment (continued) |
Property, plant and equipment include the following assets acquired under finance leases:
| As at September 30, 2014 | As at September 30, 2013 | |||||||||||||||||||||||
| Cost | Accumulated depreciation | Net carrying amount | Cost | Accumulated depreciation | Net carrying amount | |||||||||||||||||||
| $ | $ | $ | $ | $ | $ | |||||||||||||||||||
Furniture, fixtures and equipment | 15,522 | 8,744 | 6,778 | 15,762 | 7,218 | 8,544 | ||||||||||||||||||
Computer equipment | 93,375 | 61,783 | 31,592 | 105,112 | 66,117 | 38,995 | ||||||||||||||||||
| 108,897 | 70,527 | 38,370 | 120,874 | 73,335 | 47,539 | |||||||||||||||||||
| 8. | Contract costs |
| As at September 30, 2014 | As at September 30, 2013 | |||||||||||||||||||||||
| Cost | Accumulated amortization | Net carrying amount | Cost | Accumulated amortization | Net carrying amount | |||||||||||||||||||
| $ | $ | $ | $ | $ | $ | |||||||||||||||||||
Transition costs | 356,704 | 209,186 | 147,518 | 291,305 | 165,705 | 125,600 | ||||||||||||||||||
Incentives | 101,291 | 92,269 | 9,022 | 103,058 | 88,186 | 14,872 | ||||||||||||||||||
| 457,995 | 301,455 | 156,540 | 394,363 | 253,891 | 140,472 | |||||||||||||||||||
83
Consolidated Financial Statements
Notes to the Consolidated Financial Statements
For the years ended September 30, 2014 and 2013
(tabular amounts only are in thousands of Canadian dollars, except per share data)
| 9. | Intangible assets |
| Internal-use software acquired | Internal-use software internally developed | Business solutions acquired | Business solutions internally developed | Software licenses | Client relationships and other | Total | ||||||||||||||||||||||
| $ | $ | $ | $ | $ | $ | $ | ||||||||||||||||||||||
Cost | ||||||||||||||||||||||||||||
As at September 30, 2013 | 105,002 | 45,371 | 123,850 | 260,072 | 130,448 | 862,004 | 1,526,747 | |||||||||||||||||||||
Additions/transfers | 4,226 | 6,499 | 114 | 34,759 | 41,790 | — | 87,388 | |||||||||||||||||||||
Disposals/transfers | (12,170) | (1,307) | (603) | (1,984) | (12,449) | — | (28,513) | |||||||||||||||||||||
Foreign currency translation adjustment | 5,628 | 173 | 3,354 | 17,639 | 4,672 | 34,355 | 65,821 | |||||||||||||||||||||
As at September 30, 2014 | 102,686 | 50,736 | 126,715 | 310,486 | 164,461 | 896,359 | 1,651,443 | |||||||||||||||||||||
Accumulated amortization | ||||||||||||||||||||||||||||
As at September 30, 2013 | 63,211 | 40,184 | 84,644 | 164,963 | 82,885 | 382,695 | 818,582 | |||||||||||||||||||||
Amortization expense (Note 24) | 14,264 | 2,996 | 12,568 | 21,467 | 26,874 | 114,523 | 192,692 | |||||||||||||||||||||
Disposals/transfers | (12,170) | (1,118) | (121) | (1,980) | (12,197) | — | (27,586) | |||||||||||||||||||||
Foreign currency translation adjustment | 4,142 | 81 | 2,687 | 10,635 | 3,358 | 16,778 | 37,681 | |||||||||||||||||||||
As at September 30, 2014 | 69,447 | 42,143 | 99,778 | 195,085 | 100,920 | 513,996 | 1,021,369 | |||||||||||||||||||||
Net carrying amount as at September 30, 2014 | 33,239 | 8,593 | 26,937 | 115,401 | 63,541 | 382,363 | 630,074 | |||||||||||||||||||||
| Internal-use software acquired | Internal-use software internally developed | Business solutions acquired | Business solutions internally developed | Software licenses | Client relationships and other | Total | ||||||||||||||||||||||
| $ | $ | $ | $ | $ | $ | $ | ||||||||||||||||||||||
Cost | ||||||||||||||||||||||||||||
As at September 30, 2012 | 87,282 | 43,237 | 118,094 | 233,261 | 175,932 | 819,596 | 1,477,402 | |||||||||||||||||||||
Additions/transfers | 20,898 | 2,134 | 4,826 | 23,781 | 27,008 | — | 78,647 | |||||||||||||||||||||
Disposals/transfers | (5,824) | — | (237) | (4,404) | (74,329) | (1,382) | (86,176) | |||||||||||||||||||||
Foreign currency translation adjustment | 2,646 | — | 1,167 | 7,434 | 1,837 | 43,790 | 56,874 | |||||||||||||||||||||
As at September 30, 2013 | 105,002 | 45,371 | 123,850 | 260,072 | 130,448 | 862,004 | 1,526,747 | |||||||||||||||||||||
Accumulated amortization | ||||||||||||||||||||||||||||
As at September 30, 2012 | 42,117 | 36,100 | 72,977 | 147,340 | 132,629 | 258,460 | 689,623 | |||||||||||||||||||||
Amortization expense (Note 24) | 25,134 | 4,084 | 11,097 | 18,205 | 20,956 | 114,505 | 193,981 | |||||||||||||||||||||
Disposals/transfers | (5,608) | — | (493) | (4,396) | (72,241) | (1,382) | (84,120) | |||||||||||||||||||||
Foreign currency translation adjustment | 1,568 | — | 1,063 | 3,814 | 1,541 | 11,112 | 19,098 | |||||||||||||||||||||
As at September 30, 2013 | 63,211 | 40,184 | 84,644 | 164,963 | 82,885 | 382,695 | 818,582 | |||||||||||||||||||||
Net carrying amount as at September 30, 2013 | 41,791 | 5,187 | 39,206 | 95,109 | 47,563 | 479,309 | 708,165 | |||||||||||||||||||||
All intangible assets are subject to amortization.
84
FISCAL 2014 RESULTS
Notes to the Consolidated Financial Statements
For the years ended September 30, 2014 and 2013
(tabular amounts only are in thousands of Canadian dollars, except per share data)
| 10. | Other long-term assets |
| As at September 30, 2014 | As at September 30, 2013 | |||||||
| $ | $ | |||||||
Insurance contracts held to fund defined benefit pension and life assurance arrangements - reimbursement rights (Note 17) | 22,415 | 20,856 | ||||||
Retirement benefits assets (Note 17) | 8,737 | 9,175 | ||||||
Deferred financing fees | 4,474 | 3,856 | ||||||
Long-term maintenance agreements | 15,004 | 6,653 | ||||||
Deposits | 11,773 | 9,960 | ||||||
Other | 11,755 | 7,929 | ||||||
| 74,158 | 58,429 | ||||||
| 11. | Long-term financial assets |
| As at September 30, 2014 | As at September 30, 2013 | |||||||
| $ | $ | |||||||
Deferred compensation plan assets (Note 31) | 31,151 | 24,752 | ||||||
Long-term investments | 30,689 | 20,333 | ||||||
Long-term receivables | 7,403 | 4,289 | ||||||
Derivative financial assets (Note 31) | 14,834 | 2,518 | ||||||
| 84,077 | 51,892 | ||||||
| 12. | Goodwill |
The Company completed the annual impairment test as at September 30, 2014 and did not identify any impairment.
The variations in goodwill were as follows:
| U.S. | NSESA | Canada | France | U.K. | CEE | Asia Pacific | Total | |||||||||||||||||||||||||
| $ | $ | $ | $ | $ | $ | $ | $ | |||||||||||||||||||||||||
As at September 30, 2013 | 1,370,399 | 1,274,667 | 1,111,702 | 805,891 | 827,291 | 715,011 | 288,829 | 6,393,790 | ||||||||||||||||||||||||
Foreign currency translation adjustment | 121,513 | (1,844) | — | 14,328 | 64,599 | 7,985 | 10,952 | 217,533 | ||||||||||||||||||||||||
As at September 30, 2014 | 1,491,912 | 1,272,823 | 1,111,702 | 820,219 | 891,890 | 722,996 | 299,781 | 6,611,323 | ||||||||||||||||||||||||
85
Consolidated Financial Statements
Notes to the Consolidated Financial Statements
For the years ended September 30, 2014 and 2013
(tabular amounts only are in thousands of Canadian dollars, except per share data)
| 12. | Goodwill (continued) |
Key assumptions in goodwill impairment testing
The key assumptions for the CGUs are disclosed in the following table:
| As at September 30, 2014 | U.S. | NSESA | Canada | France | U.K. | CEE | Asia Pacific | |||||||||||||||||||||
| % | % | % | % | % | % | % | ||||||||||||||||||||||
Assumptions | ||||||||||||||||||||||||||||
Pre-tax WACC | 11.2 | 12.2 | 9.0 | 10.6 | 10.2 | 10.6 | 21.7 | |||||||||||||||||||||
Long-term growth rate of net operating cash flows1 | 2.0 | 1.9 | 2.0 | 1.9 | 1.8 | 1.6 | 2.0 | |||||||||||||||||||||
| As at September 30, 2013 | U.S. | NSESA | Canada | France | U.K. | CEE | Asia Pacific | |||||||||||||||||||||
| % | % | % | % | % | % | % | ||||||||||||||||||||||
Assumptions | ||||||||||||||||||||||||||||
Pre-tax WACC | 10.0 | 12.5 | 7.6 | 10.8 | 10.7 | 10.5 | 20.1 | |||||||||||||||||||||
Long-term growth rate of net operating cash flows1 | 2.0 | 2.0 | 2.0 | 2.0 | 2.0 | 2.0 | 2.0 | |||||||||||||||||||||
| 1 | The long-term growth rate is based on published industry research. |
86
FISCAL 2014 RESULTS
Notes to the Consolidated Financial Statements
For the years ended September 30, 2014 and 2013
(tabular amounts only are in thousands of Canadian dollars, except per share data)
| 13. | Provisions |
Onerous leases1 | Litigations and claims2 | Decommissioning liabilities3 | Restructuring4 | Total | ||||||||||||||||
| $ | $ | $ | $ | $ | ||||||||||||||||
As at September 30, 2013 | 94,022 | 65,418 | 54,256 | 118,389 | 332,085 | |||||||||||||||
Additional provisions | 14,118 | 3,351 | 1,770 | 100,354 | 119,593 | |||||||||||||||
Utilized amounts | (44,174) | (14,133) | (1,560) | (122,130) | (181,997) | |||||||||||||||
Reversals of unused amounts | (24,275) | (24,984) | (12,574) | (6,081) | (67,914) | |||||||||||||||
Discount rate adjustment and imputed interest | 605 | — | 525 | — | 1,130 | |||||||||||||||
Foreign currency translation adjustment | 5,353 | 1,941 | 2,364 | 1,340 | 10,998 | |||||||||||||||
As at September 30, 2014 | 45,649 | 31,593 | 44,781 | 91,872 | 213,895 | |||||||||||||||
Current portion | 17,203 | 31,593 | 8,542 | 85,971 | 143,309 | |||||||||||||||
Non-current portion | 28,446 | — | 36,239 | 5,901 | 70,586 | |||||||||||||||
Onerous leases1 | Litigations and claims2 | Decommissioning liabilities3 | Restructuring4 | Total | ||||||||||||||||
| $ | $ | $ | $ | $ | ||||||||||||||||
As at September 30, 2012 | 88,670 | 91,669 | 53,366 | 143,120 | 376,825 | |||||||||||||||
Additional provisions | 36,687 | — | 1,722 | 249,799 | 288,208 | |||||||||||||||
Utilized amounts | (34,490) | (31,332) | (2,375) | (284,106) | (352,303) | |||||||||||||||
Reversals of unused amounts | (1,683) | — | (1,958) | — | (3,641) | |||||||||||||||
Discount rate adjustment and imputed interest | 646 | — | 572 | — | 1,218 | |||||||||||||||
Foreign currency translation adjustment | 4,192 | 5,081 | 2,929 | 9,576 | 21,778 | |||||||||||||||
As at September 30, 2013 | 94,022 | 65,418 | 54,256 | 118,389 | 332,085 | |||||||||||||||
Current portion | 41,668 | 65,418 | 7,735 | 108,253 | 223,074 | |||||||||||||||
Non-current portion | 52,354 | — | 46,521 | 10,136 | 109,011 | |||||||||||||||
| 1 | As at September 30, 2014, the timing of cash outflows relating to these provisions ranges between one and nine years (one and ten years as at September 30, 2013) and was discounted at a weighted average rate of 1.35% (1.15% as at September 30, 2013). For the year ended September 30, 2014, a net amount of $1,503,000 of integration costs ($31,899,000 for the year ended September 30, 2013) was accounted for in the provision for onerous leases (Note 26b). The reversals of unused amounts are mostly due to the sublease in the period of previously vacated premises, as well as favorable lease terminations. |
| 2 | As at September 30, 2014, litigations and claims include provisions related to tax exposure (other than those related to income tax), contractual disputes, employee claims and other of $15,661,000, $7,433,000 and $8,499,000, respectively (as at September 30, 2013, $34,409,000, $15,434,000 and $15,575,000, respectively). The reversals of unused amounts are mostly due to the favorable settlement of tax exposures and contractual disputes. |
| 3 | As at September 30, 2014, the decommissioning liability was based on the expected cash flows of $45,834,000 ($56,454,000 as at September 30, 2013) and was discounted at a weighted average rate of 0.94% (0.93% as at September 30, 2013). The timing of the settlement of these obligations ranges between one and nine years as at September 30, 2014 (one and ten years as at September 30, 2013). |
| 4 | For the year ended September 30, 2014, a net amount of $94,273,000 of integration costs ($249,799,000 for the year ended September 30, 2013) was accounted for in the provision for restructuring (Note 26b). |
87
Consolidated Financial Statements
Notes to the Consolidated Financial Statements
For the years ended September 30, 2014 and 2013
(tabular amounts only are in thousands of Canadian dollars, except per share data)
| 14. | Long-term debt |
| As at September 30, 2014 | As at September 30, 2013 | |||||||
| $ | $ | |||||||
Senior U.S. unsecured notes repayable by tranches of $95,277 (U.S.$85,000) in 2016, $156,926 (U.S.$140,000) in 2018 and $280,225 (U.S.$250,000) in 20211 | 522,220 | 475,787 | ||||||
Senior unsecured notes repayable by tranches of $44,836 (U.S.$40,000) in 2019, $61,650 (U.S.$55,000) in 2021, $336,270 (U.S.$300,000) in 2024, $392,315 (U.S. $350,000) in 7 yearly payments of U.S.$50,000 from 2018 to 2024 and $120,326, (€85,000) in 20212 | 954,317 | — | ||||||
Unsecured committed revolving credit facility3 | — | 254,818 | ||||||
Unsecured committed term loan credit facility4 | 1,001,752 | 1,974,490 | ||||||
Obligations repayable in blended monthly installments maturing at various dates until 2019, bearing a weighted average interest rate of 3.01% (3.27% in 2013) | 117,680 | 79,446 | ||||||
Obligations under finance leases repayable in blended monthly installments maturing at various dates until 2019, bearing a weighted average interest rate of 3.66% (3.46% in 2013) | 61,698 | 67,928 | ||||||
Other long-term debt | 22,036 | 14,081 | ||||||
| 2,679,703 | 2,866,550 | |||||||
Current portion | 80,367 | 534,173 | ||||||
| 2,599,336 | 2,332,377 | |||||||
| 1 | As at September 30, 2014, an amount of $532,428,000 was drawn, less fair value adjustments relating to interest rate swaps designated as fair value hedges and financing fees for a total of $10,208,000. The private placement financing with U.S. institutional investors is comprised of three tranches of Senior U.S. unsecured notes, with a weighted average maturity of 5.4 years and a weighted average interest rate of 4.57%. The Senior U.S. unsecured notes contain covenants that require the Company to maintain certain financial ratios (Note 32). As at September 30, 2014, the Company was in compliance with these covenants. |
| 2 | During the year ended September 30, 2014, the Company signed a private placement financing. As at September 30, 2014, an amount of $955,397,000 was drawn, less financing fees of $1,080,000. The private placement is comprised of four tranches of Senior U.S. unsecured notes and one tranche of Senior euro unsecured note, with a weighted average maturity of 7.9 years and a weighted average interest rate of 3.62%. The Senior unsecured notes contain covenants that require the Company to maintain certain financial ratios (Note 32). As at September 30, 2014, the Company was in compliance with these covenants. |
| 3 | In the first quarter of 2014, the unsecured committed revolving credit facility of $1,500,000,000 was extended by one year to December 2017. On July 25, 2014, the facility was further extended by another year to December 2018 and can be further extended annually. All other terms and conditions including interest rates and banking covenants remain unchanged. |
Under the four-year unsecured committed revolving credit facility, amounts can be drawn at banker’s acceptance, LIBOR or Canadian prime; plus a variable margin that is determined based on the Company’s leverage ratio. As at September 30, 2014, no amount was drawn upon this facility. Also, an amount of $36,720,000 has been committed against this facility to cover various letters of credit issued for clients and other parties. The revolving credit facility contains covenants that require the Company to maintain certain financial ratios (Note 32). As at September 30, 2014, the Company was in compliance with these covenants.
| 4 | As at September 30, 2014, an amount of $1,005,332,000 was drawn, less financing fees of $3,580,000. The term loan credit expires on May 2016. The term loan credit facility bears interest at Bankers’ acceptance, LIBOR or to a lesser extent, Canadian prime; plus a variable margin that is determined based on the Company’s leverage ratio. As at September 30, 2014, the margin paid was 1.5% for LIBOR and Banker’s acceptance and 0.50% for the Canadian prime portion. The term loan credit facility contains covenants that require the Company to maintain certain financial ratios (Note 32). As at September 30, 2014, the Company was in compliance with these covenants. |
During the year ended September 30, 2014, the Company repaid in advance, without penalty, the May 2014 and the May 2015 maturing tranches of the unsecured committed term loan credit facility for a total amount of $486,745,000 and $494,712,000, respectively. Following these repayments, the Company settled related floating-to-fixed interest rate swaps with notional amounts of $450,000,000 and $300,000,000 and related floating-to-floating cross currency swap with a notional amount of $184,900,000 (Note 31).
88
FISCAL 2014 RESULTS
Notes to the Consolidated Financial Statements
For the years ended September 30, 2014 and 2013
(tabular amounts only are in thousands of Canadian dollars, except per share data)
| 14. | Long-term debt (continued) |
Principal repayments on long-term debt, excluding fair value hedges and financing fees, over the forthcoming years are as follows:
| $ | ||||||||||||
Less than one year | 48,048 | |||||||||||
Between one and two years | 1,043,394 | |||||||||||
Between two and five years | 456,274 | |||||||||||
Beyond five years | 1,085,157 | |||||||||||
Total principal payments on long-term debt | 2,632,873 | |||||||||||
Minimum finance lease payments are as follows:
| Principal | Interest | Payment | |||||||||
| $ | $ | $ | ||||||||||
Less than one year | 32,319 | 1,494 | 33,813 | |||||||||
Between one and two years | 20,477 | 846 | 21,323 | |||||||||
Between two and five years | 8,902 | 359 | 9,261 | |||||||||
Beyond five years | — | — | — | |||||||||
Total minimum finance lease payments | 61,698 | 2,699 | 64,397 | |||||||||
| 15. | Other long-term liabilities |
| As at September 30, 2014 | As at September 30, 2013 | |||||||
| $ | $ | |||||||
Deferred revenue | 151,989 | 225,482 | ||||||
Estimated losses on revenue-generating contracts1 | 42,804 | 78,390 | ||||||
Deferred compensation plan liabilities (Note 17) | 31,633 | 25,253 | ||||||
Deferred rent | 67,169 | 85,858 | ||||||
Other | 14,792 | 19,670 | ||||||
| 308,387 | 434,653 | |||||||
| 1 | The current portion of estimated losses on revenue-generating contracts included in accounts payable and accrued liabilities is $84,747,000 as at September 30, 2014 ($138,700,000 at September 30, 2013). |
89
Consolidated Financial Statements
Notes to the Consolidated Financial Statements
For the years ended September 30, 2014 and 2013
(tabular amounts only are in thousands of Canadian dollars, except per share data)
| 16. | Income taxes |
| Year ended September 30 | ||||||||
2014 | 2013 | |||||||
| $ | $ | |||||||
Current income tax expense | ||||||||
Current income tax expense in respect of the current year | 250,403 | 157,822 | ||||||
Adjustments recognized in the current year in relation to the income tax expense of prior years | (33,956 | ) | (20,734) | |||||
Total current income tax expense | 216,447 | 137,088 | ||||||
Deferred income tax expense | ||||||||
Deferred income tax expense relating to the origination and reversal of temporary differences | 60,488 | 36,253 | ||||||
Deferred income tax expense relating to changes in tax rates | (1,520 | ) | 27,708 | |||||
Adjustments recognized in the current year in relation to the deferred income tax expense of prior years | 23,948 | (818) | ||||||
Recognition of previously unrecognized temporary differences | (28,556 | ) | (28,429) | |||||
Total deferred income tax expense | 54,360 | 34,714 | ||||||
Total income tax expense | 270,807 | 171,802 | ||||||
The Company’s effective income tax rate on income from continuing operations differs from the combined Federal and Provincial Canadian statutory tax rate as follows:
| Year ended September 30 | ||||||||
2014 | 2013 | |||||||
| % | % | |||||||
Company’s statutory tax rate | 26.9 | 26.9 | ||||||
Effect of foreign tax rate differences | (0.3) | (1.5) | ||||||
Final determination from agreements with tax authorities and expirations of statutes of limitations | (0.9) | (3.4) | ||||||
Non-deductible and tax exempt items | 0.2 | 1.0 | ||||||
Recognition of previously unrecognized temporary differences | (2.5) | (4.5) | ||||||
Effect of integration-related costs | (0.1) | 2.9 | ||||||
Minimum income tax charge | 0.8 | 1.6 | ||||||
Impact on future tax assets and liabilities resulting from tax rate changes | (0.1) | 4.4 | ||||||
Effective income tax rate | 24.0 | 27.4 | ||||||
90
FISCAL 2014 RESULTS
Notes to the Consolidated Financial Statements
For the years ended September 30, 2014 and 2013
(tabular amounts only are in thousands of Canadian dollars, except per share data)
| 16. | Income taxes (continued) |
The continuity of deferred income tax balances is as follows:
As at September 30, 2013 | Recognized in earnings | Recognized in other comprehensive income | Recognized in equity | Foreign currency translation adjustment and | As at September 30, 2014 | |||||||||||||||||||
| $ | $ | $ | $ | $ | ||||||||||||||||||||
Accounts payable, accrued liabilities and other long-term liabilities | 69,497 | 6,685 | — | — | 3,789 | 79,971 | ||||||||||||||||||
Tax benefits on losses carried forward | 300,536 | (44,065) | — | — | 12,663 | 269,134 | ||||||||||||||||||
Accrued compensation | 68,908 | (5,356) | — | (9,542) | 3,396 | 57,406 | ||||||||||||||||||
Retirement benefits obligations | 21,958 | 726 | 12,940 | — | (309) | 35,315 | ||||||||||||||||||
Allowance for doubtful accounts | 5,274 | (1,445) | — | — | (2) | 3,827 | ||||||||||||||||||
PP&E, contract costs, intangible assets and other long-term assets | (150,418) | (2,432) | — | — | (7,742) | (160,592) | ||||||||||||||||||
Work in progress | (43,217) | (9,762) | — | — | (3,089) | (56,068) | ||||||||||||||||||
Goodwill | (41,326) | (2,798) | — | — | (2,633) | (46,757) | ||||||||||||||||||
Refundable tax credits on salaries | (21,821) | 3,855 | — | — | — | (17,966) | ||||||||||||||||||
Cash flow hedges | 4,173 | (1,424) | (5,247) | — | 81 | (2,417) | ||||||||||||||||||
Other liabilities | (676) | 1,656 | 2,182 | — | 2,429 | 5,591 | ||||||||||||||||||
Deferred income taxes, net | 212,888 | (54,360) | 9,875 | (9,542) | 8,583 | 167,444 | ||||||||||||||||||
| As at September 30, 2012 | Recognized in earnings | Recognized in other comprehensive income | Recognized in equity | Foreign currency translation adjustment and other | As at September 30, 2013 | |||||||||||||||||||
| $ | $ | $ | $ | $ | $ | |||||||||||||||||||
Accounts payable, accrued liabilities and other long-term liabilities | 96,992 | (27,724) | — | — | 229 | 69,497 | ||||||||||||||||||
Tax benefits on losses carried forward | 289,323 | (10,920) | — | — | 22,133 | 300,536 | ||||||||||||||||||
Accrued compensation | 38,518 | 12,992 | — | 15,232 | 2,166 | 68,908 | ||||||||||||||||||
Retirement benefits obligations | 17,448 | (2,750) | 7,749 | — | (489) | 21,958 | ||||||||||||||||||
Allowance for doubtful accounts | 2,046 | 3,228 | — | — | — | 5,274 | ||||||||||||||||||
PP&E, contract costs, intangible assets and other long-term assets | (162,950) | 17,932 | — | — | (5,400) | (150,418) | ||||||||||||||||||
Work in progress | (25,382) | (17,107) | — | — | (728) | (43,217) | ||||||||||||||||||
Goodwill | (35,244) | (4,644) | — | — | (1,438) | (41,326) | ||||||||||||||||||
Refundable tax credits on salaries | (17,783) | (4,038) | — | — | — | (21,821) | ||||||||||||||||||
��Cash flow hedges | 4,379 | (696) | (217) | — | 707 | 4,173 | ||||||||||||||||||
Other liabilities | (6,110) | (987) | 4,479 | — | 1,942 | (676) | ||||||||||||||||||
Deferred income taxes, net | 201,237 | (34,714) | 12,011 | 15,232 | 19,122 | 212,888 | ||||||||||||||||||
The deferred income taxes are presented as follows in the consolidated balance sheets:
| As at September 30, 2014 | As at September 30, 2013 | |||||||
| $ | $ | |||||||
Deferred tax assets | 323,416 | 368,217 | ||||||
Deferred tax liabilities | (155,972 | ) | (155,329) | |||||
Deferred income taxes, net | 167,444 | 212,888 | ||||||
91
Consolidated Financial Statements
Notes to the Consolidated Financial Statements
For the years ended September 30, 2014 and 2013
(tabular amounts only are in thousands of Canadian dollars, except per share data)
| 16. | Income taxes (continued) |
As at September 30, 2014, the Company had $1,718,494,000 ($1,920,600,000 as at September 30, 2013) in tax losses carried forward and other temporary differences, of which $152,700,000 ($231,199,000 as at September 30, 2013) expire at various dates up to 2032 and $1,565,794,000 ($1,689,401,000 as at September 30, 2013) have no expiry dates. The Company recognized a deferred tax asset of $413,134,000 ($460,800,000 as at September 30, 2013) on the losses carried forward and other temporary differences and recognized a valuation allowance of $144,000,000 ($160,264,000 as at September 30, 2013). The resulting net deferred tax asset of $269,134,000 ($300,536,000 as at September 30, 2013) is the amount that is more likely than not to be realized, based on deferred tax liabilities reversal and future taxable profits.
As at September 30, 2014, the Company has not recorded deferred tax liabilities on undistributed earnings of its foreign subsidiaries when they are considered indefinitely reinvested, unless it is probable that these temporary differences will reverse. Upon distribution of these earnings in the form of dividends or otherwise, the Company may be subject to taxes. The temporary differences associated with investments in subsidiaries for which a deferred tax liability has not been recognized amount to $1,434,101,000 ($934,176,000 as at September 30, 2013).
The cash and cash equivalents held by foreign subsidiaries were $356,147,000 as at September 30, 2014 ($16,400,000 as at September 30, 2013). The tax implications and impact on the Company’s liquidities related to its repatriation will not affect the Company’s liquidity.
| 17. | Employee benefits |
The Company operates various post-employment plans, including defined benefit and defined contribution pension plans as well as other benefit plans for its employees.
DEFINED BENEFIT PLANS
The Company operates defined benefit pension plans primarily for the benefit of employees in U.K., Germany, France, with smaller plans in other countries. The benefits are based on pensionable salary and years of service. U.K. and Germany plans are funded with the assets held in separate funds. The plan in France is unfunded.
The defined benefit plans expose the Company to interest risk, inflation risk, longevity risk, currency risk and market investment risk.
The following description focuses mainly on plans registered in U.K., Germany and France.
U.K.
In U.K., the Company has three defined benefit pension plans, CMG U.K. Pension Scheme, Logica U.K. Pension & Life Assurance Scheme and Logica Defined Benefit Pension Plan.
The CMG U.K. Pension scheme is closed to new members and for accrual. The Logica U.K. Pension & Life Assurance Scheme is still open but only for employees who come from the civil service with protected pensions. Logica Defined Benefit Pension Plan was created to mirror the Electricity Industry pension scheme and was created for employees that worked for National Grid and Welsh Water with protected benefits.
Both the Logica U.K. Pension & Life Assurance Scheme and Logica Defined Benefit Pension Plan are employer and employee based contribution plans.
92
FISCAL 2014 RESULTS
Notes to the Consolidated Financial Statements
For the years ended September 30, 2014 and 2013
(tabular amounts only are in thousands of Canadian dollars, except per share data)
| 17. | Employee benefits (continued) |
DEFINED BENEFIT PLANS (CONTINUED)
U.K. (CONTINUED)
The trustees are the custodians of the defined benefit pension plans and are responsible for the plan administration, including investment strategies. The trustees review periodically the investment and the asset allocation policies. As such, CMG U.K. Pension Scheme policy is to target an allocation of 45% to return-seeking assets such as equities and 55% to matching assets such as bonds; Logica Defined Benefit Pension plan policy is to invest 25% of the Plan’s assets in equities and 75% in bonds; Logica U.K. Pension & Life Assurance Scheme target is to invest 20% of the Scheme’s assets in equities and 80% in bonds. CMG U.K. Pension Scheme investment policy is currently being revised.
U.K. Pensions Act 2004 requires that full formal actuarial valuations are carried out at least every three years to determine the contributions that the Company should pay in order for the plan to meet its statutory objective, taking into account the assets already held. In the interim years, the trustees need to obtain estimated funding updates unless the scheme has less than 100 members in total.
The latest funding actuarial valuations of the CMG U.K. Pension Scheme as well as the Logica U.K. Pension & Life Assurance Scheme were performed in September 2012 and reported a deficit of $112,209,000 for the CMG U.K. Pension Scheme and $4,000 for the Logica U.K. Pension & Life Assurance Scheme. A recovery plan was proposed for the CMG U.K. Pension Scheme reflecting contributions of $12,926,000 per year (plus $1,436,000 per year for expenses) for 9 years ending in August 2023.
The next funding actuarial valuation for the Logica Defined Benefit Pension Plan will be available in 2015. In the meantime, the Company continues to contribute to the plan, in line with the last actuarial valuation, the monthly payments of $108,000 to cover for the deficit and about $9,000 to cover administrative fees.
Germany
In Germany, the Company is a participating employer in numerous defined benefit pension plans which are all closed to new members. In the majority of the plans, upon retirement of employees, the benefits are in the form of a monthly pension and in a few plans, the employees will receive an indemnity in the form of a lump-sum payment. Half of the plans are bound by collective bargaining agreements. There are no mandatory funding requirements. The plans are funded by the contributions made by the Company. In some plans, insurance policies are taken out to fund retirement benefit plans that do not qualify as plan assets and that are presented as reimbursement rights.
France
In France, the retirement indemnities are provided in accordance with the Labor Code. Upon retirement, employees will receive an indemnity (depending on the salary and seniority in the Company) in the form of a lump-sum payment.
93
Consolidated Financial Statements
Notes to the Consolidated Financial Statements
For the years ended September 30, 2014 and 2013
(tabular amounts only are in thousands of Canadian dollars, except per share data)
| 17. | Employee benefits (continued) |
DEFINED BENEFIT PLANS (CONTINUED)
The following table presents amounts for post-employment benefits plans included in the consolidated balance sheets:
| As at September 30, 2014 | U.K. | Germany | France | Other | Total | |||||||||||||||
| $ | $ | $ | $ | $ | ||||||||||||||||
Defined benefit obligations | (643,857) | (78,035) | (42,540) | (49,370) | (813,802) | |||||||||||||||
Fair value of plan assets | 601,313 | 11,582 | — | 25,891 | 638,786 | |||||||||||||||
| (42,544) | (66,453) | (42,540) | (23,479) | (175,016) | ||||||||||||||||
Fair value of reimbursement rights | — | 21,418 | — | 997 | 22,415 | |||||||||||||||
Net liability recognized in the balance sheet | (42,544) | (45,035) | (42,540) | (22,482) | (152,601) | |||||||||||||||
Presented as: | ||||||||||||||||||||
Other long-term assets (Note 10) | ||||||||||||||||||||
Insurance contracts held to fund defined benefit pension and life assurance arrangements - reimbursement rights | — | 21,418 | — | 997 | 22,415 | |||||||||||||||
Retirement benefits assets | 8,737 | — | — | — | 8,737 | |||||||||||||||
Retirement benefits obligations | (51,281) | (66,453) | (42,540) | (23,479) | (183,753) | |||||||||||||||
| (42,544) | (45,035) | (42,540) | (22,482) | (152,601) | ||||||||||||||||
| As at September 30, 2013 | U.K. | Germany | France | Other | Total | |||||||||||||||
| $ | $ | $ | $ | $ | ||||||||||||||||
Defined benefit obligations | (521,505) | (64,655) | (29,970) | (434,783) | (1,050,913) | |||||||||||||||
Fair value of plan assets | 491,717 | 10,539 | — | 404,737 | 906,993 | |||||||||||||||
| (29,788) | (54,116) | (29,970) | (30,046) | (143,920) | ||||||||||||||||
Fair value of reimbursement rights | — | 20,234 | — | 622 | 20,856 | |||||||||||||||
Net liability recognized in the balance sheet | (29,788) | (33,882) | (29,970) | (29,424) | (123,064) | |||||||||||||||
Presented as: | ||||||||||||||||||||
Other long-term assets (Note 10) | ||||||||||||||||||||
Insurance contracts held to fund defined benefit pension and life assurance arrangements - reimbursement rights | — | 20,234 | — | 622 | 20,856 | |||||||||||||||
Retirement benefits assets | 8,813 | — | — | 362 | 9,175 | |||||||||||||||
Retirement benefits obligations | (38,601) | (54,116) | (29,970) | (30,408) | (153,095) | |||||||||||||||
| (29,788) | (33,882) | (29,970) | (29,424) | (123,064) | ||||||||||||||||
94
FISCAL 2014 RESULTS
Notes to the Consolidated Financial Statements
For the years ended September 30, 2014 and 2013
(tabular amounts only are in thousands of Canadian dollars, except per share data)
| 17. | Employee benefits (continued) |
DEFINED BENEFIT PLANS (CONTINUED)
| Defined benefit obligations | U.K. | Germany | France | Other | Total | |||||||||||||||
| $ | $ | $ | $ | $ | ||||||||||||||||
As at September 30, 2013 | 521,505 | 64,655 | 29,970 | 434,783 | 1,050,913 | |||||||||||||||
Obligations extinguished on settlement | — | — | — | (383,816) | (383,816) | |||||||||||||||
Settlement gain | — | — | — | (8,449) | (8,449) | |||||||||||||||
Current service cost | 1,103 | 864 | 2,805 | 2,998 | 7,770 | |||||||||||||||
Interest cost | 24,495 | 2,336 | 1,099 | 2,541 | 30,471 | |||||||||||||||
Actuarial losses due to change in financial assumptions1 | 42,766 | 11,491 | 6,929 | 3,304 | 64,490 | |||||||||||||||
Actuarial gains due to change in demographic assumptions1 | — | — | — | (48) | (48) | |||||||||||||||
Actuarial losses (gains) due to experience1 | 16,531 | (194) | 2,211 | (1,117) | 17,431 | |||||||||||||||
Past service cost | — | — | (128) | — | (128) | |||||||||||||||
Plan participant contributions | 228 | 52 | — | 245 | 525 | |||||||||||||||
Benefits paid from the plan | (11,789) | (403) | — | (2,147) | (14,339) | |||||||||||||||
Benefits paid directly by employer | — | (1,427) | (495) | (974) | (2,896) | |||||||||||||||
Foreign currency translation adjustment1 | 49,018 | 661 | 149 | 2,050 | 51,878 | |||||||||||||||
As at September 30, 2014 | 643,857 | 78,035 | 42,540 | 49,370 | 813,802 | |||||||||||||||
Defined benefit obligation of unfunded plans | — | — | 42,540 | 18,736 | 61,276 | |||||||||||||||
Defined benefit obligation of funded plans | 643,857 | 78,035 | — | 30,634 | 752,526 | |||||||||||||||
As at September 30, 2014 | 643,857 | 78,035 | 42,540 | 49,370 | 813,802 | |||||||||||||||
| 1 | Amounts recognized in other comprehensive income. |
Settlement
During the year ended September 30, 2014, the defined benefit pension plan Stichting Pensioenfonds CMG in Netherlands was settled as the Company signed an agreement with an insurance company to cover residual benefits and was no longer exposed to risks in respect of this plan. The obligations and assets extinguished on settlement amounted to $366,311,000.
In Norway, a defined benefit plan was terminated and replaced by a defined contribution plan in 2014. The plan settled when each member received an individual insurance paid up policy. The obligations and assets extinguished on settlement amounted to $17,505,000 and the Company recorded a settlement gain of $8,449,000.
95
Consolidated Financial Statements
Notes to the Consolidated Financial Statements
For the years ended September 30, 2014 and 2013
(tabular amounts only are in thousands of Canadian dollars, except per share data)
| 17. | Employee benefits (continued) |
DEFINED BENEFIT PLANS (CONTINUED)
| Defined benefit obligations | U.K. | Germany | France | Other | Total | |||||||||||||||
| $ | $ | $ | $ | $ | ||||||||||||||||
As at September 30, 2012 | 437,585 | 58,314 | 27,092 | 392,041 | 915,032 | |||||||||||||||
Current service cost | 1,096 | 1,060 | 2,943 | 3,422 | 8,521 | |||||||||||||||
Interest cost | 20,335 | 2,232 | 912 | 14,888 | 38,367 | |||||||||||||||
��Curtailment gain | — | — | (4,371) | — | (4,371) | |||||||||||||||
Actuarial losses (gains) due to change in financial assumptions1 | 53,236 | (910) | (262) | (1,654) | 50,410 | |||||||||||||||
Actuarial losses due to change in demographic assumptions1 | — | — | — | 2,281 | 2,281 | |||||||||||||||
Actuarial losses (gains) due to experience1 | 141 | (405) | 974 | (764) | (54) | |||||||||||||||
Termination benefits | 310 | — | — | — | 310 | |||||||||||||||
Plan participant contributions | 271 | — | — | 288 | 559 | |||||||||||||||
Benefits paid from the plan | (13,509) | (429) | — | (11,143) | (25,081) | |||||||||||||||
Benefits paid directly by employer | — | (1,084) | (88) | (1,409) | (2,581) | |||||||||||||||
Foreign currency translation adjustment1 | 22,040 | 5,877 | 2,770 | 36,833 | 67,520 | |||||||||||||||
As at September 30, 2013 | 521,505 | 64,655 | 29,970 | 434,783 | 1,050,913 | |||||||||||||||
Defined benefit obligation of unfunded plans | — | — | 29,970 | 11,302 | 41,272 | |||||||||||||||
Defined benefit obligation of funded plans | 521,505 | 64,655 | — | 423,481 | 1,009,641 | |||||||||||||||
As at September 30, 2013 | 521,505 | 64,655 | 29,970 | 434,783 | 1,050,913 | |||||||||||||||
| 1 | Amounts recognized in other comprehensive income. |
96
FISCAL 2014 RESULTS
Notes to the Consolidated Financial Statements
For the years ended September 30, 2014 and 2013
(tabular amounts only are in thousands of Canadian dollars, except per share data)
| 17. | Employee benefits (continued) |
DEFINED BENEFIT PLANS (CONTINUED)
| Plan assets and reimbursement rights | U.K. | Germany | France | Other | Total | |||||||||||||||
| $ | $ | $ | $ | $ | ||||||||||||||||
As at September 30, 2013 | 491,717 | 30,773 | — | 405,359 | 927,849 | |||||||||||||||
Assets distributed on settlement | — | — | — | (383,816) | (383,816) | |||||||||||||||
Interest income on plan assets | 23,430 | 1,123 | — | 1,635 | 26,188 | |||||||||||||||
Employer contributions | 17,396 | 2,031 | 495 | 4,251 | 24,173 | |||||||||||||||
Return on assets excluding interest income1 | 35,646 | 597 | — | (521) | 35,722 | |||||||||||||||
Plan participants contributions | 228 | 52 | — | 245 | 525 | |||||||||||||||
Benefits paid from the plan | (11,789) | (403) | — | (2,147) | (14,339) | |||||||||||||||
Benefits paid directly by employer | — | (1,427) | (495) | (457) | (2,379) | |||||||||||||||
Administration expenses paid from the plan | (1,566) | — | — | (6) | (1,572) | |||||||||||||||
Foreign currency translation adjustment1 | 46,251 | 254 | — | 2,345 | 48,850 | |||||||||||||||
As at September 30, 2014 | 601,313 | 33,000 | — | 26,888 | 661,201 | |||||||||||||||
Plan assets | 601,313 | 11,582 | — | 25,891 | 638,786 | |||||||||||||||
Reimbursement rights | — | 21,418 | — | 997 | 22,415 | |||||||||||||||
As at September 30, 2014 | 601,313 | 33,000 | — | 26,888 | 661,201 | |||||||||||||||
| Plan assets and reimbursement rights | U.K. | Germany | France | Other | Total | |||||||||||||||
| $ | $ | $ | $ | $ | ||||||||||||||||
As at September 30, 2012 | 433,727 | 27,480 | — | 364,034 | 825,241 | |||||||||||||||
Interest income on plan assets | 20,504 | 1,087 | — | 14,228 | 35,819 | |||||||||||||||
Employer contributions | 16,937 | 1,992 | 88 | 3,584 | 22,601 | |||||||||||||||
Return on assets excluding interest income1 | 13,885 | (461) | — | 619 | 14,043 | |||||||||||||||
Plan participants contributions | 271 | — | — | 288 | 559 | |||||||||||||||
Benefits paid from the plan | (13,509) | (1,014) | — | (11,143) | (25,666) | |||||||||||||||
Benefits paid directly by employer | — | (1,084) | (88) | (1,409) | (2,581) | |||||||||||||||
Administration expenses paid from the plan | (1,619) | — | — | (238) | (1,857) | |||||||||||||||
Foreign currency translation adjustment1 | 21,521 | 2,773 | — | 35,396 | 59,690 | |||||||||||||||
As at September 30, 2013 | 491,717 | 30,773 | — | 405,359 | 927,849 | |||||||||||||||
Plan assets | 491,717 | 10,539 | — | 404,737 | 906,993 | |||||||||||||||
Reimbursement rights | — | 20,234 | — | 622 | 20,856 | |||||||||||||||
As at September 30, 2013 | 491,717 | 30,773 | — | 405,359 | 927,849 | |||||||||||||||
| 1 | Amounts recognized in other comprehensive income. |
97
Consolidated Financial Statements
Notes to the Consolidated Financial Statements
For the years ended September 30, 2014 and 2013
(tabular amounts only are in thousands of Canadian dollars, except per share data)
| 17. | Employee benefits (continued) |
DEFINED BENEFIT PLANS (CONTINUED)
The plan assets at the end of the year consist of:
| As at September 30, 2014 | U.K. | Germany | France | Other | Total | |||||||||||||||
| $ | $ | $ | $ | $ | ||||||||||||||||
Quoted equities | 216,044 | — | — | 190 | 216,234 | |||||||||||||||
Quoted bonds | 352,305 | — | — | 9,543 | 361,848 | |||||||||||||||
Property | 29,897 | — | — | 1,371 | 31,268 | |||||||||||||||
Cash | 3,067 | — | — | 215 | 3,282 | |||||||||||||||
Other1 | — | 11,582 | — | 14,572 | 26,154 | |||||||||||||||
| 601,313 | 11,582 | — | 25,891 | 638,786 | ||||||||||||||||
| As at September 30, 2013 | U.K. | Germany | France | Other | Total | |||||||||||||||
| $ | $ | $ | $ | $ | ||||||||||||||||
Quoted equities | 181,463 | — | — | 2,214 | 183,677 | |||||||||||||||
Quoted bonds | 283,186 | — | — | 20,805 | 303,991 | |||||||||||||||
Property | 23,529 | — | — | 4,936 | 28,465 | |||||||||||||||
Cash | 3,539 | — | — | 2,948 | 6,487 | |||||||||||||||
Other1 | — | 10,539 | — | 373,834 | 384,373 | |||||||||||||||
| 491,717 | 10,539 | — | 404,737 | 906,993 | ||||||||||||||||
| 1 | Other is mainly composed of various insurance policies to cover some of the defined benefit obligations. |
Plan assets do not include any ordinary shares of the Company, property occupied by the Company or any other assets used by the Company.
The following table summarizes the expense1 recognized in the consolidated statements of earnings:
| Year ended September 30 | ||||||||
| 2014 | 2013 | |||||||
| $ | $ | |||||||
Current service cost | 7,770 | 8,521 | ||||||
Curtailment gain | — | (4,371) | ||||||
Settlement gain | (8,449 | ) | — | |||||
Past service cost | (128 | ) | — | |||||
Termination benefits | — | 310 | ||||||
Net interest on net defined benefit liability or asset | 4,283 | 2,548 | ||||||
Administration expenses | 1,572 | 1,857 | ||||||
| 5,048 | 8,865 | |||||||
| 1 | The expense was presented as a recovery of costs of services, selling and administrative for an amount of $807,000 and as finance costs for an amount of $5,855,000 ($5,981,000 and $4,405,000, respectively for the year ended September 30, 2013), with a curtailment gain of nil presented in integration-related costs ($1,521,000 for the year ended September 30, 2013). |
98
FISCAL 2014 RESULTS
Notes to the Consolidated Financial Statements
For the years ended September 30, 2014 and 2013
(tabular amounts only are in thousands of Canadian dollars, except per share data)
| 17. | Employee benefits (continued) |
DEFINED BENEFIT PLANS (CONTINUED)
Actuarial assumptions
The following are the principal actuarial assumptions at the reporting date (expressed as weighted averages). The assumed discount rates, future salary and pension increases, inflation rates and mortality all have a significant effect on the accounting valuation.
| As at September 30, 2014 | U.K. | Germany | France | Other | ||||||||||||
| % | % | % | % | |||||||||||||
Discount rate | 3.85 | 2.50 | 2.50 | 4.20 | ||||||||||||
Future salary increases | 3.25 | 2.50 | 2.00 | 5.50 | ||||||||||||
Future pension increases | 3.10 | 1.80 | — | — | ||||||||||||
Inflation | 3.25 | 2.00 | 2.00 | 2.90 | ||||||||||||
| As at September 30, 2013 | U.K. | Germany | France | Other | ||||||||||||
| % | % | % | % | |||||||||||||
Discount rate | 4.40 | 3.60 | 3.60 | 3.70 | ||||||||||||
Future salary increases | 3.35 | 2.50 | 2.00 | 5.30 | ||||||||||||
Future pension increases | 3.19 | 1.75 | — | — | ||||||||||||
Inflation | 3.35 | 2.00 | 2.00 | 2.10 | ||||||||||||
| The average longevity over 65 of a member presently at age 45 and 65 are as follows: | ||||||||||||||||
| As at September 30, 2014 | U.K. | Germany | ||||||||||||||
| (in years) | ||||||||||||||||
Longevity at age 65 for current members | ||||||||||||||||
Males | 22.4 | 19.0 | ||||||||||||||
Females | 23.8 | 23.0 | ||||||||||||||
Longevity at age 45 for current members | ||||||||||||||||
Males | 24.4 | 22.0 | ||||||||||||||
Females | 25.9 | 25.4 | ||||||||||||||
| As at September 30, 2013 | U.K. | Germany | ||||||||||||||
| (in years) | ||||||||||||||||
Longevity at age 65 for current members | ||||||||||||||||
Males | 22.4 | 19.0 | ||||||||||||||
Females | 23.8 | 23.0 | ||||||||||||||
Longevity at age 45 for current members | ||||||||||||||||
Males | 24.3 | 21.4 | ||||||||||||||
Females | 25.9 | 25.4 | ||||||||||||||
99
Consolidated Financial Statements
Notes to the Consolidated Financial Statements
For the years ended September 30, 2014 and 2013
(tabular amounts only are in thousands of Canadian dollars, except per share data)
| 17. | Employee benefits (continued) |
DEFINED BENEFIT PLANS (CONTINUED)
Actuarial assumptions (continued)
Assumptions regarding future mortality are set based on actuarial advice in accordance with published statistics and experience in each countries. Mortality assumptions for the most significant countries are based on the following post-retirement mortality tables for the years ended September 30, 2014 and 2013: (1) U.K.: 110% PNXA00 (year of birth) plus CMI_2011 projections with 1% p.a. minimum long term improvement rate and (2) Germany: Heubeck RT2005G.
The following table shows the sensitivity of the defined benefit obligations to changes in these assumptions, all other actuarial assumptions remaining unchanged:
| As at September 30, 2014 | U.K. | Germany | France | |||||||||
| $ | $ | $ | ||||||||||
Increase of 0.25% in the discount rate | (28,480) | (2,757) | (1,849) | |||||||||
Decrease of 0.25% in the discount rate | 30,292 | 2,913 | 1,952 | |||||||||
Salary increase of 0.25% | 931 | 642 | 1,999 | |||||||||
Salary decrease of 0.25% | (913) | (568) | (1,900) | |||||||||
Pension increase of 0.25% | 8,759 | 1,120 | — | |||||||||
Pension decrease of 0.25% | (9,248) | (1,081) | — | |||||||||
Increase of 0.25% in inflation | 22,873 | 1,152 | 1,999 | |||||||||
Decrease of 0.25% in inflation | (21,707) | (1,098) | (1,900) | |||||||||
Increase of one year in life expectancy | 15,039 | 2,482 | — | |||||||||
Decrease of one year in life expectancy | (15,124) | (2,517) | — | |||||||||
| As at September 30, 2013 | U.K. | Germany | France | |||||||||
| $ | $ | $ | ||||||||||
Increase of 0.25% in the discount rate | (21,118) | (2,674) | (1,286) | |||||||||
Decrease of 0.25% in the discount rate | 23,052 | 1,784 | 1,357 | |||||||||
Salary increase of 0.25% | 715 | 528 | 1,390 | |||||||||
Salary decrease of 0.25% | (700) | (468) | (1,322) | |||||||||
Pension increase of 0.25% | 7,095 | 928 | — | |||||||||
Pension decrease of 0.25% | (7,490) | (896) | — | |||||||||
Increase of 0.25% in inflation | 16,235 | 1,440 | 1,390 | |||||||||
Decrease of 0.25% in inflation | (14,107) | (632) | (1,322) | |||||||||
Increase of one year in life expectancy | 10,504 | 1,673 | — | |||||||||
Decrease of one year in life expectancy | (10,626) | (1,719) | — | |||||||||
The sensitivity analysis above have been based on a method that extrapolates the impact on the defined benefit obligation as a result of reasonable changes in key assumptions occurring at the end of the year.
The weighted average durations of the defined benefit obligations are as follows:
| Year ended September 30 | ||||||||||
| 2014 | 2013 | |||||||||
| (in years) | ||||||||||
U.K. | 19 | 17 | ||||||||
Germany | 15 | 17 | ||||||||
France | 18 | 18 | ||||||||
Other | 14 | 17 | ||||||||
100
FISCAL 2014 RESULTS
Notes to the Consolidated Financial Statements
For the years ended September 30, 2014 and 2013
(tabular amounts only are in thousands of Canadian dollars, except per share data)
| 17. | Employee benefits (continued) |
DEFINED BENEFIT PLANS (CONTINUED)
The Company expects to contribute $20,140,000 to defined benefit plans during the next year, of which $17,217,000 relates to the U.K. plans, and $2,923,000 relating to the other plans. The contributions will include new benefit accruals and deficit recovery payments.
DEFINED CONTRIBUTION PLANS
The Company also operates defined contribution retirement plans. In some countries, contributions are made into state pension plans. The pension cost expense for defined contribution plans amounted to $217,980,000 in 2014 ($207,616,000 in 2013).
In addition, in Sweden the Company contributes to a multi-employer plan, Alecta SE pension plan, which is a defined benefit pension plan. This pension plan is classified as a defined contribution plan as sufficient information is not available to use defined benefit accounting. Alecta lacks the possibility of establishing an exact distribution of assets and provisions to the respective employers. The Company’s proportion of the total contributions to the plan is 0.87% and the Company’s proportion of the total number of active members in the plan is 0.64%.
Alecta uses a collective funding ratio to determine the surplus or deficit in the pension plan. Any surplus or deficit in the plan will affect the amount of future contributions payable. The collective funding is the difference between Alecta’s assets and the commitments to the policyholders and insured individuals. The collective solvency is normally allowed to vary between 125% and 155%, with the target being 140%. At September 30, 2014, Alecta’s collective funding ratio was 146% (145% in 2013). The plan expense was $45,044,000 in 2014 ($38,598,000 in 2013). The Company expects to contribute $43,707,000 to the plan during the next year.
OTHER BENEFIT PLANS
The Company maintains two non-qualified deferred compensation plans covering some of its U.S. management. One of these plans is an unfunded plan and the deferred compensation liability totaled $482,000 as at September 30, 2014 ($501,000 as at September 30, 2013). The other plan is a funded plan for which a trust was established so that the plan assets could be segregated; however, the assets are subject to the Company’s general creditors in the case of bankruptcy. The assets composed of investments vary with employees’ contributions and changes in the value of the investments. The change in liability associated with the plan is equal to the change of the assets. The assets in the trust and the associated liabilities totaled $31,151,000 as at September 30, 2014 ($24,752,000 as at September 30, 2013).
The deferred compensation plans assets and liabilities are presented in long-term financial assets and other long-term liabilities, respectively.
101
Consolidated Financial Statements
Notes to the Consolidated Financial Statements
For the years ended September 30, 2014 and 2013
(tabular amounts only are in thousands of Canadian dollars, except per share data)
| 18. | Accumulated other comprehensive income |
| As at September 30, 2014 | As at September 30, 2013 | |||||||
| $ | $ | |||||||
Items that will be reclassified subsequently to net earnings: | ||||||||
Net unrealized gains on translating financial statements of foreign operations, net of accumulated income tax expense of $31,986 as at September 30, 2014 ($18,818 as at September 30, 2013) | 511,689 | 290,410 | ||||||
Net losses on derivative financial instruments and on translating long-term debt designated as hedges of net investments in foreign operations, net of accumulated income tax recovery of $37,024 as at September 30, 2014 ($21,349 as at September 30, 2013) | (238,583) | (137,714) | ||||||
Net unrealized gains (losses) on cash flow hedges, net of accumulated income tax expense of $2,162 as at September 30, 2014 (net of accumulated income tax recovery of $3,085 as at September 30, 2013) | 14,520 | (6,209) | ||||||
Net unrealized gains on investments available for sale, net of accumulated income tax expense of $942 as at September 30, 2014 ($617 as at September 30, 2013) | 2,576 | 1,635 | ||||||
Items that will not be reclassified subsequently to net earnings: | ||||||||
Net remeasurement losses, net of accumulated income tax recovery of $18,728 as at September 30, 2014 ($5,788 as at September 30, 2013) | (61,578) | (26,267) | ||||||
| 228,624 | 121,855 | |||||||
For the year ended September 30, 2014, $22,000 of the net unrealized gains previously recognized in other comprehensive income, net of income tax expense of $133,000, were reclassified to net earnings for derivative financial instruments designated as cash flow hedges ($1,967,000 of the net unrealized losses net of income tax recovery of $1,601,000 for the year ended September 30, 2013).
102
FISCAL 2014 RESULTS
Notes to the Consolidated Financial Statements
For the years ended September 30, 2014 and 2013
(tabular amounts only are in thousands of Canadian dollars, except per share data)
| 19. | Capital stock |
Authorized, an unlimited number without par value:
First preferred shares, carrying one vote per share, ranking prior to second preferred shares, Class A subordinate shares and Class B shares with respect to the payment of dividends;
Second preferred shares, non-voting, ranking prior to Class A subordinate shares and Class B shares with respect to the payment of dividends;
Class A subordinate shares, carrying one vote per share, participating equally with Class B shares with respect to the payment of dividends and convertible into Class B shares under certain conditions in the event of certain takeover bids on Class B shares;
Class B shares, carrying ten votes per share, participating equally with Class A subordinate shares with respect to the payment of dividends and convertible at any time at the option of the holder into Class A subordinate shares.
For 2014 and 2013, the Class A subordinate and the Class B shares varied as follows:
Class A subordinate shares
| Class B shares
| Total
| ||||||||||||||||||||||
Number |
Carrying value |
Number |
Carrying value |
Number |
Carrying value | |||||||||||||||||||
| $ | $ | $ | ||||||||||||||||||||||
As at September 30, 2012 | 273,771,106 | 2,154,807 | 33,608,159 | 46,887 | 307,379,265 | 2,201,694 | ||||||||||||||||||
Issued upon exercise of stock options1 | 3,765,982 | 51,971 | — | — | 3,765,982 | 51,971 | ||||||||||||||||||
Repurchased and cancelled2 | (723,100) | (5,780) | — | — | (723,100) | (5,780) | ||||||||||||||||||
Purchased and held in trust3 | — | (7,663) | — | — | — | (7,663) | ||||||||||||||||||
PSUs exercised4 | — | 272 | — | — | — | 272 | ||||||||||||||||||
Conversion of shares5 | 335,392 | 468 | (335,392) | (468) | — | — | ||||||||||||||||||
As at September 30, 2013 | 277,149,380 | 2,194,075 | 33,272,767 | 46,419 | 310,422,147 | 2,240,494 | ||||||||||||||||||
Issued upon exercise of stock options1 | 4,999,544 | 83,305 | — | — | 4,999,544 | 83,305 | ||||||||||||||||||
Repurchased and cancelled2 | (2,837,360) | (56,077) | — | — | (2,837,360) | (56,077) | ||||||||||||||||||
Purchased and held in trust3 | — | (23,016) | — | — | — | (23,016) | ||||||||||||||||||
Resale of shares held in trust3 | — | 908 | — | — | — | 908 | ||||||||||||||||||
PSUs exercised4 | — | 583 | — | — | — | 583 | ||||||||||||||||||
As at September 30, 2014 | 279,311,564 | 2,199,778 | 33,272,767 | 46,419 | 312,584,331 | 2,246,197 | ||||||||||||||||||
| 1 | The carrying value of Class A subordinate shares includes $18,380,000 ($12,531,000 in 2013), which corresponds to a reduction in contributed surplus representing the value of accumulated compensation costs associated with the stock options exercised during the year. |
| 2 | On January 29, 2014, the Company’s Board of Directors authorized the renewal of a Normal Course Issuer Bid (“NCIB”) for the purchase of up to 21,798,645 Class A subordinate shares during the next year (20,685,976 in 2013) for cancellation on the open market through the TSX. The Class A subordinate shares were available for purchase commencing February 11, 2014, until no later than February 10, 2015, or on such earlier date when the Company completes its purchases or elects to terminate the NCIB. During the year ended September 30, 2014, the Company repurchased 2,490,660 Class A subordinate shares from the Caisse de dépôt et placement du Québec for a cash consideration of $100,000,000. The excess of the purchase price over the carrying value in the amount of $46,675,000 was charged to retained earnings. In accordance with the requirements of TSX, the repurchased shares have been taken into account in calculating the annual aggregate limit that the Company is entitled to repurchase under its previous NCIB. In addition, during the year ended September 30, 2014, the Company repurchased 346,700 Class A subordinate shares under the previous NCIB (723,100 in 2013) for a cash consideration of $11,468,000 ($22,869,000 in 2013). The excess of the purchase price over the carrying value, in the amount of $8,716,000 ($17,089,000 in 2013), was charged to retained earnings. |
| 3 | The trustee, in accordance with the terms of the PSU plan and a Trust Agreement, purchased 619,888 Class A subordinate shares of the Company on the open market for $23,016,000 during the year ended September 30, 2014 (336,849 Class A subordinate shares for $7,663,000 during the year ended September 30, 2013). During the year ended September 30, 2014, the trustee sold 35,576 Class A subordinate shares that were held in trust on the open market in accordance with the terms of the PSU plan. The excess of proceeds over the carrying value of the Class A subordinate shares, in the amount of $482,000, resulted in an increase of contributed surplus. For the year ended September 30, 2013, the trustee did not sell any Class A subordinate shares. |
| 4 | During the year ended September 30, 2014, 22,858 PSUs were exercised (14,020 during the year ended September 30, 2013) with a recorded average fair value of $583,000 ($272,000 as at September 30, 2013) that was removed from contributed surplus. As at September 30, 2014, 1,748,149 Class A subordinate shares were held in trust under the PSU plan (1,186,695 as at September 30, 2013) (Note 20b). |
| 5 | During the year ended September 30, 2013, a shareholder converted 335,392 Class B shares into 335,392 Class A subordinate shares. No class B shares were converted during the year ended September 30, 2014. |
103
Consolidated Financial Statements
Notes to the Consolidated Financial Statements
For the years ended September 30, 2014 and 2013
(tabular amounts only are in thousands of Canadian dollars, except per share data)
| 20. | Share-based payments |
| a) | Stock options |
Under the Company’s stock option plan, the Board of Directors may grant, at its discretion, stock options to purchase Class A subordinate shares to certain employees, officers, directors and consultants of the Company and its subsidiaries. The exercise price is established by the Board of Directors and is equal to the closing price of the Class A subordinate shares on the TSX on the day preceding the date of the grant. Stock options generally vest over four years from the date of grant conditionally upon achievement of objectives and must be exercised within a ten-year period, except in the event of retirement, termination of employment or death. As at September 30, 2014, 43,616,083 Class A subordinate shares have been reserved for issuance under the stock option plan.
The following table presents information concerning all outstanding stock options granted by the Company:
| 2014 | 2013 | |||||||||||||||
| Number of options | | Weighted average exercise price per share | | Number of options | | Weighted average exercise price per share | | |||||||||
| $ | $ | |||||||||||||||
Outstanding, beginning of year | 20,209,569 | 16.45 | 18,617,230 | 12.69 | ||||||||||||
Granted | 5,973,451 | 37.15 | 7,196,903 | 23.89 | ||||||||||||
Exercised | (4,999,544) | 12.99 | (3,765,982) | 10.47 | ||||||||||||
Forfeited | (1,438,920) | 26.45 | (1,825,447) | 19.77 | ||||||||||||
Expired | (16,450) | 7.85 | (13,135) | 11.42 | ||||||||||||
Outstanding, end of year | 19,728,106 | 22.88 | 20,209,569 | 16.45 | ||||||||||||
Exercisable, end of year | 8,890,504 | 14.13 | 10,955,235 | 11.70 | ||||||||||||
The weighted average share price at the date of exercise for share options exercised in 2014 was $37.78 ($29.47 in 2013).
The following table summarizes information about outstanding stock options granted by the Company as at September 30, 2014:
| Options outstanding | Options exercisable | |||||||||||||||||||||||
| Range of exercise price | Number of options | Weighted contractual life (years) | Weighted average exercise price | Number of options | Weighted average | |||||||||||||||||||
| $ | $ | $ | ||||||||||||||||||||||
| 7.00 to 8.55 | 490,915 | 1.66 | 8.08 | 490,915 | 8.08 | |||||||||||||||||||
| 9.05 to 10.05 | 1,634,331 | 4.00 | 9.31 | 1,634,331 | 9.31 | |||||||||||||||||||
| 10.11 to 11.80 | 993,269 | 3.03 | 11.38 | 993,269 | 11.38 | |||||||||||||||||||
| 12.54 to 13.26 | 2,282,150 | 5.00 | 12.56 | 2,282,150 | 12.56 | |||||||||||||||||||
| 14.48 to 15.96 | 2,631,359 | 6.00 | 15.48 | 1,880,357 | 15.48 | |||||||||||||||||||
| 19.28 to 22.52 | 830,466 | 7.00 | 19.79 | 436,086 | 19.83 | |||||||||||||||||||
| 23.65 to 32.57 | 5,192,158 | 8.22 | 23.91 | 1,126,898 | 23.99 | |||||||||||||||||||
| 34.68 to 38.79 | 5,673,458 | 9.28 | 37.17 | 46,498 | 36.60 | |||||||||||||||||||
| 19,728,106 | 7.03 | 22.88 | 8,890,504 | 14.13 | ||||||||||||||||||||
104
FISCAL 2014 RESULTS
Notes to the Consolidated Financial Statements
For the years ended September 30, 2014 and 2013
(tabular amounts only are in thousands of Canadian dollars, except per share data)
| 20. | Share-based payments (continued) |
| a) | Stock options (continued) |
The fair value of stock options granted in the year and the weighted average assumptions used in the calculation of their fair value on the date of grant using the Black-Scholes option pricing model were as follows:
| Year ended September 30 | ||||||||
| 2014 | 2013 | |||||||
Grant date fair value ($) | 7.98 | 4.98 | ||||||
Dividend yield (%) | 0.00 | 0.00 | ||||||
Expected volatility (%)1 | 23.92 | 23.67 | ||||||
Risk-free interest rate (%) | 1.53 | 1.29 | ||||||
Expected life (years) | 4.00 | 4.00 | ||||||
Exercise price ($) | 37.15 | 23.89 | ||||||
Share price ($) | 37.15 | 23.89 | ||||||
| 1 | Expected volatility was determined using statistical formulas and based on the weekly historical average of closing daily share prices over the period of the expected life of stock option. |
| b) | Performance share units |
Under the PSU plan, the Board of Directors may grant PSUs to senior executives and other key employees (“participants”) which entitle them to receive one Class A subordinate share for each PSU. The vesting performance conditions are determined by the Board of Directors at the time of each grant. PSUs expire on the business day preceding December 31 of the third calendar year following the end of the fiscal year during which the PSU award was made, except in the event of retirement, termination of employment or death. Granted PSUs vest annually over a period of four years from the date of grant conditionally upon achievement of objectives.
Class A subordinate shares purchased in connection with the PSU plan are held in trust for the benefit of the participants. The trust, considered as a structured entity, is consolidated in the Company’s consolidated financial statements with the cost of the purchased shares recorded as a reduction of capital stock (Note 19).
The following table presents information concerning the number of outstanding PSUs granted by the Company:
Outstanding as at September 30, 2012 | 863,866 | |||
Granted1 | 805,921 | |||
Exercised | (14,020) | |||
Forfeited | (469,072) | |||
Outstanding as at September 30, 2013 | 1,186,695 | |||
Granted1 | 619,888 | |||
Exercised | (22,858) | |||
Forfeited | (35,576) | |||
Outstanding as at September 30, 2014 | 1,748,149 |
| 1 | The PSUs granted in 2014 had a grant date fair value of $36.15 per unit ($23.65 in 2013). |
105
Consolidated Financial Statements
Notes to the Consolidated Financial Statements
For the years ended September 30, 2014 and 2013
(tabular amounts only are in thousands of Canadian dollars, except per share data)
| 20. | Share-based payments (continued) |
| c) | Share Purchase plan |
Under the Share purchase plan, the Company contributes to the Share purchase plan an amount equal to a percentage of the employee’s basic contribution, up to a maximum of 3.5%. An employee may make additional contributions in excess of the basic contribution however the Company does not match contributions in the case of such additional contributions. The employee and Company contributions are remitted to an independent plan administrator who purchases Class A subordinate shares on the open market on behalf of the employee through either the TSX or New York Stock Exchange.
| d) | Deferred share unit plan |
Under the DSU plan, the Board of Directors may grant DSUs to members of the Board of Directors (“participants”). DSUs are granted with immediate vesting and must be exercised no later than December 15 of the calendar year immediately following the calendar year during which the participant ceases to act as a Director. Each DSU entitles the holder to receive a cash payment equal to the closing price of Class A subordinate shares on the TSX on the payment date.
| e) | Share-based payment costs |
The share-based payment expense recorded in cost of services, selling and administrative expenses is as follows:
| Year ended September 30 | ||||||||
2014
| 2013
| |||||||
| $ | $ | |||||||
Stock options | 18,383 | 19,631 | ||||||
PSUs | 13,333 | 11,642 | ||||||
Share purchase plan | 69,500 | 52,542 | ||||||
DSUs | 1,109 | 2,205 | ||||||
| 102,325 | 86,020 | |||||||
| 21. | Earnings per share |
The following table sets forth the computation of basic and diluted earnings per share for the year ended September 30:
| 2014 | 2013 | |||||||||||||||||||||||
| Net earnings | Weighted average number of shares outstanding1 | Earnings per share | Net earnings | Weighted average number of shares outstanding1 | Earnings per share | |||||||||||||||||||
| $ | $ | $ | $ | |||||||||||||||||||||
Basic | 859,443 | 308,743,126 | 2.78 | 455,820 | 307,900,034 | 1.48 | ||||||||||||||||||
Dilutive stock options and PSUs2 | 10,184,611 | 9,074,145 | ||||||||||||||||||||||
| 859,443 | 318,927,737 | 2.69 | 455,820 | 316,974,179 | 1.44 | |||||||||||||||||||
| 1 | The 2,837,360 Class A subordinate shares repurchased and 1,748,149 Class A subordinate shares held in trust during the year ended September 30, 2014 (723,100 and 1,186,695, respectively, during year ended September 30, 2013), were excluded from the calculation of weighted average number of shares outstanding as of the date of transaction. |
| 2 | The calculation of the diluted earnings per share excluded 5,648,757 stock options for the year ended September 30, 2014 (19,994 for the year ended September 30, 2013), as they were anti-dilutive. |
106
FISCAL 2014 RESULTS
Notes to the Consolidated Financial Statements
For the years ended September 30, 2014 and 2013
(tabular amounts only are in thousands of Canadian dollars, except per share data)
| 22. | Construction contracts in progress |
Revenue from systems integration and consulting services under fixed-fee arrangements where the outcome of the arrangements can be estimated reliably is recognized using the percentage-of-completion method over the service periods. The Company uses the labour costs or labour hours to measure the progress towards completion. If the outcome of an arrangement cannot be estimated reliably, revenue is recognized to the extent of arrangement costs incurred that are likely to be recoverable.
Amounts recognized as revenue in excess of billings are classified as work in progress. Amounts received in advance of the delivery of products or performances of services are classified as deferred revenue.
The status of the Company’s construction contracts still in progress at the end of the reporting period was as follows:
| As at | As at | |||||||
| September 30, 2014 | September 30, 2013 | |||||||
| $ | $ | |||||||
Recognized as: | ||||||||
Revenue in the respective year | 1,575,593 | 1,634,739 | ||||||
Recognized as: | ||||||||
Amounts due from customers under construction contracts1 | 289,838 | 311,733 | ||||||
Amounts due to customers under construction contracts | (153,962) | (209,890) | ||||||
| 1 | As at September 30, 2014, retentions held by customers for contract work in progress amounted to $50,425,000 ($38,133,000 as at September 30, 2013). |
| 23. | Costs of services, selling and administrative |
| Year ended September 30 | ||||||||
| 2014 | 2013 | |||||||
| $ | $ | |||||||
Salaries and other member costs1 | 6,215,991 | 5,954,032 | ||||||
Hardware, software and data center related costs | 786,360 | 864,687 | ||||||
Professional fees and other contracted labour | 1,260,955 | 1,311,323 | ||||||
Property costs | 398,560 | 410,197 | ||||||
Amortization and depreciation (Note 24) | 435,775 | 416,889 | ||||||
Other operating expenses | 32,150 | 55,182 | ||||||
| 9,129,791 | 9,012,310 | |||||||
| 1 | Net of tax credits of $121,114,000 in 2014 ($95,911,000 in 2013). |
107
Consolidated Financial Statements
Notes to the Consolidated Financial Statements
For the years ended September 30, 2014 and 2013
(tabular amounts only are in thousands of Canadian dollars, except per share data)
| 24. | Amortization and depreciation |
Year ended September 30
| ||||||||
2014
| 2013
| |||||||
| $ | $ | |||||||
Depreciation of PP&E1 | 186,886 | 175,687 | ||||||
Amortization of intangible assets | 192,692 | 185,309 | ||||||
Amortization of contract costs related to transition costs
|
| 56,197
|
|
| 55,893
|
| ||
Included in costs of services, selling and administrative (Note 23) | 435,775 | 416,889 | ||||||
Amortization of contract costs related to incentives (presented as a reduction of revenue) | 5,889 | 8,151 | ||||||
Amortization of internal-use software (presented in integration-related costs) | — | 8,672 | ||||||
Amortization of deferred financing fees (presented in finance costs) | 1,185 | 1,186 | ||||||
Amortization of premiums and discounts on investments related to funds held for clients
|
| 1,383
|
|
| 1,046
|
| ||
|
| 444,232
|
|
| 435,944
|
| |||
| 1 | Depreciation of PP&E acquired under finance leases was $23,822,000 in 2014 ($21,102,000 in 2013). |
| 25. | Finance costs |
| Year ended September 30 | ||||||||
| 2014 | 2013 | |||||||
| $ | $ | |||||||
Interest on long-term debt | 92,581 | 104,502 | ||||||
Net interest cost on the net defined benefit plans (Note 17) | 5,855 | 4,405 | ||||||
Other finance costs
|
| 2,842
|
|
| 5,024
|
| ||
|
| 101,278
|
|
| 113,931
|
| |||
| 26. | Investments in subsidiaries |
2014 TRANSACTIONS
There were no acquisitions or significant disposals for the year ended September 30, 2014.
2013 TRANSACTIONS
There were no acquisitions or significant disposals for the year ended September 30, 2013.
108
FISCAL 2014 RESULTS
Notes to the Consolidated Financial Statements
For the years ended September 30, 2014 and 2013
(tabular amounts only are in thousands of Canadian dollars, except per share data)
| 26. | Investments in subsidiaries (continued) |
2012 TRANSACTIONS
| a) | Modifications to purchase price allocation |
During the year ended September 30, 2013, the Company finalized the purchase price allocation and made adjustments relating to the acquisition of Logica. The prior period figures had been retrospectively revised in 2013 as follows:
Purchase price allocation, as
| Adjustments and
| Final purchase price
| ||||||||||
| $ | $ | $ | ||||||||||
Assets | ||||||||||||
Current assets1 | 1,374,838 | (72,333) | 1,302,505 | |||||||||
Property, plant and equipment | 250,808 | (19,169) | 231,639 | |||||||||
Contract costs | 71,697 | 948 | 72,645 | |||||||||
Intangible assets | 603,683 | (68,620) | 535,063 | |||||||||
Other long-term assets | 87,789 | (1,667) | 86,122 | |||||||||
Deferred tax assets | 197,210 | 126,571 | 323,781 | |||||||||
Goodwill
|
| 3,276,172
|
|
| 265,324
|
|
| 3,541,496
|
| |||
|
| 5,862,197
|
|
| 231,054
|
|
| 6,093,251
|
| ||||
Liabilities | ||||||||||||
Current liabilities | (1,546,273) | (285,657) | (1,831,930) | |||||||||
Debt2 | (808,775) | — | (808,775) | |||||||||
Deferred tax liabilities | (43,616) | 22,472 | (21,144) | |||||||||
Long-term provisions | (182,880) | 86,570 | (96,310) | |||||||||
Retirement benefits obligations | (113,526) | — | (113,526) | |||||||||
Other long-term liabilities
|
| (426,864)
|
|
| (54,439)
|
|
| (481,303)
|
| |||
|
| (3,121,934)
|
|
| (231,054)
|
|
| (3,352,988)
|
| ||||
Bank overdraft assumed, net
|
| (57,883)
|
|
| —
|
|
| (57,883)
|
| |||
Net assets acquired
|
| 2,682,380
|
|
| —
|
|
| 2,682,380
|
| |||
Cash consideration | 2,676,912 | 2,676,912 | ||||||||||
Consideration payable3
|
| 5,468
|
| 5,468 | ||||||||
| 1 | The current assets include accounts receivable with a fair value of $866,816,000 which approximates the gross amount due under the contracts. |
| 2 | The fair value of the assumed debt in the business acquisition at August 20, 2012 was $808,775,000. In 2012, the Company repaid Logica’s debt for an amount of $891,354,000, less settlement of foreign currency forward contracts of $50,171,000 resulting in a loss of $83,632,000, which was recorded in acquisition-related and integration costs. |
| 3 | Paid during the year ended September 30, 2013. |
109
Consolidated Financial Statements
Notes to the Consolidated Financial Statements
For the years ended September 30, 2014 and 2013
(tabular amounts only are in thousands of Canadian dollars, except per share data)
| 26. | Investments in subsidiaries (continued) |
2012 TRANSACTIONS (CONTINUED)
| a) | Modifications to purchase price allocation (continued) |
IMPACT ON CONSOLIDATED BALANCE SHEET AS AT SEPTEMBER 30, 2012
The following represents the revised consolidated balance sheet as at September 30, 2012 which reflects the final purchase price allocation adjustments and the related additional reclassifications applied to the consolidated balance sheet as at September 30, 2012. A discussion of the adjustments and resulting impact for year ended September 30, 2012 are presented further below.
As originally
| Adjustments and
| Foreign exchange on
| Final
| |||||||||||||||||
| $ | $ | $ | $ | |||||||||||||||||
Assets | ||||||||||||||||||||
Current assets | ||||||||||||||||||||
Cash and cash equivalents | 113,103 | — | — | 113,103 | ||||||||||||||||
Short-term investments | 14,459 | — | — | 14,459 | ||||||||||||||||
Accounts receivable | 1,446,149 | A | (32,273) | (941) | 1,412,935 | |||||||||||||||
Work in progress | 744,482 | A | (45,819) | (1,531) | 697,132 | |||||||||||||||
Prepaid expenses and other current assets | 244,805 | A | (8,840) | (3) | 235,962 | |||||||||||||||
Income taxes
|
| 24,650
|
| I |
| 14,599
|
|
| 628
|
|
| 39,877
|
| |||||||
Total current assets before funds held for clients | 2,587,648 | (72,333) | (1,847) | 2,513,468 | ||||||||||||||||
Funds held for clients
|
| 202,407
|
|
| —
|
|
| —
|
|
| 202,407
|
| ||||||||
Total current assets | 2,790,055 | (72,333) | (1,847) | 2,715,875 | ||||||||||||||||
Property, plant and equipment | 500,995 | A, B, F | (19,169) | (346) | 481,480 | |||||||||||||||
Contract costs | 167,742 | A | 948 | (40) | 168,650 | |||||||||||||||
Intangible assets | 858,892 | C | (68,620) | (2,493) | 787,779 | |||||||||||||||
Other long-term assets | 96,351 | A | (1,667) | (59) | 94,625 | |||||||||||||||
Deferred tax assets | 219,590 | I | 126,571 | 2,528 | 348,689 | |||||||||||||||
Goodwill
|
| 5,819,817
|
|
| 265,324
|
|
| 7,993
|
|
| 6,093,134
|
| ||||||||
|
| 10,453,442
|
|
| 231,054
|
|
| 5,736
|
|
| 10,690,232
|
| |||||||||
Liabilities | ||||||||||||||||||||
Current liabilities | ||||||||||||||||||||
Accounts payable and accrued liabilities | 1,156,737 | A, H | 124,680 | 4,614 | 1,286,031 | |||||||||||||||
Accrued compensation | 539,779 | D | (16,695) | (520) | 522,564 | |||||||||||||||
Deferred revenue | 443,596 | A | 90,792 | 1,514 | 535,902 | |||||||||||||||
Income taxes | 177,030 | I | (58) | (10) | 176,962 | |||||||||||||||
Provisions | 160,625 | E, F, J | 86,938 | 3,124 | 250,687 | |||||||||||||||
Current portion of long-term debt
|
| 52,347
|
|
| —
|
|
| —
|
|
| 52,347
|
| ||||||||
Total current liabilities before clients’ funds obligations | 2,530,114 | 285,657 | 8,722 | 2,824,493 | ||||||||||||||||
Clients’ funds obligations
|
| 197,986
|
|
| —
|
|
| —
|
|
| 197,986
|
| ||||||||
Total current liabilities | 2,728,100 | 285,657 | 8,722 | 3,022,479 | ||||||||||||||||
Long-term provisions | 216,507 | E, F | (86,570) | (3,799) | 126,138 | |||||||||||||||
Long-term debt | 3,196,061 | — | — | 3,196,061 | ||||||||||||||||
Other long-term liabilities | 601,232 | A, D, G, H | 54,439 | 1,450 | 657,121 | |||||||||||||||
Deferred tax liabilities | 171,130 | I | (22,472) | (1,206) | 147,452 | |||||||||||||||
Retirement benefits obligations
|
| 118,078
|
|
| —
|
|
| —
|
|
| 118,078
|
| ||||||||
| 7,031,108 | 231,054 | 5,167 | 7,267,329 | |||||||||||||||||
Equity | ||||||||||||||||||||
Retained earnings | 1,113,225 | — | — | 1,113,225 | ||||||||||||||||
Accumulated other comprehensive (loss) income | (275) | — | 569 | 294 | ||||||||||||||||
Capital stock | 2,201,694 | — | — | 2,201,694 | ||||||||||||||||
Contributed surplus
|
| 107,690
|
|
| —
|
|
| —
|
|
| 107,690
|
| ||||||||
|
| 3,422,334
|
|
| —
|
|
| 569
|
|
| 3,422,903
|
| |||||||||
|
| 10,453,442
|
|
| 231,054
|
|
| 5,736
|
|
| 10,690,232
|
| |||||||||
110
FISCAL 2014 RESULTS
Notes to the Consolidated Financial Statements
For the years ended September 30, 2014 and 2013
(tabular amounts only are in thousands of Canadian dollars, except per share data)
| 26. | Investments in subsidiaries (continued) |
2012 TRANSACTIONS (CONTINUED)
| a) | Modifications to purchase price allocation (continued) |
IMPACT ON CONSOLIDATED BALANCE SHEET AS AT SEPTEMBER 30, 2012 (CONTINUED)
| A. | Contract accounting |
The Company obtained supplementary information and reviewed estimates related to client contracts and made reclassifications. As a result, accounts receivable, work in progress, prepaid expenses and other current assets, property, plant and equipment and other long-term assets decreased by an amount of $32,273,000, $13,663,000, $8,840,000, $8,947,000, $1,667,000, respectively while contract costs, accounts payable and accrued liabilities as well as long-term deferred revenue, estimated losses on revenue-generating contracts and other within other long-term liabilities increased by an amount of $948,000, $4,482,000, $29,638,000, $142,173,000 and $8,514,000, respectively.
In addition, certain reclassifications for presentation purposes were done. As a result, accounts payable and accrued liabilities and current deferred revenue increased by an amount of $114,253,000 and $90,792,000, respectively while work in progress, long-term deferred revenue and estimated losses on revenue-generating contracts within other long-term liabilities decreased by an amount of $32,156,000, $131,751,000 and $105,450,000, respectively.
| B. | Buildings |
The Company refined the assumptions related to the fair value of buildings acquired. As a result, property, plant and equipment decreased by an amount of $2,377,000.
| C. | Intangible assets |
The Company refined the assumptions related to cash flows. As a result, internal-use software increased by an amount of $5,918,000 while business solutions and client relationships decreased by an amount of $3,966,000 and $70,572,000, respectively.
| D. | Accrued compensation |
The Company adjusted the accrued compensation provision. As a result, accrued compensation decreased by an amount of $16,695,000 while other within other long-term liabilities increased by an amount of $5,488,000.
| E. | Litigations and claims |
The Company obtained supplementary information, reviewed estimates and settled claims that have been agreed upon by both parties for a social security and contractual dispute claim against the Company. As a result, current and non-current provisions for litigations decreased by an amount of $708,000 and $18,144,000, respectively.
In addition, the Company made certain reclassifications from non-current provisions to current provisions for an amount of $86,884,000.
| F. | Lease provisions |
The Company refined the assumptions related to the discount rate, sublease rental cash flows and costs to restore premises at the end of the lease period. As a result, onerous leases within current provisions decreased by an amount of $3,704,000 while onerous lease and decommissioning liabilities within non-current provisions and decommissioning liabilities within current provisions increased by an amount of $9,681,000, $13,777,000 and $1,405,000. Additionally, leasehold improvements within property, plant and equipment decreased by an amount of $7,845,000.
| G. | Fair value of client contracts |
The Company refined the assumptions related to the discount rate and the expected amount and timing of future cash flows related to client contracts. As a result, long-term deferred revenue within other long-term liabilities increased by an amount of $67,507,000.
111
Consolidated Financial Statements
Notes to the Consolidated Financial Statements
For the years ended September 30, 2014 and 2013
(tabular amounts only are in thousands of Canadian dollars, except per share data)
| 26. | Investments in subsidiaries (continued) |
2012 TRANSACTIONS (CONTINUED)
| a) | Modifications to purchase price allocation (continued) |
IMPACT ON CONSOLIDATED BALANCE SHEET AS AT SEPTEMBER 30, 2012 (CONTINUED)
| H. | Fair value of lease contracts |
The Company refined the assumptions related to the discount rate and rental rates in effect at the acquisition date of lease contracts. As a result, deferred rent within accounts payable and accrued liabilities and within other long-term liabilities increased by an amount of $5,945,000 and $38,320,000.
| I. | Income taxes |
The Company obtained supplementary information concerning income tax provisions. As a result, income taxes payable decreased by an amount of $28,280,000. The related income tax impact of the adjustments to purchase price allocation on income taxes receivable and deferred tax liabilities was a decrease by an amount of $7,501,000 and $6,972,000, respectively while deferred tax assets and income taxes payable increased by an amount of $142,071,000 and $6,122,000, respectively.
In addition, for presentation purposes, reclassifications were made from income taxes payable to income taxes receivable for an amount of $22,100,000 and from deferred tax assets to deferred tax liabilities for an amount of $15,500,000.
| J. | Restructuring |
The Company refined the assumptions related to restructuring provisions assumed in the acquisition. As a result, expected restructuring costs within current and non-current provisions increased by an amount of $3,061,000 and decreased by an amount of $5,000,000, respectively.
| b) | Integration-related costs |
During the year ended September 30, 2014, the previously announced integration program of $525,000,000 was increased by $26,500,000 to include new opportunities and by $24,000,000 to consider foreign currency impact.
During the year ended September 30, 2014, the Company expensed $127,341,000 ($338,439,000 during the year ended September 30, 2013) of the announced program. This amount included net integration costs for the termination of employees to transform the operations of Logica to the Company’s operating model of $94,273,000 ($249,799,000 during the year ended September 30, 2013) (Note 13), costs related to onerous leases of $1,503,000 ($31,899,000 during the year ended September 30, 2013) (Note 13) and other integration costs of $31,565,000 ($56,741,000 during the year ended September 30, 2013).
During the year ended September 30, 2014, the Company paid in total $157,998,000 ($306,433,000 during the year ended September 30, 2013) related to the integration program and $4,537,000 ($37,937,000 during the year ended September 30, 2013), related to the restructuring program of Logica announced before the acquisition, on December 14, 2011. During the year ended September 30, 2014, the non-cash integration costs of $nil ($7,151,000 during the year ended September 30, 2013) included amortization expense of $nil ($8,672,000 during the year ended September 30, 2013) and curtailment gain of $nil ($1,521,000 during the year ended September 30, 2013).
112
FISCAL 2014 RESULTS
Notes to the Consolidated Financial Statements
For the years ended September 30, 2014 and 2013
(tabular amounts only are in thousands of Canadian dollars, except per share data)
| 27. | Supplementary cash flow information |
a) Net change in non-cash working capital items is as follows for the years ended September 30:
| 2014 | 2013 | |||||||
| $ | $ | |||||||
Accounts receivable | 205,945 | 280,146 | ||||||
Work in progress | 161,270 | (169,035) | ||||||
Prepaid expenses and other assets | 42,555 | 17,499 | ||||||
Long-term financial assets | (4,230) | (2,742) | ||||||
Accounts payable and accrued liabilities | (113,537) | (231,169) | ||||||
Accrued compensation | (151,573) | 164,166 | ||||||
Deferred revenue | (158,026) | (163,941) | ||||||
Provisions | (132,735) | (67,055) | ||||||
Other long-term liabilities | (65,840) | (99,573) | ||||||
Retirement benefits obligations | (17,181) | (7,646) | ||||||
Derivative financial instruments | (650) | 966 | ||||||
Income taxes | 1,335 | (3,172) | ||||||
| (232,667) | (281,556) | |||||||
b) Non-cash operating, investing and financing activities related to operations are as follows for the years ended September 30: | ||||||||
| 2014 | 2013 | |||||||
| $ | $ | |||||||
Operating activities | ||||||||
Accounts receivable | (199) | (412) | ||||||
Prepaid expenses and other assets | (3,792) | (4,180) | ||||||
| (3,991) | (4,592) | |||||||
Investing activities | ||||||||
Purchase of property, plant and equipment | (12,878) | (12,909) | ||||||
Additions of intangible assets | (1,074) | (4,948) | ||||||
Additions of long-term financial assets | (7,788) | (1,852) | ||||||
| (21,740) | (19,709) | |||||||
Financing activities | ||||||||
Increase in obligations under finance leases | 24,458 | 11,745 | ||||||
Increase in obligations other than finance leases | 1,074 | 12,144 | ||||||
Issuance of shares | 199 | 412 | ||||||
| 25,731 | 24,301 | |||||||
c) Interest paid and received and income taxes paid are classified within operating activities and are as follows for the years ended September 30: | ||||||||
| 2014 | 2013 | |||||||
| $ | $ | |||||||
Interest paid | 103,127 | 104,981 | ||||||
Interest received | 903 | 3,550 | ||||||
Income taxes paid | 182,531 | 131,552 | ||||||
113
Consolidated Financial Statements
Notes to the Consolidated Financial Statements
For the years ended September 30, 2014 and 2013
(tabular amounts only are in thousands of Canadian dollars, except per share data)
| 28. | Segmented information |
The following presents information on the Company’s operations based on its current management structure managed through seven operating segments which are based on the geographic delivery model, namely: United States of America (“U.S.”); Nordics, Southern Europe and South America (“NSESA”); Canada; France (including Luxembourg and Morocco); United Kingdom (“U.K.”); Central and Eastern Europe (primarily the Netherlands and Germany) (“CEE”); the Asia Pacific (including Australia, India, Philippines and the Middle east).
| Year ended September 30, 2014 | ||||||||||||||||||||||||||||||||
| U.S. | NSESA | Canada | France | U.K. | CEE | Asia Pacific | Total | |||||||||||||||||||||||||
| $ | $ | $ | $ | $ | $ | $ | $ | |||||||||||||||||||||||||
Segment revenue | 2,664,876 | 2,090,240 | 1,638,320 | 1,333,792 | 1,283,847 | 1,063,533 | 425,084 | 10,499,692 | ||||||||||||||||||||||||
Earnings before integration- related costs, finance costs, finance income and income tax expense1 | 303,515 | 195,400 | 361,136 | 155,695 | 164,977 | 107,977 | 68,159 | 1,356,859 | ||||||||||||||||||||||||
Integration-related costs | (127,341) | |||||||||||||||||||||||||||||||
Finance costs | (101,278) | |||||||||||||||||||||||||||||||
Finance income | 2,010 | |||||||||||||||||||||||||||||||
Earnings before income taxes | 1,130,250 | |||||||||||||||||||||||||||||||
| 1 | Total amortization and depreciation of $443,047,000 included in the U.S., NSESA, Canada, France, U.K., CEE and Asia Pacific operating segments was $114,106,000, $81,793,000, $84,403,000, $34,575,000, $75,853,000, $29,314,000 and $23,003,000, respectively for the year ended September 30, 2014. |
| Year ended September 30, 2013 | ||||||||||||||||||||||||||||||||
| U.S. | NSESA | Canada | France | U.K. | CEE | Asia Pacific | Total | |||||||||||||||||||||||||
| $ | $ | $ | $ | $ | $ | $ | $ | |||||||||||||||||||||||||
Segment revenue | 2,512,530 | 2,010,693 | 1,685,723 | 1,273,604 | 1,158,520 | 1,003,950 | 439,604 | 10,084,624 | ||||||||||||||||||||||||
Earnings before integration- related costs, finance costs, finance income and income tax expense1 | 283,690 | 139,418 | 320,306 | 109,760 | 102,820 | 67,341 | 52,295 | 1,075,630 | ||||||||||||||||||||||||
Integration-related costs | (338,439) | |||||||||||||||||||||||||||||||
Finance costs | (113,931) | |||||||||||||||||||||||||||||||
Finance income | 4,362 | |||||||||||||||||||||||||||||||
Earnings before income taxes | 627,622 | |||||||||||||||||||||||||||||||
| 1 | Total amortization and depreciation of $426,086,000 included in the U.S., NSESA, Canada, France, U.K., CEE and Asia Pacific operating segments was $103,520,000, $78,095,000, $99,899,000, $30,855,000, $52,417,000, $34,899,000 and $26,401,000, respectively for the year ended September 30, 2013. |
The accounting policies of each operating segment are the same as those described in the summary of significant accounting policies (Note 3). Intersegment revenue is priced as if the revenue was from third parties.
114
FISCAL 2014 RESULTS
Notes to the Consolidated Financial Statements
For the years ended September 30, 2014 and 2013
(tabular amounts only are in thousands of Canadian dollars, except per share data)
| 28. | Segmented information (continued) |
GEOGRAPHIC INFORMATION
The following table provides information for PP&E, contract costs and intangible assets based on their location:
| As at September 30, 2014 | As at September 30, 2013 | |||
| $ | $ | |||
U.S. | 296,587 | 288,307 | ||
Canada | 254,240 | 289,248 | ||
U.K. | 240,455 | 210,089 | ||
France | 101,477 | 125,056 | ||
Sweden | 98,496 | 96,608 | ||
Finland | 58,245 | 66,408 | ||
Germany | 56,958 | 55,786 | ||
Netherlands | 44,454 | 50,016 | ||
Rest of the world | 122,582 | 142,262 | ||
| 1,273,494 | 1,323,780 |
The following table provides revenue information based on the client’s location:
| 2014 | 2013 | |||
| $ | $ | |||
U.S. | 2,803,326 | 2,650,540 | ||
Canada | 1,614,511 | 1,670,190 | ||
U.K. | 1,391,943 | 1,271,405 | ||
France | 1,309,568 | 1,257,473 | ||
Sweden | 913,110 | 909,977 | ||
Finland | 665,845 | 571,682 | ||
Netherlands | 527,010 | 507,638 | ||
Germany | 384,765 | 353,967 | ||
Rest of the world | 889,614 | 891,752 | ||
| 10,499,692 | 10,084,624 |
INFORMATION ABOUT SERVICES
The following table provides revenue information based on services provided by the Company:
| 2014 | 2013 | |||
| $ | $ | |||
Outsourcing | ||||
IT Services | 4,342,370 | 4,474,203 | ||
BPS | 1,118,117 | 1,143,069 | ||
Systems integration and consulting | 5,039,205 | 4,467,352 | ||
| 10,499,692 | 10,084,624 |
MAJOR CLIENT INFORMATION
Contracts with the U.S. federal government and its various agencies accounted for $1,404,093,000 (13.4%) of revenues included within the U.S. segment for the year ended September 30, 2014 ($1,392,286,000 (13.8%) for the year ended September 30, 2013).
115
Consolidated Financial Statements
Notes to the Consolidated Financial Statements
For the years ended September 30, 2014 and 2013
(tabular amounts only are in thousands of Canadian dollars, except per share data)
| 29. | Related party transactions |
| a) | Transactions with subsidiaries |
Balances and transactions between the Company and its subsidiaries have been eliminated on consolidation. The Company owns 100% of the equity interests of its principal subsidiaries.
The Company’s principal subsidiaries whose revenues, based on the geographic delivery model, represent more than 3% of the consolidated revenues are as follows:
| Name of subsidiary | Country of incorporation | |
Conseillers en gestion et informatique CGI Inc. | Canada | |
CGI Information Systems and Management Consultants Inc. | Canada | |
CGI Technologies and Solutions Inc. | United States | |
Stanley Associates, Inc. | United States | |
CGI Federal Inc. | United States | |
CGI Information Systems and Management Consultants Private Limited | India | |
CGI France SAS | France | |
CGI Nederland BV | Netherlands | |
CGI (Germany) GmbH & Co KG | Germany | |
CGI Suomi Oy | Finland | |
CGI Sverige AB | Sweden | |
CGI IT UK Limited | United Kingdom |
| b) | Compensation of key management personnel |
Compensation of key management personnel, defined as the Board of Directors and the Executive Vice-President and Chief Financial Officer, was as follows:
| 2014 | 2013 | |||||||
| $ | $ | |||||||
Short-term employee benefits | 4,972 | 8,940 | ||||||
Share-based payments | 15,609 | 13,715 | ||||||
116
FISCAL 2014 RESULTS
Notes to the Consolidated Financial Statements
For the years ended September 30, 2014 and 2013
(tabular amounts only are in thousands of Canadian dollars, except per share data)
| 30. | Commitments, contingencies and guarantees |
| a) | Commitments |
At September 30, 2014, the Company is committed under the terms of operating leases with various expiration dates up to 2023, primarily for the rental of premises and computer equipment used in outsourcing contracts, in the aggregate amount of approximately $1,413,682,000. The future minimum lease payments under non-cancellable operating leases are due as follows:
| $ | ||||
Less than one year | 336,370 | |||
Between one and two years | 273,707 | |||
Between two and five years | 576,091 | |||
Beyond five years | 227,514 | |||
The majority of the lease agreements are renewable at the end of the lease period at market rates. The lease expenditure charged to the earnings, during the year was $306,428,000 ($326,140,000 in 2013), net of sublease income of $26,128,000 ($25,851,000 in 2013). As at September 30, 2014, the total future minimum sublease payments expected to be received under non-cancellable sublease were $100,745,000 ($110,823,000 as at September 30, 2013).
The Company entered into long-term service and other agreements representing a total commitment of $190,083,000. Minimum payments under these agreements are due as follows:
| $ | ||||
Less than one year | 74,291 | |||
Between one and two years | 62,372 | |||
Between two and five years | 53,420 | |||
Beyond five years | — | |||
| b) | Contingencies |
From time to time, the Company is involved in legal proceedings, audits, claims and litigation which primarily relate to tax exposure, contractual disputes and employee claims arising in the ordinary course of its business. Certain of these matters seek damages in significant amounts and will ultimately be resolved when one or more future events occur or fail to occur. Although the outcome of such matters is not predictable with assurance, the Company has no reason to believe that the disposition of any such current matter could reasonably be expected to have a materially adverse impact on the Company’s financial position, results of operations or the ability to carry on any of its business activities. Claims for which there is a probable unfavourable outcome are recorded in provisions (Note 13).
In addition, the Company is engaged to provide services under contracts with the U.S. Government. The contracts are subject to extensive legal and regulatory requirements and, from time to time, agencies of the U.S. Government investigate whether the Company’s operations are being conducted in accordance with these requirements. Generally, the Government has the right to change the scope of, or terminate, these projects at its convenience. The termination or reduction in the scope, of a major government project could have a materially adverse effect on the results of operations and financial condition of the Company.
117
Consolidated Financial Statements
Notes to the Consolidated Financial Statements
For the years ended September 30, 2014 and 2013
(tabular amounts only are in thousands of Canadian dollars, except per share data)
| 30. | Commitments, contingencies and guarantees (continued) |
| c) | Guarantees |
Sale of assets and business divestitures
In connection with the sale of assets and business divestitures, the Company may be required to pay counterparties for costs and losses incurred as the result of breaches in representations and warranties, intellectual property right infringement and litigation against counterparties. While some of the agreements specify a maximum potential exposure of approximately $10,411,000 in total, others do not specify a maximum amount or limited period. It is not possible to reasonably estimate the maximum amount that may have to be paid under such guarantees. The amounts are dependent upon the outcome of future contingent events, the nature and likelihood of which cannot be determined at this time. No amount has been accrued in the consolidated balance sheets relating to this type of indemnification as at September 30, 2014. The Company does not expect to incur any potential payment in connection with these guarantees that could have a materially adverse effect on its consolidated financial statements.
Other transactions
In the normal course of business, the Company may provide certain clients, principally governmental entities, with bid and performance bonds. In general, the Company would only be liable for the amount of the bid bonds if the Company refuses to perform the project once the bid is awarded. The Company would also be liable for the performance bonds in the event of default in the performance of its obligations. As at September 30, 2014, the Company provided for a total of $55,911,000 of these bonds. To the best of its knowledge, the Company is in compliance with its performance obligations under all service contracts for which there is a performance or bid bond, and the ultimate liability, if any, incurred in connection with these guarantees would not have a materially adverse effect on the Company’s consolidated results of operations or financial condition.
Moreover, the Company has letters of credit for a total of $85,959,000 in addition to the letters of credit covered by the unsecured committed revolving credit facility (Note 14). These guarantees are required in some of the Company’s contracts with customers.
118
FISCAL 2014 RESULTS
Notes to the Consolidated Financial Statements
For the years ended September 30, 2014 and 2013
(tabular amounts only are in thousands of Canadian dollars, except per share data)
| 31. | Financial instruments |
FAIR VALUE MEASUREMENTS
Fair value is the price that would be received to sell an asset or paid to transfer a liability in an orderly transaction between market participants at the measurement date.
The following table presents financial liabilities measured at amortized cost categorized using the fair value hierarchy:
| As at September 30, 2014 | As at September 30, 2013 | |||||||||||||||||||
| Level | Carrying amount | Fair value | Carrying amount | Fair value | ||||||||||||||||
| $ | $ | $ | $ | |||||||||||||||||
Financial liabilities for which fair value is disclosed | ||||||||||||||||||||
Other liabilities | ||||||||||||||||||||
Senior U.S. and euro unsecured notes | Level 2 | 1,476,537 | 1,528,724 | 475,787 | 510,667 | |||||||||||||||
Unsecured committed revolving credit facility | Level 2 | — | — | 254,818 | 254,162 | |||||||||||||||
Unsecured committed term loan credit facility | Level 2 | 1,001,752 | 1,005,792 | 1,974,490 | 1,984,773 | |||||||||||||||
Other long-term debt | Level 2 | 22,036 | 20,276 | 14,081 | 12,269 | |||||||||||||||
| 2,500,325 | 2,554,792 | 2,719,176 | 2,761,871 | |||||||||||||||||
The following table presents financial assets and liabilities measured at fair value categorized using the fair value hierarchy:
| ||||||||||||||||||||
| Level | As at September 30, 2014 | As at September 30, 2013 | ||||||||||||||||||
| $ | $ | |||||||||||||||||||
Financial assets | ||||||||||||||||||||
Financial assets at fair value through earnings | ||||||||||||||||||||
Cash and cash equivalents | Level 2 | 535,715 | 106,199 | |||||||||||||||||
Deferred compensation plan assets | Level 1 | 31,151 | 24,752 | |||||||||||||||||
| 566,866 | 130,951 | |||||||||||||||||||
Derivative financial instruments designated as hedging instruments | ||||||||||||||||||||
Current derivative financial instruments | Level 2 | 9,397 | 1,344 | |||||||||||||||||
Long-term derivative financial instruments | Level 2 | 14,834 | 2,518 | |||||||||||||||||
| 24,231 | 3,862 | |||||||||||||||||||
Available for sale | ||||||||||||||||||||
Long-term bonds included in funds held for clients | Level 2 | 198,177 | 187,816 | |||||||||||||||||
Long-term investments | Level 2 | 30,689 | 20,333 | |||||||||||||||||
| 228,866 | 208,149 | |||||||||||||||||||
Financial liabilities | ||||||||||||||||||||
Derivative financial instruments designated as hedging instruments | ||||||||||||||||||||
Current derivative financial instruments | Level 2 | 4,588 | 6,882 | |||||||||||||||||
Long-term derivative financial instruments | Level 2 | 149,074 | 157,110 | |||||||||||||||||
| 153,662 | 163,992 | |||||||||||||||||||
There have been no transfers between Level 1 and Level 2 for the years ended September 30, 2014 and 2013.
119
Consolidated Financial Statements
Notes to the Consolidated Financial Statements
For the years ended September 30, 2014 and 2013
(tabular amounts only are in thousands of Canadian dollars, except per share data)
| 31. | Financial instruments (continued) |
FAIR VALUE MEASUREMENTS (CONTINUED)
The following table summarizes the fair value of outstanding derivative financial instruments:
| As at September | As at September | |||||||||||
| Recorded in derivative financial instruments | 30, 2014 | 30, 2013 | ||||||||||
| $ | $ | |||||||||||
Hedges on net investments in foreign operations | ||||||||||||
$968,800 cross-currency swaps in euro designated as a hedging instrument of the Company’s net investment in European operations ($1,153,700 as at September 30, 2013) | Long-term liabilities | 136,203 | 137,795 | |||||||||
Cash flow hedges on future revenue | ||||||||||||
U.S.$32,000 foreign currency forward contracts to hedge the variability in the expected foreign currency exchange rate between the U.S. dollar and the Canadian dollar (U.S. $56,800 as at September 30, 2013) | Current assets | — | 1,078 | |||||||||
| Long-term assets | — | 300 | ||||||||||
| Current liabilities | 1,651 | — | ||||||||||
| Long-term liabilities | 605 | — | ||||||||||
U.S.$75,216 foreign currency forward contracts to hedge the variability in the expected foreign currency exchange rate between the U.S. dollar and the Indian rupee (U.S.$94,436 as at September 30, 2013) | Current assets | 1,226 | — | |||||||||
| Long-term assets | 1,586 | — | ||||||||||
| Current liabilities | 1,963 | 3,705 | ||||||||||
| Long-term liabilities | 1,153 | 4,079 | ||||||||||
$94,600 foreign currency forward contracts to hedge the variability in the expected foreign currency exchange rate between the Canadian dollar and the Indian rupee ($142,528 as at September 30, 2013) | �� | Current assets | 4,276 | 266 | ||||||||
| Long-term assets | 5,937 | 838 | ||||||||||
| Current liabilities | 475 | 2,605 | ||||||||||
| Long-term liabilities | 45 | 1,549 | ||||||||||
Kr142,600 foreign currency forward contracts to hedge the variability in the expected foreign currency exchange rate between the Swedish krona and the Indian rupee (kr nil as at September 30, 2013) | Current assets | 1 | — | |||||||||
| Current liabilities | 16 | — | ||||||||||
| Long-term liabilities | 32 | — | ||||||||||
€121,100 foreign currency forward contracts to hedge the variability in the expected foreign currency rate between the euro and the British pound (€nil as at September 30, 2013) | Current assets | 3,894 | — | |||||||||
| Long-term assets | 7,311 | — | ||||||||||
€15,000 foreign currency forward contracts to hedge the variability in the expected foreign currency exchange rate between the euro and the Swedish krona (€31,000 as at September 30, 2013) | Current liabilities | 483 | 11 | |||||||||
| Long-term liabilities | 183 | 52 | ||||||||||
€nil foreign currency forward contracts to hedge the variability in the expected foreign currency exchange rate between the euro and the Moroccan dirham (€17,000 as at September 30, 2013) | Long-term assets | — | 26 | |||||||||
| Current liabilities | — | 149 | ||||||||||
| Long-term liabilities | — | 54 | ||||||||||
Cash flow hedges on unsecured committed term loan credit facility | ||||||||||||
$484,400 interest rate swaps floating-to-fixed ($1,234,400 as at September 30, 2013) | Long-term assets | — | 1,354 | |||||||||
| Current liabilities | — | 412 | ||||||||||
| Long-term liabilities | 943 | 537 | ||||||||||
Fair value hedges on Senior U.S. unsecured notes | ||||||||||||
U.S.$250,000 interest rate swaps fixed-to-floating (U.S. $250,000 as at September 30, 2013) | Long-term liabilities | 9,910 | 13,044 | |||||||||
120
FISCAL 2014 RESULTS
Notes to the Consolidated Financial Statements
For the years ended September 30, 2014 and 2013
(tabular amounts only are in thousands of Canadian dollars, except per share data)
| 31. | Financial instruments (continued) |
FAIR VALUE MEASUREMENTS (CONTINUED)
Valuation techniques used to value financial instruments are as follows:
| - | The fair value of Senior U.S. and euro unsecured notes, the unsecured committed revolving credit facility, the unsecured committed term loan credit facility and the other long-term debt is estimated by discounting expected cash flows at rates currently offered to the Company for debts of the same remaining maturities and conditions; |
| - | The fair value of long-term bonds included in funds held for clients and in long-term investments is determined by discounting the future cash flows using observable inputs, such as interest rate yield curves or credit spreads, or according to similar transactions on an arm’s-length basis; |
| - | The fair value of foreign currency forward contracts is determined using forward exchange rates at the end of the reporting period; |
| - | The fair value of cross-currency swaps and interest rate swaps is determined based on market data (primarily yield curves, exchange rates and interest rates) to calculate the present value of all estimated flows. |
As at September 30, 2014, there were no changes in valuation techniques.
The Company expects that approximately $4,928,000 of the accumulated net unrealized gain on derivative financial instruments designated as cash flow hedges as at September 30, 2014 will be reclassified in the consolidated statements of earnings in the next 12 months.
During the year ended September 30, 2014, the Company’s hedging relationships were effective.
MARKET RISK
Market risk incorporates a range of risks. Movements in risk factors, such as interest rate risk and currency risk, affect the fair values of financial assets and liabilities.
Interest rate risk
The Company is exposed to interest rate risk on a portion of its long-term debt (Note 14) and holds interest rate swaps that mitigate this risk on the unsecured committed term loan credit facility. Under the interest rate swaps, the Company receives a variable rate of interest and pays interest at a fixed rate on the notional amount.
The Company also has interest rate swaps whereby the Company receives a fixed rate of interest and pays interest at a variable rate on the notional amount of its Senior U.S. unsecured notes. These swaps are being used to hedge the exposure to changes in the fair value of the debt.
The Company analyzes its interest rate risk exposure on an ongoing basis using various scenarios to simulate refinancing or the renewal of existing positions. Based on these scenarios, a change in the interest rate of 1% would not have had a significant impact on net earnings and comprehensive income.
Currency risk
The Company operates internationally and is exposed to risk from changes in foreign currency exchange rates. The Company mitigates this risk principally through foreign currency denominated debt and use of derivative financial instruments. The Company enters into foreign currency forward contracts to hedge forecasted cash flows or contractual cash flows in currencies other than the functional currency of its subsidiaries. The Company has entered into foreign currency forward contracts to hedge the variability in various foreign currency exchange rates on future U.S. dollar, Canadian dollar, euro and Swedish krona revenues.
The Company hedges a portion of the translation of the Company’s net investments in its U.S. and European operations into Canadian dollar with unsecured committed revolving credit facility, Senior U.S. and euro unsecured notes.
121
Consolidated Financial Statements
Notes to the Consolidated Financial Statements
For the years ended September 30, 2014 and 2013
(tabular amounts only are in thousands of Canadian dollars, except per share data)
| 31. | Financial instruments (continued) |
MARKET RISK (CONTINUED)
The Company also hedges a portion of the translation of the Company’s net investments in its European operations with fixed-to-fixed and floating-to-floating cross-currency swaps. These swaps convert Canadian dollar based fixed and variable interest payments to euro based fixed and variable interest payments associated with the notional amount. During the year ended September 30, 2014, the Company settled a floating-to-floating cross-currency swap for a net amount of $28,924,000. The loss on settlement was recognized in other comprehensive income and will be transferred to earnings when the net investment is disposed of.
During the year ended September 30, 2014, the Company entered into a foreign currency forward contract to hedge the net investment in its U.S. operations. The foreign currency forward contract was subsequently settled for an amount of $8,792,000. The loss on settlement was recognized in other comprehensive income and will be transferred to earnings when the net investment is disposed of.
Hedging relationships are designated and documented at inception and quarterly effectiveness assessments are performed during the year.
In addition, to mitigate foreign exchange risk arising from transactions denominated in currencies other than the Company’s functional currency, assets and liabilities not denominated in the functional currencies are hedged economically. During the year ended September 30, 2013, a fair value gain on the cross-currency swap amounted to $21,325,000 and was offsetting a translation exchange loss on the unsecured committed term loan credit facility of $21,600,000. A fair value loss of $6,992,000 on the foreign currency forward contracts was also offsetting a translation exchange gain. The gains and losses on the economic hedges and the hedged instruments were recorded in foreign exchange gain in the consolidated statements of earnings. As at September 30, 2013, these contracts were terminated, and no such transactions occurred for the year ended September 30, 2014.
The Company is mainly exposed to fluctuations in the Swedish krona, U.S. dollar, the euro and the British pound. The following table details the Company’s sensitivity to a 10% strengthening of the Swedish krona, U.S. dollar, the euro and the British pound foreign currency rates on net earnings and comprehensive income against the Canadian dollar. The sensitivity analysis on net earnings presents the impact of foreign currency denominated financial instruments and adjusts their translation at period end for a 10% strengthening in foreign currency rates. The sensitivity analysis on other comprehensive income presents the impact of a 10% strengthening in foreign currency rates on the fair value of foreign currency forward contracts designated as cash flow hedges and on net investment hedges.
| 2014 | 2013 | |||||||||||||||||||||||||||||||
| Swedish krona impact | U.S. dollar impact | euro impact | British pound impact | Swedish krona impact | U.S. dollar impact | euro impact | British pound impact | |||||||||||||||||||||||||
(Decrease) increase in net earnings | (402) | (1,178) | 7,787 | (73 | ) | 11,548 | 6,682 | 5,921 | 55 | |||||||||||||||||||||||
Decrease in other comprehensive income | (2,171) | (149,474) | (143,468) | — | — | (71,751) | (150,066) | — | ||||||||||||||||||||||||
122
FISCAL 2014 RESULTS
Notes to the Consolidated Financial Statements
For the years ended September 30, 2014 and 2013
(tabular amounts only are in thousands of Canadian dollars, except per share data)
| 31. | Financial instruments (continued) |
LIQUIDITY RISK
Liquidity risk is the risk that the Company is not able to meet its financial obligations as they fall due or can do so only at excessive cost. The Company’s activities are financed through a combination of the cash flows from operations, borrowing under existing credit facilities, the issuance of debt and the issuance of equity. One of management’s primary goals is to maintain an optimal level of liquidity through the active management of the assets and liabilities as well as the cash flows.
The following table summarizes the carrying amount and the contractual maturities of both the interest and principal portion of significant financial liabilities. All amounts contractually denominated in foreign currency are presented in Canadian dollar equivalent amounts using the period-end spot rate.
| As at September 30, 2014 | Carrying amount | Contractual cash flows | Less than one year | Between one and two years | Between two and five years | Beyond five years | ||||||||||||||||||
| $ | $ | $ | $ | $ | $ | |||||||||||||||||||
Non-derivative financial liabilities | ||||||||||||||||||||||||
Accounts payable and accrued liabilities | 1,060,380 | 1,060,380 | 1,060,380 | — | — | — | ||||||||||||||||||
Accrued compensation | 583,979 | 583,879 | 583,879 | — | — | — | ||||||||||||||||||
Senior U.S. & euro unsecured notes | 1,476,537 | 1,912,490 | 58,900 | 58,900 | 571,595 | 1,223,095 | ||||||||||||||||||
Unsecured committed term loan credit facility | 1,001,752 | 1,051,603 | 27,732 | 1,023,871 | — | — | ||||||||||||||||||
Obligations other than finance leases | 117,680 | 124,475 | 42,838 | 36,394 | 45,243 | — | ||||||||||||||||||
Obligations under finance leases | 61,698 | 64,397 | 33,813 | 21,323 | 9,261 | — | ||||||||||||||||||
Other long-term debt | 22,036 | 22,036 | 8,286 | 3,726 | 3,562 | 6,462 | ||||||||||||||||||
Clients’ funds obligations | 292,257 | 292,257 | 292,257 | — | — | — | ||||||||||||||||||
Derivative financial liabilities | ||||||||||||||||||||||||
Cash flow hedges on future revenue | (17,625) | |||||||||||||||||||||||
Outflow | 6,959 | 4,731 | 2,113 | 115 | — | |||||||||||||||||||
(Inflow) | (26,041) | (9,658) | (9,415) | (6,968) | — | |||||||||||||||||||
Cross-currency swaps | 136,203 | |||||||||||||||||||||||
Outflow | 1,140,662 | 21,686 | 1,118,976 | — | — | |||||||||||||||||||
(Inflow) | (1,023,136) | (32,566) | (990,570) | — | — | |||||||||||||||||||
Interest rate swaps | 10,853 | |||||||||||||||||||||||
Outflow | 848,249 | 16,687 | 498,726 | 28,697 | 304,139 | |||||||||||||||||||
(Inflow) | (879,626) | (20,053) | (502,440) | (41,950) | (315,183) | |||||||||||||||||||
| 4,745,750 | 5,178,584 | 2,088,912 | 1,261,604 | 609,555 | 1,218,513 | |||||||||||||||||||
123
Consolidated Financial Statements
Notes to the Consolidated Financial Statements
For the years ended September 30, 2014 and 2013
(tabular amounts only are in thousands of Canadian dollars, except per share data)
| 31. | Financial instruments (continued) |
LIQUIDITY RISK (CONTINUED)
As at September 30, 2013
| Carrying amount
| Contractual cash flows
| Less than one year
| Between one and two years
| Between two and five years
| Beyond five years
| ||||||||||||||||||
| $ | $ | $ | $ | $ | $ | |||||||||||||||||||
Non-derivative financial liabilities | ||||||||||||||||||||||||
Accounts payable and accrued liabilities | 1,119,034 | 1,119,034 | 1,119,034 | — | — | — | ||||||||||||||||||
Accrued compensation | 713,933 | 713,933 | 713,933 | — | — | — | ||||||||||||||||||
Senior U.S. unsecured notes | 475,787 | 643,324 | 22,308 | 22,308 | 149,547 | 449,161 | ||||||||||||||||||
Unsecured committed revolving credit facility | 254,818 | 273,935 | 6,000 | 6,000 | 261,935 | — | ||||||||||||||||||
Unsecured committed term loan credit facility | 1,974,490 | 2,105,910 | 544,955 | 536,547 | 1,024,408 | — | ||||||||||||||||||
Obligations other than finance leases | 79,446 | 84,392 | 21,940 | 24,861 | 37,449 | 142 | ||||||||||||||||||
Obligations under finance leases | 67,928 | 71,200 | 23,870 | 24,459 | 22,470 | 401 | ||||||||||||||||||
Other long-term debt | 14,081 | 14,081 | 5,023 | 1,129 | 2,972 | 4,957 | ||||||||||||||||||
Clients’ funds obligations | 220,279 | 220,279 | 220,279 | — | — | — | ||||||||||||||||||
Derivative financial liabilities | ||||||||||||||||||||||||
Cash flow hedges on future revenue | 9,696 | |||||||||||||||||||||||
Outflow | 13,523 | 6,740 | 4,679 | 2,104 | — | |||||||||||||||||||
(Inflow) | (2,746) | (1,367) | (631) | (748) | — | |||||||||||||||||||
Cross-currency swaps | 137,795 | |||||||||||||||||||||||
Outflow | 1,356,654 | 25,153 | 231,178 | 1,100,323 | — | |||||||||||||||||||
(Inflow) | (1,248,720) | (37,835) | (220,777) | (990,108) | — | |||||||||||||||||||
Interest rate swaps | 12,639 | |||||||||||||||||||||||
Outflow | 1,596,637 | 474,184 | 318,714 | 515,635 | 288,104 | |||||||||||||||||||
(Inflow) | (1,625,755) | (475,879) | (321,066) | (526,778) | (302,032) | |||||||||||||||||||
| 5,079,926 | 5,335,681 | 2,668,338 | 627,401 | 1,599,209 | 440,733 | |||||||||||||||||||
As at September 30, 2014, the Company holds cash and cash equivalents, short-term investments and long-term investments of $566,404,000 ($126,601,000 as at September 30, 2013). The Company also has available $1,463,280,000 in unsecured committed revolving credit facility ($1,210,630,000 as at September 30, 2013). The funds held for clients of $295,754,000 ($222,469,000 as at September 30, 2013) fully cover the clients’ funds obligations. As at September 30, 2014, accounts receivable amount to $1,036,068,000 ($1,205,625,000 as at September 30, 2013). Given the Company’s available liquid resources as compared to the timing of the payments of liabilities, management assesses the Company’s liquidity risk to be low.
124
FISCAL 2014 RESULTS
Notes to the Consolidated Financial Statements
For the years ended September 30, 2014 and 2013
(tabular amounts only are in thousands of Canadian dollars, except per share data)
| 31. | Financial instruments (continued) |
CREDIT RISK
The Company takes on exposure to credit risk, which is the risk that a counterparty will be unable to pay amounts in full when due. Financial instruments that potentially subject the Company to concentrations of credit risk consist of cash and cash equivalents, short-term investments, accounts receivable and long-term investments. The maximum exposure of credit risk is generally represented by the carrying amount of these items reported on the consolidated balance sheets.
Cash equivalents consist mainly of highly liquid investments, such as money market funds and term deposits, as well as bankers’ acceptances and bearer deposit notes issued by major banks (Note 4). The Company has deposited its cash and cash equivalents with reputable financial institutions, from which management believes the risk of loss to be remote.
The Company is exposed to credit risk in connection with short-term investments, long-term investments through the possible inability of borrowers to meet the terms of their obligations. The Company mitigates this risk by investing primarily in high credit quality corporate and government bonds with a credit rating of A or higher.
The Company has accounts receivable derived from clients engaged in various industries including governmental agencies, finance, telecommunications, manufacturing and utilities that are not concentrated in any specific geographic area. These specific industries may be affected by economic factors that may impact accounts receivable. However, management does not believe that the Company is subject to any significant credit risk in view of the Company’s large and diversified client base. Overall, management does not believe that any single industry or geographic region represents a significant credit risk to the Company. The following table sets forth details of the age of accounts receivable that are past due:
| 2014 | 2013 | |||||||
| $ | $ | |||||||
Not past due | 716,435 | 814,054 | ||||||
Past due 1-30 days | 86,796 | 109,942 | ||||||
Past due 31-60 days | 29,133 | 43,909 | ||||||
Past due 61-90 days | 15,012 | 32,309 | ||||||
Past due more than 90 days | 30,982 | 21,022 | ||||||
| 878,358 | 1,021,236 | |||||||
Allowance for doubtful accounts | (4,892) | (2,246) | ||||||
| 873,466 | 1,018,990 | |||||||
The carrying amount of accounts receivable is reduced by an allowance account and the amount of the loss is recognized in the consolidated statements of earnings within costs of services, selling and administrative. When a receivable balance is considered uncollectible, it is written off against the allowance for doubtful accounts. Subsequent recoveries of amounts previously written off are credited against costs of services, selling and administrative in the consolidated statements of earnings.
125
Consolidated Financial Statements
Notes to the Consolidated Financial Statements
For the years ended September 30, 2014 and 2013
(tabular amounts only are in thousands of Canadian dollars, except per share data)
| 32. | Capital risk management |
The Company is exposed to risks of varying degrees of significance which could affect its ability to achieve its strategic objectives for growth. The main objectives of the Company’s risk management process are to ensure that risks are properly identified and that the capital base is adequate in relation to these risks.
The Company manages its capital to ensure that there are adequate capital resources while maximizing the return to shareholders through the optimization of the debt and equity balance. As at September 30, 2014, total managed capital was $8,234,832 ($7,048,848 as at September 30, 2013). Managed capital consists of long-term debt, including the current portion (Note 14), cash and cash equivalents (Note 4), short-term investments, long-term investments (Note 11) and shareholders’ equity. The basis for the Company’s capital structure is dependent on the Company’s expected business growth and changes in the business environment. When capital needs have been specified, the Company’s management proposes capital transactions for the approval of the Company’s Audit and Risk Management Committee and Board of Directors. The capital risk policy remains unchanged from prior periods.
The Company monitors its capital by reviewing various financial metrics, including the following:
| - | Debt/Capitalization |
| - | Net Debt/Capitalization |
| - | Debt/EBITDA |
Debt represents long-term debt, including the current portion. Net debt, capitalization and EBITDA are additional measures. Net debt represents debt (including the impact of the fair value of derivative financial instruments) less cash and cash equivalents, short-term investments and long-term investments. Capitalization is shareholders’ equity plus debt. EBITDA is calculated as earnings from continuing operations before income taxes, interest expense on long-term debt, depreciation, amortization and integration-related costs. The Company believes that the results of the current internal ratios are consistent with its capital management objectives.
The Company is subject to external covenants on its Senior U.S. and euro unsecured notes and unsecured committed term loan credit facility. The ratios are as follows:
| - | A leverage ratio, which is the ratio of total debt to EBITDA for the four most recent quarters1. |
| - | An interest and rent coverage ratio, which is the ratio of the EBITDAR for the four most recent quarters to the total interest expense and the operating rentals in the same periods. EBITDAR, a non-GAAP measure, is calculated as EBITDA before rent expense1. |
| - | In the case of the Senior U.S. and euro unsecured notes, a minimum net worth is required, whereby shareholders’ equity, excluding foreign exchange translation adjustments included in accumulated other comprehensive income, cannot be less than a specified threshold. |
These ratios are calculated on a consolidated basis.
The Company is in compliance with these covenants and monitors them on an ongoing basis. The ratios are also reviewed quarterly by the Company’s Audit and Risk Management Committee. The Company is not subject to any other externally imposed capital requirements.
| 1 | In the event of an acquisition, the available historical financial information of the acquired Company will be used in the computation of the ratios. |
126
FISCAL 2014 RESULTS
Shareholder information
Shareholder information listing
IPO: 1986
Toronto Stock Exchange, April 1992: GIB.A
New York Stock Exchange, October 1998: GIB
Number of shares outstanding as of September 30, 2014:
279,311,564 Class A subordinate shares
33,272,767 Class B shares
High/low of share price from October 1, 2013
to September 30, 2014:
| TSX (CDN$) | NYSE (U.S.$) | |||||||
|
|
| ||||||
High: | 41.47 | 39.47 | ||||||
Low: | 32.71 | 29.40 | ||||||
|
|
| ||||||
The certifications by CGI’s Chief Executive Officer and Chief Financial Officer concerning the quality of the Company’s public disclosure in accordance with the requirements of National Instrument 52-109 are filed with securities regulators in Canada on SEDAR (sedar.com); similar certifications pursuant to Rule 13a-14 of the U.S.Exchange Act of 1934 and Section 302 of theSarbanes-Oxley Act of 2002 are included as exhibits to our Form 40-F filed with the USSecurities and Exchange Commission on EDGAR (sec.gov); and the certification required by Section 303A.12 of theNYSE Listed Company Manual is filed annually with theNew York Stock Exchange. CGI’s corporate governance practices do not differ in any significant way from those required of domestic companies under New York Stock Exchange listing standards and are set out in the in the report of the Corporate Governance Committee contained in theManagement Proxy Circular, which is filed with Canadian and U.S. securities authorities and is available on SEDAR and EDGAR, respectively, as well as on CGI’s website (cgi.com).
Auditors
Ernst & Young LLP
Transfer agent
Computershare Trust Company of Canada
100 University Avenue, 9th Floor
Toronto, Ontario M5J 2Y1
Telephone: 1 800 564-6253
www.investorcentre.com/service
Investor relations
For further information about the Company, additional copies of this report or other financial information, please contact:
CGI Group Inc.
Investor Relations
Email: ir@cgi.com
Twitter: CGI_IR
Web: cgi.com/investors
1350 René-Lévesque Blvd West
Montréal, Québec H3G 1T4
Canada
Tel.: 514-841-3200
Annual general meeting of shareholders
Wednesday, January 28, 2015 at 11:00 a.m.
Le Ritz-Carlton Montréal
Oval Room
1228 Sherbrooke Street West
Montréal, Québec H3G 1H6
Canada
A live webcast of the Annual General Meeting will be available via cgi.com/investors. Complete instructions for viewing the webcast will be available on CGI’s website. To vote by phone or by using the Internet, please refer to the instructions provided in the CGI Management Proxy Circular.
The online version of CGI’s annual report is available at cgi.com/investors.
Le rapport annuel 2014 de CGI est aussi publié en français et disponible sur cgi.com/investisseurs.
127
Consolidated Financial Statements)
[This page intentionally left blank]
128

Founded in 1976, CGI is a global IT and business process services provider delivering high-quality business consulting, systems integration and managed services. With 68,000 professionals in 40 countries, CGI has an industry-leading track record of delivering 95% of projects on time and within budget, aligning our teams with clients’ business strategies to achieve top-to-bottom line results.
cgi.com
© 2014 CGI Group Inc.