Exhibit 99.1

Exhibit 99.1
CGI Experience the commitment®
FISCAL 2019 RESULTS
CONTENTS
1 Management’s Discussion and Analysis
65 Management’s and Auditors’ Reports
70 Consolidated Financial Statements
135 Shareholder Information
| FISCAL 2019 RESULTS |  |
Management’s Discussion and Analysis
November 6, 2019
Basis of Presentation
This Management’s Discussion and Analysis of the Financial Position and Results of Operations (MD&A) is the responsibility of management and has been reviewed and approved by the Board of Directors. This MD&A has been prepared in accordance with the requirements of the Canadian Securities Administrators. The Board of Directors is ultimately responsible for reviewing and approving the MD&A. The Board of Directors carries out this responsibility mainly through its Audit and Risk Management Committee, which is appointed by the Board of Directors and is comprised entirely of independent and financially literate directors.
Throughout this document, CGI Inc. is referred to as “CGI”, “we”, “our” or “Company”. This MD&A provides information management believes is relevant to an assessment and understanding of the consolidated results of operations and financial condition of the Company. This document should be read in conjunction with the audited consolidated financial statements and the notes thereto for the years ended September 30, 2019 and 2018. CGI’s accounting policies are in accordance with International Financial Reporting Standards (IFRS) as issued by the International Accounting Standards Board (IASB). All dollar amounts are in Canadian dollars unless otherwise noted.
Materiality of Disclosures
This MD&A includes information we believe is material to investors. We consider something to be material if it results in, or would reasonably be expected to result in, a significant change in the market price or value of our shares, or if it is likely that a reasonable investor would consider the information to be important in making an investment decision.
Forward-Looking Statements
This MD&A contains “forward-looking information” within the meaning of Canadian securities laws and “forward-looking statements” within the meaning of the United States Private Securities Litigation Reform Act of 1995 and other applicable United States safe harbours. All such forward-looking information and statements are made and disclosed in reliance upon the safe harbour provisions of applicable Canadian and United States securities laws. Forward-looking information and statements include all information and statements regarding CGI’s intentions, plans, expectations, beliefs, objectives, future performance, and strategy, as well as any other information or statements that relate to future events or circumstances and which do not directly and exclusively relate to historical facts. Forward-looking information and statements often but not always use words such as “believe”, “estimate”, “expect”, “intend”, “anticipate”, “foresee”, “plan”, “predict”, “project”, “aim”, “seek”, “strive”, “potential”, “continue”, “target”, “may”, “might”, “could”, “should”, and similar expressions and variations thereof. These information and statements are based on our perception of historic trends, current conditions and expected future developments, as well as other assumptions, both general and specific, that we believe are appropriate in the circumstances. Such information and statements are, however, by their very nature, subject to inherent risks and uncertainties, of which many are beyond the control of the Company, and which give rise to the possibility that actual results could differ materially from our expectations expressed in, or implied by, such forward-looking information or forward-looking statements. These risks and uncertainties include but are not restricted to: risks related to the market such as the level of business activity of our clients, which is affected by economic and political conditions, and our ability to negotiate new contracts; risks related to our industry such as competition and our ability to attract and retain qualified employees, to develop and expand our services, to penetrate new markets, and to protect our intellectual property rights; risks related to our business such as risks associated with our growth strategy, including the integration of new operations, financial and operational risks inherent in worldwide operations, foreign exchange risks, income tax laws, our ability to negotiate favourable contractual terms, to deliver our services and to collect receivables, and the reputational and financial risks attendant to cybersecurity breaches and other incidents; as well as other risks identified or incorporated by reference in this MD&A and in other documents that we make public, including our filings with the Canadian Securities Administrators (on SEDAR atwww.sedar.com) and the U.S. Securities and Exchange
1
|
MANAGEMENT’S DISCUSSION AND ANALYSIS
Commission (on EDGAR atwww.sec.gov). Unless otherwise stated, the forward-looking information and statements contained in this MD&A are made as of the date hereof and CGI disclaims any intention or obligation to publicly update or revise any forward-looking information or forward-looking statements, whether as a result of new information, future events or otherwise, except as required by applicable law. While we believe that our assumptions on which these forward-looking information and forward-looking statements are based were reasonable as at the date of this MD&A, readers are cautioned not to place undue reliance on these forward-looking information or statements. Furthermore, readers are reminded that forward-looking information and statements are presented for the sole purpose of assisting investors and others in understanding our objectives, strategic priorities and business outlook as well as our anticipated operating environment. Readers are cautioned that such information may not be appropriate for other purposes. Further information on the risks that could cause our actual results to differ significantly from our current expectations may be found in section 8 - Risk Environment, which is incorporated by reference in this cautionary statement. We also caution readers that the risks described in the previously mentioned section and in other sections of this MD&A are not the only ones that could affect us. Additional risks and uncertainties not currently known to us or that we currently deem to be immaterial could also have a material adverse effect on our financial position, financial performance, cash flows, business or reputation.
2
|
| FISCAL 2019 RESULTS | |
Non-GAAP and Key Performance Measures
The reader should note that the Company reports its financial results in accordance with IFRS. However, we use a combination of financial measures, ratios, andnon-GAAP measures to assess the Company’s performance. Thenon-GAAP measures used in this MD&A do not have any standardized meaning prescribed by IFRS and are therefore unlikely to be comparable to similar measures presented by other issuers. These measures should be considered as supplemental in nature and not as a substitute for the related financial information prepared in accordance with IFRS.
The table below summarizes ournon-GAAP measures and most relevant key performance measures:
| Profitability | • Adjusted EBIT(non-GAAP) – is a measure of earnings excluding acquisition-related and integration costs, restructuring costs, net finance costs and income tax expense. Management believes this measure is useful to investors as it best reflects the performance of its activities and allows for better comparability from period to period as well as to trend analysis. A reconciliation of the adjusted EBIT to its closest IFRS measure can be found in section 3.7 of the present document. | |
• Adjusted EBIT margin(non-GAAP) is obtained by dividing our adjusted EBIT by our revenues. Management believes this measure is useful to investors as it best reflects the performance of its activities and allows for better comparability from period to period as well as to trend analysis. A reconciliation of the adjusted EBIT to its closest IFRS measure can be found in section 3.7 of the present document. | ||
• Net earnings – is a measure of earnings generated for shareholders. | ||
• Diluted earnings per share (diluted EPS) – is a measure of earnings generated for shareholders on a per share basis, assuming all dilutive elements are exercised. | ||
• Net earnings excluding specific items(non-GAAP) – is a measure of net earnings excluding acquisition-related and integration costs, restructuring costs and tax adjustments. Management believes this measure is useful to investors as it best reflects the Company’s performance and allows for better comparability from period to period. A reconciliation of the net earnings excluding specific items to its closest IFRS measure can be found in section 3.8.3. of the present document. | ||
• Net earnings margin excluding specific items(non-GAAP) is obtained by dividing our net earnings excluding specific items by our revenues. Management believes this measure is useful to investors as it best reflects the Company’s performance and allows for better comparability from period to period. A reconciliation of the net earnings excluding specific items to its closest IFRS measure can be found in section 3.8.3. of the present document. | ||
• Diluted earnings per share excluding specific items(non-GAAP) – is defined as the net earnings excluding specific items on a per share basis. Management believes that this measure is useful to investors as it best reflects the Company’s performance on a per share basis and allows for better comparability from period to period. The diluted earnings per share reported in accordance with IFRS can be found in section 3.8 of the present document while the basic and diluted earnings per share excluding specific items can be found in section 3.8.3 of the present document.
| ||
| Liquidity | • Cash provided by operating activities – is a measure of cash generated from managing ourday-to-day business operations. Management believes strong operating cash flow is indicative of financial flexibility, allowing us to execute the Company’s strategy. | |
• Days sales outstanding (DSO)(non-GAAP) – is the average number of days needed to convert our trade receivables and work in progress into cash. DSO is obtained by subtracting deferred revenue from trade accounts receivable and work in progress; the result is divided by our most recent quarter’s revenue over 90 days. Management tracks this metric closely to ensure timely collection and healthy liquidity. Management believes this measure is useful to investors as it demonstrates the Company’s ability to timely convert its trade receivables and work in progress into cash.
| ||
3
|
MANAGEMENT’S DISCUSSION AND ANALYSIS
Growth | • Constant currency growth(non-GAAP) – is a measure of revenue growth before foreign currency translation impacts. This growth is calculated by translating current period results in local currency using the conversion rates in the equivalent period from the prior year. Management believes that it is helpful to adjust revenue to exclude the impact of currency fluctuations to facilitateperiod-to-period comparisons of business performance and that this measure is useful to investors for the same reason. | |
• Backlog(non-GAAP) – includes new contract wins, extensions and renewals (bookings(non-GAAP)), adjusted for the backlog consumed during the period as a result of client work performed and adjustments related to the volume, cancellation and the impact of foreign currencies to our existing contracts. Backlog incorporates estimates from management that are subject to change. Management tracks this measure as it is a key indicator of management’s best estimate of contracted revenue to be realized in the future and believes that this measure is useful to investors for the same reason. | ||
• Book-to-bill ratio(non-GAAP) – is a measure of the proportion of the value of our bookings to our revenue in the period. This metric allows management to monitor the Company’s business development efforts to ensure we grow our backlog and our business over time and management believes that this measure is useful to investors for the same reason. Management remains committed to maintaining a target ratio greater than 100% over a trailing twelve-month period. Management believes that monitoring the Company’s bookings over a longer period is a more representative measure as the services and contract type, size and timing of bookings could cause this measurement to fluctuate significantly if taken for only a three-month period.
| ||
Capital Structure | • Net debt(non-GAAP) – is obtained by subtracting from our debt our cash and cash equivalents, short-term investments, long-term investments and fair value of foreign currency derivative financial instruments related to debt. Management uses the net debt metric to monitor the Company’s financial leverage and believes that this metric is useful to investors as it provides insight into its financial strength. A reconciliation of net debt to its closest IFRS measure can be found in section 4.5 of the present document. | |
• Net debt to capitalization ratio(non-GAAP) – is a measure of our level of financial leverage and is obtained by dividing the net debt by the sum of shareholder’s equity and debt. Management uses the net debt to capitalization ratio to monitor the proportion of debt versus capital used to finance the Company’s operations and to assess its financial strength. Management believes that this metric is useful to investors for the same reasons. | ||
• Return on equity (ROE)(non-GAAP) – is a measure of the rate of return on the ownership interest of our shareholders and is calculated as the proportion of net earnings for the last 12 months over the last four quarters’ average equity. Management looks at ROE to measure its efficiency at generating net earnings for the Company’s shareholders and how well the Company uses the invested funds to generate net earnings growth and believes that this measure is useful to investors for the same reasons. | ||
• Return on invested capital (ROIC)(non-GAAP) – is a measure of the Company’s efficiency at allocating the capital under its control to profitable investments and is calculated as the proportion of the net earnings excluding net finance costsafter-tax for the last 12 months, over the last four quarters’ average invested capital, which is defined as the sum of equity and net debt. Management examines this ratio to assess how well it is using its funds to generate returns and believes that this measure is useful to investors for the same reason.
| ||
Reporting Segments
During the first quarter of Fiscal 2019, the Company realigned its management structure, resulting primarily in the transfer of our Belgium and Southern Europe operations from the Central and Eastern Europe to the Western and Southern Europe
4
|
| FISCAL 2019 RESULTS | |
operating segment as well as other internal organizational changes. During the three months ended June 30, 2019, the Company further realigned its management structure with the transfer of our Australia operations from the Asia Pacific segment to the U.K. operating segment. The Company has retrospectively revised the segmented information for the comparative periods. Please refer to sections 3.4, 3.6, 5.4 and 5.5 of the present document and to note 27 of our audited consolidated financial statements for additional information on our segments.
For Fiscal 2019, the Company’s results were presented through eight operating segments, namely: Western and Southern Europe (primarily France, Portugal and Belgium); Northern Europe (including Nordics, Baltics and Poland); Canada; United States of America (U.S.) Commercial and State Government; U.S. Federal; United Kingdom (U.K.) and Australia; Central and Eastern Europe (primarily Netherlands and Germany); and Asia Pacific Global Delivery Centers of Excellence (India and Philippines) (Asia Pacific).
5
|
MANAGEMENT’S DISCUSSION AND ANALYSIS
MD&A Objectives and Contents
In this document, we:
| • | Provide a narrative explanation of the audited consolidated financial statements through the eyes of management; |
| • | Provide the context within which the audited consolidated financial statements should be analyzed, by giving enhanced disclosure about the dynamics and trends of the Company’s business; and |
| • | Provide information to assist the reader in ascertaining the likelihood that past performance may be indicative of future performance. |
In order to achieve these objectives, this MD&A is presented in the following main sections:
Section
| Contents
| Pages
| ||||||
1. | Corporate | 1.1. | About CGI | 8 | ||||
| Overview | 1.2. | Vision and Strategy | 9 | |||||
| 1.3.
| Competitive Environment
| 10
| ||||||
2. | Highlights and Key | 2.1. | Fiscal 2019 Year-Over-Year Highlights | 11 | ||||
| Performance | 2.2. | Selected Yearly Information & Key Performance Measures | 12 | |||||
| 2.3. | Stock Performance | 13 | ||||||
| 2.4.
| Investments in Subsidiaries
| 14
| ||||||
3. | Financial Review | 3.1. | Bookings andBook-to-Bill Ratio | 15 | ||||
| 3.2. | Foreign Exchange | 16 | ||||||
| 3.3. | Revenue Distribution | 17 | ||||||
| 3.4. | Revenue by Segment | 18 | ||||||
| 3.5. | Operating Expenses | 20 | ||||||
| 3.6. | Adjusted EBIT by Segment | 21 | ||||||
| 3.7. | Earnings Before Income Taxes | 23 | ||||||
| 3.8.
| Net Earnings and Earnings Per Share
| 24
| ||||||
4. | Liquidity | 4.1. | Consolidated Statements of Cash Flows | 26 | ||||
| 4.2. | Capital Resources | 29 | ||||||
| 4.3. | Contractual Obligations | 30 | ||||||
| 4.4. | Financial Instruments and Hedging Transactions | 30 | ||||||
| 4.5. | Selected Measures of Capital Resources and Liquidity | 31 | ||||||
| 4.6. | Off-Balance Sheet Financing and Guarantees | 31 | ||||||
| 4.7.
| Capability to Deliver Results
| 32
| ||||||
5. | Fourth Quarter | 5.1. | Bookings andBook-to-Bill Ratio | 33 | ||||
| Results | 5.2. | Foreign Exchange | 34 | |||||
| 5.3. | Revenue Distribution | 35 | ||||||
| 5.4. | Revenue by Segment | 36 | ||||||
| 5.5. | Adjusted EBIT by Segment | 39 | ||||||
| 5.6. | Net Earnings and Earnings Per Share | 41 | ||||||
| 5.7.
| Consolidated Statements of Cash Flows
| 43
| ||||||
6
|
| FISCAL 2019 RESULTS | |
6. | Eight Quarter Summary | A summary of the past eight quarters’ key performance measures and a discussion of the factors that could impact our quarterly results.
| 45
| |||||||
7. | Changes in Accounting Policies
| A summary of the accounting standard changes. | 47
| |||||||
8. | Critical Accounting Estimates
| A discussion of the critical accounting estimates made in the preparation of the audited consolidated financial statements.
| 50
| |||||||
9. | Integrity of Disclosure | A discussion of the existence of appropriate information systems, procedures and controls to ensure that information used internally and disclosed externally is complete and reliable.
| 53
| |||||||
10. | Risk Environment | 10.1. | Risks and Uncertainties | 55 | ||||||
10.2. | Legal Proceedings
| 64
| ||||||||
7
|
MANAGEMENT’S DISCUSSION AND ANALYSIS
| 1. | Corporate Overview |
1.1. ABOUT CGI
Founded in 1976 and headquartered in Montréal, Canada, CGI is among the largest information technology (IT) and business consulting services firms in the world. CGI delivers anend-to-end portfolio of capabilities, including strategic IT and business consulting, systems integration, intellectual property and managed IT and business process services. The Company employs approximately 77,500 consultants and professionals worldwide, whom are called members as they are also owners.
End-to-end services and solutions
CGI deliversend-to-end services that cover the full spectrum of technology delivery; from digital strategy and architecture to solution design, development, integration, implementation, and operations. Our portfolio encompasses:
| • | High-end IT services and business consulting and systems integration:CGI helps clients define their digital strategy and roadmap, adopting an agile, iterative approach that facilitates innovation, connection and optimization of mission-critical systems to deliver enterprise-wide change. |
| • | Managed IT and business process services:Our clients entrust us with full or partial responsibility for their IT and business functions to improve how they operate and transform their business. In return, we deliver innovation, significant efficiency gains, and cost savings. Typical services in anend-to-end engagement include: application development, integration and maintenance; technology infrastructure management; and business process services, such as in collections and payroll management. Managed IT and business process services contracts are long-term in nature, with a typical duration greater than five years, allowing our clients to reinvest savings, alongside CGI, in their digital transformations. |
| • | Intellectual property (IP):Our IP portfolio includes more than 175 business solutions, some of which are cross-industry solutions. Most IP has beenco-innovated with clients and act as business accelerators for the industries we serve. These include business solutions encompassing commercial software embedded with ourend-to-end-services, and digital enablers such as methodologies and frameworks to drive change across business and IT processes. |
Deep industry expertise
CGI has long standing and focused practices in all of its core industries, providing clients with a partner that is not only an expert in IT, but also expert in their industries. This combination of business knowledge and digital technology expertise allows us to help our clients adapt with shifts in market dynamics and changing consumer and citizen expectations. In the process, we evolve the services and solutions we deliver within our targeted industries.
Our targeted industries include: communications, financial services, government, health & life sciences, manufacturing, oil & gas, retail & consumer services, transportation, post & logistics and utilities. While these represent ourgo-to-market industry targets, we group these industries into the following for reporting purposes: government; manufacturing, retail & distribution (MRD); financial services; communications & utilities; and health.
As the move toward digitalization continues across industries, CGI partners with clients to help guide them in becoming customer andcitizen-centric digital organizations.
Applied innovation
At CGI, innovation happens across many interconnected fronts. It starts in our everyday work on client projects, where thousands of innovations are applied daily. Through benchmarkin-person interviews we conduct each year, business and technology executives share their priorities with us, informing our own innovation investments and driving our client proximity teams’ focus on local client priorities. We also turn ideas into new business solutions through our Innovate, Collaborate and Evolve (ICE) program which incubates proximity team innovations into scalable, replicable solutions for global application.
8
|
| FISCAL 2019 RESULTS | |
Since 1976, CGI is a trusted partner in delivering innovative, client-inspired business services and solutions. We help develop, innovate and protect the technology that enables clients to achieve their digital transformation goals faster, with reduced risk and enduring results. Through ourday-to-day project engagements as well as global programs and investments, CGI partners with clients to generate practical innovations that are replicable and scalable, followed by the delivery of measurable results.
Quality processes
CGI’s clients expect consistency of service wherever and whenever they engage us. We have an outstanding track record ofon-time, within-budget delivery as a result of our commitment to excellence and our robust governance model - the CGI Management Foundation. The CGI Management Foundation provides a common business language, frameworks and practices for managing all operations consistently across the globe, driving a focus on continuous improvement. We also invest in rigorous quality and service delivery standards (including ISO and Capability Maturity Model Integration (CMMI) certification programs), as well as a comprehensive Client Satisfaction Assessment Program, with signed client assessments, to ensure high satisfaction on an ongoing basis.
1.2. VISION AND STRATEGY
CGI is unique compared to most companies. As our vision is based on a dream: “To create an environment in which we enjoy working together and, as owners, contribute to building a company we can be proud of.” This dream has motivated us since our founding in 1976 and drives our vision: “To be a global, world-classend-to-end IT and business consulting services leader helping our clients succeed.”
In pursuing our dream and vision, CGI has been highly disciplined throughout its history in executing a Build and Buy profitable growth strategy comprised of four pillars that combine profitable organic growth (Build) and accretive acquisitions (Buy):
Pillar 1:Win, renew and extend contracts
Pillar 2:New large managed IT and business process services contracts
These first two pillars relate to driving profitable organic growth through the pursuit of contracts with new and existing clients in our targeted industries. Successes in these pillars reflect the strength of ourend-to-end portfolio of capabilities, the depth of expertise of our consultants in business and IT and the appreciation of the proximity model by our clients, both existing and potential.
Pillar 3:Metro market acquisitions
The third pillar focuses on growth through metro market acquisitions, complementing the proximity model, helping provide a fuller range ofend-to-end services. We identify metro market acquisitions through a strategic qualification process that systematically searches for targets to strengthen our proximity model, leveraging strong local relationships with customers, and enhancing our industry expertise, services and solutions.
Pillar 4:Large, transformational acquisitions
We also pursue large acquisitions to further expand our geographic presence and critical mass, which enables us to compete for large managed IT and business process services contracts and broaden our client relationships. CGI will continue to be a consolidator in the IT services industry by being active on both of these last pillars.
Executing our strategy
CGI’s strategy is executed through a unique business model that combines client proximity with an extensive global delivery network to deliver the following benefits:
• Local relationships and accountability: We live and work near our clients to provide a high level of responsiveness, partnership, and innovation. Our local CGI members speak our clients’ language, understand their business environment, and collaborate to meet their goals and advance their business.
9
|
MANAGEMENT’S DISCUSSION AND ANALYSIS
• Global reach: Our local presence is complemented by an expansive global delivery network that ensures our clients have 24/7 access tobest-fit digital capabilities and resources to meet theirend-to-end needs. In addition, clients benefit from our unique combination of industry domain and technology expertise within our global delivery model.
• Committed experts: One of our key strategic goals is to be our clients’ partner and expert of choice. To achieve this, we invest in developing and recruiting professionals with extensive industry, business andin-demand technology expertise. In addition, CGI consultants and professionals are also owners through our Share Purchase Plan, which, combined with the Profit Participation Plan, provide an added level of commitment to the success of our clients.
• Comprehensive quality processes: CGI’s investment in quality frameworks and rigorous client satisfaction assessments has resulted in a consistent track record ofon-time and within-budget project delivery. With regular reviews of engagements and transparency at all levels, the company ensures that client objectives and its own targets are consistently followed at all times. This thorough process enables CGI to generate continuous improvements for all stakeholders by applying corrective measures as soon as they are required.
• Corporate responsibility:Social Responsibility is one of CGI’s core values. Our business model is designed to ensure that we are close to our clients and communities. At CGI, our members embrace our responsibilities to contribute to the continuous improvement of the economic, social and environmental well-being of the communities in which we live and work.
1.3. COMPETITIVE ENVIRONMENT
In today’s digital era, there is a competitive urgency for organizations across industries to become digital in a sustainable way. The pressure is on to modernize legacy assets and connect them to digital business and operating models. Central to this massive transformation is the evolving role of technology. Traditionally viewed as an enabler, technology is now recognized as a driver of business transformation. The promise of digital creates an enormous opportunity to transform organizationsend-to-end, and CGI is well-positioned to serve as a digital partner and expert of choice. We’re working with clients across the globe to implement digital strategies, roadmaps and solutions that revolutionize the customer/citizen experience, drive the launch of new products and services, and deliver efficiencies and cost savings.
As the demand for digitalization increases, competition within the global IT industry is intensifying. CGI’s competition comprises a variety of players; from metro market companies providing specialized services and software, to global,end-to-end IT service providers, to large consulting firms and government pure-play. All of these players are competing to deliver some or all of the services we provide.
Many factors distinguish the industry leaders, including the following:
• Depth and breadth of industry and technology expertise;
• Local presence and strength of client relationships;
• Consistent,on-time, within-budget delivery everywhere the client operates;
• Breadth of digital IP solutions;
• Ability to deliver practical innovation for measurable results;
• Total cost of services and value delivered;
• Unique global delivery network, including onshore, nearshore and offshore options.
CGI is one of the leaders in the industry with respect to all of these factors. We’re not only delivering all of the capabilities clients need to compete in a digital world, but the immediate results and long-term value they expect. As the market dynamics and industry trends continue to increase demand for enterprise solutions from global,end-to-end IT and business consulting services firms, CGI is one of few firms with the scale, reach, and capabilities to meet clients’ enterprise needs.
10
|
| FISCAL 2019 RESULTS | |
| 2. | Highlights and Key Performance Measures |
2.1. FISCAL 2019 HIGHLIGHTS
| • | Revenue of $12.1 billion, up 5.3% or 5.9% in constant currency; |
| • | Adjusted EBIT of $1,825.0 million, up 7.2%; |
| • | Adjusted EBIT margin of 15.1%, up 30 bps; |
| • | Net earnings of $1,263.2 million, up 10.7%; |
| • | Diluted EPS of $4.55, up 15.2%; |
| • | Net earnings, excluding specific items1, of $1,305.9 million, up 7.9%; |
| • | Diluted EPS, excluding specific items1, of $4.70, up 12.2%; |
| • | Cash provided by operating activities of $1,633.9 million, up 9.4%; |
| • | Bookings of $12.6 billion, or 104.4% of revenue; and, |
| • | Backlog of $22.6 billion, representing 1.9 times Fiscal 2019 revenue. |
| 1 | Specific items are comprised of acquisition-related, integration costs and restructuring costs net of tax as well as tax adjustments, all of which are discussed in sections 3.7.1, 3.7.2. and 3.8.1 of the present document. |
11
|
MANAGEMENT’S DISCUSSION AND ANALYSIS
2.2. SELECTED YEARLY INFORMATION & KEY PERFORMANCE MEASURES
| As at and for the years ended September 30, | 2019 | 2018 | 2017 |
Change
| Change 2018 / 2017 | |||||
In millions of CAD unless otherwise noted | ||||||||||
Growth | ||||||||||
Revenue | 12,111.2 | 11,506.8 | 10,845.1 | 604.4 | 661.7 | |||||
Year-over-year revenue growth | 5.3% | 6.1% | 1.5% | (0.8%) | 4.6% | |||||
Constant currency year-over-year revenue growth | 5.9% | 4.6% | 4.3% | 1.3% | 0.3% | |||||
Backlog | 22,611 | 22,577 | 20,813 | 34 | 1,764 | |||||
Bookings | 12,646 | 13,493 | 11,284 | (847) | 2,209 | |||||
Book-to-bill ratio | 104.4% | 117.3% | 104.1% | (12.9%) | 13.2% | |||||
Profitability | ||||||||||
Adjusted EBIT | 1,825.0 | 1,701.7 | 1,586.6 | 123.3 | 115.1 | |||||
Adjusted EBIT margin | 15.1% | 14.8% | 14.6% | 0.3% | 0.2% | |||||
Net earnings | 1,263.2 | 1,141.4 | 1,035.2 | 121.8 | 106.2 | |||||
Net earnings margin | 10.4% | 9.9% | 9.5% | 0.5% | 0.4% | |||||
Diluted EPS (in dollars) | 4.55 | 3.95 | 3.41 | 0.60 | 0.54 | |||||
Net earnings excluding specific items | 1,305.9 | 1,210.7 | 1,107.0 | 95.2 | 103.7 | |||||
Net earnings margin excluding specific items | 10.8% | 10.5% | 10.2% | 0.3% | 0.3% | |||||
Diluted EPS excluding specific items (in dollars) | 4.70 | 4.19 | 3.65 | 0.51 | 0.54 | |||||
Liquidity | ||||||||||
Cash provided by operating activities | 1,633.9 | 1,493.4 | 1,358.6 | 140.5 | 134.8 | |||||
As a % of revenue | 13.5% | 13.0% | 12.5% | 0.5% | 0.5% | |||||
Days sales outstanding | 50 | 52 | 47 | (2) | 5 | |||||
Capital structure | ||||||||||
Net debt | 2,117.2 | 1,640.8 | 1,749.4 | 476.4 | (108.6) | |||||
Net debt to capitalization ratio | 22.9% | 19.2% | 21.5% | 3.7% | (2.3)% | |||||
Return on equity | 18.5% | 17.3% | 16.1% | 1.2% | 1.2% | |||||
Return on invested capital | 15.1% | 14.5% | 13.7% | 0.6% | 0.8% | |||||
Balance sheet | ||||||||||
Cash and cash equivalents, and short-term investments | 223.7 | 184.1 | 165.9 | 39.6 | 18.2 | |||||
Total assets | 12,621.7 | 11,919.1 | 11,396.2 | 702.6 | 522.9 | |||||
Long-term financial liabilities1 | 2,236.0 | 1,530.1 | 1,821.9 | 705.9 | (291.8) | |||||
| 1 | Long-term financial liabilities include the long-term portion of the debt and the long-term derivative financial instruments. |
12
|
| FISCAL 2019 RESULTS | |
2.3. STOCK PERFORMANCE
CGI Stock Price (TSX) for the Last Twelve Months
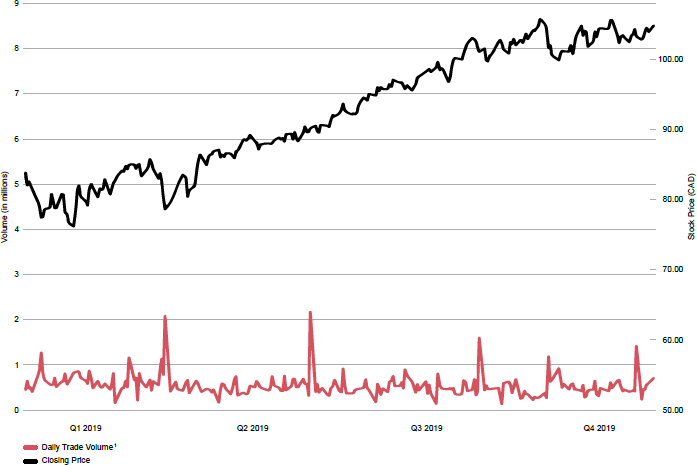
2.3.1. Fiscal 2019 Trading Summary
CGI’s shares are listed on the Toronto Stock Exchange (TSX) (stock quote – GIB.A) and the New York Stock Exchange (NYSE) (stock quote – GIB) and are included in key indices such as the S&P/TSX 60 Index.
TSX | (CAD) | NYSE | (USD) | |||||
Open: | 83.28 | Open: | 64.68 | |||||
High: | 106.63 | High: | 80.59 | |||||
Low: | 75.54 | Low: | 57.35 | |||||
Close: | 104.76 | Close: | 79.14 | |||||
CDN average daily trading volumes1: | 828,899 | NYSE average daily trading volumes: | 174,254 | |||||
| 1 | Includes the average daily volumes of both the TSX and alternative trading systems. |
13
|
MANAGEMENT’S DISCUSSION AND ANALYSIS
2.3.2. Normal Course Issuer Bid (NCIB)
On January 30, 2019, the Company’s Board of Directors authorized and subsequently received the regulatory approval from the TSX for the renewal of CGI’s NCIB which allows for the purchase for cancellation of up to 20,100,499 Class A subordinate voting shares (Class A Shares), representing 10% of the Company’s public float as of the close of business on January 23, 2019. Class A Shares may be purchased for cancellation under the current NCIB commencing on February 6, 2019 until no later than February 5, 2020, or on such earlier date when the Company has either acquired the maximum number of Class A Shares allowable under the NCIB or elects to terminate the bid.
During Fiscal 2019, the Company purchased for cancellation 12,460,232 Class A Shares for $1,126.1 million at a weighted average price of $90.37 under the previous and current NCIB. The purchased shares included 5,158,362 Class A Shares purchased for cancellation from Caisse de dépôt et placement du Québec (CDPQ) for cash consideration of $500.0 million. The purchase is considered within the annual aggregate limit that the Company is entitled to purchase under its current NCIB.
As at September 30, 2019, the Company could purchase up to 13,315,767 Class A Shares for cancellation under the current NCIB.
2.3.3. Capital Stock and Options Outstanding
The following table provides a summary of the Capital Stock and Options Outstanding as at November 1, 2019:
| Capital Stock and Options Outstanding | �� | As at November 1, 2019 |
Class A subordinate voting shares | 239,812,343 | |
Class B multiple voting shares | 28,945,706 | |
Options to purchase Class A subordinate voting shares | 9,749,355 |
2.4. INVESTMENTS IN SUBSIDIARIES
On October 11, 2018, the Company acquired all of the outstanding shares of ckc AG (ckc), for a purchase price of $21.0 million (€13.9 million). ckc was a specialized provider of agile software development and management services, with a focus on the automotive sector, headquartered in Brunswick, Germany. This acquisition added approximately 300 professionals and annualized revenues of approximately€30 million to the Company.
During the three months ended March 31, 2019, the Company acquired 22.6% of the outstanding shares of Acando AB (Acando), a consulting services firm with strategic consulting, system integration and customer-centric digital innovation capabilities, headquartered in Stockholm, Sweden, with additional offices in Finland, Norway, Germany and Latvia.
On April 16, 2019, the Company acquired control of Acando through the acquisition of an additional 71.1% of the outstanding shares under a tender offer. By May 14, 2019, an additional 2.4% was acquired, for a total purchase price of $623.8 million (SEK 4,319.7 million).This acquisition added approximately 2,100 professionals and annualized revenues of approximately $400 million to the Company, before considering divestitures in the range of5%-10%.
On October 11 2019, the Company acquired the remaining 3.9% of the outstanding shares of Acando for a total purchase price of $23.1 million (SEK 171.5 million).
With significant strategic consulting, system integration and customer-centric digital innovation capabilities, these acquisitions were made to complement CGI’s proximity model and expertise across key sectors, including manufacturing, retail and government. Please refer to note 25 of our audited consolidated financial statements for additional information.
On June 14, 2019, the Company announced a cash offer of approximately $131 million (£ 78.9 million) to acquire all outstanding shares of SCISYS Group Plc (SCISYS).The transaction is expected to be completed by the first quarter of Fiscal 2020. SCISYS operates in several sectors, with deep expertise and industry leading solutions in the space and defense sectors, as well as in the media and broadcast news industries and is headquartered in Dublin, Ireland. This acquisition would add approximately 670 professionals predominantly based in the UK and Germany and annualized revenues of approximately £58.4 million to the Company.
14
|
| FISCAL 2019 RESULTS | |
| 3. | Financial Review |
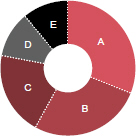
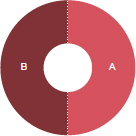
3.1. BOOKINGS ANDBOOK-TO-BILL RATIO
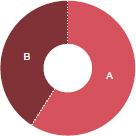
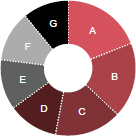
Bookings for the year were $12.6 billion representing a book-to-bill ratio of 104.4%. The breakdown of the new bookings signed during the year is as follows:
| 
| 
| 
| |||||||||||||||||||||||||
| Contract Type | Service Type | Segment | Vertical Market | |||||||||||||||||||||||||
| A. | Extensions, renewalsand add-ons | 67% | A. | System integration and consulting | 59 % | A. | U.S. Commercial and State Government | 19% | A. | Government | 31% | |||||||||||||||||
| B. | New business | 33% | B. | Managed IT and Business Process Services | 41 % | B. | Northern Europe | 18% | B. | Financial Services | 27% | |||||||||||||||||
| C. | Western and Southern Europe | 16% | C. | MRD | 20% | |||||||||||||||||||||||
| D. | Canada | 12% | D. | Communications & utilities | 11% | |||||||||||||||||||||||
| E. | U.S. Federal | 12% | E. | Health | 11% | |||||||||||||||||||||||
| F. | U.K. and Australia | 12% | ||||||||||||||||||||||||||
| G. | Central and Eastern Europe | 11% | ||||||||||||||||||||||||||

Information regarding our bookings is a key indicator of the volume of our business over time. However, due to the timing and transition period associated with managed IT and business process services contracts, the realization of revenue related to these bookings may fluctuate from period to period. The values initially booked may change over time due to their variable attributes, including demand-driven usage, modifications in the scope of work to be performed caused by changes in client requirements as well as termination clauses at the option of the client. As such, information regarding our bookings is not comparable to, nor should it be substituted for, an analysis of our revenue. Management however believes that it is a key indicator of potential future revenue.
The following table provides a summary of the bookings and book-to-bill ratio by segment:
| In thousands of CAD except for percentages |
Bookings for the year ended September 30, 2019
| Book-to-bill ratio for the year ended September 30, 2019 | ||||
Total CGI | 12,646,027 | 104.4% | ||||
Western and Southern Europe | 2,057,093 | 101.5% | ||||
Northern Europe | 2,254,359 | 113.8% | ||||
Canada | 1,556,634 | 82.9% | ||||
U.S. Commercial and State Government | 2,436,044 | 133.1% | ||||
U.S. Federal | 1,545,255 | 93.9% | ||||
U.K. and Australia | 1,466,935 | 94.0% | ||||
Central and Eastern Europe | 1,329,707 | 111.7% | ||||
15
|
MANAGEMENT’S DISCUSSION AND ANALYSIS
3.2. FOREIGN EXCHANGE
The Company operates globally and is exposed to changes in foreign currency rates. Accordingly, as prescribed by IFRS, we value assets, liabilities and transactions that are measured in foreign currencies using various exchange rates. We report all dollar amounts in Canadian dollars.
Closing foreign exchange rates
As at September 30,
| 2019 | 2018 | Change | |||||||||
U.S. dollar | 1.3246 | 1.2925 | 2.5% | |||||||||
Euro | 1.4446 | 1.5024 | (3.8% | ) | ||||||||
Indian rupee | 0.0188 | 0.0178 | 5.6% | |||||||||
British pound | 1.6302 | 1.6874 | (3.4% | ) | ||||||||
Swedish krona | 0.1347 | 0.1456 | (7.5% | ) | ||||||||
Average foreign exchange rates
| ||||||||||||
For the year ended September 30,
| 2019 | 2018 | Change | |||||||||
U.S. dollar | 1.3270 | 1.2838 | 3.4% | |||||||||
Euro | 1.4970 | 1.5278 | (2.0% | ) | ||||||||
Indian rupee | 0.0188 | 0.0193 | (2.6% | ) | ||||||||
British pound | 1.6943 | 1.7271 | (1.9% | ) | ||||||||
Swedish krona | 0.1426 | 0.1510 | (5.6% | ) | ||||||||
16
|
| FISCAL 2019 RESULTS | |
3.3. REVENUE DISTRIBUTION
The following charts provide additional information regarding our revenue mix for the year:
|
| 
|
| 
|
| |||||||||||||||||||||
| Service Type | Client Geography | Vertical Market | ||||||||||||||||||||||||
| A. | System integration and consulting | 50% | A. | U.S. | 29% | A. | Government | 33% | ||||||||||||||||||
| B. | Managed IT and Business Process | 50% | B. | Canada | 16% | B. | MRD | 24% | ||||||||||||||||||
| C. | France | 15% | C. | Financial services | 22% | |||||||||||||||||||||
| D. | U.K. | 12% | D. | Communications & utilities | 14% | |||||||||||||||||||||
| E. | Sweden | 7% | E. | Health | 7% | |||||||||||||||||||||
| F. | Finland | 6% | ||||||||||||||||||||||||
| G. | Rest of the world | 15% | ||||||||||||||||||||||||
3.3.1. Client Concentration
IFRS guidance on segment disclosures defines a single customer as a group of entities that are known to the reporting entity to be under common control. As a consequence, our work for the U.S. federal government including its various agencies represented 12.8% of our revenue for Fiscal 2019 as compared to 12.0% for Fiscal 2018.
17
|
MANAGEMENT’S DISCUSSION AND ANALYSIS
3.4. REVENUE BY SEGMENT
Our segments are reported based on where the client’s work is delivered from - our geographic delivery model.
The following table provides a summary of the year-over-year changes in our revenue, in total and by segment, separately showing the impacts of foreign currency exchange rate variations between Fiscal 2019 and Fiscal 2018. The Fiscal 2018 revenue by segment was recorded reflecting the actual foreign exchange rates for that period. The foreign exchange impact is the difference between the current period’s actual results and the same period’s results converted with the prior year’s foreign exchange rates.
| For the years ended September 30, |
Change
| |||||||||||||||
| 2019 | 2018 | $ | % | |||||||||||||
In thousands of CAD except for percentages | ||||||||||||||||
Total CGI revenue | 12,111,236 | 11,506,825 | 604,411 | 5.3% | ||||||||||||
Variation prior to foreign currency impact | 5.9% | |||||||||||||||
Foreign currency impact | (0.6% | ) | ||||||||||||||
Variation over previous period | 5.3% | |||||||||||||||
Western and Southern Europe | ||||||||||||||||
Revenue prior to foreign currency impact | 2,061,550 | 1,995,811 | 65,739 | 3.3% | ||||||||||||
Foreign currency impact | (41,887 | ) | ||||||||||||||
Western and Southern Europe revenue | 2,019,663 | 1,995,811 | 23,852 | 1.2% | ||||||||||||
Northern Europe | ||||||||||||||||
Revenue prior to foreign currency impact | 1,950,212 | 1,800,460 | 149,752 | 8.3% | ||||||||||||
Foreign currency impact | (72,960 | ) | ||||||||||||||
Northern Europe revenue | 1,877,252 | 1,800,460 | 76,792 | 4.3% | ||||||||||||
Canada | ||||||||||||||||
Revenue prior to foreign currency impact | 1,711,550 | 1,671,060 | 40,490 | 2.4% | ||||||||||||
Foreign currency impact | 377 | |||||||||||||||
Canada revenue | 1,711,927 | 1,671,060 | 40,867 | 2.4% | ||||||||||||
U.S. Commercial and State Government | ||||||||||||||||
Revenue prior to foreign currency impact | 1,744,239 | 1,689,686 | 54,553 | 3.2% | ||||||||||||
Foreign currency impact | 58,223 | |||||||||||||||
U.S. Commercial and State Government revenue | 1,802,462 | 1,689,686 | 112,776 | 6.7% | ||||||||||||
U.S. Federal | ||||||||||||||||
Revenue prior to foreign currency impact | 1,569,083 | 1,458,741 | 110,342 | 7.6% | ||||||||||||
Foreign currency impact | 52,904 | |||||||||||||||
U.S. Federal revenue | 1,621,987 | 1,458,741 | 163,246 | 11.2% | ||||||||||||
U.K. and Australia | ||||||||||||||||
Revenue prior to foreign currency impact | 1,380,231 | 1,342,662 | 37,569 | 2.8% | ||||||||||||
Foreign currency impact | (28,238 | ) | ||||||||||||||
U.K. and Australia revenue | 1,351,993 | 1,342,662 | 9,331 | 0.7% | ||||||||||||
Central and Eastern Europe | ||||||||||||||||
Revenue prior to foreign currency impact | 1,187,715 | 1,027,055 | 160,660 | 15.6% | ||||||||||||
Foreign currency impact | (25,122 | ) | ||||||||||||||
Central and Eastern Europe revenue | 1,162,593 | 1,027,055 | 135,538 | 13.2% | ||||||||||||
Asia Pacific | ||||||||||||||||
Revenue prior to foreign currency impact | 565,337 | 521,350 | 43,987 | 8.4% | ||||||||||||
Foreign currency impact | (1,978 | ) | ||||||||||||||
Asia Pacific revenue | 563,359 | 521,350 | 42,009 | 8.1% | ||||||||||||
18
|
| FISCAL 2019 RESULTS | |
For the year ended September 30, 2019, revenue was $12,111.2 million, an increase of $604.4 million, or 5.3% over the same period last year. On a constant currency basis, revenue increased by $674.1 million or 5.9%. Foreign currency rate fluctuations unfavourably impacted our revenue by $69.7 million. The increase in revenue was mostly due to organic growth, primarily within the MRD and government vertical markets, and recent business acquisitions.
3.4.1. Western and Southern Europe
For the year ended September 30, 2019, revenue in our Western and Southern Europe segment was $2,019.7 million, an increase of $23.9 million or 1.2% over the same period last year. On a constant currency basis, revenue increased by $65.7 million or 3.3%. The increase in revenue was the result of organic growth in France across most vertical markets, predominantly in MRD, partly offset by the performance of our Southern Europe and Brazil operations.
On a client geographic basis, the top two Western and Southern Europe vertical markets were MRD and financial services, generating combined revenues of approximately $1,290 million for the year ended September 30, 2019.
3.4.2. Northern Europe
For the year ended September 30, 2019, revenue in our Northern Europe segment was $1,877.3 million, an increase of $76.8 million or 4.3% over the same period last year. On a constant currency basis, revenue increased by $149.8 million or 8.3%. The increase was mainly driven by the Acando acquisition.
On a client geographic basis, the top two Northern Europe vertical markets were MRD and government, generating combined revenues of approximately $1,250 million for the year ended September 30, 2019.
3.4.3. Canada
For the year ended September 30, 2019, revenue in our Canada segment was $1,711.9 million, an increase of $40.9 million or 2.4% compared to the same period last year. On a constant currency basis, revenue increased by $40.5 million or 2.4%. The increase was mostly due to organic growth and higher IP license sales and related services, notably within the financial services and government vertical markets. This was in part offset by the decrease in work volume within the communications & utilities vertical market.
On a client geographic basis, the top two Canada vertical markets were financial services and communications & utilities, generating combined revenues of approximately $1,169 million for the year ended September 30, 2019.
3.4.4. U.S. Commercial and State Government
For the year ended September 30, 2019, revenue in our U.S. Commercial and State Government segment was $1,802.5 million, an increase of $112.8 million or 6.7% over the same period last year. On a constant currency basis, revenue increased by $54.6 million or 3.2%. The increase was mainly driven by higher IP license sales and related services, primarily within the financial services vertical market, combined with organic growth within the government vertical market.
On a client geographic basis, the top two U.S. Commercial and State Government vertical markets were financial services and government, generating combined revenues of approximately $1,088 million for the year ended September 30, 2019.
3.4.5. U.S. Federal
For the year ended September 30, 2019, revenue in our U.S. Federal segment was $1,622.0 million, an increase of $163.2 million or 11.2% over the same period last year. On a constant currency basis, revenue increased by $110.3 million or 7.6%. The increase was driven by new business mainly related to our IP solutions, application support and cybersecurity services. This was partly offset by lower business process services.
For the year ended September 30, 2019, 80% of revenues within the U.S. Federal segment were federal civilian based.
19
|
MANAGEMENT’S DISCUSSION AND ANALYSIS
3.4.6. U.K. and Australia
For the year ended September 30, 2019, revenue in our U.K. and Australia segment was $1,352.0 million, an increase of $9.3 million or 0.7% over the same period last year. On a constant currency basis, revenue increased by $37.6 million or 2.8%. The increase in revenue was due to organic growth within the government vertical market and higher IP license sales and related services within the financial services vertical market. This was partly offset by an unfavourable adjustment on a client contract.
On a client geographic basis, the top two U.K. and Australia vertical markets were government and communications & utilities, generating combined revenues of approximately $1,060 million for the year ended September 30, 2019.
3.4.7. Central and Eastern Europe
For the year ended September 30, 2019, revenue in our Central and Eastern Europe segment was $1,162.6 million, an increase of $135.5 million or 13.2% over the same period last year. On a constant currency basis, revenue increased by $160.7 million or 15.6%. The increase in revenue was mainly driven by organic growth in Germany and the Netherlands, primarily within the MRD, government and communications & utilities vertical markets and by recent acquisitions.
On a client geographic basis, the top two Central and Eastern Europe vertical markets were MRD and communications & utilities, generating combined revenues of approximately $779 million for year ended September 30, 2019.
3.4.8. Asia Pacific
For the year ended September 30, 2019, revenue in our Asia Pacific segment was $563.4 million, an increase of $42.0 million or 8.1% over the same period last year. On a constant currency basis, revenue increased by $44.0 million or 8.4%. The increase is mainly driven by the continued demand for our offshore delivery centers, predominantly within financial services and MRD vertical markets.
3.5. OPERATING EXPENSES
For the years ended September 30,
| 2019
| % of
| 2018
| % of
| $
| %
| ||||||||||||||||||
| In thousands of CAD except for percentages | ||||||||||||||||||||||||
Costs of services, selling and administrative | 10,284,007 | 84.9% | 9,801,791 | 85.2% | 482,216 | 4.9% | ||||||||||||||||||
Foreign exchange loss | 2,234 | 0.0% | 3,300 | 0.0% | (1,066 | ) | (32.3% | ) | ||||||||||||||||
3.5.1. Costs of Services, Selling and Administrative
For the year ended September 30, 2019, costs of services, selling and administrative expenses amounted to $10,284.0 million, an increase of $482.2 million over the same period last year. As a percentage of revenue, costs of services, selling and administrative expenses decreased to 84.9% from 85.2%. As a percentage of revenue, costs of services remained stable compared to the same period last year as the impact of a higher proportion of IP services and solutions revenue and savings generated by the Restructuring Program compensated for the unfavourablenon-recurring adjustments and the temporary slowdown in certain segments, as outlined in section 3.6. of the present document. As a percentage of revenue, selling and administrative expenses improved mainly due to savings generated by the Restructuring Program and benefits of synergies achieved through the integration of business acquisitions.
During the year ended September 30, 2019, the translation of the results of our foreign operations from their local currencies to the Canadian dollar favourably impacted costs by $69.3 million, essentially offsetting the unfavourable translation impact of $69.7 million on our revenue.
20
|
| FISCAL 2019 RESULTS | |
3.5.2. Foreign Exchange Loss
During the year ended September 30, 2019, CGI incurred $2.2 million of foreign exchange losses, mainly driven by the timing of payments combined with the volatility of foreign exchange rates. The Company, in addition to its natural hedges, uses derivatives as a strategy to manage its exposure, to the extent possible.
3.6. ADJUSTED EBIT BY SEGMENT
| Change | ||||||||||||||||
For the years ended September 30,
|
| 2019
|
|
| 2018
|
|
| $
|
|
| %
|
| ||||
| In thousands of CAD except for percentages | ||||||||||||||||
Western and Southern Europe | 271,543 | 258,802 | 12,741 | 4.9% | ||||||||||||
As a percentage of segment revenue | 13.4% | 13.0% | ||||||||||||||
Northern Europe | 200,116 | 196,823 | 3,293 | 1.7% | ||||||||||||
As a percentage of segment revenue | 10.7% | 10.9% | ||||||||||||||
Canada | 349,497 | 363,066 | (13,569 | ) | (3.7% | ) | ||||||||||
As a percentage of segment revenue | 20.4% | 21.7% | ||||||||||||||
U.S. Commercial and State Government | 331,135 | 283,571 | 47,564 | 16.8% | ||||||||||||
As a percentage of segment revenue | 18.4% | 16.8% | ||||||||||||||
U.S. Federal | 235,262 | 198,140 | 37,122 | 18.7% | ||||||||||||
As a percentage of segment revenue | 14.5% | 13.6% | ||||||||||||||
U.K. and Australia | 180,646 | 195,098 | (14,452 | ) | (7.4% | ) | ||||||||||
As a percentage of segment revenue | 13.4% | 14.5% | ||||||||||||||
Central and Eastern Europe | 101,749 | 86,428 | 15,321 | 17.7% | ||||||||||||
As a percentage of segment revenue | 8.8% | 8.4% | ||||||||||||||
Asia Pacific | 155,047 | 119,806 | 35,241 | 29.4% | ||||||||||||
As a percentage of segment revenue | 27.5% | 23.0% | ||||||||||||||
Adjusted EBIT | 1,824,995 | 1,701,734 | 123,261 | 7.2% | ||||||||||||
Adjusted EBIT margin | 15.1% | 14.8% | ||||||||||||||
For the year ended September 30, 2019, adjusted EBIT margin increased to 15.1% from 14.8% for the same period last year. The increase was mostly due to an improved revenue mix, compensating for the impact of unfavourablenon-recurring adjustments, as disclosed below.
3.6.1. Western and Southern Europe
For the year ended September 30, 2019, adjusted EBIT in the Western and Southern Europe segment was $271.5 million, an increase of $12.7 million when compared to the same period last year. Adjusted EBIT margin increased to 13.4% from 13.0%. The increase was due to organic growth in France, partly offset by the performance of our Southern Europe and Brazil operations.
3.6.2. Northern Europe
For the year ended September 30, 2019, adjusted EBIT in the Northern Europe segment was $200.1 million, an increase of $3.3 million when compared to the same period last year. Adjusted EBIT margin was essentially stable as the temporary effects of excess capacity in our Swedish infrastructure business and the dilutive impact of the Acando acquisition were offset by improved utilization in Finland.
3.6.3. Canada
For the year ended September 30, 2019, adjusted EBIT in the Canada segment was $349.5 million, a decrease of $13.6 million when compared to the same period last year. Adjusted EBIT margin decreased to 20.4% from 21.7%, primarily due to cost associated with the optimization and modernization of our infrastructure business and the slowdown of projects and lower
21
|
MANAGEMENT’S DISCUSSION AND ANALYSIS
work volumes within the communications & utilities vertical market. This was partly offset by higher IP license sales and related services within financial services vertical market.
3.6.4. U.S. Commercial and State Government
For the year ended September 30, 2019, adjusted EBIT in the U.S. Commercial and State Government segment was $331.1 million, an increase of $47.6 million when compared to the same period last year. Adjusted EBIT margin increased to 18.4% from 16.8%. The increase was mainly due to an improved revenue mix, primarily as a result of higher IP license sales and related services.
3.6.5. U.S. Federal
For the year ended September 30, 2019, adjusted EBIT in the U.S. Federal segment was $235.3 million, an increase of $37.1 million when compared to the same period last year. Adjusted EBIT margin increased to 14.5% from 13.6% compared to the same period last year, primarily due to the improved revenue mix described in the revenue section.
3.6.6. U.K. and Australia
For the year ended September 30, 2019, adjusted EBIT in the U.K. and Australia segment was $180.6 million, a decrease of $14.5 million when compared to the same period last year. Adjusted EBIT margin decreased to 13.4% from 14.5%. An improved business mix combined with lower costs helped compensate for both the unfavourable impact of the equalization of pensionable services and client contracts adjustments. The change in adjusted EBIT margin was also impacted by a favourable client provision release in Q1 2018.
3.6.7. Central and Eastern Europe
For the year ended September 30, 2019, adjusted EBIT in the Central and Eastern Europe segment was $101.7 million, an increase of $15.3 million when compared to the same period last year. Adjusted EBIT margin increased to 8.8% from 8.4% last year. The increase in Adjusted EBIT was mainly driven by improved profitability in the Netherlands, in part offset by lower demand from a financial services client.
3.6.8. Asia Pacific
For the year ended September 30, 2019, adjusted EBIT in the Asia Pacific segment was $155.0 million, an increase of $35.2 million when compared to the same period last year. Adjusted EBIT margin increased to 27.5% from 23.0% last year. The increase in adjusted EBIT margin was mostly due to productivity improvements and automation efforts, as well as the favourable impact of our currency forward contracts.
22
|
| FISCAL 2019 RESULTS | |
3.7. EARNINGS BEFORE INCOME TAXES
The following table provides a reconciliation between our adjusted EBIT and earnings before income taxes, which is reported in accordance with IFRS.
| Change | ||||||||||||||||||||||||
| For the years ended September 30, | 2019 | | % of Revenue | | 2018 | | % of Revenue | | $ | % | ||||||||||||||
In thousands of CAD except for percentage | ||||||||||||||||||||||||
Adjusted EBIT | 1,824,995 | 15.1% | 1,701,734 | 14.8% | 123,261 | 7.2% | ||||||||||||||||||
Minus the following items: | ||||||||||||||||||||||||
Acquisition-related and integration costs | 77,417 | 0.6% | 37,482 | 0.3% | 39,935 | 106.5% | ||||||||||||||||||
Restructuring costs | — | — | 100,387 | 0.9% | (100,387 | ) | (100.0% | ) | ||||||||||||||||
Net finance costs | 70,630 | 0.6% | 73,885 | 0.6% | (3,255 | ) | (4.4% | ) | ||||||||||||||||
Earnings before income taxes | 1,676,948 | 13.8% | 1,489,980 | 12.9% | 186,968 | 12.5% | ||||||||||||||||||
3.7.1. Acquisition-Related and Integration Costs
For the year ended September 30, 2019, the Company incurred $77.4 million of acquisition-related and integration costs, mainly in connection with the integration of the Acando and ckc operations to the CGI operating model. These costs are mainly related to severances, leases of vacated premises and professional fees.
3.7.2. Restructuring Costs
In Q4 2018, the Company completed the previously announced restructuring program (the Restructuring Program) for a total cost of $189.0 million, of which the remaining $100.4 million was expensed during the year ended September 30, 2018. These amounts include restructuring costs for termination of employment, leases of vacated premises, as well as other restructuring costs.
3.7.3. Net Finance Costs
Net finance costs mainly include interest on our long-term debt. For the year ended September 30, 2019 the decrease in net finance costs of $3.3 million was mainly due to less interest charges related to our unsecured notes and additional interest income from our financial assets. This was partially offset by interest expense related to the settlement of a client contract in our Northern Europe segment and the increase in utilization of our unsecured committed revolving credit facility.
23
|
MANAGEMENT’S DISCUSSION AND ANALYSIS
3.8. NET EARNINGS AND EARNINGS PER SHARE
The following table sets out the information supporting the earnings per share calculations:
| Change | ||||||||||||||||
For the years ended September 30,
|
| 2019
|
|
| 2018
|
|
| $
|
|
| %
|
| ||||
In thousands of CAD except for percentage and shares data | ||||||||||||||||
Earnings before income taxes | 1,676,948 | 1,489,980 | 186,968 | 12.5% | ||||||||||||
Income tax expense | 413,741 | 348,578 | 65,163 | 18.7% | ||||||||||||
Effective tax rate | 24.7% | 23.4% | ||||||||||||||
Net earnings | 1,263,207 | 1,141,402 | 121,805 | 10.7% | ||||||||||||
Net earnings margin | 10.4% | 9.9% | ||||||||||||||
Weighted average number of shares outstanding | ||||||||||||||||
Class A subordinate voting shares and Class B multiple voting shares (basic) | 272,719,309 | 283,878,426 | (3.9% | ) | ||||||||||||
Class A subordinate voting shares and Class B multiple voting shares (diluted)
|
| 277,785,725
|
|
| 288,858,580
|
|
| (3.8%
| )
| |||||||
Earnings per share (in dollars) | ||||||||||||||||
Basic | 4.63 | 4.02 | 0.61 | 15.2% | ||||||||||||
Diluted | 4.55 | 3.95 | 0.60 | 15.2% | ||||||||||||
3.8.1. Income Tax Expense
For the year ended September 30, 2019, the income tax expense was $413.7 million compared to $348.6 million over the same period last year, while our effective tax rate increased to 24.7% from 23.4%. During the quarter ended September 30, 2019, the Company settled with the German tax authorities and booked $115.5 million of additional corporate tax losses, and recorded a $18.5 million income tax recovery. The prior year effective tax rate was impacted by a net favourable tax recovery of $34.1 million, resulting from the U.S. tax reform, a temporary corporate surtax in France and a tax rate reduction in Belgium. When excluding these tax adjustments and the tax effects from acquisition-related and integration costs and restructuring costs, the effective tax rate would have been 25.6% for both financial years.
The table in section 3.8.3. shows the year-over-year comparison of the tax rate with the impact of specific items removed.
Based on the enacted rates at the end of Fiscal 2019 and our current business mix, we expect our effective tax rate before any significant adjustments to be in the range of 24.5% to 26.5% in subsequent periods.
3.8.2. Weighted Average Number of Shares
For Fiscal 2019, CGI’s basic and diluted weighted average number of shares decreased compared to Fiscal 2018 due to the impact of the purchase for cancellation of Class A Shares, partly offset by the grant and the exercise of stock options.
24
|
| FISCAL 2019 RESULTS | |
3.8.3. Net Earnings and Earnings per Share Excluding Specific Items
Below is a table showing the year-over-year comparison excluding specific items namely, acquisition-related and integration costs, restructuring costs, and tax adjustments:
| Change | ||||||||||||||||
| 2019 | 2018 | $ | % | |||||||||||||
In thousands of CAD except for percentages and shares data | ||||||||||||||||
Earnings before income taxes | 1,676,948 | 1,489,980 | 186,968 | 12.5% | ||||||||||||
Add back: | ||||||||||||||||
Acquisition-related and integration costs | 77,417 | 37,482 | 39,935 | 106.5% | ||||||||||||
Restructuring costs
|
| —
|
|
| 100,387
|
|
| (100,387
| )
|
| (100.0%
| )
| ||||
Earnings before income taxes excluding specific items | 1,754,365 | 1,627,849 | 126,516 | 7.8% | ||||||||||||
Margin | 14.5% | 14.1% | ||||||||||||||
Income tax expense | 413,741 | 348,578 | 65,163 | 18.7% | ||||||||||||
Add back: | ||||||||||||||||
Tax deduction on acquisition-related and integration costs | 16,307 | 7,922 | 8,385 | 105.8% | ||||||||||||
Tax deduction on restructuring costs | — | 26,526 | (26,526 | ) | (100.0% | ) | ||||||||||
Tax adjustment | 18,451 | 34,100 | (15,649 | ) | (45.9% | ) | ||||||||||
Income tax expense excluding specific items | 448,499 | 417,126 | 31,373 | 7.5% | ||||||||||||
Effective tax rate excluding specific items | 25.6% | 25.6% | ||||||||||||||
| ||||||||||||||||
Net earnings excluding specific items | 1,305,866 | 1,210,723 | 95,143 | 7.9% | ||||||||||||
Net earnings margin excluding specific items | 10.8% | 10.5% | ||||||||||||||
Weighted average number of shares outstanding | ||||||||||||||||
Class A subordinate voting shares and Class B multiple voting shares (basic) | 272,719,309 | 283,878,426 | (3.9% | ) | ||||||||||||
Class A subordinate voting shares and Class B multiple voting shares (diluted) | 277,785,725 | 288,858,580 | (3.8% | ) | ||||||||||||
Earnings per share excluding specific items (in dollars) | ||||||||||||||||
Basic | 4.79 | 4.26 | 0.53 | 12.4% | ||||||||||||
Diluted
|
| 4.70
|
|
| 4.19
|
|
| 0.51
|
|
| 12.2%
|
| ||||
25
|
MANAGEMENT’S DISCUSSION AND ANALYSIS
| 4. | Liquidity |
4.1. CONSOLIDATED STATEMENTS OF CASH FLOWS
CGI’s growth is financed through a combination of cash flow from operations, borrowing under our existing credit facility, the issuance of long-term debt, and the issuance of equity. One of our financial priorities is to maintain an optimal level of liquidity through the active management of our assets and liabilities as well as our cash flows.
As at September 30, 2019, cash and cash equivalents were $213.8 million. The following table provides a summary of the generation and use of cash for the years ended September 30, 2019 and 2018.
For the years ended September 30,
|
| 2019
|
|
| 2018
|
|
| Change
|
| |||
In thousands of CAD | ||||||||||||
Cash provided by operating activities | 1,633,919 | 1,493,408 | 140,511 | |||||||||
Cash used in investing activities | (950,809 | ) | (577,418 | ) | (373,391 | ) | ||||||
Cash used in financing activities | (629,109 | ) | (879,044 | ) | 249,935 | |||||||
Effect of foreign exchange rate changes on cash and cash equivalents | (24,261 | ) | (18,727 | ) | (5,534 | ) | ||||||
Net increase in cash and cash equivalents
|
| 29,740
|
|
| 18,219
|
|
| 11,521
|
| |||
4.1.1. Cash Provided by Operating Activities
For the year ended September 30, 2019, cash provided by operating activities was $1,633.9 million or 13.5% of revenue compared to $1,493.4 million or 13.0% for the same period last year.
The following table provides a summary of the generation and use of cash from operating activities:
For the years ended September 30,
|
| 2019
|
|
| 2018
|
|
| Change
|
| |||
In thousands of CAD | ||||||||||||
Net earnings | 1,263,207 | 1,141,402 | 121,805 | |||||||||
Amortization and depreciation | 392,301 | 392,675 | (374 | ) | ||||||||
Other adjustments1 | 34,662 | (2,432 | ) | 37,094 | ||||||||
Cash flow from operating activities before net change innon-cash working capital items | 1,690,170 | 1,531,645 | 158,525 | |||||||||
Net change innon-cash working capital items: | ||||||||||||
Accounts receivable, work in progress and deferred revenue | 21,859 | (159,609 | ) | 181,468 | ||||||||
Accounts payable and accrued liabilities, accrued compensation, provisions and long-term liabilities | (21,620 | ) | 79,322 | (100,942 | ) | |||||||
Other2 | (56,490 | ) | 42,050 | (98,540 | ) | |||||||
Net change innon-cash working capital items | (56,251 | ) | (38,237 | ) | (18,014 | ) | ||||||
Cash provided by operating activities
|
| 1,633,919
|
|
| 1,493,408
|
|
| 140,511
|
| |||
| 1 | Comprised of deferred income taxes, foreign exchange loss and share-based payment costs. |
| 2 | Comprised of prepaid expenses and other assets, long-term financial assets, retirement benefits obligations, derivative financial instruments and income taxes. |
For the year ended September 30, 2019, the net change innon-cash working capital items of $56.3 million was mostly due to the timing of accounts payable, income tax payments and collection of tax credits, partially offset by the decrease in our DSO from 52 days in Q4 2018 to 50 days in Q4 2019.
The timing of our working capital inflows and outflows will always have an impact on the cash flow from operations.
26
|
| FISCAL 2019 RESULTS | |
4.1.2. Cash Used in Investing Activities
For the year ended September 30, 2019, $950.8 million was used in investing activities while $577.4 million was used over the prior year.
The following table provides a summary of the use of cash from investing activities:
For the years ended September 30,
|
|
2019
|
|
|
2018
|
|
|
Change
|
| |||
In thousands of CAD | ||||||||||||
Business acquisitions and Investment in a step acquisition | (620,014 | ) | (244,637 | ) | (375,377 | ) | ||||||
Purchase of property, plant and equipment | (162,061 | ) | (143,250 | ) | (18,811 | ) | ||||||
Additions to contract costs | (60,191 | ) | (87,420 | ) | 27,229 | |||||||
Additions to intangible assets | (105,976 | ) | (95,451 | ) | (10,525 | ) | ||||||
Net change in short-term investments and purchase of long-term investments | (2,567 | ) | (6,660 | ) | 4,093 | |||||||
Cash used in investing activities
|
| (950,809
| )
|
| (577,418
| )
|
| (373,391
| )
| |||
The increase of $373.4 million in cash used in investing activities during the year ended September 30, 2019 was mainly due to the increase in cash used for acquisitions throughout the year. It was also due to an increase of investments in leasehold improvements and business solutions, partially offset by a decrease in cash used for contract costs.
4.1.3. Cash Used in Financing Activities
For the year ended September 30, 2019, $629.1 million was used in financing activities while $879.0 million was used over the same period last year.
The following table provides a summary of the generation and use of cash from financing activities:
For the years ended September 30,
|
|
2019
|
|
|
2018
|
|
|
Change
|
| |||
In thousands of CAD | ||||||||||||
Net change in unsecured committed revolving credit facility | 139,575 | (5,205 | ) | 144,780 | ||||||||
Net change in long-term debt | 331,404 | (101,660 | ) | 433,064 | ||||||||
| 470,979 | (106,865 | ) | 577,844 | |||||||||
Repayment of debt assumed from business acquisitions | (2,141 | ) | (28,609 | ) | 26,468 | |||||||
Purchase of Class A subordinate voting shares held in trusts | (30,740 | ) | (24,789 | ) | (5,951 | ) | ||||||
Settlement of derivative financial instruments | (554 | ) | (2,430 | ) | 1,876 | |||||||
Resale of class A subordinate voting shares held in trust | — | 528 | (528 | ) | ||||||||
Purchase and cancellation of Class A subordinate voting shares | (1,130,255 | ) | (794,076 | ) | (336,179 | ) | ||||||
Issuance of Class A subordinate voting shares | 63,602 | 77,197 | (13,595 | ) | ||||||||
Cash used in financing activities
|
| (629,109
| )
|
| (879,044
| )
|
| 249,935
|
| |||
For the year ended September 30, 2019, we drew $139.6 million under the unsecured committed revolving credit facility and we entered into a five-year unsecured committed term loan credit facility of $670.0 million (swapped into euro currency). The proceeds of the credit facility and term loan were used to repay the scheduled repayments of the Senior unsecured notes in the amount of $306.8 million, used to invest in business acquisitions and in the purchase for cancellation of class A shares. For the year ended September 30, 2018, $101.7 million was used to reduce our outstanding debt, mainly driven by the scheduled repayment of the Senior U.S. unsecured notes, while $28.6 million was used to repay debt assumed from the previous year’s business acquisitions.
For the year ended September 30, 2019, $30.7 million was used to purchase Class A Shares in connection with the Company’s Performance Share Unit Plans (PSU Plans) compared to $24.8 million during the year ended September 30, 2018. More information concerning the PSU Plans can be found in note 19 of the audited consolidated financial statements.
For the year ended September 30, 2019, $1,130.3 million was used to pay for the purchase for cancellation of 12,510,232 Class A Shares, compared to $794.1 million for the purchase for cancellation of 10,325,879 Class A Shares last year.
27
|
MANAGEMENT’S DISCUSSION AND ANALYSIS
Finally, for the year ended September 30, 2019, we received $63.6 million in proceeds from the exercise of stock options, compared to $77.2 million during the year ended September 30, 2018.
4.1.4. Effect of Foreign Exchange Rate Changes on Cash and Cash Equivalents
For the year ended September 30, 2019, the effect of foreign exchange rate changes on cash and cash equivalents had an unfavourable impact of $24.3 million. This amount had no effect on net earnings as it was recorded in other comprehensive income.
28
|
| FISCAL 2019 RESULTS | |
4.2. CAPITAL RESOURCES
As at September 30, 2019
|
Available
| |||
In thousands of CAD | ||||
Cash and cash equivalents | 213,831 | |||
Short-term investments | 9,889 | |||
Long-term investments | 24,596 | |||
$1.5 billion unsecured committed revolving credit facility1 | 1,155,369 | |||
Total | 1,403,685 | |||
| 1 | As at September 30, 2019, letters of credit in the amount of $9.6 million were outstanding against the $1.5 billion unsecured committed revolving credit facility. |
Our cash position and bank lines are sufficient to support our growth strategy. As at September 30, 2019, cash and cash equivalents and investments represented $248.3 million.
Cash equivalents include term deposits, all with maturities of 90 days or less. Long-term investments include corporate and government bonds with maturities ranging from one to five years, with a credit rating of A or higher.
As at September 30, 2019, the aggregate amount of the capital resources available to the Company was $1,403.7 million. The long-term debt agreements contain covenants, which require us to maintain certain financial ratios. As at September 30, 2019, CGI was in compliance with these covenants.
Total debt increased by $530.3 million to $2,331.2 million as at September 30, 2019, compared to $1,800.9 million as at September 30, 2018. The variance was mainly due to the $670.0 million (US $500.0 million) received through the five-year unsecured committed term loan credit facility, net change in the unsecured committed revolving credit facility of $139.6 million and a foreign exchange translation impact of $22.0 million, partly offset by scheduled repayments of the unsecured notes in the amount of $306.8 million.
As at September 30, 2019, CGI was showing a positive working capital2 of $373.3 million. The Company also had $1,155.4 million available under its unsecured committed revolving credit facility and is generating a significant level of cash, which will allow it to fund its operations while maintaining adequate levels of liquidity. On November 5, 2019, the unsecured committed revolving facility was extended by one year to December 2024 and can be further extended. There were no material changes in the terms and conditions.
As at September 30, 2019, the cash and cash equivalents held by foreign subsidiaries were $149.1 million ($142.4 million as at September 30, 2018). The tax implications and impact related to its repatriation will not materially affect the Company’s liquidity.
| 2 | Working capital is defined as total current assets minus total current liabilities. |
29
|
MANAGEMENT’S DISCUSSION AND ANALYSIS
4.3. CONTRACTUAL OBLIGATIONS
We are committed under the terms of contractual obligations which have various expiration dates, primarily for the rental of premises, computer equipment used in managed IT and business process services contracts and long-term service agreements. For the year ended September 30, 2019, the Company increased its commitments by $650.7 million mainly due to the increase of long-term debt.
| Commitment type | Total | Less than 1 | Between 1 | Between 2 | Beyond 5 | |||||||||||||||
| year | and 2 years | and 5 years | years | |||||||||||||||||
In thousands of CAD | ||||||||||||||||||||
Long-term debt | 2,299,997 | 99,410 | 270,393 | 1,929,603 | 591 | |||||||||||||||
Estimated interest on long-term debt | 300,150 | 81,030 | 78,980 | 140,140 | — | |||||||||||||||
Finance lease obligations | 30,339 | 14,086 | 11,303 | 4,950 | — | |||||||||||||||
Estimated interest on finance lease obligations | 906 | 448 | 282 | 176 | — | |||||||||||||||
Operating leases | ||||||||||||||||||||
Rental of office space (excluding cost of services and taxes) | 727,551 | 148,375 | 126,842 | 281,103 | 171,231 | |||||||||||||||
Computer equipment | 1,545 | 949 | 419 | 177 | — | |||||||||||||||
Vehicles | 118,406 | 38,797 | 28,270 | 51,339 | — | |||||||||||||||
Long-term service agreements and other | 211,845 | 113,840 | 79,252 | 18,753 | — | |||||||||||||||
Total | 3,690,739 | 496,935 | 595,741 | 2,426,241 | 171,822 | |||||||||||||||
The periods in the above table were aligned to the Company’s audited consolidated financial statements.
Our required benefit plan contributions have not been included in this table as such contributions depend on periodic actuarial valuations for funding purposes. Our contributions to defined benefit plans are estimated at $25.2 million for Fiscal 2019 as described in note 16 of the audited consolidated financial statements.
4.4. FINANCIAL INSTRUMENTS AND HEDGING TRANSACTIONS
We use various financial instruments to help us manage our exposure to fluctuations of foreign currency exchange rates and interest rates. Please refer to notes 3 and 30 of our audited consolidated financial statements for additional information on our financial instruments and hedging transactions.
30
|
| FISCAL 2019 RESULTS | |
4.5. SELECTED MEASURES OF CAPITAL RESOURCES AND LIQUIDITY
As at September 30,
|
|
2019
|
|
|
2018
|
| ||
In thousands of CAD except for percentages | ||||||||
Reconciliation between net debt and long-term debt including the current portion: | ||||||||
Net debt | 2,117,229 | 1,640,814 | ||||||
Add back: | ||||||||
Cash and cash equivalents | 213,831 | 184,091 | ||||||
Short-term investments | 9,889 | — | ||||||
Long-term investments | 24,596 | 30,054 | ||||||
Fair value of foreign currency derivative financial instruments related to debt | (34,338 | ) | (54,066 | ) | ||||
Long-term debt including the current portion
|
| 2,331,207
|
|
| 1,800,893
|
| ||
Net debt to capitalization ratio | 22.9 | % | 19.2 | % | ||||
Return on equity | 18.5 | % | 17.3 | % | ||||
Return on invested capital | 15.1 | % | 14.5 | % | ||||
Days sales outstanding | 50 | 52 | ||||||
We use the net debt to capitalization ratio as an indication of our financial leverage in order to realize our Build and Buy strategy (please refer to section 1.2 of the present document for additional information on our Build and Buy strategy). The net debt to capitalization ratio increased to 22.9% in Fiscal 2019 from 19.2% in Fiscal 2018. The change in the net debt to capitalization ratio was mostly due to an increase in long-term debt following the investment in our business acquisitions and in the purchase for cancellation of class A shares.
ROE is a measure of the return we are generating for our shareholders. ROE increased to 18.5% in Q4 2019 from 17.3% in Fiscal 2018. The increase was mainly due to higher net earnings over the last four quarters and the purchase for cancellation of class A shares.
ROIC is a measure of the Company’s efficiency in allocating the capital under our control to profitable investments. The return on invested capital ratio increased to 15.1% in Fiscal 2019 from 14.5% in Fiscal 2018. The improvement in the ROIC was mainly the result of our higher net earnings excluding net finance costsafter-tax over the last four quarters.
DSO decreased to 50 days at the end of Fiscal 2019 when compared to 52 days in Fiscal 2018. In calculating the DSO, we subtract the deferred revenue balance from trade accounts receivable and work in progress; for that reason, the timing of payments received from managed IT and business process services clients in advance of the work to be performed and the timing of payments related to project milestones can affect the DSO. The Company maintains a target DSO of 45 days.
4.6.OFF-BALANCE SHEET FINANCING AND GUARANTEES
In the normal course of operations, CGI usesoff-balance sheet financing for a variety of transactions such as operating leases for office space, computer equipment and vehicles. From time to time, we also enter into agreements to provide financial or performance assurances to third parties on the sale of assets, business divestitures and guarantees on government and commercial contracts.
In connection with sales of assets and business divestitures, we may be required to pay counterparties for costs and losses incurred as a result of breaches in our contractual obligations, representations and warranties, intellectual property right infringement and litigation against counterparties, among others. While some of the agreements specify a maximum potential exposure of approximately $8.9 million, others do not specify a maximum amount or limited period. It is not possible to reasonably estimate the maximum amount that may have to be paid under such guarantees. The amounts are dependent upon the outcome of future contingent events, the nature and likelihood of which cannot be determined at this time. The Company does not expect to incur any potential payment in connection with these guarantees that could have a materially adverse effect on its audited consolidated financial statements.
In the normal course of business, we may provide certain clients, principally governmental entities, with bid and performance bonds. In general, we would only be liable for the amount of the bid bonds if we refuse to perform the project once we are
31
|
MANAGEMENT’S DISCUSSION AND ANALYSIS
awarded the bid. We would also be liable for the performance bonds in the event of a default in the performance of our obligations. As at September 30, 2019, we had committed a total of $33.7 million for these bonds. To the best of our knowledge, we complied with our performance obligations under all service contracts for which there was a performance or bid bond, and the ultimate liability, if any, incurred in connection with these guarantees would not have a material adverse effect on our consolidated results of operations or financial condition.
4.7. CAPABILITY TO DELIVER RESULTS
The Company has sufficient capital resources coming from its cash provided by operating activities, credit facilities, long-term debt agreements and invested capital from shareholders to support ongoing business operations and execute the Build and Buy growth strategy. Our principal and most accretive uses of cash are: to invest in our business (procuring new large managed IT and business process services and managed services contracts and developing business and IP solutions); to pursue accretive acquisitions; to purchase for cancellation Class A Shares and pay down debt. In terms of financing, we are well positioned to continue executing our four-pillar growth strategy in Fiscal 2020.
To successfully implement the Company’s strategy, CGI relies on a strong leadership team, supported by highly knowledgeable members with relevant relationships and significant experience in both IT and our targeted industries. CGI fosters leadership development through the CGI Leadership Institute ensuring continuity and knowledge transfer across the organization. For key positions, a detailed succession plan is established and revised frequently.
As a Company built on human capital, our professionals and their knowledge are critical to delivering quality service to our clients. Our human resources program allows us to attract and retain the best talent as it provides competitive compensation and benefits, a favourable working environment, training programs and career development opportunities. Employee satisfaction is monitored annually through a Company-wide survey. Also, a majority of our consultants and professionals are owners of CGI through our Share Purchase Plan which, along with the Profit Participation Plan, allow them to share Company successes, further aligning stakeholders interests.
In addition to capital resources and talent, CGI has established the Management Foundation encompassing governance policies, organizational model and sophisticated management frameworks for its business units and corporate processes. This robust governance model, provides a common business language for managing all operations consistently across the globe, driving a focus on continuous improvement. CGI’s operations maintain appropriate certifications in accordance with service requirements such as the ISO and the Capability Maturity Model Integration (CMMI) certification programs.
32
|
| FISCAL 2019 RESULTS | |
| 5. | Fourth Quarter Results (Unaudited) |
5.1. BOOKINGS ANDBOOK-TO-BILL RATIO
Bookings for the quarter ended September 30, 2019 were $3.4 billion representing abook-to-bill ratio of 115.2%. The breakdown of the new bookings signed during the quarter is as follows:
|
|
|
| |||||||||||||||||||||||||||||||||||||||
Contract Type
|
| Service Type
|
| Segment |
| Vertical Market |
| |||||||||||||||||||||||||||||||||||
| A. | Extensions, renewals andadd-ons | 80 % | A. | Managed IT and Business Process Services | 53 % | A. | U.S. Commercial and State Government | 29 % | A. | Government | 31 % | |||||||||||||||||||||||||||||||
| B. | New business | 20 % | B. | U.S. Federal | 17 % | B. | Financial Services | 24 % | ||||||||||||||||||||||||||||||||||
| B. | System integration and consulting | 47 % | C. | Northern Europe | 12 % | C. | MRD | 20 % | ||||||||||||||||||||||||||||||||||
| D. | Western and Southern Europe | 12 % | D | Health | 16 % | |||||||||||||||||||||||||||||||||||||
| E. | U.K. and Australia | 11 % | E | Communication & Utilities | 9 % | |||||||||||||||||||||||||||||||||||||
| F. | Canada | 10 % | ||||||||||||||||||||||||||||||||||||||||
| G. | Central and Eastern | 9 % | ||||||||||||||||||||||||||||||||||||||||
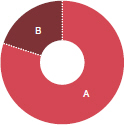
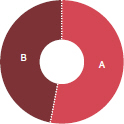

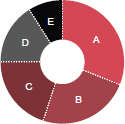
Information regarding our bookings is a key indicator of the volume of our business over time. However, due to the timing and transition period associated with managed IT and business process services contracts, the realization of revenue related to these bookings may fluctuate from period to period. The values initially booked may change over time due to their variable attributes, including demand-driven usage, modifications in the scope of work to be performed caused by changes in client requirements as well as termination clauses at the option of the client. As such, information regarding our bookings is not comparable to, nor should it be substituted for, an analysis of our revenue. Management however believes that it is a key indicator of potential future revenue.
The following table provides a summary of the bookings andbook-to-bill ratio by segment:
| In thousands of CAD except for percentages | Bookings for the three September 30, 2019
| Bookings for the year 2019
| Book-to-bill ratio for the year ended
| |||||||||
Total CGI | 3,409,260 | 12,646,027 | 104.4% | |||||||||
Western and Southern Europe | 409,670 | 2,057,093 | 101.5% | |||||||||
Northern Europe | 426,818 | 2,254,359 | 113.8% | |||||||||
Canada | 331,530 | 1,556,634 | 82.9% | |||||||||
U.S. Commercial and State Government | 997,657 | 2,436,044 | 133.1% | |||||||||
U.S. Federal | 574,875 | 1,545,255 | 93.9% | |||||||||
U.K. and Australia | 370,463 | 1,466,935 | 94.0% | |||||||||
Central and Eastern Europe | 298,247 | 1,329,707 | 111.7% | |||||||||
33
|
MANAGEMENT’S DISCUSSION AND ANALYSIS
5.2. FOREIGN EXCHANGE
The Company operates globally and is exposed to changes in foreign currency rates. Accordingly, as prescribed by IFRS, we value assets, liabilities and transactions that are measured in foreign currencies using various exchange rates. We report all dollar amounts in Canadian dollars.
Average foreign exchange rates
For the three months ended September 30, | 2019 | 2018 | Change | |||||||||
U.S. dollar | 1.3205 | 1.3072 | 1.0% | |||||||||
Euro | 1.4689 | 1.5204 | (3.4% | ) | ||||||||
Indian rupee | 0.0188 | 0.0187 | 0.5% | |||||||||
British pound | 1.6285 | 1.7035 | (4.4% | ) | ||||||||
Swedish krona | 0.1378 | 0.1462 | (5.7% | ) | ||||||||
34
|
| FISCAL 2019 RESULTS | |
5.3. REVENUE DISTRIBUTION
The following charts provide additional information regarding our revenue mix for the quarter ended September 30, 2019:
|
|
| ||||||||||||||||||||
Service Type
| Client Geography
| Vertical Market
|
| |||||||||||||||||||
A. | Managed IT and Business Process Services | 54% | A. | U.S. | 30% | A. | Government | 33% | ||||||||||||||
B. | System integration and consulting | 46% | B. | Canada | 15% | B. | MRD | 24% | ||||||||||||||
C. | France | 14% | C. | Financial services | 22% | |||||||||||||||||
D. | U.K. | 12% | D. | Communications & utilities | 14% | |||||||||||||||||
E. | Sweden | 7% | E. | Health | 7% | |||||||||||||||||
F. | Finland | 6% | ||||||||||||||||||||
G. | Rest of the world | 16% | ||||||||||||||||||||
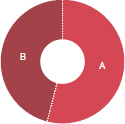
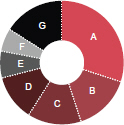
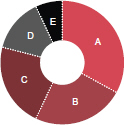
5.3.1. Client Concentration
IFRS guidance on segment disclosures defines a single customer as a group of entities that are known to the reporting entity to be under common control. As a consequence, our work for the U.S. federal government including its various agencies represented 13.7% of our revenue for Q4 2019 as compared to 12.0% for Q4 2018.
35
|
MANAGEMENT’S DISCUSSION AND ANALYSIS
5.4. REVENUE BY SEGMENT
The following table provides a summary of the year-over-year changes in our revenue, in total and by segment, separately showing the impacts of foreign currency exchange rate variations between the Q4 2019 and Q4 2018 periods. The Q4 2018 revenue by segment was recorded reflecting the actual average foreign exchange rates for that period. The foreign exchange impact is the difference between the current period’s actual results and the current period’s results converted with the prior year’s average foreign exchange rates.
| Change | ||||||||||||||||
For the three months ended September 30,
|
| 2019
|
|
| 2018
|
|
| $
|
|
| %
|
| ||||
In thousands of CAD except for percentages | ||||||||||||||||
Total CGI revenue | 2,959,230 | 2,798,960 | 160,270 | 5.7% | ||||||||||||
Variation prior to foreign currency impact | 7.7% | |||||||||||||||
Foreign currency impact | (2.0% | ) | ||||||||||||||
Variation over previous period | 5.7% | |||||||||||||||
Western and Southern Europe | ||||||||||||||||
Revenue prior to foreign currency impact | 491,570 | 475,026 | 16,544 | 3.5% | ||||||||||||
Foreign currency impact | (17,331 | ) | ||||||||||||||
Western and Southern Europe | 474,239 | 475,026 | (787 | ) | (0.2% | ) | ||||||||||
Northern Europe | ||||||||||||||||
Revenue prior to foreign currency impact | 456,931 | 396,369 | 60,562 | 15.3% | ||||||||||||
Foreign currency impact | (22,134 | ) | ||||||||||||||
Northern Europe | 434,797 | 396,369 | 38,428 | 9.7% | ||||||||||||
Canada | ||||||||||||||||
Revenue prior to foreign currency impact | 415,885 | 418,254 | (2,369 | ) | (0.6% | ) | ||||||||||
Foreign currency impact | (132 | ) | ||||||||||||||
Canada | 415,753 | 418,254 | (2,501 | ) | (0.6% | ) | ||||||||||
U.S. Commercial and State Government | ||||||||||||||||
Revenue prior to foreign currency impact | 435,093 | 427,007 | 8,086 | 1.9% | ||||||||||||
Foreign currency impact | 4,145 | |||||||||||||||
U.S. Commercial and State Government revenue | 439,238 | 427,007 | 12,231 | 2.9% | ||||||||||||
U.S. Federal | ||||||||||||||||
Revenue prior to foreign currency impact | 418,124 | 353,686 | 64,438 | 18.2% | ||||||||||||
Foreign currency impact | 4,307 | |||||||||||||||
U.S. Federal revenue | 422,431 | 353,686 | 68,745 | 19.4% | ||||||||||||
U.K. and Australia | ||||||||||||||||
Revenue prior to foreign currency impact | 352,373 | 337,028 | 15,345 | 4.6% | ||||||||||||
Foreign currency impact | (15,818 | ) | ||||||||||||||
U.K. and Australia revenue | 336,555 | 337,028 | (473 | ) | (0.1% | ) | ||||||||||
Central and Eastern Europe | ||||||||||||||||
Revenue prior to foreign currency impact | 302,885 | 259,141 | 43,744 | 16.9% | ||||||||||||
Foreign currency impact | (10,711 | ) | ||||||||||||||
Central and Eastern Europe revenue | 292,174 | 259,141 | 33,033 | 12.7% | ||||||||||||
Asia Pacific | ||||||||||||||||
Revenue prior to foreign currency impact | 145,784 | 132,449 | 13,335 | 10.1% | ||||||||||||
Foreign currency impact | (1,741 | ) | ||||||||||||||
Asia Pacific revenue | 144,043 | 132,449 | 11,594 | 8.8% | ||||||||||||
We ended the fourth quarter of Fiscal 2019 with revenue of $2,959.2 million, an increase of $160.3 million, or 5.7% when compared to the same period of Fiscal 2018. On a constant currency basis, revenue increased by $216.6 million or 7.7%. Foreign currency rate fluctuations unfavourably impacted our revenue by $56.3 million or 2.1%. The increase in revenue was mainly due to organic growth across most of our segments and recent business acquisitions.
36
|
| FISCAL 2019 RESULTS | |
5.4.1. Western and Southern Europe
Revenue in our Western and Southern Europe segment was $474.2 million in Q4 2019, a decrease of $0.8 million or 0.2% over the same period last year. On a constant currency basis, revenue increased by 16.5 million or 3.5%. The increase in revenue was the result of organic growth in France across most vertical markets, predominantly in MRD.
On a client geographic basis, the top two Western and Southern Europe vertical markets were MRD and financial services, generating combined revenues of approximately $304 million for the three months ended September 30, 2019.
5.4.2. Northern Europe
Revenue in our Northern Europe segment was $434.8 million in Q4 2019, an increase of $38.4 million or 9.7% over the same period last year. On a constant currency basis, revenue increased by $60.6 million or 15.3%. The increase was mainly driven by the Acando acquisition and higher system integration and consulting services in Finland.
On a client geographic basis, the top two Northern Europe vertical markets were MRD and government, generating combined revenues of approximately $296 million for the three months ended September 30, 2019.
5.4.3. Canada
Revenue in our Canada segment was $415.8 million in Q4 2019, a decrease of $2.5 million or 0.6% over the same period last year, and essentially the same on a constant currency basis. The change in revenue was primarily due to completed projects and lower work volumes within the communication & utilities and MRD vertical markets. This was in part offset by higher IP license sales and related services, as well as organic growth within the financial services vertical market. On a client geographic basis, the top two Canada vertical markets were financial services and MRD, generating combined revenues of approximately $287 million for the three months ended September 30, 2019.
5.4.4. U.S. Commercial and State Government
Revenue from our U.S. Commercial and State Government segment was $439.2 million in Q4 2019, an increase of $12.2 million or 2.9% compared to the same period last year. On a constant currency basis, revenue increased by $8.1 million or 1.9%. The increase was mainly driven by organic growth within the government and financial services vertical markets. On a client geographic basis, the top two U.S. Commercial and State Government vertical markets were financial services and government, generating combined revenues of approximately $276 million for the three months ended September 30, 2019.
5.4.5. U.S. Federal
Revenue in our U.S. Federal segment was $422.4 million in Q4 2019, an increase of $68.7 million or 19.4% over the same period last year. On a constant currency basis, revenue increased by $64.4 million or 18.2%. The increase was driven by new business mainly related to our IP solutions, application support and cybersecurity services and to a lesser extent an unfavourable work in progress adjustment taken on a contract in Q4 2018.
For the three months ended September 30, 2019, 80% of revenues within the U.S. Federal segment were federal civilian based.
5.4.6. U.K. and Australia
Revenue in our U.K. and Australia segment was $336.6 million in Q4 2019, a decrease of $0.5 million or 0.1% over the same period last year. On a constant currency basis, revenue increased by $15.3 million or 4.6%. The increase was mainly driven by organic growth within the government vertical market and higher IP license sales and solution revenue within the financial services vertical market. This was partly offset by the completion of projects primarily in the MRD vertical market.
On a client geographic basis, the top two U.K. and Australia vertical markets were government and communications & utilities, generating combined revenues of approximately $258 million for the three months ended September 30, 2019, respectively.
37
|
MANAGEMENT’S DISCUSSION AND ANALYSIS
5.4.7. Central and Eastern Europe
Revenue in our Central and Eastern Europe segment was $292.2 million in Q4 2019, an increase of $33.0 million or 12.7% over the same period last year. On a constant currency basis, revenue increased by $43.7 million or 16.9%. The increase was mainly driven by recent acquisitions and organic growth in Germany and the Netherlands, primarily within the MRD and government vertical markets.
On a client geographic basis, the top two Central and Eastern Europe vertical markets were MRD and communications & utilities, generating combined revenues of approximately $196 million for the three months ended September 30, 2019.
5.4.8. Asia Pacific
Revenue in our Asia Pacific segment was $144.0 million in Q4 2019, an increase of $11.6 million or 8.8% over the same period last year. On a constant currency basis, revenue increased by $13.3 million or 10.1%. The increase is mainly driven by the continued demand for our offshore delivery centers, predominantly within financial services and MRD vertical markets.
38
|
| FISCAL 2019 RESULTS | |
5.5. ADJUSTED EBIT BY SEGMENT
| Change | ||||||||||||||||
For the three months ended September 30,
| 2019
| 2018
| $
| %
| ||||||||||||
In thousands of CAD except for percentages | ||||||||||||||||
Western and Southern Europe | 73,100 | 58,638 | 14,462 | 24.7% | ||||||||||||
As a percentage of segment revenue | 15.4% | 12.3% | ||||||||||||||
Northern Europe | 44,721 | 49,868 | (5,147 | ) | (10.3% | ) | ||||||||||
As a percentage of segment revenue | 10.3% | 12.6% | ||||||||||||||
Canada | 99,228 | 92,358 | 6,870 | 7.4% | ||||||||||||
As a percentage of segment revenue | 23.9% | 22.1% | ||||||||||||||
U.S. Commercial and State Government | 66,839 | 85,388 | (18,549 | ) | (21.7% | ) | ||||||||||
As a percentage of segment revenue | 15.2% | 20.0% | ||||||||||||||
U.S. Federal | 60,249 | 45,394 | 14,855 | 32.7% | ||||||||||||
As a percentage of segment revenue | 14.3% | 12.8% | ||||||||||||||
U.K. and Australia | 42,601 | 42,938 | (337 | ) | (0.8% | ) | ||||||||||
As a percentage of segment revenue | 12.7% | 12.7% | ||||||||||||||
Central and Eastern Europe | 30,478 | 27,236 | 3,242 | 11.9% | ||||||||||||
As a percentage of segment revenue | 10.4% | 10.5% | ||||||||||||||
Asia Pacific | 40,241 | 33,912 | 6,329 | 18.7% | ||||||||||||
As a percentage of segment revenue | 27.9% | 25.6% | ||||||||||||||
Adjusted EBIT | 457,457 | 435,732 | 21,725 | 5.0% | ||||||||||||
Adjusted EBIT margin
|
| 15.5%
|
|
| 15.6%
|
| ||||||||||
Adjusted EBIT for the quarter was $457.5 million an increase of $21.7 million or 5.0% from Q4 2018. The adjusted EBIT margin remained essentially stable at 15.5% as the impact of organic growth described in the revenue section compensated for the favourable impact from additional R&D tax credits in Q4 2018.
5.5.1. Western and Southern Europe
Adjusted EBIT in the Western and Southern Europe segment was $73.1 million in Q4 2019, an increase of $14.5 million when compared to Q4 2018. Adjusted EBIT margin increased to 15.4% from 12.3% in Q4 2018, primarily due to the impact of organic growth in France and additional R&D tax credits.
5.5.2. Northern Europe
Adjusted EBIT in the Northern Europe segment was $44.7 million in Q4 2019, a decrease of $5.1 million when compared to Q4 2018. Adjusted EBIT margin decreased to 10.3% from 12.6% in Q4 2018. The change in adjusted EBIT margin was mainly driven by the temporary effects of both the dilutive impact of the Acando acquisition, as well as excess capacity in our Swedish infrastructure business. This was partly offset by improved utilization in Finland.
5.5.3. Canada
Adjusted EBIT in the Canada segment was $99.2 million in Q4 2019, an increase of $6.9 million when compared to Q4 2018. Adjusted EBIT margin increased to 23.9% from 22.1% in Q4 2018. The increase in adjusted EBIT margin was mainly due to higher IP license sales and related services within the financial services vertical market and the adjustments in performance based compensation accruals. This was partly offset by the slowdown of projects and lower work volumes within the communications & utilities vertical market.
5.5.4. U.S. Commercial and State Government
Adjusted EBIT in the U.S. Commercial and State Government segment was $66.8 million in Q4 2019, a decrease of $18.5 million when compared to Q4 2018. Adjusted EBIT margin decreased to 15.2% from 20.0% in Q4 2018. The change in adjusted EBIT margin was mainly due to the favourable impact from additional R&D tax credits in Q4 2018.
39
|
MANAGEMENT’S DISCUSSION AND ANALYSIS
5.5.5. U.S. Federal
Adjusted EBIT in the U.S. Federal segment was $60.2 million in Q4 2019, an increase of $14.9 million when compared to Q4 2018. Adjusted EBIT margin increased to 14.3% from 12.8% in Q4 2018. This increase was primarily due to the unfavourable work in progress adjustment taken on a contract in Q4 2018, in part offset by the adjustment in performance based compensation accruals.
5.5.6. U.K. and Australia
Adjusted EBIT in the U.K. and Australia segment was $42.6 million in Q4 2019, a decrease of $0.3 million when compared to Q4 2018. Adjusted EBIT margin was essentially stable as an improved business mix combined with lower costs compensated for an unfavourable adjustment on a client contract.
5.5.7. Central and Eastern Europe
Adjusted EBIT in the Central and Eastern Europe segment was $30.5 million in Q4 2019, an increase of $3.2 million when compared to Q4 2018. Adjusted EBIT margin was essentially stable as improved profitability in the Netherlands compensated for lower demand from a financial services client.
5.5.8. Asia Pacific
Adjusted EBIT in the Asia Pacific segment was 40.2 million in Q4 2019, an increase of $6.3 million when compared to Q4 2018, while the adjusted EBIT margin increased to 27.9% from 25.6% Q4 2018. The increase in adjusted EBIT margin was mostly due to productivity improvements and automation efforts, as well as the favourable impact of our currency forward contracts.
40
|
| FISCAL 2019 RESULTS | |
5.6. NET EARNINGS AND EARNINGS PER SHARE
The following table sets out the information supporting the earnings per share calculations:
| Change | ||||||||||||||||
| For the three months ended September 30, | 2019 | 2018 | $ | % | ||||||||||||
In thousands of CAD except for percentage and shares data | ||||||||||||||||
Adjusted EBIT | 457,457 | 435,732 | 21,725 | 5.0% | ||||||||||||
Minus the following items: | ||||||||||||||||
Acquisition-related and integration costs | 27,291 | 2,089 | 25,202 | 1,206.4% | ||||||||||||
Restructuring costs | — | 20,082 | (20,082 | ) | (100.0% | ) | ||||||||||
Net finance costs
|
| 17,824
|
|
| 20,782
|
|
| (2,958
| )
|
| (14.2%
| )
| ||||
Earnings before income taxes | 412,342 | 392,779 | 19,563 | 5.0% | ||||||||||||
Income tax expense | 88,253 | 99,294 | (11,041 | ) | (11.1% | ) | ||||||||||
Effective tax rate
|
| 21.4%
|
|
| 25.3%
|
| ||||||||||
Net earnings | 324,089 | 293,485 | 30,604 | 10.4% | ||||||||||||
Margin | 11.0% | 10.5% | ||||||||||||||
Weighted average number of shares | ||||||||||||||||
Class A subordinate voting shares and Class B multiple voting shares (basic) | 268,135,727 | 279,415,304 | (4.0% | ) | ||||||||||||
Class A subordinate voting shares and Class B multiple voting shares (diluted) | 273,090,564 | 284,531,000 | (4.0% | ) | ||||||||||||
Earnings per share (in dollars) | ||||||||||||||||
Basic EPS | 1.21 | 1.05 | 0.16 | 15.2% | ||||||||||||
Diluted EPS
|
| 1.19
|
|
| 1.03
|
|
| 0.16
|
|
| 15.5%
|
| ||||
For the current quarter, the increase in earnings before income taxes was mainly due to revenue growth.
For Q4 2019, the income tax expense was $88.3 million compared to $99.3 million for the same period last year, while our effective tax rate decreased to 21.4% from 25.3%. During the quarter ended September 30, 2019, the Company settled with the German tax authorities and booked $115.5 million of additional corporate tax losses and recorded a $18.5 million income tax recovery. When excluding that tax adjustment and tax effects from acquisition-related and integration costs and restructuring costs, the effective tax rate would have been 25.1% in Q4 2019 compared to 25.3% in Q4 2018. The decrease in the effective tax rate was mainly attributable to a corporate tax rate reduction in India.
During the quarter, 1,053,300 Class A subordinate voting shares were purchased for cancellation while 522,894 stock options were exercised.
41
|
MANAGEMENT’S DISCUSSION AND ANALYSIS
5.6.1. Net Earnings and Earnings per Share Excluding Specific Items
Below is a table showing the year-over-year comparison excluding specific items, namely acquisition-related and integration costs as well as restructuring costs :
| Change | ||||||||||||||||
For the three months ended September 30,
| 2019
| 2018
| $
| %
| ||||||||||||
In thousands of CAD except for percentage and shares data | ||||||||||||||||
Earnings before income taxes | 412,342 | 392,779 | 19,563 | 5.0% | ||||||||||||
Add back: | ||||||||||||||||
Acquisition-related and integration costs | 27,291 | 2,089 | 25,202 | 1,206.4% | ||||||||||||
Restructuring costs
|
| —
|
|
| 20,082
|
|
| (20,082
| )
|
| (100.0%
| )
| ||||
Earnings before income taxes excluding specific items | 439,633 | 414,950 | 24,683 | 5.9% | ||||||||||||
Income tax expense | 88,253 | 99,294 | (11,041 | ) | (11.1% | ) | ||||||||||
Add back: | ||||||||||||||||
Tax deduction on acquisition-related and integration costs | 3,467 | 448 | 3,019 | 673.9% | ||||||||||||
Tax deduction on restructuring costs | — | 5,364 | (5,364 | ) | (100.0% | ) | ||||||||||
Tax adjustment
|
| 18,451
|
|
| —
|
|
| —
|
|
| —
|
| ||||
Income tax expense excluding specific items | 110,171 | 105,106 | 5,065 | 4.8% | ||||||||||||
Effective tax rate excluding specific items | 25.1% | 25.3% | ||||||||||||||
| ||||||||||||||||
Net earnings excluding specific items | 329,462 | 309,844 | 19,618 | 6.3% | ||||||||||||
Net earnings excluding specific items margin | 11.1% | 11.1% | ||||||||||||||
Weighted average number of shares outstanding | ||||||||||||||||
Class A subordinate voting shares and Class B multiple voting shares (basic) | 268,135,727 | 279,415,304 | (4.0% | ) | ||||||||||||
Class A subordinate voting shares and Class B multiple voting shares (diluted) | 273,090,564 | 284,531,000 | (4.0% | ) | ||||||||||||
Earnings per share excluding specific items (in dollars) | ||||||||||||||||
Basic EPS | 1.23 | 1.11 | 0.12 | 10.8% | ||||||||||||
Diluted EPS
|
| 1.21
|
|
| 1.09
|
|
| 0.12
|
|
| 11.0%
|
| ||||
42
|
| FISCAL 2019 RESULTS | |
5.7. CONSOLIDATED STATEMENTS OF CASH FLOWS
As at September 30, 2019, cash and cash equivalents were $213.8 million. The following table provides a summary of the generation and use of cash and cash equivalents for the quarters ended September 30, 2019 and 2018.
For the three months ended September 30,
| 2019
| 2018
| Change
| |||||||||
In thousands of CAD | ||||||||||||
Cash provided by operating activities | 405,214 | 340,363 | 64,851 | |||||||||
Cash used in investing activities | (94,730 | ) | (76,826 | ) | (17,904 | ) | ||||||
Cash used in financing activities | (307,835 | ) | (226,120 | ) | (81,715 | ) | ||||||
Effect of foreign exchange rate changes on cash and cash equivalents
|
| (13,969
| )
|
| (24,422
| )
|
| 10,453
|
| |||
Net (decrease) increase in cash and cash equivalents
|
| (11,320
| )
|
| 12,995
|
|
| (24,315
| )
| |||
5.7.1. Cash Provided by Operating Activities
For Q4 2019, cash provided by operating activities was $405.2 million compared to $340.4 million in Q4 2018, or 13.7% of revenue compared to 12.2% last year.
The following table provides a summary of the generation and use of cash from operating activities.
For the three months ended September 30,
| 2019
| 2018
| Change
| |||||||||
In thousands of CAD | ||||||||||||
Net earnings | 324,089 | 293,485 | 30,604 | |||||||||
Amortization and depreciation | 97,155 | 101,471 | (4,316 | ) | ||||||||
Other adjustments1 | 6,971 | 25,283 | (18,312 | ) | ||||||||
Cash flow from operating activities before net change innon-cash working capital items | 428,215 | 420,239 | 7,976 | |||||||||
Net change innon-cash working capital items: | ||||||||||||
Accounts receivable, work in progress and deferred revenue | 74,308 | (13,106 | ) | 87,414 | ||||||||
Accounts payable and accrued liabilities, accrued compensation, provisions and long-term liabilities | (63,567 | ) | (79,057 | ) | 15,490 | |||||||
Other2 | (33,742 | ) | 12,287 | (46,029 | ) | |||||||
Net change innon-cash working capital items
|
| (23,001
| )
|
| (79,876
| )
|
| 56,875
|
| |||
Cash provided by operating activities
|
| 405,214
|
|
| 340,363
|
|
| 64,851
|
| |||
| 1 | Other adjustments are comprised of deferred income taxes, foreign exchange loss (gain) and share-based payment costs. |
| 2 | Comprised of prepaid expenses and other assets, long-term financial assets, retirement benefits obligations, derivative financial instruments and income taxes. |
For the three months ended September 30, 2019, the $23.0 million of net change innon-cash working capital items was mostly due to the timing of accrued compensation mainly related to vacation, the timing of income tax payments, accounts payable and the timing of the collection of tax credits which was partially offset by the decrease in our DSO from 52 days in Q3 2019 to 50 days in Q4 2019 and the net decrease in prepaid expenses and other assets.
The timing of our working capital inflows and outflows will always have an impact on the cash flow from operations.
43
|
MANAGEMENT’S DISCUSSION AND ANALYSIS
5.7.2. Cash Used in Investing Activities
For Q4 2019, $94.7 million was used in investing activities while $76.8 million was used in the prior year.
The following table provides a summary of the generation and use of cash from investing activities:
For the three months ended September 30,
| 2019
| 2018
| Change
| |||||||||
In thousands of CAD | ||||||||||||
Business acquisitions | (14,876 | ) | 2,886 | (17,762 | ) | |||||||
Purchase of property, plant and equipment | (41,592 | ) | (42,367 | ) | 775 | |||||||
Additions to contract costs | (12,679 | ) | (16,746 | ) | 4,067 | |||||||
Additions to intangible assets | (26,421 | ) | (20,320 | ) | (6,101 | ) | ||||||
Net change in short-term investments and purchase of long-term investments
|
| 838
|
|
| (279
| )
|
| 1,117
|
| |||
Cash used in investing activities
|
| (94,730
| )
|
| (76,826
| )
|
| (17,904
| )
| |||
The increase of $17.9 million in cash used in investing activities during the three months ended September 30, 2019 was mainly due to the increase in cash used for an acquisition made in the quarter.
5.7.3. Cash Used in Financing Activities
For the three months ended September 30,
| 2019
| 2018
| Change
| |||||||||
In thousands of CAD | ||||||||||||
Net change in unsecured committed revolving credit facility | (95,119 | ) | 53,136 | (148,255 | ) | |||||||
Net change in long-term debt | (123,446 | ) | (71,882 | ) | (51,564 | ) | ||||||
| (218,565 | ) | (18,746 | ) | (199,819 | ) | |||||||
Repayment of debt assumed in a business acquisition | (767 | ) | — | (767 | ) | |||||||
Settlement of derivative financial instruments | 1,380 | (2,430 | ) | 3,810 | ||||||||
Purchase and cancellation of Class A subordinate voting shares held in trusts | (106,143 | ) | (215,616 | ) | 109,473 | |||||||
Issuance of Class A subordinate voting shares
|
| 16,260
|
|
| 10,672
|
|
| 5,588
|
| |||
Cash used in financing activities
|
| (307,835
| )
|
| (226,120
| )
|
| (81,715
| )
| |||
During Q4 2019, we used $123.4 million to reduce our outstanding long-term debt while, for the same period last year, $71.9 million was used. This was mainly driven by scheduled repayments on a Senior unsecured notes in the amount of $119.2 million. In addition, we repaid $95.1 million on the Company’s unsecured committed revolving credit facility during Q4 2019 while, for the same period last year, we drew $53.1 million.
During Q4 2019, we used $106.1 million to purchase Class A Shares for cancellation under the NCIB. For the same period last year, we used $215.6 million to purchase Class A Shares for cancellation under the NCIB.
In Q4 2019, we received $16.3 million in proceeds from the exercise of stock options, compared to $10.7 million during the same period last year.
44
|
| FISCAL 2019 RESULTS | |
6. Eight Quarter Summary (Unaudited)
As at and for the three months ended,
| Sep. 30,
| Jun. 30,
| Mar. 31,
| Dec. 31,
| Sep. 30,
| Jun. 30,
| Mar. 31,
| Dec. 31,
| ||||||||||||||||||||||||
In millions of CAD unless otherwise noted | ||||||||||||||||||||||||||||||||
Growth
| ||||||||||||||||||||||||||||||||
Revenue | 2,959.2 | 3,119.8 | 3,068.3 | 2,963.9 | 2,799.0 | 2,940.7 | 2,950.3 | 2,816.9 | ||||||||||||||||||||||||
Year-over-year revenue growth | 5.7% | 6.1% | 4.0% | 5.2% | 7.3% | 3.7% | 8.3% | 5.3% | ||||||||||||||||||||||||
Constant currency year-over-year revenue growth | 7.7% | 6.6% | 4.7% | 4.5% | 5.0% | 3.8% | 4.9% | 4.9% | ||||||||||||||||||||||||
Backlog | 22,611 | 22,418 | 22,947 | 23,338 | 22,577 | 22,407 | 22,049 | 21,110 | ||||||||||||||||||||||||
Bookings | 3,409 | 2,951 | 3,255 | 3,031 | 3,534 | 3,470 | 3,513 | 2,976 | ||||||||||||||||||||||||
Book-to-bill ratio | 115.2% | 94.6% | 106.1% | 102.3% | 126.2% | 118.0% | 119.1% | 105.7% | ||||||||||||||||||||||||
Book-to-bill ratio trailing twelve months |
| 104.4%
|
|
| 106.9%
|
|
| 112.9%
|
|
| 116.3%
|
|
| 117.3%
|
|
| 113.8%
|
|
| 107.7%
|
|
| 102.8%
|
| ||||||||
Profitability
| ||||||||||||||||||||||||||||||||
Adjusted EBIT | 457.5 | 474.2 | 454.1 | 439.2 | 435.7 | 435.3 | 424.4 | 406.3 | ||||||||||||||||||||||||
Adjusted EBIT margin | 15.5% | 15.2% | 14.8% | 14.8% | 15.6% | 14.8% | 14.4% | 14.4% | ||||||||||||||||||||||||
Net earnings | 324.1 | 309.4 | 318.3 | 311.5 | 293.5 | 288.3 | 274.4 | 285.3 | ||||||||||||||||||||||||
Net earnings margin | 11.0% | 9.9% | 10.4% | 10.5% | 10.5% | 9.8% | 9.3% | 10.1% | ||||||||||||||||||||||||
Diluted EPS (in dollars) | 1.19 | 1.12 | 1.14 | 1.11 | 1.03 | 1.00 | 0.94 | 0.98 | ||||||||||||||||||||||||
Net earnings excluding specific items | 329.5 | 337.2 | 324.5 | 314.7 | 309.8 | 309.7 | 303.2 | 288.0 | ||||||||||||||||||||||||
Net earnings margin excluding specific items | 11.1% | 10.8% | 10.6% | 10.6% | 11.1% | 10.5% | 10.3% | 10.2% | ||||||||||||||||||||||||
Diluted EPS excluding specific items (in dollars) |
| 1.21
|
|
| 1.22
|
|
| 1.17
|
|
| 1.12
|
|
| 1.09
|
|
| 1.08
|
|
| 1.04
|
|
| 0.99
|
| ||||||||
Liquidity
| ||||||||||||||||||||||||||||||||
Cash provided by operating activities | 405.2 | 375.2 | 462.0 | 391.5 | 340.4 | 317.3 | 425.7 | 410.1 | ||||||||||||||||||||||||
As a % of revenue | 13.7% | 12.0% | 15.1% | 13.2% | 12.2% | 10.8% | 14.4% | 14.6% | ||||||||||||||||||||||||
Days sales outstanding
|
| 50
|
|
| 52
|
|
| 49
|
|
| 54
|
|
| 52
|
|
| 50
|
|
| 46
|
|
| 47
|
| ||||||||
Capital structure
| ||||||||||||||||||||||||||||||||
Net debt | 2,117.2 | 2,336.1 | 1,597.3 | 1,738.7 | 1,640.8 | 1,685.2 | 1,525.9 | 1,635.0 | ||||||||||||||||||||||||
Net debt to capitalization ratio | 22.9% | 25.2% | 17.4% | 19.1% | 19.2% | 19.6% | 17.5% | 19.3% | ||||||||||||||||||||||||
Return on equity | 18.5% | 18.1% | 17.7% | 17.3% | 17.3% | 16.0% | 16.0% | 16.2% | ||||||||||||||||||||||||
Return on invested capital
|
| 15.1%
|
|
| 15.0%
|
|
| 14.9%
|
|
| 14.5%
|
|
| 14.5%
|
|
| 13.5%
|
|
| 13.5%
|
|
| 13.7%
|
| ||||||||
Balance sheet
| ||||||||||||||||||||||||||||||||
Cash and cash equivalents, and short-term investments | 223.7 | 225.2 | 544.0 | 406.1 | 184.1 | 171.1 | 287.5 | 238.9 | ||||||||||||||||||||||||
Total assets | 12,621.7 | 12,813.9 | 12,709.4 | 12,872.5 | 11,919.1 | 12,155.0 | 12,363.7 | 11,957.5 | ||||||||||||||||||||||||
Long-term financial liabilities1
|
| 2,236.0
|
|
| 2,421.3
|
|
| 2,007.3
|
|
| 2,070.9
|
|
| 1,530.1
|
|
| 1,615.7
|
|
| 1,578.9
|
|
| 1,588.3
|
| ||||||||
| 1 | Long-term financial liabilities include the long-term portion of the debt and the long-term derivative financial instruments. |
There are factors causing quarterly variances which may not be reflective of the Company’s future performance. First, there is seasonality in system integration and consulting work, and the quarterly performance of these operations is impacted by occurrences such as vacations and the number of statutory holidays in any given quarter. Managed IT and business process services contracts are affected to a lesser extent by seasonality. Second, the workflow from some clients may fluctuate from quarter to quarter based on their business cycle and the seasonality of their own operations. Third, the savings that we generate for a client on a given managed IT and business process services contract may temporarily reduce our revenue stream from this client, as these savings may not be immediately offset by additional work performed for this client.
Cash flow from operating activities could vary significantly from quarter to quarter depending on the timing of monthly payments received from large clients, cash requirements associated with large acquisitions, managed IT and business process services contracts and projects, the timing of the reimbursements for various tax credits as well as profit sharing payments to members and the timing of restructuring cost payments.
45
|
MANAGEMENT’S DISCUSSION AND ANALYSIS
Foreign exchange fluctuations can also contribute to quarterly variances as our percentage of operations in foreign countries evolves. The effect from these variances is primarily on our revenue and to a much lesser extent, on our margin as we benefit, as much as possible, from natural hedges.
46
|
| FISCAL 2019 RESULTS | |
7. Changes in Accounting Policies
The audited consolidated financial statements for the year ended September 30, 2019 include all adjustments that CGI’s management considers necessary for the fair presentation of its financial position, results of operations, and cash flows.
ADOPTION OF ACCOUNTING STANDARDS
The following standards have been adopted by the Company on October 1, 2018:
IFRS 15 - Revenue from Contracts with Customers
In May 2014, the IASB issued IFRS 15, Revenue from Contracts with Customers, to specify how and when to recognize revenue as well as requiring the provision of more informative and relevant disclosures. The standard supersedes IAS 18, Revenue, IAS 11, Construction Contracts, and other revenue related interpretations.
IFRS 15 was adopted by the Company using the modified retrospective method, with no restatement of comparative figures.
The main changes to the accounting policies disclosed in the audited consolidated financial statements of the Company for the year ended September 30, 2019 are as follows:
– Initial implementation activities of managed IT and business process services arrangements, previously not considered as a separately identifiable component, could be in some cases identified as a separate performance obligation if they meet the criteria of being distinct under IFRS 15 resulting in acceleration of revenue recognition and related contract costs.
– Previously, when a software license had value to the client on a stand-alone basis and was identified as a separately identifiable component, revenue from the software license was recognized upon delivery. Under IFRS 15, when the arrangement involves significant customization services, revenue from a software license is now combined with the services resulting in deferral of revenue recognition.
– The Company changed its presentation of work in progress and deferred revenue which are now presented net on a contract-by-contract basis separately from accounts receivable and no longer for each project as it was previously the case for systems integration and consulting services arrangements.
– IFRS 15 indicates that IAS 37,Provisions, Contingent Liabilities and Contingent Assets, should now be applied to estimated losses on revenue-generating contracts. Therefore, related amounts previously classified as accounts payable and accrued liabilities and other long-term liabilities are now classified as current and non-current provisions.
– IFRS 15 requires additional disclosures such as information on disaggregation of revenue from contracts with customers by geography, service type and major clients and on remaining performance obligations, which are respectively provided in Note 27, Segmented Information, and Note 21, Remaining performance obligations, of the audited consolidated financial statements for the year ended September 30, 2019.
The adoption of IFRS 15 did not have a material impact on the Company’s audited consolidated financial statements.
IFRS 9 - Financial instruments
In July 2014, the IASB amended IFRS 9,Financial Instruments, to replace IAS 39,Financial Instruments: Recognition and Measurement.
IFRS 9 was adopted retrospectively by the Company, with no restatement of comparative figures.
The main changes to the accounting policies disclosed in the audited consolidated financial statements of the Company for the year ended September 30, 2019 are as follows:
– The standard simplifies the classification of financial assets, while carrying forward most of the requirements of IAS 39. The Company’s financial assets previously classified as loans and receivables are now classified at amortized cost and continue to be measured as such. Financial assets previously classified as available-for-sale are now classified at fair value
47
|
MANAGEMENT’S DISCUSSION AND ANALYSIS
through other comprehensive income and continue to be measured as such. Other financial assets and derivatives that do not qualify for hedge accounting are still classified and measured at fair value through earnings. Financial liabilities previously classified as other liabilities are now classified at amortized cost and continue to be measured as such.
– The standard introduces a new impairment model which applies to the Company’s trade accounts receivable, work in progress, long-term receivables and long-term bonds. The Company is not subject to any significant credit risk, given its large and diversified client base and its risk mitigation strategy to invest in high credit quality corporate and government bonds with a credit rating of A or higher. The Company has applied the simplified approach on its accounts receivable, work in progress and long-term receivables and used the low credit risk exemption on its long-term bonds.
– Finally, IFRS 9 introduces a new hedge accounting model that is more closely aligned with risk-management activities. The Company had applied the new hedge accounting model and the existing hedge relationships continue to qualify for hedge accounting under this new model. The Company had elected to account for the forward element of the cross-currency swaps as costs of hedging. Accordingly, as of October 1, 2018, an amount of $26.0 million of deferred costs of hedging, net of accumulated tax recovery of $3.9 million, was recognized in a separate component of the accumulated other comprehensive income.
– The additional annual disclosures are provided in Note 30, Financial instruments, of the audited consolidated financial statements for the year ended September 30, 2019.
The adoption of IFRS 9 did not have a material impact on the Company’s audited consolidated financial statements.
FUTURE ACCOUNTING STANDARD CHANGE
The following standard has been issued but is not yet effective. The Company’s preliminary assessment is subject to change, as the Company is progressing in the assessment of the impact of this standard on its audited consolidated financial statements.
IFRS 16 - Leases
In January 2016, the IASB issued IFRS 16,Leases, to set out the principles for the recognition, measurement, presentation and disclosure of leases for both parties to a lease agreement. The standard supersedes IAS 17,Leases, and other leases related interpretations, eliminates the lessee’s classification of leases as either operating leases or finance leases and introduces a single lessee accounting model. The standard is effective since October 1, 2019 for the Company. The standard permits two possible transition methods for its application: i) retrospectively to each prior reporting period presented or ii) retrospectively with the cumulative effect of initially applying the standard recognized on the date of the initial application (modified retrospective method). The Company adopted IFRS 16 using the modified retrospective method and applied with no restatement of comparative figures, The Company made use of practical expedients available on transition including the definition of a lease, the use of hindsight in determining the lease term, applying a single incremental borrowing rate to a portfolio of leases with similar characteristics and adjusting the right-of- use assets for any onerous lease provisions as an alternative to an impairment review.
In preparation for the conversion to IFRS 16, the Company has developed a detailed conversion plan consisting of three phases: 1) awareness and assessment, 2) design and 3) implementation. As part of the first phase, the Company has established a steering committee responsible for monitoring the progress and approving recommendations from the project team. The steering committee meets regularly and quarterly updates are provided to the Audit and Risk Management Committee. The Company is progressing toward completion of the third phase of the conversion plan.
The adoption of IFRS 16 will result in a material increase to the company’s assets and liabilities thought the recognition of right of use assets and of lease liabilities. Please refer to note 3 of our audited consolidated financial statements for additional information.
Amendments to IFRS 9, IAS 39 and IFRS 7 - Interest rate benchmark reform
In September 2019, the IASB has amended some of its requirements to address the uncertainty arising from the phasing out of interest-rate benchmarks such as interbank offered rates (IBORS). The amendments issued focused on the accounting effects of uncertainty in the period leading up to the reform. The IASB is also working on the potential consequences to financial
48
|
| FISCAL 2019 RESULTS | |
reporting of replacing an existing benchmark with an alternative. The amendments impact IFRS 9 Financial instruments, IAS 39Financial instruments: Recognition and measurement and IFRS 7Financial instruments: Disclosures. The amendments come into effect for annual periods beginning on or after January 1, 2020 subject to EU endorsement. The Company is currently evaluating the impact of this standard on its consolidated financial statements.
49
|
MANAGEMENT’S DISCUSSION AND ANALYSIS
| 8. | Critical Accounting Estimates |
The Company’s significant accounting policies are described in note 3 of the audited consolidated financial statements for the year ended September 30, 2019. Certain of these accounting policies, listed below, require management to make accounting estimates and judgements that affect the reported amounts of assets, liabilities and equity and the accompanying disclosures at the date of the audited consolidated financial statements as well as the reported amounts of revenue and expenses during the reporting period. These accounting estimates are considered critical because they require management to make subjective and/or complex judgements that are inherently uncertain and because they could have a material impact on the presentation of our financial condition, changes in financial condition or results of operations.
| Areas impacted by estimates |
Consolidated
| Consolidated statements of earnings | ||||||
| Revenue |
Cost of services,
| Income taxes | ||||||
Revenue recognition1 | ✓ | ✓ | ✓ | |||||
Goodwill impairment | ✓ | ✓ | ||||||
Business combinations | ✓ | ✓ | ✓ | ✓ | ||||
Income taxes | ✓ | ✓ | ||||||
Litigation and claims | ✓ | ✓ | ✓ | |||||
| 1 | Affects the balance sheet through accounts receivable, work in progress and deferred revenue. |
Revenue recognition
Relative selling price
If an arrangement involves the provision of multiple performance obligations, the total arrangement value is allocated to each performance obligation based on its relative stand-alone selling price. At least on a yearly basis, the Company reviews its best estimate of the stand-alone selling price which is established by using a reasonable range of prices for the various services and products offered by the Company based on local market information available. Information used in determining the range is mainly based on recent contracts signed and the economic environment. A change in the range could have a material impact on the allocation of total arrangement value, and therefore on the amount and timing of revenue recognition.
System integration and consulting services under fixed-fee arrangements
Revenue from systems integration and consulting services under fixed-fee arrangements is recognized using the percentage-of-completion method over time, as the Company has no alternative use for the asset created and has an enforceable right to payment for performance completed to date. The Company primarily uses labour costs or labour hours to measure the progress towards completion. Project managers monitor and re-evaluate project forecasts on a monthly basis. Forecasts are reviewed to consider factors such as: changes to the scope of the contracts, delays in reaching milestones and new complexities in the project delivery. Forecasts can also be affected by market risks such as the availability and retention of qualified IT professionals and/or the ability of the subcontractors to perform their obligation within agreed upon budget and timeframes. To the extent that actual labour hours or labour costs could vary from estimates, adjustments to revenue following the review of the costs to complete on projects are reflected in the period in which the facts that give rise to the revision occur. Whenever the total costs are forecasted to be higher than the total revenue, a provision for onerous revenue-generating contract is recorded.
50
|
| FISCAL 2019 RESULTS | |
Goodwill impairment
The carrying value of goodwill is tested for impairment annually or if events or changes in circumstances indicate that the carrying value may be impaired. In order to determine if a goodwill impairment test is required, management reviews different factors on a quarterly basis such as changes in technological or market environment, changes in assumptions used to derive the weighted average cost of capital and actual financial performance compared to planned performance.
The recoverable amount of each segment has been determined based on its value in use calculation which includes estimates about their future financial performance based on cash flows approved by management. However, factors such as our ability to continue developing and expanding service offered to address emerging business demands and technology trends, a lengthened sales cycle and our ability to hire and retain qualified IT professionals affect future cash flows, and actual results might differ from future cash flows used in the goodwill impairment test. Key assumptions used in goodwill impairment testing are presented in note 11 of the audited consolidated financial statements for the fiscal year ended September 30, 2019. Historically, the Company has not recorded an impairment charge on goodwill. As at September 30, 2019, the recoverable amount of each segment represented between 229% and 433% of its carrying value.
Business combinations
Management makes assumptions when determining the acquisition-date fair values of the identifiable tangible and intangible assets acquired and liabilities assumed which involve estimates, such as the forecasting of future cash flows, discount rates, and the useful lives of the assets acquired.
Additionally, judgement is required in determining whether an intangible asset is identifiable, and should be recorded separately from goodwill.
Changes in the above assumptions, estimates and judgements could affect our acquisition-date fair values and therefore could have material impacts on our audited consolidated financial statements. These changes are recorded as part of the purchase price allocation and therefore result in corresponding goodwill adjustments if they occurred during the measurement period, not exceeding one year. All other subsequent changes are recorded in our consolidated statement of earnings.
Income taxes
Deferred tax assets are recognized for unused tax losses and deductible temporary differences to the extent that it is probable that taxable profit will be available for their utilization. The Company considers the analysis of forecast and future tax planning strategies. Estimates of taxable profit are made based on the forecast by jurisdiction which are aligned with goodwill impairment testing assumptions, on an undiscounted basis. In addition, management considers factors such as substantively enacted tax rates, the history of the taxable profits and availability of tax strategies. Due to the uncertainty and the variability of the factors mentioned above, deferred tax assets are subject to change. Management reviews its assumptions on a quarterly basis and adjusts the deferred tax assets when appropriate.
The Company is subject to taxation in numerous jurisdictions and there are transactions and calculations for which the ultimate tax determination is uncertain which occurs when there is uncertainty as to the meaning of the law, or to the applicability of the law to a particular transaction or both. In those circumstances, the Company might review administrative practice, consult tax authorities or advisors on the interpretation of tax legislation. When a tax position is uncertain, the Company recognizes an income tax benefit or reduces an income tax liability only when it is probable that the tax benefit will be realized in the future or that the income tax liability is no longer probable. The provision for uncertain tax position is made using the best estimate of the amount expected to be paid based on qualitative assessments of all relevant factors and is subject to change. The review of assumptions is done on a quarterly basis.
Litigation and claims
Provisions are recognized when the Company has a present legal or constructive obligation as a result of a past event, it is probable that an outflow of resources embodying economic benefits will be required to settle the obligation and a reliable estimate can be made of the amount of the obligation. The accrued litigation and legal claim provisions are based on historical experience, current trends and other assumptions that are believed to be reasonable under the circumstances. Estimates
51
|
MANAGEMENT’S DISCUSSION AND ANALYSIS
include the period in which the underlying cause of the claim occurred and the degree of probability of an unfavourable outcome. Management reviews assumptions and facts surrounding outstanding litigation and claims on a quarterly basis, involves external counsel when necessary and adjusts the provision accordingly. The Company has to be compliant with applicable law in many jurisdictions which increases the complexity of determining the adequate provision following a litigation review. Since the outcome of such litigation and claims is not predictable with assurance, those provisions are subject to change. Adjustments to litigation and claims provisions are reflected in the period when the facts that give rise to an adjustment occur.
52
|
| FISCAL 2019 RESULTS | |
| 9. | Integrity of Disclosure |
The Board of Directors has the responsibility under its charter and under the securities laws that govern CGI’s continuous disclosure obligations to oversee CGI’s compliance with its continuous and timely disclosure obligations, as well as the integrity of the Company’s internal controls and management information systems. The Board of Directors carries out this responsibility mainly through its Audit and Risk Management Committee.
The Audit and Risk Management Committee of CGI is composed entirely of independent directors who meet the independence and experience requirements of National Instrument 52-110 adopted by the Canadian Securities Administrators as well as those of the New York Stock Exchange (NYSE) and the U.S. Securities and Exchange Commission. The role and responsibilities of the Audit and Risk Management Committee include: (a) reviewing public disclosure documents containing audited or unaudited financial information concerning CGI; (b) identifying and examining material financial and operating risks to which the Company is exposed, reviewing the various policies and practices of the Company that are intended to manage those risks, and reporting on a regular basis to the Board of Directors concerning risk management; (c) reviewing and assessing the effectiveness of CGI’s accounting policies and practices concerning financial reporting; (d) reviewing and monitoring CGI’s internal control procedures, programs and policies and assessing their adequacy and effectiveness; (e) reviewing the adequacy of CGI’s internal audit resources including the mandate and objectives of the internal auditor; (f) recommending to the Board of Directors the appointment of the external auditor, assessing the external auditor’s independence, reviewing the terms of their engagement, conducting an annual auditor’s performance assessment, and pursuing ongoing discussions with them; (g) reviewing related party transactions in accordance with the rules of the NYSE and other applicable laws and regulations; (h) reviewing the audit procedures including the proposed scope of the external auditor’s examinations; and (i) performing such other functions as are usually attributed to audit committees or as directed by the Board of Directors. In making its recommendation to the Board of Directors in relation to the annual appointment of the external auditor, the Audit and Risk Management Committee conducts an annual assessment of the external auditor’s performance following the recommendations of the Chartered Professional Accountants of Canada. The formal assessment is concluded in advance of the Annual General Meeting of Shareholders and is conducted with the assistance of key CGI personnel.
The Company has established and maintains disclosure controls and procedures designed to provide reasonable assurance that material information relating to the Company is made known to the Chief Executive Officer and Chief Financial Officer by others, particularly during the period in which annual and interim filings are prepared, and that information required to be disclosed by the Company in its annual, interim filings or other reports filed or submitted by the Company under Canadian and U.S. securities laws is recorded, processed, summarized and reported within the time periods specified under those laws and the related rules. As at September 30, 2019, management evaluated, under the supervision of and with the participation of the Chief Executive Officer and Chief Financial Officer, the effectiveness of the Company’s disclosure controls and procedures as defined under National Instrument 52-109 adopted by the Canadian Securities Administrators and in Rule 13(a)-15(e) under the U.S. Securities Exchange Act of 1934, as amended. Based on that evaluation, the Chief Executive Officer and Chief Financial Officer concluded that the Company’s disclosure controls and procedures were effective as at September 30, 2019.
The Company has also established and maintains internal control over financial reporting, as defined under National Instrument 52-109 and in Rule 13(a)-15(f) under the U.S. Securities Exchange Act of 1934, as amended. The Company’s internal control over financial reporting is a process designed under the supervision of the Chief Executive Officer and Chief Financial Officer, and effected by management and other key CGI personnel, to provide reasonable assurance regarding the reliability of financial reporting and the preparation of financial statements for external purposes in accordance with IFRS. However, because of its inherent limitations, internal control over financial reporting may not prevent or detect misstatements on a timely basis. Management evaluated, under the supervision of and with the participation of the Chief Executive Officer and the Chief Financial Officer, the effectiveness of the Company’s internal control over financial reporting as at September 30, 2019, based on the criteria established in Internal Control - Integrated Framework (2013) issued by the Committee of Sponsoring Organizations of the Treadway Commission (COSO). Based on that evaluation, management, under the supervision of and
53
|
MANAGEMENT’S DISCUSSION AND ANALYSIS
with the participation of the President and Chief Executive Officer as well as the Executive Vice President and Chief Financial Officer concluded that the Company’s internal control over financial reporting was effective as at September 30, 2019.
54
|
| FISCAL 2019 RESULTS | |
| 10. | Risk Environment |
10.1. RISKS AND UNCERTAINTIES
While we are confident about our long-term prospects, a number of risks and uncertainties could affect our ability to achieve our strategic vision and objectives for growth. The following risks and uncertainties should be considered when evaluating our potential as an investment.
10.1.1. External Risks
Economic and political risk
Economic and political conditions in the markets in which we operate have a bearing upon the results of our operations, directly and through their effect on the level of business activity of our clients. We can neither predict the impact that current economic and political conditions will have on our future revenue, nor predict changes in economic conditions or future political uncertainty. The level of activity of our clients and potential clients may be affected by an economic downturn or political uncertainty. Clients may cancel, reduce or defer existing contracts and delay entering into new engagements and may decide to undertake fewer IT systems projects resulting in limited implementation of new technology and smaller engagements. Since there may be fewer engagements, competition may increase and pricing for services may decline as competitors may decrease rates to maintain or increase their market share in our industry and this may trigger pricing adjustments related to the benchmarking obligations within our contracts. Economic downturns and political uncertainty makes it more difficult to meet business objectives and may divert management’s attention and time from operating and growing our business. Our business, results of operations and financial condition could be negatively affected as a result of these factors.
Other external risks
Additional external risks that could adversely impact the markets in which we operate, our industry and our business include terrorism, armed conflict, labor or social unrest, criminal activity, regional and international hostilities and international responses to these hostilities, and disease, illness or health emergencies that affect local, national or international economies, Additionally, the potential impacts of continued climate change are unpredictable and natural disasters, sea-level rise, floods, droughts or other weather-related events present additional external risks. Each of these risks could negatively impact our operations, revenue and profitability.
10.1.2. Risks Related to our Industry
The competition for contracts
CGI operates in a global marketplace in which competition among providers of IT services is vigorous. Some of our competitors possess greater financial, marketing and sales resources, and larger geographic scope in certain parts of the world than we do, which, in turn, provides them with additional leverage in the competition for contracts. In certain niche, regional or metropolitan markets, we face smaller competitors with specialized capabilities who may be able to provide competing services with greater economic efficiency. Some of our competitors have more significant operations than we do in lower cost countries that can serve as a platform from which to provide services worldwide on terms that may be more favourable. Increased competition among IT services firms often results in corresponding pressure on prices. There can be no assurance that we will succeed in providing competitively priced services at levels of service and quality that will enable us to maintain and grow our market share.
We derive significant revenue from contracts awarded through competitive bidding processes, which limit the Company’s ability to negotiate certain contractual terms and conditions. Risks related to competitive bidding processes also involve substantial cost and managerial time and effort spent by the Company to prepare bids and proposals for contracts that may
55
|
MANAGEMENT’S DISCUSSION AND ANALYSIS
or may not be awarded to the Company, as well as expenses and delays that may arise if the Company’s competitors protest or challenge awards made to the Company pursuant to competitive bidding processes.
The availability and retention of qualified IT professionals
There is strong demand for qualified individuals in the IT industry. Hiring and retaining a sufficient amount of individuals with the desired knowledge and skill set may be difficult. Therefore, it is important that we remain able to successfully attract and retain highly qualified professionals and establish an effective succession plan. If our comprehensive programs aimed at attracting and retaining qualified and dedicated professionals do not ensure that we have staff in sufficient numbers and with the appropriate training, expertise and suitable government security clearances required to serve the needs of our clients, we may have to rely on subcontractors or transfers of staff to fill resulting gaps. If our succession plan fails to identify those with potential or to develop these key individuals, we may be unable to replace key members who retire or leave the company and may be required to recruit and/or train new employees. This might result in lost revenue or increased costs, thereby putting pressure on our net earnings.
The ability to continue developing and expanding service offerings to address emerging business demands and technology trends
The rapid pace of change in all aspects of IT and the continually declining costs of acquiring and maintaining IT infrastructure mean that we must anticipate changes in our clients’ needs. To do so, we must adapt our services and our solutions so that we maintain and improve our competitive advantage and remain able to provide cost effective services and solutions. The markets in which we operate are extremely competitive and there can be no assurance that we will succeed in developing and adapting our business in a timely manner nor that we will be able to penetrate new markets successfully. If we do not keep pace, our ability to retain existing clients and gain new business may be adversely affected. This may result in pressure on our revenue, net earnings and resulting cash flow from operations.
Infringing on the intellectual property rights of others
Despite our efforts, the steps we take to ensure that our services and offerings do not infringe on the intellectual property rights of third parties may not be adequate to prevent infringement and, as a result, claims may be asserted against us or our clients. We enter into licensing agreements for the right to use intellectual property and may otherwise offer indemnities against liability and damages arising from third-party claims of patent, copyright, trademark or trade secret infringement in respect of our own intellectual property or software or other solutions developed for our clients. In some instances, the amount of these indemnity claims could be greater than the revenue we receive from the client (see guarantees risk). Intellectual property claims or litigation could be time-consuming and costly, harm our reputation, require us to enter into additional royalty or licensing arrangements, or prevent us from providing some solutions or services. Any limitation on our ability to sell or use solutions or services that incorporate software or technologies that are the subject of a claim could cause us to lose revenue-generating opportunities or require us to incur additional expenses to modify solutions for future projects.
Protecting our intellectual property rights
Our success depends, in part, on our ability to protect our proprietary methodologies, processes, know-how, tools, techniques and other intellectual property that we use to provide our services. Although CGI takes reasonable steps (e.g. available copyright protection and, in some cases, patent protection) to protect and enforce its intellectual property rights, there is no assurance that such measures will be enforceable or adequate. The cost of enforcing our rights can be substantial and, in certain cases, may prove to be uneconomic. In addition, the laws of some countries in which we conduct business may offer only limited intellectual property rights protection. Despite our efforts, the steps taken to protect our intellectual property may not be adequate to prevent or deter infringement or other misappropriation of intellectual property, and we may not be able to detect unauthorized use of our intellectual property, or take appropriate steps to enforce our intellectual property rights.
Benchmarking provisions within certain contracts
Some of our managed IT and business process services contracts contain clauses allowing our clients to externally benchmark the pricing of agreed upon services against those offered by other providers in a peer comparison group. The uniqueness of
56
|
| FISCAL 2019 RESULTS | |
the client environment should be factored in and, if results indicate a difference outside the agreed upon tolerance, we may be required to work with clients to reset the pricing for their services. There can be no assurance that benchmarks will produce accurate or reliable data, including pricing data. This may result in pressure on our revenue, net earnings and resulting cash flow from operations.
57
|
MANAGEMENT’S DISCUSSION AND ANALYSIS
10.1.3. Risks Related to our Business
Risks associated with our growth strategy
CGI’s Build and Buy strategy is founded on four pillars of growth: first, organic growth through smaller contract wins, renewals and extensions in the areas of managed IT and business process services and system integration; second, the pursuit of new large long-term managed IT and business process services contracts; third, acquisitions of smaller firms or niche players; and fourth, large transformational acquisitions.
Our ability to achieve organic growth is affected by a number of factors outside of our control, including a lengthening of our sales cycle for major managed IT and business process services contracts.
Our ability to grow through niche and transformational acquisitions requires that we identify suitable acquisition targets that we correctly evaluate their potential as transactions that will meet our financial and operational objectives, and that we successfully integrate them into our business. There can, however, be no assurance that we will be able to identify suitable acquisition targets and consummate additional acquisitions that meet our economic thresholds, or that future acquisitions will be successfully integrated into our operations and yield the tangible accretive value that had been expected.
If we are unable to implement our Build and Buy strategy, we will likely be unable to maintain our historic or expected growth rates.
The variability of financial results
Our ability to maintain and increase our revenue is affected not only by our success in implementing our Build and Buy strategy, but also by a number of other factors, which could cause the Company’s financial results to fluctuate. These factors include: (i) our ability to introduce and deliver new services and business solutions; (ii) our potential exposure to a lengthened sales cycle; (iii) the cyclicality of the purchases of our technology services and products; (iv) the nature of our client’s business (for example, if a client encounters financial difficulty, it may be forced to cancel, reduce or defer existing contracts with us); and (v) the structure of our agreements with clients (for example, some of CGI’s agreements with clients contain clauses allowing the clients to benchmark the pricing of services provided by CGI against the prices offered by other providers). These, and other factors, make it difficult to predict financial results for any given period.
Business mix variations
The proportion of revenue that we generate from shorter-term system integration and consulting projects (SI&C), versus revenue from long-term managed IT and business process services contracts, will fluctuate at times, affected by acquisitions or other transactions. An increased exposure to revenue from SI&C projects may result in greater quarterly revenue variations, as the revenue from SI&C projects does not provide long-term consistency in revenue.
The financial and operational risks inherent in worldwide operations
We manage operations in numerous countries around the world including offshore delivery centers. The scope of our operations (including our offshore delivery centers) subjects us to issues that can negatively impact our operations, including: currency fluctuations (see foreign exchange risk); the burden of complying with a wide variety of national and local laws (see regulatory risk); the differences in and uncertainties arising from local business culture and practices; political, social and economic instability. Any or all of these risks could impact our global business operations and cause our profitability to decline.
Organizational challenges associated with our size
Our culture, standards, core values, internal controls and our policies need to be instilled across newly acquired businesses as well as maintained within our existing operations. To effectively communicate and manage these standards throughout a large global organization is both challenging and time consuming. Newly acquired businesses may be resistant to change and may remain attached to past methods, standards and practices which may compromise our business agility in pursuing opportunities. Cultural differences in various countries may also present barriers to introducing new ideas or aligning our vision and strategy with the rest of the organization. If we cannot overcome these obstacles in maintaining a strategic bond throughout the Company worldwide, we may not be able to achieve our growth and profitability objectives.
58
|
| FISCAL 2019 RESULTS | |
Taxes and tax credit programs
In estimating our income tax payable, management uses accounting principles to determine income tax positions that are likely to be sustained by applicable tax authorities. However, there is no assurance that our tax benefits or tax liability will not materially differ from our estimates or expectations. The tax legislation, regulation and interpretation that apply to our operations are continually changing. In addition, future tax benefits and liabilities are dependent on factors that are inherently uncertain and subject to change, including future earnings, future tax rates, and anticipated business mix in the various jurisdictions in which we operate. Moreover, our tax returns are continually subject to review by applicable tax authorities and we are subject to ongoing audits, investigations and tax proceedings in various jurisdictions. These tax authorities determine the actual amounts of taxes payable or receivable, of any future tax benefits or liabilities and of income tax expense that we may ultimately recognize. Tax authorities have disagreed and may in the future disagree with our income tax positions and are taking increasingly aggressive positions in respect of income tax positions, including with respect to intercompany transactions.
Our effective tax rate in the future could be adversely affected by challenges to intercompany transactions, changes in the value of deferred tax assets and liabilities, changes in tax law or in their interpretation or enforcement, changes in the mix of earnings in countries with differing statutory tax rates, the expiration of tax benefits and changes in accounting principles. Tax rates in the jurisdictions in which we operate may change as a result of shifting economic conditions and tax policies.
A number of countries in which the Company does business have implemented, or are considering implementing, changes in relevant tax, accounting and other laws, regulations and interpretations and the overall tax environment has made it increasingly challenging for multinational corporations to operate with certainty about taxation in many jurisdictions.
Any of the above factors could have a material adverse effect on our net income or cash flow by affecting our operations and profitability, our effective tax rate, the availability of tax credits, the cost of the services we provide, and the availability of deductions for operating losses.
Benefits obtained from government sponsored programs
We benefit from government sponsored programs designed to support research and development, labour and economic growth in jurisdictions where we operate. Government programs reflect government policy and depend on various political and economic factors. There can be no assurance that such government programs will continue to be available to the Company in the future, or will not be reduced, amended or eliminated. Any future government program reductions or eliminations or other amendments to the tax credit programs could increase operating or capital expenditures incurred by the Company and have a material adverse effect on its net earnings or cash flow.
Credit risk with respect to accounts receivable and work in progress
In order to sustain our cash flow from operations, we must invoice and collect the amounts owed to us in an efficient and timely manner. Although we maintain provisions to account for anticipated shortfalls in amounts collected from clients, the provisions we take are based on management estimates and on our assessment of our clients’ creditworthiness which may prove to be inadequate in the light of actual results. To the extent that we fail to perform our services in accordance with our contracts and our clients’ reasonable expectations, and to the extent that we fail to invoice clients and to collect the amounts owed to the Company for our services correctly in a timely manner, our collections could suffer, which could materially adversely affect our revenue, net earnings and cash flow. In addition, a prolonged economic downturn may cause clients to curtail or defer projects, impair their ability to pay for services already provided, and ultimately cause them to default on existing contracts, in each case, causing a shortfall in revenue and impairing our future prospects.
Material developments regarding major commercial clients resulting from such causes as changes in financial condition, mergers or business acquisitions
Consolidation among our clients resulting from mergers and acquisitions may result in loss or reduction of business when the successor business’ IT needs are served by another service provider or are provided by the successor company’s own personnel. Growth in a client’s IT needs resulting from acquisitions or operations may mean that we no longer have a sufficient
59
|
MANAGEMENT’S DISCUSSION AND ANALYSIS
geographic scope or the critical mass to serve the client’s needs efficiently, resulting in the loss of the client’s business and impairing our future prospects. There can be no assurance that we will be able to achieve the objectives of our growth strategy in order to maintain and increase our geographic scope and critical mass in our targeted markets.
Early termination risk
If we should fail to deliver our services according to contractual agreements, some of our clients could elect to terminate contracts before their agreed expiry date, which would result in a reduction of our earnings and cash flow and may impact the value of our backlog of orders. In addition, a number of our managed IT and business process services contractual agreements have termination for convenience and change of control clauses according to which a change in the client’s intentions or a change in control of CGI could lead to a termination of these agreements. Early contract termination can also result from the exercise of a legal right or when circumstances that are beyond our control or beyond the control of our client prevent the contract from continuing. In cases of early termination, we may not be able to recover capitalized contract costs and we may not be able to eliminate ongoing costs incurred to support the contract.
Cost estimation risks
In order to generate acceptable margins, our pricing for services is dependent on our ability to accurately estimate the costs and timing for completing projects or long-term managed IT and business process services contracts, which can be based on a client’s bid specification, sometimes in advance of the final determination of the full scope and design of the contract. In addition, a significant portion of our project-oriented contracts are performed on a fixed-price basis. Billing for fixed-price engagements is carried out in accordance with the contract terms agreed upon with our client, and revenue is recognized based on the percentage of effort incurred to date in relation to the total estimated efforts to be incurred over the duration of the respective contract. These estimates reflect our best judgement regarding the efficiencies of our methodologies and professionals as we plan to apply them to the contracts in accordance with the CGI Client Partnership Management Framework (CPMF), a framework that contains high standards of contract management to be applied throughout the Company. If we fail to apply the CPMF correctly or if we are unsuccessful in accurately estimating the time or resources required to fulfill our obligations under a contract, or if unexpected factors, including those outside of our control, arise, there may be an impact on costs or the delivery schedule which could have a material adverse effect on our expected net earnings.
Risks related to teaming agreements and subcontracts
We derive revenue from contracts where we enter into teaming agreements with other providers. In some teaming agreements we are the prime contractor whereas in others we act as a subcontractor. In both cases, we rely on our relationships with other providers to generate business and we expect to continue to do so in the foreseeable future. Where we act as prime contractor, if we fail to maintain our relationships with other providers, we may have difficulty attracting suitable participants in our teaming agreements. Similarly, where we act as subcontractor, if our relationships are impaired, other providers might reduce the work they award to us, award that work to our competitors, or choose to offer the services directly to the client in order to compete with our business. In either case, if we fail to maintain our relationship with these providers or if our relationship with these providers is otherwise impaired, our business, prospects, financial condition and operating results could be materially adversely affected.
Our partners’ ability to deliver on their commitments
Increasingly large and complex contracts may require that we rely on third party subcontractors including software and hardware vendors to help us fulfill our commitments. Under such circumstances, our success depends on the ability of the third parties to perform their obligations within agreed upon budgets and timeframes. If our partners fail to deliver, our ability to complete the contract may be adversely affected, which could have an unfavourable impact on our profitability.
Guarantees risk
In the normal course of business, we enter into agreements that may provide for indemnification and guarantees to counterparties in transactions such as consulting and managed IT and business process services services, business divestitures, lease agreements and financial obligations. These indemnification undertakings and guarantees may require us
60
|
| FISCAL 2019 RESULTS | |
to compensate counterparties for costs and losses incurred as a result of various events, including breaches of representations and warranties, intellectual property right infringement, claims that may arise while providing services or as a result of litigation that may be suffered by counterparties.
Risk related to human resources utilization rates
In order to maintain our net earnings, it is important that we maintain the appropriate availability of professional resources in each of our geographies by having a high utilization rate while still being able to assign additional resources to new work. Maintaining an efficient utilization rate requires us to forecast our need for professional resources accurately and to manage recruitment activities, professional training programs, attrition rates and restructuring programs appropriately. To the extent that we fail to do so, or to the extent that laws and regulations restrict our ability to do so, our utilization rates may be reduced; thereby having an impact on our revenue and profitability. Conversely, we may find that we do not have sufficient resources to deploy against new business opportunities in which case our ability to grow our revenue would suffer.
Client concentration risk
We derive a significant portion of our revenue from the services we provide to various U.S. federal government departments and agencies. We expect that this will continue for the foreseeable future. There can be, however, no assurance that each such U.S. federal government department and agency will continue to utilize our services to the same extent, or at all in the future. In the event that a major U.S. federal government department or agency were to limit, reduce, or eliminate the business it awards to us, we might be unable to recover the lost revenue with work from other U.S. federal government departments or agencies or other clients, and our business, prospects, financial condition and operating results could be materially and adversely affected. Although IFRS considers a national government and its departments and agencies as a single client, our client base in the U.S. government economic sector is in fact diversified with contracts from many different departments and agencies.
Government business risk
Changes in government spending policies or budget priorities could directly affect our financial performance. Among the factors that could harm our government contracting business are: the curtailment of governments’ use of consulting and IT services firms; a significant decline in spending by governments in general, or by specific departments or agencies in particular; the adoption of new legislation and/or actions affecting companies that provide services to governments; delays in the payment of our invoices by government; and general economic and political conditions. These or other factors could cause government agencies and departments to reduce their purchases under contracts, to exercise their right to terminate contracts, to issue temporary stop work orders, or not to exercise options to renew contracts, any of which would cause us to lose future revenue. Government spending reductions or budget cutbacks at these departments or agencies could materially harm our continued performance under these contracts, or limit the awarding of additional contracts from these agencies.
Regulatory risk
Our global operations require us to be compliant with laws and regulations in many jurisdictions on matters such as: anti-corruption, trade restrictions, immigration, taxation, securities, antitrust, data privacy, labour relations, and the environment, amongst others. Complying with these diverse requirements worldwide is a challenge and consumes significant resources. The laws and regulations frequently change and some may impose conflicting requirements which may expose us to penalties for non-compliance and harm our reputation. Furthermore, in some jurisdictions, we may face the absence of effective laws and regulations to protect our intellectual property rights and there may be restrictions on the movement of cash and other assets, on the import and export of certain technologies, and on the repatriation of earnings. Any or all of these risks could impact our global business operations and cause our profitability to decline.
Our business with the U.S. federal government departments and agencies also requires that we comply with complex laws and regulations relating to government contracts. These laws and regulations relate to the integrity of the procurement process, impose disclosure requirements, and address national security concerns, among other matters. For instance, we are routinely subject to audits by U.S. government departments and agencies with respect to compliance with these rules. If we fail to
61
|
MANAGEMENT’S DISCUSSION AND ANALYSIS
comply with these requirements we may incur penalties and sanctions, including contract termination, suspension of payments, suspension or debarment from doing business with the federal government, and fines.
Legal claims made against our work
We create, implement and maintain IT solutions that are often critical to the operations of our clients’ business. Our ability to complete large projects as expected could be adversely affected by unanticipated delays, renegotiations, and changing client requirements or project delays. Also, our solutions may suffer from defects that adversely affect their performance; they may not meet our clients’ requirements or may fail to perform in accordance with applicable service levels. Such problems could subject us to legal liability, which could materially adversely affect our business, operating results and financial condition, and may negatively affect our professional reputation. While we typically use reasonable efforts to include provisions in our contracts which are designed to limit our exposure to legal claims relating to our services and the applications we develop, we may not always be able to include such provisions and, where we are successful, such provisions may not protect us adequately or may not be enforceable under some circumstances or under the laws of some jurisdictions.
Data protection and infrastructure risks
Our business often requires that our clients’ applications and information, which may include their proprietary information and personal information they manage, be processed and stored on our networks and systems, and in data centers that we manage. We also process and store proprietary information relating to our business, and personal information relating to our members. The Company is subject to numerous laws and regulations designed to protect information, such as the European Union’s General Data Protection Regulation (GDPR), various laws and regulations in Canada, the U.S. and other countries in which the Company operates governing the protection of health or other personally identifiable information and data privacy. These laws and regulations are increasing in number and complexity and are being adopted and amended with greater frequency, which results in greater compliance risk and cost. The potential financial penalties for non-compliance with these laws and regulations have significantly increased with the adoption of the GDPR. The Company’s Chief Data Protection Officer oversees the Company’s compliance with the laws that protect the privacy of personal information. The Company faces risks inherent in protecting the security of such personal data which have grown in complexity, magnitude and frequency in recent years. Digital information and equipment are subject to loss, theft or destruction, and services that we provide may become temporarily unavailable as a result of those risks, or upon an equipment or system malfunction. The causes of such failures include human error in the course of normal operations (including from advertent or inadvertent actions or inactions by our members), maintenance and upgrading activities, as well as hacking, vandalism (including denial of service attacks and computer viruses), theft, and unauthorized access, as well as power outages or surges, floods, fires, natural disasters and many other causes. The measures that we take to protect against all information infrastructure risks, including both physical and logical controls on access to premises and information may prove in some circumstances to be inadequate to prevent the improper disclosure, loss, theft, misappropriation of, unauthorized access to, or destruction of client information, or service interruptions. Such events may expose the Company to financial loss arising from the costs of remediation and those arising from litigation from our clients and third parties (including under the laws that protect the privacy of personal information), claims and damages, as well as expose the Company to government sanctions and damage to our brand and reputation.
Security and cybersecurity risks
In the current environment, there are numerous and evolving security risks, especially from cyber threats, including criminal hackers, hacktivists, state sponsored organizations, industrial espionage, employee misconduct, and human or technological error. As a worldwide IT and business consulting firm providing services to both the private and public sectors, we process and store increasingly large amounts of data for our clients, including proprietary information and personal information. Consequently, our business could be negatively impacted by physical and cyber threats, which could affect our future sales and financial position or increase our costs and expenses. An unauthorized disclosure of sensitive or confidential client or member information, including by cyber-attacks or other security breaches, could cause a loss of data, give rise to remediation or other expenses, expose us to liability under federal and state laws, and subject us to litigation and investigations, which could have an adverse effect on our business, cash flows, financial condition and results of operations. These security risks to the Company include potential attacks not only of our own products, services and systems, but also those of our clients,
62
|
| FISCAL 2019 RESULTS | |
contractors, business partners, vendors and other third parties. The Company’s Chief Security Officer is responsible for overseeing the security of the Company. We seek to detect and investigate all security incidents and to prevent their occurrence or recurrence, by: (i) developing and regularly reviewing policies and standards related to information security, data privacy, physical security and business continuity, (ii) monitoring the Company’s performance against these policies and standards, (iii) developing strategies intended to seek to mitigate the Company’s risks, including through security trainings for all employees to increase awareness of potential cyber threats, (iv) implementing security measures to ensure an appropriate level of control based on the nature of the information and the inherent risks attached thereto, including through access management, security monitoring and testing to mitigate and help detect and respond to attempts to gain unauthorized access to information systems and networks, and (v) working with the industry and governments against cyber threats. However, because of the evolving nature and sophistication of these security threats, there can be no assurance that our safeguards will detect or prevent the occurrence of material cyber breaches, intrusions or attacks. We are regularly the target of attempted cyber and other security threats and must continuously monitor and develop our information technology networks and infrastructure to prevent, detect, address and mitigate the risk of unauthorized access, misuse, computer viruses and other events that could have a security impact. Insider or employee cyber and security threats are increasingly a concern for all large companies, including ours. CGI is continuously working to install new, and upgrade its existing, information technology systems and provide member awareness training around phishing, malware, and other cyber risks to ensure that the Company is protected, to the greatest extent possible, against cyber risks and security breaches. While CGI selects third-party vendors carefully, it does not control their actions. Any problems caused by these third parties, including those resulting from breakdowns or other disruptions in communication services provided by a vendor, failure of a vendor to handle current or higher volumes, cyber-attacks and security breaches at a vendor could adversely affect the our ability to deliver products and services to our customers and otherwise conduct business. Furthermore, while our liability insurance policy covers cyber risks, there is no assurance that such insurance coverage will be sufficient in type or amount to cover the costs, damages, liabilities or losses that could result from security breaches, cyber-attacks and other related breaches. As the cyber threat landscape evolves, the Company may find it necessary to make further significant investments to protect data and infrastructure. Occurrence of any of the aforementioned security threats could expose the Company, our clients or other third parties to potential liability, litigation, and regulatory action, as well as the loss of client confidence, loss of existing or potential clients, loss of sensitive government contracts, damage to brand and reputation, and other financial loss.
Risk of harm to our reputation
CGI’s reputation as a capable and trustworthy service provider and long-term business partner is key to our ability to compete effectively in the market for IT services. The nature of our operations exposes us to the potential loss, unauthorized access to, or destruction of our clients’ information, as well as temporary service interruptions. Depending on the nature of the information or services, such events may have a negative impact on how the Company is perceived in the marketplace. Under such circumstances, our ability to obtain new clients and retain existing clients could suffer with a resulting impact on our revenue and net earnings.
Risks associated with the integration of new operations
The successful integration of new operations arising from our acquisition strategy or from large managed IT and business process services contracts requires that a substantial amount of management time and attention be focused on integration tasks. Management time that is devoted to integration activities may detract from management’s normal operations focus with resulting pressure on the revenues and earnings from our existing operations. In addition, we may face complex and potentially time-consuming challenges in implementing uniform standards, controls, procedures and policies across new operations when harmonizing their activities with those of our existing business units. Integration activities can result in unanticipated operational problems, expenses and liabilities. If we are not successful in executing our integration strategies in a timely and cost-effective manner, we will have difficulty achieving our growth and profitability objectives.
Internal controls risks
Due to the inherent limitations of internal controls including the circumvention or overriding of controls, or fraud, there can only be reasonable assurance that the Company’s internal controls will detect and prevent a misstatement. If the Company is
63
|
MANAGEMENT’S DISCUSSION AND ANALYSIS
unable to design, implement, monitor and maintain effective internal controls throughout its different business environments, the efficiency of our operations might suffer, resulting in a decline in revenue and profitability, and the accuracy of our financial reporting could be impaired.
Liquidity and funding risks
The Company’s future growth is contingent on the execution of its business strategy, which, in turn, is dependent on its ability to grow the business organically as well as through business acquisitions. In the event we would need to raise additional funds through equity or debt financing to fund any currently unidentified or unplanned future acquisitions and other growth opportunities, there can be no assurance that such financing will be available in amounts and on terms acceptable to us. Our ability to raise the required funding depends on the capacity of the capital markets to meet our equity and/or debt financing needs in a timely fashion and on the basis of interest rates and/or share prices that are reasonable in the context of our commercial objectives. Increasing interest rates, volatility in our share price, and the capacity of our current lenders to meet our additional liquidity requirements are all factors that may have a material adverse effect on any acquisitions or growth activities that we may, in the future, identify or plan. If we are unable to obtain the necessary funding, we may be unable to achieve our growth objectives.
Foreign exchange risk
The majority of our revenue and costs are denominated in currencies other than the Canadian dollar. Foreign exchange fluctuations impact the results of our operations as they are reported in Canadian dollars. This risk is partially mitigated by a natural hedge in matching our costs with revenue denominated in the same currency and through the use of derivatives in our global hedging strategy. However, as we continue our global expansion, natural hedges may begin to diminish and the use of hedging contracts exposes us to the risk that financial institutions could fail to perform their obligations under our hedging instruments. Furthermore, there can be no assurance that our hedging strategy and arrangements will offset the impact of fluctuations in currency exchange rates, which could materially adversely affect our business revenues, results of operations, financial condition or prospects. Other than the use of financial products to deliver on our hedging strategy, we do not trade derivative financial instruments.
Our functional and reporting currency is the Canadian dollar. As such, our U.S., European and Asian investments, operations and assets are exposed to net change in currency exchange rates. Volatility in exchange rates could have an adverse effect on our business, financial condition and results of operations.
10.2. LEGAL PROCEEDINGS
The Company is involved in legal proceedings, audits, claims and litigation arising in the ordinary course of its business. Certain of these matters seek damages in significant amounts. Although the outcome of such matters is not predictable with assurance, the Company has no reason to believe that the disposition of any such current matter could reasonably be expected to have a material adverse effect on the Company’s financial position, results of operations or the ability to carry on any of its business activities.
Transfer Agent
Computershare Investor Services Inc.
(800) 564-6253
Investor Relations
Lorne Gorber
Executive Vice-President, Investor and Public Relations
Telephone: (514) 841-3355
lorne.gorber@cgi.com
1350 René-Lévesque Boulevard West
25th Floor
Montréal, Quebec
H3G 1T4
Canada
64
|
| FISCAL 2019 RESULTS | |
Management’s and Auditors’ Reports
MANAGEMENT’S STATEMENT OF RESPONSIBILITY FOR FINANCIAL REPORTING
The management of CGI Inc. (the Company) is responsible for the preparation and integrity of the consolidated financial statements and the Management’s Discussion and Analysis (MD&A). The consolidated financial statements have been prepared in accordance with International Financial Reporting Standards as issued by the International Accounting Standards Board and necessarily include some amounts that are based on management’s best estimates and judgement. Financial and operating data elsewhere in the MD&A are consistent with that contained in the accompanying consolidated financial statements.
To fulfill its responsibility, management has developed, and continues to maintain, systems of internal controls reinforced by the Company’s standards of conduct and ethics, as set out in written policies to ensure the reliability of the financial information and to safeguard its assets. The Company’s internal control over financial reporting and consolidated financial statements are subject to audit by an Independent Registered Public Accounting Firm, whose reports follow. PricewaterhouseCoopers LLP, Independent Registered Public Accounting Firm appointed by our shareholders upon the recommendation of the Audit and Risk Management Committee of the Board of Directors, has performed an independent audit of the consolidated balance sheet as at September 30, 2019 and the related consolidated statements of earnings, comprehensive income, changes in equity and cash flows for the year ended September 30, 2019 and the effectiveness of our internal control over financial reporting as at September 30, 2019. The consolidated balance sheet as at September 30, 2018, and the consolidated statements of earnings, comprehensive income, changes in equity and cash flows for the year ended September 30, 2018 were audited by our previous auditors, Ernst & Young LLP. In addition, the Audit and Risk Management Committee of the Board of Directors reviews the disclosure of financial information and oversees the functioning of the Company’s financial disclosure controls and procedures.
Members of the Audit and Risk Management Committee of the Board of Directors, all of whom are independent of the Company, meet regularly with PricewaterhouseCoopers LLP and with management to discuss internal controls in the financial reporting process, auditing matters and financial reporting issues and formulate the appropriate recommendations to the Board of Directors. PricewaterhouseCoopers LLP has full and unrestricted access to the Audit and Risk Management Committee. The consolidated financial statements and MD&A have been reviewed and approved by the Board of Directors.
|
| |
| George D. Schindler | François Boulanger | |
| President and Chief Executive Officer | Executive Vice-President and Chief Financial Officer | |
November 5, 2019 |


65
|
CONSOLIDATED FINANCIAL STATEMENTS
Management’s and Auditors’ Reports
MANAGEMENT’S REPORT ON INTERNAL CONTROL OVER FINANCIAL REPORTING
The management of the Company is responsible for establishing and maintaining adequate internal control over financial reporting. The Company’s internal control over financial reporting is a process designed, under the supervision of and with the participation of the President and Chief Executive Officer as well as the Executive Vice-President and Chief Financial Officer, to provide reasonable assurance regarding the reliability of financial reporting and the preparation of the Company’s consolidated financial statements for external reporting purposes in accordance with International Financial Reporting Standards (IFRS) as issued by the International Accounting Standards Board (IASB).
The Company’s internal control over financial reporting includes policies and procedures that:
- Pertain to the maintenance of records that, in reasonable detail, accurately and fairly reflect transactions and dispositions of the assets of the Company;
- Provide reasonable assurance that transactions are recorded as necessary to permit preparation of consolidated financial statements in accordance with IFRS as issued by the IASB, and that receipts and expenditures are being made only in accordance with authorizations of management and the directors of the Company; and,
- Provide reasonable assurance regarding prevention or timely detection of unauthorized acquisition, use or disposition of the Company’s assets that could have a material effect on the Company’s consolidated financial statements.
All internal control systems have inherent limitations; therefore, even where internal control over financial reporting is determined to be effective, it can provide only reasonable assurance. Projections of any evaluation of effectiveness to future periods are subject to the risk that the controls may become inadequate because of changes in conditions, or that the degree of compliance with the policies or procedures may deteriorate.
Management, under the supervision of and with the participation of the President and Chief Executive Officer as well as the Executive Vice-President and Chief Financial Officer, conducted an assessment of the effectiveness of the Company’s internal control over financial reporting based on the criteria established inInternal Control - Integrated Framework(2013) issued by the Committee of Sponsoring Organizations of the Treadway Commission (COSO). Based on this assessment, management has determined the Company’s internal control over financial reporting as at September 30, 2019 was effective.
The effectiveness of the Company’s internal control over financial reporting as of September 30, 2019 has been audited by PricewaterhouseCoopers LLP, an Independent Registered Public Accounting Firm, as stated in their report which appears herein.
|
| |
| George D. Schindler | François Boulanger | |
| President and Chief Executive Officer | Executive Vice-President and Chief Financial Officer | |
November 5, 2019 |
66
|
| FISCAL 2019 RESULTS | |
Management’s and Auditors’ Reports
REPORT OF INDEPENDENT REGISTERED PUBLIC ACCOUNTING FIRM
To the Board of Directors and Shareholders of CGI Inc.
Opinions on the Financial Statements and Internal Control over Financial Reporting
We have audited the accompanying consolidated balance sheet of CGI Inc. and its subsidiaries (together, the Company) as of September 30, 2019 and the related consolidated statement of earnings, comprehensive income, changes in equity and cash flows for the year then ended, including the related notes (collectively referred to as the 2019 consolidated financial statements). We also have audited the Company’s internal control over financial reporting as of September 30, 2019, based on criteria established inInternal Control - Integrated Framework (2013) issued by the Committee of Sponsoring Organizations of the Treadway Commission (COSO).
In our opinion, the 2019 consolidated financial statements referred to above present fairly, in all material respects, the financial position of the Company as of September 30, 2019 and its financial performance and its cash flows for the year then ended in conformity with International Financial Reporting Standards as issued by the International Accounting Standards Board. Also in our opinion, the Company maintained, in all material respects, effective internal control over financial reporting as of September 30, 2019, based on criteria established inInternal Control - Integrated Framework (2013) issued by the COSO.
Basis for Opinions
The Company’s management is responsible for these 2019 consolidated financial statements, for maintaining effective internal control over financial reporting, and for its assessment of the effectiveness of internal control over financial reporting, included in the accompanying Management’s Report on Internal Control over Financial Reporting. Our responsibility is to express opinions on the Company’s 2019 consolidated financial statements and on the Company’s internal control over financial reporting based on our audits. We are a public accounting firm registered with the Public Company Accounting Oversight Board (United States) (PCAOB) and are required to be independent with respect to the Company in accordance with the U.S. federal securities laws and the applicable rules and regulations of the Securities and Exchange Commission and the PCAOB.
We conducted our audits in accordance with the standards of the PCAOB. Those standards require that we plan and perform the audit to obtain reasonable assurance about whether the 2019 consolidated financial statements are free of material misstatement, whether due to error or fraud, and whether effective internal control over financial reporting was maintained in all material respects.
Our audit of the 2019 consolidated financial statements included performing procedures to assess the risks of material misstatement of the 2019 consolidated financial statements, whether due to error or fraud, and performing procedures that respond to those risks. Such procedures included examining, on a test basis, evidence regarding the amounts and disclosures in the 2019 consolidated financial statements. Our audit also included evaluating the accounting principles used and significant estimates made by management, as well as evaluating the overall presentation of the 2019 consolidated financial statements. Our audit of internal control over financial reporting included obtaining an understanding of internal control over financial reporting, assessing the risk that a material weakness exists, and testing and evaluating the design and operating effectiveness of internal control based on the assessed risk. Our audits also included performing such other procedures as we considered necessary in the circumstances. We believe that our audits provide a reasonable basis for our opinions.
Definition and Limitations of Internal Control over Financial Reporting
A company’s internal control over financial reporting is a process designed to provide reasonable assurance regarding the reliability of financial reporting and the preparation of financial statements for external purposes in accordance with generally accepted accounting principles. A company’s internal control over financial reporting includes those policies and procedures that (i) pertain to the maintenance of records that, in reasonable detail, accurately and fairly reflect the transactions and dispositions of the assets of the company; (ii) provide reasonable assurance that transactions are recorded as necessary to permit preparation of financial statements in accordance with generally accepted accounting principles, and that receipts and expenditures of the company are being made only in accordance with authorizations of management and directors of the company; and (iii) provide reasonable assurance regarding prevention or timely detection of unauthorized acquisition, use, or disposition of the company’s assets that could have a material effect on the financial statements.
Because of its inherent limitations, internal control over financial reporting may not prevent or detect misstatements. Also, projections of any evaluation of effectiveness to future periods are subject to the risk that controls may become inadequate because of changes in conditions, or that the degree of compliance with the policies or procedures may deteriorate.
67
|
CONSOLIDATED FINANCIAL STATEMENTS
Management’s and Auditors’ Reports
REPORT OF INDEPENDENT REGISTERED PUBLIC ACCOUNTING FIRM (continued)
Critical Audit Matters
The critical audit matter communicated below is a matter arising from the audit of the 2019 consolidated financial statements that was communicated or required to be communicated to the Audit and Risk Management Committee of the Board of Directors and that (i) relates to accounts or disclosures that are material to the 2019 consolidated financial statements and (ii) involved our especially challenging, subjective, or complex judgments. The communication of critical audit matters does not alter in any way our opinion on the 2019 consolidated financial statements, taken as a whole, and we are not, by communicating the critical audit matter below, providing a separate opinion on the critical audit matter or on the accounts or disclosures to which it relates.
Revenue Recognition - Estimates of total expected labour costs or total expected labour hours for systems integration and consulting services under fixed-fee arrangements
As described in Notes 3 and 27 to the 2019 consolidated financial statements, the Company recognizes revenue for systems integration and consulting services under fixed-fee arrangements using the percentage-of-completion method over time. As of September 30, 2019, revenue from systems integration and consulting services under fixed-fee arrangements makes up a significant portion of the revenue from systems integration and consulting services of $6,112,750,000. The selection of the measure of progress towards completion requires management judgment and is based on the nature of the services to be provided. As disclosed by management, the Company relies on estimates of total expected labour costs or total expected labour hours to complete the service, which are compared to labour costs or labour hours incurred to date, to arrive at an estimate of the percentage of revenue earned to date. Management regularly reviews underlying estimates of total expected labour costs or total expected labour hours. Management has disclosed that there are many factors that can affect the estimates of total expected labour costs or total expected labour hours, including changes to the scope of the contracts, delays in reaching milestones and new complexities in the project delivery.
The principal considerations for our determination that performing procedures relating toRevenue Recognition - Estimates of total expected labour costs or total expected labour hours for systems integration and consulting services under fixed-fee arrangementsis a critical audit matter are i) there was significant judgment by management when developing the estimates of total expected labour costs or total expected labour hours ii) There were significant auditor judgment and effort in performing procedures to evaluate the estimates of total expected labour cost or total expected hours, including the assessment of management’s judgment about the Company’s ability to properly assess the factors that can affect the estimate significant assumptions related to the estimates total expected labour costs or total expected labour hours to complete.
Addressing the matter involved performing procedures and evaluating audit evidence in connection with forming our overall opinion on the 2019 consolidated financial statements. These procedures included testing the effectiveness of controls relating to the revenue recognition process, including controls over the determination of estimates of total expected labour costs or total expected labour hours. The procedures also included, among others, evaluating and testing management’s process, on a sample basis, for determining the estimates of total expected labour costs or total expected labour hours which included evaluating the reasonableness of significant assumptions, including the total expected labour costs or total expected labour hours to complete, used by management by (i) testing total labour costs or total labour hours incurred to supporting evidence, (ii) performing a comparison of the sum of total labour costs or labour hours incurred and the total expected labour costs or total expected labour hours to complete to the originally estimated costs or hours; and; (iii) evaluating the process of the timely identification of factors that can affect the total expected labour costs or total expected labour hours, including but not limited to, changes to the scope of the contracts, delays in reaching milestones and new complexities in the project delivery.

Montreal, Canada
November 5, 2019
We have served as the Company’s auditor since 2019.
1. CPA auditor, CA, public accountancy permit No. A115888
68
|
| FISCAL 2019 RESULTS | |
Management’s and Auditors’ Reports
REPORT OF INDEPENDENT REGISTERED PUBLIC ACCOUNTING FIRM ON FINANCIAL STATEMENTS
To the Board of Directors and Shareholders of CGI Inc.
Opinion on the Consolidated Financial Statements
We have audited the accompanying consolidated financial statements of CGI Inc. (the “Company”), which comprise the consolidated balance sheet as at September 30, 2018, the consolidated statements of earnings, comprehensive income, changes in equity and cash flows for the year then ended, and the related notes, comprising a summary of significant accounting policies and other explanatory information (collectively referred to as the “consolidated financial statements”).
In our opinion, the consolidated financial statements present fairly, in all material respects, the consolidated financial position of the Company as at September 30, 2018, and its consolidated financial performance and its consolidated cash flows for the year then ended in accordance with International Financial Reporting Standards as issued by the International Accounting Standards Board.
Basis for Opinion
Management’s Responsibility for the Consolidated Financial Statements
Management is responsible for the preparation and fair presentation of these consolidated financial statements in accordance with International Financial Reporting Standards as issued by the International Accounting Standards Board, and for such internal control as management determines is necessary to enable the preparation of consolidated financial statements that are free from material misstatement, whether due to fraud or error.
Auditors’ Responsibility
Our responsibility is to express an opinion on these consolidated financial statements based on our audit. We conducted our audit in accordance with Canadian generally accepted auditing standards and the standards of the PCAOB. Those standards require that we plan and perform the audit to obtain reasonable assurance about whether the consolidated financial statements are free from material misstatement, whether due to error or fraud. Those standards also require that we comply with ethical requirements, including independence. We are required to be independent with respect to the Company in accordance with the ethical requirements that are relevant to our audit of the consolidated financial statements in Canada, the U.S. federal securities laws and the applicable rules and regulations of the Securities and Exchange Commission and the PCAOB. We are a public accounting firm registered with the PCAOB.
An audit includes performing procedures to assess the risks of material misstatements of the consolidated financial statements, whether due to error or fraud, and performing procedures to respond to those risks. Such procedures included obtaining and examining, on a test basis, audit evidence regarding the amounts and disclosures in the consolidated financial statements. The procedures selected depend on our judgment, including the assessment of the risks of material misstatement of the consolidated financial statements, whether due to fraud or error. In making those risk assessments, we consider internal control relevant to the Company’s preparation and fair presentation of the consolidated financial statements in order to design audit procedures that are appropriate in the circumstances.
An audit also includes evaluating the appropriateness of accounting policies and principles used and the reasonableness of accounting estimates made by management, as well as evaluating the overall presentation of the consolidated financial statements.
We believe that the audit evidence we have obtained is sufficient and appropriate to provide a reasonable basis for our audit opinion.
We have served as the Company’s auditors from 2010 to 2018.

Ernst & Young LLP
Montréal, Canada
November 6, 2018, except for Note 27, as to which the date is November 5, 2019
1. CPA auditor, CA, public accountancy permit No. A113209
69
|
CONSOLIDATED FINANCIAL STATEMENTS
Consolidated Statements of Earnings
For the years ended September 30
(in thousands of Canadian dollars, except per share data)
| Notes | 2019 | 2018 | ||||||||||
| $ | $ | |||||||||||
Revenue | 27 | 12,111,236 | 11,506,825 | |||||||||
Operating expenses
| ||||||||||||
Costs of services, selling and administrative
| 22 | 10,284,007 | 9,801,791 | |||||||||
Acquisition-related and integration costs
| 25c | 77,417 | 37,482 | |||||||||
Restructuring costs
| — | 100,387 | ||||||||||
Net finance costs
| 24 | 70,630 | 73,885 | |||||||||
Foreign exchange loss | 2,234 | 3,300 | ||||||||||
| 10,434,288 | 10,016,845 | |||||||||||
Earnings before income taxes
| 1,676,948 | 1,489,980 | ||||||||||
Income tax expense | 15 | 413,741 | 348,578 | |||||||||
Net earnings | 1,263,207 | 1,141,402 | ||||||||||
Earnings per share
| ||||||||||||
Basic earnings per share
| 20 | 4.63 | 4.02 | |||||||||
Diluted earnings per share | 20 | 4.55 | 3.95 | |||||||||
See Notes to the Consolidated Financial Statements.
70
|
| FISCAL 2019 RESULTS | |
Consolidated Statements of Comprehensive Income
For the years ended September 30
(in thousands of Canadian dollars)
| 2019 | 2018 | |||||||
| $ | $ | |||||||
Net earnings |
| 1,263,207
|
|
| 1,141,402
|
| ||
Items that will be reclassified subsequently to net earnings (net of income taxes):
| ||||||||
Net unrealized (losses) gains on translating financial statements of foreign operations
| (162,657 | ) | 63,424 | |||||
Net gains (losses) on cross-currency swaps and on translating long-term debt designated as hedges of net investments in foreign operations
| 53,024 | (25,710 | ) | |||||
Deferred costs of hedging on cross-currency swaps
| (4,091 | ) | — | |||||
Net unrealized gains (losses) on cash flow hedges
| 50,943 | (28,456 | ) | |||||
Net unrealized gains (losses) on financial assets at fair value through other comprehensive income
| 4,102 | (2,054 | ) | |||||
Items that will not be reclassified subsequently to net earnings (net of income taxes):
| ||||||||
Net remeasurement gains on defined benefit plans
| 33,777 | 35,001 | ||||||
Other comprehensive (loss) income
| (24,902 | ) | 42,205 | |||||
Comprehensive income
| 1,238,305 | 1,183,607 | ||||||
See Notes to the Consolidated Financial Statements.
71
|
CONSOLIDATED FINANCIAL STATEMENTS
Consolidated Balance Sheets
As at September 30
(in thousands of Canadian dollars)
| Notes | 2019 | 2018 | ||||||||||
| $ | $ | |||||||||||
Assets
| ||||||||||||
Current assets
| ||||||||||||
Cash and cash equivalents
| 26e and 30 | 213,831 | 184,091 | |||||||||
Accounts receivable
| 4 and 30 | 1,357,090 | 1,481,368 | |||||||||
Work in progress
| 1,096,031 | 942,826 | ||||||||||
Current financial assets
| 30 | 39,931 | 12,395 | |||||||||
Prepaid expenses and other current assets
| 172,182 | 153,554 | ||||||||||
Income taxes
| 10,206 | 4,646 | ||||||||||
Total current assets before funds held for clients
| 2,889,271 | 2,778,880 | ||||||||||
Funds held for clients
| 5 | 368,112 | 325,552 | |||||||||
Total current assets
| 3,257,383 | 3,104,432 | ||||||||||
Property, plant and equipment
| 6 | 397,661 | 388,093 | |||||||||
Contract costs
| 7 | 222,965 | 243,147 | |||||||||
Intangible assets
| 8 | 517,982 | 479,326 | |||||||||
Other long-term assets
| 9 | 180,480 | 104,948 | |||||||||
Long-term financial assets
| 10 | 176,899 | 117,736 | |||||||||
Deferred tax assets
| 15 | 100,539 | 139,664 | |||||||||
Goodwill
| 11 | 7,767,837 | 7,341,720 | |||||||||
| 12,621,746 | 11,919,066 | |||||||||||
Liabilities
| ||||||||||||
Current liabilities
| ||||||||||||
Accounts payable and accrued liabilities
| 1,108,895 | 1,134,802 | ||||||||||
Accrued compensation
| 642,897 | 602,245 | ||||||||||
Current derivative financial instruments
| 30 | 4,902 | 39,418 | |||||||||
Deferred revenue
| 397,370 | 399,549 | ||||||||||
Income taxes
| 176,243 | 194,681 | ||||||||||
Provisions
| 12 | 73,509 | 72,068 | |||||||||
Current portion of long-term debt
| 13 | 113,511 | 348,580 | |||||||||
Total current liabilities before clients’ funds obligations
| 2,517,327 | 2,791,343 | ||||||||||
Clients’ funds obligations
| 366,796 | 328,324 | ||||||||||
Total current liabilities
| 2,884,123 | 3,119,667 | ||||||||||
Long-term income taxes
| 7,690 | 10,603 | ||||||||||
Long-term provisions
| 12 | 24,946 | 25,933 | |||||||||
Long-term debt
| 13 | 2,217,696 | 1,452,313 | |||||||||
Other long-term liabilities
| 14 | 213,392 | 205,646 | |||||||||
Long-term derivative financial instruments
| 30 | 18,322 | 77,754 | |||||||||
Deferred tax liabilities
| 15 | 178,265 | 173,009 | |||||||||
Retirement benefits obligations
| 16 | 193,209 | 169,334 | |||||||||
| 5,737,643 | 5,234,259 | |||||||||||
Equity
| ||||||||||||
Retained earnings
| 4,557,855 | 4,251,424 | ||||||||||
Accumulated other comprehensive income
| 17 | 176,694 | 201,596 | |||||||||
Capital stock
| 18 | 1,903,977 | 2,018,592 | |||||||||
Contributed surplus | 245,577 | 213,195 | ||||||||||
| 6,884,103 | 6,684,807 | |||||||||||
| 12,621,746 | 11,919,066 | |||||||||||
See Notes to the Consolidated Financial Statements.
 |  | |||
Approved by the Board of Directors |
George D. Schindler
Director | Serge Godin
Director | ||
72
|
| FISCAL 2019 RESULTS | |
Consolidated Statements of Changes in Equity
For the years ended September 30
(in thousands of Canadian dollars)
| Notes | Retained earnings | Accumulated other comprehensive income | Capital stock | Contributed surplus | Total equity | |||||||||||||||||||
| $ | $ | $ | $ | $ | ||||||||||||||||||||
Balance as at September 30, 2018
| 4,251,424 | 201,596 | 2,018,592 | 213,195 | 6,684,807 | |||||||||||||||||||
Net earnings
| 1,263,207 | — | — | — | 1,263,207 | |||||||||||||||||||
Other comprehensive loss
| — | (24,902 | ) | — | — | (24,902 | ) | |||||||||||||||||
Comprehensive income (loss)
| 1,263,207 | (24,902 | ) | — | — | 1,238,305 | ||||||||||||||||||
Share-based payment costs
| — | — | — | 39,440 | 39,440 | |||||||||||||||||||
Income tax impact associated with stock options
| — | — | — | 14,663 | 14,663 | |||||||||||||||||||
Exercise of stock options
| 18 | — | — | 77,773 | (14,070 | ) | 63,703 | |||||||||||||||||
Exercise of performance share units
| 18 | — | — | 7,651 | (7,651 | ) | — | |||||||||||||||||
Purchase for cancellation of Class A subordinate voting shares
| 18 | (956,776 | ) | — | (169,299 | ) | — | (1,126,075 | ) | |||||||||||||||
Purchase of Class A subordinate voting shares held in trusts | 18 | — | — | (30,740 | ) | — | (30,740 | ) | ||||||||||||||||
Balance as at September 30, 2019 | 4,557,855 | 176,694 | 1,903,977 | 245,577 | 6,884,103 | |||||||||||||||||||
| Notes | Retained earnings | Accumulated other comprehensive income | Capital stock | Contributed surplus | Total equity | |||||||||||||||||||
| $ | $ | $ | $ | $ | ||||||||||||||||||||
Balance at September 30, 2017
| 3,794,439 | 159,391 | 2,054,725 | 194,071 | 6,202,626 | |||||||||||||||||||
Net earnings
| 1,141,402 | — | — | — | 1,141,402 | |||||||||||||||||||
Other comprehensive income
| — | 42,205 | — | — | 42,205 | |||||||||||||||||||
Comprehensive income
| 1,141,402 | 42,205 | — | — | 1,183,607 | |||||||||||||||||||
Share-based payment costs
| — | — | — | 38,457 | 38,457 | |||||||||||||||||||
Income tax impact associated with stock options
| — | — | — | 5,422 | 5,422 | |||||||||||||||||||
Exercise of stock options
| 18 | — | — | 94,552 | (17,340 | ) | 77,212 | |||||||||||||||||
Exercise of performance share units
| 18 | — | — | 7,439 | (7,439 | ) | — | |||||||||||||||||
Purchase for cancellation of Class A subordinate voting shares
| 18 | (684,417 | ) | — | (113,839 | ) | — | (798,256 | ) | |||||||||||||||
Purchase of Class A subordinate shares held in trusts
| 18 | — | — | (24,789 | ) | — | (24,789 | ) | ||||||||||||||||
Resale of Class A subordinate voting shares held in trusts
| 18 | — | — | 504 | 24 | 528 | ||||||||||||||||||
Balance as at September 30, 2018 | 4,251,424 | 201,596 | 2,018,592 | 213,195 | 6,684,807 | |||||||||||||||||||
See Notes to the Consolidated Financial Statements.
73
|
CONSOLIDATED FINANCIAL STATEMENTS
Consolidated Statements of Cash Flows
For the years ended September 30
(in thousands of Canadian dollars)
| Notes | 2019 | 2018 | ||||||||
| $ | $ | |||||||||
Operating activities
| ||||||||||
Net earnings
| 1,263,207 | 1,141,402 | ||||||||
Adjustments for:
| ||||||||||
Amortization and depreciation
| 23 | 392,301 | 392,675 | |||||||
Deferred income tax recovery
| 15 | (8,297 | ) | (41,238 | ) | |||||
Foreign exchange losses
| 3,519 | 349 | ||||||||
Share-based payment costs
| 39,440 | 38,457 | ||||||||
Net change in non-cash working capital items | 26a | (56,251 | ) | (38,237 | ) | |||||
Cash provided by operating activities | 1,633,919 | 1,493,408 | ||||||||
Investing activities
| ||||||||||
Net change in short-term investments
| (9,889 | ) | — | |||||||
Business acquisitions (considering the bank overdraft assumed and cash acquired)
| (480,366 | ) | (248,137 | ) | ||||||
Investment in a step acquisition
| (140,248 | ) | — | |||||||
Proceeds from sale of business
| 600 | 3,500 | ||||||||
Purchase of property, plant and equipment
| (162,061 | ) | (143,250 | ) | ||||||
Additions to contract costs
| (60,191 | ) | (87,420 | ) | ||||||
Additions to intangible assets
| (105,976 | ) | (95,451 | ) | ||||||
Purchase of long-term investments
| (523 | ) | (16,238 | ) | ||||||
Proceeds from sale of long-term investments | 7,845 | 9,578 | ||||||||
Cash used in investing activities | (950,809 | ) | (577,418 | ) | ||||||
Financing activities
| ||||||||||
Net change in unsecured committed revolving credit facility
| 13 and 26c | 139,575 | (5,205 | ) | ||||||
Increase of long-term debt
| 26c | 686,810 | 20,111 | |||||||
Repayment of long-term debt
| 26c | (355,406 | ) | (121,771 | ) | |||||
Repayment of debt assumed in business acquisitions
| 26c | (2,141 | ) | (28,609 | ) | |||||
Settlement of derivative financial instruments
| 30 and 26c | (554 | ) | (2,430 | ) | |||||
Purchase of Class A subordinate voting shares held in trusts
| 18 | (30,740 | ) | (24,789 | ) | |||||
Resale of Class A subordinate voting shares held in trusts
| 18 | — | 528 | |||||||
Purchase and cancellation of Class A subordinate voting shares
| 18 | (1,130,255 | ) | (794,076 | ) | |||||
Issuance of Class A subordinate voting shares | 63,602 | 77,197 | ||||||||
Cash used in financing activities | (629,109 | ) | (879,044 | ) | ||||||
Effect of foreign exchange rate changes on cash and cash equivalents
| (24,261 | ) | (18,727 | ) | ||||||
Net increase in cash and cash equivalents
| 29,740 | 18,219 | ||||||||
Cash and cash equivalents, beginning of year | 184,091 | 165,872 | ||||||||
Cash and cash equivalents, end of year | 213,831 | 184,091 | ||||||||
Supplementary cash flow information (Note 26).
See Notes to the Consolidated Financial Statements.
74
|
| FISCAL 2019 RESULTS | |
Notes to the Consolidated Financial Statements
For the years ended September 30, 2019 and 2018
(tabular amounts only are in thousands of Canadian dollars, except per share data)
| 1. | Description of business |
CGI Inc. (the Company), directly or through its subsidiaries, provides managed information technology (IT) and business process services (BPS), systems integration and consulting, as well as the sale of software solutions to help clients effectively realize their strategies and create added value. The Company was incorporated under Part IA of the Companies Act (Québec), predecessor to the Business Corporations Act (Québec) which came into force on February 14, 2011 and its Class A subordinate voting shares are publicly traded. The executive and registered office of the Company is situated at 1350 René-Lévesque Blvd. West, Montréal, Québec, Canada, H3G 1T4.
| 2. | Basis of preparation |
These consolidated financial statements have been prepared in accordance with International Financial Reporting Standards (IFRS) as issued by the International Accounting Standards Board (IASB).
The Company’s consolidated financial statements for the years ended September 30, 2019 and 2018 were authorized for issue by the Board of Directors on November 5, 2019.
| 3. | Summary of significant accounting policies |
BASIS OF CONSOLIDATION
The consolidated financial statements include the accounts of the Company and its subsidiaries. All intercompany transactions and balances have been eliminated on consolidation.
Subsidiaries are entities controlled by the Company. The Company controls an entity when it is exposed or has right to variable returns from its involvement with the entity and has the ability to affect those returns through its power over the relevant activities of the entity. Subsidiaries are fully consolidated from the date of acquisition and continue to be consolidated until the date control over the subsidiaries ceases.
BASIS OF MEASUREMENT
The consolidated financial statements have been prepared on a historical cost basis, except for certain financial assets and liabilities, which have been measured at fair value as described below.
USE OF JUDGEMENTS AND ESTIMATES
The preparation of the consolidated financial statements requires management to make judgements and estimates that affect the reported amounts of assets, liabilities, equity and the accompanying disclosures at the date of the consolidated financial statements and the reported amounts of revenue and expenses during the reporting period. Because the use of judgements and estimates is inherent in the financial reporting process, actual results could differ.
Significant judgements and estimates about the future and other major sources of estimation uncertainty at the end of the reporting period could have a significant risk of causing a material adjustment to the carrying amounts of the following within the next financial year: revenue recognition, deferred tax assets, estimated losses on revenue-generating contracts, goodwill impairment, business combinations, provisions for uncertain tax treatments and litigation and claims.
The judgements, apart from those involving estimations, that have the most significant effect on the amounts recognized in the consolidated financial statements are:
Revenue recognition of multiple deliverable arrangements
Assessing whether the deliverables within an arrangement are separate performance obligations requires judgement by management. A deliverable is identified as a separate performance obligation if the customer benefits from it on its own or together with resources that are readily available to the customer and if it is separately identifiable from the other deliverables in the contract. The Company assesses if the deliverables are separately identifiable in the context of the contract by determining if it is highly interrelated with other deliverables in the contract. If these criteria are not met, the deliverables are accounted for as a combined performance obligation.
75
|
CONSOLIDATED FINANCIAL STATEMENTS
Notes to the Consolidated Financial Statements
For the years ended September 30, 2019 and 2018
(tabular amounts only are in thousands of Canadian dollars, except per share data)
| 3. | Summary of significant accounting policies (continued) |
USE OF JUDGEMENTS AND ESTIMATES (CONTINUED)
Deferred tax assets
Deferred tax assets are recognized for unused tax losses to the extent that it is probable that taxable income will be available against which the losses can be utilized. Management judgement is required concerning uncertainties that exist with respect to the timing of future taxable income required to recognize a deferred tax asset. The Company recognizes an income tax benefit only when it is probable that the tax benefit will be realized in the future. In making this judgement, the Company assesses forecasts and the availability of future tax planning strategies.
A description of estimates is included in the respective sections within the Notes to the Consolidated Financial Statements.
REVENUE RECOGNITION, WORK IN PROGRESS AND DEFERRED REVENUE
The Company generates revenue through the provision of managed IT and BPS, systems integration and consulting, as well as the sale of software solutions as described in Note 1, Description of business.
For the fiscal year ended September 30, 2019, under IFRS 15,Revenue from Contracts with Customers
The Company provides services and products under arrangements that contain various pricing mechanisms. The Company accounts for a contract or a group of contracts when the following criteria are met: the parties to the contract have approved the contract in which their rights, their obligations and the payment terms have been identified, the contract has commercial substance, and the collectability of the consideration is probable.
A contract modification is a change in the scope or price of an existing revenue-generating customer contract. The Company accounts for a contract modification as a separate contract when the scope of the contract increases because of the addition of promised performance obligations and the price of the contract increases by an amount of consideration that reflects its stand-alone selling prices. When the contract is not accounted for as a separate contract, the Company recognizes an adjustment to revenue on the existing contract on a cumulative catch-up basis as at the date of the contract modification or, if the remaining goods and services are distinct, the Company recognizes the remaining consideration prospectively.
Revenue is recognized when or as the Company satisfies a performance obligation by transferring a promise of good or service to the customer and are measured at the amount of consideration the Company expects to be entitled to receive, including variable consideration, such as, discounts, volume rebates, service-level penalties, and incentives. Variable consideration is estimated using either the expected value method or most likely amount method and is included only to the extent it is highly probable that a significant reversal of cumulative revenue recognized will not occur. In making this judgement, management will mostly consider all information available at the time (historical, current and forecasted), the Company’s knowledge of the client or the industry, the type of services to be delivered and the specific contractual terms of each arrangement.
Revenue from sales of third party vendor’s products, such as software licenses, hardware or services is recorded on a gross basis when the Company is a principal to the transaction and is recorded net of costs when the Company is acting as an agent between the client and vendor. To determine whether the Company is a principal or an agent, it evaluates whether control is obtained of the goods or services before they are transferred to the client. Factors generally considered include whether the Company has the primary responsibility for providing the product or service, adds meaningful value to the vendor’s product or service and has discretion establishing the price.
Relative stand-alone selling price
The Company’s arrangements often include a mix of the services and products as described below. If an arrangement involves the provision of multiple performance obligations, the total arrangement value is allocated to each performance obligations based on its relative stand-alone selling price. When estimating the stand-alone selling price of each performance obligations, the Company maximizes the use of observable prices which are established using the Company’s prices for same or similar deliverables. When observable prices are not available, the Company estimates stand-alone selling prices based on its best estimate. The best estimate of the stand-alone selling price is the price at which the Company would normally expect to offer the services or products and is established by considering a number of internal and external factors including, but not limited to, geographies, the Company’s pricing policies, internal costs and margins. Additionally, in certain circumstances, the Company may apply the residual approach when estimating the stand-alone price of software license products, for which the Company has not yet established the price or has not previously sold on a stand-alone basis.
76
|
| FISCAL 2019 RESULTS | |
Notes to the Consolidated Financial Statements
For the years ended September 30, 2019 and 2018
(tabular amounts only are in thousands of Canadian dollars, except per share data)
| 3. | Summary of significant accounting policies (continued) |
REVENUE RECOGNITION, WORK IN PROGRESS AND DEFERRED REVENUE (CONTINUED)
The appropriate revenue recognition method is applied for each performance obligation as described below.
Managed IT and business process services
Revenue from managed IT and business process services arrangements is generally recognized over time as the services are provided at the contractual billings, which corresponds with the value provided to the client, unless there is a better measure of performance or delivery.
Systems integration and consulting services
Revenue from systems integration and consulting services under time and material arrangements is recognized over time as the services are rendered, and revenue under cost-based arrangements is recognized over time as reimbursable costs are incurred. Contractual billings of such arrangements correspond with the value provided to the client, and therefore revenues are generally recognized when amounts become billable.
Revenue from systems integration and consulting services under fixed-fee arrangements is recognized using the percentage-of-completion method over time, as the Company has no alternative use for the asset created and has an enforceable right to payment for performance completed to date. The Company primarily uses labour costs or labour hours to measure the progress towards completion. This method relies on estimates of total expected labour costs or total expected labour hours to complete the service, which are compared to labour costs or labour hours incurred to date, to arrive at an estimate of the percentage of revenue earned to date. Factors considered in the estimates include: changes in scope of the contracts, delays in reaching milestones, complexities in project delivery, availability and retention of qualified IT professionals and/or the ability of the subcontractors to perform their obligation within agreed upon budget and timeframes. Management regularly reviews underlying estimates of total expected labour costs or hours.
Software licenses
Most of the Company’s software license arrangements include other services such as implementation, customization and maintenance. For these types of arrangements, revenue from a software license, when identified as a performance obligation, is recognized at a point in time upon delivery. Otherwise when the software is significantly customized, integrated or modified, it is combined with the implementation and customization services and is accounted for as described in the systems integration and consulting services section above. Revenue from maintenance services for software licenses sold is recognized straight-line over the term of the maintenance period.
Work in progress and deferred revenue
Amounts recognized as revenue in excess of billings are classified as work in progress. Amounts received in advance of the performance of services or delivery of products are classified as deferred revenue. Work in progress and deferred revenue are presented net on a contract by-contract basis.
CASH AND CASH EQUIVALENTS
Cash and cash equivalents consist of unrestricted cash and short-term investments having a maturity of three months or less from the date of purchase.
SHORT-TERM INVESTMENTS
Short-term investments, comprise generally of term deposits, have remaining maturities over three months, but not more than one year, at the date of purchase.
77
|
CONSOLIDATED FINANCIAL STATEMENTS
Notes to the Consolidated Financial Statements
For the years ended September 30, 2019 and 2018
(tabular amounts only are in thousands of Canadian dollars, except per share data)
| 3. | Summary of significant accounting policies (continued) |
FUNDS HELD FOR CLIENTS AND CLIENTS’ FUNDS OBLIGATIONS
In connection with the Company’s payroll, tax filing and claims services, the Company collects funds for payment of payroll, taxes and claims, temporarily holds such funds until payment is due, remits the funds to the clients’ employees, appropriate tax authorities or claims holders, files tax returns and handles related regulatory correspondence and amendments. The funds held for clients include cash and long-term bonds. The Company presents the funds held for clients and related obligations separately. Funds held for clients are classified as current assets since, based upon management’s intentions, these funds are held solely for the purpose of satisfying the clients’ funds obligations, which will be repaid within one year of the consolidated balance sheet date. The market fluctuations affect the fair value of the long-term bonds. Due to those fluctuations, funds held for clients might not equal to the clients’ funds obligations.
Interest income earned and realized gains and losses on the disposal of bonds are recorded in revenue in the period that the income is earned, as the collecting, holding and remitting of these funds are critical components of providing these services.
PROPERTY, PLANT AND EQUIPMENT
Property, plant and equipment (PP&E), including those under finance leases, are recorded at cost and are depreciated over their estimated useful lives using the straight-line method.
Buildings
| 10 to 40 years | |
Leasehold improvements
| Lesser of the useful life or lease term | |
Furniture, fixtures and equipment
| 3 to 20 years | |
Computer equipment | 3 to 5 years |
LEASES
Leases are classified as finance leases whenever the terms of the lease transfer substantially all the risks and rewards of ownership to the lessee. All other leases are classified as operating leases.
Assets held under finance leases are initially recognized in PP&E at an amount equal to the fair value of the leased assets or, if lower, the present value of minimum lease payments at the inception of the lease, and then depreciated over the economic useful life of the asset or lease term, whichever is shorter. The capital element of future lease payments is included in the consolidated balance sheets within long-term debt. Interest is charged to the consolidated statements of earnings so as to achieve a constant rate of interest on the remaining balance of the liability.
Lease payments under operating leases are charged to the consolidated statements of earnings on a straight-line basis over the lease term. Operating lease incentives, typically for premises, are recognized as a reduction in rental expense over the lease term.
CONTRACT COSTS
Contract costs are comprised primarily of transition costs incurred to implement long-term managed IT and business process services contracts and incentives.
Transition costs
Transition costs consist mostly of costs associated with the installation of systems and processes, as well as conversion of the client’s applications to the Company’s platforms incurred after the award of managed IT and business process services contracts. Transition costs are comprised essentially of labour costs, including compensation and related fringe benefits, as well as subcontractor costs.
Incentives
Occasionally, incentives are granted to clients upon the signing of managed IT and business process services contracts. These incentives are granted in the form of cash payments.
78
|
| FISCAL 2019 RESULTS | |
Notes to the Consolidated Financial Statements
For the years ended September 30, 2019 and 2018
(tabular amounts only are in thousands of Canadian dollars, except per share data)
| 3. | Summary of significant accounting policies (continued) |
CONTRACT COSTS (CONTINUED)
Amortization of contract costs
Contract costs are amortized using the straight-line method over the period services are provided. Amortization of transition costs is included in costs of services, selling and administrative and amortization of incentives is recorded as a reduction of revenue.
Impairment of contract costs
When a contract is not expected to be profitable, the estimated loss is first applied to impair the related capitalized contract costs. The excess of the expected loss over the capitalized contract costs is recorded as onerous revenue-generating contracts in provisions. If at a future date the contract returns to profitability, the previously recognized impairment loss must be reversed. First the estimated losses on revenue-generating contracts must be reversed, and if there is still additional projected profitability then any capitalized contract costs that were impaired must be reversed. The reversal of the impairment loss is limited so that the carrying amount does not exceed its recoverable amount, nor exceed the carrying amount that would have been determined, net of amortization, had no impairment loss been recognized for the contract costs in prior years.
INTANGIBLE ASSETS
Intangible assets consist mainly of internal-use software, business solutions, software licenses and client relationships. Internal-use software, business solutions and software licenses are recorded at cost. Internal-use software developed internally is capitalized when it meets specific capitalization criteria related to technical and financial feasibility and when the Company demonstrates its ability and intention to use it. Business solutions developed internally and marketed are capitalized when they meet specific capitalization criteria related to technical, market and financial feasibility. Internal-use software, business solutions, software licenses and client relationships acquired through business combinations are initially recorded at their fair value based on the present value of expected future cash flows, which involves estimates, such as the forecasting of future cash flows and discount rates.
Amortization of intangible assets
The Company amortizes its intangible assets using the straight-line method over their estimated useful lives.
Internal-use software
| 2 to 7 years | |
Business solutions
| 2 to 10 years | |
Software licenses
| 3 to 8 years | |
Client relationships | 2 to 10 years |
IMPAIRMENT OF PP&E, INTANGIBLE ASSETS AND GOODWILL
Timing of impairment testing
The carrying values of PP&E, intangible assets and goodwill are reviewed for impairment when events or changes in circumstances indicate that the carrying value may be impaired. The Company assesses at each reporting date whether any such events or changes in circumstances exist. The carrying values of PP&E and intangible assets not available for use are tested for impairment annually as at September 30. Goodwill is tested for impairment annually during the fourth quarter of each fiscal year.
79
|
CONSOLIDATED FINANCIAL STATEMENTS
Notes to the Consolidated Financial Statements
For the years ended September 30, 2019 and 2018
(tabular amounts only are in thousands of Canadian dollars, except per share data)
| 3. | Summary of significant accounting policies (continued) |
IMPAIRMENT OF PP&E, INTANGIBLE ASSETS AND GOODWILL (CONTINUED)
Impairment testing
If any indication of impairment exists or when annual impairment testing for an asset is required, the Company estimates the recoverable amount of the asset or cash-generating unit (CGU) to which the asset relates to determine the extent of any impairment loss. The recoverable amount is the higher of an asset’s or CGU’s fair value less costs of disposal and its value in use (VIU) to the Company. The Company mainly uses the VIU. In assessing the VIU, estimated future cash flows are discounted to their present value using a discount rate that reflects current market assessments of the time value of money and the risks specific to the asset or CGU. In determining fair value less costs of disposal, recent market transactions are taken into account, if available. If the recoverable amount of an asset or a CGU is estimated to be less than its carrying amount, the carrying amount is reduced to its recoverable amount. An impairment loss is recognized immediately in the consolidated statements of earnings.
Goodwill acquired through business combinations is allocated to the CGU or group of CGUs that are expected to benefit from acquired work force and synergies of the related business combination. The group of CGUs that benefit from the acquired work force and synergies correspond to the Company’s operating segments. For goodwill impairment testing purposes, the group of CGUs that represents the lowest level within the Company at which management monitors goodwill is the operating segment level.
The recoverable amount of each operating segment has been determined based on the VIU calculation which includes estimates about their future financial performance based on cash flows approved by management covering a period of five years. Key assumptions used in the VIU calculations are the discount rate applied and the long-term growth rate of net operating cash flows. In determining these assumptions, management has taken into consideration the current economic environment and its resulting impact on expected growth and discount rates. The cash flow projections reflect management’s expectations of the operating segment’s operating performance and growth prospects in the operating segment’s market. The discount rate applied to an operating segment is the weighted average cost of capital (WACC). Management considers factors such as country risk premium, risk-free rate, size premium and cost of debt to derive the WACC. Impairment losses relating to goodwill cannot be reversed in future periods.
For impaired assets, other than goodwill, an assessment is made at each reporting date as to whether there is any indication that previously recognized impairment losses may no longer exist or may have decreased. If such indication exists, the Company estimates the recoverable amount of the asset. A previously recognized impairment loss is reversed only if there has been a change in the assumptions used to determine the recoverable amount of the asset since the last impairment loss was recognized. The reversal is limited so that the carrying amount of the asset does not exceed its recoverable amount, nor exceed the carrying amount that would have been determined, net of amortization, had no impairment loss been recognized for the asset in prior years. Such reversal is recognized in the consolidated statements of earnings.
LONG-TERM FINANCIAL ASSETS
Long-term investments presented in long-term financial assets are comprised of bonds which are presented as long-term based on management’s intentions.
BUSINESS COMBINATIONS
The Company accounts for its business combinations using the acquisition method. Under this method, the consideration transferred is measured at fair value. Acquisition-related and integration costs associated with the business combination are expensed as incurred or when a present legal or constructive obligation exists. The Company recognizes goodwill as the excess of the cost of the acquisition over the net identifiable tangible and intangible assets acquired and liabilities assumed at their acquisition-date fair values. The goodwill recognized is composed of the future economic value associated to acquired work force and synergies with the Company’s operations which are primarily due to reduction of costs and new business opportunities. Management makes assumptions when determining the acquisition-date fair values of the identifiable tangible and intangible assets acquired and liabilities assumed which involve estimates, such as the forecasting of future cash flows, discount rates, and the useful lives of the assets acquired. Subsequent changes in fair values are adjusted against the cost of acquisition if they qualify as measurement period adjustments. The measurement period is the period between the date of acquisition and the date where all significant information necessary to determine the fair values is available, not to exceed 12 months. All other subsequent changes in estimate are recognized in the consolidated statements of earnings.
80
|
| FISCAL 2019 RESULTS | |
Notes to the Consolidated Financial Statements
For the years ended September 30, 2019 and 2018
(tabular amounts only are in thousands of Canadian dollars, except per share data)
| 3. | Summary of significant accounting policies (continued) |
EARNINGS PER SHARE
Basic earnings per share is based on the weighted average number of shares outstanding during the period. Diluted earnings per share is determined using the treasury stock method to evaluate the dilutive effect of stock options and performance share units (PSUs).
RESEARCH AND SOFTWARE DEVELOPMENT COSTS
Research costs are charged to earnings in the period in which they are incurred, net of related tax credits. Software development costs related to internal-use software and business solutions are charged to earnings in the year they are incurred, net of related tax credits, unless they meet specific capitalization criteria related to technical, market and financial feasibility as described in the Intangible assets section above.
TAX CREDITS
The Company follows the income approach to account for research and development (R&D) and other tax credits, whereby investment tax credits are recorded when there is a reasonable assurance that the assistance will be received and that the Company will comply with all relevant conditions. Under this method, tax credits related to operating expenditures are recorded as a reduction of the related expenses and recognized in the period in which the related expenditures are charged to earnings. Tax credits related to capital expenditures are recorded as a reduction of the cost of the related assets. The tax credits recorded are based on management’s best estimates of amounts expected to be received and are subject to audit by the taxation authorities.
INCOME TAXES
Income taxes are accounted for using the liability method of accounting.
Current income taxes are recognized with respect to the amounts expected to be paid or recovered under the tax rates and laws that have been enacted or substantively enacted at the balance sheets date.
Deferred tax assets and liabilities are determined based on deductible or taxable temporary differences between the amounts reported for consolidated financial statement purposes and tax values of the assets and liabilities using enacted or substantively enacted tax rates that will be in effect for the year in which the differences are expected to be recovered or settled. Deferred tax assets and liabilities are recognized in earnings, in other comprehensive income or in equity based on the classification of the item to which they relate.
Deferred tax assets are recognized for unused tax losses to the extent that it is probable that taxable profit will be available against which the losses can be utilized. Once this assessment is made, the Company considers the analysis of forecasts and future tax planning strategies. Estimates of taxable profit are made based on the forecast by jurisdiction on an undiscounted basis. In addition, management considers factors such as substantively enacted tax rates, the history of the taxable profits and availability of tax strategies.
The Company is subject to taxation in numerous jurisdictions and there are transactions and calculations for which the ultimate tax determination is uncertain. When a tax position is uncertain, the Company recognizes an income tax asset or reduces an income tax liability only when it is probable that the tax asset will be realized in the future or that the income tax liability is no longer probable. The provision for uncertain tax positions is made using the best estimate of the amount expected to be paid based on qualitative assessment of all relevant factors such as experience of previous tax audits or interpretations of tax regulations.
PROVISIONS
Provisions are recognized when the Company has a present legal or constructive obligation as a result of a past event, it is probable that an outflow of resources embodying economic benefits will be required to settle the obligation and a reliable estimate can be made of the amount of the obligation. The Company’s provisions consist of liabilities for leases of vacated premises, litigation and claims provisions arising in the ordinary course of business, decommissioning liabilities for operating leases of office buildings and onerous revenue-generating contracts. The Company also records restructuring provisions for termination of employment costs related to its productivity improvement initiatives and to the integration of its business acquisitions.
The amount recognized as a provision is the best estimate of the consideration required to settle the present obligation at the end of the reporting period, taking into account the risks and uncertainties surrounding the obligation. Provisions are discounted using a current pre-tax rate when the impact of the time value of money is material. The increase in the provisions due to the passage of time is recognized as finance costs.
81
|
CONSOLIDATED FINANCIAL STATEMENTS
Notes to the Consolidated Financial Statements
For the years ended September 30, 2019 and 2018
(tabular amounts only are in thousands of Canadian dollars, except per share data)
| 3. | Summary of significant accounting policies (continued) |
PROVISIONS (CONTINUED)
The Company accrues provisions for onerous leases which consist of estimated costs associated with vacated premises. The provisions reflect the present value of lease payments in excess of the expected sublease proceeds on the remaining term of the lease.
The accrued litigation and legal claims provisions are based on historical experience, current trends and other assumptions that are believed to be reasonable under the circumstances. Estimates include the period in which the underlying cause of the claim occurred and the degree of probability of an unfavourable outcome.
Decommissioning liabilities pertain to operating leases of buildings where certain arrangements require premises to be returned to their original state at the end of the lease term. The provision is determined using the present value of the estimated future cash outflows.
Provisions for onerous revenue-generating contracts are recorded when unavoidable costs of fulfilling the contract exceed the estimated total revenue from the contract. Management regularly reviews arrangement profitability and the underlying estimates.
Restructuring provisions are recognized when a detailed formal plan identifies the business or part of the business concerned, the location and number of employees affected, a detailed estimate of the associated costs, appropriate timelines and has been communicated to those affected by it.
TRANSLATION OF FOREIGN CURRENCIES
The Company’s consolidated financial statements are presented in Canadian dollars, which is also the parent company’s functional currency. Each entity in the Company determines its own functional currency and items included in the financial statements of each entity are measured using that functional currency. Functional currency is the currency of the primary economic environment in which the entity operates.
Foreign currency transactions and balances
Revenue, expenses and non-monetary assets and liabilities denominated in foreign currencies are recorded at the rate of exchange prevailing at the transaction date. Monetary assets and liabilities denominated in foreign currencies are translated at exchange rates prevailing at the balance sheets date. Unrealized and realized translation gains and losses are reflected in the consolidated statements of earnings.
Foreign operations
For foreign operations that have functional currencies different from the Company, assets and liabilities denominated in a foreign currency are translated at exchange rates in effect at the balance sheets date. Revenue and expenses are translated at average exchange rates prevailing during the period. Resulting unrealized gains or losses on translating financial statements of foreign operations are reported in other comprehensive income.
For foreign operations with the same functional currency as the Company, monetary assets and liabilities are translated at the exchange rates in effect at the balance sheets date and non-monetary assets and liabilities are translated at historical exchange rates. Revenue and expenses are translated at average exchange rates during the period. Translation exchange gains or losses of such operations are reflected in the consolidated statements of earnings.
82
|
| �� | FISCAL 2019 RESULTS | |
Notes to the Consolidated Financial Statements
For the years ended September 30, 2019 and 2018
(tabular amounts only are in thousands of Canadian dollars, except per share data)
| 3. | Summary of significant accounting policies (continued) |
SHARE-BASED PAYMENTS
Equity-settled plans
The Company operates equity-settled stock option and PSU plans under which the Company receives services from employees, officers and directors as consideration for equity instruments.
The fair value of those share-based payments is established on the grant date using the Black-Scholes option pricing model for the stock options and the closing price of Class A subordinate voting shares of the Company on the Toronto Stock Exchange (TSX) for the PSUs. The number of stock options and PSUs expected to vest are estimated on the grant date and subsequently revised on each reporting date. For stock options, the estimation of fair value requires making assumptions for the most appropriate inputs to the valuation model including the expected life of the option and expected stock price volatility. The fair value of share-based payments, adjusted for expectations related to performance conditions and forfeitures, are recognized as share-based payment costs over the vesting period in earnings with a corresponding credit to contributed surplus on a graded-vesting basis if they vest annually or on a straight-line basis if they vest at the end of the vesting period.
When stock options are exercised, any consideration paid is credited to capital stock and the recorded fair value of the stock options is removed from contributed surplus and credited to capital stock. When PSUs are exercised, the recorded fair value of PSUs is removed from contributed surplus and credited to capital stock.
Share purchase plan
The Company operates a share purchase plan for eligible employees. Under this plan, the Company matches the contributions made by employees up to a maximum percentage of the employee’s salary. The Company’s contributions to the plan are recognized in salaries and other member costs within costs of services, selling and administrative.
Cash-settled deferred share units
The Company operates a deferred share unit (DSU) plan to compensate the external members of the Board of Directors. The expense is recognized within costs of services, selling and administrative for each DSU granted equal to the closing price of Class A subordinate voting shares of the Company on the TSX at the date on which DSUs are awarded and a corresponding liability is recorded in accrued compensation. After the grant date, the DSU liability is remeasured for subsequent changes in the fair value of the Company’s shares.
FINANCIAL INSTRUMENTS
For the fiscal year ended September 30, 2019, under IFRS 9,Financial Instruments
All financial instruments are initially measured at their fair value and are subsequently classified either at amortized cost, at fair value through earnings (FVTE) or at fair value through other comprehensive income (FVOCI). Financial assets are classified based on the Company’s management model of such instruments and their contractual cash flows they generate. Financial liabilities are classified and measured at amortized cost, unless they are held for trading and classified as FVTE.
The Company has made the following classifications:
FVTE
Cash and cash equivalents, derivative financial instruments and deferred compensation plan assets within long-term financial assets are measured at fair value at the end of each reporting period and the resulting gains or losses are recorded in the consolidated statements of earnings.
Amortized Cost
Trade accounts receivable, cash included in funds held for clients, long-term receivables within long-term financial assets, accounts payable and accrued liabilities, accrued compensation, long-term debt and clients’ funds obligations are measured at amortized cost using the effective interest method. Financial assets classified at amortized cost are subject to impairment. For trade accounts receivable and long-term receivables, as well for work in progress, the Company applies the simplified approach to measure expected credit losses, which requires lifetime expected loss allowance to be recorded upon initial recognition of the financial assets.
83
|
CONSOLIDATED FINANCIAL STATEMENTS
Notes to the Consolidated Financial Statements
For the years ended September 30, 2019 and 2018
(tabular amounts only are in thousands of Canadian dollars, except per share data)
| 3. | Summary of significant accounting policies (continued) |
FINANCIAL INSTRUMENTS (CONTINUED)
FVOCI
Long-term bonds included in funds held for clients and in long-term investments within long-term financial assets are measured at fair value through other comprehensive income and are subject to impairment for which the Company uses the low credit risk exemption.
The unrealized gains and losses, net of applicable income taxes, are recorded in other comprehensive income. Interest income measured using the effective interest method and realized gains and losses on derecognition are recorded in the consolidated statements of earnings.
Transaction costs are comprised primarily of legal, accounting and other costs directly attributable to the issuance of the respective financial assets and liabilities. Transaction costs are capitalized to the cost of financial assets and liabilities classified as other than FVTE.
Financial assets are derecognized if the contractual rights to the cash flows from the financial asset expire or the asset is transferred and the transfer qualifies for derecognition as substantially all the risks and rewards of ownership of the financial asset have been transferred.
Fair value hierarchy
Fair value measurements recognized on the balance sheets are classified in accordance with the following levels:
Level 1: quoted prices (unadjusted) in active markets for identical assets or liabilities;
Level 2: inputs other than quoted prices included in Level 1, but that are observable for the asset or liability, either directly or indirectly; and
Level 3: inputs for the asset or liability that are not based on observable market data.
DERIVATIVE FINANCIAL INSTRUMENTS AND HEDGING TRANSACTIONS
The Company enters into a variety of derivative financial instruments to manage its exposure to interest rate and foreign currency exchange risks.
Derivative financial instruments are initially recognized at fair value at the date the derivative contracts are entered into and are subsequently remeasured to their fair value at the end of each reporting date. The resulting gain or loss is recognized in the consolidated statements of earnings, unless the derivative is designated and is effective as a hedging instrument, in which event the timing of the recognition in the consolidated statements of earnings depends on the nature of the hedge relationship. The cash flows of the hedging instruments are classified in the same manner as the cash flows of the item being hedged.
At the inception of a hedge relationship, the Company formally designates and documents the hedge relationship to which the Company wishes to apply hedge accounting and the risk management’s objective and strategy for undertaking the hedge. The documentation includes the identification of the nature of the risk being hedged, the economic relationship between the hedged item and the hedging instruments which should not be dominated by credit risk, the hedge ratio consistent with the risk management strategy pursued and how the Company will assess the effectiveness of the hedging relationship on an ongoing basis.
Management evaluates hedge effectiveness at inception of the hedge instrument and quarterly thereafter generally based on a managed hedge ratio of 1:1. Hedge effectiveness is measured prospectively as the extent to which changes in the fair value or cash flows of the derivative offsets the changes in the fair value or cash flows of the underlying hedged instrument or risk when there is a significant mismatch between the terms of the hedging instrument and the hedged item. Any meaningful imbalance is considered ineffectiveness in the hedge and accounted for accordingly in the consolidated statements of earnings.
Hedges of net investments in foreign operations
The Company uses cross-currency swaps and foreign currency denominated long-term debt to hedge portions of the Company’s net investments in its U.S. and European operations. Foreign exchange translation gains or losses on the net investments and the effective portions of gains or losses on instruments hedging the net investments are recorded in other comprehensive income. Gains or losses relating to the ineffective portion are recognized in consolidated statements of earnings. When the hedged net investment is disposed of, the relevant amount in other comprehensive income is transferred to earnings as part of the gain or loss on disposal.
84
|
| FISCAL 2019 RESULTS | |
Notes to the Consolidated Financial Statements
For the years ended September 30, 2019 and 2018
(tabular amounts only are in thousands of Canadian dollars, except per share data)
| 3. | Summary of significant accounting policies (continued) |
DERIVATIVE FINANCIAL INSTRUMENTS AND HEDGING TRANSACTIONS (CONTINUED)
Cash flow hedges of future revenue and long-term debt
The majority of the Company’s revenue and costs are denominated in a currency other than the Canadian dollar. The risk of foreign exchange fluctuations impacting the results is substantially mitigated by matching the Company’s costs with revenue denominated in the same currency. In certain cases where there is a substantial imbalance for a specific currency, the Company enters into foreign currency forward contracts to hedge the variability in the foreign currency exchange rates.
The Company also uses interest rate and cross-currency swaps to hedge either the cash flow exposure or the foreign exchange exposure of the long-term debt.
The effective portion of the change in fair value of the derivative financial instruments is recognized in other comprehensive income and the ineffective portion, if any, in the consolidated statements of earnings. The effective portion of the change in fair value of the derivatives is reclassified out of other comprehensive income into the consolidated statements of earnings when the hedged item is recognized in the consolidated statements of earnings.
Fair value hedges of Senior U.S. unsecured notes
The Company entered into interest rate swaps to hedge the fair value exposure of the issued fixed rate Senior U.S. unsecured notes. Under the interest rate swaps, the Company receives a fixed rate of interest and pays interest at a variable rate on the notional amount.
The changes in the fair value of the interest rate swaps are recognized in the consolidated statements of earnings as finance costs. The changes in the fair value of the hedged items attributable to the risk hedged is recorded as part of the carrying value of the Senior U.S. unsecured notes and are also recognized in the consolidated statements of earnings as finance costs. If the hedged items are derecognized, the unamortized fair value is recognized immediately in the consolidated statements of earnings.
Cost of hedging
Company may elect to account for forward element of forward contracts or foreign currency basis spread as costs of hedging. In such cases, the deferred costs of hedging, net of applicable income taxes, are recognized as a separate component of the accumulated other comprehensive income and reclassified in the consolidated statements of earnings when the hedged item is recognized.
EMPLOYEE BENEFITS
The Company operates both defined benefit and defined contribution post-employment benefit plans.
The cost of defined contribution plans is charged to the consolidated statements of earnings on the basis of contributions payable by the Company during the year.
For defined benefit plans, the defined benefit obligations are calculated by independent actuaries using the projected unit credit method. The retirement benefits obligations in the consolidated balance sheets represent the present value of the defined benefit obligations as reduced by the fair value of plan assets. The retirement benefits assets are recognized to the extent that the Company can benefit from refunds or a reduction in future contributions. Retirement benefits plans that are funded by the payment of insurance premiums are treated as defined contribution plans unless the Company has an obligation either to pay the benefits directly when they fall due or to pay further amounts if assets accumulated with the insurer do not cover all future employee benefits. In such circumstances, the plan is treated as a defined benefit plan.
Insurance policies are treated as plan assets of a defined benefit plan if the proceeds of the policy:
| - | Can only be used to fund employee benefits; |
| - | Are not available to the Company’s creditors; and |
| - | Either cannot be paid to the Company unless the proceeds represent surplus assets not needed to meet all the benefit obligations or are a reimbursement for benefits already paid by the Company. |
Insurance policies that do not meet the above criteria are treated as non-current investments and are held at fair value as long-term financial assets in the consolidated balance sheets.
85
|
CONSOLIDATED FINANCIAL STATEMENTS
Notes to the Consolidated Financial Statements
For the years ended September 30, 2019 and 2018
(tabular amounts only are in thousands of Canadian dollars, except per share data)
| 3. | Summary of significant accounting policies (continued) |
EMPLOYEE BENEFITS (CONTINUED)
The actuarial valuations used to determine the cost of defined benefit pension plans and their present value involve making assumptions about discount rates, future salary and pension increases, inflation rates and mortality. Any changes in these assumptions will impact the carrying amount of pension obligations. In determining the appropriate discount rate, management considers the interest rates of high quality corporate bonds that are denominated in the currency in which the benefits will be paid, and that have terms to maturity approximating the terms of the related pension liability.
The current service cost is recognized in the consolidated statements of earnings under costs of services, selling and administrative. The net interest cost calculated by applying the discount rate to the net defined benefit liabilities or assets is recognized as net finance cost or income. When the benefits of a plan are changed or when a plan is curtailed, the resulting change in benefits that relates to past services or the gains or losses on curtailment is recognized immediately in the consolidated statements of earnings. The gains or losses on the settlement of a defined benefit plan are recognized when the settlement occurs.
Remeasurements on defined benefit plans include actuarial gains and losses, changes in the effect of the asset ceiling and the return on plan assets, excluding the amount included in net interest on the net defined liabilities or assets. Remeasurements are charged or credited to other comprehensive income in the period in which they arise.
ADOPTION OF ACCOUNTING STANDARDS
The following standards have been adopted by the Company on October 1, 2018:
IFRS 15 - Revenue from Contracts with Customers
In May 2014, the IASB issued IFRS 15,Revenue from Contracts with Customers, to specify how and when to recognize revenue as well as requiring the provision of more informative and relevant disclosures. The standard supersedes IAS 18,Revenue, IAS 11,Construction Contracts, and other revenue related interpretations.
IFRS 15 was adopted by the Company using the modified retrospective method, with no restatement of comparative figures. The Company’s policies applicable prior to October 1, 2018 are described below. The main changes to these accounting policies are as follows:
| – | Initial implementation activities of managed IT and business process services arrangements, previously not considered as a separately identifiable component, could be in some cases identified as a separate performance obligation if they meet the criteria of being distinct under IFRS 15 resulting in acceleration of revenue recognition and related contract costs. |
| – | Previously, when a software license had value to the client on a stand-alone basis and was identified as a separately identifiable component, revenue from the software license was recognized upon delivery. Under IFRS 15, when the arrangement involves significant customization services, revenue from a software license is now combined with the services resulting in deferral of revenue recognition. |
| – | The Company changed its presentation of work in progress and deferred revenue which are now presented net on a contract by-contract basis separately from accounts receivable and no longer for each project as it was previously the case for systems integration and consulting services arrangements. |
| – | IFRS 15 indicates that IAS 37,Provisions, Contingent Liabilities and Contingent Assets, should now be applied to estimated losses on revenue-generating contracts. Therefore, related amounts previously classified as accounts payable and accrued liabilities and other long-term liabilities are now classified as current and non-current provisions. |
| – | IFRS 15 requires additional disclosures such as information on disaggregation of revenue from contracts with customers by geography, service type and major clients and on remaining performance obligations, which are respectively provided in Note 27, Segmented Information and Note 21, Remaining performance obligations. |
The adoption of IFRS 15 did not have a material impact on the Company’s consolidated financial statements.
86
|
| FISCAL 2019 RESULTS | |
Notes to the Consolidated Financial Statements
For the years ended September 30, 2019 and 2018
(tabular amounts only are in thousands of Canadian dollars, except per share data)
| 3. | Summary of significant accounting policies (continued) |
ADOPTION OF ACCOUNTING STANDARDS (CONTINUED)
IFRS 15 - Revenue from Contracts with Customers (continued)
Accounting policies for the fiscal year ended September 30, 2018, under IAS 18, Revenueand IAS 11, Construction Contracts
The Company provides services and products under arrangements that contain various pricing mechanisms. The Company recognizes revenue when the following criteria are met: there is clear evidence that an arrangement exists, the amount of revenue and related costs can be measured reliably, it is probable that future economic benefits will flow to the Company, the stage of completion can be measured reliably where services are delivered and the significant risks and rewards of ownership, including effective control, are transferred to clients where products are sold. Revenue is measured at the fair value of the consideration received or receivable net of discounts, volume rebates and sales related taxes.
Some of the Company’s arrangements may include client acceptance clauses. Each clause is analyzed to determine whether the earnings process is complete when the service is performed. Formal client sign-off is not always necessary to recognize revenue provided that the Company objectively demonstrates that the criteria specified in the acceptance provisions are satisfied. Some of the criteria reviewed include historical experience with similar types of arrangements, whether the acceptance provisions are specific to the client or are included in all arrangements, the length of the acceptance term and historical experience with the specific client.
Revenue from sales of third party vendor’s products, such as software licenses, hardware or services is recorded on a gross basis when the Company is a principal to the transaction and is recorded net of costs when the Company is acting as an agent between the client and vendor. Factors generally considered to determine whether the Company is a principal or an agent include if the Company has the primary responsibility for providing the product or service, adds meaningful value to the vendor’s product or service, has discretion in supplier selection and assumes credit risks.
Revenue recognition of multiple component arrangements
Assessing whether the deliverables within an arrangement are separately identifiable components requires judgement by management. A component is considered as separately identifiable if it has value to the client on a stand-alone basis. The Company first reviews the contract clauses to evaluate if the deliverable is accepted separately by the client. Then, the Company assesses if the deliverable could have been provided by another vendor and if it would have been possible for the client to decide to not purchase the deliverable.
Relative selling price
The Company’s arrangements often include a mix of the services and products as described below. If an arrangement involves the provision of multiple components, the total arrangement value is allocated to each separately identifiable component based on its relative selling price. When estimating the selling price of each component, the Company maximizes the use of observable prices which are established using the Company’s prices for same or similar components. When observable prices are not available, the Company estimates selling prices based on its best estimate. The best estimate of the selling price is the price at which the Company would normally expect to offer the services or products and is established by considering a number of internal and external factors including, but not limited to, geographies, the Company’s pricing policies, internal costs and margins. The appropriate revenue recognition method is applied for each separately identifiable component as described below.
Managed IT and BPS
Revenue from managed IT and BPS arrangements is generally recognized as the services are provided at the contractually stated price, unless there is a better measure of performance or delivery.
87
|
CONSOLIDATED FINANCIAL STATEMENTS
Notes to the Consolidated Financial Statements
For the years ended September 30, 2019 and 2018
(tabular amounts only are in thousands of Canadian dollars, except per share data)
| 3. | Summary of significant accounting policies (continued) |
ADOPTION OF ACCOUNTING STANDARDS (CONTINUED)
IFRS 15 - Revenue from Contracts with Customers (continued)
Accounting policies for the fiscal year ended September 30, 2018, under IAS 18, Revenueand IAS 11, Construction Contracts(continued)
Systems integration and consulting services
Revenue from systems integration and consulting services under time and material arrangements is recognized as the services are rendered, and revenue under cost-based arrangements is recognized as reimbursable costs are incurred.
Revenue from systems integration and consulting services under fixed-fee arrangements where the outcome of the arrangements can be estimated reliably is recognized using the percentage-of-completion method over the service period. The Company primarily uses labour costs or labour hours to measure the progress towards completion. This method relies on estimates of total expected labour costs or total expected labour hours to complete the service, which are compared to labour costs or labour hours incurred to date, to arrive at an estimate of the percentage of revenue earned to date. Management regularly reviews underlying estimates of total expected labour costs or hours. If the outcome of an arrangement cannot be estimated reliably, revenue is recognized to the extent of arrangement costs incurred if it is probable that such costs will be recoverable.
Revenue from benefits-funded arrangements is recognized only to the extent that it is probable that the stream associated with the transaction will generate sufficient amounts to fund the value on which revenue recognition is based.
Software licenses
Most of the Company’s software license arrangements include other services such as implementation, customization and maintenance. For these types of arrangements, revenue from a software license is recognized upon delivery if it has been identified as a separately identifiable component. Otherwise, it is combined with the implementation and customization services and is accounted for as described in the Systems integration and consulting services section above. Revenue from maintenance services for software licenses sold is recognized ratably over the term of the maintenance period.
Work in progress and deferred revenue
Amounts recognized as revenue in excess of billings are classified as work in progress. Amounts received in advance of the performance of services or delivery of products are classified as deferred revenue.
Estimated losses on revenue-generating contracts
Estimated losses on revenue-generating contracts may occur due to additional costs which were not foreseen at inception of the contract. Contract losses are measured at the amount by which the estimated total costs exceed the estimated total revenue from the contract. The estimated losses on revenue-generating contracts are recognized in the period when it is determined that a loss is probable. The expected loss is first applied to impair the related capitalized contract costs with the excess recorded in accounts payable and accrued liabilities and in other long-term liabilities. Management regularly reviews arrangement profitability and the underlying estimates.
88
|
| FISCAL 2019 RESULTS | |
Notes to the Consolidated Financial Statements
For the years ended September 30, 2019 and 2018
(tabular amounts only are in thousands of Canadian dollars, except per share data)
| 3. | Summary of significant accounting policies (continued) |
ADOPTION OF ACCOUNTING STANDARDS (CONTINUED)
IFRS 9 - Financial instruments
In July 2014, the IASB amended IFRS 9,Financial Instruments, to replace IAS 39,Financial Instruments:Recognition and Measurement.
IFRS 9 was adopted retrospectively by the Company, with no restatement of comparative figures. The Company’s policies applicable prior to October 1, 2018 are described below. The main changes to these accounting policies are as follows:
| – | The standard simplifies the classification of financial assets, while carrying forward most of the requirements of IAS 39. The Company’s financial assets previously classified as loans and receivables are now classified at amortized cost and continue to be measured as such. Financial assets previously classified as available-for-sale are now classified at fair value through other comprehensive income and continue to be measured as such. Other financial assets and derivatives that do not qualify for hedge accounting are still classified and measured at fair value through earnings. Financial liabilities previously classified as other liabilities are now classified at amortized cost and continue to be measured as such. |
| – | The standard introduces a new impairment model which applies to the Company’s trade accounts receivable, work in progress, long-term receivables and long-term bonds. The Company is not subject to any significant credit risk, given its large and diversified client base and its risk mitigation strategy to invest in high credit quality corporate and government bonds with a credit rating of A or higher. The Company has applied the simplified approach on its accounts receivable, work in progress and long-term receivables and used the low credit risk exemption on its long-term bonds. |
| – | Finally, IFRS 9 introduces a new hedge accounting model that is more closely aligned with risk-management activities. The Company had applied the new hedge accounting model and the existing hedge relationships continue to qualify for hedge accounting under this new model. The Company had elected to account for the forward element of the cross- currency swaps as costs of hedging. |
| – | The additional annual disclosures are provided in Note 30, Financial instruments. |
The adoption of IFRS 9 did not have a material impact on the Company’s consolidated financial statements.
Accounting policies for the fiscal year ended September 30, 2018, under IAS 39, Financial Instruments: recognition and measurement
All financial instruments are initially measured at their fair value. Subsequently, financial assets classified as loans and receivables and financial liabilities classified as other liabilities are measured at their amortized cost using the effective interest rate method.
Financial assets and liabilities classified as fair value through earnings (FVTE) and classified as available-for-sale are measured subsequently at their fair value.
Financial instruments may be designated on initial recognition as FVTE if any of the following criteria are met: i) the financial instrument contains one or more embedded derivatives that otherwise would have to be accounted for separately; ii) the designation eliminates or significantly reduces a measurement or recognition inconsistency that would otherwise arise from measuring the financial asset or liability or recognizing the gains and losses on them on a different basis; or iii) the financial asset and financial liability are part of a group of financial assets or liabilities that is managed and its performance evaluated on a fair value basis, in accordance with a documented risk management or investment strategy. Gains and losses related to periodic revaluations of financial assets and liabilities designated as FVTE are recorded in the consolidated statements of earnings.
The unrealized gains and losses, net of applicable income taxes, on available-for-sale assets are reported in other comprehensive income. Interest income earned and realized gains and losses on the sale of available-for-sale assets are recorded in the consolidated statements of earnings.
89
|
CONSOLIDATED FINANCIAL STATEMENTS
Notes to the Consolidated Financial Statements
For the years ended September 30, 2019 and 2018
(tabular amounts only are in thousands of Canadian dollars, except per share data)
| 3. | Summary of significant accounting policies (continued) |
ADOPTION OF ACCOUNTING STANDARDS (CONTINUED)
IFRS 9 - Financial instruments (continued)
Accounting policies for the fiscal year ended September 30, 2018, under IAS 39, Financial Instruments: recognition and measurement(continued)
Transaction costs are comprised primarily of legal, accounting and other costs directly attributable to the issuance of the respective financial assets and liabilities. Transaction costs are capitalized to the cost of financial assets and liabilities classified as other than FVTE.
Financial assets are derecognized if the contractual rights to the cash flows from the financial asset expire or the asset is transferred and the transfer qualifies for derecognition. The transfer qualifies for derecognition if substantially all the risks and rewards of ownership of the financial asset are transferred.
The Company has made the following classifications:
FVTE
Cash and cash equivalents and derivative financial instruments unless they qualify for hedge accounting. In addition, deferred compensation plan assets within long-term financial assets were designated by management as FVTE upon initial recognition as this reflected management’s investment strategy.
Loans and receivables
Trade accounts receivable, cash included in funds held for clients and long-term receivables within long-term financial assets.
Available-for-sale
Long-term bonds included in funds held for clients and in long-term investments within long-term financial assets.
Other liabilities
Accounts payable and accrued liabilities, accrued compensation, long-term debt and clients’ funds obligations.
Fair value hierarchy
Fair value measurements recognized in the balance sheets are categorized in accordance with the following levels:
Level 1: quoted prices (unadjusted) in active markets for identical assets or liabilities;
Level 2: inputs other than quoted prices included in Level 1, but that are observable for the asset or liability, either directly or indirectly; and
Level 3: inputs for the asset or liability that are not based on observable market data.
DERIVATIVE FINANCIAL INSTRUMENTS AND HEDGING TRANSACTIONS
The Company enters into a variety of derivative financial instruments to manage its exposure to interest rate and foreign currency exchange risks.
Derivative financial instruments are initially recognized at fair value at the date the derivative contracts are entered into and are subsequently remeasured to their fair value at the end of each reporting date. The resulting gain or loss is recognized in the consolidated statements of earnings, unless the derivative is designated and is effective as a hedging instrument, in which event the timing of the recognition in the consolidated statements of earnings depends on the nature of the hedge relationship.
At the inception of a hedge relationship, the Company formally designates and documents the hedge relationship to which the Company wishes to apply hedge accounting and the risk management’s objective and strategy for undertaking the hedge. The documentation includes identification of the hedging instrument, the hedged item or transaction, the nature of the risk being hedged and how the Company will assess the effectiveness of changes in the hedging instrument’s fair value in offsetting the exposure to changes in the hedged item’s fair value or cash flows attributable to the hedged risk. Such hedges are expected to be highly effective in achieving offsetting changes in fair value or cash flows and are assessed on an ongoing basis to determine that they actually have been highly effective throughout the financial reporting periods for which they were designated.
90
|
| FISCAL 2019 RESULTS | |
Notes to the Consolidated Financial Statements
For the years ended September 30, 2019 and 2018
(tabular amounts only are in thousands of Canadian dollars, except per share data)
| 3. | Summary of significant accounting policies (continued) |
ADOPTION OF ACCOUNTING STANDARDS (CONTINUED)
IFRS 9 - Financial instruments (continued)
Accounting policies for the fiscal year ended September 30, 2018, under IAS 39,Financial Instruments: recognition and measurement(continued)
DERIVATIVE FINANCIAL INSTRUMENTS AND HEDGING TRANSACTIONS (continued)
The cash flows of the hedging transactions are classified in the same manner as the cash flows of the position being hedged.
Derivative financial instruments used as hedging items are recorded at fair value in the consolidated balance sheets under current derivative financial instruments, long-term financial assets or long-term derivative financial instruments. Valuation models, such as discounted cash flow analyses using observable market inputs, are utilized to determine the fair values of the derivative financial instruments.
Hedges of net investments in foreign operations
The Company uses cross-currency swaps and foreign currency denominated long-term debt to hedge portions of the Company’s net investments in its U.S. and European operations. Foreign exchange translation gains or losses on the net investments and the effective portions of gains or losses on instruments hedging the net investments are recorded in other comprehensive income. To the extent that the hedge is ineffective, such differences are recognized in consolidated statements of earnings. When the hedged net investment is disposed of, the relevant amount in other comprehensive income is transferred to earnings as part of the gain or loss on disposal.
Cash flow hedges of future revenue and long-term debt
The majority of the Company’s revenue and costs are denominated in currency other than the Canadian dollar. The risk of foreign exchange fluctuations impacting the results is substantially mitigated by matching the Company’s costs with revenue denominated in the same currency. In certain cases where there is a substantial imbalance for a specific currency, the Company enters into foreign currency forward contracts to hedge the variability in the foreign currency exchange rates.
The Company also uses interest rate and cross-currency swaps to hedge either the cash flow exposure or the foreign exchange exposure of the long-term debt.
These derivatives are documented as cash flow hedges and no component of the derivative contracts’ fair value are excluded from the assessment and measurement of hedge effectiveness. The effective portion of the change in fair value of the derivative financial instruments is recognized in other comprehensive income and the ineffective portion, if any, in the consolidated statements of earnings. The effective portion of the change in fair value of the derivatives is reclassified out of other comprehensive income into the consolidated statements of earnings when the hedged element is recognized in the consolidated statements of earnings.
Fair value hedges of Senior U.S. unsecured notes
The Company entered into interest rate swaps to hedge the fair value exposure of the issued fixed rate Senior U.S. unsecured notes. Under the interest rate swaps, the Company receives a fixed rate of interest and pays interest at a variable rate on the notional amount.
The changes in the fair value of the interest rate swaps are recognized in the consolidated statements of earnings as finance costs. The changes in the fair value of the hedged items attributable to the risk hedged is recorded as part of the carrying value of the Senior U.S. unsecured notes and are also recognized in the consolidated statements of earnings as finance costs. If the hedged items are derecognized, the unamortized fair value is recognized immediately in the consolidated statements of earnings.
91
|
CONSOLIDATED FINANCIAL STATEMENTS
Notes to the Consolidated Financial Statements
For the years ended September 30, 2019 and 2018
(tabular amounts only are in thousands of Canadian dollars, except per share data)
| 3. | Summary of significant accounting policies (continued) |
FUTURE ACCOUNTING STANDARD CHANGES
The following standards have been issued but are not yet effective as of September 30, 2019.
IFRS 16 - Leases
In January 2016, the IASB issued IFRS 16,Leases, to set out the principles for the recognition, measurement, presentation and disclosure of leases for both parties to a lease agreement. The standard supersedes IAS 17,Leases, and other leases related interpretations, eliminates the lessee’s classification of leases as either operating leases or finance leases and introduces a single lessee accounting model. The standard is effective since October 1, 2019 for the Company. The standard permits two possible transition methods for its application: i) retrospectively to each prior reporting period presented or ii) retrospectively with the cumulative effect of initially applying the standard recognized on the date of the initial application (modified retrospective method). The Company adopted IFRS 16 using the modified retrospective method, with no restatement of comparative figures. The Company made use of practical expedients available on transition including the definition of a lease, the use of hindsight in determining the lease term, applying a single incremental borrowing rate to a portfolio of leases with similar characteristics and adjusting the right-of-use assets for any onerous lease provisions as an alternative to an impairment review.
In preparation for the conversion to IFRS 16, the Company has developed a detailed conversion plan consisting of three phases: 1) awareness and assessment, 2) design and 3) implementation. As part of the first phase, the Company has established a steering committee responsible for monitoring the progress and approving recommendations from the project team. The steering committee meets regularly and quarterly updates are provided to the Audit and Risk Management Committee. The Company is progressing toward the completion of the third phase of the conversion plan.
The following table shows the expected impact of the adoption of IFRS 16 on the Company’s consolidated balance sheet as of October 1, 2019:
| Balance sheet as at September 30, 2019 | IFRS 16 adoption | Expected balance sheet as at October 1, 2019 | ||||||||||
| $ | $ | $ | ||||||||||
Assets | ||||||||||||
Accounts receivable | 1,357,090 | 3,319 | 1,360,409 | |||||||||
Prepaid expenses and other current assets | 172,182 | (6,365 | ) | 165,817 | ||||||||
Property, plant and equipment | 397,661 | (21,863 | ) | 375,798 | ||||||||
Right-of-use assets | — | 701,346 | 701,346 | |||||||||
Other long-term assets | 180,480 | 607 | 181,087 | |||||||||
Deferred tax assets | 100,539 | 14,230 | 114,769 | |||||||||
Other assets | 10,413,794 | — | 10,413,794 | |||||||||
| 12,621,746 | 691,274 | 13,313,020 | ||||||||||
Liabilities | ||||||||||||
Accounts payable and accrued liabilities | 1,108,895 | (8,037 | ) | 1,100,858 | ||||||||
Current portion of provisions | 73,509 | (3,723 | ) | 69,786 | ||||||||
Current portion of long-term debt | 113,511 | 152,758 | 266,269 | |||||||||
Long-term provisions | 24,946 | (2,264 | ) | 22,682 | ||||||||
Long-term debt | 2,217,696 | 693,269 | 2,910,965 | |||||||||
Other long-term liabilities | 213,392 | (64,655 | ) | 148,737 | ||||||||
Deferred tax liabilities | 178,265 | (8,790 | ) | 169,475 | ||||||||
Other liabilities | 1,807,429 | — | 1,807,429 | |||||||||
| 5,737,643 | 758,558 | 6,496,201 | ||||||||||
Equity | ||||||||||||
Retained earnings | 4,557,855 | (67,284 | ) | 4,490,571 | ||||||||
Other equity | 2,326,248 | — | 2,326,248 | |||||||||
| 6,884,103 | (67,284 | ) | 6,816,819 | |||||||||
| 12,621,746 | 691,274 | 13,313,020 | ||||||||||
92
|
| FISCAL 2019 RESULTS | |
Notes to the Consolidated Financial Statements
For the years ended September 30, 2019 and 2018
(tabular amounts only are in thousands of Canadian dollars, except per share data)
| 3. | Summary of significant accounting policies (continued) |
FUTURE ACCOUNTING STANDARD CHANGES (CONTINUED)
IFRS 16 - Leases (continued)
When the Company is the lessee, it is expected that the application of IFRS 16 will result in on-balance sheet recognition of most of its lease agreements that are currently considered operating leases, which are primarily for the rental of premises. The Company also expects a decrease of its property costs and an increase of its finance costs and amortization and depreciation resulting from the change in the recognition, measurement and presentation of rental expenses. The adoption of IFRS 16 will not have an impact on its ability to comply with the external covenants disclosed in Note 31, Capital risk management, related to its Senior U.S. and euro unsecured notes, unsecured committed revolving credit facility and unsecured committed term loan credit facility.
Amendments to IFRS 9, IAS 39 and IFRS 7 - Interest rate benchmark reform
In September 2019, the IASB has amended some of its requirements to address the uncertainty arising from the phasing out of interest-rate benchmarks such as interbank offered rates (IBORS). The amendments issued focused on the accounting effects of uncertainty in the period leading up to the reform. The IASB is also working on the potential consequences to financial reporting of replacing an existing benchmark with an alternative. The amendments impact IFRS 9 Financial instruments, IAS 39 Financial instruments: Recognition and measurement and IFRS 7 Financial instruments: Disclosures. The amendments come into effect for annual periods beginning on or after January 1, 2020 subject to European Union endorsement. The Company is currently evaluating the impact of this standard on its consolidated financial statements.
93
|
CONSOLIDATED FINANCIAL STATEMENTS
Notes to the Consolidated Financial Statements
For the years ended September 30, 2019 and 2018
(tabular amounts only are in thousands of Canadian dollars, except per share data)
| 4. | Accounts receivable |
| As at September 30, 2019 | As at September 30, 2018 | |||||||
| $ | $ | |||||||
Trade (Note 30) | 979,728 | 1,126,772 | ||||||
R&D and other tax credits1 | 259,289 | 245,980 | ||||||
Other | 118,073 | 108,616 | ||||||
| 1,357,090 | 1,481,368 | |||||||
| 1 | R&D and other tax credits were related to government programs in Canada, the United States of America, France, the United Kingdom and other countries. |
| 5. | Funds held for clients |
| As at September 30, 2019 | As at September 30, 2018 | |||||||
| $ | $ | |||||||
Cash | 187,823 | 141,151 | ||||||
Long-term bonds (Note 30) | 180,289 | 184,401 | ||||||
| 368,112 | 325,552 | |||||||
94
|
| FISCAL 2019 RESULTS | |
Notes to the Consolidated Financial Statements
For the years ended September 30, 2019 and 2018
(tabular amounts only are in thousands of Canadian dollars, except per share data)
| 6. | Property, plant and equipment |
| Land and buildings | Leasehold improvements | Furniture, fixtures and equipment | Computer equipment | Total | ||||||||||||||||
| $ | $ | $ | $ | $ | ||||||||||||||||
Cost | ||||||||||||||||||||
As at September 30, 2018 | 58,455 | 204,888 | 164,634 | 686,499 | 1,114,476 | |||||||||||||||
Additions | 619 | 40,915 | 19,568 | 104,887 | 165,989 | |||||||||||||||
Additions - business acquisitions (Note 25a) | — | 5,320 | 981 | 1,374 | 7,675 | |||||||||||||||
Disposals/retirements | — | (25,565 | ) | (4,146 | ) | (67,291 | ) | (97,002 | ) | |||||||||||
Foreign currency translation adjustment | (460 | ) | (999 | ) | (399 | ) | (10,840 | ) | (12,698 | ) | ||||||||||
As at September 30, 2019 | 58,614 | 224,559 | 180,638 | 714,629 | 1,178,440 | |||||||||||||||
Accumulated depreciation | ||||||||||||||||||||
As at September 30, 2018 | 14,652 | 144,275 | 106,223 | 461,233 | 726,383 | |||||||||||||||
Depreciation expense (Note 23) | 2,601 | 21,021 | 16,428 | 119,214 | 159,264 | |||||||||||||||
Disposals/retirements | — | (25,099 | ) | (3,836 | ) | (67,223 | ) | (96,158 | ) | |||||||||||
Foreign currency translation adjustment | (292 | ) | (471 | ) | (143 | ) | (7,804 | ) | (8,710 | ) | ||||||||||
As at September 30, 2019 | 16,961 | 139,726 | 118,672 | 505,420 | 780,779 | |||||||||||||||
Net carrying amount as at September 30, 2019 | 41,653 | 84,833 | 61,966 | 209,209 | 397,661 | |||||||||||||||
| Land and buildings | Leasehold improvements | Furniture, fixtures and equipment | Computer equipment | Total | ||||||||||||||||
| $ | $ | $ | $ | $ | ||||||||||||||||
Cost | ||||||||||||||||||||
As at September 30, 2017 | 65,640 | 210,326 | 164,016 | 645,363 | 1,085,345 | |||||||||||||||
Additions | 748 | 27,970 | 11,034 | 110,776 | 150,528 | |||||||||||||||
Additions - business acquisitions (Note 25b) | — | 192 | 943 | 1,479 | 2,614 | |||||||||||||||
Disposals/retirements | (8,933 | ) | (35,311 | ) | (11,082 | ) | (73,245 | ) | (128,571 | ) | ||||||||||
Foreign currency translation adjustment | 1,000 | 1,711 | (277 | ) | 2,126 | 4,560 | ||||||||||||||
As at September 30, 2018 | 58,455 | 204,888 | 164,634 | 686,499 | 1,114,476 | |||||||||||||||
Accumulated depreciation | ||||||||||||||||||||
As at September 30, 2017 | 20,691 | 154,801 | 99,131 | 414,109 | 688,732 | |||||||||||||||
Depreciation expense (Note 23) | 2,000 | 21,881 | 16,003 | 116,703 | 156,587 | |||||||||||||||
Impairment (Note 23) | — | 160 | 1,764 | — | 1,924 | |||||||||||||||
Disposals/retirements | (8,542 | ) | (34,251 | ) | (10,396 | ) | (70,577 | ) | (123,766 | ) | ||||||||||
Foreign currency translation adjustment | 503 | 1,684 | (279 | ) | 998 | 2,906 | ||||||||||||||
As at September 30, 2018 | 14,652 | 144,275 | 106,223 | 461,233 | 726,383 | |||||||||||||||
Net carrying amount as at September 30, 2018 | 43,803 | 60,613 | 58,411 | 225,266 | 388,093 | |||||||||||||||
PP&E include the following assets acquired under finance leases:
| As at September 30, 2019 | As at September 30, 2018 | |||||||||||||||||||||||
| Cost | Accumulated depreciation | Net carrying amount | Cost | Accumulated depreciation | Net carrying amount | |||||||||||||||||||
| $ | $ | $ | $ | $ | $ | |||||||||||||||||||
Furniture, fixtures and equipment | 14,578 | 8,285 | 6,293 | 15,309 | 7,958 | 7,351 | ||||||||||||||||||
Computer equipment | 40,357 | 24,787 | 15,570 | 46,183 | 29,831 | 16,352 | ||||||||||||||||||
| 54,935 | 33,072 | 21,863 | 61,492 | 37,789 | 23,703 | |||||||||||||||||||
95
|
CONSOLIDATED FINANCIAL STATEMENTS
Notes to the Consolidated Financial Statements
For the years ended September 30, 2019 and 2018
(tabular amounts only are in thousands of Canadian dollars, except per share data)
| 7. | Contract costs |
| As at September 30, 2019 | As at September 30, 2018 | |||||||||||||||||||||||
| Cost | Accumulated amortization | Net carrying amount | Cost | Accumulated amortization | Net carrying amount | |||||||||||||||||||
| $ | $ | $ | $ | $ | $ | |||||||||||||||||||
Transition costs | 476,075 | 258,283 | 217,792 | 461,262 | 235,931 | 225,331 | ||||||||||||||||||
Incentives | 61,258 | 56,085 | 5,173 | 71,748 | 53,932 | 17,816 | ||||||||||||||||||
| 537,333 | 314,368 | 222,965 | 533,010 | 289,863 | 243,147 | |||||||||||||||||||
| 8. | Intangible assets |
| Internal-use software acquired | Internal-use developed | Business solutions acquired | Business developed | Software licenses | Client relationships | Total | ||||||||||||||||||||||
| $ | $ | $ | $ | $ | $ | $ | ||||||||||||||||||||||
Cost | ||||||||||||||||||||||||||||
As at September 30, 2018 | 95,707 | 114,701 | 82,256 | 444,593 | 216,490 | 1,025,083 | 1,978,830 | |||||||||||||||||||||
Additions | 4,321 | 9,433 | 911 | 61,693 | 20,196 | — | 96,554 | |||||||||||||||||||||
Additions - business acquisitions (Note 25) | 77 | — | — | — | 201 | 113,786 | 114,064 | |||||||||||||||||||||
Disposals/retirements | (436 | ) | (326 | ) | (803 | ) | (46 | ) | (13,281 | ) | (24,321 | ) | (39,213 | ) | ||||||||||||||
Foreign currency translation adjustment | (465 | ) | (519 | ) | (1,336 | ) | 5,144 | (2,096 | ) | (19,209 | ) | (18,481 | ) | |||||||||||||||
As at September 30, 2019 | 99,204 | 123,289 | 81,028 | 511,384 | 221,510 | 1,095,339 | 2,131,754 | |||||||||||||||||||||
Accumulated amortization | ||||||||||||||||||||||||||||
As at September 30, 2018 | 72,177 | 58,212 | 80,586 | 277,092 | 145,078 | 866,359 | 1,499,504 | |||||||||||||||||||||
Amortization expense (Note 23) | 8,872 | 11,513 | 1,319 | 37,318 | 29,356 | 76,182 | 164,560 | |||||||||||||||||||||
Disposals/retirements | (436 | ) | (326 | ) | (803 | ) | (46 | ) | (13,247 | ) | (24,321 | ) | (39,179 | ) | ||||||||||||||
Foreign currency translation adjustment | (146 | ) | (304 | ) | (1,195 | ) | 3,482 | (1,596 | ) | (11,354 | ) | (11,113 | ) | |||||||||||||||
As at September 30, 2019 | 80,467 | 69,095 | 79,907 | 317,846 | 159,591 | 906,866 | 1,613,772 | |||||||||||||||||||||
Net carrying amount as at September 30, 2019 | 18,737 | 54,194 | 1,121 | 193,538 | 61,919 | 188,473 | 517,982 | |||||||||||||||||||||
| Internal-use software acquired | Internal-use software internally developed | Business solutions acquired | Business solutions internally developed | Software licenses | Client relationships and other | Total | ||||||||||||||||||||||
| $ | $ | $ | $ | $ | $ | $ | ||||||||||||||||||||||
Cost | ||||||||||||||||||||||||||||
As at September 30, 2017 | 99,047 | 94,788 | 84,044 | 387,624 | 217,875 | 965,687 | 1,849,065 | |||||||||||||||||||||
Additions | 5,742 | 21,724 | — | 47,125 | 19,343 | — | 93,934 | |||||||||||||||||||||
Additions - business acquisitions | — | — | — | — | — | 46,755 | 46,755 | |||||||||||||||||||||
Disposals/retirements | (10,145 | ) | (1,605 | ) | (1,503 | ) | (2,796 | ) | (22,278 | ) | — | (38,327 | ) | |||||||||||||||
Foreign currency translation adjustment | 1,063 | (206 | ) | (285 | ) | 12,640 | 1,550 | 12,641 | 27,403 | |||||||||||||||||||
As at September 30, 2018 | 95,707 | 114,701 | 82,256 | 444,593 | 216,490 | 1,025,083 | 1,978,830 | |||||||||||||||||||||
Accumulated amortization | ||||||||||||||||||||||||||||
As at September 30, 2017 | 74,286 | 50,842 | 78,151 | 237,351 | 131,672 | 786,337 | 1,358,639 | |||||||||||||||||||||
Amortization expense (Note 23) | 7,385 | 7,757 | 3,954 | 33,197 | 34,186 | 70,447 | 156,926 | |||||||||||||||||||||
Impairment (Note 23) | — | 1,209 | — | 57 | — | — | 1,266 | |||||||||||||||||||||
Disposals/retirements | (10,145 | ) | (1,605 | ) | (1,503 | ) | (2,062 | ) | (21,926 | ) | — | (37,241 | ) | |||||||||||||||
Foreign currency translation adjustment | 651 | 9 | (16 | ) | 8,549 | 1,146 | 9,575 | 19,914 | ||||||||||||||||||||
As at September 30, 2018 | 72,177 | 58,212 | 80,586 | 277,092 | 145,078 | 866,359 | 1,499,504 | |||||||||||||||||||||
Net carrying amount as at September 30, 2018 | 23,530 | 56,489 | 1,670 | 167,501 | 71,412 | 158,724 | 479,326 | |||||||||||||||||||||
96
|
| FISCAL 2019 RESULTS | |
Notes to the Consolidated Financial Statements
For the years ended September 30, 2019 and 2018
(tabular amounts only are in thousands of Canadian dollars, except per share data)
| 9. | Other long-term assets |
| As at September 30, 2019 | As at September 30, 2018 | |||||||
| $ | $ | |||||||
Prepaid long-term maintenance agreements | 20,532 | 21,647 | ||||||
Insurance contracts held to fund defined benefit pension and life assurance arrangements - reimbursement rights (Note 16) | 23,879 | 24,652 | ||||||
Retirement benefits assets (Note 16) | 96,620 | 27,482 | ||||||
Deposits | 13,999 | 11,253 | ||||||
Deferred financing fees | 3,798 | 3,182 | ||||||
Other | 21,652 | 16,732 | ||||||
| 180,480 | 104,948 | |||||||
| 10. Long-term financial assets | ||||||||
| As at September 30, 2019 | As at September 30, 2018 | |||||||
| $ | $ | |||||||
Deferred compensation plan assets (Notes 16 and 30) | 62,627 | 56,900 | ||||||
Long-term investments (Note 30) | 24,596 | 30,054 | ||||||
Long-term receivables | 18,034 | 19,470 | ||||||
Long-term derivative financial instruments (Note 30) | 71,642 | 11,312 | ||||||
| 176,899 | 117,736 | |||||||
97
|
CONSOLIDATED FINANCIAL STATEMENTS
Notes to the Consolidated Financial Statements
For the years ended September 30, 2019 and 2018
(tabular amounts only are in thousands of Canadian dollars, except per share data)
| 11. | Goodwill |
In the prior fiscal year, management reviewed the Company’s operating results through nine operating segments referred to as the Company’s Strategic Business Units, namely: Northern Europe (including Nordics, Baltics and Poland); Canada; France (including Luxembourg and Morocco); United States of America (U.S.) Commercial and State Government; U.S. Federal; United Kingdom (U.K.); Eastern, Central and Southern Europe (primarily Netherlands and Germany); Asia Pacific Global Delivery Centers of Excellence (India and Philippines) and Australia. The last two operating segments which each had reported revenue, earnings and assets that are less than 10% of the Company’s total revenue, earnings and assets, had been aggregated together as Asia Pacific.
During the year ended September 30, 2019, the Company realigned its management structure, resulting primarily in the transfer of our Belgium and Southern Europe operations from the Central and Eastern Europe to the Western and Southern Europe operating segment, the transfer of our Australia operations from the Asia Pacific segment to the U.K. operating segment as well as other internal organizational changes. The Company is now managed through eight operating segments, namely: Western and Southern Europe (primarily France, Portugal and Belgium); Northern Europe (including Nordics, Baltics and Poland); Canada; U.S. Commercial and State Government; U.S. Federal; U.K. and Australia; Central and Eastern Europe (primarily Netherlands and Germany); and Asia Pacific Global Delivery Centers of Excellence (India and Philippines) (Asia Pacific).
Due to the changes in operating segments, the Company reallocated goodwill to the revised CGUs using their relative fair value. No goodwill were impaired before the reclassification.
The operating segments reflect the fiscal year 2019 management structure and the way that the chief operating decision-maker, who is the President and Chief Executive Officer of the Company, evaluates the business.
The Company completed the annual impairment test during the fourth quarter of the fiscal year 2019 and did not identify any impairment.
The variations in goodwill were as follows:
| Western and Southern Europe | Northern Europe | Canada | U.S. Commercial and State Government | U.S. Federal | U.K. and Australia | Central and Eastern Europe | Asia Pacific | Total | ||||||||||||||||||||||||||||
| $ | $ | $ | $ | $ | $ | $ | $ | $ | ||||||||||||||||||||||||||||
As at September 30, 2018 | 898,186 | 1,327,204 | 1,141,227 | 1,111,719 | 882,246 | 829,520 | 856,916 | 294,702 | 7,341,720 | |||||||||||||||||||||||||||
Business acquisitions (Note 25) | — | 482,939 | (734 | ) | — | 13,955 | — | 90,943 | — | 587,103 | ||||||||||||||||||||||||||
Goodwill reallocation | 115,884 | — | (3,756 | ) | (4,361 | ) | — | 5,366 | (94,696 | ) | (18,437 | ) | — | |||||||||||||||||||||||
Foreign currency translation adjustment | (38,995 | ) | (106,216 | ) | — | 26,888 | 21,863 | (28,568 | ) | (32,598 | ) | (3,360 | ) | (160,986 | ) | |||||||||||||||||||||
As at September 30, 2019 | 975,075 | 1,703,927 | 1,136,737 | 1,134,246 | 918,064 | 806,318 | 820,565 | 272,905 | 7,767,837 | |||||||||||||||||||||||||||
Key assumptions in goodwill impairment testing
The key assumptions for the CGUs are disclosed in the following tables for the years ended September 30:
| 2019 | Western and Southern Europe | Northern Europe | Canada | U.S. Government | U.S. Federal | U.K. and Australia | Central Eastern Europe | Asia Pacific | ||||||||||||||||||||||||
| % | % | % | % | % | % | % | % | |||||||||||||||||||||||||
Pre-tax WACC | 9.1 | 9.4 | 8.9 | 10.0 | 9.9 | 8.9 | 9.1 | 21.4 | ||||||||||||||||||||||||
Long-term growth rate of net operating cash flows1 | 1.8 | 1.8 | 2.0 | 2.0 | 2.0 | 1.9 | 1.5 | 2.0 | ||||||||||||||||||||||||
| 2018 | Northern Europe | Canada | France | U.S. Government | U.S. Federal | U.K. | ECS | Asia Pacific | ||||||||||||||||||||||||
| % | % | % | % | % | % | % | % | |||||||||||||||||||||||||
Pre-tax WACC | 9.1 | 8.9 | 8.6 | 10.9 | 10.2 | 8.1 | 9.0 | 19.1 | ||||||||||||||||||||||||
Long-term growth rate of net operating cash flows1 | 2.0 | 2.0 | 1.7 | 2.0 | 2.0 | 1.9 | 2.0 | 2.0 | ||||||||||||||||||||||||
| 1 | The long-term growth rate is based on published industry research. |
98
|
| FISCAL 2019 RESULTS | |
Notes to the Consolidated Financial Statements
For the years ended September 30, 2019 and 2018
(tabular amounts only are in thousands of Canadian dollars, except per share data)
| 12. | Provisions |
As at September 30, 2019, the Company had $98,455,000 ($98,001,000 as at September 30, 2018) of provisions which consist mainly of restructuring.
The following table presents restructuring provisions continuity schedule:
| As at September 30, 2019 | As at September 30, 2018 | |||||||
| $ | $ | |||||||
Balance, beginning of year | 51,529 | 63,128 | ||||||
Additional provisions | 56,268 | 111,878 | ||||||
Utilized amounts | (67,302 | ) | (123,766 | ) | ||||
Foreign currency translation adjustment | (1,283 | ) | 289 | |||||
Balance, end of year | 39,212 | 51,529 | ||||||
Current portion | 38,284 | 50,130 | ||||||
Non-current portion | 928 | 1,399 | ||||||
During the year ended September 30, 2019, additional provisions consist of termination of employment costs in connection with acquisitions of $56,268,000 ($17,630,000 for the year ended September 30, 2018).
In addition, during the year ended September 30, 2018, additional provisions include $94,248,000 of termination of employment costs related to the previously announced restructuring program.
99
|
CONSOLIDATED FINANCIAL STATEMENTS
Notes to the Consolidated Financial Statements
For the years ended September 30, 2019 and 2018
(tabular amounts only are in thousands of Canadian dollars, except per share data)
| 13. | Long-term debt |
| As at September 30, 2019 | As at September 30, 2018 | |||||||
| $ | $ | |||||||
Senior U.S. unsecured note repayable of $331,150 (U.S.$250,000) in 20211 | 332,533 | 491,651 | ||||||
Senior unsecured notes repayable in September by tranches of $72,853 (U.S.$55,000) in 2021, $397,380 (U.S.$300,000) in 2024, $331,150 (U.S.$250,000) in five yearly repayments of U.S.$50,000 from 2020 to 2024 and $122,791 (€85,000) in 20212 | 924,021 | 1,025,683 | ||||||
Unsecured committed revolving credit facility3 | 334,370 | 194,795 | ||||||
Unsecured committed term loan credit facility4 | 661,939 | — | ||||||
Obligations repayable in blended monthly installments maturing at various dates until 2024, bearing a weighted average interest rate of 2.62% (2.46% in 2018) | 14,295 | 30,124 | ||||||
Obligations under finance leases repayable in blended monthly installments maturing at various dates until 2024, bearing a weighted average interest rate of 2.44% (2.40% in 2018) | 30,339 | 29,909 | ||||||
Other long-term debt | 33,710 | 28,731 | ||||||
| 2,331,207 | 1,800,893 | |||||||
Current portion | 113,511 | 348,580 | ||||||
| 2,217,696 | 1,452,313 | |||||||
| 1 | As at September 30, 2019, an amount of $331,150,000 was drawn, plus fair value adjustments relating to interest rate swaps designated as fair value hedges of $1,418,000 and less financing fees of $35,000. In December 2018, the Company repaid the scheduled repayment of a tranche of the Senior U.S. unsecured note for a total amount of $187,600,000 and settled the related cross-currency swaps (Note 30). The private placement financing with U.S. institutional investors is comprised of one tranche of Senior U.S. unsecured note with a maturity of 2.2 years and an interest rate of 4.99% (weighted average interest rate of 4.76% in 2018). The Senior U.S. unsecured note contains covenants that require the Company to maintain certain financial ratios (Note 31). As at September 30, 2019, the Company was in compliance with these covenants. |
| 2 | As at September 30, 2019, an amount of $924,174,000 was drawn, less financing fees of $153,000. The private placement is comprised of three tranches of Senior U. S. unsecured notes and one tranche of Senior euro unsecured note, with a weighted average maturity of 3.2 years and a weighted average interest rate of 3.66% (3.63% in 2018). In September 2019, the Company repaid the second of the seven yearly scheduled repayments of U.S.$50,000,000 on a tranche of the Senior U.S. unsecured notes for a total amount of $66,055,000 and settled the related cross-currency swaps (Note 30). In September 2019, the Company also repaid the scheduled repayment of a tranche of the Senior U.S. unsecured notes for a total amount of $52,844,000. The Senior unsecured notes contain covenants that require the Company to maintain certain financial ratios (Note 31). As at September 30, 2019, the Company was in compliance with these covenants. |
| 3 | The Company has an unsecured committed revolving credit facility available for an amount of $1,500,000,000 that expires in December 2023. This facility bears interest at bankers’ acceptance, LIBOR or Canadian prime, plus a variable margin that is determined based on the Company’s leverage ratio. As at September 30, 2019, an amount of $15,000,000 was drawn upon this facility at Canadian prime with no margin at a weighted average interest rate of 3.95% and $319,371,000 at banker’s acceptance with a margin of 1.13% and a weighted average interest rate of 1.97%. Also, an amount of $9,631,000 has been committed against this facility to cover various letters of credit issued for clients and other parties. On November 5, 2019, the facility was extended by one year to December 2024 and can be further extended. There were no material changes in the terms and conditions including interest rates and banking covenants. The unsecured committed revolving credit facility contains covenants that require the Company to maintain certain financial ratios (Note 31). As at September 30, 2019, the Company was in compliance with these covenants. |
| 4 | During the year ended September 30, 2019, the Company has entered into an unsecured committed term loan credit facility, for a notional amount of U.S. $500,000,000 expiring in December 2023. This facility bears interest at LIBOR, plus a variable margin that is determined based on the Company’s leverage ratio. As at September 30, 2019, an amount of $662,300,000 was drawn less financing fees of $361,000 with a margin of 1.00% and a weighted average interest rate of 2.03%. The unsecured committed term loan credit facility contains covenants that require the Company to maintain certain financial ratios (Note 31). As at September 30, 2019, the Company was in compliance with these covenants. |
Minimum finance lease payments are as follows:
| Principal | Interest | Payment | |||||||||
| $ | $ | $ | ||||||||||
Less than one year | 14,086 | 448 | 14,534 | |||||||||
Between one and two years | 11,303 | 282 | 11,585 | |||||||||
Between two and five years | 4,950 | 176 | 5,126 | |||||||||
Total minimum finance lease payments | 30,339 | 906 | 31,245 | |||||||||
100
|
| FISCAL 2019 RESULTS | |
Notes to the Consolidated Financial Statements
For the years ended September 30, 2019 and 2018
(tabular amounts only are in thousands of Canadian dollars, except per share data)
| 14. | Other long-term liabilities |
| As at September 30, 2019 | As at September 30, 2018 | |||||||
| $ | $ | |||||||
Deferred revenue | 70,522 | 86,272 | ||||||
Deferred compensation plan liabilities (Note 16) | 63,838 | 58,197 | ||||||
Deferred rent | 64,652 | 47,325 | ||||||
Other | 14,380 | 13,852 | ||||||
| 213,392 | 205,646 | |||||||
| 15. | Income taxes |
| Year ended September 30 | ||||||||
| 2019 | 2018 | |||||||
| $ | $ | |||||||
Current income tax expense | ||||||||
Current income tax expense in respect of the current year | 439,972 | 386,773 | ||||||
Current income tax expense relating to changes in tax laws | — | 11,400 | ||||||
Adjustments recognized in the current year in relation to the income tax expense of prior years | (17,934 | ) | (8,357 | ) | ||||
Total current income tax expense | 422,038 | 389,816 | ||||||
Deferred income tax recovery | ||||||||
Deferred income tax (recovery) expense relating to the origination and reversal of temporary differences | (959 | ) | 2,617 | |||||
Deferred income tax expense (recovery) relating to changes in tax rates | 784 | (42,437 | ) | |||||
Recognition of previously unrecognized temporary differences | (8,122 | ) | (1,418 | ) | ||||
Total deferred income tax recovery | (8,297 | ) | (41,238 | ) | ||||
Total income tax expense | 413,741 | 348,578 | ||||||
The Company’s effective income tax rate differs from the combined Federal and Provincial Canadian statutory tax rate as follows:
| Year ended September 30 | ||||||||
| 2019 | 2018 | |||||||
| % | % | |||||||
Company’s statutory tax rate | 26.6 | 26.7 | ||||||
Effect of foreign tax rate differences | (1.6 | ) | (1.3 | ) | ||||
Final determination from agreements with tax authorities and expirations of statutes of limitations | (1.4 | ) | (0.8 | ) | ||||
Non-deductible and tax exempt items | 0.2 | (0.2 | ) | |||||
Recognition of previously unrecognized temporary differences | — | 0.2 | ||||||
Effect of integration-related costs | 0.1 | — | ||||||
Minimum income tax charge | 0.8 | 0.9 | ||||||
Changes in tax laws and rates | — | (2.1 | ) | |||||
Effective income tax rate | 24.7 | 23.4 | ||||||
101
|
CONSOLIDATED FINANCIAL STATEMENTS
Notes to the Consolidated Financial Statements
For the years ended September 30, 2019 and 2018
(tabular amounts only are in thousands of Canadian dollars, except per share data)
| 15. | Income taxes (continued) |
The continuity schedule of deferred tax balances is as follows:
| As at September 30, 2018 | Additions from business acquisitions | Recognized in earnings | Recognized in other comprehensive income | Recognized in equity | Foreign currency translation adjustment and other | As at September 30, 2019 | |||||||||||||||||||||
| $ | $ | $ | $ | $ | $ | $ | ||||||||||||||||||||||
Accounts payable, accrued liabilities and other long-term liabilities | 78,177 | (3,220 | ) | (8,394 | ) | — | — | 1,363 | 67,926 | |||||||||||||||||||
Tax benefits on losses carried forward | 62,415 | — | (1,001 | ) | — | — | (2,251 | ) | 59,163 | |||||||||||||||||||
Accrued compensation | 34,887 | 18 | 3,995 | — | 6,132 | 375 | 45,407 | |||||||||||||||||||||
Retirement benefits obligations | 25,418 | — | (2,683 | ) | (4,324 | ) | — | (507 | ) | 17,904 | ||||||||||||||||||
Allowance for doubtful accounts | (260 | ) | — | 260 | — | — | — | — | ||||||||||||||||||||
PP&E, contract costs, intangible assets and other long-term assets | (106,207 | ) | (24,514 | ) | 7,788 | — | — | (214 | ) | (123,147 | ) | |||||||||||||||||
Work in progress | (59,142 | ) | — | 16,010 | — | — | (437 | ) | (43,569 | ) | ||||||||||||||||||
Goodwill | (53,891 | ) | — | (5,407 | ) | — | — | (1,068 | ) | (60,366 | ) | |||||||||||||||||
Refundable tax credits on salaries | (26,502 | ) | — | 683 | — | — | — | (25,819 | ) | |||||||||||||||||||
Cash flow hedges | 12,398 | — | (1,470 | ) | (25,290 | ) | — | 459 | (13,903 | ) | ||||||||||||||||||
Other | (638 | ) | 76 | (1,484 | ) | 2,374 | — | (1,650 | ) | (1,322 | ) | |||||||||||||||||
Deferred taxes, net | (33,345 | ) | (27,640 | ) | 8,297 | (27,240 | ) | 6,132 | (3,930 | ) | (77,726 | ) | ||||||||||||||||
| As at September 30, 2017 | Additions from business | Recognized in earnings | Recognized in other comprehensive income | Recognized in equity | Foreign currency translation adjustment and other | As at September 30, 2018 | |||||||||||||||||||||
| $ | $ | $ | $ | $ | $ | $ | ||||||||||||||||||||||
Accounts payable, accrued liabilities and other long-term liabilities | 82,697 | (1,619 | ) | (2,795 | ) | — | — | (106 | ) | 78,177 | ||||||||||||||||||
Tax benefits on losses carried forward | 78,893 | 589 | (18,141 | ) | — | — | 1,074 | 62,415 | ||||||||||||||||||||
Accrued compensation | 40,830 | — | (4,770 | ) | — | (1,959 | ) | 786 | 34,887 | |||||||||||||||||||
Retirement benefits obligations | 34,162 | — | (1,286 | ) | (7,911 | ) | — | 453 | 25,418 | |||||||||||||||||||
Allowance for doubtful accounts | 323 | — | (562 | ) | — | — | (21 | ) | (260 | ) | ||||||||||||||||||
PP&E, contract costs, intangible assets and other long-term assets | (134,083 | ) | (8,216 | ) | 39,646 | — | — | (3,554 | ) | (106,207 | ) | |||||||||||||||||
Work in progress | (80,898 | ) | — | 23,253 | — | — | (1,497 | ) | (59,142 | ) | ||||||||||||||||||
Goodwill | (60,668 | ) | — | 8,055 | — | — | (1,278 | ) | (53,891 | ) | ||||||||||||||||||
Refundable tax credits on salaries | (29,785 | ) | — | 3,283 | — | — | — | (26,502 | ) | |||||||||||||||||||
Cash flow hedges | (2,355 | ) | — | (39 | ) | 14,618 | — | 174 | 12,398 | |||||||||||||||||||
Other | 3,971 | — | (5,406 | ) | 675 | — | 122 | (638 | ) | |||||||||||||||||||
Deferred taxes, net | (66,913 | ) | (9,246 | ) | 41,238 | 7,382 | (1,959 | ) | (3,847 | ) | (33,345 | ) | ||||||||||||||||
The deferred tax balances are presented as follows in the consolidated balance sheets:
| As at September 30, 2019 | As at September 30, 2018 | |||||||
| $ | $ | |||||||
Deferred tax assets | 100,539 | 139,664 | ||||||
Deferred tax liabilities | (178,265 | ) | (173,009 | ) | ||||
| (77,726 | ) | (33,345 | ) | |||||
102
|
| FISCAL 2019 RESULTS | |
Notes to the Consolidated Financial Statements
For the years ended September 30, 2019 and 2018
(tabular amounts only are in thousands of Canadian dollars, except per share data)
| 15. | Income taxes (continued) |
On September 30, 2019, the Company recorded a deferred tax asset of $18,500,000 attributable to the recognition of additional operating tax losses following a settlement with the German tax authority.
On December 22, 2017, the U.S. government enacted a tax reform which includes several measures such as a reduction of corporate tax rate from 35% to 21%, effective on January 1, 2018, and a one-time repatriation tax on earnings held by foreign subsidiaries. In addition to the U.S. tax reform, the government of France enacted a temporary corporate surtax for the current year and a tax rate reduction was enacted by the government of Belgium. As such, the Company recorded a net income tax recovery of $34,100,000 for its fiscal year ended September 30, 2018 resulting from the re-evaluation of its deferred tax assets and liabilities of $45,500,000 partially offset by an income tax expense of $11,400,000 in relation to the U.S. repatriation tax.
As at September 30, 2019, the Company had $367,352,000 ($387,684,000 as at September 30, 2018) in operating tax losses carried forward, of which $37,480,000 ($53,382,000 as at September 30, 2018) expire at various dates from 2020 to 2039 and $329,872,000 ($334,302,000 as at September 30, 2018) have no expiry dates. As at September 30, 2019, a deferred income tax of $54,814,000 ($58,044,000 as at September 30, 2018) has been recognized on $289,976,000 ($290,244,000 as at September as at September 30, 2018) of these losses. The deferred income tax assets are recognized only to the extent that it is probable that taxable income will be available against which the unused tax losses can be utilized. As at September 30, 2019, the Company had $29,287,000 ($26,601,000 as at September 30, 2018) of the unrecognized operating tax losses that will expire at various dates from 2029 to 2039 and 48,089,000 ($70,839,000 as at September 30, 2018) that have no expiry date.
As at September 30, 2019, the Company had $471,772,000 ($497,277,000 as at September 30, 2018) in non-operating tax losses carried forward that have no expiry dates. As at September 30, 2019, a deferred income tax asset of $4,349,000 ($4,371,000 as at September 30, 2018) has been recognized on $18,151,000 ($18,246,000 as at September 30, 2018) of these losses. As at September 30, 2019, the Company had $453,621,000 ($479,031,000 as at September 30, 2018) of unrecognized non-operating tax losses.
As at September 30, 2019, the Company had $149,121,000 ($142,414,000 as at September 30, 2018) of cash and cash equivalents held by foreign subsidiaries. The tax implications of the repatriation of cash and cash equivalents not considered indefinitely reinvested have been accounted for and will not materially affect the Company’s liquidity. In addition, the Company has not recorded deferred tax liabilities on undistributed earnings of $4,457,906,000 ($3,605,464,000 as at September 30, 2018) coming from its foreign subsidiaries as they are considered indefinitely reinvested. The Company may be subject to taxation if it modifies its strategy by distributing these earnings in the form of dividends or otherwise.
103
|
CONSOLIDATED FINANCIAL STATEMENTS
Notes to the Consolidated Financial Statements
For the years ended September 30, 2019 and 2018
(tabular amounts only are in thousands of Canadian dollars, except per share data)
| 16. | Employee benefits |
The Company operates various post-employment plans, including defined benefit and defined contribution pension plans as well as other benefit plans for its employees.
DEFINED BENEFIT PLANS
The Company operates defined benefit pension plans primarily for the benefit of employees in the U.K. and Germany, with smaller plans in other countries. The benefits are based on pensionable salary and years of service and are funded with assets held in separate funds.
The defined benefit plans expose the Company to interest risk, inflation risk, longevity risk, currency risk and market investment risk.
The following description focuses mainly on plans registered in the U.K. and Germany:
U.K.
In the U.K., the Company has three defined benefit pension plans, the CMG U.K. Pension Scheme, the Logica U.K. Pension & Life Assurance Scheme and the Logica Defined Benefit Pension Plan.
The CMG U.K. Pension Scheme is closed to new members and is closed to further accrual of rights for existing members. The Logica U.K. Pension & Life Assurance Scheme is still open but only for employees who come from the civil service with protected pensions. The Logica Defined Benefit Pension Plan was created to mirror the Electricity Supply Pension Scheme and was created for employees that worked for National Grid and Welsh Water with protected benefits.
Both the Logica U.K. Pension & Life Assurance Scheme and the Logica Defined Benefit Pension Plan are employer and employee based contribution plans.
The trustees are the custodians of the defined benefit pension plans and are responsible for the plan administration, including investment strategies. The trustees review periodically the investment and the asset allocation policies. As such, the CMG U.K. Pension Scheme policy is to target an allocation up to a maximum of 70% to return-seeking assets such as equities; the Logica U.K. Pension & Life Assurance Scheme policy is to invest 20% of the scheme assets in equities and 80% in bonds; and the Logica Defined Benefit Pension Plan policy is to invest 30% of the plan assets in equities and 70% in bonds.
The U.K. Pensions Act 2004 requires that full formal actuarial valuations are carried out at least every three years to determine the contributions that the Company should pay in order for the plan to meet its statutory objective, taking into account the assets already held. In the interim years, the trustees need to obtain estimated funding updates unless the scheme has less than 100 members in total.
The latest funding actuarial valuations of the three defined benefit pension plans described above were performed as at September 30, 2018 and the final results were finalized subsequent to September 30, 2019 with no material impact on the contributions.
During fiscal 2019, in line with the last funding actuarial valuations as at September 30, 2015, the Company continued to contribute to the CMG U.K. Pension Scheme and to the Logica Defined Benefit Pension plan with quarterly payments of $3,848,000 and monthly payments of $150,000 respectively to ensure that their funding objectives are met and quarterly payments of $303,000 and monthly payments of $10,000 respectively to cover administration expenses.
Germany
In Germany, the Company has numerous defined benefit pension plans which are all closed to new members. In the majority of the plans, upon retirement of employees, the benefits are in the form of a monthly pension and in a few plans, the employees receive an indemnity in the form of a lump-sum payment. About one third of the plans are bound by the former Works Council agreements. There are no mandatory funding requirements. The plans are funded by the contributions made by the Company. In some plans, insurance policies are taken out to fund retirement benefit plans. These do not qualify as plan assets and are presented as reimbursement rights, unless they are part of a reinsured support fund or are pledged to the employees.
104
|
| FISCAL 2019 RESULTS | |
Notes to the Consolidated Financial Statements
For the years ended September 30, 2019 and 2018
(tabular amounts only are in thousands of Canadian dollars, except per share data)
| 16. | Employee benefits (continued) |
DEFINED BENEFIT PLANS (CONTINUED)
The following tables present amounts for post-employment benefits plans included in the consolidated balance sheets:
As at September 30, 2019 | U.K. | Germany | Other | Total | ||||||||||||
| $ | $ | $ | $ | |||||||||||||
Defined benefit obligations | (812,179 | ) | (101,298 | ) | (131,107 | ) | (1,044,584 | ) | ||||||||
Fair value of plan assets | 908,406 | 12,803 | 26,786 | 947,995 | ||||||||||||
| 96,227 | (88,495 | ) | (104,321 | ) | (96,589 | ) | ||||||||||
Fair value of reimbursement rights | — | 22,360 | 1,519 | 23,879 | ||||||||||||
Net asset (liability) recognized in the balance sheet | 96,227 | (66,135 | ) | (102,802 | ) | (72,710 | ) | |||||||||
Presented as: | ||||||||||||||||
Other long-term assets(Note 9) | ||||||||||||||||
Insurance contracts held to fund defined benefit pension and life assurance arrangements - reimbursement rights | — | 22,360 | 1,519 | 23,879 | ||||||||||||
Retirement benefits assets | 96,227 | — | 393 | 96,620 | ||||||||||||
Retirement benefits obligations | — | (88,495 | ) | (104,714 | ) | (193,209 | ) | |||||||||
| 96,227 | (66,135 | ) | (102,802 | ) | (72,710 | ) | ||||||||||
As at September 30, 2018 | U.K. | Germany | Other | Total | ||||||||||||
| $ | $ | $ | $ | |||||||||||||
Defined benefit obligations | (760,244 | ) | (89,959 | ) | (113,870 | ) | (964,073 | ) | ||||||||
Fair value of plan assets | 787,550 | 13,250 | 21,421 | 822,221 | ||||||||||||
| 27,306 | (76,709 | ) | (92,449 | ) | (141,852 | ) | ||||||||||
Fair value of reimbursement rights | — | 23,170 | 1,482 | 24,652 | ||||||||||||
Net asset (liability) recognized in the balance sheet | 27,306 | (53,539 | ) | (90,967 | ) | (117,200 | ) | |||||||||
Presented as: | ||||||||||||||||
Other long-term assets(Note 9) | ||||||||||||||||
Insurance contracts held to fund defined benefit pension and life assurance arrangements - reimbursement rights | — | 23,170 | 1,482 | 24,652 | ||||||||||||
Retirement benefits assets | 27,306 | — | 176 | 27,482 | ||||||||||||
Retirement benefits obligations | — | (76,709 | ) | (92,625 | ) | (169,334 | ) | |||||||||
| 27,306 | (53,539 | ) | (90,967 | ) | (117,200 | ) | ||||||||||
105
|
CONSOLIDATED FINANCIAL STATEMENTS
Notes to the Consolidated Financial Statements
For the years ended September 30, 2019 and 2018
(tabular amounts only are in thousands of Canadian dollars, except per share data)
| 16. | Employee benefits (continued) |
DEFINED BENEFIT PLANS (CONTINUED)
Defined benefit obligations | U.K. | Germany | Other | Total | ||||||||||||
| $ | $ | $ | $ | |||||||||||||
As at September 30, 2018 | 760,244 | 89,959 | 113,870 | 964,073 | ||||||||||||
Current service cost | 889 | 689 | 10,798 | 12,376 | ||||||||||||
Interest cost | 21,261 | 1,512 | 4,508 | 27,281 | ||||||||||||
Past service cost | 8,239 | — | — | 8,239 | ||||||||||||
Business acquisitions(Note 25a) | — | 1,444 | 6,550 | 7,994 | ||||||||||||
Actuarial losses due to change in financial assumptions1 | 99,257 | 15,253 | 14,878 | 129,388 | ||||||||||||
Actuarial gains due to change in demographic assumptions1 | (6,947 | ) | (292 | ) | (8,469 | ) | (15,708 | ) | ||||||||
Actuarial (gains) losses due to experience1 | (16,773 | ) | 1,065 | (1,400 | ) | (17,108 | ) | |||||||||
Plan participant contributions | 102 | — | — | 102 | ||||||||||||
Benefits paid from the plan | (25,395 | ) | (263 | ) | (3,228 | ) | (28,886 | ) | ||||||||
Benefits paid directly by employer | — | (4,020 | ) | (3,079 | ) | (7,099 | ) | |||||||||
Foreign currency translation adjustment1 | (28,698 | ) | (4,049 | ) | (3,321 | ) | (36,068 | ) | ||||||||
As at September 30, 2019 | 812,179 | 101,298 | 131,107 | 1,044,584 | ||||||||||||
Defined benefit obligations of unfunded plans | — | — | 92,738 | 92,738 | ||||||||||||
Defined benefit obligations of funded plans | 812,179 | 101,298 | 38,369 | 951,846 | ||||||||||||
As at September 30, 2019 | 812,179 | 101,298 | 131,107 | 1,044,584 | ||||||||||||
Defined benefit obligations | U.K. | Germany | Other | Total | ||||||||||||
| $ | $ | $ | $ | |||||||||||||
As at September 30, 2017 | 792,216 | 87,995 | 111,479 | 991,690 | ||||||||||||
Current service cost | 1,383 | 741 | 9,617 | 11,741 | ||||||||||||
Interest cost | 21,492 | 1,557 | 3,933 | 26,982 | ||||||||||||
Past service cost | — | — | 2,166 | 2,166 | ||||||||||||
Actuarial (gains) losses due to change in financial assumptions1 | (28,091 | ) | 242 | (3,649 | ) | (31,498 | ) | |||||||||
Actuarial gains due to change in demographic assumptions1 | (3,853 | ) | — | (4,994 | ) | (8,847 | ) | |||||||||
Actuarial losses due to experience1 | 3,116 | 541 | 4,710 | 8,367 | ||||||||||||
Plan participant contributions | 192 | — | — | 192 | ||||||||||||
Benefits paid from the plan | (31,907 | ) | (171 | ) | (5,267 | ) | (37,345 | ) | ||||||||
Benefits paid directly by employer | — | (2,611 | ) | (1,341 | ) | (3,952 | ) | |||||||||
Foreign currency translation adjustment1 | 5,696 | 1,665 | (2,784 | ) | 4,577 | |||||||||||
As at September 30, 2018 | 760,244 | 89,959 | 113,870 | 964,073 | ||||||||||||
Defined benefit obligations of unfunded plans | — | — | 88,025 | 88,025 | ||||||||||||
Defined benefit obligations of funded plans | 760,244 | 89,959 | 25,845 | 876,048 | ||||||||||||
As at September 30, 2018 | 760,244 | 89,959 | 113,870 | 964,073 | ||||||||||||
| 1 | Amounts recognized in other comprehensive income. |
106
|
| FISCAL 2019 RESULTS | |
Notes to the Consolidated Financial Statements
For the years ended September 30, 2019 and 2018
(tabular amounts only are in thousands of Canadian dollars, except per share data)
| 16. | Employee benefits (continued) |
DEFINED BENEFIT PLANS (CONTINUED)
Plan assets and reimbursement rights | U.K. | Germany | Other | Total | ||||||||||||
| $ | $ | $ | $ | |||||||||||||
As at September 30, 2018 | 787,550 | 36,420 | 22,903 | 846,873 | ||||||||||||
Interest income on plan assets | 22,271 | 620 | 2,425 | 25,316 | ||||||||||||
Employer contributions | 24,430 | 2,765 | 8,273 | 35,468 | ||||||||||||
Return on assets excluding interest income1 | 133,821 | (784 | ) | 669 | 133,706 | |||||||||||
Plan participants contributions | 102 | — | — | 102 | ||||||||||||
Benefits paid from the plan | (25,395 | ) | (263 | ) | (3,228 | ) | (28,886 | ) | ||||||||
Benefits paid directly by employer | — | (2,576 | ) | (3,079 | ) | (5,655 | ) | |||||||||
Administration expenses paid from the plan | (1,696 | ) | — | (152 | ) | (1,848 | ) | |||||||||
Foreign currency translation adjustment1 | (32,677 | ) | (1,019 | ) | 494 | (33,202 | ) | |||||||||
As at September 30, 2019 | 908,406 | 35,163 | 28,305 | 971,874 | ||||||||||||
Plan assets | 908,406 | 12,803 | 26,786 | 947,995 | ||||||||||||
Reimbursement rights | — | 22,360 | 1,519 | 23,879 | ||||||||||||
As at September 30, 2019 | 908,406 | 35,163 | 28,305 | 971,874 | ||||||||||||
Plan assets and reimbursement rights | U.K. | Germany | Other | Total | ||||||||||||
| $ | $ | $ | $ | |||||||||||||
As at September 30, 2017 | 763,859 | 34,951 | 26,156 | 824,966 | ||||||||||||
Interest income on plan assets | 20,915 | 626 | 1,824 | 23,365 | ||||||||||||
Employer contributions | 20,152 | 2,283 | 1,652 | 24,087 | ||||||||||||
Return on assets excluding interest income1 | 12,981 | 226 | 1,826 | 15,033 | ||||||||||||
Plan participants contributions | 192 | — | — | 192 | ||||||||||||
Benefits paid from the plan | (31,907 | ) | (171 | ) | (5,267 | ) | (37,345 | ) | ||||||||
Benefits paid directly by employer | — | (2,611 | ) | (1,341 | ) | (3,952 | ) | |||||||||
Administration expenses paid from the plan | (1,964 | ) | — | (173 | ) | (2,137 | ) | |||||||||
Foreign currency translation adjustment1 | 3,322 | 1,116 | (1,774 | ) | 2,664 | |||||||||||
As at September 30, 2018 | 787,550 | 36,420 | 22,903 | 846,873 | ||||||||||||
Plan assets | 787,550 | 13,250 | 21,421 | 822,221 | ||||||||||||
Reimbursement rights | — | 23,170 | 1,482 | 24,652 | ||||||||||||
As at September 30, 2018 | 787,550 | 36,420 | 22,903 | 846,873 | ||||||||||||
| 1 | Amounts recognized in other comprehensive income. |
107
|
CONSOLIDATED FINANCIAL STATEMENTS
Notes to the Consolidated Financial Statements
For the years ended September 30, 2019 and 2018
(tabular amounts only are in thousands of Canadian dollars, except per share data)
| 16. | Employee benefits (continued) |
DEFINED BENEFIT PLANS (CONTINUED)
The plan assets at the end of the years consist of:
As at September 30, 2019 | U.K. | Germany | Other | Total | ||||||||||||
| $ | $ | $ | $ | |||||||||||||
Quoted equities | 366,203 | — | — | 366,203 | ||||||||||||
Quoted bonds | 200,599 | — | — | 200,599 | ||||||||||||
Cash | 111,454 | — | 91 | 111,545 | ||||||||||||
Other1 | 230,150 | 12,803 | 26,695 | 269,648 | ||||||||||||
| 908,406 | 12,803 | 26,786 | 947,995 | |||||||||||||
As at September 30, 2018 | U.K. | Germany | Other | Total | ||||||||||||
| $ | $ | $ | $ | |||||||||||||
Quoted equities | 339,915 | — | — | 339,915 | ||||||||||||
Quoted bonds | 198,541 | — | 79 | 198,620 | ||||||||||||
Property | 34,399 | — | — | 34,399 | ||||||||||||
Cash | 17,178 | — | 107 | 17,285 | ||||||||||||
Other1 | 197,517 | 13,250 | 21,235 | 232,002 | ||||||||||||
| 787,550 | 13,250 | 21,421 | 822,221 | |||||||||||||
| 1 | Other is mainly composed of various insurance policies and quoted investment funds to cover some of the defined benefit obligations. |
Plan assets do not include any shares of the Company, property occupied by the Company or any other assets used by the Company.
The following table summarizes the expense1 recognized in the consolidated statements of earnings:
| Year ended September 30 | ||||||||
| 2019 | 2018 | |||||||
| $ | $ | |||||||
Current service cost | 12,376 | 11,741 | ||||||
Past service cost | 8,239 | 2,166 | ||||||
Net interest on net defined benefit obligations or assets | 1,965 | 3,617 | ||||||
Administration expenses | 1,848 | 2,137 | ||||||
| 24,428 | 19,661 | |||||||
| 1 | The expense was presented as costs of services, selling and administrative for an amount of $20,615,000 and as net finance costs for an amount of $3,813,000 (Note 24) ($13,907,000 and $5,754,000, respectively for the year ended September 30, 2018). |
108
|
| FISCAL 2019 RESULTS | |
Notes to the Consolidated Financial Statements
For the years ended September 30, 2019 and 2018
(tabular amounts only are in thousands of Canadian dollars, except per share data)
| 16. | Employee benefits (continued) |
DEFINED BENEFIT PLANS (CONTINUED)
Actuarial assumptions
The following are the principal actuarial assumptions (expressed as weighted averages). The assumed discount rates, future salary and pension increases, inflation rates and mortality all have a significant effect on the accounting valuation.
As at September 30, 2019 | U.K. | Germany | Other | |||||||||
| % | % | % | ||||||||||
Discount rate | 1.82 | 0.56 | 1.72 | |||||||||
Future salary increases | 3.03 | 2.50 | 2.23 | |||||||||
Future pension increases | 3.00 | 1.50 | 0.03 | |||||||||
Inflation rate | 3.03 | 2.00 | 2.37 | |||||||||
As at September 30, 2018 | U.K. | Germany | Other | |||||||||
| % | % | % | ||||||||||
Discount rate | 2.83 | 1.73 | 2.92 | |||||||||
Future salary increases | 3.40 | 2.50 | 2.50 | |||||||||
Future pension increases | 3.32 | 1.50 | — | |||||||||
Inflation rate | 3.40 | 2.00 | 2.31 | |||||||||
The average longevity over 65 of a member presently at age 45 and 65 are as follows:
As at September 30, 2019 | U.K. | Germany | ||||||||||
| (in years | ) | |||||||||||
Longevity at age 65 for current members | ||||||||||||
Males | 21.8 | 20.0 | ||||||||||
Females | 23.1 | 23.0 | ||||||||||
Longevity at age 45 for current members | ||||||||||||
Males | 23.6 | 24.0 | ||||||||||
Females | 25.2 | 26.0 | ||||||||||
As at September 30, 2018 | U.K. | Germany | ||||||||||
| (in years | ) | |||||||||||
Longevity at age 65 for current members | ||||||||||||
Males | 21.9 | 20.0 | ||||||||||
Females | 23.8 | 24.0 | ||||||||||
Longevity at age 45 for current members | ||||||||||||
Males | 23.3 | 22.0 | ||||||||||
Females | 25.4 | 26.0 | ||||||||||
109
|
CONSOLIDATED FINANCIAL STATEMENTS
Notes to the Consolidated Financial Statements
For the years ended September 30, 2019 and 2018
(tabular amounts only are in thousands of Canadian dollars, except per share data)
| 16. | Employee benefits (continued) |
DEFINED BENEFIT PLANS (CONTINUED)
Actuarial assumptions (continued)
Assumptions regarding future mortality are set based on actuarial advice in accordance with published statistics and experience in each country. Mortality assumptions for the most significant countries are based on the following post-retirement mortality tables for the year ended September 30, 2019: (1) U.K.: 100% S2PxA (year of birth) plus CMI_2018 projections with 1.25% p.a. minimum long term improvement rate, (2) Germany: Heubeck RT2018G.
The following tables show the sensitivity of the defined benefit obligations to changes in the principal actuarial assumptions:
As at September 30, 2019 | U.K. | Germany | ||||||
| $ | $ | |||||||
Increase of 0.25% in the discount rate | (33,082 | ) | (3,440 | ) | ||||
Decrease of 0.25% in the discount rate | 34,484 | 3,632 | ||||||
Salary increase of 0.25% | 408 | 56 | ||||||
Salary decrease of 0.25% | (404 | ) | (55 | ) | ||||
Pension increase of 0.25% | 16,758 | 1,601 | ||||||
Pension decrease of 0.25% | (16,398 | ) | (1,531 | ) | ||||
Increase of 0.25% in inflation rate | 26,342 | 1,601 | ||||||
Decrease of 0.25% in inflation rate | (25,490 | ) | (1,531 | ) | ||||
Increase of one year in life expectancy | 20,884 | 3,325 | ||||||
Decrease of one year in life expectancy | (20,824 | ) | (2,938 | ) | ||||
As at September 30, 2018 | U.K. | Germany | ||||||
| $ | $ | |||||||
Increase of 0.25% in the discount rate | (32,877 | ) | (2,870 | ) | ||||
Decrease of 0.25% in the discount rate | 34,433 | 3,024 | ||||||
Salary increase of 0.25% | 478 | 53 | ||||||
Salary decrease of 0.25% | (472 | ) | (51 | ) | ||||
Pension increase of 0.25% | 16,567 | 1,330 | ||||||
Pension decrease of 0.25% | (16,157 | ) | (1,276 | ) | ||||
Increase of 0.25% in inflation rate | 26,313 | 1,330 | ||||||
Decrease of 0.25% in inflation rate | (24,808 | ) | (1,276 | ) | ||||
Increase of one year in life expectancy | 18,676 | 2,501 | ||||||
Decrease of one year in life expectancy | (18,590 | ) | (2,237 | ) | ||||
The sensitivity analysis above has been based on a method that extrapolates the impact on the defined benefit obligations as a result of reasonable changes in key assumptions occurring at the end of the year.
The weighted average duration of the defined benefit obligations are as follows:
| Year ended September 30 | ||||||||
| 2019 | 2018 | |||||||
| (in years) | ||||||||
U.K. | 18 | 18 | ||||||
Germany | 14 | 14 | ||||||
Other | 13 | 13 | ||||||
110
|
| FISCAL 2019 RESULTS | |
Notes to the Consolidated Financial Statements
For the years ended September 30, 2019 and 2018
(tabular amounts only are in thousands of Canadian dollars, except per share data)
| 16. | Employee benefits (continued) |
DEFINED BENEFIT PLANS (CONTINUED)
The Company expects to contribute $25,247,000 to defined benefit plans during the next year, of which $19,799,000 relates to the U.K. plans, and $5,448,000 relates to the other plans. The contributions will include funding payments and new benefit accruals.
DEFINED CONTRIBUTION PLANS
The Company also operates defined contribution pension plans. In some countries, contributions are made into the state pension plans. The pension cost for defined contribution plans amounted to $221,063,000 in 2019 ($233,376,000 in 2018).
In addition, in Sweden, the Company contributes to a multi-employer plan, Alecta SE (Alecta) pension plan, which is a defined benefit pension plan. This pension plan is classified as a defined contribution plan as sufficient information is not available to use defined benefit accounting. Alecta lacks the possibility of establishing an exact distribution of assets and provisions to the respective employers. The Company’s proportion of the total contributions to the plan is 0.73% and the Company’s proportion of the total number of active members in the plan is 0.51%.
Alecta uses a collective funding ratio to determine the surplus or deficit in the pension plan. Any surplus or deficit in the plan will affect the amount of future contributions payable. The collective funding is the difference between Alecta’s assets and the commitments to the policy holders and insured individuals. The collective solvency is normally allowed to vary between 125% and 175%. As at September 30, 2019, Alecta collective funding ratio was 142% (159% in 2018). The plan expense was $32,512,000 in 2019 ($36,645,000 in 2018). The Company expects to contribute $25,736,000 to the plan during the next year.
OTHER BENEFIT PLANS
The Company maintains deferred compensation plans covering some of its U.S. and German management. Some of the plans include assets that will be used to fund the liabilities. As at September 30, 2019, the deferred compensation liability totaled $63,838,000 ($58,197,000 as at September 30, 2018) (Note 14) and the deferred compensation assets totaled $62,627,000 ($56,900,000 as at September 30, 2018) (Note 10).
For the deferred compensation plan in the U.S., a trust was established so that the plan assets could be segregated; however, the assets are subject to the Company’s general creditors in the case of bankruptcy. The assets composed of investments vary with employees’ contributions and changes in the value of the investments. The change in liabilities associated with the plan is equal to the change of the assets. The assets in the trust and the associated liabilities totaled $62,247,000 as at September 30, 2019 ($56,642,000 as at September 30, 2018).
111
|
CONSOLIDATED FINANCIAL STATEMENTS
Notes to the Consolidated Financial Statements
For the years ended September 30, 2019 and 2018
(tabular amounts only are in thousands of Canadian dollars, except per share data)
| 17. | Accumulated other comprehensive income |
| As at | As at | |||||||
| September 30, 2019 | September 30, 2018 | |||||||
| $ | $ | |||||||
Items that will be reclassified subsequently to net earnings: | ||||||||
Net unrealized gains on translating financial statements of foreign operations, net of accumulated income tax expense of $63,579 ($72,054 as at September 30, 2018) | 596,358 | 759,015 | ||||||
Net losses on cross-currency swaps and on translating long-term debt designated as hedges of net investments in foreign operations, net of accumulated income tax recovery of $67,165 ($73,502 as at September 30, 2018) | (426,376 | ) | (479,400 | ) | ||||
Deferred costs of hedging on cross-currency swaps, net of accumulated income tax recovery of $1,113 (nil as at September 30, 2018) | (4,091 | ) | — | |||||
Net unrealized gains (losses) on cash flow hedges, net of accumulated income tax expense of $13,003 (net of accumulated tax recovery of $12,286 as at September 30, 2018) | 24,157 | (26,786 | ) | |||||
Net unrealized gains (losses) on financial assets at fair value through other comprehensive income, net of accumulated income tax expense of $352 (net of accumulated income tax recovery of $734 as at September 30, 2018) | 1,486 | (2,616 | ) | |||||
Items that will not be reclassified subsequently to net earnings: | ||||||||
Net remeasurement losses on defined benefit plans, net of accumulated income tax recovery of $8,698 ($13,021 as at September 30, 2018) | (14,840 | ) | (48,617 | ) | ||||
| 176,694 | 201,596 | |||||||
For the year ended September 30, 2019, $8,306,000 of the net unrealized gains on cash flow hedges, net of income tax recovery of $4,311,000, previously recognized in other comprehensive income were reclassified in the consolidated statements of earnings ($145,000 for the year ended September 30, 2018). For the year ended September 30, 2019, $5,203,000 of the deferred costs of hedging cross-currency swaps, net of income tax recovery of $1,113,000, were also reclassified in the consolidated statements of earnings.
| 18. | Capital stock |
The Company’s authorized share capital is comprised of an unlimited number, all without par value, of:
| – | First preferred shares, issuable in series, carrying one vote per share, each series ranking equal with other series, but prior to second preferred shares, Class A subordinate voting shares and Class B multiple voting shares with respect to the payment of dividends; |
| – | Second preferred shares, issuable in series, non-voting, each series ranking equal with other series, but prior to Class A subordinate voting shares and Class B multiple voting shares with respect to the payment of dividends; |
| – | Class A subordinate voting shares, carrying one vote per share, participating equally with Class B multiple voting shares with respect to the payment of dividends and convertible into Class B multiple voting shares under certain conditions in the event of certain takeover bids on Class B multiple voting shares; and |
| – | Class B multiple voting shares, carrying ten votes per share, participating equally with Class A subordinate voting shares with respect to the payment of dividends and convertible at any time at the option of the holder into Class A subordinate voting shares. |
112
|
| FISCAL 2019 RESULTS | |
Notes to the Consolidated Financial Statements
For the years ended September 30, 2019 and 2018
(tabular amounts only are in thousands of Canadian dollars, except per share data)
| 18. | Capital stock (continued) |
For the fiscal years 2019 and 2018, the number of issued and outstanding Class A subordinate voting shares and Class B multiple voting shares varied as follows:
| Class A subordinate voting shares | Class B multiple voting shares | Total | ||||||||||||||||||||||
| Number | Carrying value | Number | Carrying value | Number | Carrying value | |||||||||||||||||||
| $ | $ | $ | ||||||||||||||||||||||
As at September 30, 2017 | 254,106,795 | 2,008,892 | 32,852,748 | 45,833 | 286,959,543 | 2,054,725 | ||||||||||||||||||
Issued upon exercise of stock options1 | 2,737,156 | 94,552 | — | — | 2,737,156 | 94,552 | ||||||||||||||||||
PSUs exercised2 | — | 7,439 | — | — | — | 7,439 | ||||||||||||||||||
Purchased and cancelled3 | (10,325,879 | ) | (113,437 | ) | — | — | (10,325,879 | ) | (113,437 | ) | ||||||||||||||
Purchased and not cancelled3 | — | (402 | ) | — | — | — | (402 | ) | ||||||||||||||||
Purchased and held in trusts4 | — | (24,789 | ) | — | — | — | (24,789 | ) | ||||||||||||||||
Shares held in trusts resold4 | — | 504 | — | — | — | 504 | ||||||||||||||||||
Conversion of shares5 | 3,907,042 | 5,451 | (3,907,042 | ) | (5,451 | ) | — | — | ||||||||||||||||
As at September 30, 2018 | 250,425,114 | 1,978,210 | 28,945,706 | 40,382 | 279,370,820 | 2,018,592 | ||||||||||||||||||
Issued upon exercise of stock options1 | 1,942,580 | 77,773 | — | — | 1,942,580 | 77,773 | ||||||||||||||||||
PSUs exercised2 | — | 7,651 | — | — | — | 7,651 | ||||||||||||||||||
Purchased and cancelled3 | (12,510,232 | ) | (169,299 | ) | — | — | (12,510,232 | ) | (169,299 | ) | ||||||||||||||
Purchased and held in trusts4 | — | (30,740 | ) | — | — | — | (30,740 | ) | ||||||||||||||||
As at September 30, 2019 | 239,857,462 | 1,863,595 | 28,945,706 | 40,382 | 268,803,168 | 1,903,977 | ||||||||||||||||||
| 1 | The carrying value of Class A subordinate voting shares includes $14,070,000 ($17,340,000 for the year ended September 30, 2018), which corresponds to a reduction in contributed surplus representing the value of accumulated compensation costs associated with the stock options exercised during the year. |
| 2 | During the year ended September 30, 2019, 160,694 PSUs were exercised (172,068 during the year ended September 30, 2018) with a recorded value of $7,651,000 ($7,439,000 during the year ended September 30, 2018) that was removed from contributed surplus. As at September 30, 2019, 875,480 Class A subordinate voting shares were held in trusts under the PSU plans (661,179 as at September 30, 2018). |
| 3 | On January 30, 2019, the Company’s Board of Directors authorized and subsequently received the regulatory approval for the renewal of the Normal Course Issuer Bid (NCIB) for the purchase for cancellation of up to 20,100,499 Class A subordinate voting shares on the open market through the TSX, the New York Stock Exchange (NYSE) and/or alternative trading systems or otherwise pursuant to exemption orders issued by securities regulators. The Class A subordinate voting shares are available for purchase for cancellation commencing February 6, 2019, until no later than February 5, 2020, or on such earlier date when the Company has either acquired the maximum number or elects to terminate the bid. |
During the year ended September 30, 2019, the Company purchased for cancellation 7,301,870 Class A subordinate voting shares (3,510,700 during the year ended September 30, 2018) under its previous and current NCIB for a cash consideration of $626,075,000 ($293,671,000 during the year ended September 30, 2018) and the excess of the purchase price over the carrying value in the amount of $567,125,000 ($265,563,000 during the year ended September 30, 2018) was charged to retained earnings. As of September 30, 2018, 50,000 of the purchased Class A subordinate voting shares with a carrying value of $402,000 and a cash consideration of $4,180,000 were held by the Company and were paid and cancelled during the year ended September 30, 2019. |
During the year ended September 30, 2019, the Company also purchased for cancellation 5,158,362 Class A subordinate voting shares from the Caisse de dépôt et placement du Québec for a cash consideration of $500,000,000 (3,634,729 and $272,842,000, respectively during the year ended September 30, 2018). The excess of the purchase price over the carrying value in the amount of $389,651,000 was charged to retained earnings ($195,062,000 during the year ended September 30, 2018). The purchase is considered within the annual aggregate limit that the Company is entitled to purchase under its current NCIB. |
| 4 | During the year ended September 30, 2019, the trustees, in accordance with the terms of the PSU plans and Trust Agreements, purchased 374,995 Class A subordinate voting shares of the Company on the open market (372,290 during the year ended September 30, 2018) for a cash consideration of $30,740,000 ($24,789,000 during the year ended September 30, 2018). During the year ended September 30, 2018, the trustees resold 7,711 Class A subordinate voting shares that were held in trusts on the open market in accordance with the terms of the PSU plans. The excess of proceeds over the carrying value of the Class A subordinate voting shares, in the amount of $24,000 resulted in an increase of contributed surplus. |
| 5 | On February 26, 2018, the Founder and Executive Chairman of the Board of the Company converted a total of 3,031,383 Class B multiple voting shares into 3,031,383 Class A subordinate voting shares. In addition, on May 9, 2018, the Founder and Advisor to the Executive Chairman of the Board of the Company, also a related party of the Company, converted a total of 875,659 Class B multiple voting shares into 875,659 Class A subordinate voting shares. |
On February 26, 2018, the Company entered into a private agreement with a related party, the Founder and Executive Chairman of the Board of the Company, to purchase for cancellation 3,230,450 Class A subordinate voting shares for a cash consideration of $231,443,000 excluding transaction costs of $300,000 which were paid during the year ended September 30, 2018. The excess of the purchase price over the carrying value in the amount of $223,792,000 was charged to retained earnings. The transaction was recommended by an independent committee of the Board of Directors of the Company following the receipt of an external opinion regarding the reasonableness of the terms of the transaction. A favourable decision was obtained from the Quebec securities regulator to exempt the Company from the issuer bid requirements. The purchase was considered within the annual aggregate limit that the Company was entitled to purchase under its previous NCIB.
113
|
CONSOLIDATED FINANCIAL STATEMENTS
Notes to the Consolidated Financial Statements
For the years ended September 30, 2019 and 2018
(tabular amounts only are in thousands of Canadian dollars, except per share data)
| 19. | Share-based payments |
| a) | Stock options |
Under the Company’s stock option plan, the Board of Directors may grant, at its discretion, stock options to purchase Class A subordinate voting shares to certain employees, officers and directors of the Company and its subsidiaries. The exercise price is established by the Board of Directors and is equal to the closing price of the Class A subordinate voting shares on the TSX on the day preceding the date of the grant. Stock options generally vest over four years from the date of grant conditionally upon achievement of performance objectives and must be exercised within a ten-year period, except in the event of retirement, termination of employment or death. As at September 30, 2019, 25,881,386 Class A subordinate voting shares were reserved for issuance under the stock option plan.
The following table presents information concerning the outstanding stock options granted by the Company:
| 2019 | 2018 | |||||||||||||||
| Number of options | | Weighted average exercise price per share | | Number of options | | Weighted average exercise price per share | | |||||||||
| $ | $ | |||||||||||||||
Outstanding, beginning of year | 12,830,826 | 52.01 | 15,237,883 | 44.70 | ||||||||||||
Granted | 52,735 | 82.59 | 1,944,829 | 83.94 | ||||||||||||
Exercised(Note 18) | (1,942,580 | ) | 32.81 | (2,737,156 | ) | 28.19 | ||||||||||
Forfeited | (1,045,783 | ) | 64.11 | (1,610,969 | ) | 61.93 | ||||||||||
Expired | (3,606 | ) | 34.79 | (3,761 | ) | 28.13 | ||||||||||
Outstanding, end of year | 9,891,592 | 54.64 | 12,830,826 | 52.01 | ||||||||||||
Exercisable, end of year | 5,460,470 | 41.32 | 5,695,951 | 34.11 | ||||||||||||
The weighted average share price at the date of exercise for stock options exercised in 2019 was $93.68 ($74.01 in 2018).
The following table summarizes information about the outstanding stock options granted by the Company as at September 30, 2019:
| Options outstanding | Options exercisable | |||||||||||||||||||||||
| | Range of exercise price | | | Number of options | | | Weighted average remaining contractual life | | | Weighted average exercise price | | | Number of options | | | Weighted average exercise price | | |||||||
| $ | (in years) | $ | $ | |||||||||||||||||||||
| 13.26 to 38.79 | 2,644,296 | 3.37 | 28.10 | 2,644,296 | 28.10 | |||||||||||||||||||
| 39.47 to 47.36 | 599,536 | 5.12 | 39.57 | 599,536 | 39.57 | |||||||||||||||||||
| 47.81 to 56.69 | 1,192,731 | 5.99 | 48.51 | 864,103 | 48.54 | |||||||||||||||||||
| 57.21 to 63.72 | 3,554,413 | 7.45 | 63.21 | 1,315,301 | 63.20 | |||||||||||||||||||
| 67.04 to 102.79 | 1,900,616 | 8.93 | 84.16 | 37,234 | 68.78 | |||||||||||||||||||
| 9,891,592 | 6.33 | 54.64 | 5,460,470 | 41.32 | ||||||||||||||||||||
114
|
| FISCAL 2019 RESULTS | |
Notes to the Consolidated Financial Statements
For the years ended September 30, 2019 and 2018
(tabular amounts only are in thousands of Canadian dollars, except per share data)
| 19. | Share-based payments (continued) |
| a) | Stock options (continued) |
The weighted average fair value of stock options granted in the year and the weighted average assumptions used in the calculation of their fair value on the date of grant using the Black-Scholes option pricing model were as follows:
| Year ended September 30 | ||||||||
| 2019 | 2018 | |||||||
Grant date fair value ($) | 16.24 | 16.45 | ||||||
Dividend yield (%) | 0.00 | 0.00 | ||||||
Expected volatility (%)1 | 19.79 | 19.80 | ||||||
Risk-free interest rate (%) | 2.26 | 2.21 | ||||||
Expected life (years) | 4.00 | 4.00 | ||||||
Exercise price ($) | 82.59 | 83.94 | ||||||
Share price ($) | 82.59 | 83.94 | ||||||
| 1 | Expected volatility was determined using statistical formulas and based on the weekly historical average of closing daily share prices over the period of the expected life of stock options. |
| b) | Performance share units |
The Company operates two PSU plans with similar terms and conditions. Under both plans, the Board of Directors may grant PSUs to certain employees and officers which entitle them to receive one Class A subordinate voting share for each PSU. The vesting performance conditions are determined by the Board of Directors at the time of each grant. PSUs expire on the business day preceding December 31 of the third calendar year following the end of the fiscal year during which the PSU award was made, except in the event of retirement, termination of employment or death. Conditionally upon achievement of performance objectives, granted PSUs under the first plan vest annually over a period of four years from the date of the grant and granted PSUs under the second plan vest at the end of the four-year period.
Class A subordinate voting shares purchased in connection with the PSU plans are held in trusts for the benefit of the participants. The trusts, considered as structured entities, are consolidated in the Company’s consolidated financial statements with the cost of the purchased shares recorded as a reduction of capital stock (Note 18).
The following table presents information concerning the number of outstanding PSUs granted by the Company:
Outstanding as at September 30, 2017 | 468,668 | |||
Granted1 | 403,321 | |||
Exercised(Note 18) | (172,068 | ) | ||
Forfeited | (41,189 | ) | ||
Outstanding as at September 30, 2018 | 658,732 | |||
Granted1 | 472,187 | |||
Exercised(Note 18) | (160,694 | ) | ||
Forfeited | (108,740 | ) | ||
Outstanding as at September 30, 2019 | 861,485 | |||
| 1 | The PSUs granted in 2019 had a grant date fair value of $83.24 per unit ($64.75 in 2018). |
| c) | Share purchase plan |
Under the share purchase plan, the Company contributes an amount equal to a percentage of the employee’s basic contribution, up to a maximum of 3.50%. An employee may make additional contributions in excess of the basic contribution. However, the Company does not match contributions in the case of such additional contributions. The employee and Company’s contributions are remitted to an independent plan administrator who purchases Class A subordinate voting shares on the open market on behalf of the employee through either the TSX or NYSE.
115
|
CONSOLIDATED FINANCIAL STATEMENTS
Notes to the Consolidated Financial Statements
For the years ended September 30, 2019 and 2018
(tabular amounts only are in thousands of Canadian dollars, except per share data)
| 19. | Share-based payments (continued) |
| d) | Deferred share unit plan |
External members of the Board of Directors (participants) are entitled to receive part or their entire retainer fee in DSUs. DSUs are granted with immediate vesting and must be exercised no later than December 15 of the calendar year immediately following the calendar year during which the participant ceases to act as a director. Each DSU entitles the holder to receive a cash payment equal to the closing price of Class A subordinate voting shares on the TSX on the payment date. As at September 30, 2019, the number of outstanding DSUs was 137,571 (140,886 DSUs as at September 30, 2018).
| e) | Share-based payment costs |
The share-based payment expense recorded in costs of services, selling and administrative is as follows:
| Year ended September 30 | ||||||||
| 2019 | 2018 | |||||||
| $ | $ | |||||||
Stock options | 21,674 | 25,822 | ||||||
PSUs | 17,766 | 12,635 | ||||||
Share purchase plan | 115,287 | 106,770 | ||||||
DSUs | 3,334 | 2,918 | ||||||
| 158,061 | 148,145 | |||||||
| 20. | Earnings per share |
The following table sets forth the computation of basic and diluted earnings per share for the years ended September 30:
| 2019 | 2018 | |||||||||||||||||||||||
| Net earnings | | Weighted average number of shares outstanding1 | | | Earnings per share | | Net earnings | | Weighted average number of shares outstanding1 | | | Earnings per share | | |||||||||||
| $ | $ | $ | $ | |||||||||||||||||||||
Basic | 1,263,207 | 272,719,309 | 4.63 | 1,141,402 | 283,878,426 | 4.02 | ||||||||||||||||||
Net effect of dilutive stock options and PSUs2 | 5,066,415 | 4,980,154 | ||||||||||||||||||||||
| 1,263,207 | 277,785,724 | 4.55 | 1,141,402 | 288,858,580 | 3.95 | |||||||||||||||||||
| 1 | During the year ended September 30, 2019, 12,460,232 Class A subordinate voting shares purchased and 875,480 Class A subordinate voting shares held in trust were excluded from the calculation of weighted average number of shares outstanding as of the date of transaction (10,375,879 and 661,179, respectively during the year ended September 30, 2018). |
| 2 | The calculation of the diluted earnings per share excluded 1,716,774 stock options for the year ended September 30, 2019 (1,935,289 for the year ended September 30, 2018), as they were anti-dilutive. |
| 21. | Remaining performance obligations |
Remaining performance obligations relates to Company’s performance obligations that are partially or fully unsatisfied under fixed-fee arrangements for which the term of the contract is over one year.
The amount of the selling price allocated to remaining performance obligations as at September 30, 2019 is $964,052,000 and is expected to be recognized as revenue within weighted an average of 1.6 years.
116
|
| FISCAL 2019 RESULTS | |
Notes to the Consolidated Financial Statements
For the years ended September 30, 2019 and 2018
(tabular amounts only are in thousands of Canadian dollars, except per share data)
| 22. | Costs of services, selling and administrative |
| Year ended September 30 | ||||||||
| 2019 | 2018 | |||||||
| $ | $ | |||||||
Salaries and other member costs1 | 7,158,588 | 6,846,585 | ||||||
Professional fees and other contracted labour | 1,439,915 | 1,369,420 | ||||||
Hardware, software and data center related costs | 873,158 | 829,655 | ||||||
Property costs | 363,812 | 307,496 | ||||||
Amortization and depreciation(Note 23) | 388,087 | 383,834 | ||||||
Other operating expenses | 60,447 | 64,801 | ||||||
| 10,284,007 | 9,801,791 | |||||||
| 1 | Net of R&D and other tax credits of $171,389,000 in 2019 ($182,493,000 in 2018). |
| 23. | Amortization and depreciation |
| Year ended September 30 | ||||||||
| 2019 | 2018 | |||||||
| $ | $ | |||||||
Depreciation of PP&E1(Note 6) | 159,264 | 156,587 | ||||||
Amortization of intangible assets(Note 8) | 164,560 | 156,926 | ||||||
Amortization of contract costs related to transition costs | 64,263 | 70,321 | ||||||
Included in costs of services, selling and administrative(Note 22) | 388,087 | 383,834 | ||||||
Amortization of contract costs related to incentives (presented as a reduction of revenue) | 2,919 | 3,591 | ||||||
Amortization of deferred financing fees (presented in finance costs) | 1,012 | 721 | ||||||
Amortization of premiums and discounts on investments related to funds held for clients (presented net as a reduction of revenue) | 283 | 1,339 | ||||||
Impairment of PP&E (presented in restructuring costs)(Note 6) | — | 1,924 | ||||||
Impairment of intangible assets (presented in restructuring costs)(Note 8) | — | 1,266 | ||||||
| 392,301 | 392,675 | |||||||
| 1 | Depreciation of PP&E acquired under finance leases was $8,117,000 in 2019 ($7,841,000 in 2018). |
| 24. | Net finance costs |
| Year ended September 30 | ||||||||
| 2019 | 2018 | |||||||
| $ | $ | |||||||
Interest on long-term debt | 63,312 | 62,875 | ||||||
Net interest costs on net defined benefit obligations or assets(Note 16) | 3,813 | 5,754 | ||||||
Other finance costs | 15,071 | 8,166 | ||||||
Finance costs | 82,196 | 76,795 | ||||||
Finance income | (11,566 | ) | (2,910 | ) | ||||
| 70,630 | 73,885 | |||||||
117
|
CONSOLIDATED FINANCIAL STATEMENTS
Notes to the Consolidated Financial Statements
For the years ended September 30, 2019 and 2018
(tabular amounts only are in thousands of Canadian dollars, except per share data)
| 25. | Investments in subsidiaries |
| a) | Business acquisitions realized in current fiscal year |
The Company made the following acquisitions during the year ended September 30, 2019:
| – | On October 11, 2018, the Company acquired all outstanding shares of ckc AG (ckc), a specialized provider of agile software development and management services, with a focus on the automotive sector, headquartered in Brunswick, Germany; |
| – | During the year, the Company acquired the control of Acando AB (Acando), a consulting services firm headquartered in Stockholm, Sweden, through a step acquisition. In March 2019, the Company acquired 22.6% of the outstanding shares of Acando which was accounted for as an investment in an associate using the equity method. On April 16, 2019, the Company acquired control of Acando through the acquisition of an additional 71.1% of the outstanding shares under a tender offer and by May 14, 2019, an additional 2.4% was acquired. The remaining 3.9% of the outstanding shares, which are included in accounts payable and accrued liabilities in the consolidated balance sheet, were acquired on October 11, 2019. |
| – | On August 30, 2019, the Company acquired all outstanding shares of Annams Systems Corporation d/b/a Sunflower Systems (Sunflower), a specialized provider of asset management software, solutions and services, headquartered in San Ramon, California. |
The following table presents the fair value of assets acquired and liabilities assumed for all the above acquisitions based on the acquisition-date fair values of the identifiable tangible and intangible assets acquired and liabilities assumed:
| Acando | Other | Total | ||||||||||
| $ | $ | $ | ||||||||||
Current assets | 105,298 | 14,674 | 119,972 | |||||||||
PP&E(Note 6) | 6,404 | 1,271 | 7,675 | |||||||||
Intangible assets(Note 8) | 102,889 | 9,855 | 112,744 | |||||||||
Goodwill1(Note 11) | 555,921 | 31,916 | 587,837 | |||||||||
Current liabilities | (120,746 | ) | (12,735 | ) | (133,481 | ) | ||||||
Deferred tax liabilities | (25,966 | ) | (1,324 | ) | (27,290 | ) | ||||||
Retirement benefits obligations(Note 16) | (6,550 | ) | (1,444 | ) | (7,994 | ) | ||||||
Long-term debt | (9,828 | ) | — | (9,828 | ) | |||||||
| 607,422 | 42,213 | 649,635 | ||||||||||
Cash acquired | 16,348 | (2,481 | ) | 13,867 | ||||||||
Net assets acquired | 623,770 | 39,732 | 663,502 | |||||||||
Consideration paid | 599,744 | 37,738 | 637,482 | |||||||||
Consideration payable2 | 24,026 | 1,994 | 26,020 | |||||||||
| 1 | The goodwill arising from the acquisitions mainly represents the future economic value associated to acquired work force and synergies with the Company’s operations. As at September 30, 2019, $482,939,000 of the goodwill is included in the Northern Europe operating segment, $90,943,000 in the Central and Eastern Europe operating segment and $13,955,000 in the U.S. Federal operating segment. The goodwill is only deductible for tax purposes for Sunflower. |
| 2 | Mostly repayable through the fiscal year 2020 with no interest. |
The fair value of assets acquired and liabilities assumed for Acando and Sunflower are preliminary and are expected to be completed as soon as management will have gathered all the significant information available and considered necessary in order to finalize this allocation. During the year ended September 30, 2019, the Company finalized the fair value of assets acquired and liabilities assumed for ckc.
Since the date of acquisition, Acando contributed approximately $170,000,000 of revenues and $9,000,000 of earnings before acquisition and related integration costs, and income taxes to the financial results of the Company. When annualized, these figures are indicative of the impact the acquisition would have had on the results of the Company since October 1, 2018, on a pro forma basis, before borrowing costs and divestitures, which are deemed non-significant.
With strategic consulting, system integration and customer-centric digital innovation capabilities, these acquisitions were made to complement CGI’s proximity model and expertise across key sectors, including manufacturing, retail and government.
118
|
| FISCAL 2019 RESULTS | |
Notes to the Consolidated Financial Statements
For the years ended September 30, 2019 and 2018
(tabular amounts only are in thousands of Canadian dollars, except per share data)
| 25. | Investments in subsidiaries (continued) |
| a) | Business acquisitions realized in current fiscal year (continued) |
On June 14, 2019, the Company announced an all-cash offer of approximatively $131,258,000 to acquire all outstanding shares of SCISYS Group PLC, operating in several sectors, with deep expertise and industry leading solutions in the space and defense sectors, as well as in the media and broadcast news industries, headquartered in Dublin, Ireland. The transaction is expected to be completed by the first quarter of fiscal year 2020.
| b) | Business acquisitions realized in the prior fiscal year |
The Company made the following acquisitions during the year ended September 30, 2018:
| – | On October 6, 2017 and October 26, 2017, the Company acquired 94.79% and an additional 1.88%, respectively of the outstanding shares of Affecto Plc (Affecto) and subsequently, acquired the remaining outstanding shares in the fiscal year 2018. Affecto is a leading provider of business intelligence and enterprise information management solutions and services, headquartered in Helsinki, Finland; |
| – | On December 7, 2017, the Company acquired all outstanding shares of Paragon Solutions, Inc. (Paragon), a high-end commercial business consultancy with depth in health and life sciences and IT expertise in digital transformation and systems integration, headquartered in Cranford, New Jersey; and |
| – | On May 16, 2018, the Company acquired all outstanding shares of Facilité Informatique Canada Inc. (Facilité Informatique), an IT consulting services firm in high-demand digital services across a wide range of industries with a strong local presence in Montréal and Québec City, headquartered in Montréal, Québec. |
These acquisitions were made to complement the Company’s proximity model and further strengthen its global capabilities across several in-demand digital transformation areas.
During the year ended September 30, 2018, the Company paid an amount of $9,966,000 related to acquisitions realized in the fiscal year 2018 and an additional amount of $7,385,000 related to acquisitions realized in the fiscal year 2017.
The following table presents the fair value of assets acquired and liabilities assumed for the above acquisitions based on the acquisition-date fair values of the identifiable tangible and intangible assets acquired and liabilities assumed. During the year ended September 30, 2018, the Company finalized the fair value of assets acquired and liabilities assumed for Affecto and Paragon. The fair value of assets acquired and liabilities assumed for Facilité Informatique was preliminary.
| 2018 | ||||
| $ | ||||
Current assets | 109,878 | |||
PP&E(Note 6) | 2,614 | |||
Intangible assets | 47,723 | |||
Goodwill1 | 209,992 | |||
Current liabilities | (89,179 | ) | ||
Deferred tax liabilities | (9,246 | ) | ||
Long-term debt | (27,925 | ) | ||
| 243,857 | ||||
Cash acquired | 22,642 | |||
Net assets acquired | 266,499 | |||
Consideration paid | 253,428 | |||
Consideration payable | 13,071 | |||
| 1 | The goodwill arising from the acquisitions mainly represents the future economic value associated to acquired work force and synergies with the Company’s operations. As at September 30, 2018, $44,674,000 of the goodwill is included in the U.S. Commercial and State Government operating segment, $29,081,000 in the Canada operating segment and $136,237,000 in the Northern Europe operating. The goodwill is not deductible for tax purposes. |
During the year ended September 30, 2019, the Company finalized the fair value of assets acquired and liabilities assumed for Facilité Informatique with adjustments resulting mainly in an increase of intangible assets of $1,320,000 and a decrease of goodwill of $734,000.
In addition, during the year ended September 30, 2019, the Company paid an additional cash consideration of $2,088,000 related to acquisitions realized in the prior fiscal year.
119
|
CONSOLIDATED FINANCIAL STATEMENTS
Notes to the Consolidated Financial Statements
For the years ended September 30, 2019 and 2018
(tabular amounts only are in thousands of Canadian dollars, except per share data)
| 25. | Investments in subsidiaries (continued) |
| c) | Acquisition-related and integration costs |
The Company expensed $77,417,000 related to acquisition-related and integration costs during the year ended September 30, 2019 ($37,482,000 during the year ended September 30, 2018). This amount includes acquisition-related costs of $1,992,000 ($1,687,000 during the year ended September 30, 2018) and integration costs of $75,425,000 ($35,795,000 during the year ended September 30, 2018). The acquisition-related costs consist mainly of professional fees incurred for the acquisitions. The integration costs mainly include termination of employments of $56,268,000 accounted for in restructuring provisions ($17,630,000 during the year ended September 30, 2018), leases of vacated premises of $4,795,000 accounted for in onerous lease provisions ($10,747,000 during the year ended September 30, 2018), as well as other integration costs of $14,362,000 ($7,418,000 during the year ended September 30, 2018).
| d) | Disposal |
There was no significant disposal during the years ended September 30, 2019 and 2018.
| 26. | Supplementary cash flow information |
a) Net change in non-cash working capital items is as follows for the years ended September 30:
| 2019 | 2018 | |||||||
| $ | $ | |||||||
Accounts receivable | 205,549 | (106,072 | ) | |||||
Work in progress | (161,031 | ) | 8,290 | |||||
Prepaid expenses and other assets | (22,238 | ) | 10,927 | |||||
Long-term financial assets | (3,547 | ) | (11,448 | ) | ||||
Accounts payable and accrued liabilities | (54,822 | ) | 107,889 | |||||
Accrued compensation | 13,112 | (10,602 | ) | |||||
Deferred revenue | (22,659 | ) | (61,827 | ) | ||||
Provisions | 737 | (31,831 | ) | |||||
Long-term liabilities | 19,353 | 13,866 | ||||||
Retirement benefits obligations | (2,814 | ) | 493 | |||||
Derivative financial instruments | (271 | ) | 46 | |||||
Income taxes | (27,620 | ) | 42,032 | |||||
| (56,251 | ) | (38,237 | ) | |||||
b) Non-cash operating and investing activities related to operations are as follows for the years ended September 30:
| 2019 | 2018 | |||||||
| $ | $ | |||||||
Operating activities | ||||||||
Accounts payable and accrued liabilities | 14,573 | 26,333 | ||||||
Provisions | 2,512 | 1,516 | ||||||
| 17,085 | 27,849 | |||||||
Investing activities | ||||||||
Purchase of PP&E | (14,913 | ) | (17,600 | ) | ||||
Additions to intangible assets | (14,267 | ) | (19,441 | ) | ||||
| (29,180 | ) | (37,041 | ) | |||||
120
|
| FISCAL 2019 RESULTS | |
Notes to the Consolidated Financial Statements
For the years ended September 30, 2019 and 2018
(tabular amounts only are in thousands of Canadian dollars, except per share data)
| 26. | Supplementary cash flow information (continued) |
c) Changes arising from financing activities are as follows for the years ended September 30:
| 2019 | 2018 | |||||||||||||||
| Long-term debt | Derivative financial instruments to hedge long-term debt | Long-term debt | Derivative financial instruments to hedge long-term debt | |||||||||||||
| $ | $ | $ | $ | |||||||||||||
Balance, beginning of year | 1,800,893 | 43,217 | 1,862,003 | 58,844 | ||||||||||||
Cash used in financing activities excluding equity | ||||||||||||||||
Net change in unsecured committed revolving credit facility | 139,575 | — | (5,205 | ) | — | |||||||||||
Increase of long-term debt | 686,810 | — | 20,111 | — | ||||||||||||
Repayment of long-term debt | (355,406 | ) | — | (121,771 | ) | — | ||||||||||
Repayment of debt assumed in business acquisitions | (2,141 | ) | — | (28,609 | ) | — | ||||||||||
Settlement of derivative financial instruments(Note 30) | — | (554 | ) | — | (2,430 | ) | ||||||||||
Non-cash financing activities | ||||||||||||||||
Increase in obligations under finance leases | 12,095 | — | 9,192 | — | ||||||||||||
Additions through business acquisitions(Note 25) | 9,828 | — | 27,925 | — | ||||||||||||
Changes in foreign currency exchange rates | 25,304 | (72,557 | ) | 50,968 | (13,197 | ) | ||||||||||
Other | 14,249 | — | (13,721 | ) | — | |||||||||||
Balance, end of year | 2,331,207 | (29,894 | ) | 1,800,893 | 43,217 | |||||||||||
d) Interest paid and received and income taxes paid are classified within operating activities and are as follows for the years ended September 30:
| 2019 | 2018 | |||||||
| $ | $ | |||||||
Interest paid | 102,108 | 81,998 | ||||||
Interest received | 3,080 | 1,536 | ||||||
Income taxes paid | 386,953 | 261,952 | ||||||
e) Cash and cash equivalents consisted of unrestricted cash as at September 30, 2019 and 2018.
121
|
CONSOLIDATED FINANCIAL STATEMENTS
Notes to the Consolidated Financial Statements
For the years ended September 30, 2019 and 2018
(tabular amounts only are in thousands of Canadian dollars, except per share data)
| 27. | Segmented information |
The following tables present information on the Company’s operations based on its revised management structure. Segment results are based on the location from which the services are delivered - the geographic delivery model. The Company has retrospectively revised the segmented information for the comparative period to conform to the new segmented information structure (Note 11).
| Year ended September 30, 2019 | ||||||||||||||||||||||||||||||||||||
| Western and Southern Europe | Northern Europe | Canada | U.S. Government | U.S. Federal | U.K. and Australia | Central and Eastern Europe | Asia Pacific | Total | ||||||||||||||||||||||||||||
| $ | $ | $ | $ | $ | $ | $ | $ | $ | ||||||||||||||||||||||||||||
Segment revenue | 2,019,663 | 1,877,252 | 1,711,927 | 1,802,462 | 1,621,987 | 1,351,993 | 1,162,593 | 563,359 | 12,111,236 | |||||||||||||||||||||||||||
Segment earnings before acquisition-related and integration costs, net finance costs and income tax expense1 | 271,543 | 200,116 | 349,497 | 331,135 | 235,262 | 180,646 | 101,749 | 155,047 | 1,824,995 | |||||||||||||||||||||||||||
Acquisition-related and integration costs(Note 25) | (77,417 | ) | ||||||||||||||||||||||||||||||||||
Net finance costs(Note 24) | (70,630 | ) | ||||||||||||||||||||||||||||||||||
Earnings before income taxes | 1,676,948 | |||||||||||||||||||||||||||||||||||
| 1 | Total amortization and depreciation of $391,289,000 included in the Western and Southern Europe, Northern Europe, Canada, U.S. Commercial and State Government, U.S. Federal, U.K and Australia, Central and Eastern Europe and Asia Pacific segments is $42,558,000, $65,502,000, $62,486,000, $72,767,000, $28,313,000, $67,110,000, $37,314,000 and $15,239,000, respectively for the year ended September 30, 2019. |
| Year ended September 30, 2018 | ||||||||||||||||||||||||||||||||||||
| Western and Southern Europe | Northern Europe | Canada | U.S. Commercial and State | U.S. Federal | U.K. and Australia | Central and Eastern Europe | Asia Pacific | Total | ||||||||||||||||||||||||||||
| $ | $ | $ | $ | $ | $ | $ | $ | $ | ||||||||||||||||||||||||||||
Segment revenue | 1,995,811 | 1,800,460 | 1,671,060 | 1,689,686 | 1,458,741 | 1,342,662 | 1,027,055 | 521,350 | 11,506,825 | |||||||||||||||||||||||||||
Segment earnings before acquisition-related and integration costs, restructuring costs, net finance costs and income tax expense1 | 258,802 | 196,823 | 363,066 | 283,571 | 198,140 | 195,098 | 86,428 | 119,806 | 1,701,734 | |||||||||||||||||||||||||||
Acquisition-related and integration costs(Note 25) | (37,482 | ) | ||||||||||||||||||||||||||||||||||
Restructuring costs | (100,387 | ) | ||||||||||||||||||||||||||||||||||
Net finance costs(Note 24) | (73,885 | ) | ||||||||||||||||||||||||||||||||||
Earnings before income taxes | 1,489,980 | |||||||||||||||||||||||||||||||||||
| 1 | Total amortization and depreciation of $388,764,000 included in the Western and Southern Europe, Northern Europe, Canada, U.S. Commercial and State Government, U.S. Federal, U.K and Australia, Central and Eastern Europe and Asia Pacific segments is $40,732,000, $57,003,000, $66,948,000, $73,234,000, $24,269,000, $78,150,000, $33,029,000 and $15,399,000, respectively for the year ended September 30, 2018. |
The accounting policies of each operating segment are the same as those described in Note 3, Summary of significant accounting policies. Intersegment revenue is priced as if the revenue was from third parties.
122
|
| FISCAL 2019 RESULTS | |
Notes to the Consolidated Financial Statements
For the years ended September 30, 2019 and 2018
(tabular amounts only are in thousands of Canadian dollars, except per share data)
| 27. | Segmented information (continued) |
GEOGRAPHIC INFORMATION
The following table provides external revenue information based on the client’s location which is different from the revenue presented under operating segments, due to the intersegment revenue, for the years ended September 30:
| 2019 | 2018 | |||||||
| $ | $ | |||||||
Western and Southern Europe | ||||||||
France | 1,761,861 | 1,717,476 | ||||||
Others | 264,252 | 285,768 | ||||||
| 2,026,113 | 2,003,244 | |||||||
Northern Europe | ||||||||
Sweden | 854,565 | 800,221 | ||||||
Finland | 785,285 | 781,346 | ||||||
Others | 334,280 | 309,625 | ||||||
| 1,974,130 | 1,891,192 | |||||||
Canada | 1,881,364 | 1,823,948 | ||||||
U.S.1 | 3,474,418 | 3,222,912 | ||||||
U.K. and Australia | ||||||||
U.K. | 1,480,627 | 1,414,568 | ||||||
Australia | 75,268 | 114,601 | ||||||
| 1,555,895 | 1,529,169 | |||||||
Central and Eastern Europe | ||||||||
Germany | 655,713 | 502,703 | ||||||
Netherlands | 463,633 | 448,589 | ||||||
Others | 74,271 | 71,883 | ||||||
| 1,193,617 | 1,023,175 | |||||||
Asia Pacific | ||||||||
Others | 5,699 | 13,185 | ||||||
| 5,699 | 13,185 | |||||||
| 12,111,236 | 11,506,825 | |||||||
| 1 | External revenue included in the U.S Commercial and State Government and U.S. Federal operating segments was $1,829,010,000 and $1,645,408,000, respectively in 2019 ($1,742,336,000 and $1,480,576,000, respectively in 2018). |
123
|
CONSOLIDATED FINANCIAL STATEMENTS
Notes to the Consolidated Financial Statements
For the years ended September 30, 2019 and 2018
(tabular amounts only are in thousands of Canadian dollars, except per share data)
| 27. | Segmented information (continued) |
GEOGRAPHIC INFORMATION (CONTINUED)
The following table provides information for PP&E, contract costs and intangible assets based on their location:
| As at September 30, 2019 | As at September 30, 2018 | |||||||
| $ | $ | |||||||
U.S. | 367,415 | 337,191 | ||||||
Canada | 292,291 | 319,604 | ||||||
U.K. | 103,803 | 140,682 | ||||||
France | 45,501 | 53,214 | ||||||
Sweden | 125,987 | 68,463 | ||||||
Finland | 46,828 | 47,512 | ||||||
Germany | 47,800 | 37,331 | ||||||
Netherlands | 22,187 | 25,248 | ||||||
Rest of the world | 86,796 | 81,321 | ||||||
| 1,138,608 | 1,110,566 | |||||||
INFORMATION ABOUT SERVICES
The following table provides revenue information based on services provided by the Company for the year ended September 30:
| 2019 | 2018 | |||||||
| $ | $ | |||||||
Systems integration and consulting | 5,998,486 | 6,023,321 | ||||||
Management of IT and business functions | 6,112,750 | 5,483,504 | ||||||
| 12,111,236 | 11,506,825 | |||||||
MAJOR CLIENT INFORMATION
Contracts with the U.S. federal government and its various agencies, included within the U.S. Federal operating segment, accounted for $1,554,933,000 and 12.84% of revenues for the year ended September 30, 2019 ($1,379,525,000 and 12.00% for the year ended September 30, 2018).
124
|
| FISCAL 2019 RESULTS | |
Notes to the Consolidated Financial Statements
For the years ended September 30, 2019 and 2018
(tabular amounts only are in thousands of Canadian dollars, except per share data)
| 28. | Related party transactions |
| a) | Transactions with subsidiaries and other related parties |
Balances and transactions between the Company and its subsidiaries have been eliminated on consolidation. The Company owns 100% of the equity interests of its principal subsidiaries.
The Company’s principal subsidiaries whose revenues, based on the geographic delivery model, represent more than 3% of the consolidated revenues are as follows:
| Name of subsidiary | Country of incorporation | |
CGI Technologies and Solutions Inc. | United States | |
CGI France SAS | France | |
CGI Federal Inc. | United States | |
CGI IT UK Limited | United Kingdom | |
CGI Information Systems and Management Consultants Inc. | Canada | |
Conseillers en gestion et informatique CGI Inc. | Canada | |
CGI Sverige AB | Sweden | |
CGI Suomi Oy | Finland | |
CGI Deutschland B.V. & Co KG | Germany | |
CGI Information Systems and Management Consultants Private Limited | India | |
CGI Nederland BV | Netherlands | |
During the year ended September 30, 2018, the Company entered into share repurchase and conversion transactions with related parties as described in Note 18, Capital Stock.
| b) | Compensation of key management personnel |
Compensation of key management personnel, currently defined as the executive officers and the Board of Directors of the Company, was as follows for the year ended September 30:
| 2019 | 2018 | |||||||
| $ | $ | |||||||
Short-term employee benefits | 22,185 | 22,326 | ||||||
Share-based payments | 23,991 | 20,773 | ||||||
| 29. | Commitments, contingencies and guarantees |
| a) | Commitments |
As at September 30, 2019, the Company is committed under the terms of operating leases with various expiration dates up to 2033, primarily for the rental of premises and computer equipment used in managed IT and business process services contracts, in the aggregate amount of approximately $847,502,000, excluding costs for services and taxes.
The future minimum lease payments under non-cancellable operating leases are due as follows:
| $ | ||||
Less than one year | 188,121 | |||
Between one and two years | 155,531 | |||
Between two and five years | 332,619 | |||
Beyond five years | 171,231 | |||
The majority of the lease agreements are renewable at the end of the lease period at market rates. The lease expenditure charged to earnings during the year was $196,494,000 ($185,292,000 in 2018), net of subleases income of $2,746,000 ($12,560,000 in 2018). As at September 30, 2019, the total future minimum sublease payments expected to be received under non-cancellable subleases were $8,631,000 ($4,075,000 as at September 30, 2018).
125
|
CONSOLIDATED FINANCIAL STATEMENTS
Notes to the Consolidated Financial Statements
For the years ended September 30, 2019 and 2018
(tabular amounts only are in thousands of Canadian dollars, except per share data)
| 29. | Commitments, contingencies and guarantees (continued) |
| a) | Commitments (continued) |
The Company entered into long-term service and other agreements representing a total commitment of $211,845,000. Minimum payments under these agreements are due as follows:
| $ | ||||
Less than one year | 113,840 | |||
Between one and two years | 79,252 | |||
Between two and five years | 18,753 | |||
| b) | Contingencies |
From time to time, the Company is involved in legal proceedings, audits, litigation and claims which primarily relate to tax exposure, contractual disputes and employee claims arising in the ordinary course of its business. Certain of these matters seek damages in significant amounts and will ultimately be resolved when one or more future events occur or fail to occur. Although the outcome of such matters is not predictable with assurance, the Company has no reason to believe that the disposition of any such current matter could reasonably be expected to have a materially adverse impact on the Company’s financial position, results of operations or the ability to carry on any of its business activities. Claims for which there is a probable unfavourable outcome are recorded in provisions.
In addition, the Company is engaged to provide services under contracts with the U.S. Government. The contracts are subject to extensive legal and regulatory requirements and, from time to time, agencies of the U.S. Government investigate whether the Company’s operations are being conducted in accordance with these requirements. Generally, the Government has the right to change the scope of, or terminate, these projects at its convenience. The termination or reduction in the scope of a major government project could have a materially adverse effect on the results of operations and the financial condition of the Company.
| c) | Guarantees |
Sale of assets and business divestitures
In connection with the sale of assets and business divestitures, the Company may be required to pay counterparties for costs and losses incurred as the result of breaches in contractual obligations, representations and warranties, intellectual property right infringement and litigation against counterparties, among others. While some of the agreements specify a maximum potential exposure of approximately $8,871,000 in total, others do not specify a maximum amount or limited period. It is not possible to reasonably estimate the maximum amount that may have to be paid under such guarantees. The amounts are dependent upon the outcome of future contingent events, the nature and likelihood of which cannot be determined at this time. No amount has been accrued in the consolidated balance sheets relating to this type of indemnification as at September 30, 2019. The Company does not expect to incur any potential payment in connection with these guarantees that could have a materially adverse effect on its consolidated financial statements.
Other transactions
In the normal course of business, the Company may provide certain clients, principally governmental entities, with bid and performance bonds. In general, the Company would only be liable for the amount of the bid bonds if the Company refuses to perform the project once the bid is awarded. The Company would also be liable for the performance bonds in the event of default in the performance of its obligations. As at September 30, 2019, the Company had committed a total of $33,658,000 of these bonds. To the best of its knowledge, the Company is in compliance with its performance obligations under all service contracts for which there is a bid or performance bond, and the ultimate liability, if any, incurred in connection with these guarantees, would not have a materially adverse effect on the Company’s consolidated results of operations or financial condition.
Moreover, the Company has letters of credit for a total of $70,720,000 in addition to the letters of credit covered by the unsecured committed revolving credit facility (Note 13). These guarantees are required in some of the Company’s contracts with customers.
126
|
| FISCAL 2019 RESULTS | |
Notes to the Consolidated Financial Statements
For the years ended September 30, 2019 and 2018
(tabular amounts only are in thousands of Canadian dollars, except per share data)
| 30. | Financial instruments |
FAIR VALUE MEASUREMENTS
Fair value is the price that would be received to sell an asset or paid to transfer a liability in an orderly transaction between market participants at the measurement date.
Valuation techniques used to value financial instruments are as follows:
| - | The fair value of Senior U.S. and euro unsecured notes and the other long-term debt is estimated by discounting expected cash flows at rates currently offered to the Company for debts of the same remaining maturities and conditions; |
| - | The fair value of long-term bonds included in funds held for clients and in long-term investments is determined by discounting the future cash flows using observable inputs, such as interest rate yield curves or credit spreads, or according to similar transactions on an arm’s-length basis; |
| - | The fair value of foreign currency forward contracts is determined using forward exchange rates at the end of the reporting period; |
| - | The fair value of cross-currency swaps and interest rate swaps is determined based on market data (primarily yield curves, exchange rates and interest rates) to calculate the present value of all estimated cash flows; |
| - | The fair value of cash and cash equivalents is determined using observable quotes; and |
| - | The fair value of deferred compensation plan assets within long-term financial assets is based on observable price quotations and net assets values at the reporting date. |
As at September 30, 2019, there were no changes in valuation techniques.
The following table presents the financial liabilities included in the long-term debt (Note 13) measured at amortized cost categorized using the fair value hierarchy.
As at September 30, 2019
| As at September 30, 2018
| |||||||||||||||||||
| Level | Carrying amount | Fair value | Carrying amount | Fair value | ||||||||||||||||
| $ | $ | $ | $ | |||||||||||||||||
Senior U.S. and euro unsecured notes | Level 2 | 1,256,554 | 1,330,809 | 1,517,334 | 1,550,329 | |||||||||||||||
Obligations other than finance leases | Level 2 | 14,295 | 13,960 | 30,124 | 29,130 | |||||||||||||||
Obligations under finance leases | Level 2 | 30,339 | 29,792 | 29,909 | 29,193 | |||||||||||||||
Other long-term debt | Level 2 | 33,710 | 32,783 | 28,731 | 27,674 | |||||||||||||||
| 1,334,898 | 1,407,344 | 1,606,098 | 1,636,326 | |||||||||||||||||
For the remaining financial assets and liabilities measured at amortized cost, the carrying values approximate the fair values of the financial instruments given their short term maturity.
127
|
CONSOLIDATED FINANCIAL STATEMENTS
Notes to the Consolidated Financial Statements
For the years ended September 30, 2019 and 2018
(tabular amounts only are in thousands of Canadian dollars, except per share data)
| 30. | Financial instruments (continued) |
FAIR VALUE MEASUREMENTS (CONTINUED)
The following table presents financial assets and liabilities measured at fair value categorized using the fair value hierarchy:
| Level | As at September 30, 2019 | As at September 30, 2018 | ||||||||||
| $ | $ | |||||||||||
Financial assets | ||||||||||||
FVTE | ||||||||||||
Cash and cash equivalents | Level 2 | 213,831 | 184,091 | |||||||||
Deferred compensation plan assets (Note 10) | Level 1 | 62,627 | 56,900 | |||||||||
| 276,458 | 240,991 | |||||||||||
Derivative financial instruments designated as hedging instruments | ||||||||||||
Current derivative financial instruments included in current financial assets | Level 2 | |||||||||||
Cross-currency swaps | 4,243 | 8,545 | ||||||||||
Foreign currency forward contracts | 25,799 | 3,850 | ||||||||||
Long-term derivative financial instruments (Note 10) | Level 2 | |||||||||||
Cross-currency swaps | 45,193 | 8,943 | ||||||||||
Foreign currency forward contracts | 25,069 | 2,369 | ||||||||||
Interest rate swaps | 1,380 | — | ||||||||||
| 101,684 | 23,707 | |||||||||||
FVOCI (2018: available for sale) | ||||||||||||
Short-term investments included in current financial assets | Level 2 | 9,889 | — | |||||||||
Long-term bonds included in funds held for clients (Note 5) | Level 2 | 180,289 | 184,401 | |||||||||
Long-term investments (Note 10) | Level 2 | 24,596 | 30,054 | |||||||||
| 214,774 | 214,455 | |||||||||||
Financial liabilities | ||||||||||||
Derivative financial instruments designated as hedging instruments | ||||||||||||
Current derivative financial instruments | Level 2 | |||||||||||
Cross-currency swaps | 2,982 | 21,950 | ||||||||||
Foreign currency forward contracts | 1,920 | 17,468 | ||||||||||
Long-term derivative financial instruments | Level 2 | |||||||||||
Cross-currency swaps | 16,560 | 38,755 | ||||||||||
Foreign currency forward contracts | 1,762 | 26,673 | ||||||||||
Interest rate swaps | — | 12,326 | ||||||||||
| 23,224 | 117,172 | |||||||||||
There have been no transfers between Level 1 and Level 2 for the years ended September 30, 2019 and 2018.
128
|
| FISCAL 2019 RESULTS | |
Notes to the Consolidated Financial Statements
For the years ended September 30, 2019 and 2018
(tabular amounts only are in thousands of Canadian dollars, except per share data)
| 30. | Financial instruments (continued) |
MARKET RISK
Market risk incorporates a range of risks. Movements in risk factors, such as interest rate risk and currency risk, affect the fair values of financial assets and liabilities.
Interest rate risk
The Company has interest rate swaps whereby the Company receives a fixed rate of interest and pays interest at a variable rate of its Senior U.S. unsecured note. These swaps are being used to hedge the exposure to changes in the fair value of the debt. The following table summarizes the fair value of theses swaps:
As at September 30, 2019 | As at September 30, 2018 | |||||||||||||||||||||||
| Interest rate swaps | Notional amount | Receive Rate | Pay Rate | Maturity | Fair value | Fair value | ||||||||||||||||||
Fair value hedges of Senior U.S. unsecured note | U.S.$ | 250,000 | 4.99% | LIBOR 1 month +3.26% | December 2021 | 1,380 | (12,326 | ) | ||||||||||||||||
Senior U.S. unsecured note with a carrying value of $332,533,000, includes an accumulated amount of fair value hedge adjustments of $1,418,000 as at September 30, 2019.
In addition, the Company designates cross-currency interest rate swaps as cash flow hedges for changes in both interest rates and foreign exchange rates of foreign currency denominated long-term debt as described below.
The Company is also exposed to interest rate risk on its unsecured committed revolving credit facility.
The Company analyzes its interest rate risk exposure on an ongoing basis using various scenarios to simulate refinancing or the renewal of existing positions. Based on these scenarios, a change in the interest rate of 1% would not have had a significant impact on net earnings and comprehensive income.
Currency risk
The Company operates internationally and is exposed to risk from changes in foreign currency exchange rates. The Company mitigates this risk principally through foreign currency denominated debt and derivative financial instruments, which includes foreign currency forward contracts and cross-currency swaps.
The Company hedges a portion of the translation of the Company’s net investments in its U.S. and European operations into Canadian dollar, with Senior U.S. and euro unsecured notes. As of September 30, 2019, U.S. unsecured notes of a carrying value of $634,095,000 and a nominal amount of $632,762,000 has been designated as hedging instruments to hedge portions of the Company’s net investments in its U.S. and European operations.
The Company also hedges a portion of the translation of the Company’s net investments in its European operations with cross-currency swaps.
129
|
CONSOLIDATED FINANCIAL STATEMENTS
Notes to the Consolidated Financial Statements
For the years ended September 30, 2019 and 2018
(tabular amounts only are in thousands of Canadian dollars, except per share data)
| 30. | Financial instruments (continued) |
MARKET RISK (CONTINUED)
Currency risk (continued)
The following tables summarize the cross-currency swap agreements that the Company had entered into in order to manage its currency:
As at September 30, 2019 | As at September 30, 2018 | |||||||||||||||||||
| Receive Notional | Receive Rate | Pay Notional | Pay rate | Maturity | Fair value | Fair value | ||||||||||||||
Hedges of net investments in European operations | ||||||||||||||||||||
| $443,500 | From 3.40% to 3.81% | €285,400 | From 2.10% to 2.51% | From September 2020 to 2024 | 19,305 | 1,985 | ||||||||||||||
| $136,274 | From 3.57% to 3.63% | £75,842 | From 2.67% to 2.80% | September 2024 | 12,511 | 6,311 | ||||||||||||||
| $58,419 | From 3.57% to 3.68% | Skr371,900 | From 2.12% to 2.18% | September 2024 | 7,995 | 2,553 | ||||||||||||||
Hedges of net investments in European operations and cash flow hedges on unsecured committed term loan credit facility | ||||||||||||||||||||
| U.S.$500,000 | LIBOR 1 month + 3.03% | €443,381 | From 1.13% to 1.17% | December 2023 | (3,627 | ) | — | |||||||||||||
Cash flow hedges of Senior U.S. unsecured notes | ||||||||||||||||||||
| U.S.$470,000 | From 3.74% to 4.06% | $638,193 | From 3.40% to 3.81% | From September 2020 to 2024 | (6,290 | ) | (54,066 | ) | ||||||||||||
| Total | 29,894 | (43,217 | ) | |||||||||||||||||
During the year ended September 30, 2019, the Company settled cross-currency swaps with a notional amount of $318,600,000 for a net amount of $554,000. The related amounts recognized in accumulated other comprehensive income will be transferred to earnings when the net investment is disposed of.
The Company enters into foreign currency forward contracts to hedge the variability in various foreign currency exchange rates on future revenues. Hedging relationships are designated and documented at inception and quarterly effectiveness assessments are performed during the year.
As at September 30, 2019, the Company held foreign currency forward contracts to hedge exposures to changes in foreign currency, which have the following notional, average contract rates and maturities:
| Average contract rates | As at September 30, 2019 | As at September 30, 2018 | ||||||||||||||||||
| Foreign currency forward contracts | Notional | Less than one year | More than one year | Fair value | Fair value | |||||||||||||||
USD/INR | U.S.$130,070 | 72.07 | 77.74 | 1,498 | (8,727 | ) | ||||||||||||||
CAD/INR | $300,226 | 57.36 | 60.46 | 11,687 | (8,258 | ) | ||||||||||||||
EUR/INR | €107,386 | 88.06 | 95.43 | 14,985 | (7,445 | ) | ||||||||||||||
GBP/INR | £86,669 | 96.30 | 104.48 | 11,929 | (6,221 | ) | ||||||||||||||
SEK/INR | Skr255,236 | 8.35 | 8.88 | 3,945 | (488 | ) | ||||||||||||||
EUR/GBP | €49,442 | 0.89 | 0.91 | (311 | ) | (2,788 | ) | |||||||||||||
EUR/MAD | €65,714 | 11.17 | 11.91 | 4,416 | (2,879 | ) | ||||||||||||||
EUR/CZK | €24,991 | 25.95 | 26.50 | 243 | 4 | |||||||||||||||
EUR/SEK | €43,298 | 10.35 | 10.56 | (1,828 | ) | (752 | ) | |||||||||||||
Others | $57,239 | 622 | (368 | ) | ||||||||||||||||
Total | 47,186 | (37,922 | ) | |||||||||||||||||
130
|
| FISCAL 2019 RESULTS | |
Notes to the Consolidated Financial Statements
For the years ended September 30, 2019 and 2018
(tabular amounts only are in thousands of Canadian dollars, except per share data)
| 30. | Financial instruments (continued) |
MARKET RISK (CONTINUED)
Currency risk (continued)
The following table details the Company’s sensitivity to a 10% strengthening of the Swedish krona, the U.S. dollar, the euro and the British pound foreign currency rates on net earnings and comprehensive income. The sensitivity analysis on net earnings presents the impact of foreign currency denominated financial instruments and adjusts their translation at period end for a 10% strengthening in foreign currency rates. The sensitivity analysis on other comprehensive income presents the impact of a 10% strengthening in foreign currency rates on the fair value of foreign currency forward contracts designated as cash flow hedges and on net investment hedges.
| 2019 | 2018 | |||||||||||||||||||||||||||||||
| Swedish krona impact | U.S. dollar impact | euro impact | British pound impact | Swedish krona impact | U.S. dollar impact | euro impact | British pound impact | |||||||||||||||||||||||||
| $ | $ | $ | $ | $ | $ | $ | $ | |||||||||||||||||||||||||
Increase (decrease) in net earnings | 875 | 2,333 | 167 | 2,166 | (906 | ) | (4,870 | ) | (778 | ) | (2,695 | ) | ||||||||||||||||||||
Decrease in other comprehensive income | (7,724 | ) | (65,034 | ) | (109,838 | ) | (24,736 | ) | (6,522 | ) | (65,337 | ) | (107,722 | ) | (25,018 | ) | ||||||||||||||||
LIQUIDITY RISK
Liquidity risk is the risk that the Company is not able to meet its financial obligations as they fall due or can do so only at excessive cost. The Company’s activities are financed through a combination of the cash flows from operations, borrowing under existing unsecured committed revolving credit facility, the issuance of debt and the issuance of equity. One of management’s primary goals is to maintain an optimal level of liquidity through the active management of the assets and liabilities as well as the cash flows. The Company regularly monitors its cash forecasts to ensure it has sufficient flexibility under its available liquidity to meet its obligations.
131
|
CONSOLIDATED FINANCIAL STATEMENTS
Notes to the Consolidated Financial Statements
For the years ended September 30, 2019 and 2018
(tabular amounts only are in thousands of Canadian dollars, except per share data)
| 30. | Financial instruments (continued) |
LIQUIDITY RISK (CONTINUED)
The following tables summarize the carrying amount and the contractual maturities of both the interest and principal portion of financial liabilities. All amounts contractually denominated in foreign currency are presented in Canadian dollar equivalent amounts using the period-end spot rate or floating rate.
| As at September 30, 2019 | Carrying amount | Contractual cash flows | Less than one year | Between one and two years | Between two and five years | Beyond five years | ||||||||||||||||||
| $ | $ | $ | $ | $ | $ | |||||||||||||||||||
Non-derivative financial liabilities | ||||||||||||||||||||||||
Accounts payable and accrued liabilities | 1,108,895 | 1,108,895 | 1,108,895 | — | — | — | ||||||||||||||||||
Accrued compensation | 642,897 | 642,897 | 642,897 | — | — | — | ||||||||||||||||||
Senior U.S. and euro unsecured notes | 1,256,554 | 1,425,138 | 116,613 | 309,780 | 998,745 | — | ||||||||||||||||||
Unsecured committed revolving credit facility | 334,370 | 378,298 | 10,493 | 10,493 | 357,312 | — | ||||||||||||||||||
Unsecured committed term loan credit facility | 661,939 | 747,921 | 19,677 | 20,346 | 707,898 | — | ||||||||||||||||||
Obligations other than finance leases | 14,295 | 14,609 | 10,938 | 3,102 | 569 | — | ||||||||||||||||||
Obligations under finance leases | 30,339 | 31,245 | 14,534 | 11,585 | 5,126 | — | ||||||||||||||||||
Other long-term debt | 33,710 | 34,181 | 22,719 | 5,652 | 5,219 | 591 | ||||||||||||||||||
Clients’ funds obligations | 366,796 | 366,796 | 366,796 | — | — | — | ||||||||||||||||||
Derivative financial liabilities | ||||||||||||||||||||||||
Cash flow hedges of future revenue | 3,682 | |||||||||||||||||||||||
Outflow | 224,440 | 97,993 | 80,424 | 46,023 | — | |||||||||||||||||||
(Inflow) | (228,672 | ) | (97,250 | ) | (82,216 | ) | (49,206 | ) | — | |||||||||||||||
Cross-currency swaps | 19,542 | |||||||||||||||||||||||
Outflow | 1,160,635 | 91,857 | 165,934 | 902,844 | — | |||||||||||||||||||
(Inflow) | (1,218,430 | ) | (101,823 | ) | (172,868 | ) | (943,739 | ) | — | |||||||||||||||
| 4,473,019 | 4,687,953 | 2,304,339 | 352,232 | 2,030,791 | 591 | |||||||||||||||||||
| As at September 30, 2018 | Carrying amount | Contractual cash flows | Less than one year | Between one and two years | Between two and five | Beyond five years | ||||||||||||||||||
| $ | $ | $ | $ | $ | $ | |||||||||||||||||||
Non-derivative financial liabilities | ||||||||||||||||||||||||
Accounts payable and accrued liabilities | 1,134,802 | 1,134,802 | 1,134,802 | — | — | — | ||||||||||||||||||
Accrued compensation | 602,245 | 602,245 | 602,245 | — | — | — | ||||||||||||||||||
Senior U.S. and euro unsecured notes | 1,517,334 | 1,753,402 | 354,575 | 113,955 | 814,337 | 470,535 | ||||||||||||||||||
Unsecured committed revolving credit facility | 194,795 | 222,331 | 6,573 | 6,591 | 209,167 | — | ||||||||||||||||||
Obligations other than finance leases | 30,124 | 30,794 | 19,319 | 9,393 | 2,082 | — | ||||||||||||||||||
Obligations under finance leases | 29,909 | 30,976 | 12,909 | 10,005 | 8,062 | — | ||||||||||||||||||
Other long-term debt | 28,731 | 29,155 | 20,302 | 1,613 | 5,826 | 1,414 | ||||||||||||||||||
Clients’ funds obligations | 328,324 | 328,324 | 328,324 | — | — | — | ||||||||||||||||||
Derivative financial liabilities | ||||||||||||||||||||||||
Cash flow hedges of future revenue | 44,141 | |||||||||||||||||||||||
Outflow | 889,665 | 359,381 | 302,294 | 227,990 | — | |||||||||||||||||||
(Inflow) | (902,035 | ) | (350,963 | ) | (307,598 | ) | (243,473 | ) | — | |||||||||||||||
Cross-currency swaps | 60,705 | |||||||||||||||||||||||
Outflow | 1,366,739 | 353,186 | 162,933 | 607,662 | 242,958 | |||||||||||||||||||
(Inflow) | (1,355,968 | ) | (338,419 | ) | (167,099 | ) | (609,398 | ) | (241,052 | ) | ||||||||||||||
Interest rate swaps | 12,326 | 4,845 | 1,384 | 1,384 | 2,077 | — | ||||||||||||||||||
| 3,983,436 | 4,135,275 | 2,503,618 | 133,471 | 1,024,332 | 473,855 | |||||||||||||||||||
132
|
| FISCAL 2019 RESULTS | |
Notes to the Consolidated Financial Statements
For the years ended September 30, 2019 and 2018
(tabular amounts only are in thousands of Canadian dollars, except per share data)
| 30. | Financial instruments (continued) |
LIQUIDITY RISK (CONTINUED)
As at September 30, 2019, the Company held cash and cash equivalents, funds held for clients, short-term investments and long-term investments of $616,428,000 ($539,697,000 as at September 30, 2018). The Company also had available $1,155,369,000 in unsecured committed revolving credit facility ($1,295,595,000 as at September 30, 2018). As at September 30, 2019, trade accounts receivable amounted to $979,728,000 (Note 4) ($1,126,772,000 as at September 30, 2018). Given the Company’s available liquid resources as compared to the timing of the payments of liabilities, management assesses the Company’s liquidity risk to be low.
CREDIT RISK
The Company takes on exposure to credit risk, which is the risk that a counterparty will be unable to pay amounts in full when due. Financial instruments that potentially subject the Company to concentrations of credit risk consist of cash and cash equivalents, accounts receivable, work in progress, long-term investments and derivative financial instruments with a positive fair value. The maximum exposure of credit risk is generally represented by the carrying amount of these items reported on the consolidated balance sheets.
The Company is exposed to credit risk in connection with long-term investments through the possible inability of borrowers to meet the terms of their obligations. The Company mitigates this risk by investing primarily in high credit quality corporate and government bonds with a credit rating of A or higher. The application of the low credit exemption had no material impact on the Company’s consolidated financial statements.
The Company has accounts receivable derived from clients engaged in various industries including government; manufacturing, retail & distribution; financial services; communications & utilities; and health that are not concentrated in any specific geographic area. These specific industries may be affected by economic factors that may impact trade accounts receivable. However, management does not believe that the Company is subject to any significant credit risk in view of the Company’s large and diversified client base and that any single industry or geographic region represents a significant credit risk to the Company. Historically, the Company has not made any significant write-offs and had low bad debt ratios. The application of the simplified approach to measure expected credit losses for trade accounts receivable and long-term receivables as well as for work in progress had no material impact on the Company’s consolidated financial statements.
The following table sets forth details of the age of trade accounts receivable that are past due:
| 2019 | 2018 | |||||||
| $ | $ | |||||||
Not past due | 793,387 | 951,277 | ||||||
Past due 1-30 days | 96,106 | 109,668 | ||||||
Past due 31-60 days | 23,125 | 27,806 | ||||||
Past due 61-90 days | 17,392 | 17,005 | ||||||
Past due more than 90 days | 54,192 | 25,768 | ||||||
| 984,202 | 1,131,524 | |||||||
Allowance for doubtful accounts | (4,474 | ) | (4,752 | ) | ||||
| 979,728 | 1,126,772 | |||||||
In addition, the exposure to credit risk of cash and cash equivalents and derivatives financial instruments is limited given that the Company deals mainly with a diverse group of high-grade financial institutions and that derivatives agreements are generally subject to master netting agreements, such as the International Swaps and Derivatives Association, which provide for net settlement of all outstanding contracts with the counterparty in case of an event of default.
133
|
CONSOLIDATED FINANCIAL STATEMENTS
Notes to the Consolidated Financial Statements
For the years ended September 30, 2019 and 2018
(tabular amounts only are in thousands of Canadian dollars, except per share data)
| 31. | Capital risk management |
The Company is exposed to risks of varying degrees of significance which could affect its ability to achieve its strategic objectives for growth. The main objectives of the Company’s risk management process are to ensure that risks are properly identified and that the capital base is adequate in relation to these risks.
The Company manages its capital to ensure that there are adequate capital resources while maximizing the return to shareholders through the optimization of the debt and equity balance. As at September 30, 2019, total managed capital1 was $9,463,626,000 ($8,699,845,000 as at September 30, 2018). Managed capital consists of long-term debt, including the current portion (Note 13), cash and cash equivalents, short-term investments, long-term investments (Note 10) and shareholders’ equity. The basis for the Company’s capital structure is dependent on the Company’s expected business growth and changes in the business environment. When capital needs have been specified, the Company’s management proposes capital transactions for the approval of the Company’s Audit and Risk Management Committee and Board of Directors. The capital risk policy remains unchanged from prior periods.
The Company monitors its capital by reviewing various financial metrics, including the following:
| - | Net Debt1/Capitalization1 |
| - | Debt/EBITDA1 |
Net debt, capitalization and EBITDA are additional measures. Net debt represents debt (including the current portion and the fair value of foreign currency derivative financial instruments related to debt) less cash and cash equivalents, short-term investments and long-term investments. Capitalization is shareholders’ equity plus debt. EBITDA is calculated as earnings from continuing operations before finance costs, income taxes, depreciation, amortization, restructuring costs and acquisition-related and integration costs. The Company believes that the results of the current internal ratios are consistent with its capital management credit facility and unsecured committed revolving credit facility. The ratios are as follows:
| - | Leverage ratios1, which are the ratio of total debt to EBITDA for its Senior U.S. and euro unsecured notes and the ratio of total debt net of cash and cash equivalent investments to EBITDA for its unsecured committed revolving credit facility and unsecured committed term loan credit facility for the four most recent quarters2. |
| - | An interest and rent coverage ratio1, which is the ratio of the EBITDAR1for the four most recent quarters to the total finance costs and the operating rentals in the same periods. EBITDAR is calculated as EBITDA before rent expense2. |
| - | In the case of the Senior U.S. and euro unsecured notes, a minimum net worth is required, whereby shareholders’ equity, excluding foreign exchange translation adjustments included in accumulated other comprehensive income, cannot be less than a specified threshold. |
These ratios are calculated on a consolidated basis.
The Company is in compliance with these covenants and monitors them on an ongoing basis. The ratios are also reviewed quarterly by the Company’s Audit and Risk Management Committee. The Company is not subject to any other externally imposed capital requirements.
| 1 | Non-GAAP measure. |
| 2 | In the event of an acquisition, the available historical financial information of the acquired company will be used in the computation of the ratios. |
134
|
Shareholder Information
Shareholder information listing
IPO: 1986
Toronto Stock Exchange, April 1992: GIB.A
New York Stock Exchange, October 1998: GIB
Number of shares outstanding as of September 30, 2019:
239,857,462 Class A subordinate voting shares
28,945,706 Class B shares
High/low of share price from October 1, 2018
to September 30, 2019:
| TSX (CDN$) | NYSE (U.S.$) | |||||||
High: | 106.63 | 80.59 | ||||||
Low: | 75.54 | 57.35 | ||||||
The certifications required by National Instrument 52-109Certification of Disclosure in Issuers’ Annual and Interim Filings whereby CGI’s Chief Executive Officer and Chief Financial Officer certify the accuracy of the information contained in CGI’s Annual Information Form, Annual Audited Consolidated Financial Statements, and Annual Management’s Discussion and Analysis are available on the Canadian Securities Administrators’ website at www.sedar.com. Similar certifications required by Rule 13a-14(a) of theSecurities Exchange Act of 1934 and Section 302 of theSarbanes-Oxley Act of 2002 are attached as exhibits to our Form 40-F, which is available on EDGAR at www.sec.gov. The certification required by Section 303A.12(c) of theNYSE Listed Company Manual is also filed annually with the New York Stock Exchange. CGI’s corporate governance practices conform to those followed by U.S. domestic companies under New York Stock Exchange listing standards. A summary of these practices is provided in the report of the Corporate Governance Committee contained in CGI’s Management Proxy Circular, which is available on the Canadian Securities Administrators’ website at www.sedar.com, on EDGAR at www.edgar.com and on CGI’s website at www.cgi.com.
Auditors
PricewaterhouseCoopers LLP
Transfer agent
Computershare Trust Company of Canada
100 University Avenue, 8th floor
Toronto, Ontario M5J 2Y1
Telephone: 1 800 564-6253
www.investorcentre.com/service
Investor relations
For further information about the Company, additional copies of this report, or other financial information, please contact:
CGI Inc.
Investor Relations
Email: ir@cgi.com
Web: cgi.com/investors
1350 René-Lévesque Blvd West,
15th floor
Montréal, Quebec H3G 1T4
Canada
Tel.: 514-841-3200
Annual general meeting of shareholders
Wednesday, January 29, 2020 at 11:00 a.m.
Le Centre Sheraton Montréal
1201 René-Lévesque Blvd. West
Montréal, Québec H3B 2L7
Canada
A live webcast of the Annual General Meeting of Shareholders will be available via cgi.com/investors. Complete instructions for viewing the webcast will be available on CGI’s website. To vote by phone or by using the internet, please refer to the instructions provided in CGI’s 2019 Management Proxy Circular.
135
|
ABOUT CGI
Founded in 1976, CGI is among the largest IT and business consulting services firms in the world. Operating in hundreds of locations across the globe, CGI delivers end-to-end services and solutions, including strategic IT and business consulting, systems integration, intellectual property, and managed IT and business process services.
CGI works with clients through a local relationship model complemented by a global delivery network to help clients achieve their goals, including becoming customer-centric digital enterprises.
cgi.com
Experience the commitment