 Blackstone Mortgage Trust, Inc. July 29, 2014 Second Quarter 2014 Results Exhibit 99.2 |
 1 Blackstone Mortgage Trust Second Quarter 2014 Highlights Core Earnings of $0.43 per share for the quarter driven by a 27% increase in net interest income of the Loan Origination portfolio over the first quarter. GAAP net income of $0.70 per share driven by $13 million of net income related to the realization of BXMT’s first promote distribution from its legacy private equity fund, CTOPI. BXMT closed 11 floating-rate senior mortgage loans during the quarter representing total commitments of $1.1 billion, including $387 million of loans in the U.K., and its first loan in Continental Europe. Second quarter net loan fundings of $828 million, bringing the total Loan Origination portfolio to $3.5 billion with a weighted average LTV of 63%. Addition of $1.1 billion of financing capacity during the quarter, bringing total capacity to $3.8 billion, with $2.2 billion outstanding. Book value per share increased by $0.88 to $25.51, resulting from retained earnings generated by the CT Legacy portfolio and an accretive April common stock issuance. Second quarter dividend of $0.48 per share paid on July 15, 2014. Information included in this presentation is as of or for the period ended June 30, 2014, unless otherwise indicated. See Appendix for a definition of Core Earnings and a reconciliation to GAAP net income, as well as certain per share calculations that are referenced throughout this presentation. |
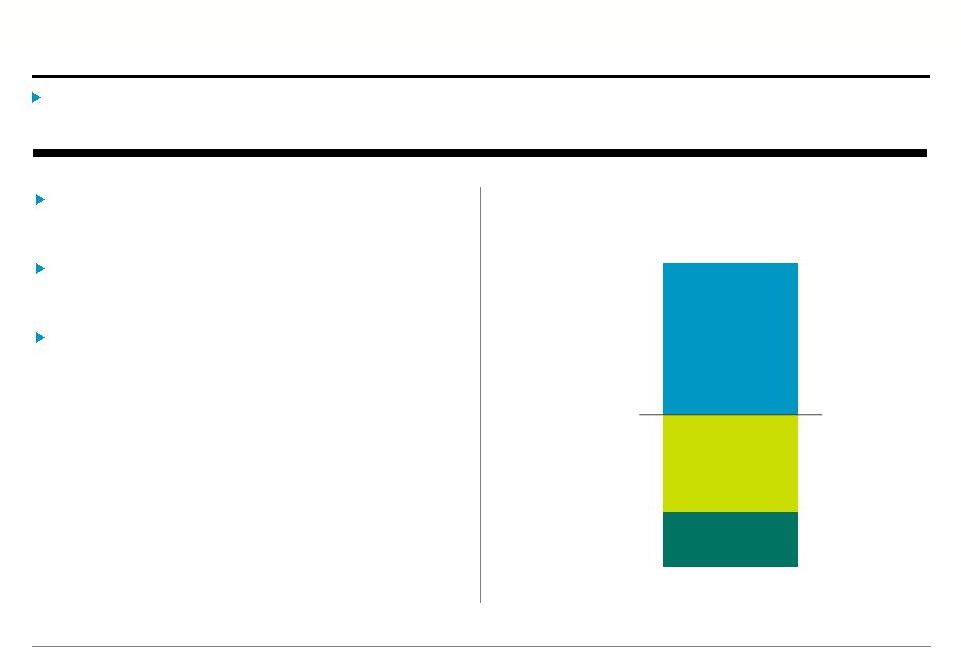
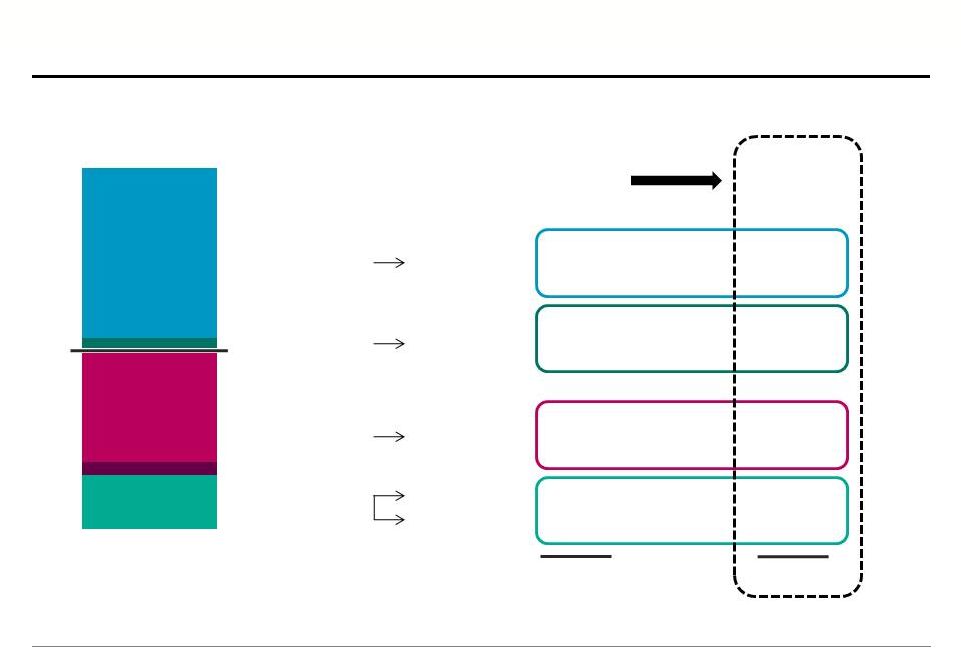 Blackstone Mortgage Trust 2 Second Quarter 2014 Balance Sheet, Results, and Core Earnings ($ in Millions) CT Legacy portfolio $15.5 Secured debt obligations ($15.5) Equity and other (a) ($2.4) ($5.5) Loan Origination portfolio $41.4 $33.5 ($15.5) $0.2 (b) $2.4 $- $- Interest income Interest expense Non-cash comp. G&A expenses Net results $41.4 $- ($15.3) $- ($5.5) Core Earnings Net Income $20.5 + + + + Convertible notes, net Balance Sheet $3,488 $36 $2,241 $161 $1,122 Includes stockholders’ equity of $1.2 billion, less the net of (i) cash and cash equivalents of $120.5 million, (ii) accrued interest receivable, prepaid expenses, and other assets of $29.8 million, and (iii) accounts payable, accrued expenses, and other liabilities of $34.0 million. Adjustment represents non-cash amortization of the deemed issue discount on convertible notes resulting from the conversion option value accounting under GAAP. (a) (b) |
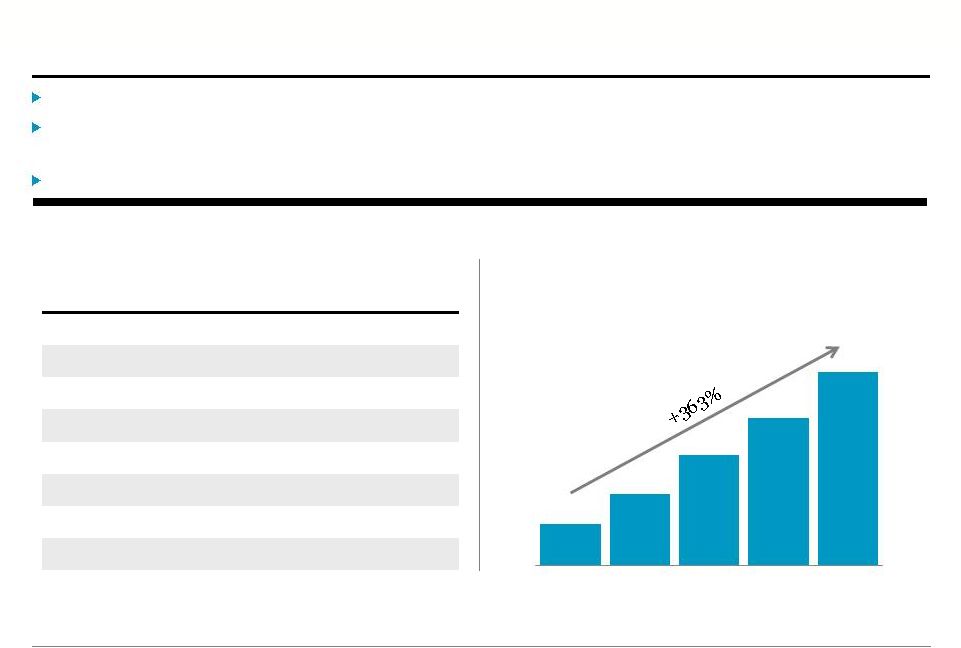 Blackstone Mortgage Trust 3 Loan Origination Portfolio During the quarter, BXMT closed 11 new loans with total commitments of $1.1 billion. BXMT funded $1.0 billion of loan commitments, and received $173.0 million of full or partial repayments from five loans. BXMT’s portfolio includes $546.4 million of U.K./EU loans, 16% of the total. Loan Origination Portfolio Statistics ($ in Millions) Loan Origination Portfolio (Net Book Value, $ in Millions) Number of loans 48 Principal balance 3,514 $ Net book value 3,488 $ Wtd. avg. LTV 63% Wtd. avg. cash coupon (a) L + 4.46% Wtd. avg. all-in yield (a) L + 5.02% Wtd. avg. gross return on investment (a)(b) L + 12.7% Wtd. avg. maximum maturity (c) 4.1 yrs. $753 $1,286 $2,000 $2,663 $3,488 2Q'13 3Q'13 4Q'13 1Q'14 2Q'14 (a) Includes 83% of loans indexed to one-month LIBOR and 17% indexed to three-month LIBOR; and 18% of loans that earn interest based on LIBOR floors. (b) Weighted average gross return on investment is based on each asset’s all-in yield, assuming current pay rates with no dispositions, early payments, or defaults, and all-in cost of secured debt, assuming full leverage at the asset level based on the maximum available leverage in place or in negotiation with respect to each investment, notwithstanding the amount actually borrowed in a given period. Gross return on investment excludes costs related to BXMT’s convertible notes, management fees, and corporate-level expenses. (c) Maximum maturity assumes all extension options are exercised, however BXMT’s loans may be repaid prior to such date. |
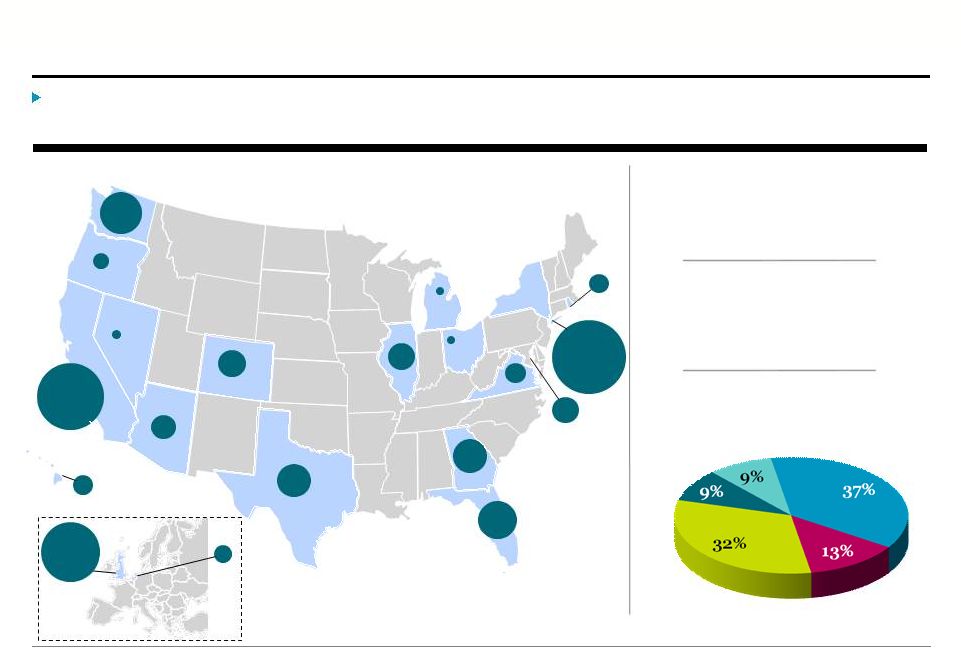 Blackstone Mortgage Trust 4 Portfolio Diversification BXMT’s $3.5 billion floating-rate portfolio is diversified by collateral property type and geographic location, and is comprised of senior mortgages and similar credit quality loans. $316,934,052 $416,559,099 Collateral Diversification (Net Book Value, % of Total) Floating-rate Loans (Net Book Value, % of Total) 100.0% Office Multifamily Hotel Condo Senior Loans (Net Book Value, % of Total) 94.2% Geographic Diversification (Net Book Value, $ in Millions) AZ CA 18.9% CO FL 5.0% GA 3.9% IL MI 0.2% NV 0.3% NY 31.6% OH 0.2% OR 0.9% 2.0% 2.6% TX 3.8% VA 1.4% 2.5% HI 1.4% DC 2.3% RI 1.3% 1.1% Other UK 14.6% NL WA 6.0% |
 Blackstone Mortgage Trust 5 Credit Facilities and Liquidity During the quarter, BXMT closed a $500.0 million revolving credit facility, bringing total credit facility capacity to $2.9 billion, including $686.5 million of GBP and EUR multi-currency facilities. Total liquidity of $352.4 million (a) , providing for $1.3 billion (a) of potential loan originations and fundings. $232.0 million Available Borrowings L + 2.19% Wtd. Avg. All-in Cost of Credit Facilities $2.9 billion Total Credit Facility Capacity Maximum Collateral Asset Debt Obligations (b) ($ in Thousands) Facility Size Principal Balance Potential Outstanding Available Lender 1 500,000 $ 517,280 $ 406,653 $ 387,653 $ 19,000 $ Lender 2 500,000 611,459 461,556 351,245 110,311 Lender 3 (c) 510,697 467,722 354,776 293,600 61,176 Lender 4 500,000 301,083 231,600 190,125 41,475 Lender 5 (c) 425,875 169,804 135,765 135,765 - Lender 6 500,000 214,524 165,369 165,369 - Total 2,936,572 $ 2,281,872 $ 1,755,719 $ 1,523,757 $ 231,962 $ (a) Total liquidity includes $120.5 million of cash and $232.0 million of available borrowings. Potential loan originations assumes 3.5x asset-level leverage on total liquidity, net of $63.3 million of minimum liquidity requirements under applicable debt covenants. (b) Potential borrowings represent the total amount that could be drawn under each facility based on collateral already approved and pledged. When undrawn, these amounts do not incur interest, but are immediately available to BXMT at its sole discretion under the terms of each revolving credit facility. (c) The maximum facility size for Lender 3 is composed of a $250.0 million facility and a £153.0 million ($260.7 million) facility. The maximum facility size for Lender 5 represents a £250.0 million ($425.9 million) facility that may be drawn in GBP or EUR. |
 Blackstone Mortgage Trust 6 Asset-Specific Financings (a) $912.9 Total Asset-Specific Financing Capacity ($ in Millions) $342.5 • Non-cross collateralized, with limited recourse and margin call provisions • Three agreements with $255.9 million outstanding and $86.6 million of future funding commitments • $324.4 million of collateral assets Asset-Specific Repurchase Agreements $461.1 • Senior loan participations sold by BXMT • Three participation sales totaling $461.1 million • $632.5 million of whole loans financed Participations Sold $109.3 • Transaction structures resulting in off-balance sheet senior interests • A $109.3 million senior interest sold in a $142.9 million property financing • $33.6 million mezzanine loan remains in BXMT’s portfolio Off-Balance Sheet Senior Interests (a) BXMT’s balance sheet includes asset-specific financings of $255.9 million classified as repurchase agreements and $461.1 million classified as participations sold. See pages 11-12, Consolidated and Segment Balance Sheets. During the quarter, BXMT closed three asset-specific financings totaling $565.5 million of financing capacity, bringing total asset-specific capacity to $912.9 million and total financing capacity to $3.8 billion including credit facilities. |
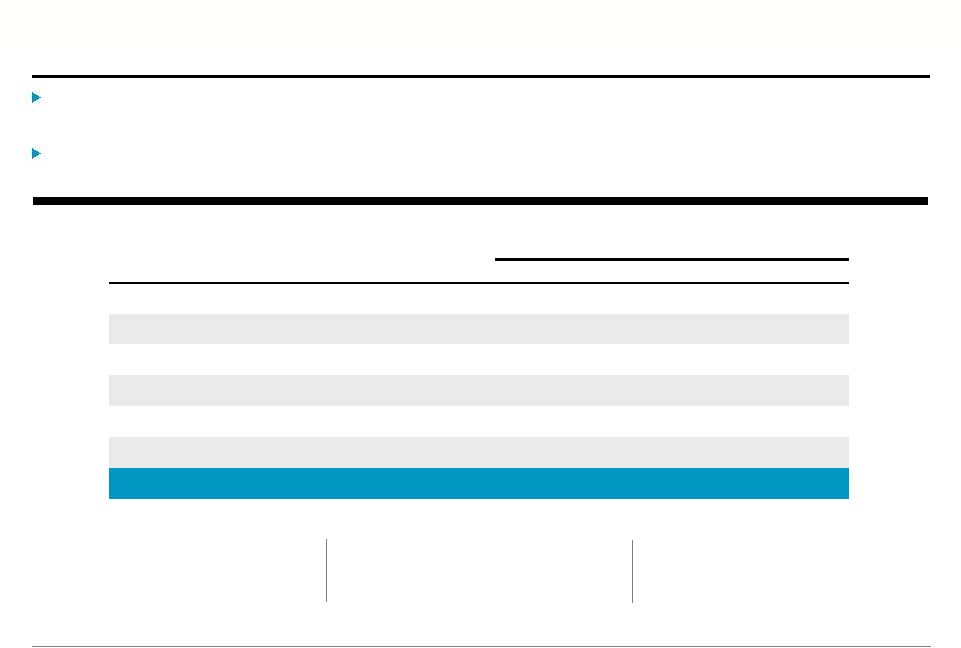
 7 $3.5 billion of floating-rate loans, indexed to LIBOR. $2.2 billion of floating-rate liabilities, also indexed to LIBOR. Return on net investment of $1.3 billion increases with increasing LIBOR. All else equal, a 100bp increase in LIBOR would increase net interest income by $11.8 million (b) per year, or $0.24 per share. Floating-Rate Business Model Because of BXMT’s LIBOR-based lending and funding business model, its returns increase with rising short-term interest rates. Loan Capitalization (a) (Principal Balance, $ in Millions) Floating-rate loans Floating-rate borrowings Floating-rate Net investment • Blackstone Mortgage Trust (a) Includes only the Loan Origination portfolio with an aggregate principal balance of $3.5 billion, capitalized with $2.2 billion of secured borrowings, and with a $1.3 billion net investment. Excludes the assets, liabilities, and equity of the CT Legacy portfolio. (b) Includes the impact of LIBOR floors for loan receivable investments. $1,273 $2,241 $3,514 |
 CT Legacy Portfolio BXMT received its first CTOPI promote distribution resulting in $13.1 million of net income, after amounts paid under legacy compensation plans. Additionally, CTOPI’s net unrealized promote allocable to BXMT increased by $2.3 million, representing incremental future value. CT Legacy Partners reported a $7.2 million gain on investments carried at fair value, reflecting improved recovery expectations of legacy assets. In July, CT Legacy Partners received a $19.6 million loan repayment, which resulted in a net distribution of $6.9 million to BXMT. 2Q’14 Book Value ($ per share) CTOPI Net Promote (a) ($ in Millions) CT Legacy Portfolio Component Book Value ($ per share) Total $0.75 CT CDO I and other $0.21 CT Legacy Partners $0.54 CTOPI $ - $0.75 $24.76 Loan Origination CT Legacy Total Book Value $25.51 $14.9 $18.0 $18.5 7.7 $13.1 3Q'13 4Q'13 1Q'14 2Q'14 Unrealized Realized Blackstone Mortgage Trust 8 $ (a) Represents the cumulative net realized and unrealized promote allocable to BXMT, after amounts payable under legacy compensation plans. |
 Appendix |
 Blackstone Mortgage Trust 10 Loan Origination Segment Portfolio Details The following table provides details of BXMT’s Loan Origination Segment portfolio: (a) Includes 83% of loans indexed to one-month LIBOR and 17% indexed to three-month LIBOR; and 18% of loans that earn interest based on LIBOR floors. (b) Maximum maturity date assumes all extension options are exercised, however BXMT’s loans may be repaid prior to such date. (c) Includes (i) 32 senior mortgage loans with an aggregate principal balance of $1.6 billion, and (ii) one mezzanine loan with a principal balance of $33.6 million where BXMT originated the entire loan and sold a senior interest to finance its overall investment. ($ in Millions) Origination Date Loan Type Principal Balance Book Value Cash Coupon (a) All-In Yield (a) Maximum Maturity (b) Geographic Location Property Type Origination LTV Loan 1 5/22/14 Senior loan 338.0 $ 335.7 $ L + 4.00% L + 4.34% 5/22/19 UK Hotel 57% Loan 2 11/21/13 Senior loan 181.0 179.5 L + 4.50% L + 4.86% 11/9/18 NY Multifamily 68% Loan 3 10/23/13 Sub. mortgage part. 173.8 169.0 L + 5.66% L + 9.25% 4/9/15 WA Office 67% Loan 4 12/17/13 Senior loan 140.0 139.0 L + 4.75% L + 5.27% 1/9/19 NY Office 70% Loan 5 1/30/14 Senior loan 125.0 124.4 L + 4.30% L + 4.63% 12/1/17 NY Hotel 38% Loan 6 6/20/14 Senior loan 114.6 113.2 L + 5.75% L + 6.39% 6/20/16 CA Hotel 43% Loan 7 6/7/13 Senior loan 105.9 105.6 L + 3.80% L + 3.97% 6/15/18 CA Office 43% Loan 8 2/25/14 Senior loan 101.0 99.6 L + 4.40% L + 4.81% 3/9/19 Diversified Hotel 49% Loan 9 2/20/14 Senior loan 95.7 95.2 L + 4.40% L + 4.58% 3/9/19 NY Office 69% Loan 10 10/30/13 Senior loan 95.2 94.7 L + 4.38% L + 4.61% 11/9/18 CA Hotel 72% Loan 11 1/7/14 Senior loan 91.0 89.6 L + 4.75% L + 5.43% 1/7/19 Diversified Other 65% Loan 12 9/30/13 Senior loan 89.5 89.4 L + 3.70% L + 3.83% 9/30/20 NY Multifamily 62% Loan 13 6/26/14 Senior loan 87.0 86.1 L + 4.30% L + 4.83% 7/15/19 NY Multifamily 79% Loan 14 8/8/13 Senior loan 85.5 85.1 L + 4.25% L + 4.62% 8/10/18 Diversified Diversified 59% Loan 15 3/4/14 Senior loan 83.3 83.8 L + 4.00% L + 4.63% 3/4/18 UK Office 50% Loans 16-48 Various Various (c) 1,607.5 1,598.3 L + 4.45% L + 4.87% Various Various Various 68% Total/Wtd. avg. 3,514.0 $ 3,488.2 $ L + 4.46% L + 5.02% 4.1 years 63% |
 Blackstone Mortgage Trust 11 Consolidated Balance Sheet ($ in Thousands, Except per Share Data) June 30, 2014 December 31, 2013 Assets Cash and cash equivalents 120,456 $ 52,342 $ Restricted cash 11,392 10,096 Loans receivable, net 3,488,179 2,047,223 Equity investments in unconsolidated subsidiaries 14,038 22,480 Accrued interest receivable, prepaid expenses, and other assets 120,704 80,639 Total assets 3,754,769 $ 2,212,780 $ Liabilities and equity Accounts payable, accrued expenses, and other liabilities 71,345 $ 97,153 $ Repurchase obligations 1,779,650 1,109,353 Convertible notes, net 160,671 159,524 Participations sold 461,078 90,000 Total liabilities 2,472,744 1,456,030 Equity Class A common stock, $0.01 par value 479 $ 288 $ Restricted class A common stock, $0.01 par value 5 7 Additional paid-in capital 1,767,954 1,252,986 Accumulated other comprehensive income 2,728 798 Accumulated deficit (531,858) (536,170) Total Blackstone Mortgage Trust, Inc. stockholders’ equity 1,239,308 717,909 Non-controlling interests 42,717 38,841 Total equity 1,282,025 756,750 Total liabilities and equity 3,754,769 $ 2,212,780 $ |
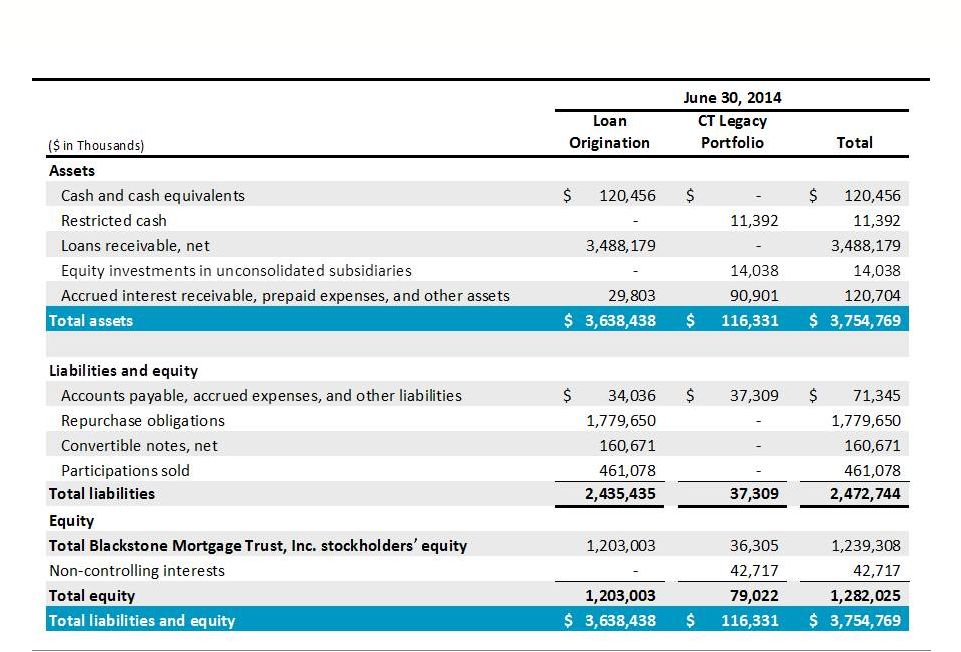 Consolidated Balance Sheet: Segment Allocation Blackstone Mortgage Trust 12 |
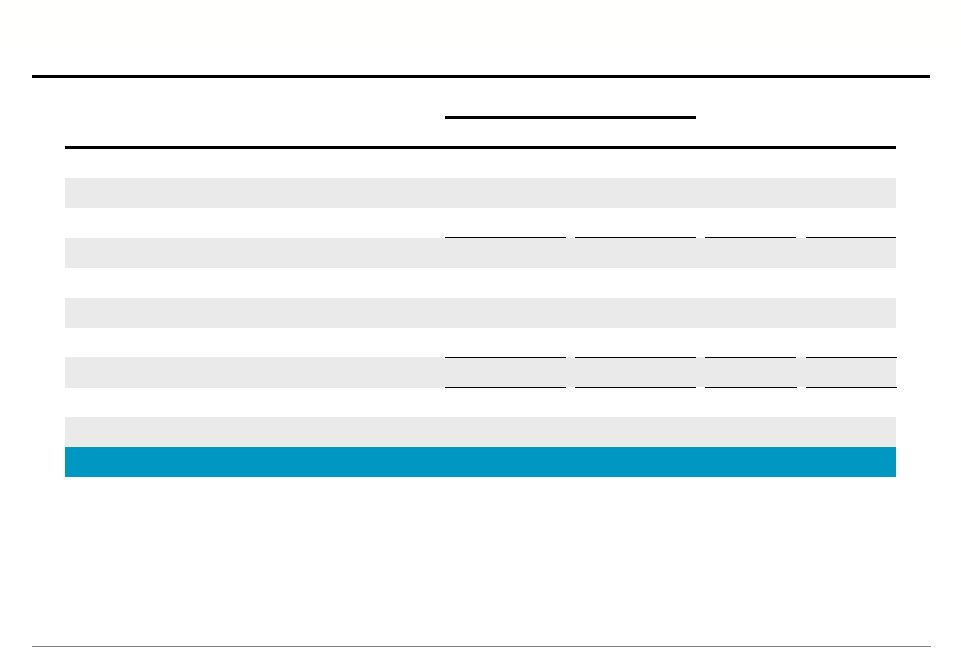
 Blackstone Mortgage Trust 13 Consolidated Statement of Operations Three Months Ended June 30, Six Months Ended June 30, ($ in Thousands, Except per Share Data) 2014 2013 2014 2013 Income from loans and other investments Interest and related income 42,466 $ 6,017 $ 76,122 $ 7,473 $ Less: Interest and related expenses 15,720 1,306 27,794 2,083 Income from loans and other investments, net 26,746 4,711 48,328 5,390 Other expenses Management fees 4,410 920 7,807 983 General and administrative 15,356 2,507 18,554 4,482 Total other expenses 19,766 3,427 26,361 5,465 Impairments, provisions, and valuation adjustments 7,163 6,000 5,824 5,800 Income from equity investments in unconsolidated subsidiaries 24,294 - 24,294 - Gain on extinguishment of debt - 38 - 38 Income before income taxes 38,437 7,322 52,085 5,763 Income tax (benefit) provision (2) 554 530 593 Net income 38,439 $ 6,768 $ 51,555 $ 5,170 $ Net income attributable to non-controlling interests (4,973) (4,020) (5,024) (5,537) Net income (loss) attributable to Blackstone Mortgage Trust, Inc. 33,466 $ 2,748 $ 46,531 $ (367) $ Per share information (basic and diluted) Weighted-average shares of common stock outstanding 47,977,813 12,401,274 43,000,242 7,734,774 Net income (loss) per share of common stock 0.70 $ 0.22 $ 1.08 $ (0.05) $ |
 Blackstone Mortgage Trust 14 Consolidated Statement of Operations: Segment Allocation Three Months Ended June 30, 2014 Six Months Ended June 30, 2014 ($ in Thousands) Loan Origination CT Legacy Portfolio Total Loan Origination CT Legacy Portfolio Total Income from loans and other investments Interest and related income 41,372 $ 1,094 $ 42,466 $ 73,408 $ 2,714 $ 76,122 $ Less: Interest and related expenses 15,503 217 15,720 27,130 664 27,794 Income from loans and other investments, net 25,869 877 26,746 46,278 2,050 48,328 Other expenses Management fees 4,410 - 4,410 7,807 - 7,807 General and administrative expenses 3,501 11,855 15,356 6,346 12,208 18,554 Total other expenses 7,911 11,855 19,766 14,153 12,208 26,361 Impairments, provisions, and valuation adjustments - 7,163 7,163 - 5,824 5,824 Income from equity investments in unconsolidated subsidiaries - 24,294 24,294 - 24,294 24,294 Income before income taxes 17,958 20,479 38,437 32,125 19,960 52,085 Income tax (benefit) provision - (2) (2) 131 399 530 Net income 17,958 $ 20,481 $ 38,439 $ 31,994 $ 19,561 $ 51,555 $ Net income attributable to non-controlling interests - (4,973) (4,973) - (5,024) (5,024) Net income attributable to Blackstone Mortgage Trust, Inc. 17,958 $ 15,508 $ 33,466 $ 31,994 $ 14,537 $ 46,531 $ |
 Blackstone Mortgage Trust 15 Consolidated Statement of Operations: Loan Origination Segment Three Months Ended ($ in Thousands) June 30, 2014 March 31, 2014 $ Change % Change Income from loans and other investments Interest and related income 41,372 $ 32,035 $ 9,337 $ 29.1% Less: Interest and related expenses 15,503 11,626 3,877 33.3% Income from loans and other investments, net 25,869 20,409 5,460 26.8% Other expenses Management fees 4,410 3,397 1,013 29.8% General and administrative expenses 3,501 2,846 655 23.0% Total other expenses 7,911 6,243 1,668 26.7% Income before income taxes 17,958 14,166 3,792 26.8% Income tax provision - 131 (131) N/M Net income 17,958 $ 14,035 $ 3,923 $ 28.0% |
 Blackstone Mortgage Trust 16 Per Share Calculations (in Thousands, Except per Share Data) Three Months Ended June 30, 2014 Three Months Ended March 31, 2014 Loan Origination CT Legacy Portfolio Total Loan Origination CT Legacy Portfolio Total Net income 17,958 $ 15,508 $ 33,466 $ 14,035 $ (970) $ 13,065 $ Weighted-average shares outstanding, basic and diluted 47,978 47,978 47,978 37,967 �� 37,967 37,967 Earnings per share, basic and diluted 0.38 $ 0.32 $ 0.70 $ 0.37 $ (0.03) $ 0.34 $ Three Months Ended June 30, 2014 March 31, 2014 Net income 33,466 $ 13,065 $ CT Legacy Portfolio segment net (income) loss (15,508) 970 Amortization of discount on convertible notes 397 391 Unrealized (gain) loss on foreign currency remeasurement (235) 32 Non-cash compensation expense 2,382 1,834 Core Earnings 20,502 $ 16,292 $ Weighted-average shares outstanding, basic and diluted 47,978 37,967 Core Earnings per share, basic and diluted 0.43 $ 0.43 $ June 30, 2014 March 31, 2014 Loan Origination CT Legacy Portfolio Total Loan Origination CT Legacy Portfolio Total Stockholders’ equity 1,203,003 $ 36,305 $ 1,239,308 $ 946,352 $ 23,731 $ 970,083 $ Shares Class A common stock 47,935 47,935 47,935 38,655 38,655 38,655 Restricted class A common stock 544 544 544 622 622 622 Stock units 108 108 108 106 106 106 48,587 48,587 48,587 39,383 39,383 39,383 Book value per share 24.76 $ 0.75 $ 25.51 $ 24.03 $ 0.60 $ 24.63 $ Core Earnings Reconciliation Book Value per Share: Segment Allocation Earnings per Share: Segment Allocation |
 Blackstone Mortgage Trust 17 Definitions Blackstone Mortgage Trust, Inc. (“BXMT”) discloses Core Earnings, a financial measure that is calculated and presented on the basis of methodologies other than in accordance with generally accepted accounting principles in the United States of America (“GAAP”) in this presentation. Core Earnings is an adjusted measure that helps BXMT evaluate its performance excluding the effects of certain transactions and GAAP adjustments that it believes are not necessarily indicative of its current loan origination portfolio and operations. BXMT also uses Core Earnings to calculate the incentive and base management fees due to its manager under its management agreement and, as such, BXMT believes that the disclosure of Core Earnings is useful to investors. Core Earnings is defined as GAAP net income (loss), including realized losses not otherwise included in GAAP net income (loss), and excluding (i) net income (loss) attributable to the CT Legacy Portfolio segment, (ii) non-cash equity compensation expense, (iii) incentive management fees, (iv) depreciation and amortization, and (v) unrealized gains (losses) or similar non-cash items. Core Earnings may also be adjusted from time to time to exclude one-time events pursuant to changes in GAAP and certain other non-cash charges as determined by BXMT’s manager, subject to approval by a majority of its independent directors. Core Earnings does not represent net income or cash generated from operating activities and should not be considered as an alternative to GAAP net income, or an indication of cash flow from GAAP operating activities, a measure of BXMT’s liquidity, or an indication of funds available for its cash needs. In addition, BXMT’s methodology for calculating Core Earnings may differ from the methodologies employed by other companies to calculate the same or similar supplemental performance measures, and accordingly, its reported Core Earnings may not be comparable to the Core Earnings reported by other companies. |
 Blackstone Mortgage Trust 18 Forward-Looking Statements This presentation may contain forward-looking statements within the meaning of Section 27A of the Securities Act of 1933, as amended, and Section 21E of the Securities Exchange Act of 1934, as amended, which reflect Blackstone Mortgage Trust’s current views with respect to, among other things, Blackstone Mortgage Trust’s operations and financial performance. You can identify these forward-looking statements by the use of words such as “outlook,” “indicator,” “believes,” “expects,” “potential,” “continues,” “may,” “will,” “should,” “seeks,” “approximately,” “predicts,” “intends,” “plans,” “estimates,” “anticipates” or the negative version of these words or other comparable words. Such forward-looking statements are subject to various risks and uncertainties. Accordingly, there are or will be important factors that could cause actual outcomes or results to differ materially from those indicated in these statements. Blackstone Mortgage Trust believes these factors include but are not limited to those described under the section entitled “Risk Factors” in its Annual Report on Form 10-K for the fiscal year ended December 31, 2013, as such factors may be updated from time to time in its periodic filings with the Securities and Exchange Commission which are accessible on the SEC’s website at www.sec.gov. These factors should not be construed as exhaustive and should be read in conjunction with the other cautionary statements that are included in this presentation and in the filings. Blackstone Mortgage Trust assumes no obligation to update or supplement forward-looking statements that become untrue because of subsequent events or circumstances. |