 Blackstone Mortgage Trust, Inc. October 28, 2014 Third Quarter 2014 Results Exhibit 99.2 |
 Blackstone Mortgage Trust 1 Third Quarter 2014 Highlights Core Earnings of $0.50 per share for the quarter; dividend of $0.50 per share, representing a 7.8% annualized yield on book value. Total Loan Origination portfolio of $3.9 billion with a weighted average loan-to-value of 64%, all of which are fully performing floating-rate loans. Closed 8 floating-rate senior mortgage loans during the quarter representing total commitments of $656 million, of which 14% was secured by collateral located in Europe. Subsequent to quarter-end, closed $145 million of loan originations with $865 million currently in the closing pipeline at an average loan size of $168 million, reflecting strong demand for large transitional loans. Issued 9.2 million shares of common stock in September generating net proceeds of $253 million and increasing book value by $0.23 per share. Subsequent to quarter-end, upsized a revolving credit facility by $500 million, bringing total financing capacity to $4.3 billion. Received a $7 million net distribution from CT Legacy Partners, which will be redeployed into the Loan Origination business. BXMT’s share of unrealized net CTOPI promote increased to $8 million. GAAP net income of $0.45 per share, almost entirely related to the Loan Origination portfolio, and consolidated book value of $25.57 per share. Information included in this presentation is as of or for the period ended September 30, 2014, unless otherwise indicated. See Appendix for a definition of Core Earnings and a reconciliation to GAAP net income, as well as certain per share calculations that are referenced throughout this presentation. |
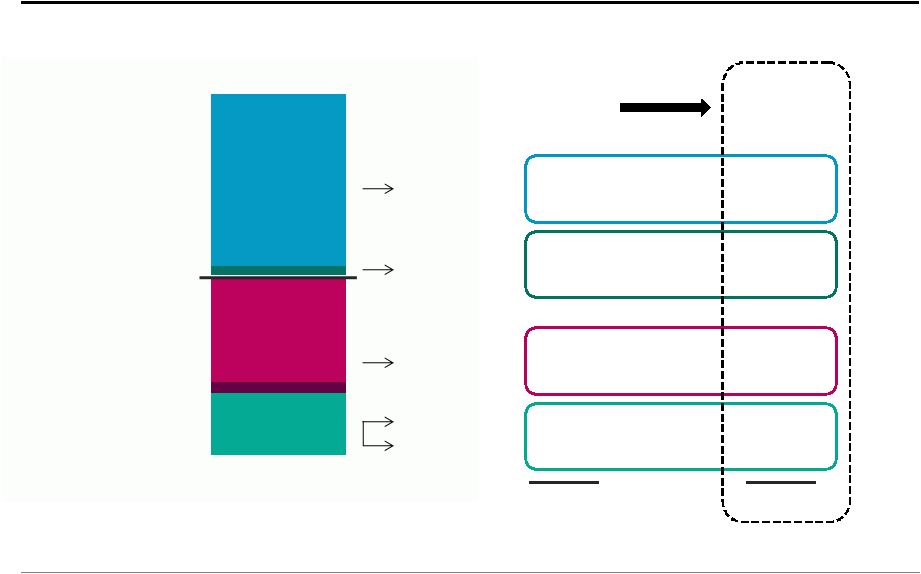 Blackstone Mortgage Trust 2 Third Quarter 2014 Balance Sheet, Results, and Core Earnings ($ in Millions) CT Legacy portfolio $0.1 Secured debt obligations ($19.7) Equity and other (b) ($1.6) ($6.5) Loan Origination portfolio $49.7 $22.0 ($0.1) $0.4 $1.6 $- $0.8 Interest income Interest expense Non-cash comp. G&A expenses Net results $49.7 $- ($19.3) $- ($5.7) Core Earnings (a) Net Income $24.8 + + + + Convertible notes, net Balance Sheet (a) See Appendix for a definition of Core Earnings and description of the related adjustments to GAAP net income. (b) Includes stockholders’ equity of $1.5 billion, less the net of (i) cash and cash equivalents of $63.3 million, (ii) accrued interest receivable, prepaid expenses, and other assets of $29.7 million, and (iii) accounts payable, accrued expenses, and other liabilities of $45.3 million. $1,430 $161 $29 $2,344 $3,906 |
 Blackstone Mortgage Trust 3 Loan Origination Portfolio During the quarter, BXMT closed 8 new loans with total commitments of $656 million, of which 14.2% was secured by collateral located in Europe. BXMT funded $557 million of loan commitments, outpacing $109 million of full or partial repayments from five loans. Portfolio gross ROI (a) remained stable at L + 12.9% as improved financing terms have generally balanced modestly lower portfolio asset yields. Loan Origination Portfolio Statistics ($ in Millions) (a) Gross return on investment is based on each asset’s all-in yield, assuming current rates with no dispositions, early payments, or defaults, and all-in cost of secured debt, assuming full leverage at the asset level based on the maximum available leverage in place or in negotiation for each investment, notwithstanding the amount actually borrowed. Gross return on investment excludes costs related to convertible notes, management fees, and corporate-level expenses. Prior period gross return on investment amounts have been presented based on calculations and assumptions consistent with the current period to allow for comparability. (b) Includes 83% of loans indexed to one-month USD LIBOR, 13% indexed to three-month GBP LIBOR, and 4% referencing other floating rate indices. (c) Maximum maturity assumes all extension options are exercised, however BXMT’s loans may be repaid prior to such date. Loan Origination Portfolio (Net Book Value and Gross Return on Investment (a) , $ in Millions) L+12.6% L+12.7% L+12.7% L+12.9% ROI: Number of loans 55 Principal balance $3,941 Net book value $3,906 Wtd. avg. loan-to-value 64% Wtd. avg. cash coupon (b) L + 4.42% Wtd. avg. all-in yield (b) L + 4.97% Wtd. avg. gross return on investment (a)(b) L + 12.9% Wtd. avg. maximum maturity (c) 3.9 yrs. $2,000 $2,663 $3,488 $3,906 4Q'13 1Q'14 2Q'14 3Q'14 |
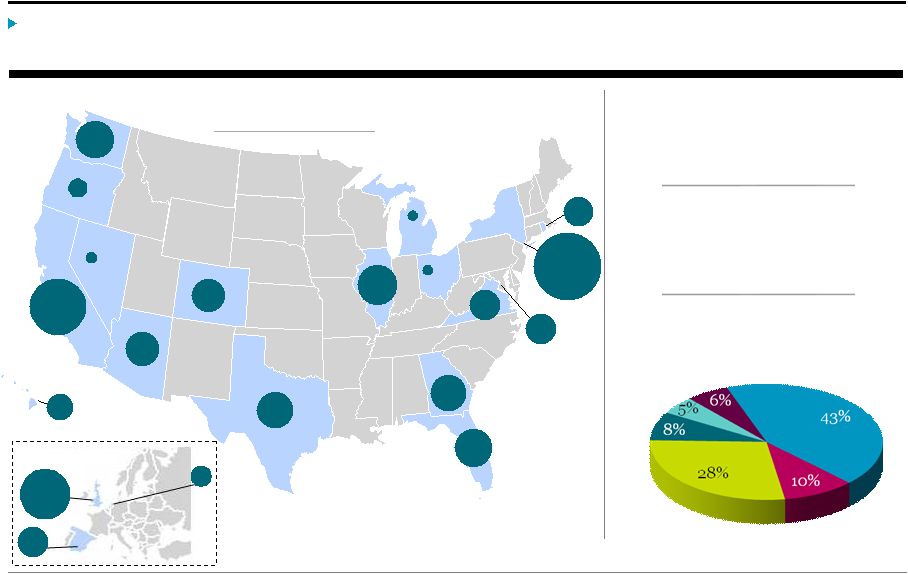 Blackstone Mortgage Trust 4 Portfolio Diversification BXMT’s $3.9 billion floating-rate portfolio is diversified by collateral property type and geographic location, and is comprised of senior mortgages and similar credit quality loans. $316,934,052 $416,559,099 Collateral Diversification (Net Book Value, % of Total) Floating-rate Loans (Net Book Value, % of Total) 100.0% Office Multifamily Hotel Condo Senior Loans (Net Book Value, % of Total) 94.8% Geographic Diversification (Net Book Value, $ in Millions) Other Retail NY 29.6% CA 15.8% IL 7.9% FL 5.7% WA 5.4% TX 4.7% GA 3.6% CO 2.4% DC 2.0% AZ 1.8% VA 1.5% HI 1.3% RI 1.1% OR 0.8% NV 0.3% MI 0.2% OH 0.2% UK 12.6% 0.9% NL ES 2.2% |
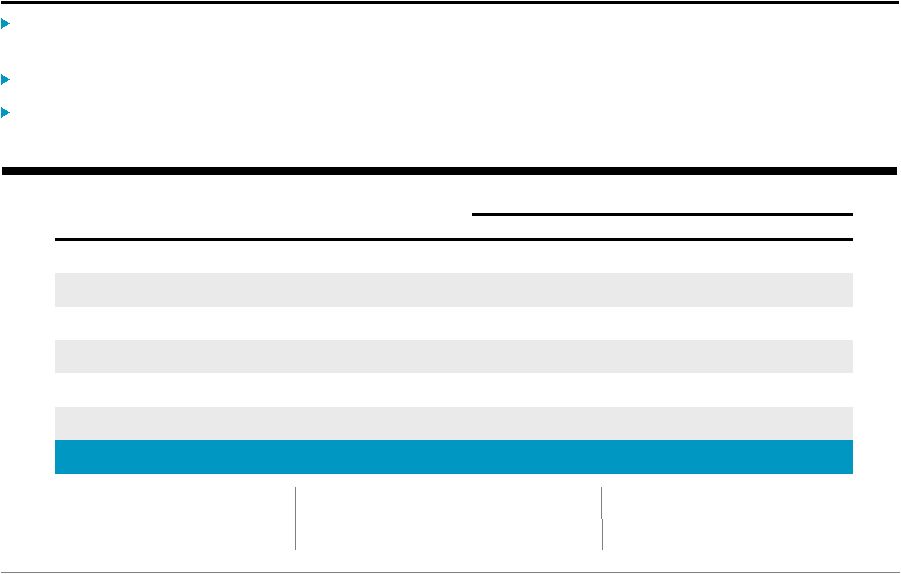 Blackstone Mortgage Trust 5 Credit Facilities and Liquidity Total credit facility capacity of $2.9 billion, including $655 million of GBP and EUR multi-currency facilities. Total liquidity of $497 million (a) , providing for $1.9 billion (a) of potential loan originations and fundings. Subsequent to quarter-end, upsized a revolving credit facility by $500 million, bringing credit facility capacity to $3.4 billion. $434 million Available Borrowings L + 2.14% Wtd. Avg. All-in Cost of Credit Facilities $2.9 billion Total Credit Facility Capacity Maximum Collateral Asset Debt Obligations (b) ($ in Thousands) Facility Size Principal Balance Potential Outstanding Available Lender 1 500,000 $ 574,395 $ 447,994 $ 360,725 $ 87,269 $ Lender 2 500,000 537,159 424,404 353,542 70,862 Lender 3 500,000 584,020 441,567 324,429 117,138 Lender 4 (c) 498,546 519,159 396,587 269,618 126,969 Lender 5 500,000 341,524 263,889 232,389 31,500 Lender 6 (c) 406,025 168,930 128,703 128,703 - Total 2,904,571 $ 2,725,187 $ 2,103,144 $ 1,669,406 $ 433,738 $ (a) Total liquidity includes $63 million of cash and $434 million of available borrowings. Potential loan originations assumes 3.5x asset- level leverage on total liquidity, net of $77 million of minimum liquidity requirements under applicable debt covenants. (b) Potential borrowings represent the total amount that could be drawn under each facility based on collateral already approved and pledged. When undrawn, these amounts do not incur interest, but are immediately available to BXMT at its sole discretion under the terms of each revolving credit facility. (c) The maximum facility size for Lender 4 is composed of a $250 million facility and a £153 million ($249 million) facility. The maximum facility size for Lender 6 represents a £250 million ($406 million) facility that may be drawn in GBP or EUR. |
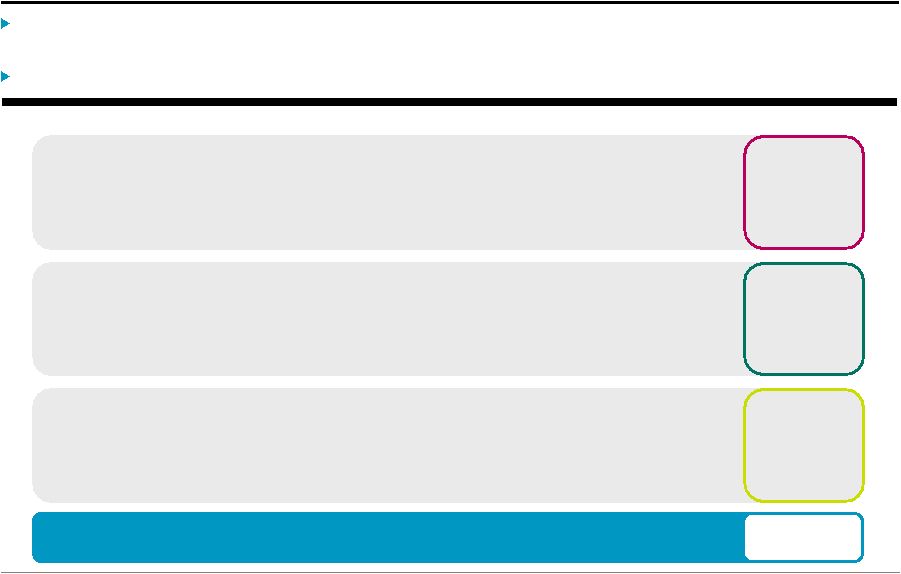 Blackstone Mortgage Trust 6 Asset-Specific Financings (a) Asset-specific financings provide an additional $847 million of capacity for total financing capacity of $3.8 billion including credit facilities, or $4.3 billion including facilities closed since quarter-end. Opportunistic use of asset-specific financings preserves capacity in revolving repurchase facilities. $847 Total Asset-Specific Financing Capacity ($ in Millions) $289 • Non-cross collateralized, with limited recourse and margin call provisions • Three agreements with $227 million outstanding and $62 million of future funding commitments • $289 million of collateral assets Asset-Specific Repurchase Agreements $448 • Senior loan participations sold by BXMT • Three participation sales totaling $448 million • $619 million of whole loans financed Loan Participations Sold $110 • Transaction structures resulting in realized sales of senior interests • One $110 million senior interest sold in a $144 million property financing • $34 million mezzanine loan remains in BXMT’s portfolio Non-Consolidated Senior Interests (a) BXMT’s balance sheet includes asset-specific financings of $227 million classified as asset-specific repurchase agreements and $448 million classified as loan participations sold. See pages 10-11, Consolidated and Segment Balance Sheets. |
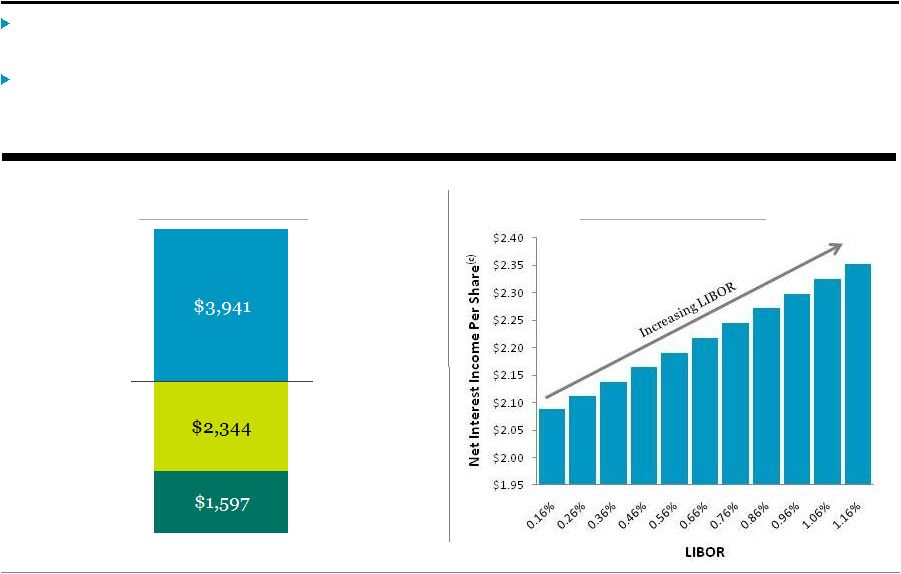 Blackstone Mortgage Trust 7 Floating-Rate Business Model BXMT’s LIBOR-based lending and funding business model generates increasing returns with rising short-term interest rates. Return on net investment of $1.6 billion increases with increasing LIBOR. • All else equal, a 100bp increase in LIBOR would increase net interest income by $15 million (a) per year, or $0.26 per share. Loan Capitalization (b) (Principal Balance, $ in Millions) Floating-rate loans Floating-rate borrowings Floating-rate Net investment (a) Includes the impact of LIBOR floors for loan receivable investments. (b) Includes only the Loan Origination portfolio with an aggregate principal balance of $3.9 billion, capitalized with $2.3 billion of secured borrowings, and with a $1.6 billion net investment. Excludes the assets, liabilities, and equity of the CT Legacy portfolio. (c) Based on annualized net interest income for the quarter-ended September 30, 2014, and shares outstanding as of September 30, 2014. Income Sensitivity to LIBOR ($ Net Interest Income per share (C) ) |
 Appendix * * * * * * * * * * |
 Blackstone Mortgage Trust 9 Loan Origination Segment Portfolio Details The following table provides details of BXMT’s Loan Origination Segment portfolio: (a) Includes 83% of loans indexed to one-month USD LIBOR, 13% indexed to three-month GBP LIBOR, and 4% referencing other floating rate indices; 17% of loans earn interest based on LIBOR floors. (b) Maximum maturity date assumes all extension options are exercised, however BXMT’s loans may be repaid prior to such date. (c) Includes (i) 39 senior loans with an aggregate principal balance of $1.9 billion, and (ii) one mezzanine loan with a principal balance of $34 million where BXMT originated the entire loan and sold a senior interest to finance its overall investment. Origination Date Loan Type Principal Balance Book Value Cash Coupon (a) All-In Yield (a) Maximum Maturity (b) Geographic Location Property Type Origination LTV Loan 1 5/22/14 Senior loan 324.8 $ 320.3 $ L + 4.00% L + 4.34% 5/22/19 UK Hotel 57% Loan 2 11/21/13 Senior loan 181.0 179.7 L + 4.50% L + 4.86% 11/9/18 NY Condo 68% Loan 3 10/23/13 Sub. Mortgage part. 173.8 170.5 L + 5.66% L + 9.25% 4/9/15 WA Office 67% Loan 4 7/31/14 Senior loan 146.4 145.1 L + 3.50% L + 4.01% 8/9/19 IL Office 70% Loan 5 12/17/13 Senior loan 140.0 139.1 L + 4.75% L + 5.27% 1/9/19 NY Office 70% Loan 6 1/30/14 Senior loan 125.0 124.5 L + 4.30% L + 4.63% 12/1/17 NY Hotel 38% Loan 7 6/20/14 Senior loan 117.5 116.3 L + 5.75% L + 6.39% 6/20/16 CA Hotel 44% Loan 8 1/7/14 Senior loan 110.9 109.6 L + 4.75% L + 5.30% 1/7/19 Diversified Other 66% Loan 9 2/25/14 Senior loan 101.0 99.7 L + 4.40% L + 4.81% 3/9/19 Diversified Hotel 49% Loan 10 2/20/14 Senior loan 97.0 96.6 L + 4.40% L + 4.58% 3/9/19 NY Office 69% Loan 11 10/30/13 Senior loan 96.6 96.1 L + 4.38% L + 4.61% 11/9/18 CA Hotel 72% Loan 12 9/30/13 Senior loan 89.5 89.4 L + 3.70% L + 3.83% 9/30/20 NY Multifamily 62% Loan 13 6/26/14 Senior loan 87.0 86.2 L + 4.30% L + 4.83% 7/15/19 NY Multifamily 77% Loan 14 3/17/14 Senior loan 86.2 86.0 L + 4.75% L + 4.93% 12/28/16 NY Condo 70% Loan 15 9/8/14 Senior loan 86.7 85.3 L + 4.00% L + 4.34% 11/20/19 ES Retail 70% Loans 16-55 Various Various (c) 1,977.2 1,961.8 L + 4.37% L + 4.81% Various Various Various 66% Total/Wtd. avg. 3,940.6 $ 3,906.2 $ L + 4.42% L + 4.97% 3.9 years 64% ($ in Millions) |
 Blackstone Mortgage Trust 10 Consolidated Balance Sheet ($ in Thousands, Except per Share Data) September 30, 2014 December 31, 2013 Assets Cash and cash equivalents 63,343 $ 52,342 $ Restricted cash 10,855 10,096 Loans receivable, net 3,906,226 2,047,223 Equity investments in unconsolidated subsidiaries 14,990 22,480 Accrued interest receivable, prepaid expenses, and other assets 103,059 80,639 Total assets 4,098,473 $ 2,212,780 $ Liabilities and equity Accounts payable, accrued expenses, and other liabilities 83,011 $ 97,153 $ Revolving repurchase facilities 1,669,406 863,622 Asset-specific repurchase agreements 226,961 245,731 Loan participations sold 447,977 90,000 Convertible notes, net 161,259 159,524 Total liabilities 2,588,614 1,456,030 Equity Class A common stock, $0.01 par value 572 $ 288 $ Restricted class A common stock, $0.01 par value 5 7 Additional paid-in capital 2,022,093 1,252,986 Accumulated other comprehensive income (6,205) 798 Accumulated deficit (538,726) (536,170) Total Blackstone Mortgage Trust, Inc. stockholders’ equity 1,477,739 717,909 Non-controlling interests 32,120 38,841 Total equity 1,509,859 756,750 Total liabilities and equity 4,098,473 $ 2,212,780 $ |
 Blackstone Mortgage Trust 11 Consolidated Balance Sheet: Segment Allocation September 30, 2014 ($ in Thousands) Loan Origination CT Legacy Portfolio Total Assets Cash and cash equivalents 63,343 $ - $ 63,343 $ Restricted cash - 10,855 10,855 Loans receivable, net 3,906,226 - 3,906,226 Equity investments in unconsolidated subsidiaries - 14,990 14,990 Accrued interest receivable, prepaid expenses, and other assets 29,727 73,332 103,059 Total assets 3,999,296 $ 99,177 $ 4,098,473 $ Liabilities and equity Accounts payable, accrued expenses, and other liabilities 45,309 $ 37,702 $ 83,011 $ Revolving repurchase facilities 1,669,406 - 1,669,406 Asset-specific repurchase agreements 226,961 - 226,961 Loan participations sold 447,977 - 447,977 Convertible notes, net 161,259 - 161,259 Total liabilities 2,550,912 37,702 2,588,614 Equity Total Blackstone Mortgage Trust, Inc. stockholders’ equity 1,448,384 29,355 1,477,739 Non-controlling interests - 32,120 32,120 Total equity 1,448,384 61,475 1,509,859 Total liabilities and equity 3,999,296 $ 99,177 $ 4,098,473 $ |
 Blackstone Mortgage Trust 12 Consolidated Statement of Operations Three Months Ended September 30, Nine Months Ended September 30, ($ in Thousands, Except per Share Data) 2014 2013 2014 2013 Income from loans and other investments Interest and related income 50,386 $ 18,853 $ 126,507 $ 26,327 $ Less: Interest and related expenses 19,903 4,407 47,697 6,492 Income from loans and other investments, net 30,483 14,446 78,810 19,835 Other expenses Management and incentive fees 5,412 2,433 13,219 3,416 General and administrative 3,368 1,615 21,920 6,096 Total other expenses 8,780 4,048 35,139 9,512 Impairments, provisions, and valuation adjustments 1,780 (136) 7,604 5,664 Income from equity investments in unconsolidated subsidiaries - - 24,294 - Gain on extinguishment of debt - - - 38 Income before income taxes 23,483 10,262 75,569 16,025 Income tax (benefit) provision (118) (264) 412 329 Net income 23,601 $ 10,526 $ 75,157 $ 15,696 $ Net income attributable to non-controlling interests (1,577) (2,206) (6,602) (7,743) Net income attributable to Blackstone Mortgage Trust, Inc. 22,024 $ 8,320 $ 68,555 $ 7,953 $ Per share information (basic and diluted) Weighted-average shares of common stock outstanding 49,211,205 28,894,515 45,093,314 14,865,530 Net income per share of common stock 0.45 $ 0.29 $ 1.52 $ 0.53 $ |
 Blackstone Mortgage Trust 13 Consolidated Statement of Operations: Segment Allocation Three Months Ended September 30, 2014 Nine Months Ended September 30, 2014 ($ in Thousands) Loan Origination CT Legacy Portfolio Total Loan Origination CT Legacy Portfolio Total Income from loans and other investments Interest and related income 49,720 $ 666 $ 50,386 $ 123,127 $ 3,380 $ 126,507 $ Less: Interest and related expenses 19,713 190 19,903 46,843 854 47,697 Income from loans and other investments, net 30,007 476 30,483 76,284 2,526 78,810 Other expenses Management and incentive fees 5,412 - 5,412 13,219 - 13,219 General and administrative expenses 2,705 663 3,368 9,049 12,871 21,920 Total other expenses 8,117 663 8,780 22,268 12,871 35,139 Impairments, provisions, and valuation adjustments - 1,780 1,780 - 7,604 7,604 Income from equity investments in unconsolidated subsidiaries - - - - 24,294 24,294 Income before income taxes 21,890 1,593 23,483 54,016 21,553 75,569 Income tax (benefit) provision - (118) (118) 131 281 412 Net income 21,890 $ 1,711 $ 23,601 $ 53,885 $ 21,272 $ 75,157 $ Net income attributable to non-controlling interests - (1,577) (1,577) - (6,602) (6,602) Net income attributable to Blackstone Mortgage Trust, Inc. 21,890 $ 134 $ 22,024 $ 53,885 $ 14,670 $ 68,555 $ |
 Blackstone Mortgage Trust 14 Consolidated Statement of Operations: Loan Origination Segment Three Months Ended ($ in Thousands) September 30, 2014 June 30, 2014 $ Change % Change Income from loans and other investments Interest and related income 49,720 $ 41,372 $ 8,348 $ 20.2% Less: Interest and related expenses 19,713 15,503 4,210 27.2% Income from loans and other investments, net 30,007 25,869 4,138 16.0% Other expenses Management and incentive fees 5,412 4,410 1,002 22.7% General and administrative expenses 2,705 3,501 (796) (22.7)% Total other expenses 8,117 7,911 206 2.6% Net income 21,890 $ 17,958 $ 3,932 $ 21.9% |
 Blackstone Mortgage Trust 15 Per Share Calculations (in Thousands, Except per Share Data) Core Earnings Reconciliation Book Value per Share: Segment Allocation Segment Allocation Three Months Ended September 30, 2014 Three Months Ended June 30, 2014 Loan Origination CT Legacy Portfolio Total Loan Origination CT Legacy Portfolio Total Net income 21,890 $ 134 $ 22,024 $ 17,958 $ 15,508 $ 33,466 $ Weighted-average shares outstanding, basic and diluted 49,211 49,211 49,211 47,978 47,978 47,978 Earnings per share, basic and diluted 0.45 $ 0.00 $ 0.45 $ 0.38 $ 0.32 $ 0.70 $ Three Months Ended September 30, 2014 June 30, 2014 Net income 22,024 $ 33,466 $ CT Legacy Portfolio segment net income (134) (15,508) Amortization of discount on convertible notes 404 397 Unrealized gain on foreign currency remeasurement - (235) Incentive management fees 842 - Non-cash compensation expense 1,619 2,382 Core Earnings 24,755 $ 20,502 $ Weighted-average shares outstanding, basic and diluted 49,211 47,978 Core Earnings per share, basic and diluted 0.50 $ 0.43 $ Earnings per Share: September 30, 2014 June 30, 2014 Loan Origination CT Legacy Portfolio Total Loan Origination CT Legacy Portfolio Total 1,448,384 $ 29,355 $ 1,477,739 $ 1,203,003 $ 36,305 $ 1,239,308 $ Shares Class A common stock 57,194 57,194 57,194 47,935 47,935 47,935 Restricted class A common stock 486 486 486 544 544 544 Deferred stock units 113 113 113 108 108 108 57,793 57,793 57,793 48,587 48,587 48,587 Book value per share 25.06 $ 0.51 $ 25.57 $ 24.76 $ 0.75 $ 25.51 $ Stockholders’ equity |
 Blackstone Mortgage Trust 16 Definitions Blackstone Mortgage Trust, Inc. (“BXMT”) discloses Core Earnings, a financial measure that is calculated and presented on the basis of methodologies other than in accordance with generally accepted accounting principles in the United States of America (“GAAP”) in this presentation. Core Earnings is an adjusted measure that helps BXMT evaluate its performance excluding the effects of certain transactions and GAAP adjustments that it believes are not necessarily indicative of its current loan origination portfolio and operations. BXMT also uses Core Earnings to calculate the incentive and base management fees due to its manager under its management agreement and, as such, BXMT believes that the disclosure of Core Earnings is useful to investors. Core Earnings is defined as GAAP net income (loss), including realized losses not otherwise included in GAAP net income (loss), and excluding (i) net income (loss) attributable to the CT Legacy Portfolio segment, (ii) non-cash equity compensation expense, (iii) incentive management fees, (iv) depreciation and amortization, and (v) unrealized gains (losses) or similar non-cash items. Core Earnings may also be adjusted from time to time to exclude one-time events pursuant to changes in GAAP and certain other non-cash charges as determined by BXMT’s manager, subject to approval by a majority of its independent directors. Core Earnings does not represent net income or cash generated from operating activities and should not be considered as an alternative to GAAP net income, or an indication of cash flow from GAAP operating activities, a measure of BXMT’s liquidity, or an indication of funds available for its cash needs. In addition, BXMT’s methodology for calculating Core Earnings may differ from the methodologies employed by other companies to calculate the same or similar supplemental performance measures, and accordingly, its reported Core Earnings may not be comparable to the Core Earnings reported by other companies. |
 Blackstone Mortgage Trust 17 Forward-Looking Statements This presentation may contain forward-looking statements within the meaning of Section 27A of the Securities Act of 1933, as amended, and Section 21E of the Securities Exchange Act of 1934, as amended, which reflect Blackstone Mortgage Trust’s current views with respect to, among other things, Blackstone Mortgage Trust’s operations and financial performance. You can identify these forward-looking statements by the use of words such as “outlook,” “indicator,” “believes,” “expects,” “potential,” “continues,” “may,” “will,” “should,” “seeks,” “approximately,” “predicts,” “intends,” “plans,” “estimates,” “anticipates” or the negative version of these words or other comparable words. Such forward-looking statements are subject to various risks and uncertainties. Accordingly, there are or will be important factors that could cause actual outcomes or results to differ materially from those indicated in these statements. Blackstone Mortgage Trust believes these factors include but are not limited to those described under the section entitled “Risk Factors” in its Annual Report on Form 10-K for the fiscal year ended December 31, 2013, as such factors may be updated from time to time in its periodic filings with the Securities and Exchange Commission which are accessible on the SEC’s website at www.sec.gov. These factors should not be construed as exhaustive and should be read in conjunction with the other cautionary statements that are included in this presentation and in the filings. Blackstone Mortgage Trust assumes no obligation to update or supplement forward-looking statements that become untrue because of subsequent events or circumstances. |