Exhibit 99.1
Exhibit 99.1
May 2015
Forward-Looking Statements and Other Matters
This presentation contains forward-looking statements within the meaning of Section 27A of the Securities Act of 1933, as amended, and Section 21E of the Securities Exchange Act of 1934, as amended, which reflect Blackstone Mortgage Trust, Inc.’s (“BXMT”) current views with respect to, among other things, BXMT’s proposed loan portfolio acquisition from GE Capital and operations and financial performance. You can identify these forward-looking statements by the use of words such as “outlook,” “indicator,” “believes,” “expects,” “potential,” “continues,” “may,” “will,” “should,” “seeks,” “approximately,” “predicts,” “intends,” “plans,” “estimates,” “anticipates” or the negative version of these words or other comparable words.
Additionally, other statements in this presentation reflect the opinion of BXMT’s management as of the dates indicated. Such forward-looking statements are subject to various risks and uncertainties. Accordingly, there are or will be important factors that could cause actual outcomes or results to differ materially from those indicated in these statements. BXMT believes these factors include but are not limited to those described under the section entitled “Risk Factors” in its Annual Report on Form 10-K for the fiscal year ended December 31, 2014 and under the section entitled “Risks Related to the Loan Portfolio Acquisition” in its Current Report on Form 8-K filed with the Securities and Exchange Commission on April 13, 2015, as such factors may be updated from time to time in its periodic filings with the SEC which are accessible on the SEC’s website at www.sec.gov. These factors should not be construed as exhaustive and should be read in conjunction with the other cautionary statements that are included in this presentation and in the filings. BXMT assumes no obligation to update or supplement forward?looking statements that become untrue because of subsequent events or circumstances.
We refer to “Core Earnings”, which is a non-GAAP financial measure, in this presentation. A reconciliation of core earnings to net income, the most directly comparable GAAP measure, is included in this presentation and in our most recent Annual Report on Form 10-K, and is available on our website at www.bxmt.com.
BXMT’s acquisition of the GE Capital loan portfolio is expected to close in stages beginning in the second quarter of 2015, subject to regulatory approval and the satisfaction or waiver of certain customary closing conditions set forth in the transaction agreements. However, there can be no assurance that the closing of the acquisition of all or any part of the loan portfolio will occur. Additionally, the closing of the Wells Fargo facility is subject to the negotiation, in good faith, and the execution and delivery of definitive documentation acceptable to the parties and certain other customary terms and conditions, and there can be no assurance that BXMT will be able to obtain such financing on terms acceptable to it or at all. Slide 18 of this presentation includes a reference to imputed core return on equity (“Imputed Core ROE”) and other economic terms relating to an illustrative BXMT loan transaction that are presented solely for purposes of illustrating the impact of using floating rate financing to finance the origination of a floating rate loan and should not be viewed as indicative of the results that will be achieved for any particular loan in BXMT’s portfolio or of BXMT’s results as a whole. The loan economics presented are hypothetical and based upon a number of assumptions, including no defaults on the loan, and are subject to various risks and uncertainties. Accordingly, there are or will be important factors, including those referred to above, that could cause the actual economics that are achieved on any loan in BXMT’s loan portfolio to differ materially from those indicated in this illustration. In particular, it should be noted that as a result of such factors the net spread between whole loan yields and the cost of related leverage, the leverage multiple applicable to any particular loan and allocable overhead may vary materially from period to period and across BXMT’s loan portfolio. Imputed Core ROE also excludes potential incentive management fees and is presented before any tax effects.
Information included in this presentation is as of or for the period ended March 31, 2015, unless otherwise indicated.
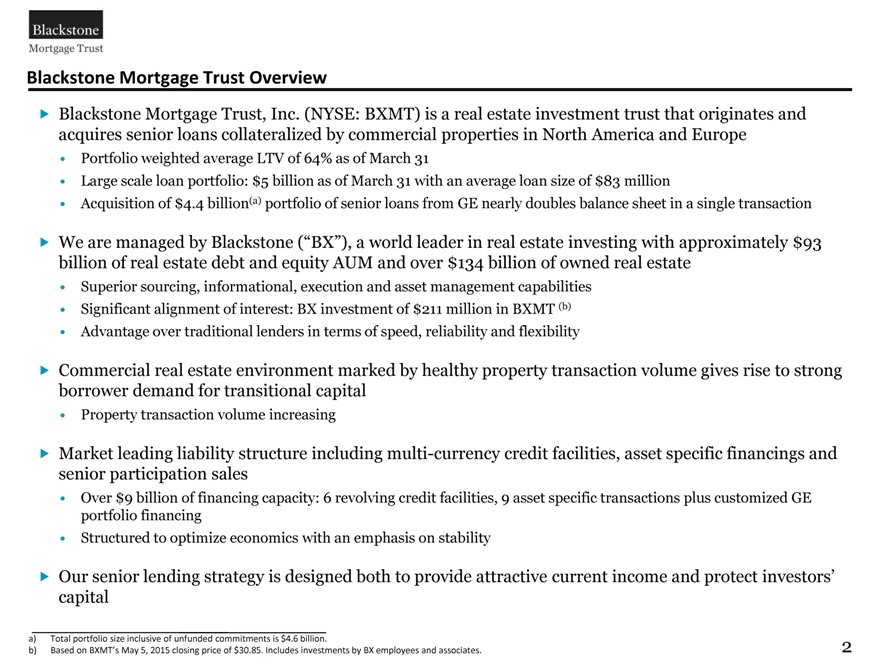
Blackstone Mortgage Trust Overview
Blackstone Mortgage Trust, Inc. (NYSE: BXMT) is a real estate investment trust that originates and
acquires senior loans collateralized by commercial properties in North America and Europe
Portfolio weighted average LTV of 64% as of March 31
Large scale loan portfolio: $5 billion as of March 31 with an average loan size of $83 million
Acquisition of $4.4 billion(a) portfolio of senior loans from GE nearly doubles balance sheet in a single transaction
We are managed by Blackstone (“BX”), a world leader in real estate investing with approximately $93
billion of real estate debt and equity AUM and over $134 billion of owned real estate
Superior sourcing, informational, execution and asset management capabilities
Significant alignment of interest: BX investment of $211 million in BXMT (b)
Advantage over traditional lenders in terms of speed, reliability and flexibility
Commercial real estate environment marked by healthy property transaction volume gives rise to strong
borrower demand for transitional capital
Property transaction volume increasing
Market leading liability structure including multi-currency credit facilities, asset specific financings and
senior participation sales
Over $9 billion of financing capacity: 6 revolving credit facilities, 9 asset specific transactions plus customized GE
portfolio financing
Structured to optimize economics with an emphasis on stability
Our senior lending strategy is designed both to provide attractive current income and protect investors’
capital
a) Total portfolio size inclusive of unfunded commitments is $4.6 billion. b) Based on BXMT’s May 5, 2015 closing price of $30.85. Includes investments by BX employees and associates.
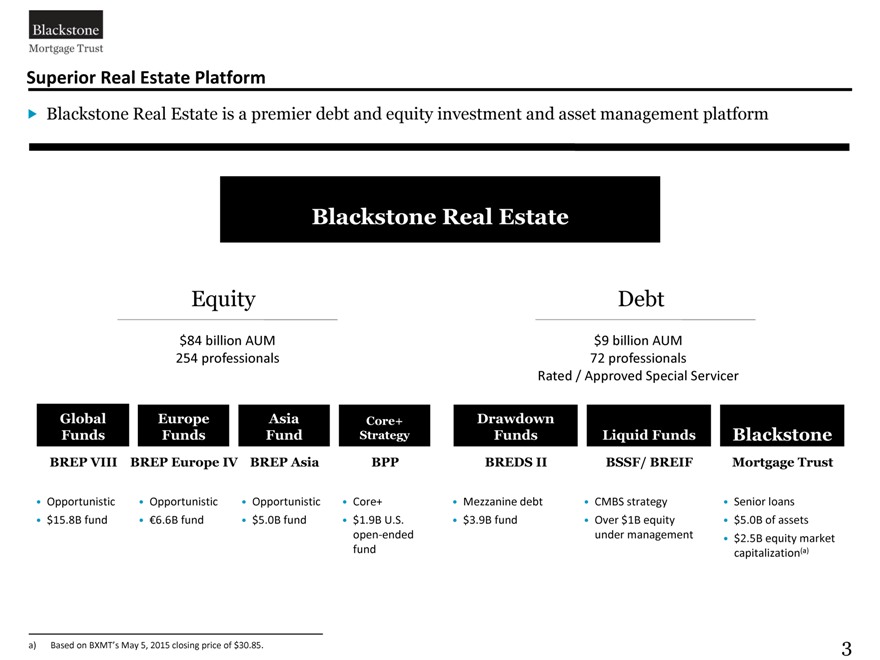
Superior Real Estate Platform
Blackstone Real Estate is a premier debt and equity investment and asset management platform
Blackstone Real Estate
Equity Debt
$84 billion AUM $9 billion AUM
254 professionals 72 professionals
Rated / Approved Special Servicer
Global Europe Asia Core+ Drawdown
Funds Funds Fund Strategy Funds Liquid Funds Blackstone
BREP VIII BREP Europe IV BREP Asia BPP BREDS II BSSF/ BREIF Mortgage Trust
Opportunistic Opportunistic Opportunistic Core+ Mezzanine debt CMBS strategy Senior loans
$15.8B fund €6.6B fund $5.0B fund $1.9B U.S. $3.9B fund Over $1B equity $ 5.0B of assets
open-ended under management $ 2.5B equity market
fund capitalization(a)
Based on BXMT’s May 5, 2015 closing price of $30.85.
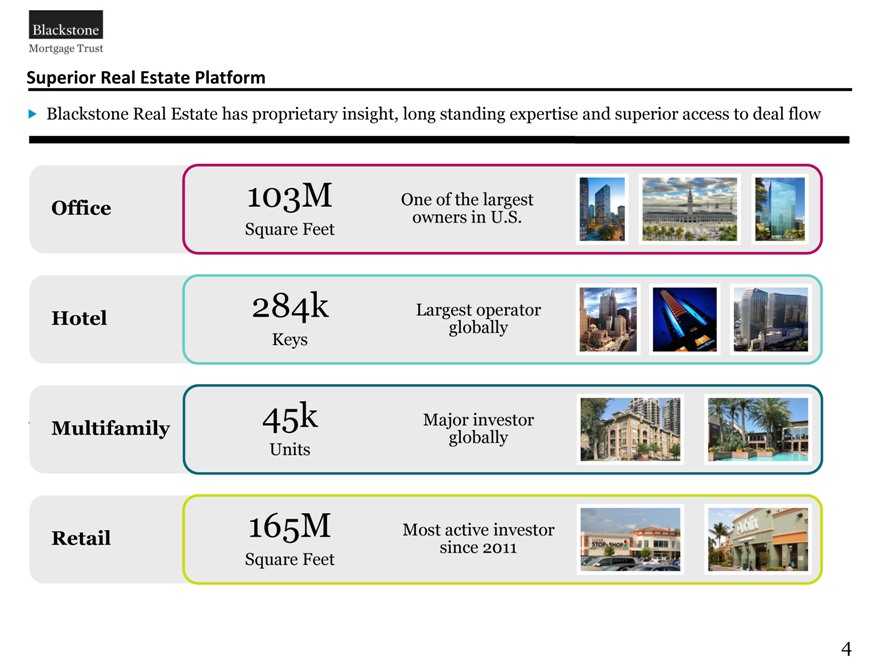
Superior Real Estate Platform
Blackstone Real Estate has proprietary insight, long standing expertise and superior access to deal flow
Office 103M One of the largest owners in U.S.
Square Feet
Hotel 284k Largest operator globally Keys
Multifamily 45k Major investor globally Units
Retail 165M Most active investor since 2011 Square Feet
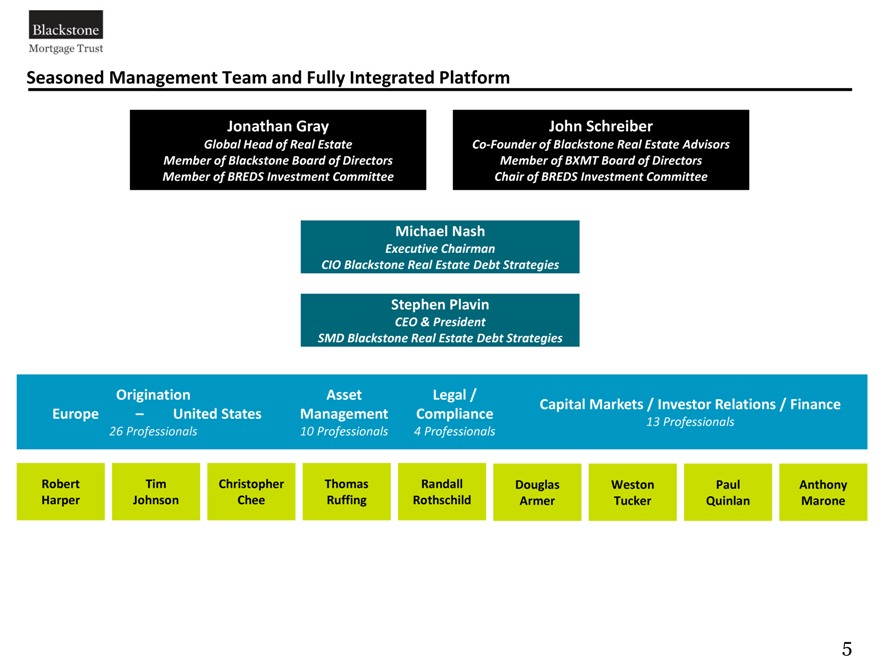
Seasoned Management Team and Fully Integrated Platform
Jonathan Gray John Schreiber
Global Head of Real Estate Co-Founder of Blackstone Real Estate Advisors Member of Blackstone Board of Directors Member of BXMT Board of Directors Member of BREDS Investment Committee Chair of BREDS Investment Committee
Michael Nash
Executive Chairman
CIO Blackstone Real Estate Debt Strategies
Stephen Plavin
CEO & President
SMD Blackstone Real Estate Debt Strategies
Origination Asset Legal /
Capital Markets / Investor Relations / Finance Europe – United States Management Compliance
26 Professionals 10 Professionals 4 Professionals 13 Professionals
Robert Tim Christopher Thomas Randall Douglas Weston Paul Anthony Harper Johnson Chee Ruffing Rothschild Armer Tucker Quinlan Marone
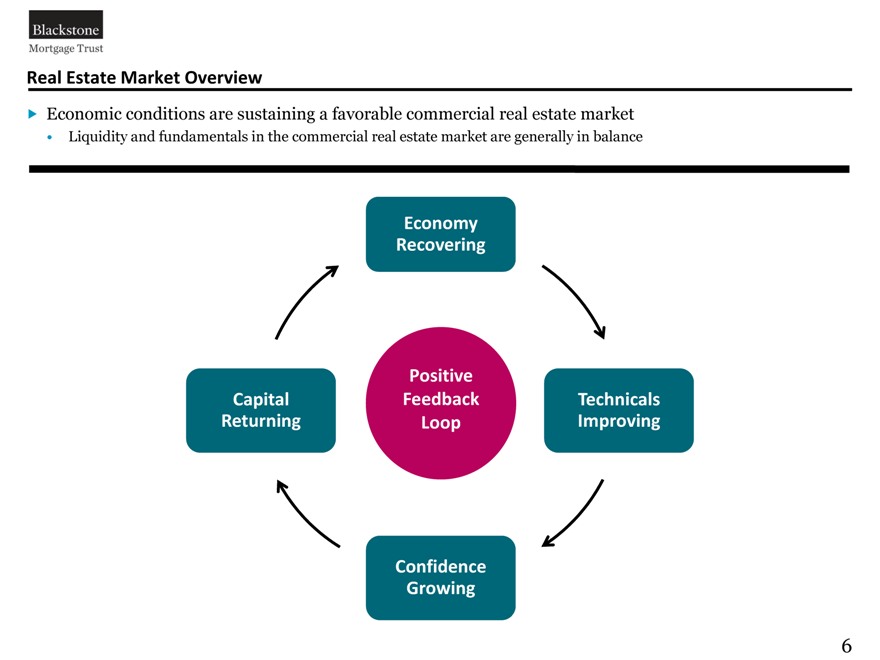
Real Estate Market Overview
Economic conditions are sustaining a favorable commercial real estate market
Liquidity and fundamentals in the commercial real estate market are generally in balance
Economy Recovering
Positive
Capital Feedback Technicals Returning Loop Improving
Confidence Growing
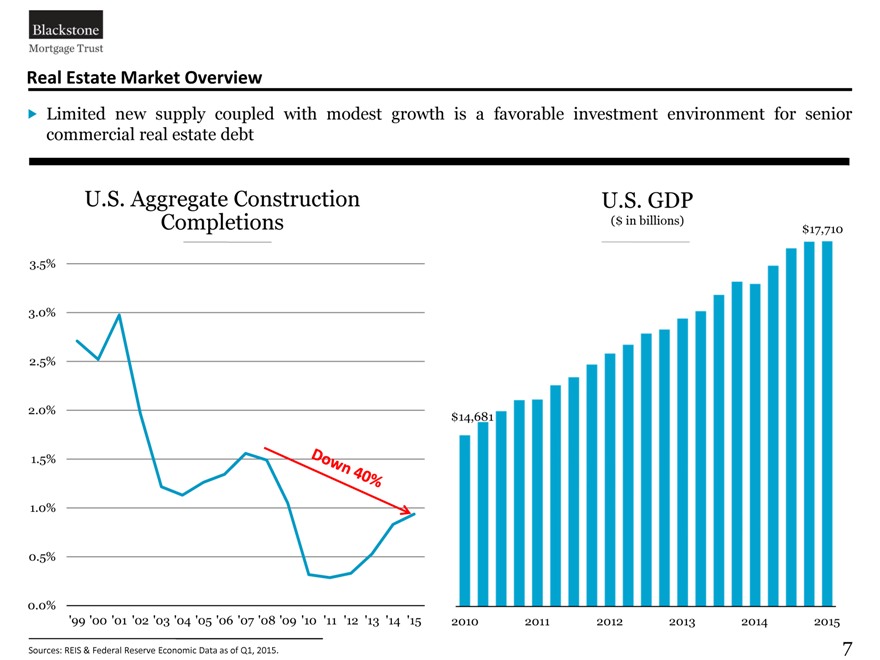
Real Estate Market Overview
Limited new supply coupled with modest growth is a favorable investment environment for senior commercial real estate debt
U.S. Aggregate Construction U.S. GDP
Completions ($ in billions) $17,710
(Office, Industrial, and Retail Sectors)
(Office, Industrial, and Retail Sectors)
3.5%
3.0%
2.5%
2.0% $14,681
1.5%
1.0%
0.5%
0.0%
‘99 ‘00 ‘01 ‘02 ‘03 ‘04 ‘05 ‘06 ‘07 ‘08 ‘09 ‘10 ‘11 ‘12 ‘13 ‘14 ‘15 2010 2011 2012 2013 2014 2015
Sources: REIS & Federal Reserve Economic Data as of Q1, 2015.
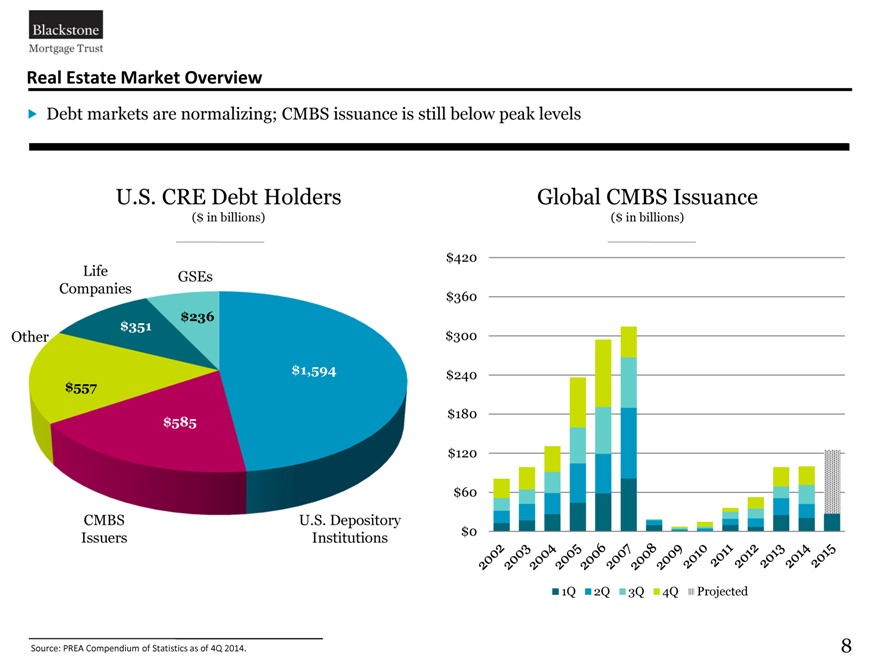
Real Estate Market Overview
Debt markets are normalizing; CMBS issuance is still below peak levels
U.S. CRE Debt Holders Global CMBS Issuance
($ in billions) ($ in billions)
(Office, Industrial, and Retail Sectors) (Office, Industrial, and Retail Sectors)
Life $420 GSEs Companies $360 $236 $351
Other $300
$1,594 $240 $557 $180 $585
$120
$60
CMBS U.S. Depository
Issuers Institutions $0
1Q 2Q 3Q 4Q Projected
Source: PREA Compendium of Statistics as of 4Q 2014.
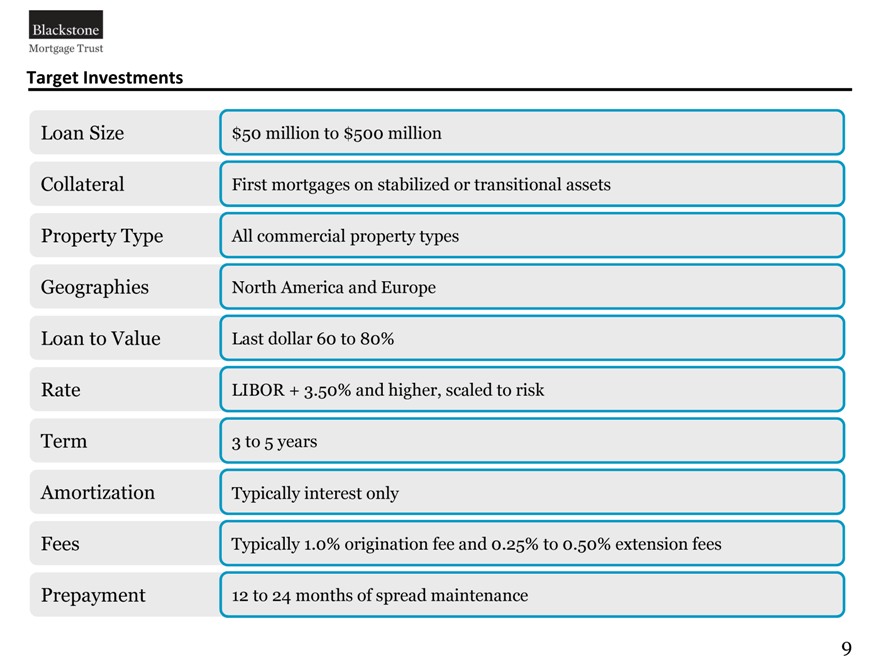
Target Investments
Loan Size $50 million to $500 million
Collateral First mortgages on stabilized or transitional assets Property Type All commercial property types Geographies North America and Europe Loan to Value Last dollar 60 to 80% Rate LIBOR + 3.50% and higher, scaled to risk Term 3 to 5 years Amortization Typically interest only
Fees Typically 1.0% origination fee and 0.25% to 0.50% extension fees
Prepayment 12 to 24 months of spread maintenance
9
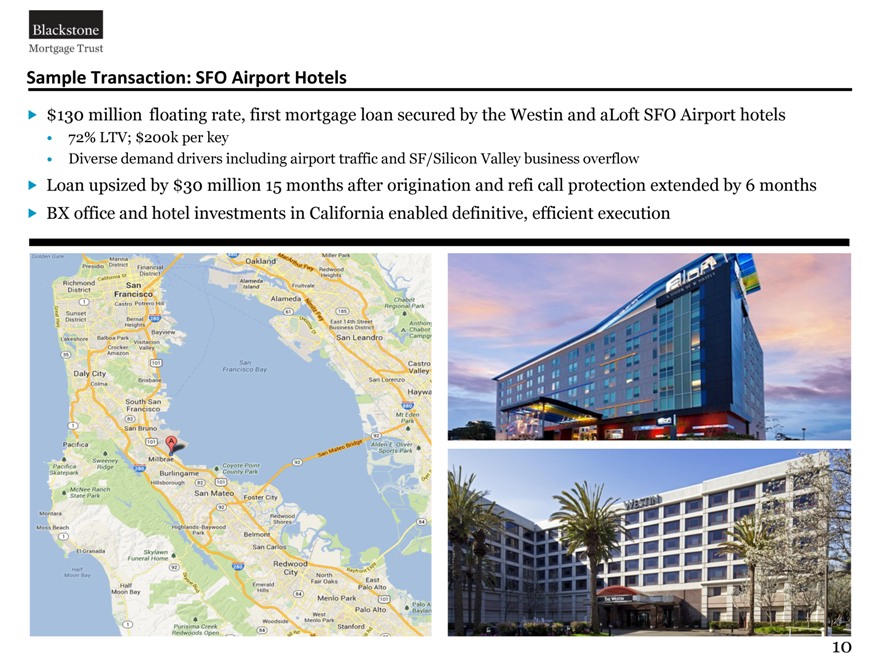
Sample Transaction: SFO Airport Hotels
$130 million floating rate, first mortgage loan secured by the Westin and aLoft SFO Airport hotels
72% LTV; $200k per key
Diverse demand drivers including airport traffic and SF/Silicon Valley business overflow
Loan upsized by $30 million 15 months after origination and refi call protection extended by 6 months BX office and hotel investments in California enabled definitive, efficient execution
10
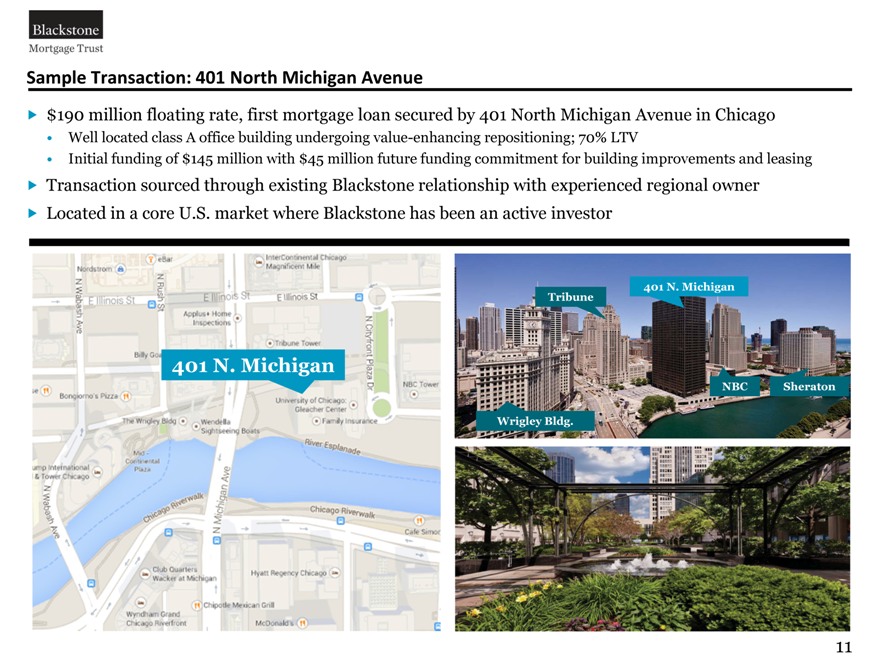
Sample Transaction: 401 North Michigan Avenue
$190 million floating rate, first mortgage loan secured by 401 North Michigan Avenue in Chicago
Well located class A office building undergoing value-enhancing repositioning; 70% LTV
Initial funding of $145 million with $45 million future funding commitment for building improvements and leasing
Transaction sourced through existing Blackstone relationship with experienced regional owner Located in a core U.S. market where Blackstone has been an active investor
401 N. Michigan
11
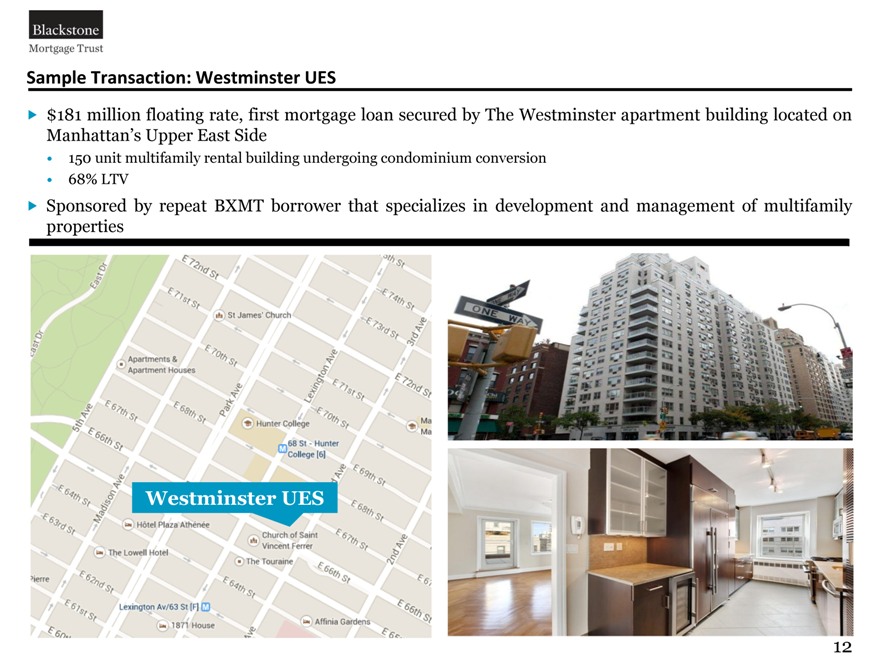
Sample Transaction: Westminster UES
$181 million floating rate, first mortgage loan secured by The Westminster apartment building located on Manhattan’s Upper East Side
150 unit multifamily rental building undergoing condominium conversion 68% LTV
Sponsored by repeat BXMT borrower that specializes in development and management of multifamily properties
Westminster UES
12
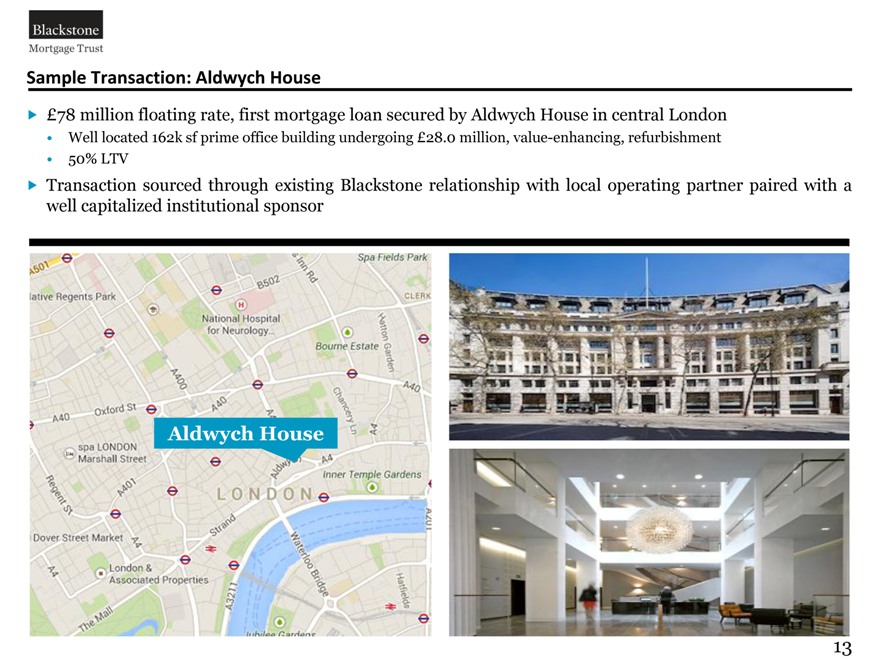
Sample Transaction: Aldwych House
£78 million floating rate, first mortgage loan secured by Aldwych House in central London
Well located 162k sf prime office building undergoing £28.0 million, value-enhancing, refurbishment 50% LTV
Transaction sourced through existing Blackstone relationship with local operating partner paired with a well capitalized institutional sponsor
Aldwych House
13
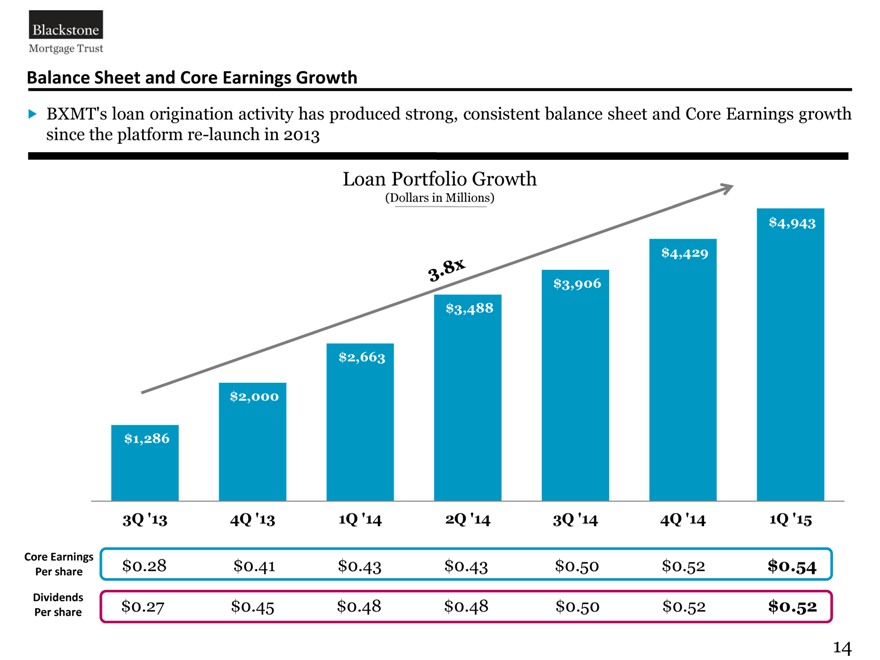
Balance Sheet and Core Earnings Growth
BXMT’s loan origination activity has produced strong, consistent balance sheet and Core Earnings growth since the platform re-launch in 2013
Loan Portfolio Growth
(Dollars in Millions)
(Dollars in Millions) $4,943
$4,429
$3,906 $3,488
$2,663 $2,000 $1,286
3Q ‘13 4Q ‘13 1Q ‘14 2Q ‘14 3Q ‘14 4Q ‘14 1Q ‘15
Core Earnings $0.28 $0.41 $0.43 $0.43 $0.50 $0.52 $0.54
Per share
Dividends $0.27 $0.45 $0.48 $0.48 $0.50 $0.52 $0.52
Per share
14
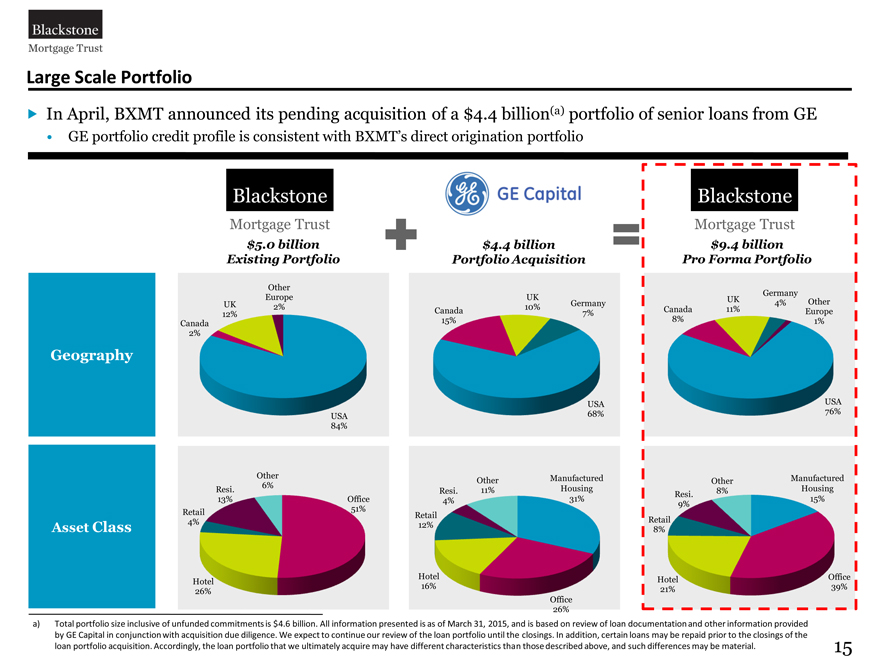
Large Scale Portfolio
In April, BXMT announced its pending acquisition of a $4.4 billion(a) portfolio of senior loans from GE
GE portfolio credit profile is consistent with BXMT’s direct origination portfolio
Blackstone Blackstone
Mortgage Trust Mortgage Trust
$5.0 billion $4.4 billion $9.4 billion Existing Portfolio Portfolio Acquisition Pro Forma Portfolio
Other
Germany Europe UK UK
UK Germany 4% Other
2% Canada 10% Canada 11%
12% 7% 8% Europe Canada 15% 1% 2%
Geography
USA USA 68% 76% USA
84%
Other Manufactured Manufactured Other Other
6% Housing Housing Resi. Resi. 11% 8% Resi.
13% Office 4% 31% 15% 9% Retail 51% Retail
4% Retail 12%
Asset Class 8%
Hotel Hotel Office Hotel 16% 21% 39% 26% Office 26%
a) Total portfolio size inclusive of unfunded commitments is $4.6 billion. All information presented is as of March 31, 2015, and is based on review of loan documentation and other information provided by GE Capital in conjunction with acquisition due diligence. We expect to continue our review of the loan portfolio until the closings. In addition, certain loans may be repaid prior to the closings of the loan portfolio acquisition. Accordingly, the loan portfolio that we ultimately acquire may have different characteristics than those described above, and such differences may be material.
15
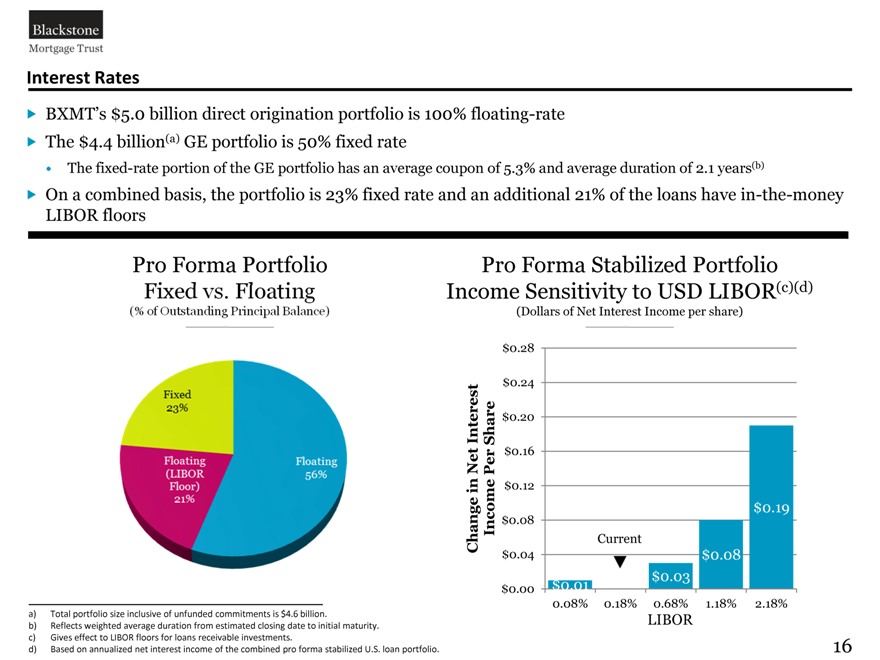
Interest Rates
BXMT’s $5.0 billion direct origination portfolio is 100% floating-rate The $4.4 billion(a) GE portfolio is 50% fixed rate
The fixed-rate portion of the GE portfolio has an average coupon of 5.3% and average duration of 2.1 years(b)
On a combined basis, the portfolio is 23% fixed rate and an additional 21% of the loans have in-the-money LIBOR floors
Pro Forma Portfolio Pro Forma Stabilized Portfolio Income Sensitivity to USD LIBOR(c)(d)
(Dollars of Net Interest Income per share)
$0.28
$0.24
Interest Share $0.20 Net $0.16 Per
in $0.12
Income $0.08 $0.19
Change Current $0.04 $0.08
$0.03
$0.00 $0.01
0.08% 0.18% 0.68% 1.18% 2.18% a) Total portfolio size inclusive of unfunded commitments is $4.6 billion. LIBOR b) Reflects weighted average duration from estimated closing date to initial maturity. c) Gives effect to LIBOR floors for loans receivable investments. d) Based on annualized net interest income of the combined pro forma stabilized U.S. loan portfolio.
16
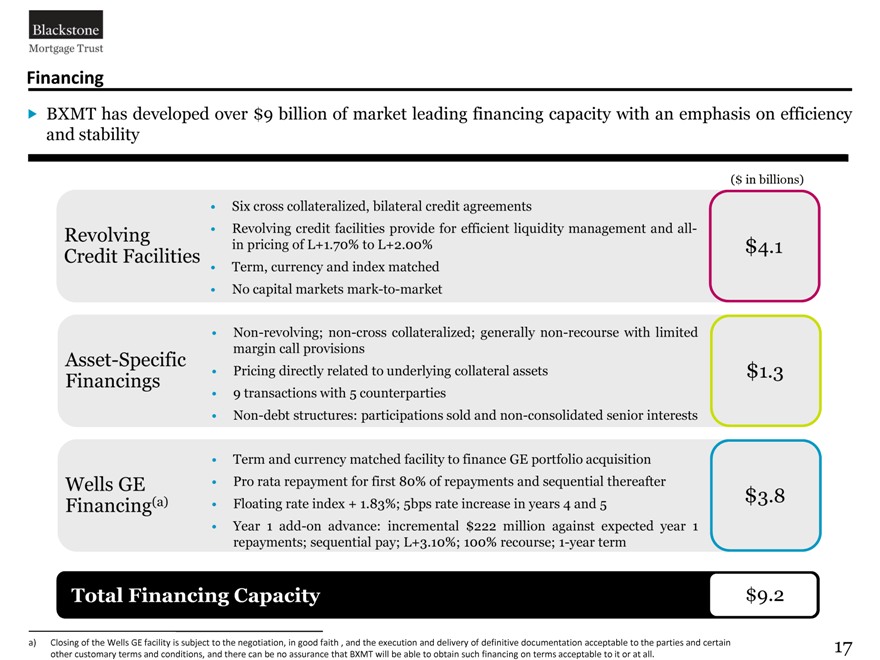
Financing
BXMT has developed over $9 billion of market leading financing capacity with an emphasis on efficiency and stability
($ in billions)
Six cross collateralized, bilateral credit agreements
Revolving Revolving credit facilities provide for efficient liquidity management and all-in pricing of L+1.70% to L+2.00% $4.1
Credit Facilities
Term, currency and index matched
No capital markets mark-to-market
Non-revolving; non-cross collateralized; generally non-recourse with limited margin call provisions
Asset-Specific
Pricing directly related to underlying collateral assets $1.3
Financings
9 transactions with 5 counterparties
Non-debt structures: participations sold and non-consolidated senior interests
Term and currency matched facility to finance GE portfolio acquisition Wells GE Pro rata repayment for first 80% of repayments and sequential thereafter
(a) | | 5bps 5 $3.8 Financing Floating rate index + 1.83%; rate increase in years 4 and |
Year 1 add-on advance: incremental $222 million against expected year 1 repayments; sequential pay; L+3.10%; 100% recourse; 1-year term
Total Financing Capacity $9.2
a) Closing of the Wells GE facility is subject to the negotiation, in good faith , and the execution and delivery of definitive documentation acceptable to the parties and certain other customary terms and conditions, and there can be no assurance that BXMT will be able to obtain such financing on terms acceptable to it or at all.
17
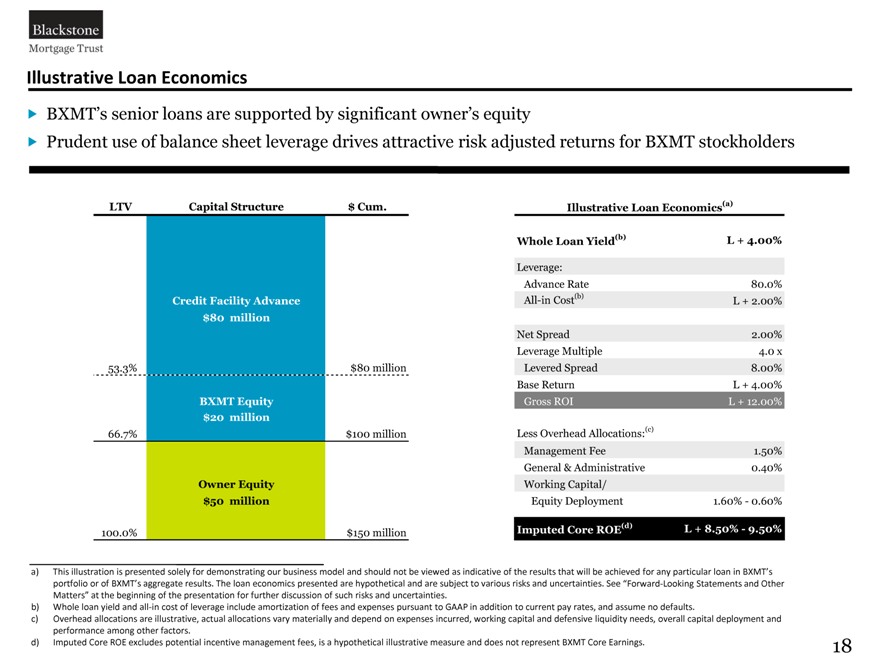
Illustrative Loan Economics
BXMT’s senior loans are supported by significant owner’s equity
Prudent use of balance sheet leverage drives attractive risk adjusted returns for BXMT stockholders
LTV Capital Structure $ Cum. Illustrative Loan Economics(a)
Whole Loan Yield(b) L + 4.00%
Leverage:
Advance Rate 80.0%
Credit Facility Advance All-in Cost(b) L + 2.00%
$80 million
Net Spread 2.00% Leverage Multiple 4.0 x 53.3% $80 million Levered Spread 8.00% Base Return L + 4.00% BXMT Equity Gross ROI L + 12.00%
$20 million
66.7% $100 million Less Overhead Allocations:(c)
Management Fee 1.50% General & Administrative 0.40% Owner Equity Working Capital/
$50 million Equity Deployment 1.60%—0.60%
Imputed Core ROE(d) L + 8.50%—9.50%
100.0% $150 million
a) This illustration is presented solely for demonstrating our business model and should not be viewed as indicative of the results that will be achieved for any particular loan in BXMT’s portfolio or of BXMT’s aggregate results. The loan economics presented are hypothetical and are subject to various risks and uncertainties. See “Forward?Looking Statements and Other
Matters” at the beginning of the presentation for further discussion of such risks and uncertainties. b) Whole loan yield and all-in cost of leverage include amortization of fees and expenses pursuant to GAAP in addition to current pay rates, and assume no defaults. c) Overhead allocations are illustrative, actual allocations vary materially and depend on expenses incurred, working capital and defensive liquidity needs, overall capital deployment and performance among other factors. d) Imputed Core ROE excludes potential incentive management fees, is a hypothetical illustrative measure and does not represent BXMT Core Earnings.
18
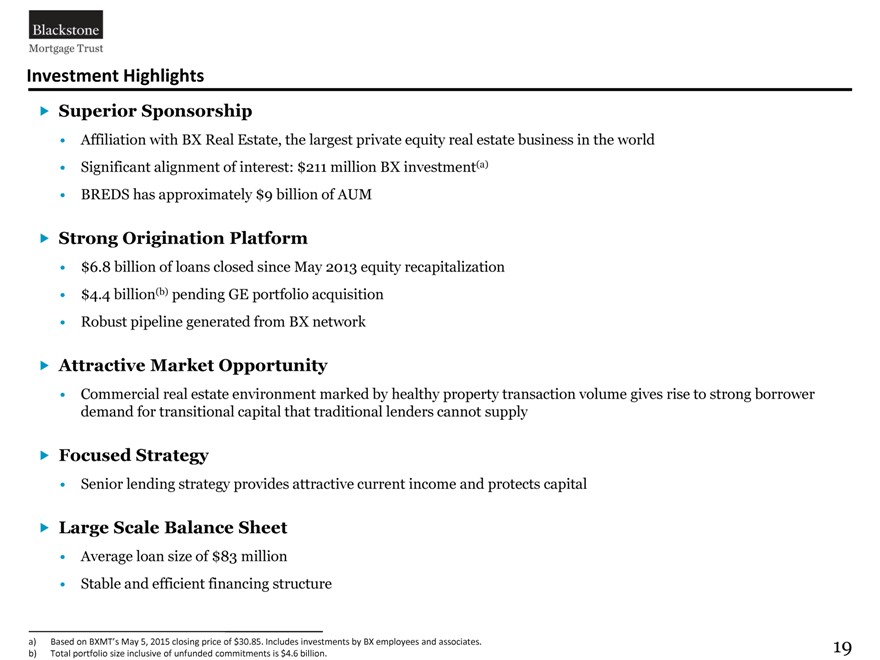
Investment Highlights
Superior Sponsorship
Affiliation with BX Real Estate, the largest private equity real estate business in the world Significant alignment of interest: $211 million BX investment(a) BREDS has approximately $9 billion of AUM
Strong Origination Platform
$6.8 billion of loans closed since May 2013 equity recapitalization $4.4 billion(b) pending GE portfolio acquisition Robust pipeline generated from BX network
Attractive Market Opportunity
Commercial real estate environment marked by healthy property transaction volume gives rise to strong borrower demand for transitional capital that traditional lenders cannot supply
Focused Strategy
Senior lending strategy provides attractive current income and protects capital
Large Scale Balance Sheet
Average loan size of $83 million Stable and efficient financing structure
a) Based on BXMT’s May 5, 2015 closing price of $30.85. Includes investments by BX employees and associates. b) Total portfolio size inclusive of unfunded commitments is $4.6 billion.
19
Appendix: 1Q 2015 Earnings Release Excerpts
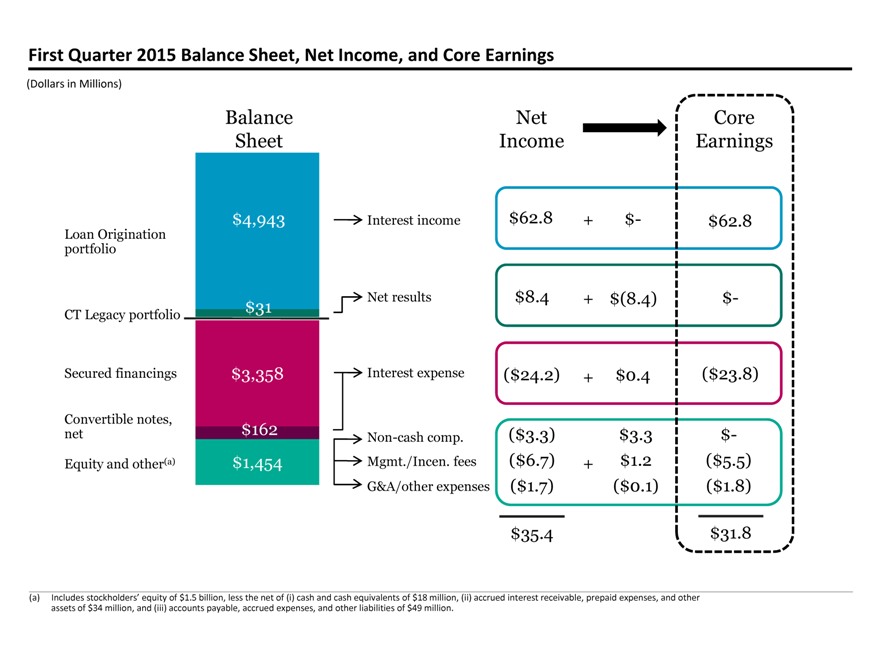
First Quarter 2015 Balance Sheet, Net Income, and Core Earnings
(Dollars in Millions)
Balance Net Core Sheet Income Earnings
$4,943 Interest income $62.8 + $- $62.8
Loan Origination portfolio
Net results $8.4 + $(8.4) $-
$31
CT Legacy portfolio
Secured financings $3,358 Interest expense ($24.2) + $0.4 ($23.8)
Convertible notes,
net $162 ($3.3) $3.3 $-
Non-cash comp.
Equity and other(a) $1,454 Mgmt./Incen. fees ($6.7) + $1.2 ($5.5)
G&A/other expenses ($1.7) ($0.1) ($1.8)
$35.4 $31.8
(a) Includes stockholders’ equity of $1.5 billion, less the net of (i) cash and cash equivalents of $18 million, (ii) accrued interest receivable, prepaid expenses, and other assets of $34 million, and (iii) accounts payable, accrued expenses, and other liabilities of $49 million.
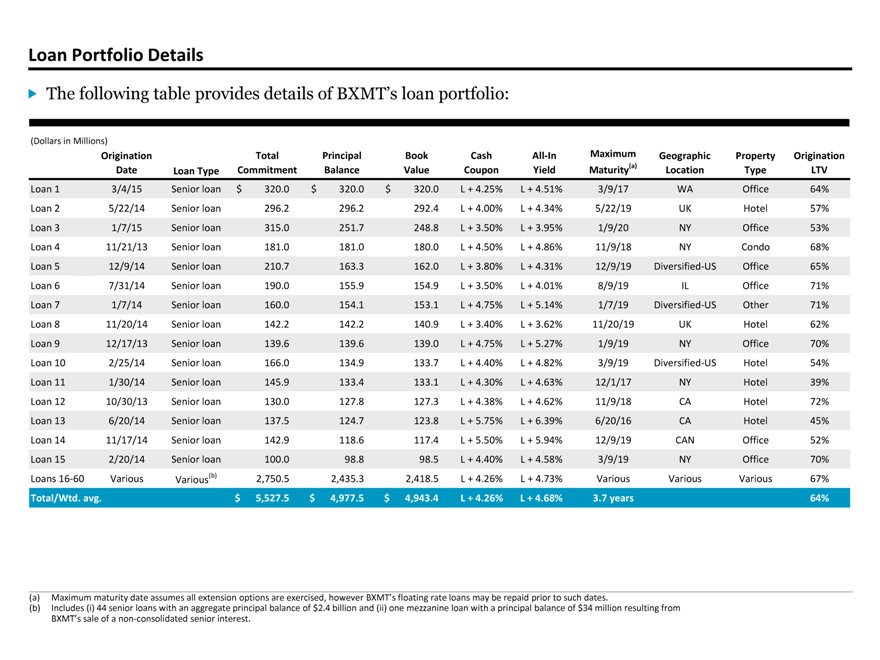
Loan Portfolio Details
The following table provides details of BXMT’s loan portfolio:
(Dollars in Millions)
Origination Total Principal Book Cash All-In Maximum Geographic Property Origination
Date Loan Type Commitment Balance Value Coupon Yield Maturity(a) Location Type LTV
Loan 1 3/4/15 Senior loan $ 320.0 $ 320.0 $ 320.0 L + 4.25% L + 4.51% 3/9/17 WA Office 64%
Loan 2 5/22/14 Senior loan 296.2 296.2 292.4 L + 4.00% L + 4.34% 5/22/19 UK Hotel 57%
Loan 3 1/7/15 Senior loan 315.0 251.7 248.8 L + 3.50% L + 3.95% 1/9/20 NY Office 53%
Loan 4 11/21/13 Senior loan 181.0 181.0 180.0 L + 4.50% L + 4.86% 11/9/18 NY Condo 68%
Loan 5 12/9/14 Senior loan 210.7 163.3 162.0 L + 3.80% L + 4.31% 12/9/19 Diversified-US Office 65%
Loan 6 7/31/14 Senior loan 190.0 155.9 154.9 L + 3.50% L + 4.01% 8/9/19 IL Office 71%
Loan 7 1/7/14 Senior loan 160.0 154.1 153.1 L + 4.75% L + 5.14% 1/7/19 Diversified-US Other 71%
Loan 8 11/20/14 Senior loan 142.2 142.2 140.9 L + 3.40% L + 3.62% 11/20/19 UK Hotel 62%
Loan 9 12/17/13 Senior loan 139.6 139.6 139.0 L + 4.75% L + 5.27% 1/9/19 NY Office 70%
Loan 10 2/25/14 Senior loan 166.0 134.9 133.7 L + 4.40% L + 4.82% 3/9/19 Diversified-US Hotel 54%
Loan 11 1/30/14 Senior loan 145.9 133.4 133.1 L + 4.30% L + 4.63% 12/1/17 NY Hotel 39%
Loan 12 10/30/13 Senior loan 130.0 127.8 127.3 L + 4.38% L + 4.62% 11/9/18 CA Hotel 72%
Loan 13 6/20/14 Senior loan 137.5 124.7 123.8 L + 5.75% L + 6.39% 6/20/16 CA Hotel 45%
Loan 14 11/17/14 Senior loan 142.9 118.6 117.4 L + 5.50% L + 5.94% 12/9/19 CAN Office 52%
Loan 15 2/20/14 Senior loan 100.0 98.8 98.5 L + 4.40% L + 4.58% 3/9/19 NY Office 70%
Loans 16-60 Various Various(b) 2,750.5 2,435.3 2,418.5 L + 4.26% L + 4.73% Various Various Various 67%
Total/Wtd. avg. $ 5,527.5 $ 4,977.5 $ 4,943.4 L + 4.26% L + 4.68% 3.7 years 64%
(a) Maximum maturity date assumes all extension options are exercised, however BXMT’s floating rate loans may be repaid prior to such dates.
(b) Includes (i) 44 senior loans with an aggregate principal balance of $2.4 billion and (ii) one mezzanine loan with a principal balance of $34 million resulting from BXMT’s sale of a non-consolidated senior interest.
Blackstone