Blackstone Mortgage Trust, Inc. July 25, 2017 Second Quarter 2017 Results Exhibit 99.2 |
1 Blackstone Mortgage Trust Information included in this presentation is as of or for the period ended June 30, 2017, unless otherwise indicated (a) See Appendix for a definition and reconciliation to GAAP net income (b) Based on annualized dividend and BXMT closing price as of June 30, 2017 (c) Based on LTV as of the dates loans were originated or acquired by BXMT (d) Includes $983 million of Non-Consolidated Senior Interests, see Appendix for definition GAAP earnings of $0.53 per share and Core Earnings (a) of $0.60 per share. Book value of $26.38 per share. $0.62 per share dividend equates to a 7.8% dividend yield. (b) 2Q loan originations totaled $1.5 billion and were 100% floating rate, senior loans with a weighted average LTV (c) of 61%; 1H 2017 originations of $2.5 billion, up 44% from 1H 2016 100% performing $10.6 billion (d) portfolio of senior loans with a weighted average LTV (c) of 61% Portfolio is 92% floating rate; a 1.0% increase in USD LIBOR would result in a $0.23 increase in annual net interest income per share Sponsored 2017-ROSS CMBS transaction, BXMT’s first securitized financing of a balance sheet loan: $475 million of notes sold with a weighted average coupon of L+1.86% Raised $288 million of five-year convertible debt with a 4.375% coupon and an initial conversion price of $35.67 per share (1.35x P/B) Subsequent to quarter end, closed the initial $133 million of loans and two new credit facilities totaling $450 million for the BXMT-Walker & Dunlop joint venture Second Quarter 2017 Highlights |
Blackstone Mortgage Trust 2 Loan Originations Originated $1.5 billion in 2Q taking 1H 2017 originations to $2.5 billion, up 44% from 1H 2016 2Q originations comprised of $753 million portfolio loan (subsequently securitized in 2017-ROSS transaction) plus six loans with an average commitment of $114 million 100% senior loans $1.5 billion total commitments 100% floating rate Weighted Average LTV (a) of 61% (a) Reflects LTV as of the date loans were originated or acquired by BXMT Large loans: $205 million avg. size ($ in billions) Originations Growth 2Q 2017 Originations $2.5 originations $1.7 originations 44% YoY growth $0.9 $0.9 $1.0 $0.8 $1.0 $1.5 1Q'16 2Q'16 3Q'16 4Q'16 1Q'17 2Q'17 |
Blackstone Mortgage Trust 3 Earnings & Dividends GAAP earnings of $0.53 per share ($51 million) and Core Earnings (a) of $0.60 per share ($57 million). $0.62 per share dividend equates to a 7.8% dividend yield. (b) Book value of $26.38 per share, up $0.10 from prior quarter Future quarters will capture full benefit of $811 million of net fundings in 2Q, further funding of constructions loans and increased deployment of convertible note issuance proceeds Since May 2013 re-IPO, cumulative Core Earnings of $668 million have been fully distributed to investors via $668 million of cash dividends (a) See Appendix for a definition and reconciliation to GAAP net income (b) Based on annualized dividend and BXMT closing price as of June 30, 2017 $0.52 * Cumulative Dividends $668 million dividends paid since re-IPO $0.62 * $0.27 * $0.45 * $0.48 * $0.50 * *Denotes change in quarterly dividend 3Q 4Q 1Q 2Q 3Q 4Q 1Q 2Q 3Q 4Q 1Q 2Q 3Q 4Q 1Q 2Q 2013 2014 2015 2016 2017 |
Blackstone Mortgage Trust 4 Condo Portfolio Composition $10.6 billion portfolio comprising 102 senior loans secured by institutional quality real estate concentrated in major markets: loans secured by assets located in New York and California comprise 38% of the portfolio Office Multifamily Hotel MHC Other Retail Geographic Diversification (a) Collateral Diversification (a) (a) In certain instances, we finance our loans through the non-recourse sale of a senior loan interest that is not included in our consolidated financial statements. See Note 2 in our Form 10-Q for further discussion. Total loan exposure encompasses the entire loan we originated and financed, including $983 billion of such Non- Consolidated Senior Interests as of June 30, 2017. (b) Reflects LTV as of the date loans were originated or acquired by BXMT Weighted Average LTV (b) 61% States that comprise less than 1% of total loan portfolio CA 16% WA 2% HI 5% DC 2% TX 2% GA 3% IL 8% FL 9% UK 13% OR 1% MD 1% NC 1% NL 1% MA 1% DEU 1% VA 8% NY 22% CAN 4% 2% 2% 54% 20% 9% 6% 7% |
Blackstone Mortgage Trust 5 Capital Markets Activity $762 million of securities issued in 2Q 2017 across two transactions, increasing capital structure efficiency in favorable market environment Raised $288 million of accretive capital issuing five-year convertible notes $475 million CMBS notes sold: cost efficient and structurally advantaged financing transaction for large loan originations $288 million Convertible Notes (a)(b) $500 million CMBS (a)(c) $475 million (c) securitized financing 4.375% coupon $35.67 conversion price (1.35x P/B) L+1.86% (c) coupon (a) This information is not intended to, and does not constitute, represent or form part of any offer, invitation or solicitation of any offer to purchase, or otherwise acquire, subscribe for, sell or otherwise dispose of, any securities (b) On May 5, 2017, BXMT issued $250 million of its 4.375% convertible senior notes due 2022 in an underwritten public offering. BXMT issued an additional $38 million on May 23, 2017 as a result of the underwriters’ exercise in full of their option to purchase additional notes, a total of $288 million of convertible notes issued. (c) On June 30, 2017, $500 million Commercial Mortgage Pass-Through Certificates Series 2017-ROSS were issued in a transaction underwritten by Goldman Sachs and in which both Goldman Sachs and BXMT were loan sellers and sponsors. Certificates with a principal balance of $475 million were sold to third party investors and BXMT, as the retaining sponsor, acquired the class HRR certificates with a balance of $25 million. |
Blackstone Mortgage Trust 6 2.5x Debt-to-Equity Ratio 3.2x Total Leverage Ratio Balance Sheet Total asset-level financing capacity of $10.5 billion was 72% utilized at quarter end $1.5 billion of credit facility maturity extensions in 2Q Asset-Level Financing Capacity ($ in billions) Outstanding Leverage Credit Facilities Credit Facilities All-in cost of L+2.15% Asset-Specific Financings Asset-Specific Financings All-in cost of L+2.01% Corporate Debt Corporate Debt Recourse Debt Recourse Debt Senior Loan Interests Senior Loan Interests Pricing directly related to underlying collateral assets Total Leverage Total Leverage $4.0 $1.7 $0.6 $1.4 $6.3 $8.2 (a) In addition to $369 million of loan participations sold, includes $983 million of Non-Consolidated Senior Interests, which result from non-recourse sales of senior loan interests in loans BXMT originates. BXMT’s net investments in these loans are reflected in the form of mezzanine or other subordinate loans on BXMT’s balance sheet. (b) Represents (i) total outstanding secured debt agreements, convertible notes, less cash, to (ii) total stockholders’ equity (c) Represents (i) total outstanding secured debt agreements, convertible notes, loan participations sold, Non-Consolidated Senior Interests, and securitized debt obligations, less cash, to (ii) total stockholders’ equity Credit Facilities 8 providers Senior Loan Interests 8 providers Asset-Specific Financings 4 providers $10.5 bn 2Q’17 Capacity Securitized Debt 1 securitization Securitized Debt Securitized Debt $0.5 All-in cost of L+1.95% $6.6 $2.0 $1.4 $0.5 (c) (b) (a) Secured Facility: L+2.25% Convertible Notes: 4.70% |
Blackstone Mortgage Trust 7 Interest Rates Core Earnings are positively correlated to changes in LIBOR, the benchmark index for 92% of BXMT’s loans A 1.0% increase in USD LIBOR would increase net interest income per share by $0.23 per annum (a) As of June 30, 2015 (b) As of June 30, 2015, $1.2 billion of floating rate loans earned interest based on floors that were above the applicable index, with an average floor of 0.54% (c) As of June 30, 2017, $229 million of floating rate loans earned interest based on floors that were above the applicable index, with an average floor of 1.18% Portfolio Income Sensitivity to USD LIBOR (Annual Dollars of Net Interest Income Per Share) USD LIBOR Portfolio Fixed vs. Floating (% of Total Loan Exposure) Floating Fixed Floating Fixed At GE Acquisition 2Q 2017 $0.00 $0.10 $0.20 $0.30 $0.40 $0.50 $0.60 $0.70 1.22% 1.72% 2.22% 2.72% 3.22% 3.72% 8% 92% 20% 80% (a) (b) (c) |
Appendix |
Blackstone Mortgage Trust 9 ($ in billions) ($ in millions) Appendix – Second Quarter 2017 Operating Results & Net Funding $811 million (b) Net Fundings Net Funding Operating Results $9.7 $1.3 $(0.4) $10.6 (a) Includes $1.0 billion and $983 million of Non-Consolidated Senior Interests as of March 31, 2017 and June 30, 2017, respectively, see Appendix for definition (b) Excludes the impact of changes in foreign currency rates and hedges for non-USD loans and financings $0.60 Core Earnings Per Share $0.53 Net Income Per Share (a) (a) GAAP Net Income Adjustments Core Earnings Interest Income 126.8 $ (0.2) $ 126.6 $ Interest Expense (54.4) 0.4 (54.0) Management and Incentive Fees (14.4) — (14.4) G&A / Other (1.5) 0.6 (0.9) Non-Cash Compensation (6.0) 6.0 — Total 50.6 $ 6.8 $ 57.4 $ 1Q'17 Loans Outstanding Fundings Repayments 2Q'17 Loans Outstanding |
Blackstone Mortgage Trust 10 Loan Portfolio Details (a) Date loan was originated or acquired by BXMT, and the LTV as of such date (b) In certain instances, loans are financed through the non-recourse sale of a senior loan interest that is not included in the consolidated financial statements. As of June 30, 2017, three loans in the portfolio have been financed with an aggregate $983 billion of Non-Consolidated Senior Interests, which are included in the table above. (c) Maximum maturity assumes all extension options are exercised; however, floating rate loans generally may be repaid prior to their final maturity without penalty (d) Consists of both floating and fixed rate loans. Coupon and all-in yield assume applicable floating benchmark rates for weighted-average calculation. ($ in millions) Loan Type Origination Date (a) Total Loan (b) Principal Balance (b) Net Book Value Cash Coupon All-In Yield Maximum Maturity (c) Location Property Type Loan Per SQFT / Unit / Key Origination LTV (a) Loan 1 Senior Loan 5/11/2017 753 $ 643 $ 639 $ L + 3.40% L + 3.60% 6/10/2023 Virginia Office 316 / sqft 62% Loan 2 Senior loan (b) 5/15/2015 590 520 88 L + 4.25% L + 4.75% 5/15/2020 Miami Retail 643 / sqft 36% Loan 3 Senior loan (b) 8/6/2015 481 481 87 4.49% 5.81% 10/29/2022 Diversified - EUR Other n/a 71% Loan 4 Senior Loan 5/22/2014 443 443 440 L + 4.20% L + 4.48% 12/31/2019 Diversified - UK Hotel 120,340 / key 59% Loan 5 Senior Loan 5/1/2015 320 295 294 L + 3.45% L + 3.83% 5/1/2020 New York Office 375 / sqft 68% Loan 6 Senior Loan 1/7/2015 315 287 287 L + 3.50% L + 3.70% 1/9/2021 New York Office 246 / sqft 53% Loan 7 Senior Loan 6/4/2015 266 266 269 L + 4.34% L + 4.21% 8/26/2020 Diversified - CAN Hotel 41,008 / key 54% Loan 8 Senior Loan 3/31/2017 258 242 239 L + 4.15% L + 4.54% 4/9/2022 Maui Hotel 318,182 / key 75% Loan 9 Senior Loan 6/23/2015 223 215 214 L + 3.65% L + 3.96% 5/8/2022 Washington DC Office 241 / sqft 72% Loan 10 Senior Loan 7/31/2014 215 203 203 L + 3.40% L + 3.44% 8/9/2019 Chicago Office 268 / sqft 64% Loan 11 Senior loan (b) 6/30/2015 198 197 39 L + 4.75% L + 5.19% 7/9/2020 San Francisco Condo 927 / sqft 66% Loan 12 Senior Loan 8/3/2016 276 189 187 L + 4.66% L + 5.20% 8/9/2021 New York Office 260 / sqft 57% Loan 13 Senior Loan 8/19/2016 200 188 187 L + 3.64% L + 4.10% 9/9/2021 New York Office 572 / sqft 69% Loan 14 Senior Loan 4/15/2016 200 185 184 L + 4.25% L + 4.86% 5/9/2021 New York Office 174 / sqft 40% Loan 15 Senior Loan 2/25/2014 181 181 181 L + 4.75% L + 5.07% 3/9/2019 Diversified - US Hotel 95,113 / key 58% Loan 16-102 Senior Loans Various 7,143 6,079 6,050 5.17% 5.62% (d) Various Various Various Various 62% Total/Wtd. Avg. 12,062 $ 10,614 $ 9,588 $ 5.10% 5.54% 3.5 years 61% |
Blackstone Mortgage Trust 11 Consolidated Balance Sheets ($ in thousands, except per share data) June 30, 2017 December 31, 2016 Assets Cash and cash equivalents 33,521 $ 75,567 $ Restricted Cash 34,278 — Loans receivable, net 9,587,457 8,692,978 Other assets 63,832 44,070 Total assets 9,719,088 $ 8,812,615 $ Liabilities and equity Secured debt agreements, net 5,806,037 $ 5,716,354 $ Loan participations sold, net 367,671 348,077 Securitized debt obligations, net 474,123 — Convertible notes, net 448,047 166,762 Other liabilities 116,737 87,819 Total liabilities 7,212,615 6,319,012 Commitments and contingencies — — Equity Class A common stock, $0.01 par value 948 945 Additional paid-in capital 3,102,929 3,089,997 Accumulated other comprehensive loss (40,508) (56,202) Accumulated deficit (556,896) (541,137) Total Blackstone Mortgage Trust, Inc. stockholders’ equity 2,506,473 2,493,603 Total liabilities and equity 9,719,088 $ 8,812,615 $ |
Blackstone Mortgage Trust 12 Consolidated Statements of Operations ($ in thousands, except per share data) Three Months Ended June 30, Six Months Ended June 30, 2017 2016 2017 2016 Income from loans and other investments Interest and related income 126,825 $ 130,471 $ 245,341 $ 253,496 $ Less: Interest and related expenses 54,352 49,065 101,026 94,446 Income from loans and other investments, net 72,473 81,406 144,315 159,050 Other expenses Management and incentive fees 14,393 15,847 27,314 29,460 General and administrative expenses 7,373 6,781 14,800 13,576 Total other expenses 21,766 22,628 42,114 43,036 Gain on investments at fair value — 10,524 — 10,589 (Loss) income from equity investment in unconsolidated subsidiary — (6) — 133 Income before income taxes 50,707 69,296 102,201 126,736 Income tax provision (benefit) 94 (154) 183 87 Net income 50,613 $ 69,450 $ 102,018 $ 126,649 $ Net income attributable to non-controlling interests — (6,369) — (6,521) Net income attributable to Blackstone Mortgage Trust, Inc. 50,613 $ 63,081 $ 102,018 $ 120,128 $ Per share information (basic and diluted) Weighted-average shares of common stock outstanding 95,005,873 94,064,423 94,999,664 94,066,096 Net income per share of common stock 0.53 $ 0.67 $ 1.07 $ 1.28 $ |
Blackstone Mortgage Trust 13 Per Share Calculations (Amounts in thousands, except per share data) (a) Represents net income attributable to Blackstone Mortgage Trust (b) Adjustment in respect of the deferral in Core Earnings of the accretion of a total $9.1 million of purchase discount attributable to a certain pool of GE portfolio loans pending the repayment of those loans Three Months Ended June 30, 2017 March 31, 2017 Net income (a) 50,613 $ 51,405 $ Non-cash compensation expense 5,959 5,907 GE purchase discount accretion adjustment (b) (198) (216) Other items 1,001 1,024 Core Earnings 57,375 $ 58,120 $ Weighted-average shares outstanding, basic and diluted 95,006 94,993 Core Earnings per share, basic and diluted 0.60 $ 0.61 $ June 30, 2017 March 31, 2017 Stockholders’ equity 2,506,473 $ 2,495,982 $ Shares Class A common stock 94,828 94,818 Deferred stock units 182 176 Total outstanding 95,010 94,994 Book value per share 26.38 $ 26.28 $ Three Months Ended June 30, 2017 March 31, 2017 Net income (a) 50,613 $ 51,405 $ Weighted-average shares outstanding, basic and diluted 95,006 94,993 Earnings per share, basic and diluted 0.53 $ 0.54 $ Core Earnings Reconciliation Book Value per Share Earnings per Share |
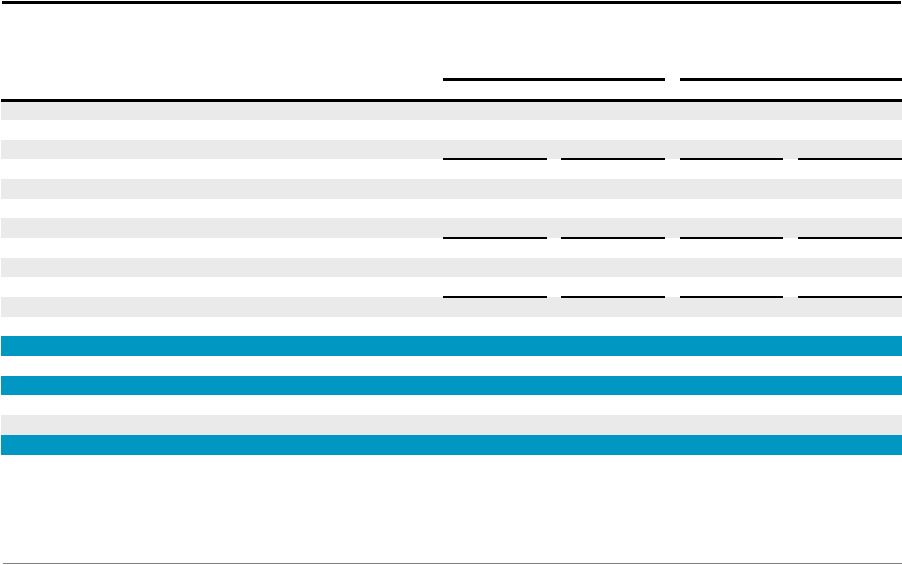
Blackstone Mortgage Trust 14 Reconciliation of Net Income to Core Earnings (a) (a) In 3Q 2015, BXMT revised the basis of reporting for Core Earnings to be net of incentive fees. Core EPS numbers indicated in the chart for 3Q 2014, 4Q 2014 and 1Q 2015 are adjusted from the previously reported $0.50, $0.52 and $0.54, respectively, so as to be comparable to Core EPS numbers in 3Q 2015 and subsequently. (b) Represents net income attributable to Blackstone Mortgage Trust (c) Adjustment in respect of the deferral in Core Earnings of the accretion of a total $9.1 million of purchase discount attributable to a certain pool of GE portfolio loans pending the repayment of those loans (Amounts in Thousands, Except per Share Data) Three Months Ended Sep 30, 2013 Dec 31, 2013 Mar 31, 2014 Jun 30, 2014 Sep 30, 2014 Dec 31, 2014 Mar 31, 2015 Jun 30, 2015 Sep 30, 2015 Dec 31, 2015 Mar 31, 2016 Jun 30, 2016 Sep 30, 2016 Dec 31, 2016 Mar 31, 2017 Jun 30, 2017 Net income (b) 8,320 $ 7,079 $ 13,065 $ 33,466 $ 22,024 $ 21,490 $ 35,393 $ 29,284 $ 66,888 $ 65,264 $ 57,047 $ 63,081 $ 64,794 $ 53,375 $ 51,405 $ 50,613 $ CT Legacy Portfolio net (income) loss (437) 3,670 970 (15,508) (134) 4,833 (8,400) (1,857) (401) (3,408) 183 (3,825) (1,805) (502) - - Non-cash compensation expense 94 1,158 1,834 2,382 1,619 2,528 3,297 3,396 3,188 3,460 4,687 4,836 4,949 4,955 5,907 5,959 GE purchase discount accretion adjustment (c) - - - - - - - (459) (2,008) (1,542) (1,166) (1,247) (929) (320) (216) (198) Other items - 107 423 162 404 408 342 416 (119) 310 418 278 (65) 742 1,024 1,001 Core Earnings 7,977 $ 12,014 $ 16,292 $ 20,502 $ 23,913 $ 29,259 $ 30,632 $ 30,780 $ 67,548 $ 64,084 $ 61,169 $ 63,123 $ 66,944 $ 58,250 $ 58,120 $ 57,375 $ Weighted-average shares outstanding, basic and diluted 28,895 29,364 37,967 47,978 49,211 58,190 58,576 80,941 93,358 93,574 94,068 94,064 94,072 94,456 94,993 95,006 Net income per share, basic and diluted 0.29 $ 0.24 $ 0.34 $ 0.70 $ 0.45 $ 0.37 $ 0.60 $ 0.36 $ 0.72 $ 0.70 $ 0.61 $ 0.67 $ 0.69 $ 0.57 $ 0.54 $ 0.53 $ Core Earnings per share, basic and diluted 0.28 $ 0.41 $ 0.43 $ 0.43 $ 0.49 $ 0.50 $ 0.52 $ 0.38 $ 0.72 $ 0.68 $ 0.65 $ 0.67 $ 0.71 $ 0.62 $ 0.61 $ 0.60 $ |
Blackstone Mortgage Trust 15 Definitions Core Earnings: Blackstone Mortgage Trust, Inc. (“BXMT”) discloses Core Earnings, a financial measure that is calculated and presented on the basis of methodologies other than in accordance with generally accepted accounting principles in the United States of America (“GAAP”) in this presentation. Core Earnings is an adjusted measure that helps BXMT evaluate its performance excluding the effects of certain transactions and GAAP adjustments that it believes are not necessarily indicative of its current loan origination portfolio and operations. Although according to its management agreement BXMT calculates the incentive and base management fees due to its Manager using Core Earnings before incentive fees expense, beginning with the third quarter of 2015, BXMT reports Core Earnings after incentive fees expense, as BXMT believes this is a more meaningful presentation of the economic performance of its class A common stock. Core Earnings is defined as GAAP net income (loss), including realized gains and losses not otherwise included in GAAP net income (loss), and excluding (i) net income (loss) attributable to the CT Legacy Portfolio, (ii) non-cash equity compensation expense, (iii) depreciation and amortization, (iv) unrealized gains (losses), and (v) certain non-cash items. Core Earnings may also be adjusted from time to time to exclude one-time events pursuant to changes in GAAP and certain other non-cash charges as determined by BXMT’s manager, subject to approval by a majority of its independent directors. Core Earnings does not represent net income or cash generated from operating activities and should not be considered as an alternative to GAAP net income, or an indication of BXMT’s GAAP cash flows from operations, a measure of BXMT’s liquidity, or an indication of funds available for its cash needs. In addition, BXMT’s methodology for calculating Core Earnings may differ from the methodologies employed by other companies to calculate the same or similar supplemental performance measures, and accordingly, its reported Core Earnings may not be comparable to the Core Earnings reported by other companies. Non-Consolidated Senior Interests: Senior interests in loans originated and syndicated to third parties. These non-recourse loan participations constitute additional financing capacity and are included in discussions of the loan portfolio. |
Blackstone Mortgage Trust 16 Forward-Looking Statements This presentation may contain forward-looking statements within the meaning of Section 27A of the Securities Act of 1933, as amended, and Section 21E of the Securities Exchange Act of 1934, as amended, which reflect BXMT’s current views with respect to, among other things, BXMT’s operations and financial performance. You can identify these forward-looking statements by the use of words such as “outlook,” “indicator,” “believes,” “expects,” “potential,” “continues,” “may,” “will,” “should,” “seeks,” “predicts,” “intends,” “plans,” “estimates,” “anticipates” or the negative version of these words or other comparable words. Such forward- looking statements are subject to various risks and uncertainties. Accordingly, there are or will be important factors that could cause actual outcomes or results to differ materially from those indicated in these statements. BXMT believes these factors include but are not limited to those described under the section entitled “Risk Factors” in its Annual Report on Form 10-K for the fiscal year ended December 31, 2016, as such factors may be updated from time to time in its periodic filings with the Securities and Exchange Commission (“SEC”) which are accessible on the SEC’s website at www.sec.gov. These factors should not be construed as exhaustive and should be read in conjunction with the other cautionary statements that are included in this presentation and in the filings. BXMT assumes no obligation to update or supplement forward-looking statements that become untrue because of subsequent events or circumstances. |