 Blackstone Mortgage Trust, Inc. October 24, 2017 Third Quarter 2017 Results Exhibit 99.2 |
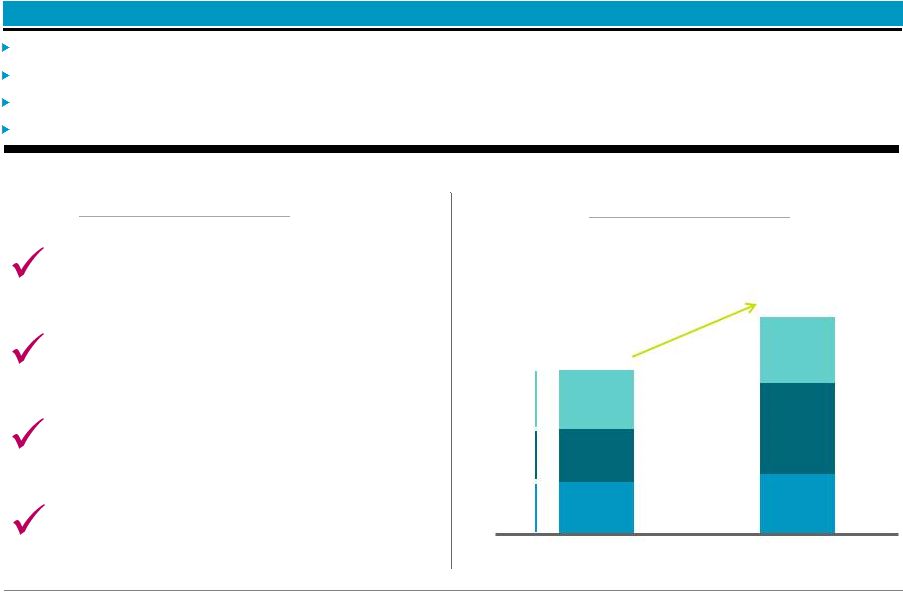
 Blackstone Mortgage Trust 1 BXMT Highlights 8.0% dividend yield (b) Blackstone Real Estate platform provides expert management 100% performing loan portfolio generates current cash income Stable portfolio financed with long- term, match-funded liabilities Portfolio positioned for yield and value protection in changing rate environment Information included in this presentation is as of or for the period ended September 30, 2017, unless otherwise indicated. YTD information is for the nine months ended September 30, 2017. (a) See Appendix for a definition and reconciliation to GAAP net income (b) Based on annualized dividend and BXMT closing price as of September 30, 2017 (c) Reflects LTV as of the date loans were originated or acquired by BXMT $0.62 3Q dividend 61% Loan-to-Value (c) $10.7B senior loan portfolio 92% floating rate +$0.26 net interest income per 1% increase in LIBOR $111B BX Real Estate investor capital under management $1.1B 3Q originations BXMT’s $10.7 billion portfolio of senior commercial real estate loans produced $0.61 of GAAP EPS and $0.69 of Core EPS (a) in 3Q driving TTM dividend coverage to 102% Expertise Income Stable Protected |
 Blackstone Mortgage Trust 2 Loan Originations Loan Originations 3Q origination of $1.1 billion; YTD volume of $3.6 billion up 33% from prior year Fundings under previously originated commitments in 3Q totaled $172 million Earnings & Dividends Earnings & Dividends 3Q EPS of $0.61 and Core Earnings (a) of $0.69 per share; book value of $26.52 3Q dividend of $0.62 per share equates to an 8.0% dividend yield (b) Third Quarter 2017 Results Portfolio Composition Portfolio Composition Financing Financing Interest Rates Interest Rates $10.7 billion portfolio (c) with a weighted average origination LTV (d) of 61% Coastal markets emphasis with 41% of loans secured by assets in CA or NY Debt-to-Equity ratio (e) of 2.6x; match funded long-term leverage $115 million add-on issuance of 4.375% May 2022 convertible notes (a) See Appendix for a definition and reconciliation to GAAP net income (b) Based on annualized dividend and BXMT closing price as of September 30, 2017 (c) Includes $988 million of Non-Consolidated Senior Interests, see Appendix for definition (d) Reflects LTV as of the date loans were originated or acquired by BXMT (e) Represents (i) total outstanding secured debt agreements and convertible notes, less cash, to (ii) total equity 92% of the portfolio is floating rate 1.0% increase in LIBOR would increase annual net interest income by $0.26 per share |
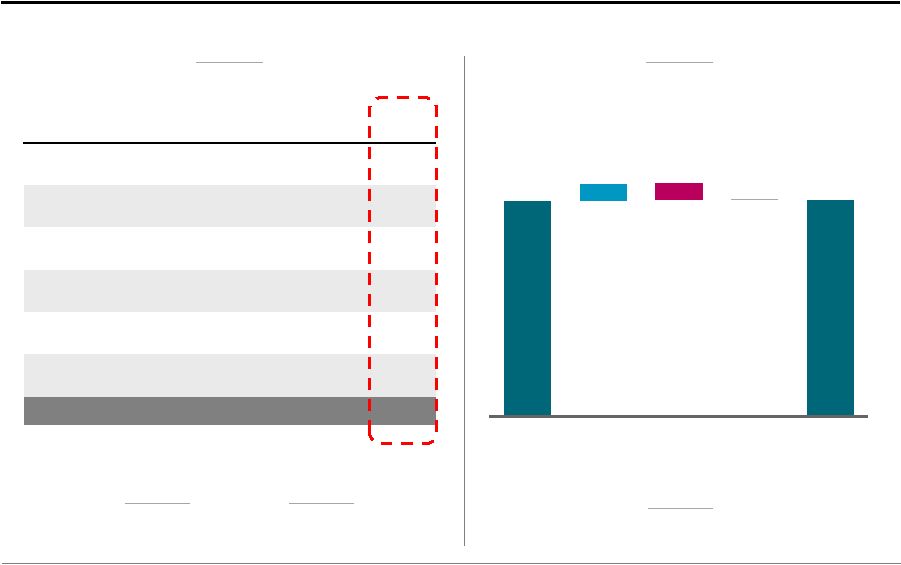
 Blackstone Mortgage Trust 3 TTM Dividend Coverage (c) Earnings & Dividends Earnings & Dividends GAAP earnings of $0.61 per share ($58 million) and Core Earnings (a) of $0.69 per share ($65 million) $0.62 per share dividend equates to an 8.0% dividend yield (b) Book value of $26.52 per share, up $0.14 from prior quarter (a) See Appendix for a definition and reconciliation to GAAP net income (b) Based on annualized dividend and BXMT closing price as of September 30, 2017 (c) GAAP EPS of $0.57, $0.54, $0.53 and $0.61 as of 4Q’16, 1Q’17, 2Q’17 and 3Q’17, respectively Cumulative Dividends ($ in millions) $0.62 dividend 102% TTM coverage Core Earnings Per Share Dividends Paid $21 $122 $317 $550 $727 2013 2014 2015 2016 YTD 2017 $0.62 $0.61 $0.60 $0.69 4Q'16 1Q'17 2Q'17 3Q'17 |
 Blackstone Mortgage Trust 4 Loan Originations Loan Originations Originated $1.1 billion in 3Q with YTD 2017 totaling $3.6 billion of originations, up 33% from prior year Fundings under previously originated commitments in the quarter totaled $172 million 64% of 3Q originations are collateralized by assets located in California Originated 2 new construction loans totaling $284 million that will contribute to outstandings in future periods 100% senior loans 100% floating rate Weighted average LTV (a) of 63% (a) Reflects LTV as of the date loans were originated or acquired by BXMT (b) Excludes loans originated in the BXMT-Walker & Dunlop joint venture Large loans: $116 million avg. size (b) ($ in billions) Origination Growth 3Q 2017 Originations $2.7 $3.6 1Q 2Q 3Q 33% YoY growth $0.9 $1.0 $0.9 $1.5 $1.0 $1.1 1Q - 3Q 2016 YTD 2017 |
 Blackstone Mortgage Trust 5 MHC Portfolio Composition $10.7 billion portfolio comprising 111 senior loans secured by institutional quality real estate concentrated in major markets; 41% of loans secured by assets located in New York or California Office Multifamily Hotel Condo Other Retail Geographic Diversification (a) Collateral Diversification (a) Weighted Average LTV (b) 61% States that comprise less than 1% of total loan portfolio 54% 17% 9% 7% 3% 2% 8% NC 1% TX 1% MA 2% CAN 4% CA 19% WA 2% HI 5% DC 2% GA 3% IL 8% FL 9% VA 7% NY 22% NL 1% DEU 1% BE 1% UK 8% (a) In certain instances, we finance our loans through the non-recourse sale of a senior loan interest that is not included in our consolidated financial statements. See Note 2 in our Form 10-Q for further discussion. Total loan exposure encompasses the entire loan we originated and financed, including $988 million of such Non-Consolidated Senior Interests as of September 30, 2017. (b) Reflects LTV as of the date loans were originated or acquired by BXMT |
 Blackstone Mortgage Trust 6 Financing Total asset-level financing capacity of $10.7 billion was 68% utilized at quarter end Closed $450 million of credit facility financing for bridge loans originated in the BXMT-Walker & Dunlop joint venture 3Q $115 million add-on issuance of 4.375% May 2022 convertible notes increased total outstanding to $403 million ($ in billions) Financing 2.6x Debt-to-Equity Ratio (b) 3.2x Total Leverage Ratio (c) Credit Facilities Coupon of L+1.90% Corporate Debt Convertible Notes: 4.64% Secured Facility: L+2.25% Corporate Obligations Senior Loan Interests (a) Pricing directly related to underlying collateral assets Total Leverage $5.9 $0.7 $1.0 $6.6 $8.3 Securitized Debt $0.5 Coupon of L+1.86% (a) In addition to $33 million of loan participations sold, includes $988 million of Non-Consolidated Senior Interests, which result from non-recourse sales of senior loan interests in loans BXMT originates. BXMT’s net investments in these loans are reflected in the form of mezzanine or other subordinate loans on BXMT’s balance sheet. (b) Represents (i) total outstanding secured debt agreements, convertible notes, less cash, to (ii) total equity (c) Represents (i) total outstanding secured debt agreements, convertible notes, loan participations sold, Non-Consolidated Senior Interests, and securitized debt obligations, less cash, to (ii) total equity |
 Blackstone Mortgage Trust 7 8% 92% Interest Rates Core Earnings are positively correlated to changes in LIBOR, the benchmark index for 92% of BXMT’s loans A 1.0% increase in USD LIBOR would increase net interest income per share by $0.26 per annum Portfolio Income Sensitivity to USD LIBOR (Annual Dollars of Net Interest Income Per Share) USD LIBOR Portfolio Fixed vs. Floating (% of Total Loan Exposure) Floating (a) Fixed $0.00 $0.10 $0.20 $0.30 $0.40 $0.50 $0.60 $0.70 $0.80 1.23% 1.73% 2.23% 2.73% 3.23% 3.73% (a) As of September 30, 2017, $274 million of floating rate loans earned interest based on floors that were above the applicable index, with an average floor of 1.24% |
 Appendix |
 Blackstone Mortgage Trust 9 GAAP Net Income Adjustments Core Earnings Interest Income 146.4 $ (0.1) $ 146.3 $ Interest Expense (67.9) 0.5 (67.4) Management and Incentive Fees (13.2) — (13.2) G&A / Other (1.6) 1.1 (0.5) Non-Cash Compensation (5.9) 5.9 — Net income attributable to non-controlling interests (0.1) — (0.1) Total 57.7 $ 7.4 $ 65.1 $ 2Q'17 Loans Outstanding Fundings Repayments FX Revaluation 3Q'17 Loans Outstanding Appendix – Third Quarter 2017 Operating Results & Net Funding $10 million (b) Net Repayments Net Funding ($ in billions) Operating Results ($ in millions) $10.6 $0.9 $(0.9) $10.7 $0.69 Core Earnings Per Share $0.61 Net Income Per Share (a) (a) $0.1 (a) Includes $983 million and $988 million of Non-Consolidated Senior Interests as of June 30, 2017 and September 30, 2017, respectively, see Appendix for definition (b) Excludes the impact of changes in foreign currency rates and hedges for non-USD loans and financings |
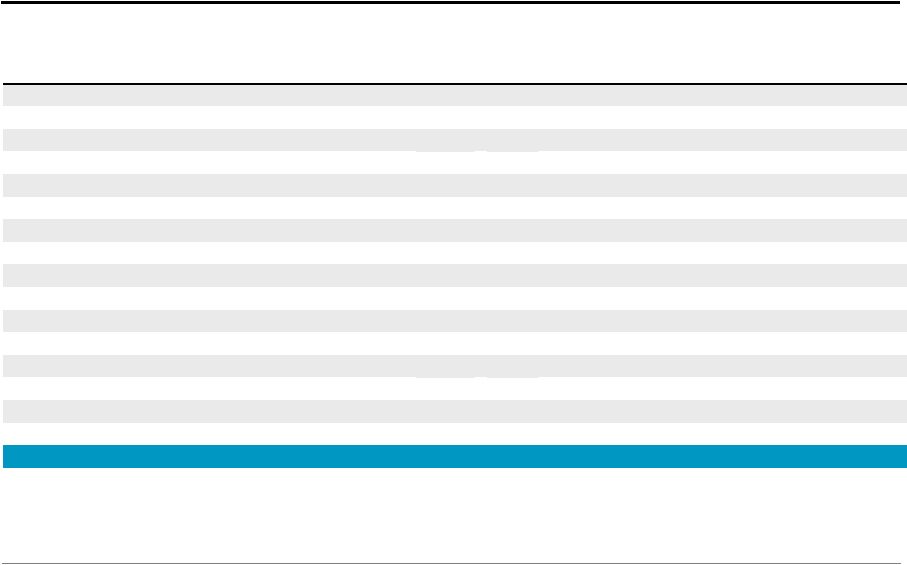 Blackstone Mortgage Trust 10 (a) Date loan was originated or acquired by BXMT, and the LTV as of such date (b) In certain instances, loans are financed through the non-recourse sale of a senior loan interest that is not included in the consolidated financial statements. As of September 30, 2017, three loans in the portfolio have been financed with an aggregate $988 million of Non-Consolidated Senior Interests, which are included in the table above. (c) Maximum maturity assumes all extension options are exercised; however, floating rate loans generally may be repaid prior to their final maturity without penalty (d) Consists of both floating and fixed rates. Coupon and all-in yield assume applicable floating benchmark rates for weighted-average calculation. ($ in millions) Loan Type Origination Date (a) Total Loan (b) Principal Balance (b) Net Book Value Cash Coupon All-In Yield Maximum Maturity (c) Location Property Type Loan Per SQFT / Unit / Key Origination LTV (a) Loan 1 Senior Loan 5/11/2017 753 $ 645 $ 641 $ L + 3.40% L + 3.60% 6/10/2023 Virginia Office 316 / sqft 62% Loan 2 Senior Loan (b) 5/15/2015 590 531 90 L + 4.25% L + 4.74% 5/15/2020 Miami Retail 674 / sqft 36% Loan 3 Senior Loan (b) 8/6/2015 495 495 90 4.49% 5.82% 10/29/2022 Diversified - EUR Other n/a 71% Loan 4 Senior Loan 5/1/2015 320 295 294 L + 3.45% L + 3.83% 5/1/2020 New York Office 375 / sqft 68% Loan 5 Senior Loan 1/7/2015 315 294 293 L + 3.50% L + 3.71% 1/9/2021 New York Office 252 / sqft 53% Loan 6 Senior Loan 6/4/2015 274 274 278 L + 4.34% L + 4.20% 9/2/2020 Diversified - CAN Hotel 42,371 / key 54% Loan 7 Senior Loan 3/31/2017 258 242 239 L + 4.15% L + 4.54% 4/9/2022 Maui Hotel 318,182 / key 75% Loan 8 Senior Loan 6/23/2015 223 215 215 L + 3.65% L + 3.97% 5/8/2022 Washington DC Office 241 / sqft 72% Loan 9 Senior Loan 7/31/2014 215 213 213 L + 3.40% L + 3.52% 8/9/2019 Chicago Office 281 / sqft 64% Loan 10 Senior Loan 8/3/2016 276 194 192 L + 4.66% L + 5.21% 8/9/2021 New York Office 267 / sqft 57% Loan 11 Senior Loan 8/19/2016 200 190 190 L + 3.64% L + 4.10% 9/9/2021 New York Office 579 / sqft 69% Loan 12 Senior Loan 4/15/2016 200 189 188 L + 4.25% L + 4.86% 5/9/2021 New York Office 176 / sqft 40% Loan 13 Senior Loan 2/25/2014 181 181 181 L + 4.75% L + 5.07% 3/9/2019 Diversified - US Hotel 95,113 / key 58% Loan 14 Senior Loan (b) 6/30/2015 180 177 35 L + 4.75% L + 5.16% 8/15/2022 San Francisco Condo 827 / sqft 60% Loan 15 Senior Loan 12/22/2016 205 172 171 L + 3.50% L + 4.07% 1/9/2022 New York Office 242 / sqft 66% Loan 16-111 Senior Loans Various 7,657 6,362 6,327 5.17% (d) 5.58% (d) Various Various Various Various 62% Total/Wtd. Avg. 12,342 $ 10,669 $ 9,637 $ 5.13% 5.55% 3.4 years 61% Loan Portfolio Details |
 Blackstone Mortgage Trust 11 Consolidated Balance Sheets ($ in thousands, except per share data) September 30, 2017 December 31, 2016 Assets Cash and cash equivalents 61,221 $ 75,567 $ Restricted Cash 32,864 — Loans receivable, net 9,637,152 8,692,978 Other assets 45,680 44,070 Total assets 9,776,917 $ 8,812,615 $ Liabilities and equity Secured debt agreements, net 6,079,135 $ 5,716,354 $ Loan participations sold, net 33,193 348,077 Securitized debt obligations, net 474,298 — Convertible notes, net 562,741 166,762 Other liabilities 101,758 87,819 Total liabilities 7,251,125 6,319,012 Commitments and contingencies — — Equity Class A common stock, $0.01 par value 948 945 Additional paid-in capital 3,109,094 3,089,997 Accumulated other comprehensive loss (32,362) (56,202) Accumulated deficit (558,066) (541,137) Total Blackstone Mortgage Trust, Inc. stockholders’equity 2,519,614 2,493,603 Non-controlling interests 6,178 — Total equity 2,525,792 2,493,603 Total liabilities and equity 9,776,917 $ 8,812,615 $ |
 Blackstone Mortgage Trust 12 Consolidated Statements of Operations ($ in thousands, except per share data) Three Months Ended September 30, Nine Months Ended September 30, 2017 2016 2017 2016 Income from loans and other investments Interest and related income 146,446 $ 128,190 $ 391,787 $ 381,686 $ Less: Interest and related expenses 67,891 45,373 168,917 139,819 Income from loans and other investments, net 78,555 82,817 222,870 241,867 Other expenses Management and incentive fees 13,243 13,701 40,557 43,161 General and administrative expenses 7,419 7,414 22,219 20,990 Total other expenses 20,662 21,115 62,776 64,151 Gain on investments at fair value — 2,824 — 13,413 Income from equity investment in unconsolidated subsidiary — 2,060 — 2,192 Income before income taxes 57,893 66,586 160,094 193,321 Income tax provision 83 194 265 281 Net income 57,810 $ 66,392 $ 159,829 $ 193,040 $ Net income attributable to non-controlling interests (88) (1,598) (88) (8,119) Net income attributable to Blackstone Mortgage Trust, Inc. 57,722 $ 64,794 $ 159,741 $ 184,921 $ Per share information (basic and diluted) Weighted-average shares of common stock outstanding 95,013,087 94,071,537 95,004,188 94,067,923 Net income per share of common stock 0.61 $ 0.69 $ 1.68 $ 1.97 $ |
 Blackstone Mortgage Trust 13 Three Months Ended September 30, 2017 June 30, 2017 Net income (a) 57,722 $ 50,613 $ Weighted-average shares outstanding, basic and diluted 95,013 95,006 Earnings per share, basic and diluted 0.61 $ 0.53 $ September 30, 2017 June 30, 2017 Stockholders' equity 2,519,614 $ 2,506,473 $ Shares Class A common stock 94,828 94,828 Deferred stock units 190 182 Total outstanding 95,018 95,010 Book value per share 26.52 $ 26.38 $ Per Share Calculations (Amounts in thousands, except per share data) (a) Represents net income attributable to Blackstone Mortgage Trust, Inc. (b) Adjustment in respect of the deferral in Core Earnings of the accretion of a total $9.1 million of purchase discount attributable to a certain pool of GE portfolio loans pending the repayment of those loans Core Earnings Reconciliation Book Value per Share Earnings per Share Three Months Ended September 30, 2017 June 30, 2017 Net income (a) 57,722 $ 50,613 $ Non-cash compensation expense 5,944 5,959 GE purchase discount accretion adjustment (b) (138) (198) Other items 1,610 1,001 Core Earnings 65,138 $ 57,375 $ Weighted-average shares outstanding, basic and diluted 95,013 95,006 Core Earnings per share, basic and diluted 0.69 $ 0.60 $ |
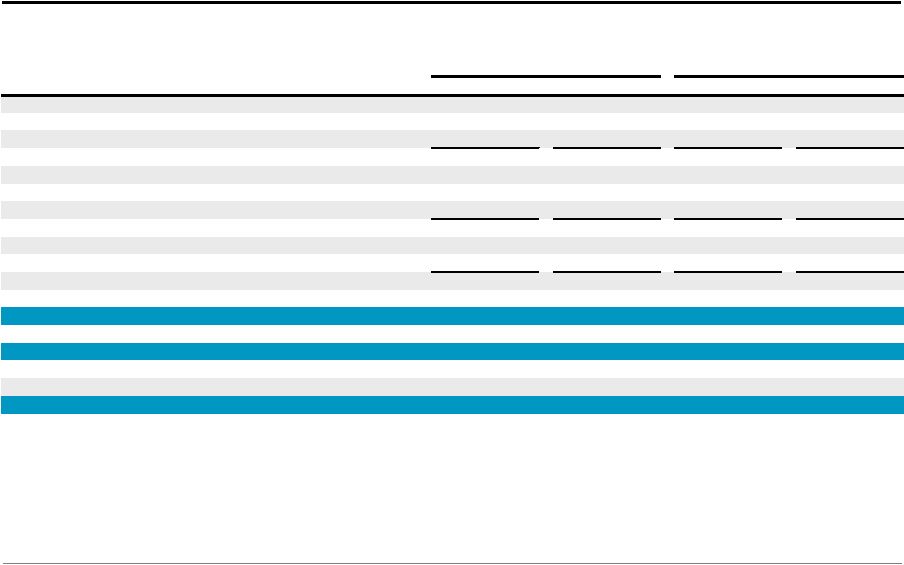
 Blackstone Mortgage Trust 14 Reconciliation of Net Income to Core Earnings (a) Represents net income attributable to Blackstone Mortgage Trust, Inc. (b) Adjustment in respect of the deferral in Core Earnings of the accretion of a total $9.1 million of purchase discount attributable to a certain pool of GE portfolio loans pending the repayment of those loans (Amounts in Thousands, Except per Share Data) Three Months Ended Dec 31, 2016 Mar 31, 2017 Jun 30, 2017 Sep 30, 2017 Net income (a) 53,375 $ 51,405 $ 50,613 $ 57,722 $ CT Legacy Portfolio net income (502) — — — Non-cash compensation expense 4,955 5,907 5,959 5,944 GE purchase discount accretion adjustment (b) (320) (216) (198) (138) Other items 742 1,024 1,001 1,610 Core Earnings 58,250 $ 58,120 $ 57,375 $ 65,138 $ Weighted-average shares outstanding, basic and diluted 94,456 94,993 95,006 95,013 Net income per share, basic and diluted 0.57 $ 0.54 $ 0.53 $ 0.61 $ Core Earnings per share, basic and diluted 0.62 $ 0.61 $ 0.60 $ 0.69 $ |
 Blackstone Mortgage Trust 15 Definitions Core Earnings: Blackstone Mortgage Trust, Inc. (“BXMT”) discloses Core Earnings, a financial measure that is calculated and presented on the basis of methodologies other than in accordance with generally accepted accounting principles in the United States of America (“GAAP”) in this presentation. Core Earnings is an adjusted measure that helps BXMT evaluate its performance excluding the effects of certain transactions and GAAP adjustments that it believes are not necessarily indicative of its current loan origination portfolio and operations. Although according to its management agreement BXMT calculates the incentive and base management fees due to its Manager using Core Earnings before incentive fees expense, beginning with the third quarter of 2015, BXMT reports Core Earnings after incentive fees expense, as BXMT believes this is a more meaningful presentation of the economic performance of its class A common stock. Core Earnings is defined as GAAP net income (loss), including realized gains and losses not otherwise included in GAAP net income (loss), and excluding (i) net income (loss) attributable to the CT Legacy Portfolio, (ii) non-cash equity compensation expense, (iii) depreciation and amortization, (iv) unrealized gains (losses), and (v) certain non-cash items. Core Earnings may also be adjusted from time to time to exclude one-time events pursuant to changes in GAAP and certain other non-cash charges as determined by BXMT’s manager, subject to approval by a majority of its independent directors. Core Earnings does not represent net income or cash generated from operating activities and should not be considered as an alternative to GAAP net income, or an indication of BXMT’s GAAP cash flows from operations, a measure of BXMT’s liquidity, or an indication of funds available for its cash needs. In addition, BXMT’s methodology for calculating Core Earnings may differ from the methodologies employed by other companies to calculate the same or similar supplemental performance measures, and accordingly, its reported Core Earnings may not be comparable to the Core Earnings reported by other companies. Non-Consolidated Senior Interests: Senior interests in loans originated and syndicated to third parties. These non-recourse loan participations constitute additional financing capacity and are included in discussions of the loan portfolio. |
 Blackstone Mortgage Trust 16 Forward-Looking Statements This presentation may contain forward-looking statements within the meaning of Section 27A of the Securities Act of 1933, as amended, and Section 21E of the Securities Exchange Act of 1934, as amended, which reflect BXMT’s current views with respect to, among other things, its operations and financial performance. You can identify these forward-looking statements by the use of words such as “outlook,” “indicator,” “believes,” “expects,” “potential,” “continues,” “may,” “will,” “should,” “seeks,” “predicts,” “intends,” “plans,” “estimates,” “anticipates” or the negative version of these words or other comparable words. Such forward- looking statements are subject to various risks and uncertainties. Accordingly, there are or will be important factors that could cause actual outcomes or results to differ materially from those indicated in these statements. BXMT believes these factors include but are not limited to those described under the section entitled “Risk Factors” in its Annual Report on Form 10-K for the fiscal year ended December 31, 2016, as such factors may be updated from time to time in its periodic filings with the Securities and Exchange Commission (“SEC”) which are accessible on the SEC’s website at www.sec.gov. These factors should not be construed as exhaustive and should be read in conjunction with the other cautionary statements that are included in this presentation and in the filings. BXMT assumes no obligation to update or supplement forward-looking statements that become untrue because of subsequent events or circumstances. |