 Blackstone Mortgage Trust, Inc. February 13, 2018 Fourth Quarter and Full Year 2017 Results Exhibit 99.2 |
 Blackstone Mortgage Trust 1 BXMT Highlights 8.2% dividend yield (b) Blackstone Real Estate platform provides expert management 100% performing loan portfolio generates current cash income Portfolio positioned for yield and value protection in changing rate environment $0.62 4Q dividend 61% Loan-to-Value (c) $11.1B senior loan portfolio 94% floating rate +$0.29 net interest income per 1% increase in LIBOR (d) $115B BX Real Estate investor capital under management $4.8B 2017 originations Expertise Income Stability Protection BXMT originated $1.2 billion of senior commercial real estate loans and grew its portfolio to $11.1 billion in 4Q, generating $0.59 of GAAP EPS and $0.65 of Core EPS (a) Stable assets financed with long- term, match-funded liabilities Information included in this presentation is as of or for the period ended December 31, 2017, unless otherwise indicated. (a) See Appendix for a definition and reconciliation to GAAP net income (b) Based on annualized dividend and BXMT closing price as of February 12, 2018 (c) Reflects LTV as of the date loans were originated or acquired by BXMT (d) Changes in interest rates and credit spreads may affect our net interest income from loans and other investments. See Appendix for important disclosures. |
 Blackstone Mortgage Trust 2 4Q originations of $1.2 billion; 2017 volume of $4.8 billion up 37% from prior year 44% of loans originated in 4Q were secured by multifamily assets Fourth Quarter and Full Year 2017 Results 94% of the portfolio is floating rate, up 5% from 2016 1.0% increase in LIBOR would increase annual net interest income by $0.29 per share (e) Earnings & Dividends Loan Originations Portfolio Composition Financing Interest Rates 4Q EPS of $0.59 and Core Earnings (a) of $0.65 per share ($2.27 and $2.55, respectively for full year 2017) Book value per share of $26.93, up $0.41 as a result of share issuance at $31.90 or 1.20x P/B Portfolio grew 14% from prior year, ending with an $11.1 billion outstanding balance (b) Weighted average origination LTV (c) of 61% $1.0 billion CLO issuance represents non-recourse, term-matched financing with an 82% advance rate and a weighted average coupon of L+1.21% Debt-to-Equity ratio (d) of 2.0x, down 0.6x quarter over quarter (a) See Appendix for a definition and reconciliation to GAAP net income (b) Includes $985 million of Non-Consolidated Senior Interests; see Appendix for definition (c) Reflects LTV as of the date loans were originated or acquired by BXMT (d) Represents (i) total outstanding secured debt agreements and convertible notes, less cash, to (ii) total equity (e) Changes in interest rates and credit spreads may affect our net interest income from loans and other investments. See Appendix for important disclosures. |
 Blackstone Mortgage Trust 3 2017 Dividend Coverage (c) 4Q GAAP earnings of $0.59 per share ($58 million) and Core Earnings (a) of $0.65 per share ($65 million) 2017 GAAP earnings of $2.27 per share ($218 million) and Core Earnings (a) of $2.55 per share ($245 million) $0.62 per share dividend equates to an 8.2% dividend yield (b) (a) See Appendix for a definition and reconciliation to GAAP net income (b) Based on annualized dividend and BXMT closing price as of February 12, 2018 (c) GAAP EPS of $0.54, $0.53, $0.61 and $0.59 as of 1Q’17, 2Q’17, 3Q’17 and 4Q’17, respectively Book Value Per Share Growth $0.62 Quarterly Dividend 103% Dividend Coverage 9.2% Accretion $0.61 $0.60 $0.69 $0.65 1Q'17 2Q'17 3Q'17 4Q'17 $24.67 $26.93 Re-IPO 2Q'13 4Q'17 Core Earnings Per Share Dividends Per Share Earnings & Dividends |
 Blackstone Mortgage Trust 4 100% floating rate, senior loans Weighted average LTV (a) of 62% 22% multifamily; 0% retail (a) Reflects LTV as of the date loans were originated or acquired by BXMT (b) Excludes loans originated in the BXMT-Walker & Dunlop joint venture Large loans: $142 million avg. size (b) ($ in billions) Origination Growth 2017 Originations $3.5 $4.8 37% YoY growth Office Multi Hotel Retail Other 2016 Originations 2017 Originations Loan Originations Originated $1.2 billion in 4Q bringing total 2017 originations to $4.8 billion, up 37% from prior year Portfolio growth of $1.2 billion, including $486 million of fundings under previously originated commitments in 2017 |
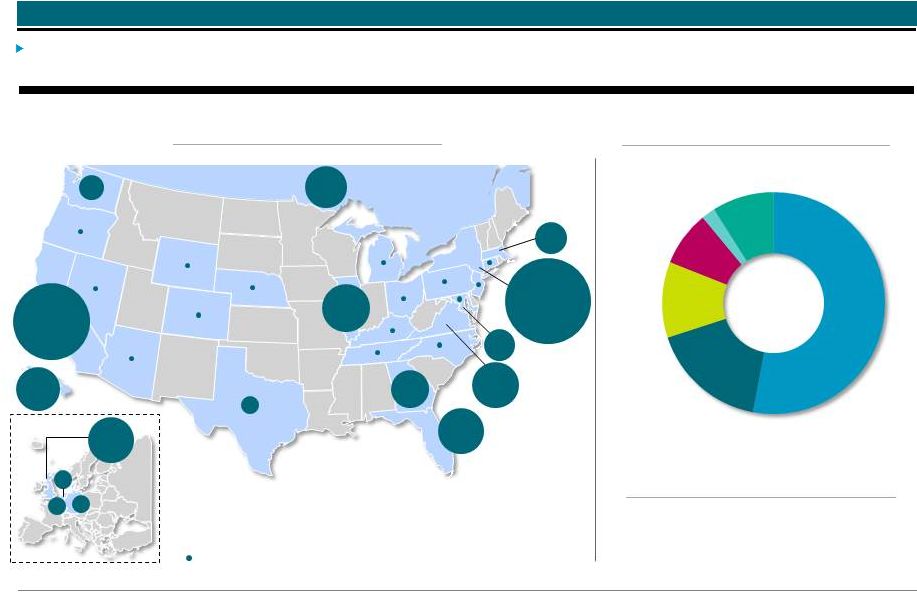 Blackstone Mortgage Trust 5 Portfolio Composition $11.1 billion portfolio comprising 110 senior loans secured by institutional quality real estate concentrated in major markets; 63% of loans secured by assets located in coastal markets Office Retail Hotel Condo Other Multi Geographic Diversification (a) Collateral Diversification (a) Weighted Average LTV (b) 61% TX 1% $11.1B portfolio CA 19% BE 1% NL 1% DEU 1% UK 7% States that comprise less than 1% of total loan portfolio CAN 4% IL 8% GA 4% FL 7% VA 7% DC 3% NY 22% MA 3% WA 2% 53% 17% 11% 8% 2% 9% (a) In certain instances, we finance our loans through the non-recourse sale of a senior loan interest that is not included in our consolidated financial statements. See Note 2 in our Form 10-K for further discussion. Total loan exposure encompasses the entire loan we originated and financed, including $985 million of such Non-Consolidated Senior Interests as of December 31, 2017. (b) Reflects LTV as of the date loans were originated or acquired by BXMT HI 5% |
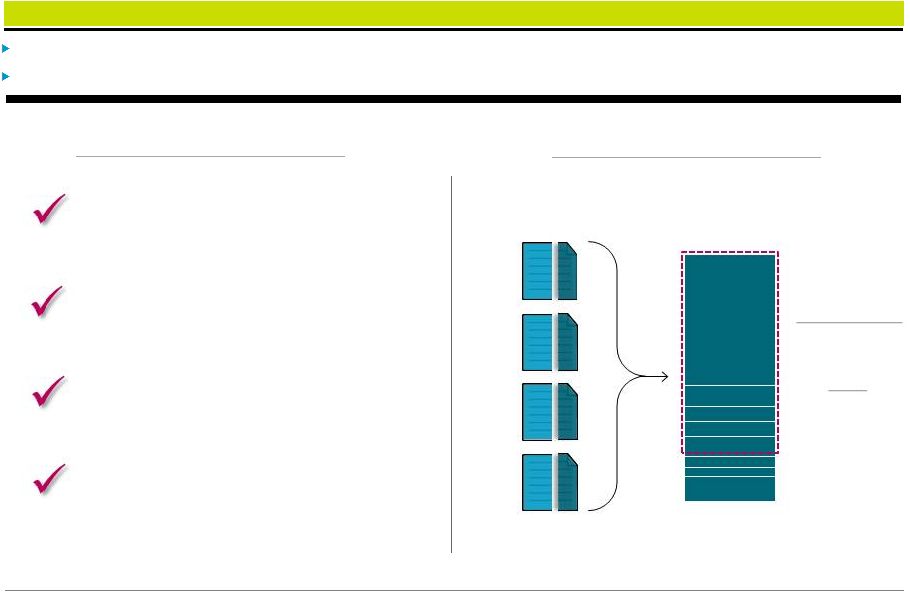 Blackstone Mortgage Trust 6 Financing Closed $1.0 billion collateralized loan obligation (CLO), the largest commercial real estate CLO issued post financial crisis Innovative structural features maximize economic efficiency and maintain asset management flexibility BXMT 2017-FL1 (b) Structure $3.4B Total Loans $1.0B CLO Securitization 31 No. of Loans 31 Pari Passu A2 Participations Finances $1.0 billion of BXMT originated senior mortgages Non-recourse Non-MTM (a) term financing Innovative structural flexibility Highlights $817M Notes Sold 82% Advance Rate L+1.21% Average Coupon NR $100 B- $38 BB- $45 BBB- $83 A- $59 AA- $61 AAA $85 AAA $530 A1 A1 A1 A1 A2 A2 A2 A2 (a) Mark to market (b) This information is not intended to, and does not constitute, represent or form part of any offer, invitation or solicitation of any offer to purchase, or otherwise acquire, subscribe for, sell or otherwise dispose of, any securities |
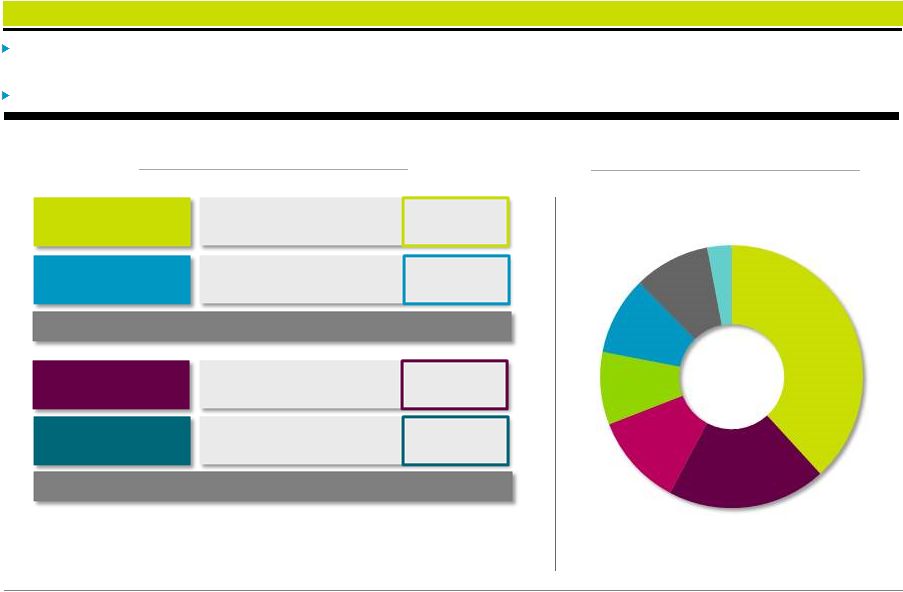 Blackstone Mortgage Trust 7 Financing Grew capacity by $4.2 billion in 2017 through diversified funding sources including new credit facilities, upsizes of existing facilities, BXMT’s first CLO and large loan securitization, convertible debt issuances, and issuance of common stock Total asset-level financing capacity of $10.9 billion was 70% utilized at quarter end Financing (a) In addition to $33 million of loan participations sold, includes $985 million of Non-Consolidated Senior Interests, which result from non-recourse sales of senior loan interests in loans BXMT originates. BXMT’s net investments in these loans are reflected in the form of mezzanine or other subordinate loans on BXMT’s balance sheet. (b) Represents (i) total outstanding secured debt agreements and convertible notes, less cash, to (ii) total equity $4.2B 2017 New Capital Sources 2.0x Debt-to-Equity Ratio (b) $5.8 $8.1 Credit Facilities $1,600 Secured Facility $125 Total Leverage Senior Loan Interests (a) Securitized Debt Corporate Obligations Corporate Debt Credit Facilities 10 Credit Providers Convertible Notes and Secured Facility Senior Syndications $5.3 $0.6 $1.0 $1.3 CLO and Single Asset Securitization CLO $818 A-note $375 Convert $403 Common Equity $392 ($ in billions, outstanding balance) ($ in millions, except as noted otherwise) Securitization $475 |
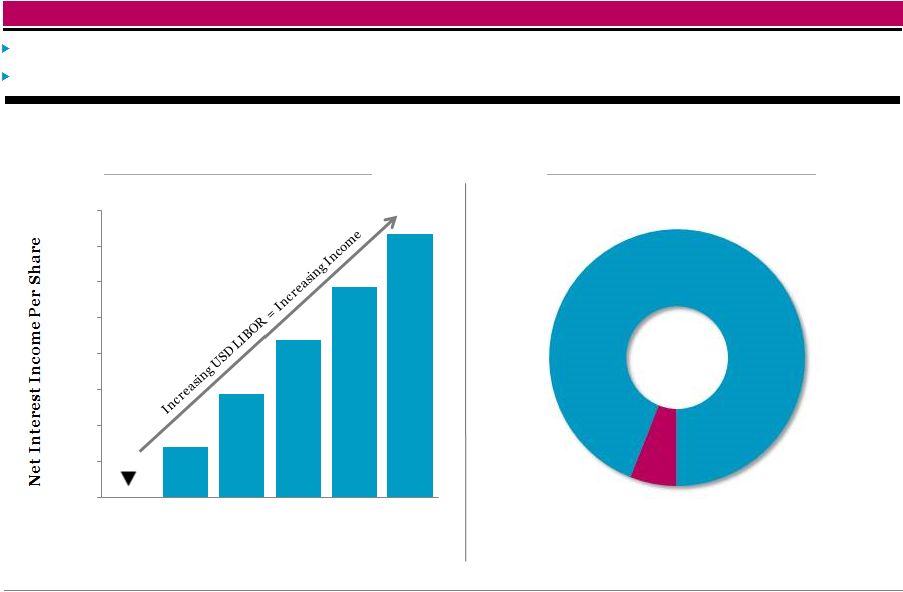 Blackstone Mortgage Trust 8 Interest Rates Core Earnings are positively correlated to changes in LIBOR, the benchmark index for 94% of BXMT’s loans A 1.0% increase in USD LIBOR would increase net interest income per share by $0.29 per annum (a) Portfolio Income Sensitivity to USD LIBOR (a) (Annual Dollars of Net Interest Income Per Share) Portfolio Fixed vs. Floating (% of Total Loan Exposure) Fixed $0.00 $0.10 $0.20 $0.30 $0.40 $0.50 $0.60 $0.70 $0.80 1.56% 2.06% 2.56% 3.06% 3.56% 4.06% Floating Fixed 6% 94% USD LIBOR (a) Changes in interest rates and credit spreads may affect our net interest income from loans and other investments. See Appendix for important disclosures. |
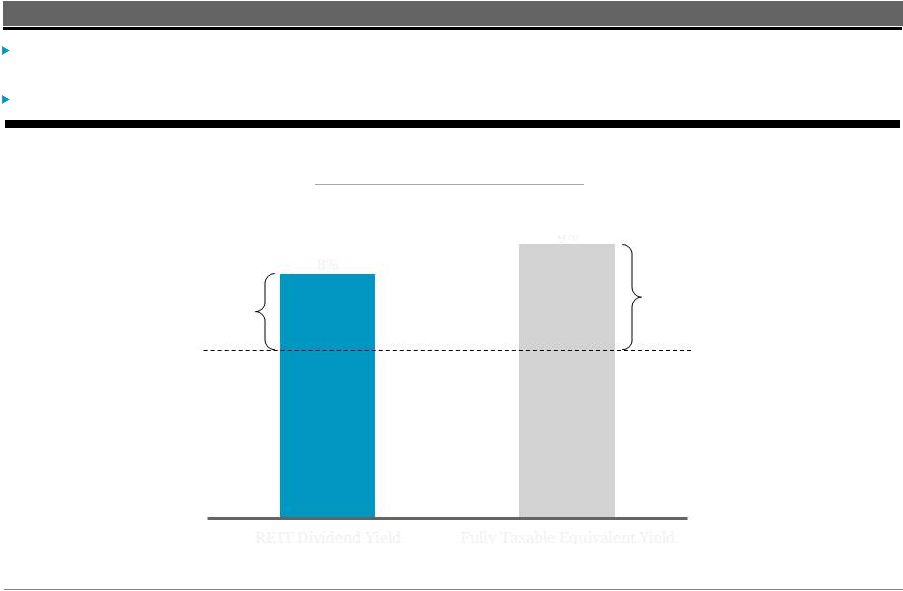 Blackstone Mortgage Trust 9 Tax Reform The Tax Cuts and Jobs Act of 2017 includes provisions entitling individual recipients of REIT dividends to a 20% deduction on ordinary dividends, effectively reducing the maximum individual tax rate on REIT dividends from 37.0% to 29.6% (a) An 8% REIT dividend results in an after-tax yield equivalent to a 9% bond yield for individual investors Tax Reform Impact Illustration After-Tax Yield 29.6% Max. Tax Rate 37.0% Max. Tax Rate (a) This does not constitute tax advice to, and should not be relied upon by, potential investors, who should consult their own tax advisors regarding the matters discussed herein and the tax consequences of an investment in BXMT. This presentation is included for illustration purposes only. The dividend yields included herein are not guaranteed and are not reflective of BXMT’s historical performance. 8% 9% REIT Dividend Yield Fully Taxable Equivalent Yield |
 Appendix |
 Blackstone Mortgage Trust 11 3Q'17 Loans Outstanding Fundings Repayments 4Q'17 Loans Outstanding GAAP Net Income Adjustments Core Earnings Interest Income 146.1 $ (0.5) $ 145.6 $ Interest Expense (66.0) 0.5 (65.5) Management and Incentive Fees (14.3) — (14.3) G&A / Other (1.5) 0.4 (1.1) Non-Cash Compensation (6.2) 6.2 — Net income attributable to non-controlling interests (0.2) — (0.2) Total 57.9 $ 6.6 $ 64.5 $ Appendix – Fourth Quarter 2017 Operating Results & Net Funding $420 million (b) Net Fundings Net Funding ($ in billions) Operating Results ($ in millions) $10.7 $1.3 $(0.9) $11.1 $0.65 Core Earnings Per Share $0.59 Net Income Per Share (a) (a) (a) Includes $988 million and $985 million of Non-Consolidated Senior Interests as of September 30, 2017 and December 31, 2017, respectively; see Appendix for definition (b) Excludes the impact of changes in foreign currency rates and hedges for non-USD loans and financings |
 Blackstone Mortgage Trust 12 (a) Date loan was originated or acquired by BXMT, and the LTV as of such date (b) In certain instances, loans are financed through the non-recourse sale of a senior loan interest that is not included in the consolidated financial statements. As of December 31, 2017, three loans in the portfolio have been financed with an aggregate $985 million of Non-Consolidated Senior Interests, which are included in the table above. (c) Maximum maturity assumes all extension options are exercised; however, floating rate loans generally may be repaid prior to their final maturity without penalty (d) Consists of both floating and fixed rates. Coupon and all-in yield assume applicable floating benchmark rates for weighted-average calculation. Loan Portfolio Details ($ in millions) Loan Type Origination Date (a) Total Loan (b) Principal Balance (b) Net Book Value Cash Coupon All-In Yield Maximum Maturity (c) Location Property Type Loan Per SQFT / Unit / Key Origination LTV (a) Loan 1 Senior Loan 5/11/2017 753 $ 656 $ 653 $ L + 3.40% L + 3.60% 6/10/2023 Northern Virginia Office 321 / sqft 62% Loan 2 Senior Loan (b) 5/15/2015 590 545 92 L + 4.25% L + 4.69% 5/15/2020 Miami Retail 691 / sqft 36% Loan 3 Senior Loan (b) 8/6/2015 499 499 91 4.49% 5.82% 10/29/2022 Diversified - EUR Other n/a 71% Loan 4 Senior Loan 1/7/2015 315 295 294 L + 3.50% L + 3.71% 1/9/2021 New York Office 252 / sqft 53% Loan 5 Senior Loan 5/1/2015 320 295 294 L + 3.45% L + 3.83% 5/1/2020 New York Office 375 / sqft 68% Loan 6 Senior Loan 3/31/2017 258 242 240 L + 4.15% L + 4.54% 4/9/2022 Maui Hotel 318,182 / key 75% Loan 7 Senior Loan 6/4/2015 230 230 232 L + 4.20% L + 4.22% 3/18/2021 Diversified - CAN Hotel 38,623 / key 54% Loan 8 Senior Loan 12/22/2017 225 225 223 L + 2.80% L + 3.16% 1/9/2023 Chicago Multi 326,087 / unit 65% Loan 9 Senior Loan 6/23/2015 222 215 215 L + 3.65% L + 3.98% 5/8/2022 Washington DC Office 241 / sqft 72% Loan 10 Senior Loan 2/25/2014 210 210 209 L + 4.25% L + 4.70% 3/9/2021 Diversified - US Hotel 110,352 / key 58% Loan 11 Senior Loan 8/3/2016 276 200 198 L + 4.66% L + 5.22% 8/9/2021 New York Office 275 / sqft 57% Loan 12 Senior Loan 8/19/2016 200 190 190 L + 3.64% L + 4.10% 9/9/2021 New York Office 580 / sqft 69% Loan 13 Senior Loan 4/15/2016 200 189 188 L + 4.25% L + 4.86% 5/9/2021 New York Office 176 / sqft 40% Loan 14 Senior Loan 12/22/2016 205 175 174 L + 3.50% L + 4.07% 1/9/2022 New York Office 246 / sqft 66% Loan 15 Senior Loan 8/17/2016 187 169 168 L + 3.75% L + 4.13% 9/9/2021 San Francisco Office 498 / sqft 65% Loans 16-110 Senior Loans Various 8,016 6,759 6,596 5.47% (d) 5.88% (d) Various Various Various Various 62% Total/Wtd. Avg. 12,706 $ 11,094 $ 10,057 $ 5.38% 5.83% 3.5 years 61% |
 Blackstone Mortgage Trust 13 December 31, 2017 December 31, 2016 Assets Cash and cash equivalents 69,654 $ 75,567 $ Restricted Cash 32,864 — Loans receivable, net 10,056,732 8,692,978 Other assets 99,575 44,070 Total assets 10,258,825 $ 8,812,615 $ Liabilities and equity Secured debt agreements, net 5,273,855 $ 5,716,354 $ Loan participations sold, net 80,415 348,077 Securitized debt obligations, net 1,282,412 — Convertible notes, net 563,911 166,762 Other liabilities 140,826 87,819 Total liabilities 7,341,419 6,319,012 Commitments and contingencies — — Equity Class A common stock, $0.01 par value 1,079 945 Additional paid-in capital 3,506,861 3,089,997 Accumulated other comprehensive loss (29,706) (56,202) Accumulated deficit (567,168) (541,137) Total Blackstone Mortgage Trust, Inc. stockholders' equity 2,911,066 2,493,603 Non-controlling interests 6,340 — Total equity 2,917,406 2,493,603 Total liabilities and equity 10,258,825 $ 8,812,615 $ Consolidated Balance Sheets ($ in thousands, except per share data) |
 Blackstone Mortgage Trust 14 Consolidated Statements of Operations ($ in thousands, except per share data) Three Months Ended December 31, Year Ended December 31, 2017 2016 2017 2016 Income from loans and other investments Interest and related income 146,127 $ 116,288 $ 537,915 $ 497,974 $ Less: Interest and related expenses 65,953 44,451 234,870 184,270 Income from loans and other investments, net 80,174 71,837 303,045 313,704 Other expenses Management and incentive fees 14,284 12,798 54,841 55,959 General and administrative expenses 7,702 6,726 29,922 27,716 Total other expenses 21,986 19,524 84,763 83,675 Gain on investments at fair value — 6 — 13,420 Income from equity investment in unconsolidated subsidiary — 995 — 3,187 Income before income taxes 58,188 53,314 218,282 246,636 Income tax provision (benefit) 48 (85) 314 196 Net income 58,140 $ 53,399 $ 217,968 $ 246,440 $ Net income attributable to non-controlling interests (249) (24) (337) (8,143) Net income attributable to Blackstone Mortgage Trust, Inc. 57,891 $ 53,375 $ 217,631 $ 238,297 $ Per share information (basic and diluted) Weighted-average shares of common stock outstanding 98,810,617 94,455,518 95,963,616 94,165,351 Net income per share of common stock 0.59 $ 0.57 $ 2.27 $ 2.53 $ |
 Blackstone Mortgage Trust 15 Per Share Calculations (Amounts in thousands, except per share data) (a) Represents net income attributable to Blackstone Mortgage Trust, Inc. (b) Adjustment in respect of the deferral in Core Earnings of the accretion of a total $9.1 million of purchase discount attributable to a certain pool of GE portfolio loans pending the repayment of those loans Core Earnings Reconciliation Three Months Ended December 31, 2017 September 30, 2017 Net income (a) 57,891 $ 57,722 $ Non-cash compensation expense 6,221 5,944 GE purchase discount accretion adjustment (b) (483) (138) Other items 874 1,610 Core Earnings 64,503 $ 65,138 $ Weighted-average shares outstanding, basic and diluted 98,811 95,013 Core Earnings per share, basic and diluted 0.65 $ 0.69 $ Three Months Ended December 31, 2017 September 30, 2017 Net income (a) 57,891 $ 57,722 $ Weighted-average shares outstanding, basic and diluted 98,811 95,013 Earnings per share, basic and diluted 0.59 $ 0.61 $ December 31, 2017 September 30, 2017 Stockholders‘ equity 2,911,066 $ 2,519,614 $ Shares Class A common stock 107,884 94,828 Deferred stock units 197 190 Total outstanding 108,081 95,018 Book value per share 26.93 $ 26.52 $ Book Value per Share Earnings per Share |
 Blackstone Mortgage Trust 16 Reconciliation of Net Income to Core Earnings (a) Represents net income attributable to Blackstone Mortgage Trust, Inc. (b) Adjustment in respect of the deferral in Core Earnings of the accretion of a total $9.1 million of purchase discount attributable to a certain pool of GE portfolio loans pending the repayment of those loans (Amounts in thousands, except per share data) Mar 31, 2017 Jun 30, 2017 Sep 30, 2017 Dec 31, 2017 Net income (a) 51,405 $ 50,613 $ 57,722 $ 57,891 $ Non-cash compensation expense 5,907 5,959 5,944 6,221 GE purchase discount accretion adjustment (b) (216) (198) (138) (483) Other items 1,024 1,001 1,610 874 Core Earnings 58,120 $ 57,375 $ 65,138 $ 64,503 $ Weighted-average shares outstanding, basic and diluted 94,993 95,006 95,013 98,811 Net income per share, basic and diluted 0.54 $ 0.53 $ 0.61 $ 0.59 $ Core Earnings per share, basic and diluted 0.61 $ 0.60 $ 0.69 $ 0.65 $ |
 Blackstone Mortgage Trust 17 Definitions Core Earnings: Blackstone Mortgage Trust, Inc. (“BXMT”) discloses Core Earnings in this presentation. Core Earnings is a financial measure that is calculated and presented on the basis of methodologies other than in accordance with generally accepted accounting principles in the United States of America (“GAAP”). Core Earnings is an adjusted measure that helps BXMT evaluate its performance excluding the effects of certain transactions and GAAP adjustments that it believes are not necessarily indicative of its current loan origination portfolio and operations. Although according to its management agreement BXMT calculates the incentive and base management fees due to its Manager using Core Earnings before incentive fees expense, BXMT reports Core Earnings after incentive fees expense, as BXMT believes this is a more meaningful presentation of the economic performance of its class A common stock. Core Earnings is defined as GAAP net income (loss), including realized gains and losses not otherwise included in GAAP net income (loss), and excluding (i) net income (loss) attributable to the CT Legacy Portfolio, (ii) non-cash equity compensation expense, (iii) depreciation and amortization, (iv) unrealized gains (losses), and (v) certain non-cash items. Core Earnings may also be adjusted from time to time to exclude one-time events pursuant to changes in GAAP and certain other non-cash charges as determined by BXMT’s manager, subject to approval by a majority of its independent directors. Core Earnings does not represent net income or cash generated from operating activities and should not be considered as an alternative to GAAP net income, or an indication of BXMT’s GAAP cash flows from operations, a measure of BXMT’s liquidity, or an indication of funds available for its cash needs. In addition, BXMT’s methodology for calculating Core Earnings may differ from the methodologies employed by other companies to calculate the same or similar supplemental performance measures, and accordingly, its reported Core Earnings may not be comparable to the Core Earnings reported by other companies. Non-Consolidated Senior Interests: Senior interests in loans originated and syndicated to third parties. These non-recourse loan participations, which are excluded from the GAAP balance sheet, constitute additional financing capacity and are included in discussions of the loan portfolio. Net Interest Income Sensitivity to LIBOR: Reflects the impact on net interest income, assuming no changes in credit spreads, portfolio composition, or asset performance. Excludes other components of net income, such as management and incentive fees, which ultimately impact earnings and dividends per share. |
 Blackstone Mortgage Trust 18 Forward-Looking Statements This presentation may contain forward-looking statements within the meaning of Section 27A of the Securities Act of 1933, as amended, and Section 21E of the Securities Exchange Act of 1934, as amended, which reflect BXMT’s current views with respect to, among other things, its operations and financial performance. You can identify these forward-looking statements by the use of words such as “outlook,” “indicator,” “believes,” “expects,” “potential,” “continues,” “may,” “will,” “should,” “seeks,” “predicts,” “intends,” “plans,” “estimates,” “anticipates” or the negative version of these words or other comparable words. Such forward- looking statements are subject to various risks and uncertainties. Accordingly, there are or will be important factors that could cause actual outcomes or results to differ materially from those indicated in these statements. BXMT believes these factors include but are not limited to those described under the section entitled “Risk Factors” in its Annual Report on Form 10-K for the fiscal year ended December 31, 2017, as such factors may be updated from time to time in its periodic filings with the Securities and Exchange Commission (“SEC”) which are accessible on the SEC’s website at www.sec.gov. These factors should not be construed as exhaustive and should be read in conjunction with the other cautionary statements that are included in this presentation and in the filings. BXMT assumes no obligation to update or supplement forward-looking statements that become untrue because of subsequent events or circumstances. |