 Blackstone Mortgage Trust, Inc. February 12, 2019 Fourth Quarter and Full Year 2018 Results Exhibit 99.2 |
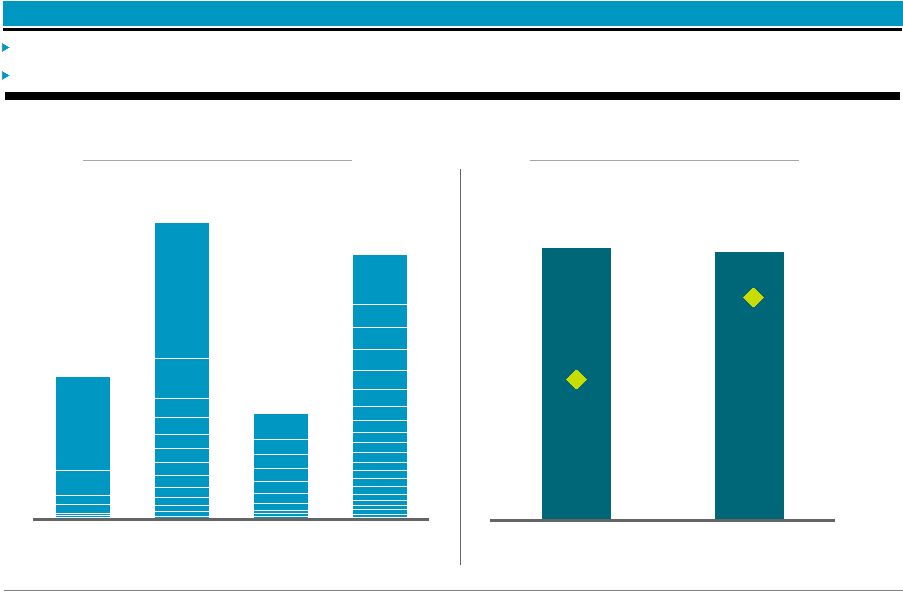
 Blackstone Mortgage Trust 1 $11.1 $15.8 YE 2017 YE 2018 BXMT Highlights Information included in this presentation is as of or for the period ended December 31, 2018, unless otherwise indicated. (a) See Appendix for a definition and reconciliation to GAAP net income. (b) Based on annualized dividend and BXMT closing price as of February 11, 2019. (c) Reflects ratio of Core Earnings to dividends declared. (d) Reflects weighted average LTV as of the date investments were originated or acquired by BXMT. (e) Includes $447 million of Non-Consolidated Senior Interests and investment exposure to the $1.0 billion 2018 Single Asset Securitization through a $99 million subordinate risk retention interest. +42% ($ in billions) Portfolio Growth (e) 2018 Dividend Coverage 117% 7.2% 100% 62% Performing Loans Loan-to-Value (d)(e) (c) Dividend Yield (b) BXMT generated 4Q EPS of $0.61 and Core EPS (a) of $0.69 through continued growth in its first mortgage origination business; 2018 full year EPS of $2.50, Core EPS of $2.90 and dividends paid of $2.48 per share |
 Blackstone Mortgage Trust 2 4Q originations of $3.5 billion across 21 transactions (b) Originated 52 loans (b) in 2018 resulting in record volume of $10.7 billion, with a weighted average origination LTV (c) of 61% 4Q EPS of $0.61 and Core Earnings (a) per share of $0.69 ($2.50 and $2.90, respectively for full year 2018) Book value per share of $27.20, up $0.27 in 2018; paid $0.62 per share dividend Fourth Quarter and Full Year 2018 Results Portfolio grew 42% in 2018 to $15.8 billion (d) 100% performing portfolio with a weighted average origination LTV (c)(d) of 62% Sourced new credit capacity of $3.0 billion in the quarter and $6.5 billion in 2018 Issued 14.6 million shares at an average 1.22x P/B in 2018, generating $483 million of gross proceeds (a) See Appendix for a definition and reconciliation to GAAP net income. (b) Excluding upsizes. (c) Reflects weighted average LTV as of the date investments were originated or acquired by BXMT. (d) Includes $447 million of Non-Consolidated Senior Interests and investment exposure to the $1.0 billion 2018 Single Asset Securitization through a $99 million subordinate risk retention interest. 96% of the portfolio (d) is floating rate Floating rate assets and matched liabilities support book value and earnings stability Earnings & Dividends Originations Portfolio Composition Capitalization Interest Rates |
 Blackstone Mortgage Trust 3 $2.48 $0.42 $24.67 $27.20 Re-IPO 2Q'13 4Q'18 Earnings & Dividends Earnings & Dividends 4Q GAAP EPS of $0.61 and Core Earnings (a) of $0.69 per share, $0.62 per share dividend equates to a 7.2% dividend yield (b) Earnings in excess of quarterly dividends enhanced book value per share, which has grown 10% since 2013 re-IPO (a) See Appendix for a definition and reconciliation to GAAP net income. (b) Based on annualized dividend and BXMT closing price as of February 11, 2019. (c) 2018 GAAP EPS was $2.50; retained Core Earnings refers to the amount of Core Earnings in excess of dividends paid for the periods presented. $0.62 Quarterly Dividend +10% Dividends Paid Retained Core Earnings Book Value Per Share Growth 2018 Core Earnings Per Share (c) 117% 2018 Dividend Coverage |
 Blackstone Mortgage Trust 4 Originations Originations Origination volume grew to $3.5 billion in 4Q and $10.7 billion in 2018 while maintaining a consistent credit profile Originations were driven by an increase in both large loans and more granular deal flow ($ in billions) Origination LTV and Volume (b) Origination Volume and Deal Count (a) Excluding upsizes. (b) Reflects weighted average LTV as of the date investments were originated or acquired by BXMT. 62% 61% 2017 2018 $4.8 $10.7 $1.9 $3.9 $1.4 $3.5 1Q 2018 2Q 2018 3Q 2018 4Q 2018 21 10 14 7 Deal Count (a) |
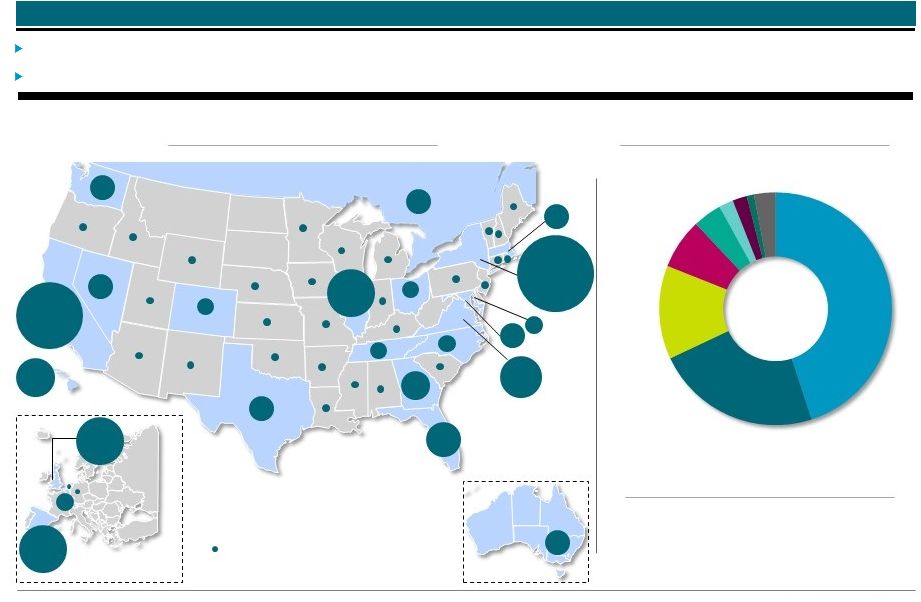 Blackstone Mortgage Trust 5 Portfolio Composition $15.8 billion portfolio (a) comprising 126 assets secured by institutional quality real estate, with 71% in gateway markets High quality 100% performing portfolio with low weighted average LTV (a)(b) of 62% Major Market Focus (a) Collateral Diversification (a) (a) Includes $447 million of Non-Consolidated Senior Interests and investment exposure to the $1.0 billion 2018 Single Asset Securitization through a $99 million subordinate risk retention interest. (b) Reflects weighted average LTV as of the date investments were originated or acquired by BXMT. Weighted Average LTV (a)(b) 62% States that comprise less than 1% of total portfolio BE IL 7% CAN GA 3% HI 5% VA 6% CA 16% MD MA 2% FL 4% NY 25% ES 7% UK 7% DC 2% NV 2% TX 2% WA 2% 2% CO 1% 1% NC 1% OH 1% TN 1% 1% AU 2% 1% Condo Self-Storage Retail Industrial Spanish Assets Multi $15.8B portfolio Office 23% 13% 7% 4% 2% 2% 3% 45% Other |
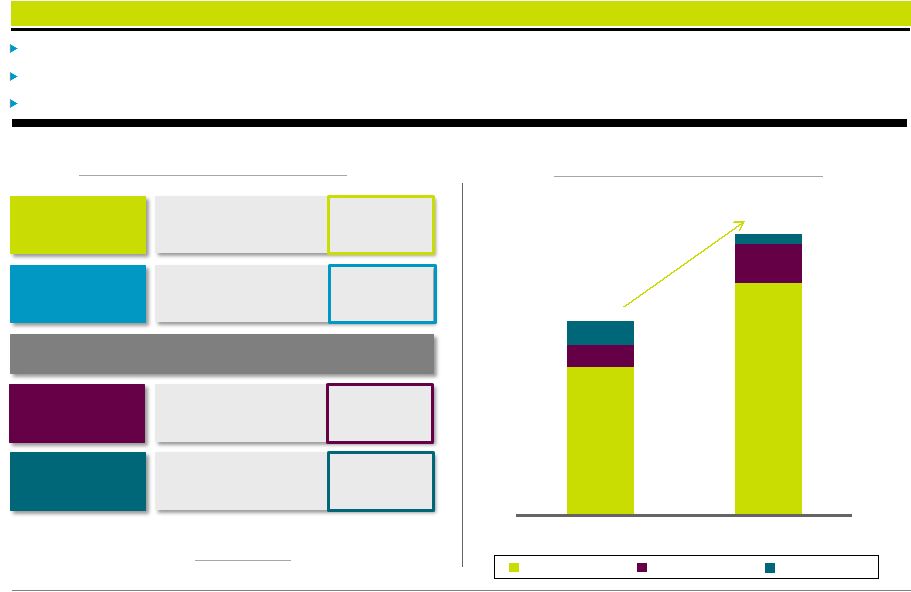 Blackstone Mortgage Trust 6 $8.6 $13.6 $1.3 $2.2 $1.4 $0.6 2017 2018 Capitalization $2.9 billion of net credit capacity growth across 6 credit facilities during the quarter Asset-level financing increased in step with net portfolio growth totaling $5.1 billion of net capacity growth in 2018 Total asset-level financing capacity of $16.4 billion was 72% utilized at quarter-end Credit Capacity Growth (a) Includes $1.3 billion of consolidated securitized debt obligations as well as $0.9 billion of securitized debt held by third-parties in the $1.0 billion 2018 Single Asset Securitization, which is not consolidated on BXMT’s balance sheet. Refer to our consolidated financial statements for further discussion of the subordinated risk retention interest related to the 2018 Single Asset Securitization. (b) Includes $95 million of loan participations sold and $447 million of Non-Consolidated Senior Interests, which result from non-recourse sales of senior loan interests in loans BXMT originates. BXMT’s net investments in these loans are reflected in the form of mezzanine or other subordinate loans on BXMT’s balance sheet. (c) Represents (i) total outstanding secured debt agreements and convertible notes, less cash, to (ii) total equity. 2.8x Debt-to-Equity Ratio (c) Financing (Outstanding Balance) +45% $16.4 $11.3 ($ in billions) Credit Facilities Syndications Securitizations Convertible Notes and Secured Facility CLO and Single Asset Securitizations Senior Syndications 11 Credit Providers $9.0 $0.6 $0.5 $2.2 Corporate Obligations Corporate Obligations Credit Facilities Corporate Debt Securitized Debt (a) Senior Loan Interests (b) $9.6 |
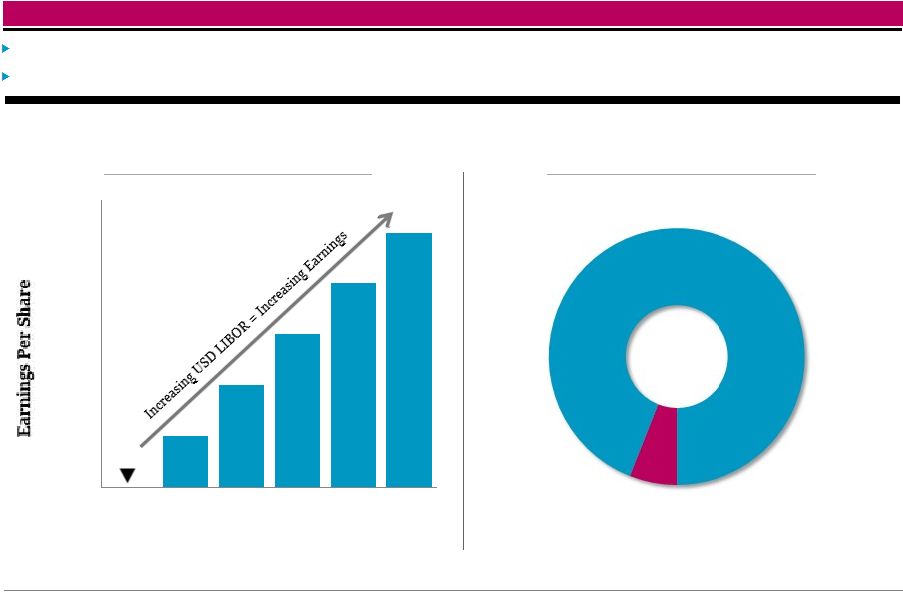 Blackstone Mortgage Trust 7 4% 96% Interest Rates 96% of the portfolio (a) is floating rate A 1.0% increase in USD LIBOR would increase earnings per share by $0.21 per annum (b) (a) Includes $447 million of Non-Consolidated Senior Interests and investment exposure to the $1.0 billion 2018 Single Asset Securitization through a $99 million subordinate risk retention interest. (b) Changes in interest rates and credit spreads may affect our net interest income from loans and other investments. Reflects impact on net income, net of incentive fees. See Appendix for important disclosures. Earnings Sensitivity to USD LIBOR (b) (Annual Dollars of Earnings per Share) USD LIBOR Portfolio Fixed vs. Floating (a) (% of Total Portfolio Exposure) Floating Fixed $0.00 $0.10 $0.20 $0.30 $0.40 $0.50 $0.60 2.50% 3.00% 3.50% 4.00% 4.50% 5.00% |
 Appendix |
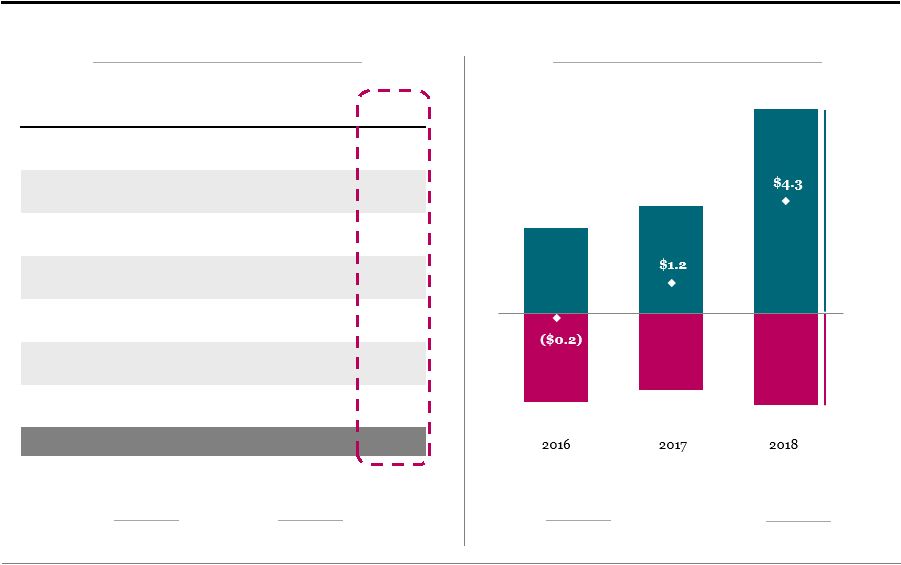 Blackstone Mortgage Trust 9 GAAP Net Income Adjustments Core Earnings Interest Income 206.1 $ $— 206.1 $ Interest Expense (103.9) 0.4 (103.5) Management and Incentive Fees (18.6) — (18.6) General and Administrative Expenses (2.0) — (2.0) Non-Cash Compensation (7.7) 7.7 — Realized Foreign Currency Gain, net (a) — 1.9 1.9 Net Income Attributable to Non-controlling Interests (0.3) — (0.3) Total 73.6 $ 10.0 $ 83.6 $ Appendix – Fourth Quarter and Full Year 2018 Operating Results & Net Fundings $4.3 billion 2018 Net Fundings Net Fundings (b) ($ in billions) Operating Results ($ in millions) (a) Primarily represents the forward points earned on our foreign currency forward contracts, which reflect the interest rate differentials between the applicable base rate for our foreign currency investments and USD LIBOR. These forward contracts effectively convert the rate exposure to USD LIBOR, resulting in additional interest income earned in U.S. dollar terms. These amounts are not included in GAAP net income, but rather as a component of Other Comprehensive Income in our consolidated financial statements. (b) Excludes the impact of changes in foreign currency rates and related hedges for non-USD investments. $0.69 Core Earnings per Share $0.61 Net Income per Share $2.1 billion 4Q’18 Net Fundings Fundings Repayments |
 Blackstone Mortgage Trust 10 (a) Date loan was originated or acquired by BXMT, and the LTV as of such date. (b) In certain instances, loans are financed through the non-recourse sale of a senior loan interest that is not included in the consolidated financial statements. As of December 31, 2018, three loans in the portfolio have been financed with an aggregate $447 million of Non-Consolidated Senior Interests, which are included in the table above. (c) Portfolio excludes our $99 million subordinate risk retention interest in the $1.0 billion 2018 Single Asset Securitization. (d) Maximum maturity assumes all extension options are exercised; however, floating rate loans generally may be repaid prior to their final maturity without penalty. (e) Consists of both floating and fixed rates. Coupon and all-in yield assume applicable floating benchmark rates for weighted-average calculation. Portfolio Details ($ in millions) Origination Total Principal Net Book Maximum Property Loan Per Origination Loan Type Date (a) Loan (b)(c) Balance (b)(c) Value Maturity (d) Location Type SQFT / Unit / Key LTV (a) Loan 1 Senior loan 3/22/2018 $ 1,131 $ 1,131 $ 1,124 L + 3.15 % L + 3.40 % 3/15/2023 Diversified - Spain Spanish Assets n/a 71 % Loan 2 Senior loan 5/11/2017 753 682 679 L + 3.40 % L + 3.60 % 6/10/2023 Washington DC Office 334 / sqft 62 % Loan 3 Senior loan (b) 8/6/2015 471 471 86 5.75 % 5.82 % 10/29/2022 Diversified - EUR Other n/a 71 % Loan 4 Senior loan 5/1/2015 355 342 342 L + 2.85 % L + 3.02 % 5/1/2023 New York Office 434 / sqft 68 % Loan 5 Senior loan 2/13/2018 330 322 322 L + 3.42 % L + 3.52 % 3/9/2023 New York Multi 780,386 / unit 62 % Loan 6 Senior loan 1/7/2015 350 317 316 L + 2.50 % L + 2.76 % 1/9/2021 New York Office 272 / sqft 53 % Loan 7 Senior loan 10/23/2018 352 313 310 L + 3.40 % L + 3.72 % 10/23/2021 New York Mixed-Use 284 / sqft 65 % Loan 8 Senior loan 3/31/2017 339 286 283 L + 3.50 % L + 3.88 % 8/9/2023 Maui Hotel 377,099 / key 61 % Loan 9 Senior loan 11/30/2018 291 274 272 L + 2.83 % L + 3.20 % 12/9/2023 New York Hotel 224,555 / key 73 % Loan 10 Senior loan 11/30/2018 254 247 245 L + 2.80 % L + 3.17 % 12/9/2023 San Francisco Hotel 363,291 / key 73 % Loan 11 Senior loan 12/11/2018 310 241 238 L + 2.55 % L + 2.96 % 12/9/2023 Chicago Office 203 / sqft 78 % Loan 12 Senior loan 8/3/2016 276 233 233 L + 4.66 % L + 5.29 % 8/9/2021 New York Office 321 / sqft 57 % Loan 13 Senior loan 12/22/2017 225 225 224 L + 2.80 % L + 3.16 % 1/9/2023 Chicago Multi 326,087 / unit 65 % Loan 14 Senior loan 5/9/2018 219 219 218 L + 3.00 % L + 3.24 % 5/9/2023 New York Industrial 62 / sqft 70 % Loan 15 Senior loan 6/23/2015 220 213 213 L + 3.65 % L + 3.78 % 5/8/2022 Washington DC Office 239 / sqft 72 % Loans 16 - 125 Senior loans Various 12,340 9,222 9,088 5.91 % (e) 6.26 % (e) Various Various Various Various 62 % Total/Wtd. avg. $ 18,217 $ 14,741 $ 14,191 5.64 % 5.96 % 3.9 yrs 64 % Cash All-in Coupon Yield |
 Blackstone Mortgage Trust 11 December 31, 2018 December 31, 2017 Assets Cash and cash equivalents 105,662 $ 69,654 $ Restricted cash — 32,864 Loans receivable, net 14,191,200 10,056,732 Other assets 170,513 99,575 Total assets 14,467,375 $ 10,258,825 $ Liabilities and equity Secured debt agreements, net 8,974,756 $ 5,273,855 $ Loan participations sold, net 94,418 80,415 Securitized debt obligations, net 1,285,471 1,282,412 Convertible notes, net 609,911 563,911 Other liabilities 128,212 140,826 Total liabilities 11,092,768 7,341,419 Commitments and contingencies — — Equity Class A common stock, $0.01 par value 1,234 1,079 Additional paid-in capital 3,966,540 3,506,861 Accumulated other comprehensive loss (34,222) (29,706) Accumulated deficit (569,428) (567,168) Total Blackstone Mortgage Trust, Inc. stockholders' equity 3,364,124 2,911,066 Non-controlling interests 10,483 6,340 Total equity 3,374,607 2,917,406 Total liabilities and equity 14,467,375 $ 10,258,825 $ Consolidated Balance Sheets ($ in thousands, except per share data) |
 Blackstone Mortgage Trust 12 Consolidated Statements of Operations ($ in thousands, except per share data) Three Months Ended December 31, Year Ended December 31, 2018 2017 2018 2017 Income from loans and other investments Interest and related income 206,098 $ 146,127 $ 756,109 $ 537,915 $ Less: Interest and related expenses 103,948 65,953 359,625 234,870 Income from loans and other investments, net 102,150 80,174 396,484 303,045 Other expenses Management and incentive fees 18,586 14,284 74,834 54,841 General and administrative expenses 9,632 7,702 35,529 29,922 Total other expenses 28,218 21,986 110,363 84,763 Income before income taxes 73,932 58,188 286,121 218,282 Income tax provision 36 48 308 314 Net income 73,896 $ 58,140 $ 285,813 $ 217,968 $ Net income attributable to non-controlling interests (253) (249) (735) (337) Net income attributable to Blackstone Mortgage Trust, Inc. 73,643 $ 57,891 $ 285,078 $ 217,631 $ Per share information (basic and diluted) Weighted-average shares of common stock outstanding 121,588,404 98,810,617 113,857,238 95,963,616 Net income per share of common stock 0.61 $ 0.59 $ 2.50 $ 2.27 $ |
 Blackstone Mortgage Trust 13 Three Months Ended December 31, 2018 September 30, 2018 Stockholders' equity 3,364,124 $ 3,300,772 $ Shares Class A common stock 123,436 119,669 Deferred stock units 229 221 Total outstanding 123,665 119,890 Book value per share 27.20 $ 27.53 $ Per Share Calculations (a) Represents net income attributable to Blackstone Mortgage Trust, Inc. (b) Primarily represents the forward points earned on our foreign currency forward contracts, which reflect the interest rate differentials between the applicable base rate for our foreign currency investments and USD LIBOR. These forward contracts effectively convert the rate exposure to USD LIBOR, resulting in additional interest income earned in U.S. dollar terms. These amounts are not included in GAAP net income, but rather as a component of Other Comprehensive Income in our consolidated financial statements. (Amounts in thousands, except per share data) Core Earnings Reconciliation Book Value per Share Earnings per Share Three Months Ended December 31, 2018 September 30, 2018 Net income (a) 73,643 $ 78,165 $ Non-cash compensation expense 7,666 6,734 Realized foreign currency gain, net (b) 1,942 1,930 Other items 394 590 Core Earnings 83,645 $ 87,419 $ Weighted-average shares outstanding, basic and diluted 121,588 116,203 Core Earnings per share, basic and diluted 0.69 $ 0.75 $ Three Months Ended December 31, 2018 September 30, 2018 Net income (a) 73,643 $ 78,165 $ Weighted-average shares outstanding, basic and diluted 121,588 116,203 Earnings per share, basic and diluted 0.61 $ 0.67 $ |
 Blackstone Mortgage Trust 14 Reconciliation of Net Income to Core Earnings (a) Represents net income attributable to Blackstone Mortgage Trust, Inc. (b) Historically, we have deferred in Core Earnings the accretion of purchase discount attributable to a certain pool of GE portfolio investments acquired in May 2015, until repayment in full of the remaining investments in the pool was substantially assured. During the three months ended June 30, 2018, it was determined that repayment of the remaining loans in the deferral pool was substantially assured. As such, the $8.7 million of deferred purchase discount, which has been previously recognized in GAAP net income, was realized in Core Earnings during the three months ended June 30, 2018. (c) Primarily represents the forward points earned on our foreign currency forward contracts, which reflect the interest rate differentials between the applicable base rate for our foreign currency investments and USD LIBOR. These forward contracts effectively convert the rate exposure to USD LIBOR, resulting in additional interest income earned in U.S. dollar terms. These amounts are not included in GAAP net income, but rather as a component of Other Comprehensive Income in our consolidated financial statements. (Amounts in thousands, except per share data) Year Ended Dec 31, 2018 Dec 31, 2018 Sept 30, 2018 June 30, 2018 Mar 31, 2018 Net income (a) 285,078 $ 73,643 $ 78,165 $ 72,312 $ 60,958 $ Non-cash compensation expense 28,154 7,666 6,734 6,778 6,976 GE purchase discount accretion adjustment (b) 8,706 — — 8,723 (17) Realized foreign currency gain, net (c) 6,723 1,942 1,930 1,998 854 Other items 2,084 394 590 565 534 Core Earnings 330,745 $ 83,645 $ 87,419 $ 90,376 $ 69,305 $ Weighted-average shares outstanding, basic and diluted 113,857 121,588 116,203 109,069 108,398 Net income per share, basic and diluted 2.50 $ 0.61 $ 0.67 $ 0.66 $ 0.56 $ Core Earnings per share, basic and diluted 2.90 $ 0.69 $ 0.75 $ 0.83 $ 0.64 $ Three Months Ended |
 Blackstone Mortgage Trust 15 Definitions Core Earnings: Blackstone Mortgage Trust, Inc. (“BXMT”) discloses Core Earnings in this presentation. Core Earnings is a financial measure that is calculated and presented on the basis of methodologies other than in accordance with generally accepted accounting principles in the United States of America (“GAAP”). Core Earnings is an adjusted measure that helps BXMT evaluate its performance excluding the effects of certain transactions and GAAP adjustments that it believes are not necessarily indicative of its current loan origination portfolio and operations. Although according to its management agreement BXMT calculates the incentive and base management fees due to its Manager using Core Earnings before incentive fees expense, BXMT reports Core Earnings after incentive fees expense, as BXMT believes this is a more meaningful presentation of the economic performance of its class A common stock. Core Earnings is defined as GAAP net income (loss), including realized gains and losses not otherwise included in GAAP net income (loss), and excluding (i) net income (loss) attributable to the CT Legacy Portfolio, (ii) non-cash equity compensation expense, (iii) depreciation and amortization, (iv) unrealized gains (losses), and (v) certain non-cash items. Core Earnings may also be adjusted from time to time to exclude one-time events pursuant to changes in GAAP and certain other non-cash charges as determined by BXMT’s manager, subject to approval by a majority of its independent directors. Core Earnings does not represent net income or cash generated from operating activities and should not be considered as an alternative to GAAP net income, or an indication of BXMT’s GAAP cash flows from operations, a measure of BXMT’s liquidity, or an indication of funds available for its cash needs. In addition, BXMT’s methodology for calculating Core Earnings may differ from the methodologies employed by other companies to calculate the same or similar supplemental performance measures, and accordingly, its reported Core Earnings may not be comparable to the Core Earnings reported by other companies. Non-Consolidated Senior Interests: Senior interests in loans originated and syndicated to third parties. These non-recourse loan participations, which are excluded from the GAAP balance sheet, constitute additional financing capacity and are included in discussions of the loan portfolio. Earnings Sensitivity to LIBOR: Reflects the impact on net income, net of incentive fees, assuming no changes in credit spreads, portfolio composition, or asset performance. Assumes no change in general and administrative expenses, management fees, or other non-interest expenses relative to those incurred for the quarter ended December 31, 2018. |
 Blackstone Mortgage Trust 16 Forward-Looking Statements This presentation may contain forward-looking statements within the meaning of Section 27A of the Securities Act of 1933, as amended, and Section 21E of the Securities Exchange Act of 1934, as amended, which reflect BXMT’s current views with respect to, among other things, its operations and financial performance. You can identify these forward-looking statements by the use of words such as “outlook,” “indicator,” “believes,” “expects,” “potential,” “continues,” “may,” “will,” “should,” “seeks,” “predicts,” “intends,” “plans,” “estimates,” “anticipates” or the negative version of these words or other comparable words. Such forward- looking statements are subject to various risks and uncertainties. Accordingly, there are or will be important factors that could cause actual outcomes or results to differ materially from those indicated in these statements. BXMT believes these factors include but are not limited to those described under the section entitled “Risk Factors” in its Annual Report on Form 10-K for the fiscal year ended December 31, 2018, as such factors may be updated from time to time in its periodic filings with the Securities and Exchange Commission (“SEC”) which are accessible on the SEC’s website at www.sec.gov. These factors should not be construed as exhaustive and should be read in conjunction with the other cautionary statements that are included in this presentation and in the filings. BXMT assumes no obligation to update or supplement forward-looking statements that become untrue because of subsequent events or circumstances. |