Exhibit 99.1

2Q 2023
Results
July 27, 2023
Investor Contact
(52) 818-328-6167
investor@femsa.com.mx
femsa.gcs-web.com
Media Contact
(52) 555-249-6843
comunicacion@femsa.com.mx
femsa.com

HIGHLIGHTS
Monterrey, Mexico, July 27, 2023 — Fomento Económico Mexicano, S.A.B. de C.V. (“FEMSA”) (NYSE: FMX; BMV: FEMSAUBD, FEMSAUB) announced today its operational and financial results for the second quarter of 2023.
| • | FEMSA: Total Consolidated Revenues grew 18.3% against 2Q22. |
| • | FEMSA Retail1: Proximity Americas total Revenues increased 19.9% against 2Q22. |
| • | DIGITAL: Spin by OXXO had 5.7 million active users2 while Spin Premia had 15.8 million active loyalty users2 and an average tender3 of 24.0%. |
| • | COCA-COLA FEMSA: Total revenues grew 7.2% against 2Q22. |
Financial Summary for the Second Quarter and First Six Months 2023
Change vs. comparable period
| | | Total Revenues | | | Gross Profit | | | Income from Operations | | | Same-Store Sales | |
| | | 2Q23 | | | YTD23 | | | 2Q23 | | | YTD23 | | | 2Q23 | | | YTD23 | | | 2Q23 | | | YTD23 | |
| FEMSA Consolidated | | | 18.3 | % | | | 19.9 | % | | | 20.1 | % | | | 21.3 | % | | | 8.0 | % | | | 6.8 | % | | | | | | | | |
| Proximity Americas | | | 19.9 | % | | | 20.8 | % | | | 19.3 | % | | | 19.5 | % | | | 18.0 | % | | | 18.7 | % | | | 15.3 | % | | | 16.7 | % |
| Health | | | 0.6 | % | | | 0.1 | % | | | 6.5 | % | | | 5.7 | % | | | (0.5 | )% | | | (3.5 | )% | | | (3.7 | )% | | | (5.1 | )% |
| Fuel | | | 9.3 | % | | | 14.4 | % | | | 6.9 | % | | | 13.7 | % | | | (0.9 | )% | | | 15.0 | % | | | 3.2 | % | | | 9.3 | % |
| Coca-Cola FEMSA | | | 7.2 | % | | | 9.2 | % | | | 7.9 | % | | | 9.9 | % | | | 11.9 | % | | | 12.1 | % | | | | | | | | |
| Envoy Solutions | | | 23.1 | % | | | 23.4 | % | | | 31.1 | % | | | 27.1 | % | | | (7.1 | )% | | | (8.6 | )% | | | | | | | | |
José Antonio Fernandez Carbajal, FEMSA’s Chief Executive Officer, commented:
“It is a great privilege to lead this amazing company again. It is also a challenge that I embrace, particularly as we find ourselves in the process of implementing our transformational FEMSA Forward strategy, and as we pursue our ambitious long-range growth plans for all our core business units, setting the course for sustained, long-term value creation.
The second quarter results announced today represent an example of the organic growth potential we have before us. Among the highlights, Proximity Americas increased revenues by 20 percent, again driven by strong same-store sales trends at OXXO and reflecting an accelerated store expansion. In Europe, Valora reported solid top line growth, while Health revenues were stable, reflecting a challenging comparison base in Chile as well as currency headwinds. For its part, Coca-Cola FEMSA again delivered a strong performance, while Envoy Solutions showed sustained revenue growth driven by recent acquisitions. On the Digital side, we continued to add users at a rapid pace, with active users growing more than one hundred percent year-over-year.
I want to extend my gratitude to our hardworking team who continue to find a way to post strong results, putting us on the right path to meet or exceed our long-term aspirations.”
| 1 | FEMSA Retail: Proximity Americas & Europe, Fuel and FEMSA Health. |
| 2 | Active User for Spin by OXXO: Any user with a balance or that has transacted within the last 56 days. Active User for Spin Premia: User that has transacted at least once with OXXO Premia within the last 90 days. |
| 3 | Tender: OXXO Mexico MXN sales with OXXO Premia or Spin Premia redemption or accrual divided by Total OXXO Mexico MXN Sales, during the period. |
QUARTERLY RESULTS
Results are compared to the same period of previous year
FEMSA CONSOLIDATED
2Q23 Financial Summary
Amounts expressed in millions of Mexican Pesos (Ps.)
| | | | 2Q23 | | | | 2Q22 | | | | Var. | | | | Org. | |
| Total Revenues | | | 198,220 | | | | 167,504 | | | | 18.3 | % | | | 9.5 | % |
| Income from Operations | | | 16,581 | | | | 15,355 | | | | 8.0 | % | | | 4.5 | % |
| Operating Margin (%) | | | 8.4 | | | | 9.2 | | | | (80 | )bps | | | | |
| EBITDA5 | | | 27,134 | | | | 23,370 | | | | 16.1 | % | | | 8.5 | % |
| EBITDA Margin (%) | | | 13.7 | | | | 14.0 | | | | (30 | )bps | | | | |
| Net Income | | | 8,926 | | | | 7,640 | | | | 16.8 | % | | | | |
Net Debt ex-KOF6
Amounts expressed in millions of Mexican Pesos (Ps.)
| As of June 30, 2023 | | Ps. | | | US$4 | |
| Cash | | | 133,846 | | | | 7,807 | |
| Long-Term Debt | | | 73,329 | | | | 4,277 | |
| Lease Liabilities | | | 91,633 | | | | 5,345 | |
| Net debt | | | 31,115 | | | | 1,815 | |
| ND / EBITDA | | | 0.54 | x | | | - | |
Total revenues increased 18.3% in 2Q23 compared to 2Q22, driven by growth across our business units. On an organic1 basis, total revenues increased 9.5%.
Gross profit increased 20.1%. Gross margin expanded 50 basis points, reflecting the consolidation of Proximity Europe, as well as margin expansions at Coca-Cola FEMSA, Envoy Solutions, and FEMSA Health. This was partially offset by a margin contraction at Fuel and Proximity Americas.
Income from operations increased 8.0%. On an organic basis, income from operations increased 4.5%. Consolidated operating margin decreased 80 basis points to 8.4% of total revenues, reflecting margin expansion at Coca-Cola FEMSA, offset by margin contractions at Proximity Americas, Health, Fuel, and Envoy Solutions, as well as the consolidation of Proximity Europe.
Our effective income tax rate was 30.0% in 2Q23 compared to 38.0% in 2Q22. Our income tax provision was Ps. 5,618 million in 2Q23.
Net consolidated income was Ps. 8,926 million, reflecting: i) higher income from operations; ii) a Ps. 9,410 other non-operating income, mostly reflecting the divestment of FEMSA’s minority stake in Jetro Restaurant Depot; and iii) a decrease in net interest expenses during the quarter. This was offset by: i) a non-cash foreign exchange loss of Ps. 6,456, related to FEMSA’s U.S. dollar-denominated cash position as impacted by the appreciation of the Mexican peso and, ii) a net loss of discontinued operations of Ps. 3,953 driven by the market value fluctuation of the Heineken shares underlying FEMSA’s outstanding exchangeable bond.2
Net majority income was Ps. 1.72 per FEMSA Unit3 and US$1.00 per FEMSA ADS.
Capital expenditures amounted to Ps. 8,375 million, driven by ongoing investment activities across our business units.
| 1 | Excludes the effects of significant mergers and acquisitions in the last twelve months, including the acquisition of Valora. |
| 2 | As of June 30, 2023, FEMSA maintained 5,228,758 Heineken shares, underlying FEMSA’s exchangeable bond into Heineken shares issued in connection with the divestment of this stake in February 2023. |
| 3 | FEMSA Units consist of FEMSA BD Units and FEMSA B Units. Each FEMSA BD Unit is comprised of one Series B Share, two Series D-B Shares and two Series D-L Shares. Each FEMSA B Unit is comprised of five Series B Shares. The number of FEMSA Units outstanding as of June 30, 2023 was 3,578,226,270, equivalent to the total number of FEMSA Shares outstanding as of the same date, divided by 5. |
| 4 | The exchange rate published by the Federal Reserve Bank of New York for June 30, 2023 was 17.1439 MXN per USD. |
| 5 | EBITDA: Operating Income + Depreciation + Amortizations. |
| 6 | ex-KOF: FEMSA Consolidated reported information – Coca-Cola FEMSA Consolidated reported information.
EBITDA ex-KOF: FEMSA Consolidated EBITDA as described above – Coca-Cola FEMSA’s Consolidated EBITDA + Dividends received by FEMSA from Coca-Cola FEMSA and other investments.
All Net Debt calculations are shown on an Ex-KOF basis. For a detailed reconciliation of this metric please see table on page 17 of this document. |
PROXIMITY AMERICAS
OXXO (Mexico & Latam1) |  |
2Q23 Financial Summary
Amounts expressed in millions of Mexican Pesos (Ps.) except same-store sales
| | | | 2Q23 | | | | 2Q22 | | | | Var. | |
| Same-store sales (thousands of Ps.) | | | 1,042.5 | | | | 903.9 | | | | 15.3 | % |
| Total Revenues | | | 72,099 | | | | 60,136 | | | | 19.9 | % |
| Income from Operations | | | 7,211 | | | | 6,110 | | | | 18.0 | % |
| Income from Operations Margin (%) | | | 10.0 | | | | 10.2 | | | | (20 | )bps |
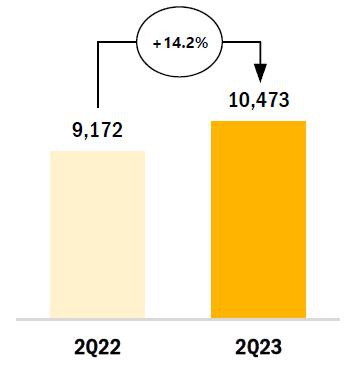
| EBITDA | | | 10,473 | | | | 9,172 | | | | 14.2 | % |
| EBITDA Margin (%) | | | 14.5 | | | | 15.3 | | | | (80 | )bps |
Net Additions
Vs. comparable quarter | Store Base
As of 1Q23 | Same-Store Sales
In thousands of Ps. | EBITDA
In millions of Ps. |
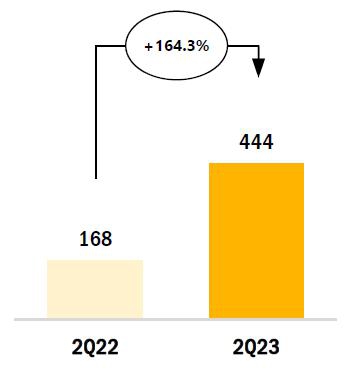 | 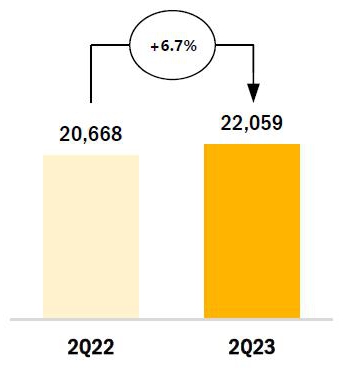 |  |  |
Total revenues increased 19.9% in 2Q23 compared to 2Q22, reflecting a 15.3% average same-store sales increase, driven by 7.4% growth in average customer ticket and an increase of 7.4% in store traffic. These figures reflect a strong performance across most of OXXO’s categories supported by the strong performance of the thirst and gathering occasions, such as beer, snacks, and other beverages, as well as the continued recovery of mobility-driven occasions. During the quarter, the OXXO store base in Mexico & Latam expanded by 444 units to reach 1,391 total net store additions for the last twelve months. As of June 30, 2023, Proximity Americas had a total of 22,059 OXXO stores.
Gross profit reached 41.0% of total revenues, reflecting strong commercial activity and promotional programs from key suppliers, offset by a decrease in the contribution of financial services relative to 2Q22.
Income from operations amounted to 10.0% of total revenues. Operating expenses increased 19.7% to Ps. 22,332 million, slightly below revenues, as operating leverage and efficiencies offset an increase in labor expenses in connection with recent labor reforms in Mexico.
1 OXXO Latam: OXXO Colombia, Chile and Peru.
PROXIMITY AMERICAS
Other formats | |
Bara1
Total revenues increased 44.1% in 2Q23 compared to 2Q22, driven by a 22.7% average same-store sales increase, reflecting the strong performance of the groceries, home hygiene and convenience categories, mainly driven by beverages. During the quarter, the Bara store base expanded by 13 units to reach 296 total Bara stores as of June 30, 2023.
Grupo Nós2
Total revenues for the period grew 207.1% year-over-year, reaching R$176.4 million3. This figure reflects the successful evolution and expansion of the OXXO value proposition which resulted in same-store sales growth at OXXO of 20.5%4, as well as the addition of 218 net new OXXO stores for the last twelve months. During the quarter, the store base of Grupo Nós expanded by 35 units, including 32 net new OXXO stores. As of June 30, 2023, Grupo Nós had a total of 1,638 stores, which include 346 company owned and operated OXXO stores.
1 Bara store count and results are not consolidated within the Proximity Americas reported figures.
2 OXXO’s non-consolidated joint-venture with Raízen in Brazil.
3 The exchange rate published by the Federal Reserve Bank of New York for June 30, 2023 was 4.8102 BRL per USD.
4 Local currency, BRL.
5 The Proximity Europe segment is comprised of Valora. The acquisition of Valora was concluded in October 2022.
2Q23 Financial Summary
Amounts expressed in millions of Mexican Pesos (Ps.)
| | | 2Q23 | |
| Total Revenues | | | 10,833 | |
| Income from Operations | | | 316 | |
| Income from Operations Margin (%) | | | 2.9 | |
| EBITDA | | | 1,518 | |
| EBITDA Margin (%) | | | 14.0 | |
Total revenues increased 8.4%1 in 2Q23 compared to 2Q22 to Ps. 10,833 million, reflecting traffic recovery as well as positive pricing initiatives, and the growth of Valora’s foodservice and B2B business. As of the end of the period, Proximity Europe had 2,784 points of sale.
Gross profit reached 42.1% of total revenues, reflecting the continued recovery of the foodservice category, which has a structurally higher margin.
Income from operations amounted to 2.9% of total revenues, reflecting the contribution of foodservice, as well as positive operating leverage.
1 Local currency, CHF.
| HEALTH |  |
2Q23 Financial Summary
Amounts expressed in millions of Mexican Pesos (Ps.) except same-store sales
| | | 2Q23 | | | 2Q22 | | | Var. | |
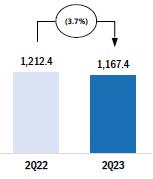
| Same-store sales (thousands of Ps.) | | | 1,167.4 | | | | 1,212.4 | | | | (3.7 | )% |
| Total Revenues | | | 18,962 | | | | 18,844 | | | | 0.6 | % |
| Income from Operations | | | 910 | | | | 915 | | | | (0.5 | )% |
| Income from Operations Margin (%) | | | 4.8 | | | | 4.9 | | | | (10 | )bps |
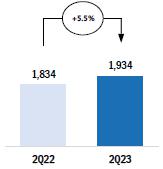
| EBITDA | | | 1,934 | | | | 1,834 | | | | 5.5 | % |
| EBITDA Margin (%) | | | 10.2 | | | | 9.7 | | | | 50 | bps |
Net Additions Vs. comparable quarter | Locations As of 2Q23 | Same-Store Sales In thousands of Ps. | EBITDA In millions of Ps. |
| 
| 
| 
|
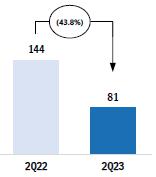
Total revenues increased 0.6% in 2Q23 compared to 2Q22, mainly reflecting positive local currency sales trends in Colombia and Ecuador, offset by a demanding comparison base in Chile and Mexico, and by a negative currency translation effect related to the depreciation of the Chilean and Colombian pesos relative to the Mexican peso. During the quarter, Health’s store base expanded by 81 units reaching a total of 4,267 locations across its territories as of June 30, 2023. This figure reflects the addition of 369 net new locations for the last twelve months. Same-store sales decreased an average of 3.7%, reflecting the trends described above. On a currency-neutral1 basis, total revenues grew 14.1% while same-store sales increased by 7.9%.
Gross profit represented 30.2% of total revenues, reflecting improved efficiency and more effective collaboration and execution with key supplier partners, as well as a positive mix effect reflecting a decrease in the contribution of our institutional sales channel in Chile.
Income from operations amounted to 4.8% of total revenues. Operating expenses increased 8.0% to Ps. 4,818 million, reflecting an increase in labor expenses in Mexico, partially offset by tight expense control across our operations.
1 Calculated by translating comparable period figures at the foreign currency exchange rates used in the current period.
| FUEL |  |
2Q23 Financial Summary
Amounts expressed in millions of Mexican Pesos (Ps.) except same-station sales
| | | 2Q23 | | | 2Q22 | | | Var. | |
| Same-station sales (thousands of Ps.) | | | 7,457.6 | | | | 7,227.0 | | | | 3.2 | % |
| Total Revenues | | | 14,455 | | | | 13,220 | | | | 9.3 | % |
| Income from Operations | | | 567 | | | | 572 | | | | (0.9 | )% |
| Income from Operations Margin (%) | | | 3.9 | | | | 4.3 | | | | (40 | )bps |
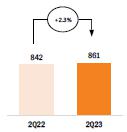
| EBITDA | | | 861 | | | | 842 | | | | 2.3 | % |
| EBITDA Margin (%) | | | 6.0 | | | | 6.4 | | | | (40 | )bps |
Net Additions Vs. comparable quarter | Service Station Base As of 1Q23 | Same-Station Sales In thousands of Ps. | EBITDA In millions of Ps. |

| 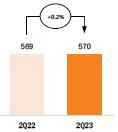 | 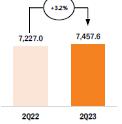 |  |
Total revenues increased 9.3% in 2Q23 compared to 2Q22, reflecting a 3.2% average same-station sales increase, driven by 0.6% growth in average volume and 2.6% increase in the average price per liter, as well as volume growth in our institutional and wholesale customer network. The OXXO Gas retail network had 570 points of sale as of June 30, 2023. This figure reflects the addition of one net station for the last twelve months.
Gross profit was 12.0% of total revenues.
Income from operations amounted to 3.9% of total revenues. Operating expenses increased 11.1% to Ps. 1,169 million, reflecting increased labor expenses.
FEMSA Retail Operations Summary
Currency-neutral terms where applicable
Total Revenue Growth (% vs year ago)
| | | 2Q23 | |
| Proximity Americas | | | | |
| OXXO1 | | | 19.9 | % |
| Mexico | | | 19.9 | % |
| OXXO Latam1 | | | 36.6 | % |
| | | | | |
| Other Proximity Americas formats | | | | |
| Bara | | | 44.1 | % |
| OXXO Brazil2 | | | 207.1 | % |
| | | | | |
| Proximity Europe4 | | | 8.4 | % |
| OXXO Gas | | | 9.3 | % |
| | | | | |
| FEMSA Health5 | | | 14.1 | % |
| Chile | | | 10.6 | % |
| Colombia | | | 13.6 | % |
| Ecuador | | | 7.3 | % |
| Mexico | | | 7.6 | % |
| 1 | OXXO Consolidated figures shown in MXN including currency effects. |
| 2 | Includes OXXO Colombia, Chile and Peru. |
| 3 | Operated through Grupo Nós, our joint-venture with Raízen. |
| 4 | Local currency (CHF). |
| 5 | FEMSA Health Include franchised stores in Ecuador. |
Total Unit Growth (% vs year ago)
| | | 2Q23 | |
| Proximity Americas | | | | |
| OXXO | | | 6.7 | % |
| Mexico | | | 5.9 | % |
| OXXO Latam1 | | | 41.9 | % |
| | | | | |
| Other Proximity Americas formats | | | | |
| Bara | | | 30.4 | % |
| OXXO Brazil2 | | | 170.3 | % |
| | | | | |
| Proximity Europe3 | | | 2.2 | % |
| OXXO Gas | | | - | |
| | | | | |
| FEMSA Health | | | 10.5 | % |
| Chile | | | 2.0 | % |
| Colombia | | | 16.0 | % |
| Ecuador | | | 8.0 | % |
| Mexico | | | 12.0 | % |
| 1 | Includes OXXO Colombia, Chile and Perú. |
| 2 | Operated through Grupo Nós, our joint-venture with Raízen. |
| 3 | Includes company owned and franchised units. |
Same-Store Sales
| | | 2Q23 | |
| Proximity Americas | | | | |
| OXXO1 | | | 15.3 | % |
| Mexico | | | 15.6 | % |
| OXXO Latam1 | | | 12.6 | % |
| | | | | |
| Other Proximity Americas formats | | | | |
| Bara | | | 22.7 | % |
| OXXO Brazil2 | | | 20.5 | % |
| | | | | |
| Proximity Europe3 | | | N.A. | |
| OXXO Gas4 | | | 3.2 | % |
| | | | | |
| FEMSA Health5 | | | 7.9 | % |
| Chile | | | 4.0 | % |
| Colombia | | | 15.8 | % |
| Ecuador | | | 12.4 | % |
| Mexico | | | 1.0 | % |
| 1 | OXXO Consolidated figures shown in MXN including currency effects. |
| 2 | Includes OXXO Colombia, Chile and Peru. |
| 3 | Operated through Grupo Nós, our joint-venture with Raízen. |
| 4 | Local currency (CHF). |
| 5 | Only includes retail sales. FEMSA Health Include franchised stores in Ecuador. |
| DIGITAL@FEMSA1 |  |
Spin by OXXO
Spin by OXXO acquired 1.2 million users during the quarter to reach 7.6 million total users in 2Q23, compared to 3.1 million users in 2Q22. This represents an increase of 142.1% YoY and a 7.6% compound monthly growth rate. Active users2 represented 75.8% of the total acquired user base. Total transactions per month increased 23.5%3 during the quarter to reach an average of 36.2 million per month in 2Q23, reflecting an increase in user engagement.
Spin Premia
Spin Premia acquired 3.8 million users during the quarter to reach 32.7 million total users in 2Q23, compared to 15.2 million users in 2Q22. This represents an increase of 115.1% YoY and a 6.6% compound monthly growth rate. Active users4 represented 48.3% of the total acquired user base. The average tender5 during the quarter was 24.0%.
| COCA-COLA FEMSA |  |
Coca-Cola FEMSA’s financial results and discussion thereof are incorporated by reference from Coca-Cola FEMSA’s press release, which is attached to this press release or may be accessed by visiting coca-colafemsa.com.
1 Digital@FEMSA’s results are included within the Other business segment.
2 Active User for Spin by OXXO: Any user with a balance or that has transacted within the last 56 days.
3 Represents the quarter-over-quarter growth of average monthly transactions.
4 Active User for Spin Premia: User that has transacted at least once with OXXO Premia or Spin Premia within the last 90 days.
5 Tender: OXXO Mexico MXN sales with OXXO Premia or Spin Premia redemption or accrual divided by Total OXXO Mexico MXN Sales, during the period.
| ENVOY SOLUTIONS1 |  |
| 2Q23 Financial Summary |
| Amounts expressed in millions of Mexican Pesos (Ps.) |
| | | | | | | | | | |
| | | 2Q23 | | | 2Q22 | | | Var. | |
| Total Revenues | | | 13,482 | | | | 10,949 | | | | 23.1 | % |
| Income from Operations | | | 508 | | | | 547 | | | | (7.1 | )% |
| Income from Operations Margin (%) | | | 3.8 | | | | 5.0 | | | | (120 | )bps |
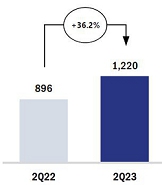
| EBITDA | | | 1,220 | | | | 896 | | | | 36.2 | % |
| EBITDA Margin (%) | | | 9.0 | | | | 8.2 | | | | 80 | bps |
Revenues In millions of Ps. | EBITDA In millions of Ps. |
| |
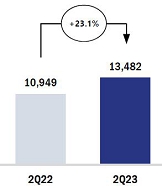 |  |
Total revenues increased 23.1% in 2Q23 compared to 2Q22, reflecting the acquisitions made by Envoy Solutions during the last twelve months.
Gross profit represented 29.2% of total revenues, reflecting strong trends in the janitorial and sanitation segment, as well as price optimization strategies.
Income from operations represented 3.8% of total revenues. Operating expenses increased 39.6% to Ps. 3,267 million, reflecting the strong inorganic expansion of this business as well as expenses related to synergy capture across Envoy Solutions. On a comparable basis2, income from operations increased 10.9% compared to 2Q22.
1 During 2021 and 2022, Envoy Solutions results were included within the Logistics & Distribution business segment.
2 Comparable basis: Excluding non-recurrent M&A expenses and on a currency-neutral basis.
RESULTS FOR THE FIRST SIX MONTHS OF 2023
Results are compared to the same period of previous year
Financial Summary for the First Six Months
Amounts expressed in millions of Mexican Pesos (Ps.)
| | | 2023 | | | 2022 | | | Var. | | | Org. | |
| Total Revenues | | | 378,086 | | | | 315,269 | | | | 19.9 | % | | | 10.8 | % |
| Income from Operations | | | 29,108 | | | | 27,267 | | | | 6.8 | % | | | 3.8 | % |
| Operating Margin (%) | | | 7.7 | | | | 8.6 | | | | (90 | )bps | | | | |
| EBITDA1 | | | 49,260 | | | | 43,095 | | | | 14.3 | % | | | 6.8 | % |
| EBITDA Margin (%) | | | 13.0 | | | | 13.7 | | | | (70 | )bps | | | | |
| Net Income | | | 59,252 | | | | 13,504 | | | | N.S. | | | | | |
Total revenues increased 19.9%. On an organic basis2, total revenues increased 10.8% reflecting growth across most of our operations.
Gross profit increased 21.3%. Gross margin increased 40 basis points to 37.4% of total revenues, reflecting gross margin expansion at Coca-Cola FEMSA, Health and Envoy Solutions as well as the consolidation of Proximity Europe, offset by margin contraction at Proximity Americas and Fuel.
Income from operations increased 6.8%. On an organic basis2, income from operations increased 3.8%. Our consolidated operating margin decreased 90 basis points to 7.7% of total revenues, reflecting margin expansions at Coca-Cola FEMSA, Fuel and Envoy Solutions, offset by margin contractions at Proximity Americas and Health, as well as by the consolidation of Proximity Europe.
Net consolidated income increased to Ps. 59,252 million, reflecting; i) a Ps. 36,653 million net income from discontinued operations, reflecting the accounting re-measurement from historical cost to fair value of FEMSA’s investment in Heineken, as well as the divestiture of this investment as part of the FEMSA Forward strategy announced on February 15, 2023, net of taxes; ii) a Ps. 10,275 million non-cash financial product that mostly reflects the repurchase of US$ 1.7 billion3 of FEMSA’s outstanding debt at favorable price levels during 1Q23, also in connection with FEMSA Forward; and iii) a Ps. 9,160 other non-operating income, mostly reflecting the divestment of FEMSA’s minority stake in Jetro Restaurant Depot. This was offset by a non-cash foreign exchange loss of Ps. 8,999, related to FEMSA’s U.S. dollar-denominated cash position as impacted by the appreciation of the Mexican peso.
Net majority income per FEMSA Unit4 was Ps.15.16 (US$8.84 per ADS).
Capital expenditures amounted to Ps. 13,531 million, reflecting the reactivation of ongoing investment activities at most of our business units.
1 EBITDA: Operating Income + Depreciation + Amortizations.
2 Excludes the effects of significant mergers and acquisitions in the last twelve months.
3 Face value
4 FEMSA Units consist of FEMSA BD Units and FEMSA B Units. Each FEMSA BD Unit is comprised of one Series B Share, two Series D-B Shares and two Series D-L Shares. Each FEMSA B Unit is comprised of five Series B Shares. The number of FEMSA Units outstanding as of June 30, 2023 was 3,578,226,270, equivalent to the total number of FEMSA Shares outstanding as of the same date, divided by 5.
RECENT DEVELOPMENTS
| · | On May 30, 2023, FEMSA announced the offering by the Company and its wholly-owned subsidiaries Compañía Internacional de Bebidas, S.A. de C.V. and Grupo Industrial Emprex, S. de R.L. de C.V. of existing issued ordinary shares of both Heineken N.V. and Heineken Holding N.V. (together, the “Heineken Group”) in the total amount of approximately EUR 3.3 billion (approximately 5.9% of the combined interest in the Heineken Group) (the “Equity Offering”). The Company also announced a tap issuance of euro denominated senior unsecured bonds in the aggregate principal amount of up to EUR 250 million (the “New Bonds”), exchangeable into ordinary shares of Heineken Holding N.V. (the “Exchangeable Offering” and together with the Equity Offering, the “Offering”). The New Bonds will be consolidated and form a single series with the Company’s EUR 500 million 2.625% senior unsecured Exchangeable Bonds due 2026, originally issued on 24 February 2023 (the “Original Bonds” and together with the New Bonds, the “Bonds”) with effect from on or about 18 July 2023 (the “Consolidation Date”). |
| · | On May 31, 2023, FEMSA announced the pricing of the sale by the Company and its wholly-owned subsidiaries Compañía Internacional de Bebidas, S.A. de C.V. and Grupo Industrial Emprex, S. de R.L. de C.V. of its entire holding of existing issued ordinary shares of both Heineken N.V. and Heineken Holding N.V. (together, the “Heineken Group”) by way of an accelerated book build of shares in the total amount of EUR 3.3 billion (approximately 6.0% of the combined interest in the Heineken Group) (the “Equity Offering”) as well as a bilateral sale of additional shares to Heineken N.V., except for any shares retained underlying FEMSA’s outstanding EUR 500 million 2.625% senior unsecured Exchangeable Bonds due 2026 (the “Bonds”), exchangeable into ordinary shares of Heineken Holding N.V. Given the strength of demand seen for the Equity Offering, the Company has decided not to proceed with the concurrent tap issuance of its outstanding Bonds announced on May 30, 2023. |
| · | On May 31, 2023, FEMSA announced that consistent with its FEMSA Forward strategy as communicated on February 15, 2023, it has entered into a definitive agreement to divest its minority investment in Jetro Restaurant Depot and related entities (“JRD”). Subject to customary closing conditions, FEMSA will receive total cash consideration of US$1,400 million, with approximately US$467 million payable on closing in the second quarter of 2023, and the remainder payable over two years. |
| · | On July 10, 2023, FEMSA announced that Daniel Rodríguez Cofré, after consulting with his family and doctors, would step down from his role as CEO, to focus on his health and treatment of a previously announced colon cancer diagnosis. Until a replacement is appointed, José Antonio Fernández Carbajal, Executive Chairman and former CEO of FEMSA, will serve as acting Chief Executive Officer on an interim basis, with the continued support of FEMSA’s senior leadership team and the CEOs of the business units. |
CONFERENCE CALL INFORMATION
Our Second Quarter 2023 Conference Call will be held on: Thursday, July 27, 2023, 11:00 AM Eastern Time (9:00 AM Mexico City Time). The conference call will be webcast live through streaming audio.
| Telephone: | Toll Free US: | (866) 580 3963 |
| | International: | +1 (786) 697 3501 |
| Webcast: | https://edge.media-server.com/mmc/p/chfb9z24 |
| | |
| Conference ID: | FEMSA |
If you are unable to participate live, the conference call audio will be available on https://femsa.gcs-web.com/financial-reports/quarterly-results
ABOUT FEMSA
FEMSA is a company that creates economic and social value through companies and institutions and strives to be the best employer and neighbor to the communities in which it operates. It participates in the retail industry through a Proximity Americas Division operating OXXO, a small-format store chain, and other related retail formats, and Proximity Europe which includes Valora, our European retail unit which operates convenience and foodvenience formats. In the retail industry it also participates though a Health Division, which includes drugstores and related activities and Digital@FEMSA, which includes Spin by OXXO and Spin Premia, among other digital financial services initiatives. In the beverage industry, it participates through Coca-Cola FEMSA, the largest franchise bottler of Coca-Cola products in the world by volume. FEMSA also participates in the logistics and distribution industry through its Strategic Business Unit, which additionally provides point-of-sale refrigeration and plastic solutions to its business units and third-party clients. Across its business units, FEMSA has more than 350,000 employees in 18 countries. FEMSA is a member of the Dow Jones Sustainability MILA Pacific Alliance, the FTSE4Good Emerging Index and the Mexican Stock Exchange Sustainability Index: S&P/BMV Total México ESG, among other indexes that evaluate its sustainability performance.
The translations of Mexican pesos into US dollars are included solely for the convenience of the reader, using the noon buying rate for Mexican pesos as published by the Federal Reserve Bank of New York on June 30, 2023, which was 17.1439 Mexican pesos per US dollar.
FORWARD-LOOKING STATEMENTS
This report may contain certain forward-looking statements concerning our future performance that should be considered as good faith estimates made by us. These forward-looking statements reflect management’s expectations and are based upon currently available data. Actual results are subject to future events and uncertainties, which could materially impact our actual performance.
Nine pages of tables and Coca-Cola FEMSA’s press release to follow
FEMSA – Consolidated Income Statement
Amounts expressed in millions of Mexican Pesos (Ps.)
| | | For the second quarter of: | | | For the six months of: | |
| | | 2023 | | | %
of rev. | | | 2022 | | | %
of rev. | | | % Var. | | | %
Org.(A) | | | 2023 | | | %
of rev. | | | 2022 | | | %
of rev. | | | % Var. | | | %
Org.(A) | |
| Total revenues | | | 198,220 | | | | 100.0 | | | | 167,504 | | | | 100.0 | | | | 18.3 | | | | 9.5 | | | | 378,086 | | | | 100.0 | | | | 315,269 | | | | 100.0 | | | | 19.9 | | | | 10.8 | |
| Cost of sales | | | 123,650 | | | | 62.4 | | | | 105,408 | | | | 62.9 | | | | 17.3 | | | | | | | | 236,570 | | | | 62.6 | | | | 198,645 | | | | 63.0 | | | | 19.1 | | | | | |
| Gross profit | | | 74,570 | | | | 37.6 | | | | 62,096 | | | | 37.1 | | | | 20.1 | | | | | | | | 141,516 | | | | 37.4 | | | | 116,624 | | | | 37.0 | | | | 21.3 | | | | | |
| Administrative expenses | | | 11,101 | | | | 5.6 | | | | 7,699 | | | | 4.6 | | | | 44.2 | | | | | | | | 19,722 | | | | 5.2 | | | | 14,998 | | | | 4.8 | | | | 31.5 | | | | | |
| Selling expenses | | | 46,274 | | | | 23.3 | | | | 38,836 | | | | 23.2 | | | | 19.2 | | | | | | | | 92,329 | | | | 24.4 | | | | 74,146 | | | | 23.5 | | | | 24.5 | | | | | |
| Other operating expenses (income), net (1) | | | 614 | | | | 0.3 | | | | 206 | | | | 0.1 | | | | 198.1 | | | | | | | | 357 | | | | 0.1 | | | | 213 | | | | 0.1 | | | | 67.6 | | | | | |
| Income from operations (2) | | | 16,581 | | | | 8.4 | | | | 15,355 | | | | 9.2 | | | | 8.0 | | | | 4.5 | | | | 29,108 | | | | 7.7 | | | | 27,267 | | | | 8.6 | | | | 6.8 | | | | 3.8 | |
| Other non-operating expenses (income) | | | (9,410 | ) | | | | | | | 234 | | | | | | | | N.S. | | | | | | | | (9,160 | ) | | | | | | | 104 | | | | | | | | N.S. | | | | | |
| Interest expense | | | 2,874 | | | | | | | | 4,197 | | | | | | | | (31.5 | ) | | | | | | | 6,570 | | | | | | | | 8,144 | | | | | | | | (19.3 | ) | | | | |
| Interest income | | | 1,763 | | | | | | | | 787 | | | | | | | | 124.0 | | | | | | | | 10,275 | | | | | | | | 1,526 | | | | | | | | N.S. | | | | | |
| Interest expense, net | | | 1,111 | | | | | | | | 3,410 | | | | | | | | (67.4 | ) | | | | | | | (3,705 | ) | | | | | | | 6,618 | | | | | | | | N.S. | | | | | |
| Foreign exchange loss (gain) | | | 6,456 | | | | | | | | (111 | ) | | | | | | | N.S. | | | | | | | | 8,999 | | | | | | | | 1,422 | | | | | | | | N.S. | | | | | |
| Other financial expenses (income), net | | | (303 | ) | | | | | | | (477 | ) | | | | | | | (36.5 | ) | | | | | | | 13 | | | | | | | | 317 | | | | | | | | (95.9 | ) | | | | |
| Financing expenses, net | | | 7,264 | | | | | | | | 2,822 | | | | | | | | 157.4 | | | | | | | | 5,307 | | | | | | | | 8,357 | | | | | | | | (36.5 | ) | | | | |
| Income before income tax and participation in associates results | | | 18,727 | | | | | | | | 12,299 | | | | | | | | 52.3 | | | | | | | | 32,961 | | | | | | | | 18,806 | | | | | | | | 75.3 | | | | | |
| Income tax | | | 5,618 | | | | | | | | 4,668 | | | | | | | | 20.4 | | | | | | | | 9,935 | | | | | | | | 6,697 | | | | | | | | 48.4 | | | | | |
| Participation in associates results (3) | | | (230 | ) | | | | | | | (54 | ) | | | | | | | N.S. | | | | | | | | (427 | ) | | | | | | | (102 | ) | | | | | | | N.S. | | | | | |
| Continued Operations net income (Loss) | | | 12,879 | | | | | | | | 7,577 | | | | | | | | 70.0 | | | | | | | | 22,599 | | | | | | | | 12,007 | | | | | | | | 88.2 | | | | | |
| Discontinued Operations net income (Loss) | | | (3,953 | ) | | | | | | | 63 | | | | | | | | (151.7 | ) | | | | | | | 36,653 | | | | | | | | 1,497 | | | | | | | | 171.4 | | | | | |
| Consolidated net income (Loss) | | | 8,926 | | | | | | | | 7,640 | | | | | | | | 16.8 | | | | | | | | 59,252 | | | | | | | | 13,504 | | | | | | | | N.S. | | | | | |
| Net majority income | | | 6,164 | | | | | | | | 5,208 | | | | | | | | 18.4 | | | | | | | | 54,239 | | | | | | | | 9,211 | | | | | | | | N.S. | | | | | |
| Net minority income | | | 2,762 | | | | | | | | 2,432 | | | | | | | | 13.6 | | | | | | | | 5,013 | | | | | | | | 4,293 | | | | | | | | 16.8 | | | | | |
| Operative Cash Flow & CAPEX | | 2023 | | | %
of rev. | | | 2022 | | | %
of rev. | | | % Var. | | | %
Org.(A) | | | 2023 | | | %
of rev. | | | 2022 | | | %
of rev. | | | % Var. | | | %
Org.(A) | |
| Income from operations | | | 16,581 | | | | 8.4 | | | | 15,355 | | | | 9.2 | | | | 8.0 | | | | 4.5 | | | | 29,108 | | | | 7.7 | | | | 27,267 | | | | 8.6 | | | | 6.8 | | | | 3.8 | |
| Depreciation | | | 8,346 | | | | 4.2 | | | | 6,702 | | | | 4.0 | | | | 24.5 | | | | | | | | 16,606 | | | | 4.4 | | | | 13,182 | | | | 4.2 | | | | 26.0 | | | | | |
| Amortization & other non-cash charges | | | 2,207 | | | | 1.1 | | | | 1,313 | | | | 0.8 | | | | 68.1 | | | | | | | | 3,546 | | | | 0.9 | | | | 2,646 | | | | 0.9 | | | | 34.0 | | | | | |
| EBITDA | | | 27,134 | | | | 13.7 | | | | 23,370 | | | | 14.0 | | | | 16.1 | | | | 8.5 | | | | 49,260 | | | | 13.0 | | | | 43,095 | | | | 13.7 | | | | 14.3 | | | | 6.8 | |
| CAPEX | | | 8,375 | | | | | | | | 6,296 | | | | | | | | 33.0 | | | | | | | | 13,531 | | | | | | | | 12,065 | | | | | | | | 12.2 | | | | | |
(A) Organic basis (% Org.) excludes the effects of significant mergers and acquisitions in the last twelve months.
(1) Other operating expenses (income), net = other operating expenses (income) +(-) equity method from operated associates.
(2) Income from operations = gross profit – administrative and selling expenses – other operating expenses (income), net.
(3) Mainly represents the results of our joint-venture with Raízen, Grupo Nós, net of taxes.
(4) At the end of June, the CAPEX effectively paid is equivalent to Ps. 5,072 million.
FEMSA – Consolidated Balance Sheet
Amounts expressed in millions of Mexican Pesos (Ps.)
| ASSETS | | Jun-23 | | | Dec-22 | | | % Inc. | |
| Cash and cash equivalents | | | 153,999 | | | | 83,439 | | | | 84.6 | |
| Investments | | | 10,796 | | | | 51 | | | | N.S. | |
| Accounts receivable | | | 47,375 | | | | 45,527 | | | | 4.1 | |
| Inventories | | | 58,557 | | | | 62,224 | | | | (5.9 | ) |
| Assets Available for sale | | | 26 | | | | - | | | | N.S. | |
| Other current assets | | | 43,341 | | | | 35,208 | | | | 23.1 | |
| Total current assets | | | 314,094 | | | | 226,449 | | | | 38.7 | |
| Investments in shares | | | 10,781 | | | | 103,669 | | | | (89.6 | ) |
| Property, plant and equipment, net | | | 133,476 | | | | 134,001 | | | | (0.4 | ) |
| Right of use | | | 187,551 | | | | 83,966 | | | | 123.4 | |
| Intangible assets (1) | | | 83,864 | | | | 190,772 | | | | (56.0 | ) |
| Other assets | | | 51,236 | | | | 59,958 | | | | (14.5 | ) |
| TOTAL ASSETS | | | 781,002 | | | | 798,815 | | | | (2.2 | ) |
| LIABILITIES & STOCKHOLDERS’ EQUITY | | Jun-23 | | | Dec-22 | | | % Inc. | |
| Bank loans | | | 1,921 | | | | 1,862 | | | | 3.2 | |
| Current maturities of long-term debt | | | 6,619 | | | | 14,471 | | | | (54.3 | ) |
| Interest payable | | | 1,564 | | | | 2,075 | | | | (24.6 | ) |
| Current maturities of long-term leases | | | 11,954 | | | | 12,095 | | | | (1.2 | ) |
| Operating liabilities | | | 155,990 | | | | 144,411 | | | | 8.0 | |
| Total current liabilities | | | 178,048 | | | | 174,914 | | | | 1.8 | |
| Long-term debt (2) | | | 130,547 | | | | 170,989 | | | | (23.7 | ) |
| Long-term leases | | | 81,496 | | | | 81,222 | | | | 0.3 | |
| Laboral obligations | | | 7,273 | | | | 7,048 | | | | 3.2 | |
| Other liabilities | | | 21,930 | | | | 26,841 | | | | (18.3 | ) |
| Total liabilities | | | 419,294 | | | | 461,014 | | | | (9.0 | ) |
| Total stockholders’ equity | | | 361,708 | | | | 337,801 | | | | 7.1 | |
| TOTAL LIABILITIES AND STOCKHOLERS’ EQUITY | | | 781,002 | | | | 798,815 | | | | (2.2 | ) |
| | | June 30, 2023 | |
| DEBT MIX (2) | | % of Total | | | Average
Rate | |
| Denominated in: | | | | | | | | |
| Mexican pesos | | | 45.9 | % | | | 8.3 | % |
| U.S. Dollars | | | 21.3 | % | | | 2.5 | % |
| Euros | | | 21.1 | % | | | 2.1 | % |
| Swiss Francs | | | 0.7 | % | | | 0.9 | % |
| Colombian pesos | | | 0.6 | % | | | 6.5 | % |
| Argentine pesos | | | 0.0 | % | | | 0.0 | % |
| Brazilian reais | | | 9.4 | % | | | 10.7 | % |
| Chilean pesos | | | 0.7 | % | | | 8.7 | % |
| Uruguayan Pesos | | | 0.2 | % | | | 6.3 | % |
| Guatemalan Quetzal | | | 0.0 | % | | | 0.0 | % |
| Total debt | | | 100.0 | % | | | 5.9 | % |
| | | | | | | | | |
| Fixed rate (2) | | | 83.7 | % | | | | |
| Variable rate (2) | | | 16.3 | % | | | | |
| DEBT MATURITY PROFILE | | 2024 | | | 2025 | | | 2026 | | | 2027 | | | 2028 | | | 2029+ | |
| % of Total Debt | | | 0.9 | % | | | 3.6 | % | | | 1.5 | % | | | 9.1 | % | | | 13.8 | % | | | 71.1 | % |
(1) Includes mainly the intangible assets generated by acquisitions.
(2) Includes the effect of derivative financial instruments on long-term debt.
Net Debt & EBITDA ex-KOF
Amounts expressed in millions of US Dollars (US.)
| | | Twelve months ended June 30, 2023 | |
| | | Reported EBITDA | | | Adjustments | | | EBITDA Ex-KOF4 | |
| Proximity Americas & Europe1 | | | 2,256 | | | | - | | | | 2,256 | |
| Fuel | | | 191 | | | | - | | | | 191 | |
| Health Division | | | 417 | | | | - | | | | 417 | |
| Envoy Solutions | | | 218 | | | | - | | | | 218 | |
| Coca-Cola FEMSA2 | | | 2,392 | | | | (2,392 | ) | | | - | |
| Other3 | | | (147 | ) | | | - | | | | (147 | ) |
| FEMSA Consolidated | | | 5,328 | | | | (2,392 | ) | | | 2,935 | |
| | | | | | | | | | | | | |
| Dividends Received4 | | | - | | | | 444 | | | | 444 | |
| | | | | | | | | | | | | |
| FEMSA Consolidated ex-KOF | | | 5,328 | | | | (1,948 | ) | | | 3,379 | |
| | | As of June 30, 2023 | |
| | | Reported | | | Adjustments | | | Ex-KOF | |
| Cash & Equivalents | | | 7,807 | | | | - | | | | 7,807 | |
| Coca-Cola FEMSA Cash & Equivalents | | | 1,805 | | | | (1,805 | ) | | | - | |
| Cash & Equivalents | | | 9,612 | | | | (1,805 | ) | | | 7,807 | |
| | | | | | | | | | | | | |
| Financial Debt5 | | | 4,277 | | | | - | | | | 4,277 | |
| Coca-Cola FEMSA Financial Debt | | | 3,836 | | | | (3,836 | ) | | | - | |
| Lease Liabilities | | | 5,345 | | | | - | | | | 5,345 | |
| Coca-Cola FEMSA Lease Liabilities | | | 106 | | | | (106 | ) | | | - | |
| Debt | | | 13,564 | | | | (3,942 | ) | | | 9,622 | |
| | | | | | | | | | | | | |
| FEMSA Net Debt | | | 3,951 | | | | (2,136 | ) | | | 1,815 | |
Translated to USD for readers’ convenience using the exchange rate published by the Federal Reserve Bank of New York for June 30, 2023 which was 17.1439 MXN per USD.
1 Includes Proximity Europe only for the consolidated period.
2 Coca-Cola FEMSA adjustment represents 100% of its LTM EBITDA.
3 Includes FEMSA Other Businesses (including Solistica and Digital@FEMSA), FEMSA corporate expenses and the effects of consolidation adjustments
4 Reflects cash dividends received from Coca-Cola FEMSA for approximately US$295 mm, US$45 mm from JRD, and US$96 mm from Heineken during the last twelve months.
5 Includes EUR€ 500.0 mm in notes convertible to Heineken Holding N.V. shares.
Proximity Americas – Results of Operations
Amounts expressed in millions of Mexican Pesos (Ps.)
| | | For the second quarter of: | | | For the six months of: | |
| | | 2023 | | | %
of rev. | | | 2022 | | | %
of rev. | | | % Var. | | | 2023 | | | %
of rev. | | | 2022 | | | %
of rev. | | | % Var. | |
| Total revenues | | 72,099 | | | 100.0 | | | 60,136 | | | 100.0 | | | 19.9 | | | 132,970 | | | 100.0 | | | 110,054 | | | 100.0 | | | 20.8 | |
| Cost of sales | | 42,556 | | | 59.0 | | | 35,373 | | | 58.8 | | | 20.3 | | | 78,881 | | | 59.3 | | | 64,800 | | | 58.9 | | | 21.7 | |
| Gross profit | | 29,543 | | | 41.0 | | | 24,763 | | | 41.2 | | | 19.3 | | | 54,089 | | | 40.7 | | | 45,254 | | | 41.1 | | | 19.5 | |
| Administrative expenses | | 1,650 | | | 2.3 | | | 1,570 | | | 2.6 | | | 5.1 | | | 2,770 | | | 2.1 | | | 2,876 | | | 2.6 | | | (3.7 | ) |
| Selling expenses | | 20,632 | | | 28.6 | | | 17,010 | | | 28.3 | | | 21.3 | | | 39,577 | | | 29.7 | | | 32,422 | | | 29.5 | | | 22.1 | |
| Other operating expenses (income), net | | 50 | | | 0.1 | | | 73 | | | 0.1 | | | (31.5 | ) | | 70 | | | 0.1 | | | 119 | | | 0.1 | | | (41.2 | ) |
| Income from operations | | 7,211 | | | 10.0 | | | 6,110 | | | 10.2 | | | 18.0 | | | 11,672 | | | 8.8 | | | 9,837 | | | 8.9 | | | 18.7 | |
| Depreciation | | 3,033 | | | 4.2 | | | 2,734 | | | 4.5 | | | 10.9 | | | 6,055 | | | 4.6 | | | 5,400 | | | 4.9 | | | 12.1 | |
| Amortization & other non-cash charges | | 229 | | | 0.3 | | | 328 | | | 0.6 | | | (30.2 | ) | | 443 | | | 0.3 | | | 565 | | | 0.6 | | | (21.6 | ) |
| EBITDA | | 10,473 | | | 14.5 | | | 9,172 | | | 15.3 | | | 14.2 | | | 18,170 | | | 13.7 | | | 15,802 | | | 14.4 | | | 15.0 | |
| CAPEX | | 3,258 | | | | | | 2,038 | | | | | | 59.9 | | | 5,606 | | | | | | 3,790 | | | | | | 47.9 | |
| | | | | | | | | | | | | | | | | | | | | | | | | | | | | | | |
| Information of OXXO Stores | | | | | | | | | | | | | | | | | | | | | | | | | | | | | | |
| Total stores | | | | | | | | | | | | | | | | | 22,059 | | | | | | 20,668 | | | | | | 6.7 | |
| Stores Mexico | | | | | | | | | | | | | | | | | 21,389 | | | | | | 20,196 | | | | | | 5.9 | |
| Stores South America | | | | | | | | | | | | | | | | | 670 | | | | | | 472 | | | | | | 41.9 | |
| | | | | | | | | | | | | | | | | | | | | | | | | | | | | | | |
| Net new convenience stores: | | | | | | | | | | | | | | | | | | | | | | | | | | | | | | |
| vs. Last quarter | | 444 | | | | | | 168 | | | | | | 164.3 | | | | | | | | | | | | | | | | |
| Year-to-date | | 601 | | | | | | 237 | | | | | | 153.6 | | | | | | | | | | | | | | | | |
| Last-twelve-months | | 1,391 | | | | | | 834 | | | | | | 66.8 | | | | | | | | | | | | | | | | |
| | | | | | | | | | | | | | | | | | | | | | | | | | | | | | | |
| Same-store data: (1) | | | | | | | | | | | | | | | | | | | | | | | | | | | | | | |
| Sales (thousands of pesos) | | 1,042.5 | | | | | | 903.9 | | | | | | 15.3 | | | 968.5 | | | | | | 830.2 | | | | | | 16.7 | |
| Traffic (thousands of transactions) | | 19.4 | | | | | | 18.1 | | | | | | 7.4 | | | 18.3 | | | | | | 17.1 | | | | | | 6.6 | |
| Ticket (pesos) | | 53.7 | | | | | | 50.0 | | | | | | 7.4 | | | 53.0 | | | | | | 48.4 | | | | | | 9.5 | |
(1) Monthly average information per store, considering same stores with more than twelve months of operations, income from services are included.
Proximity Europe – Results of Operations
Amounts expressed in millions of Mexican Pesos (Ps.)
| | | For the second quarter of: | | | For the six months of: | |
| | | 2023 | | | %
of rev. | | | 2023 | | | %
of rev. | |
| Total revenues | | | 10,833 | | | | 100.0 | | | | 20,944 | | | | 100.0 | |
| Cost of sales | | | 6,272 | | | | 57.9 | | | | 12,120 | | | | 57.9 | |
| Gross profit | | | 4,561 | | | | 42.1 | | | | 8,824 | | | | 42.1 | |
| Administrative expenses | | | 768 | | | | 7.1 | | | | 1,520 | | | | 7.3 | |
| Selling expenses | | | 3,503 | | | | 32.3 | | | | 6,897 | | | | 32.8 | |
| Other operating expenses (income), net | | | (26 | ) | | | (0.2 | ) | | | (50 | ) | | | (0.2 | ) |
| Income from operations | | | 316 | | | | 2.9 | | | | 457 | | | | 2.2 | |
| Depreciation | | | 1,071 | | | | 9.9 | | | | 2,182 | | | | 10.4 | |
| Amortization & other non-cash charges | | | 131 | | | | 1.2 | | | | 207 | | | | 1.0 | |
| EBITDA | | | 1,518 | | | | 14.0 | | | | 2,846 | | | | 13.6 | |
| CAPEX | | | 80 | | | | | | | | 275 | | | | | |
Health Division – Results of Operations
Amounts expressed in millions of Mexican Pesos (Ps.)
| | | For the second quarter of: | | | For the six months of: | |
| | | 2023 | | | % of rev. | | | 2022 | | | % of rev. | | | % Var. | | | 2023 | | | % of rev. | | | 2022 | | | % of rev. | | | % Var. | |
| Total revenues | | | 18,962 | | | | 100.0 | | | | 18,844 | | | | 100.0 | | | | 0.6 | | | | 37,536 | | | | 100.0 | | | | 37,500 | | | | 100.0 | | | | 0.1 | |
| Cost of sales | | | 13,234 | | | | 69.8 | | | | 13,466 | | | | 71.5 | | | | (1.7 | ) | | | 26,090 | | | | 69.5 | | | | 26,671 | | | | 71.1 | | | | (2.2 | ) |
| Gross profit | | | 5,728 | | | | 30.2 | | | | 5,378 | | | | 28.5 | | | | 6.5 | | | | 11,446 | | | | 30.5 | | | | 10,829 | | | | 28.9 | | | | 5.7 | |
| Administrative expenses | | | 765 | | | | 4.0 | | | | 420 | | | | 2.2 | | | | 82.1 | | | | 1,469 | | | | 3.9 | | | | 1,182 | | | | 3.2 | | | | 24.3 | |
| Selling expenses | | | 4,011 | | | | 21.2 | | | | 4,040 | | | | 21.4 | | | | (0.7 | ) | | | 8,032 | | | | 21.4 | | | | 7,656 | | | | 20.4 | | | | 4.9 | |
| Other operating expenses (income), net | | | 42 | | | | 0.2 | | | | 3 | | | | - | | | | N.S. | | | | 33 | | | | 0.1 | | | | 9 | | | | - | | | | N.S. | |
| Income from operations | | | 910 | | | | 4.8 | | | | 915 | | | | 4.9 | | | | (0.5 | ) | | | 1,912 | | | | 5.1 | | | | 1,982 | | | | 5.3 | | | | (3.5 | ) |
| Depreciation | | | 767 | | | | 4.0 | | | | 747 | | | | 4.0 | | | | 2.7 | | | | 1,550 | | | | 4.1 | | | | 1,476 | | | | 3.9 | | | | 5.0 | |
| Amortization & other non-cash charges | | | 257 | | | | 1.4 | | | | 172 | | | | 0.8 | | | | 49.4 | | | | 500 | | | | 1.4 | | | | 376 | | | | 1.0 | | | | 33.0 | |
| EBITDA | | | 1,934 | | | | 10.2 | | | | 1,834 | | | | 9.7 | | | | 5.5 | | | | 3,962 | | | | 10.6 | | | | 3,834 | | | | 10.2 | | | | 3.3 | |
| CAPEX | | | 385 | | | | | | | | 245 | | | | | | | | 57.5 | | | | 618 | | | | | | | | 245 | | | | | | | | 152.6 | |
| | | | | | | | | | | | | | | | | | | | | | | | | | | | | | | | | | | | | | | | | |
| Information of Stores | | | | | | | | | | | | | | | | | | | | | | | | | | | | | | | | | | | | | | | | |
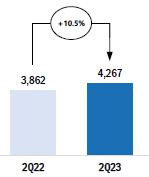
| Total stores | | | | | | | | | | | | | | | | | | | | | | | 4,267 | | | | | | | | 3,862 | | | | | | | | 10.5 | |
| Stores Mexico | | | | | | | | | | | | | | | | | | | | | | | 1,659 | | | | | | | | 1,481 | | | | | | | | 12.0 | |
| Stores South America | | | | | | | | | | | | | | | | | | | | | | | 2,608 | | | | | | | | 2,381 | | | | | | | | 9.5 | |
| | | | | | | | | | | | | | | | | | | | | | | | | | | | | | | | | | | | | | | | | |
| Net new stores: | | | | | | | | | | | | | | | | | | | | | | | | | | | | | | | | | | | | | | | | |
| vs. Last quarter | | | 81 | | | | | | | | 144 | | | | | | | | (43.8 | ) | | | | | | | | | | | | | | | | | | | | |
| Year-to-date | | | 161 | | | | | | | | 210 | | | | | | | | (23.3 | ) | | | | | | | | | | | | | | | | | | | | |
| Last-twelve-months | | | 369 | | | | | | | | 403 | | | | | | | | (8.4 | ) | | | | | | | | | | | | | | | | | | | | |
| | | | | | | | | | | | | | | | | | | | | | | | | | | | | | | | | | | | | | | | | |
| Same-store data: (1) | | | | | | | | | | | | | | | | | | | | | | | | | | | | | | | | | | | | | | | | |
| Sales (thousands of pesos) | | | 1,167.4 | | | | | | | | 1,212.4 | | | | | | | | (3.7 | ) | | | 1,177.2 | | | | | | | | 1,239.6 | | | | (5.0 | ) | | | | |
| | | | | | | | | | | | | | | | | | | | | | | | | | | | | | | | | | | | | | | | | |
(1) Monthly average information per store, considering same stores with more than twelve months of all the retail operations of the Health Division.
Fuel – Results of Operations
Amounts expressed in millions of Mexican Pesos (Ps.)
| | | For the second quarter of: | | | For the six months of: | |
| | | 2023 | | | %
of rev. | | | 2022 | | | %
of rev. | | | % Var. | | | 2023 | | | %
of rev. | | | 2022 | | | %
of rev. | | | % Var. | |
| Total revenues | | | 14,455 | | | | 100.0 | | | | 13,220 | | | | 100.0 | | | | 9.3 | | | | 27,595 | | | | 100.0 | | | | 24,115 | | | | 100.0 | | | | 14.4 | |
| Cost of sales | | | 12,719 | | | | 88.0 | | | | 11,596 | | | | 87.7 | | | | 9.7 | | | | 24,224 | | | | 87.8 | | | | 21,151 | | | | 87.7 | | | | 14.5 | |
| Gross profit | | | 1,736 | | | | 12.0 | | | | 1,624 | | | | 12.3 | | | | 6.9 | | | | 3,371 | | | | 12.2 | | | | 2,964 | | | | 12.3 | | | | 13.7 | |
| Administrative expenses | | | 68 | | | | 0.5 | | | | 57 | | | | 0.4 | | | | 19.3 | | | | 129 | | | | 0.5 | | | | 90 | | | | 0.4 | | | | 43.3 | |
| Selling expenses | | | 1,101 | | | | 7.6 | | | | 1,002 | | | | 7.7 | | | | 9.9 | | | | 2,151 | | | | 7.7 | | | | 1,933 | | | | 8.0 | | | | 11.3 | |
| Other operating expenses (income), net | | | - | | | | - | | | | (7 | ) | | | (0.1 | ) | | | (100.0 | ) | | | - | | | | - | | | | (8 | ) | | | - | | | | (100.0 | ) |
| Income from operations | | | 567 | | | | 3.9 | | | | 572 | | | | 4.3 | | | | (0.9 | ) | | | 1,091 | | | | 4.0 | | | | 949 | | | | 3.9 | | | | 15.0 | |
| Depreciation | | | 281 | | | | 1.9 | | | | 256 | | | | 1.9 | | | | 9.8 | | | | 559 | | | | 2.0 | | | | 518 | | | | 2.1 | | | | 7.9 | |
| Amortization & other non-cash charges | | | 13 | | | | 0.2 | | | | 14 | | | | 0.2 | | | | (7.1 | ) | | | 30 | | | | 0.1 | | | | 24 | | | | 0.2 | | | | 25.0 | |
| EBITDA | | | 861 | | | | 6.0 | | | | 842 | | | | 6.4 | | | | 2.3 | | | | 1,680 | | | | 6.1 | | | | 1,491 | | | | 6.2 | | | | 12.7 | |
| CAPEX | | | 44 | | | | | | | | (0 | ) | | | | | | | N.S. | | | | 68 | | | | | | | | 36 | | | | | | | | 88.2 | |
| | | | | | | | | | | | | | | | | | | | | | | | | | | | | | | | | | | | | | | | | |
| Information of OXXO GAS Service Stations | | | | | | | | | | | | | | | | | | | | | | | | | | | | | | | | | | | | | | | | |
| Total stores | | | | | | | | | | | | | | | | | | | | | | | 570 | | | | | | | | 569 | | | | | | | | 0.2 | |
| Net new convenience stores: | | | | | | | | | | | | | | | | | | | | | | | | | | | | | | | | | | | | | | | | |
| vs. Last quarter | | | 0 | | | | | | | | 0 | | | | | | | | - | | | | | | | | | | | | | | | | | | | | | |
| Year-to-date | | | 2 | | | | | | | | 2 | | | | | | | | - | | | | | | | | | | | | | | | | | | | | | |
| Last-twelve-months | | | 1 | | | | | | | | 6 | | | | | | | | (83.3 | ) | | | | | | | | | | | | | | | | | | | | |
| Volume (millions of liters) total stations | | | 616 | | | | | | | | 613 | | | | | | | | 0.6 | | | | 1,190 | | | | | | | | 1,129 | | | | | | | | 5.4 | |
| | | | | | | | | | | | | | | | | | | | | | | | | | | | | | | | | | | | | | | | | |
| Same-store data: (1) | | | | | | | | | | | | | | | | | | | | | | | | | | | | | | | | | | | | | | | | |
| Sales (thousands of pesos) | | | 7,457.6 | | | | | | | | 7,227.0 | | | | | | | | 3.2 | | | | 7,169.2 | | | | | | | | 6,558.3 | | | | | | | | 9.3 | |
| Traffic (thousands of transactions) | | | 360.4 | | | | | | | | 358.2 | | | | | | | | 0.6 | | | | 348.1 | | | | | | | | 330.2 | | | | | | | | 5.4 | |
| Ticket (pesos) | | | 20.7 | | | | | | | | 20.2 | | | | | | | | 2.6 | | | | 20.6 | | | | | | | | 19.9 | | | | | | | | 3.7 | |
(A) Unaudited consolidated financial information.
(1) Monthly average information per station, considering same stations with more than twelve months of operations.
Coca-Cola FEMSA – Results of Operations
Amounts expressed in millions of Mexican Pesos (Ps.)
| | | For the second quarter of: | | | For the six months of: | |
| | | 2023 | | | %
of rev. | | | 2022 | | | %
of rev. | | | % Var. | | | 2023 | | | %
of rev. | | | 2022 | | | %
of rev. | | | % Var. | |
| Total revenues | | | 61,428 | | | | 100.0 | | | | 57,311 | | | | 100.0 | | | | 7.2 | | | | 118,641 | | | | 100.0 | | | | 108,635 | | | | 100.0 | | | | 9.2 | |
| Cost of sales | | | 34,161 | | | | 55.6 | | | | 32,039 | | | | 55.9 | | | | 6.6 | | | | 65,985 | | | | 55.6 | | | | 60,702 | | | | 55.9 | | | | 8.7 | |
| Gross profit | | | 27,267 | | | | 44.4 | | | | 25,271 | | | | 44.1 | | | | 7.9 | | | | 52,657 | | | | 44.4 | | | | 47,933 | | | | 44.1 | | | | 9.9 | |
| Administrative expenses | | | 3,521 | | | | 5.7 | | | | 2,868 | | | | 5.0 | | | | 22.8 | | | | 6,591 | | | | 5.6 | | | | 5,330 | | | | 4.9 | | | | 23.7 | |
| Selling expenses | | | 15,274 | | | | 24.9 | | | | 14,580 | | | | 25.4 | | | | 4.8 | | | | 29,979 | | | | 25.3 | | | | 27,919 | | | | 25.6 | | | | 7.4 | |
| Other operating expenses (income), net | | | (90 | ) | | | (0.1 | ) | | | 171 | | | | 0.3 | | | | (152.6 | ) | | | (182 | ) | | | (0.2 | ) | | | 173 | | | | 0.2 | | | | N.S. | |
| Income from operations | | | 8,562 | | | | 13.9 | | | | 7,652 | | | | 13.4 | | | | 11.9 | | | | 16,269 | | | | 13.7 | | | | 14,512 | | | | 13.4 | | | | 12.1 | |
| Depreciation | | | 2,403 | | | | 3.9 | | | | 2,399 | | | | 4.2 | | | | 0.2 | | | | 4,717 | | | | 4.0 | | | | 4,755 | | | | 4.4 | | | | (0.8 | ) |
| Amortization & other non-cash charges | | | 473 | | | | 0.8 | | | | 556 | | | | 0.9 | | | | (14.9 | ) | | | 944 | | | | 0.8 | | | | 1,195 | | | | 1.0 | | | | (21.0 | ) |
| EBITDA | | | 11,439 | | | | 18.6 | | | | 10,607 | | | | 18.5 | | | | 7.8 | | | | 21,930 | | | | 18.5 | | | | 20,461 | | | | 18.8 | | | | 7.2 | |
| CAPEX | | | 4,243 | | | | | | | | 4,052 | | | | | | | | 4.7 | | | | 6,749 | | | | | | | | 7,157 | | | | | | | | (5.7 | ) |
| | | | | | | | | | | | | | | | | | | | | | | | | | | | | | | | | | | | | | | | | |
| Sales Volumes | | | | | | | | | | | | | | | | | | | | | | | | | | | | | | | | | | | | | | | | |
| (Millions of unit cases) | | | | | | | | | | | | | | | | | | | | | | | | | | | | | | | | | | | | | | | | |
| Mexico and Central America | | | 643.3 | | | | 63.1 | | | | 590.7 | | | | 62.0 | | | | 8.9 | | | | 1,180.7 | | | | 60.3 | | | | 1,084.7 | | | | 59.1 | | | | 8.8 | |
| South America | | | 135.3 | | | | 13.3 | | | | 131.1 | | | | 13.8 | | | | 3.2 | | | | 276.6 | | | | 14.1 | | | | 267.8 | | | | 14.6 | | | | 3.3 | |
| Brazil | | | 240.4 | | | | 23.6 | | | | 230.7 | | | | 24.2 | | | | 4.2 | | | | 501.3 | | | | 25.6 | | | | 481.5 | | | | 26.3 | | | | 4.1 | |
| Total | | | 1,018.9 | | | | 100.0 | | | | 952.4 | | | | 100.0 | | | | 7.0 | | | | 1,958.5 | | | | 100.0 | | | | 1,834.1 | | | | 100.0 | | | | 6.8 | |
(1) Organic basis (% Org.) excludes the effects of significant mergers and acquisitions in the last twelve months.
Envoy Solutions – Results of Operations
Amounts expressed in millions of Mexican Pesos (Ps.)
| | | For the second quarter of: | | | For the six months of: | |
| | | 2023 | | | %
of rev. | | | 2022 | | | %
of rev. | | | % Var. | | | 2023 | | | %
of rev. | | | 2022 | | | %
of rev. | | | % Var. | |
| Total revenues | | | 13,482 | | | | 100.0 | | | | 10,949 | | | | 100.0 | | | | 23.1 | | | | 26,949 | | | | 100.0 | | | | 21,836 | | | | 100.0 | | | | 23.4 | |
| Cost of sales | | | 9,540 | | | | 70.8 | | | | 7,942 | | | | 72.5 | | | | 20.1 | | | | 19,252 | | | | 71.4 | | | | 15,780 | | | | 72.3 | | | | 22.0 | |
| Gross profit | | | 3,942 | | | | 29.2 | | | | 3,008 | | | | 27.5 | | | | 31.1 | | | | 7,696 | | | | 28.6 | | | | 6,056 | | | | 27.7 | | | | 27.1 | |
| Administrative expenses | | | 1,694 | | | | 12.6 | | | | 900 | | | | 8.2 | | | | 88.2 | | | | 3,202 | | | | 11.9 | | | | 1,847 | | | | 8.5 | | | | 73.4 | |
| Selling expenses | | | 1,732 | | | | 12.7 | | | | 1,552 | | | | 14.2 | | | | 11.6 | | | | 3,484 | | | | 12.9 | | | | 3,110 | | | | 14.2 | | | | 12.0 | |
| Other operating expenses (income), net | | | 7 | | | | 0.1 | | | | 8 | | | | 0.1 | | | | (12.5 | ) | | | 15 | | | | 0.1 | | | | 10 | | | | 0.0 | | | | 50.0 | |
| Income from operations | | | 508 | | | | 3.8 | | | | 547 | | | | 5.0 | | | | (7.1 | ) | | | 996 | | | | 3.7 | | | | 1,090 | | | | 5.0 | | | | (8.6 | ) |
| Depreciation | | | 260 | | | | 1.9 | | | | 204 | | | | 1.9 | | | | 27.5 | | | | 506 | | | | 1.9 | | | | 335 | | | | 1.5 | | | | 51.0 | |
| Amortization & other non-cash charges | | | 452 | | | | 3.3 | | | | 145 | | | | 1.3 | | | | N.S. | | | | 649 | | | | 2.4 | | | | 295 | | | | 1.4 | | | | 120.0 | |
| EBITDA | | | 1,220 | | | | 9.0 | | | | 896 | | | | 8.2 | | | | 36.2 | | | | 2,151 | | | | 8.0 | | | | 1,720 | | | | 7.9 | | | | 25.1 | |
| CAPEX | | | 57 | | | | | | | | 47 | | | | | | | | 19.9 | | | | 114 | | | | | | | | 181 | | | | | | | | (37.2 | ) |
FEMSA Macroeconomic Information
| | | Inflation | | | End-of-period Exchange Rates | |
| | | 2Q 2023 | | | LTM (1) Jun-23 | | | Jun-23 | | | Jun-22 | |
| | | | | | | | | Per USD | | | Per MXN | | | Per USD | | | Per MXN | |
| Mexico | | | 0.92 | % | | | 7.44 | % | | | 17.07 | | | | 1.0000 | | | | 19.98 | | | | 1.0000 | |
| Colombia | | | 5.57 | % | | | 15.86 | % | | | 4,191.28 | | | | 0.0041 | | | | 4,127.47 | | | | 0.0048 | |
| Brazil | | | 2.26 | % | | | 7.37 | % | | | 4.82 | | | | 3.5425 | | | | 5.24 | | | | 3.8153 | |
| Argentina | | | 41.51 | % | | | 157.82 | % | | | 256.70 | | | | 0.0665 | | | | 125.23 | | | | 0.1596 | |
| Chile | | | 2.26 | % | | | 13.53 | % | | | 801.66 | | | | 0.0213 | | | | 932.08 | | | | 0.0214 | |
| Euro Zone | | | 2.55 | % | | | 9.32 | % | | | 0.91 | | | | 18.7056 | | | | 0.94 | | | | 21.1948 | |
(1) LTM = Last twelve month

Mexico City, July 25, 2023, Coca-Cola FEMSA, S.A.B. de C.V. (BMV: KOFUBL, NYSE: KOF) (“Coca-Cola FEMSA”, “KOF” or the “Company”), the largest Coca-Cola franchise bottler in the world by sales volume, announces results for the second quarter of 2023.
SECOND QUARTER HIGHLIGHTS
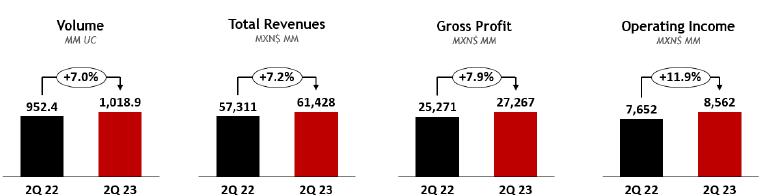
| · | Volume growth 7.0% — achieved a record of one billion unit cases for the first time during a quarter |
| · | Operating income growth 11.9% |
| · | Majority net income growth 6.5% |
| · | Earnings per share1 were Ps. 0.29. (Earnings per unit were Ps. 2.34 and per ADS were Ps. 23.45.) |
| · | Achieved more than 910 thousand monthly active buyers on Juntos+, our omnichannel B2B platform |
FIRST SIX MONTHS HIGHLIGHTS
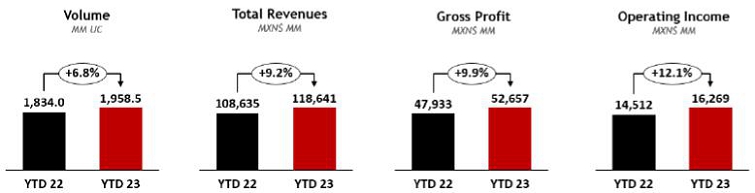
| · | Operating income growth 12.1% |
| · | Majority net income growth 17.3% |
| · | Earnings per share1 were Ps. 0.53. (Earnings per unit were Ps. 4.21 and per ADS were Ps. 42.07.) |
| · | Achieved more than US$ 1 billion in digital revenues through Juntos+ |
FINANCIAL SUMMARY FOR THE SECOND QUARTER RESULTS
Change vs. same period of last year
| | | | | Total Revenues | | | Gross Profit | | | Operating Income | | | Majority Net Income | |
| | | | | 2Q23 | | | YTD 2023 | | | 2Q23 | | | YTD 2023 | | | 2Q23 | | | YTD 2023 | | | 2Q23 | | | YTD 2023 | |
| | Consolidated | | | 7.2 | % | | | 9.2 | % | | | 7.9 | % | | | 9.9 | % | | | 11.9 | % | | | 12.1 | % | | | 6.5 | % | | | 17.3 | % |
| As Reported | | Mexico & Central America | | | 13.4 | % | | | 14.7 | % | | | 13.0 | % | | | 13.3 | % | | | 13.7 | % | | | 7.9 | % | | | | | | | | |
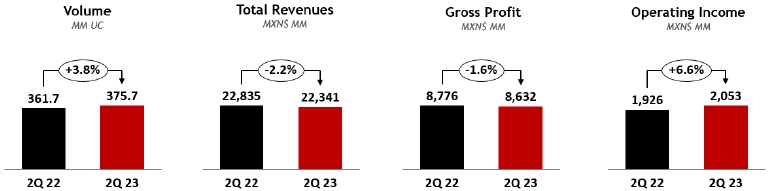
| | | South America | | | (2.2 | )% | | | 1.6 | % | | | (1.6 | )% | | | 3.9 | % | | | 6.6 | % | | | 23.8 | % | | | | | | | | |
| | | | | | | | | | | | | | | | | | | | | | | | | | | | | | | | | | | |
| | | Consolidated | | | 16.9 | % | | | 19.2 | % | | | 16.9 | % | | | 19.2 | % | | | 18.7 | % | | | 19.4 | % | | | | | | | | |
| Comparable (2) | | Mexico & Central America | | | 15.1 | % | | | 16.4 | % | | | 14.6 | % | | | 14.9 | % | | | 15.1 | % | | | 9.2 | % | | | | | | | | |
| | | South America | | | 20.3 | % | | | 23.9 | % | | | 22.1 | % | | | 28.5 | % | | | 31.5 | % | | | 54.5 | % | | | | | | | | |
Ian Craig, Coca-Cola FEMSA’s CEO, commented:
“We are pleased to report another set of positive results. During the quarter, our volume grew across all territories, and surpassed a billion unit cases for the first time during a quarter. Notably, our efforts to optimize costs and generate efficiencies, resulted in sequential margin improvements. On the digital front, the rollout of Juntos+, our B2B omnichannel platform, enabled us to reach more than US$ 1 billion in digital sales during the first six months of year. All this, as we continue bolstering our customer centricity to deepen our connection with our customers and improve their overall experience. As we enter the second half of the year, we are confident in our ability to maintain our growth momentum.
Finally, I want to congratulate our team at Coca-Cola FEMSA Argentina, which was recognized by The Coca-Cola Company with the Candler Cup 2022 due to its excellence in execution, talent, and culture. Working together as one single team with our colleagues from The Coca-Cola Company, our team in Argentina have made this recognition possible.”
| (1) | Quarterly earnings / outstanding shares. Earnings per share (EPS) were calculated using 16,806.7 million shares outstanding. For the convenience of the reader, as a KOFUBL Unit is comprised of 8 shares (3 Series B shares and 5 Series L shares), earnings per unit are equal to EPS multiplied by 8. Each ADS represents 10 KOFUBL Units. |
| (2) | Please refer to page 10 for our definition of “comparable” and a description of the factors affecting the comparability of our financial and operating performance. |
| Coca-Cola FEMSA Reports 2Q23 Results | Page 26 of 41 |  |
| July 25, 2023 | |
RECENT DEVELOPMENTS
| · | On May 3, 2023, Coca-Cola FEMSA paid the first installment of the dividend declared in the Annual Ordinary General Shareholders’ Meeting in the amount of Ps. 0.3625 per share, for a total cash distribution of Ps. 6,092 million. |
| · | On June 12, 2023, Coca-Cola FEMSA provided an update on the previously disclosed cybersecurity incident. In this update, the Company announced that its investigation determined that the party responsible for the incident extracted and published certain Company data. Importantly, the Company also announced that this cybersecurity incident did not materially adversely impact Coca-Cola FEMSA’s business operations or related functions, and our service to customers continues uninterrupted. Data security is extremely important to us. Our team, including third party experts, has been working to enhance our cybersecurity risk management program and security posture. |
| · | On July 12, 2023, Coca-Cola FEMSA, The Coca-Cola Company, and other leading bottling partners announced the creation of a sustainability-focused venture capital fund in partnership with Greycroft. The creation of the US$137.7 million fund will focus on key investments in packaging, decarbonization, and other initiatives with the potential to reduce the Coca-Cola system’s carbon footprint. The fund’s US$137.7 million in capital comes primarily from US$15 million of committed capital from each of the participating companies. |
| · | On July 18, 2023, Coca-Cola FEMSA Argentina was awarded by The Coca-Cola Company with the Candler Cup 2022. The Candler cup, named after Asa Candler, founder of The Coca-Cola Company and who granted the first Coca-Cola franchise, is an award given to a bottler in recognition for its excellence in execution, coupled with its investments behind its people’s development, training, and culture. |
CONFERENCE CALL INFORMATION
| Coca-Cola FEMSA Reports 2Q23 Results | Page 27 of 41 | |
| July 25, 2023 | |
CONSOLIDATED SECOND QUARTER RESULTS
| CONSOLIDATED SECOND QUARTER RESULTS |
| | | As Reported | | | Comparable (1) | |
| Expressed in millions of Mexican pesos | | 2Q 2023 | | | 2Q 2022 | | | Δ% | | | Δ% | |
| Total revenues | | | 61,428 | | | | 57,311 | | | | 7.2 | % | | | 16.9 | % |
| Gross profit | | | 27,267 | | | | 25,271 | | | | 7.9 | % | | | 16.9 | % |
| Operating income | | | 8,562 | | | | 7,652 | | | | 11.9 | % | | | 18.7 | % |
| EBITDA (2) | | | 11,439 | | | | 10,607 | | | | 7.8 | % | | | 16.0 | % |
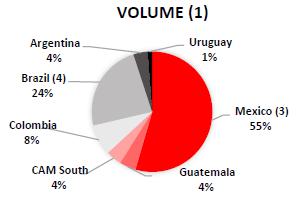
Volume increased 7.0% to 1,018.9 million unit cases, driven by volume growth in all of our territories, including strong performances in Mexico, Brazil, Guatemala, and Uruguay. Excluding the acquisition of the Cristal bulk water business in Mexico, total volume would have increased 5.2%.
Total revenues increased 7.2% to Ps. 61,428 million. Volume growth, revenue management initiatives, and favorable mix effects drove this increase. These factors were partially offset by an unfavorable currency translation into Mexican Pesos. On a comparable basis, excluding currency translations, total revenues increased 16.9%.
Gross profit increased 7.9% to Ps. 27,267 million, and gross margin increased 30 basis points to 44.4%. This gross profit increase was driven mainly by our top-line growth and favorable raw material hedging initiatives, partially offset by higher sweetener costs across our territories. On a comparable basis, gross profit increased 16.9%
Operating income increased 11.9% to Ps. 8,562 million, and operating margin increased 50 basis points to 13.9%. This expansion was driven mainly by a solid top-line performance and an operating foreign exchange gain in Mexico as a result of the appreciation of the Mexican Peso. These effects were partially offset by an increase in raw material costs, mainly sweeteners, coupled with an increase in operating expenses such as labor, marketing, and maintenance. On a comparable basis, operating income increased 18.7%.
| (1) | Please refer to page 10 for our definition of “comparable” and a description of the factors affecting the comparability of our financial and operating performance. |
| (2) | EBITDA = operating income + depreciation + amortization & other operating non-cash charges. |
| Coca-Cola FEMSA Reports 2Q23 Results | Page 28 of 41 | |
| July 25, 2023 | |
Comprehensive financing result recorded an expense of Ps. 1,377 million, compared to an expense of Ps. 574 million in the previous year. This increase was driven mainly by a foreign exchange loss of Ps. 437 million as compared to a gain of Ps. 80 million, as our net cash exposure in U.S. dollars was negatively impacted by the appreciation of the Mexican Peso and the Brazilian Real.
Additionally, we recorded a loss of Ps. 68 million in financial instruments as compared to a gain of Ps. 355 million due to a one-off market value gain recognized during the same period of 2022. In accordance with IFRS 9, as of the second quarter 2022, we are recognizing the hedging gain or loss on the debt instrument that is being hedged using interest rate derivatives.
These effects were partially offset by a decrease in our interest expense, net, mainly as a result of a higher gain in our interest income that was driven by an increase in interest rates.
Finally, we recognized a lower gain in monetary position in inflationary subsidiaries during the second quarter of 2023 as compared to the same period of the previous year.
Income tax as a percentage of income before taxes was 27.2% as compared to 35.5% during the same period of 2022. This decrease was driven mainly by favorable inflationary effects in Mexico and deferred taxes.
Net income attributable to equity holders of the company was Ps. 4,926 million as compared to Ps. 4,627 million during the same period of the previous year. This increase was driven mainly by operating income growth, partially offset by an increase in our comprehensive financing result. Earnings per share1 were Ps. 0.29 (Earnings per unit were Ps. 2.34 and per ADS were Ps. 23.45.).
| (1) | Quarterly earnings / outstanding shares. Earnings per share (EPS) were calculated using 16,806.7 million shares outstanding. For the convenience of the reader, as a KOFUBL Unit is comprised of 8 shares (3 Series B shares and 5 Series L shares), earnings per unit are equal to EPS multiplied by 8. Each ADS represents 10 KOFUBL Units. |
| Coca-Cola FEMSA Reports 2Q23 Results | Page 29 of 41 | |
| July 25, 2023 | |
CONSOLIDATED FIRST six months RESULTS
CONSOLIDATED FIRST SIX MONTHS RESULTS
| | | As Reported | | | Comparable (1) | |
| Expressed in millions of Mexican pesos | | YTD 2023 | | | YTD 2022 | | | Δ% | | | Δ% | |
| Total revenues | | | 118,641 | | | | 108,635 | | | | 9.2 | % | | | 19.2 | % |
| Gross profit | | | 52,657 | | | | 47,933 | | | | 9.9 | % | | | 19.2 | % |
| Operating income | | | 16,269 | | | | 14,512 | | | | 12.1 | % | | | 19.4 | % |
| EBITDA (2) | | | 21,930 | | | | 20,461 | | | | 7.2 | % | | | 15.6 | % |
Volume increased 6.8% to 1,958.5 million unit cases, driven by volume growth in all of our territories, including strong performances in Mexico, Brazil, and Guatemala. Excluding the acquisition of the Cristal bulk water business in Mexico, total volume increased 5.0%.
Total revenues increased 9.2% to Ps. 118,641 million. Volume growth, revenue management initiatives, and favorable mix effects drove this increase. These factors were partially offset by an unfavorable currency translation into Mexican Pesos. On a comparable basis, total revenues increased 19.2%.
Gross profit increased 9.9% to Ps. 52,657 million, and gross margin expanded 30 basis points to 44.4%. This gross profit increase was driven mainly by our top-line growth and favorable raw material hedging initiatives. These effects were partially offset by higher sweetener costs across our territories. On a comparable basis, gross profit increased 19.2%.
Operating income increased 12.1% to Ps. 16,269 million, and operating margin expanded 30 basis points to 13.7%. This was driven mainly by a solid top-line performance and an operating foreign exchange gain in Mexico as a result of the appreciation of the Mexican Peso. These effects were partially offset by an increase in raw material costs, mainly sweeteners, coupled with an increase in operating expenses such as labor, marketing, and maintenance. On a comparable basis, operating income increased 19.4%.
| (1) | Please refer to page 10 for our definition of “comparable” and a description of the factors affecting the comparability of our financial and operating performance. |
| (2) | EBITDA = operating income + depreciation + amortization & other operating non-cash charges. |
| Coca-Cola FEMSA Reports 2Q23 Results | Page 30 of 41 | |
| July 25, 2023 | |
Comprehensive financing result recorded an expense of Ps. 2,774 million, compared to an expense of Ps. 2,765 million in the previous year. This is explained mainly by a higher foreign exchange loss of Ps. 1,066 million as compared to a loss of Ps. 85 million during the first six months of the previous year, as our net cash exposure in U.S. dollars was negatively impacted by the appreciation of the Mexican Peso and the Brazilian Real. In addition, we recorded a lower gain in monetary position in inflationary subsidiaries of Ps. 120 million as compared to a gain of Ps. 292 million during the same period of the previous year.
These effects were partially offset by a decrease in our interest expense, net, mainly as a result of a gain in our interest income of Ps. 1,866 million as compared to a gain of Ps. 948 million that was driven by an increase in interest rates.
Finally, we recorded a lower loss in financial instruments of Ps. 15 million as compared to a loss of Ps. 581 million during the same period of the previous year. This was driven mainly by a market value loss recorded during the first quarter of 2022, partially offset by a market value gain recognized during the second quarter of 2022. In accordance with IFRS 9, as of the second quarter of 2022, we are recognizing the hedging gain or loss on the debt instrument that is being hedged using interest rate derivatives.
Income tax as a percentage of income before taxes was 29.6% as compared to 33.2% during the same period of 2022. This decrease was driven mainly by favorable inflationary effects in Mexico and deferred taxes.
Net income attributable to equity holders of the company increased 17.3% to reach Ps. 8,837 million during the first six months of 2023, as compared to Ps. 7,532 million during the same period of the previous year. This increase was driven mainly by operating income growth. Earnings per share1 were Ps. 0.53 (Earnings per unit were Ps. 4.21 and per ADS were Ps. 42.07.).
| (1) | Quarterly earnings / outstanding shares. Earnings per share (EPS) were calculated using 16,806.7 million shares outstanding. For the convenience of the reader, as a KOFUBL Unit is comprised of 8 shares (3 Series B shares and 5 Series L shares), earnings per unit are equal to EPS multiplied by 8. Each ADS represents 10 KOFUBL Units. |
| Coca-Cola FEMSA Reports 2Q23 Results | Page 31 of 41 | |
| July 25, 2023 | |
MEXICO & CENTRAL AMERICA DIVISION SECOND QUARTER RESULTS
| (Mexico, Guatemala, Costa Rica, Panama, and Nicaragua) |  |

MEXICO & CENTRAL AMERICA DIVISION RESULTS
| | | As Reported | | | Comparable (1) | |
| Expressed in millions of Mexican pesos | | 2Q 2023 | | | 2Q 2022 | | | Δ% | | | Δ% | |
| Total revenues | | | 39,088 | | | | 34,475 | | | | 13.4 | % | | | 15.1 | % |
| Gross profit | | | 18,635 | | | | 16,495 | | | | 13.0 | % | | | 14.6 | % |
| Operating income | | | 6,509 | | | | 5,727 | | | | 13.7 | % | | | 15.1 | % |
| EBITDA (2) | | | 8,229 | | | | 7,533 | | | | 9.2 | % | | | 10.8 | % |
Volume increased 8.9% driven by growth across all of our territories in the division, including solid performance from Mexico and Guatemala. These volumes include the integration of the Cristal bulk water business, excluding these volumes, volume increased 6.0% in the division and 4.5% in Mexico.
Total revenues increased 13.4% to Ps. 39,088 million, driven by volume growth and revenue management initiatives. These effects were partially offset by unfavorable currency translation effects from most of our operating currencies in Central America. On a comparable basis, excluding currency translation effects, total revenues increased 15.1%.
Gross profit increased 13.0% to Ps. 18,635 million, and gross margin contracted 10 basis points to 47.7%. This margin decrease was driven mainly by an increase in raw material costs such as sweeteners and concentrate in Mexico. These effects were partially offset by our top-line growth, favorable raw material hedging initiatives, and the appreciation of the Mexican Peso as applied to our U.S. dollar-denominated raw material costs. On a comparable basis, gross profit increased 14.6%.
Operating income increased 13.7% to Ps. 6,509 million, and operating margin expanded 10 basis points to 16.7%, driven mainly by our top-line growth and an operating foreign exchange gain in Mexico. These effects were partially offset by an increase in operating expenses such as labor, marketing, and maintenance. On a comparable basis, operating income increased 15.1%.
| (1) | Please refer to page 10 for our definition of “comparable” and a description of the factors affecting the comparability of our financial and operating performance. |
| (2) | EBITDA = operating income + depreciation + amortization & other operating non-cash charges. |
| Coca-Cola FEMSA Reports 2Q23 Results | Page 32 of 41 | |
| July 25, 2023 | |
SOUTH AMERICA DIVISION SECOND QUARTER RESULTS
| (Brazil, Argentina, Colombia, and Uruguay) |  |
SOUTH AMERICA DIVISION RESULTS
| | | As Reported | | | Comparable (1) | |
| Expressed in millions of Mexican pesos | | 2Q 2023 | | | 2Q 2022 | | | Δ% | | | Δ% | |
| Total revenues | | | 22,341 | | | | 22,835 | | | | (2.2 | )% | | | 20.3 | % |
| Gross profit | | | 8,632 | | | | 8,776 | | | | (1.6 | )% | | | 22.1 | % |
| Operating income | | | 2,053 | | | | 1,926 | | | | 6.6 | % | | | 31.5 | % |
| EBITDA (2) | | | 3,209 | | | | 3,074 | | | | 4.4 | % | | | 32.0 | % |
Volume increased 3.8% driven by growth across all of our territories in the division.
Total revenues decreased 2.2% to Ps. 22,341 million. This decline was driven mainly by unfavorable currency translation effects of all of our operating currencies in the division into Mexican Pesos. These effects were partially offset by a positive underlying operating performance that includes volume growth, revenue management, and favorable mix effects. On a comparable basis, total revenues increased 20.3%.
Gross profit decreased 1.6% to Ps. 8,632 million, and gross margin expanded 20 basis points to 38.6%. This decrease was driven mainly by increases in raw material costs such as sweeteners that were partially offset by our top-line growth, favorable mix effects, and raw material hedging strategies. On a comparable basis, gross profit increased 22.1%.
Operating income increased 6.6% to Ps. 2,053 million in the second quarter of 2023, resulting in an operating margin expansion of 80 basis points to 9.2%. This increase was driven mainly by operating expense efficiencies and an increase in operating leverage resulting from volume growth. These effects were partially offset by higher labor and marketing expenses. On a comparable basis, operating income increased 31.5%.
| (1) | Please refer to page 10 for our definition of “comparable” and a description of the factors affecting the comparability of our financial and operating performance. |
| (2) | EBITDA = operating income + depreciation + amortization & other operating non-cash charges. |
| Coca-Cola FEMSA Reports 2Q23 Results | Page 33 of 41 | |
| July 25, 2023 | |
DEFINITIONS
Volume is expressed in unit cases. Unit case refers to 192 ounces of finished beverage product (24 eight-ounce servings) and, when applied to soda fountains, refers to the volume of syrup, powders, and concentrate that is required to produce 192 ounces of finished beverage product.
Transactions refers to the number of single units (e.g., a can or a bottle) sold, regardless of their size or volume or whether they are sold individually or in multipacks, except for soda fountains, which represent multiple transactions based on a standard 12 oz. serving.
Operating income is a non-GAAP financial measure computed as “gross profit – operating expenses – other operating expenses, net + operative equity method (gain) loss in associates.”
EBITDA is a non-GAAP financial measure computed as “operating income + depreciation + amortization & other operating non-cash charges.”
Earnings per share are equal to “quarterly earnings / outstanding shares.” Earnings per share (EPS) for all periods are adjusted to give effect to the stock split resulting in 16,806,658,096 shares outstanding. For the convenience of the reader, as a KOFUBL Unit is comprised of 8 shares (3 Series B shares and 5 Series L shares), earnings per unit are equal to EPS multiplied by 8. Each ADS represents 10 KOFUBL Units.
COMPARABILITY
Our “comparable” term means, with respect to a year-over-year comparison, the change of a given measure excluding the effects of: (i) mergers, acquisitions, and divestitures, in this case the acquisition of CVI in Brazil, integrated as of February 2022; and (ii) translation effects resulting from exchange rate movements. In preparing this measure, management has used its best judgment, estimates, and assumptions in order to maintain comparability.
| Coca-Cola FEMSA Reports 2Q23 Results | Page 34 of 41 | |
| July 25, 2023 | |
ABOUT THE COMPANY
Stock listing information: Mexican Stock Exchange, Ticker: KOFUBL | NYSE (ADS), Ticker: KOF | Ratio of KOFUBL to KOF = 10:1
Coca-Cola FEMSA files reports, including annual reports and other information, with the U.S. Securities and Exchange Commission, or the “SEC,” and the Mexican Stock Exchange (Bolsa Mexicana de Valores, or the “BMV”) pursuant to the rules and regulations of the SEC (that apply to foreign private issuers) and of the BMV. Filings we make electronically with the SEC and the BMV are available to the public on the Internet at the SEC’s website at www.sec.gov, the BMV’s website at www.bmv.com.mx, and our website at www.coca-colafemsa.com.
Coca-Cola FEMSA, S.A.B. de C.V. is the largest Coca-Cola franchise bottler in the world by sales volume. The Company produces and distributes trademark beverages of The Coca-Cola Company, offering a wide portfolio of 131 brands to a population of more than 266 million. With over 80 thousand employees, the Company markets and sells approximately 3.5 billion unit cases through 2 million points of sale a year. Operating 49 manufacturing plants and 260 distribution centers, Coca-Cola FEMSA is committed to generating economic, social, and environmental value for all of its stakeholders across the value chain. The Company is a member of the Dow Jones Sustainability Emerging Markets Index, Dow Jones Sustainability MILA Pacific Alliance Index, FTSE4Good Emerging Index, and the Mexican Stock Exchange’s IPC and Social Responsibility and Sustainability Indices, among others. Its operations encompass franchise territories in Mexico, Brazil, Guatemala, Colombia, and Argentina, and, nationwide, in Costa Rica, Nicaragua, Panama, Uruguay, and Venezuela through its investment in KOF Venezuela. For further information, please visit www.coca-colafemsa.com.

ADDITIONAL INFORMATION
All of the financial information presented in this report was prepared under International Financial Reporting Standards (IFRS).
This news release may contain forward-looking statements concerning Coca-Cola FEMSA’s future performance, which should be considered as good faith estimates by Coca-Cola FEMSA. These forward-looking statements reflect management’s expectations and are based upon currently available data. Actual results are subject to future events and uncertainties, many of which are outside Coca-Cola FEMSA’s control, which could materially impact the Company’s actual performance. References herein to “US$” are to United States dollars. This news release contains translations of certain Mexican peso amounts into U.S. dollars for the convenience of the reader. These translations should not be construed as representations that Mexican peso amounts actually represent such U.S. dollar amounts or could be converted into U.S. dollars at the rate indicated.
(6 pages of tables to follow)
| Coca-Cola FEMSA Reports 2Q23 Results | Page 35 of 41 | |
| July 25, 2023 | |
COCA-COLA FEMSA
CONSOLIDATED INCOME STATEMENT
Millions of Pesos (1)
| | | For the Second Quarter of: | | | For the First six months of: | |
| | | 2023 | | | % of Rev. | | | 2022 | | | % of Rev. | | | Δ%
Reported | | | Δ%
Comparable (7) | | | 2023 | | | % of Rev. | | | 2022 | | | % of Rev. | | | Δ%
Reported | | | Δ%
Comparable (7) | |
| Transactions (million transactions) | | | 5,933.0 | | | | | | | | 5,636.1 | | | | | | | | 5.3 | % | | | 5.3 | % | | | 11,500.2 | | | | | | | | 10,847.6 | | | | | | | | 6.0 | % | | | 5.8 | % |
| Volume (million unit cases) | | | 1,018.9 | | | | | | | | 952.4 | | | | | | | | 7.0 | % | | | 7.0 | % | | | 1,958.5 | | | | | | | | 1,834.1 | | | | | | | | 6.8 | % | | | 6.6 | % |
| Average price per unit case | | | 58.31 | | | | | | | | 60.05 | | | | | | | | -2.9 | % | | | | | | | 58.70 | | | | | | | | 59.10 | | | | | | | | -0.7 | % | | | | |
| Net revenues | | | 61,283 | | | | | | | | 57,190 | | | | | | | | 7.2 | % | | | | | | | 118,285 | | | | | | | | 108,395 | | | | | | | | 9.1 | % | | | | |
| Other operating revenues | | | 145 | | | | | | | | 121 | | | | | | | | 20.5 | % | | | | | | | 356 | | | | | | | | 239 | | | | | | | | 48.7 | % | | | | |
| Total revenues (2) | | | 61,428 | | | | 100.0 | % | | | 57,311 | | | | 100.0 | % | | | 7.2 | % | | | 16.9 | % | | | 118,641 | | | | 100.0 | % | | | 108,635 | | | | 100.0 | % | | | 9.2 | % | | | 19.2 | % |
| Cost of goods sold | | | 34,161 | | | | 55.6 | % | | | 32,039 | | | | 55.9 | % | | | 6.6 | % | | | | | | | 65,984 | | | | 55.6 | % | | | 60,702 | | | | 55.9 | % | | | 8.7 | % | | | | |
| Gross profit | | | 27,267 | | | | 44.4 | % | | | 25,271 | | | | 44.1 | % | | | 7.9 | % | | | 16.9 | % | | | 52,657 | | | | 44.4 | % | | | 47,933 | | | | 44.1 | % | | | 9.9 | % | | | 19.2 | % |
| Operating expenses | | | 18,796 | | | | 30.6 | % | | | 17,448 | | | | 30.4 | % | | | 7.7 | % | | | | | | | 36,571 | | | | 30.8 | % | | | 33,249 | | | | 30.6 | % | | | 10.0 | % | | | | |
| Other operative expenses, net | | | (46 | ) | | | -0.1 | % | | | 260 | | | | 0.5 | % | | | NA | | | | | | | | (78 | ) | | | -0.1 | % | | | 282 | | | | 0.3 | % | | | NA | | | | | |
| Operative equity method (gain) loss in associates(3) | | | (44 | ) | | | -0.1 | % | | | (89 | ) | | | -0.2 | % | | | -50.6 | % | | | | | | | (105 | ) | | | -0.1 | % | | | (109 | ) | | | -0.1 | % | | | -4.4 | % | | | | |
| Operating income (5) | | | 8,562 | | | | 13.9 | % | | | 7,652 | | | | 13.4 | % | | | 11.9 | % | | | 18.7 | % | | | 16,269 | | | | 13.7 | % | | | 14,512 | | | | 13.4 | % | | | 12.1 | % | | | 19.4 | % |
| Other non operative expenses, net | | | 228 | | | | 0.4 | % | | | 70 | | | | 0.1 | % | | | 227.1 | % | | | | | | | 351 | | | | 0.3 | % | | | 249 | | | | 0.2 | % | | | 41.0 | % | | | | |
| Non Operative equity method (gain) loss in associates (4) | | | 31 | | | | 0.1 | % | | | (25 | ) | | | 0.0 | % | | | NA | | | | | | | | 165 | | | | 0.1 | % | | | (29 | ) | | | 0.0 | % | | | NA | | | | | |
| Interest expense | | | 1,769 | | | | | | | | 1,688 | | | | | | | | 4.8 | % | | | | | | | 3,678 | | | | | | | | 3,339 | | | | | | | | 10.2 | % | | | | |
| Interest income | | | 834 | | | | | | | | 541 | | | | | | | | 54.3 | % | | | | | | | 1,866 | | | | | | | | 948 | | | | | | | | 96.8 | % | | | | |
| Interest expense, net | | | 935 | | | | | | | | 1,147 | | | | | | | | -18.5 | % | | | | | | | 1,812 | | | | | | | | 2,391 | | | | | | | | -24.2 | % | | | | |
| Foreign exchange loss (gain) | | | 437 | | | | | | | | (80 | ) | | | | | | | NA | | | | | | | | 1,066 | | | | | | | | 85 | | | | | | | | 1151.4 | % | | | | |
| Loss (gain) on monetary position in inflationary subsidiaries | | | (63 | ) | | | | | | | (138 | ) | | | | | | | -54.3 | % | | | | | | | (120 | ) | | | | | | | (292 | ) | | | | | | | -59.0 | % | | | | |
| Market value (gain) loss on financial instruments | | | 68 | | | | | | | | (355 | ) | | | | | | | NA | | | | | | | | 15 | | | | | | | | 581 | | | | | | | | NA | | | | | |
| Comprehensive financing result | | | 1,377 | | | | | | | | 574 | | | | | | | | 139.9 | % | | | | | | | 2,774 | | | | | | | | 2,765 | | | | | | | | 0.3 | % | | | | |
| Income before taxes | | | 6,926 | | | | | | | | 7,034 | | | | | | | | -1.5 | % | | | | | | | 12,978 | | | | | | | | 11,526 | | | | | | | | 12.6 | % | | | | |
| Income taxes | | | 1,881 | | | | | | | | 2,458 | | | | | | | | -23.5 | % | | | | | | | 3,860 | | | | | | | | 3,787 | | | | | | | | 1.9 | % | | | | |
| Result of discontinued operations | | | - | | | | | | | | - | | | | | | | | NA | | | | | | | | - | | | | | | | | - | | | | | | | | NA | | | | | |
| Consolidated net income | | | 5,045 | | | | | | | | 4,576 | | | | | | | | 10.3 | % | | | | | | | 9,118 | | | | | | | | 7,740 | | | | | | | | 17.8 | % | | | | |
| Net income attributable to equity holders of the company | | | 4,926 | | | | 8.0 | % | | | 4,627 | | | | 8.1 | % | | | 6.5 | % | | | 12.0 | % | | | 8,837 | | | | 7.4 | % | | | 7,532 | | | | 6.9 | % | | | 17.3 | % | | | 27.8 | % |
| Non-controlling interest | | | 119 | | | | 0.2 | % | | | (51 | ) | | | -0.1 | % | | | NA | | | | | | | | 281 | | | | 0.2 | % | | | 208 | | | | 0.2 | % | | | 35.1 | % | | | | |
| EBITDA & CAPEX | | 2023 | | | % of Rev. | | | 2022 | | | % of Rev. | | | Δ%
Reported | | | Δ%
Comparable (7) | | | 2023 | | | % of Rev. | | | 2022 | | | % of Rev. | | | Δ%
Reported | | | Δ%
Comparable (7) | |
| Operating income (5) | | | 8,562 | | | | 13.9 | % | | | 7,652 | | | | 13.4 | % | | | 11.9 | % | | | 18.7 | % | | | 16,269 | | | | 13.7 | % | | | 14,512 | | | | 13.4 | % | | | 12.1 | % | | | 19.4 | % |
| Depreciation | | | 2,397 | | | | | | | | 2,399 | | | | | | | | -0.1 | % | | | | | | | 4,717 | | | | | | | | 4,755 | | | | | | | | -0.8 | % | | | | |
| Amortization and other operative non-cash charges | | | 480 | | | | | | | | 556 | | | | | | | | -13.7 | % | | | | | | | 945 | | | | | | | | 1,195 | | | | | | | | -20.9 | % | | | | |
| EBITDA (5)(6) | | | 11,439 | | | | 18.6 | % | | | 10,607 | | | | 18.5 | % | | | 7.8 | % | | | 16.0 | % | | | 21,930 | | | | 18.5 | % | | | 20,461 | | | | 18.8 | % | | | 7.2 | % | | | 15.6 | % |
| CAPEX(8) | | | 4,252 | | | | | | | | 4,052 | | | | | | | | 4.9 | % | | | | | | | 6,749 | | | | | | | | 7,157 | | | | | | | | -5.7 | % | | | | |
(1) Except volume and average price per unit case figures.
(2) Please refer to page 15 for revenue breakdown.
(3) Includes equity method in Jugos del Valle and Leão Alimentos, among others.
(4) Includes equity method in PIASA, IEQSA, Beta San Miguel, IMER, and KSP Participacoes, among others.
(5) The operating income and EBITDA lines are presented as non-GAAP measures for the convenience of the reader.
(6) EBITDA = operating income + depreciation, amortization & other operating non-cash charges.
(7) Please refer to page 10 for our definition of “comparable” and a description of the factors affecting the comparability of our financial and operating performance.
(8) As of June 30, 2023, the investment in fixed assets effectively paid is equivalent to Ps. 6,503 million.
| Coca-Cola FEMSA Reports 2Q23 Results | Page 36 of 41 | |
| July 25, 2023 | |
MEXICO & CENTRAL AMERICA DIVISION
RESULTS OF OPERATIONS
Millions of Pesos (1)
| | | For the Second Quarter of: | | | For the First Six Months of: | |
| | | 2023 | | | % of
Rev. | | | 2022 | | | % of
Rev. | | | Δ%
Reported | | | Δ%
Comparable (6) | | | 2023 | | | % of
Rev. | | | 2022 | | | % of
Rev. | | | Δ%
Reported | | | Δ%
Comparable (6) | |
| Transactions (million transactions) | | | 3,303.6 | | | | | | | | 3,126.6 | | | | | | | | 5.7 | % | | | 5.7 | % | | | 6,130.4 | | | | | | | | 5,774.9 | | | | | | | | 6.2 | % | | | 6.2 | % |
| Volume (million unit cases) | | | 643.3 | | | | | | | | 590.7 | | | | | | | | 8.9 | % | | | 8.9 | % | | | 1,180.7 | | | | | | | | 1,084.7 | | | | | | | | 8.8 | % | | | 8.8 | % |
| Average price per unit case | | | 60.44 | | | | | | | | 58.35 | | | | | | | | 3.6 | % | | | | | | | 61.40 | | | | | | | | 58.44 | | | | | | | | 5.1 | % | | | | |
| Net revenues | | | 39,081 | | | | | | | | 34,466 | | | | | | | | | | | | | | | | 72,693 | | | | | | | | 63,393 | | | | | | | | | | | | | |
| Other operating revenues | | | 6 | | | | | | | | 9 | | | | | | | | | | | | | | | | 12 | | | | | | | | 17 | | | | | | | | | | | | | |
| Total Revenues (2) | | | 39,088 | | | | 100.0 | % | | | 34,475 | | | | 100.0 | % | | | 13.4 | % | | | 15.1 | % | | | 72,705 | | | | 100.0 | % | | | 63,410 | | | | 100.0 | % | | | 14.7 | % | | | 16.4 | % |
| Cost of goods sold | | | 20,452 | | | | 52.3 | % | | | 17,980 | | | | 52.2 | % | | | | | | | | | | | 38,151 | | | | 52.5 | % | | | 32,908 | | | | 51.9 | % | | | | | | | | |
| Gross profit | | | 18,635.4 | | | | 47.7 | % | | | 16,495.0 | | | | 47.8 | % | | | 13.0 | % | | | 14.6 | % | | | 34,554.2 | | | | 47.5 | % | | | 30,501.8 | | | | 48.1 | % | | | 13.3 | % | | | 14.9 | % |
| Operating expenses | | | 12,251.8 | | | | 31.3 | % | | | 10,562.0 | | | | 30.6 | % | | | | | | | | | | | 23,310.5 | | | | 0.3 | | | | 19,667.5 | | | | 0.3 | | | | | | | | | |
| Other operative expenses, net | | | (101 | ) | | | -0.3 | % | | | 236 | | | | 0.7 | % | | | | | | | | | | | (212 | ) | | | -0.3 | % | | | 234 | | | | 0.4 | % | | | | | | | | |
| Operative equity method (gain) loss in associates (3) | | | (24 | ) | | | -0.1 | % | | | (30 | ) | | | -0.1 | % | | | | | | | | | | | (64 | ) | | | -0.1 | % | | | (76 | ) | | | -0.1 | % | | | | | | | | |
| Operating income (4) | | | 6,509 | | | | 16.7 | % | | | 5,727 | | | | 16.6 | % | | | 13.7 | % | | | 15.1 | % | | | 11,520 | | | | 15.8 | % | | | 10,677 | | | | 16.8 | % | | | 7.9 | % | | | 7.9 | % |
| Depreciation, amortization & other operating non-cash charges | | | 1,720 | | | | 4.4 | % | | | 1,806 | | | | 5.2 | % | | | | | | | | | | | 3,415 | | | | 4.7 | % | | | 3,579 | | | | 5.6 | % | | | | | | | | |
| EBITDA (4)(5) | | | 8,229 | | | | 21.1 | % | | | 7,533 | | | | 21.9 | % | | | 9.2 | % | | | 10.8 | % | | | 14,935 | | | | 20.5 | % | | | 14,256 | | | | 22.5 | % | | | 4.8 | % | | | 4.8 | % |
(1) Except volume and average price per unit case figures.
(2) Please refer to page 15 for revenue breakdown.
(3) Includes equity method in Jugos del Valle, among others.
(4) The operating income and EBITDA lines are presented as non-GAAP measures for the convenience of the reader.
(5) EBITDA = operating income + depreciation, amortization & other operating non-cash charges.
(6) Please refer to page 10 for our definition of “comparable” and a description of the factors affecting the comparability of our financial and operating performance.
SOUTH AMERICA DIVISION
RESULTS OF OPERATIONS
Millions of Pesos (1)
| | | For the Second Quarter of: | | | For the First Six Months of: | |
| | | 2023 | | | % of
Rev. | | | 2022 | | | % of
Rev. | | | Δ%
Reported | | | Δ%
Comparable (6) | | | 2023 | | | % of
Rev. | | | 2022 | | | % of
Rev. | | | Δ%
Reported | | | Δ%
Comparable (6) | |
| Transactions (million transactions) | | | 2,629.4 | | | | | | | | 2,509.5 | | | | | | | | 4.8 | % | | | 4.8 | % | | | 5,369.8 | | | | | | | | 5,072.6 | | | | | | | | 5.9 | % | | | 5.4 | % |
| Volume (million unit cases) | | | 375.7 | | | | | | | | 361.7 | | | | | | | | 3.8 | % | | | 3.8 | % | | | 777.9 | | | | | | | | 749.4 | | | | | | | | 3.8 | % | | | 3.3 | % |
| Average price per unit case | | | 54.66 | | | | | | | | 59.27 | | | | | | | | -7.8 | % | | | | | | | 54.60 | | | | | | | | 56.68 | | | | | | | | -3.7 | % | | | | |
| Net revenues | | | 22,202 | | | | | | | | 22,724 | | | | | | | | | | | | | | | | 45,592 | | | | | | | | 45,003 | | | | | | | | | | | | | |
| Other operating revenues | | | 139 | | | | | | | | 111 | | | | | | | | | | | | | | | | 344 | | | | | | | | 222 | | | | | | | | | | | | | |
| Total Revenues (2) | | | 22,341 | | | | 100.0 | % | | | 22,835 | | | | 100.0 | % | | | -2.2 | % | | | 20.3 | % | | | 45,936 | | | | 100.0 | % | | | 45,225 | | | | 100.0 | % | | | 1.6 | % | | | 23.9 | % |
| Cost of goods sold | | | 13,709 | | | | 61.4 | % | | | 14,059 | | | | 61.6 | % | | | | | | | | | | | 27,833 | | | | 60.6 | % | | | 27,793 | | | | 61.5 | % | | | | | | | | |
| Gross profit | | | 8,632 | | | | 38.6 | % | | | 8,776 | | | | 38.4 | % | | | -1.6 | % | | | 22.1 | % | | | 18,103 | | | | 39.4 | % | | | 17,431 | | | | 38.5 | % | | | 3.9 | % | | | 28.5 | % |
| Operating expenses | | | 6,544 | | | | 29.3 | % | | | 6,886 | | | | 30.2 | % | | | | | | | | | | | 13,261 | | | | 28.9 | % | | | 13,581 | | | | 30.0 | % | | | | | | | | |
| Other operative expenses, net | | | 55 | | | | 0.2 | % | | | 23 | | | | 0.1 | % | | | | | | | | | | | 134 | | | | 0.3 | % | | | 48 | | | | 0.1 | % | | | | | | | | |
| Operative equity method (gain) loss in associates (3) | | | (20 | ) | | | -0.1 | % | | | (59 | ) | | | -0.3 | % | | | | | | | | | | | (41 | ) | | | -0.1 | % | | | (33 | ) | | | -0.1 | % | | | | | | | | |
| Operating income (4) | | | 2,053.2 | | | | 9.2 | % | | | 1,925.7 | | | | 8.4 | % | | | 6.6 | % | | | 31.5 | % | | | 4,748.7 | | | | 10.3 | % | | | 3,835.3 | | | | 8.5 | % | | | 23.8 | % | | | 54.5 | % |
| Depreciation, amortization & other operating non-cash charges | | | 1,156 | | | | 5.2 | % | | | 1,148 | | | | 5.0 | % | | | | | | | | | | | 2,246 | | | | 4.9 | % | | | 2,370 | | | | 5.2 | % | | | | | | | | |
| EBITDA (4)(5) | | | 3,209 | | | | 14.4 | % | | | 3,074 | | | | 13.5 | % | | | 4.4 | % | | | 32.0 | % | | | 6,995 | | | | 15.2 | % | | | 6,206 | | | | 13.7 | % | | | 12.7 | % | | | 42.6 | % |
(1) Except volume and average price per unit case figures.
(2) Please refer to page 15 for revenue breakdown.
(3) Includes equity method in Leão Alimentos, among others.
(4) The operating income and EBITDA lines are presented as non-GAAP measures for the convenience of the reader.
(5) EBITDA = operating income + depreciation, amortization & other operating non-cash charges.
(6) Please refer to page 10 for our definition of “comparable” and a description of the factors affecting the comparability of our financial and operating performance.
| Coca-Cola FEMSA Reports 2Q23 Results | Page 37 of 41 | |
| July 25, 2023 | |
COCA-COLA FEMSA
CONSOLIDATED BALANCE SHEET
Millions of Pesos
| Assets | | Jun-23 | | | Dec-22 | | | % Var. | |
| Current Assets | | | | | | | | | |
| Cash, cash equivalents and marketable securities | | | 30,949 | | | | 40,277 | | | | -23 | % |
| Total accounts receivable | | | 13,779 | | | | 16,318 | | | | -16 | % |
| Inventories | | | 12,067 | | | | 11,888 | | | | 2 | % |
| Other current assets | | | 8,902 | | | | 10,729 | | | | -17 | % |
| Total current assets | | | 65,697 | | | | 79,211 | | | | -17 | % |
| Non-Current Assets | | | - | | | | - | | | | | |
| Property, plant and equipment | | | 125,650 | | | | 125,293 | | | | 0 | % |
| Accumulated depreciation | | | (54,627 | ) | | | (54,088 | ) | | | 1 | % |
| Total property, plant and equipment, net | | | 71,023 | | | | 71,205 | | | | 0 | % |
| Right of use assets | | | 2,325 | | | | 2,069 | | | | 12 | % |
| Investment in shares | | | 8,442 | | | | 8,452 | | | | 0 | % |
| Intangible assets and other assets | | | 101,043 | | | | 103,122 | | | | -2 | % |
| Other non-current assets | | | 14,784 | | | | 13,936 | | | | 6 | % |
| Total Assets | | | 263,315 | | | | 277,995 | | | | -5 | % |
| Liabilities & Equity | | Jun-23 | | | Dec-22 | | | % Var. | |
| Current Liabilities | | | | | | | | | | | | |
| Short-term bank loans and notes payable | | | 387 | | | | 8,524 | | | | -95 | % |
| Suppliers | | | 22,949 | | | | 26,834 | | | | -14 | % |
| Short-term leasing Liabilities | | | 609 | | | | 472 | | | | 29 | % |
| Other current liabilities | | | 31,061 | | | | 22,129 | | | | 40 | % |
| Total current liabilities | | | 55,006 | | | | 57,959 | | | | -5 | % |
| Non-Current Liabilities | | | - | | | | - | | | | | |
| Long-term bank loans and notes payable | | | 65,371 | | | | 70,146 | | | | -7 | % |
| Long Term Leasing Liabilities | | | 1,817 | | | | 1,663 | | | | 9 | % |
| Other long-term liabilities | | | 17,436 | | | | 16,351 | | | | 7 | % |
| Total liabilities | | | 139,630 | | | | 146,119 | | | | -4 | % |
| Equity | | | - | | | | - | | | | | |
| Non-controlling interest | | | 6,465 | | | | 6,491 | | | | 0 | % |
| Total controlling interest | | | 117,221 | | | | 125,384 | | | | -7 | % |
| Total equity | | | 123,685 | | | | 131,876 | | | | -6 | % |
| Total Liabilities and Equity | | | 263,315 | | | | 277,995 | | | | -5 | % |
| | | June 30, 2023 | |
| Debt Mix | | % Total
Debt (1) | | | % Interest Rate
Floating (1) (2) | | | Average Rate | |
| Currency | | | | | | | | | | | | |
| Mexican Pesos | | | 62.4 | % | | | 7.2 | % | | | 8.7 | % |
| U.S. Dollars | | | 16.2 | % | | | 37.4 | % | | | 4.7 | % |
| Colombian Pesos | | | 1.2 | % | | | 0.0 | % | | | 6.3 | % |
| Brazilian Reals | | | 19.7 | % | | | 67.3 | % | | | 10.7 | % |
| Uruguayan Pesos | | | 0.5 | % | | | 0.0 | % | | | 6.3 | % |
| Total Debt | | | 100 | % | | | 25.0 | % | | | 8.4 | % |
(1) After giving effect to cross- currency swaps.
(2) Calculated by weighting each year´s outstanding debt balance mix.
Debt Maturity Profile

| Financial Ratios | | 2Q 2023 | | | FY 2022 | | | Δ% | |
| Net debt including effect of hedges (1)(3) | | | 37,209 | | | | 38,104 | | | | -2.3 | % |
| Net debt including effect of hedges / EBITDA (1)(3) | | | 0.84 | | | | 0.89 | | | | | |
| EBITDA/ Interest expense, net (1) | | | 12.10 | | | | 10.34 | | | | | |
| Capitalization (2) | | | 34.8 | % | | | 38.9 | % | | | | |
(1) Net debt = total debt - cash
(2) Total debt / (total debt + shareholders' equity)
(3) After giving effect to cross-currency swaps.
| Coca-Cola FEMSA Reports 2Q23 Results | Page 38 of 41 | |
| July 25, 2023 | |
COCA-COLA FEMSA
QUARTERLY- VOLUME, TRANSACTIONS & REVENUES
Volume
| | | 2Q 2023 | | | 2Q 2022 | | | YoY | |
| | | Sparkling | | | Water (1) | | | Bulk (2) | | | Stills | | | Total | | | Sparkling | | | Water (1) | | | Bulk (2) | | | Stills | | | Total | | | Δ % | |
| Mexico (3) | | | 375.9 | | | | 37.0 | | | | 104.4 | | | | 38.1 | | | | 555.5 | | | | 366.8 | | | | 31.3 | | | | 81.9 | | | | 34.9 | | | | 514.8 | | | | 7.9 | % |
| Guatemala | | | 40.5 | | | | 2.0 | | | | - | | | | 2.3 | | | | 44.8 | | | | 33.9 | | | | 1.1 | | | | - | | | | 2.4 | | | | 37.3 | | | | 20.1 | % |
| CAM South | | | 34.9 | | | | 1.7 | | | | 0.6 | | | | 5.7 | | | | 43.0 | | | | 31.2 | | | | 1.9 | | | | 0.2 | | | | 5.3 | | | | 38.6 | | | | 11.4 | % |
| Mexico and Central America | | | 451.3 | | | | 40.7 | | | | 105.1 | | | | 46.2 | | | | 643.3 | | | | 431.8 | | | | 34.3 | | | | 82.1 | | | | 42.5 | | | | 590.7 | | | | 8.9 | % |
| Colombia | | | 63.9 | | | | 9.3 | | | | 3.5 | | | | 7.5 | | | | 84.2 | | | | 64.6 | | | | 8.4 | | | | 2.9 | | | | 7.6 | | | | 83.4 | | | | 0.9 | % |
| Brazil (4) | | | 203.5 | | | | 15.2 | | | | 2.0 | | | | 19.7 | | | | 240.4 | | | | 193.8 | | | | 14.5 | | | | 3.4 | | | | 18.9 | | | | 230.7 | | | | 4.2 | % |
| Argentina | | | 30.0 | | | | 4.3 | | | | 1.1 | | | | 3.6 | | | | 39.0 | | | | 30.2 | | | | 3.3 | | | | 0.8 | | | | 3.2 | | | | 37.5 | | | | 3.8 | % |
| Uruguay | | | 8.8 | | | | 2.9 | | | | - | | | | 0.5 | | | | 12.2 | | | | 8.6 | | | | 1.1 | | | | - | | | | 0.4 | | | | 10.1 | | | | 20.3 | % |
| South America | | | 306.1 | | | | 31.8 | | | | 6.5 | | | | 31.2 | | | | 375.7 | | | | 297.3 | | | | 27.4 | | | | 7.1 | | | | 30.1 | | | | 361.7 | | | | 3.8 | % |
| TOTAL | | | 757.5 | | | | 72.5 | | | | 111.6 | | | | 77.4 | | | | 1,018.9 | | | | 729.1 | | | | 61.6 | | | | 89.1 | | | | 72.6 | | | | 952.4 | | | | 7.0 | % |
| (1) Excludes water presentations larger than 5.0 Lt ; includes flavored water. |
| (2) Bulk Water = Still bottled water in 5.0, 19.0 and 20.0 - liter packaging presentations; includes flavored water |
| (3) Includes 17.4 million unit cases corresponding to the acquisition of Cristal from Embotelladoras Bepensa |
Transactions
| | | 2Q 2023 | | | 2Q 2022 | | | YoY | |
| | | Sparkling | | | Water | | | Stills | | | Total | | | Sparkling | | | Water | | | Stills | | | Total | | | Δ % | |
| Mexico (3) | | | 2,102.2 | | | | 258.6 | | | | 268.0 | | | | 2,628.9 | | | | 2,061.6 | | | | 216.9 | | | | 250.5 | | | | 2,528.9 | | | | 4.0 | % |
| Guatemala | | | 305.7 | | | | 15.6 | | | | 23.6 | | | | 344.9 | | | | 261.0 | | | | 11.0 | | | | 23.4 | | | | 295.5 | | | | 16.7 | % |
| CAM South | | | 255.5 | | | | 14.2 | | | | 60.1 | | | | 329.8 | | | | 230.5 | | | | 12.3 | | | | 59.4 | | | | 302.2 | | | | 9.1 | % |
| Mexico and Central America | | | 2,663.5 | | | | 288.4 | | | | 351.7 | | | | 3,303.6 | | | | 2,553.0 | | | | 240.2 | | | | 333.3 | | | | 3,126.6 | | | | 5.7 | % |
| Colombia | | | 472.7 | | | | 98.3 | | | | 79.4 | | | | 650.4 | | | | 464.7 | | | | 90.9 | | | | 80.1 | | | | 635.8 | | | | 2.3 | % |
| Brazil (4) | | | 1,346.4 | | | | 135.2 | | | | 223.3 | | | | 1,704.9 | | | | 1,279.2 | | | | 127.5 | | | | 205.7 | | | | 1,612.5 | | | | 5.7 | % |
| Argentina | | | 158.4 | | | | 28.6 | | | | 31.6 | | | | 218.5 | | | | 161.6 | | | | 22.5 | | | | 27.5 | | | | 211.5 | | | | 3.3 | % |
| Uruguay | | | 41.4 | | | | 10.4 | | | | 3.9 | | | | 55.6 | | | | 42.0 | | | | 4.4 | | | | 3.4 | | | | 49.7 | | | | 11.8 | % |
| South America | | | 2,018.8 | | | | 272.4 | | | | 338.2 | | | | 2,629.4 | | | | 1,947.5 | | | | 245.3 | | | | 316.7 | | | | 2,509.5 | | | | 4.8 | % |
| TOTAL | | | 4,682.3 | | | | 560.8 | | | | 689.9 | | | | 5,933.0 | | | | 4,500.5 | | | | 485.5 | | | | 650.1 | | | | 5,636.1 | | | | 5.3 | % |
Revenues
| Expressed in million Mexican Pesos | | 2Q 2023 | | | 2Q 2022 | | | Δ % | |
| Mexico | | | 32,299 | | | | 28,505 | | | | 13.3 | % |
| Guatemala | | | 3,316 | | | | 3,071 | | | | 8.0 | % |
| CAM South | | | 3,473 | | | | 2,899 | | | | 19.8 | % |
| Mexico and Central America | | | 39,088 | | | | 34,475 | | | | 13.4 | % |
| Colombia | | | 4,041 | | | | 4,584 | | | | -11.9 | % |
| Brazil (5) | | | 15,109 | | | | 14,982 | | | | 0.8 | % |
| Argentina | | | 2,220 | | | | 2,349 | | | | -5.5 | % |
| Uruguay | | | 971 | | | | 920 | | | | 5.5 | % |
| South America | | | 22,341 | | | | 22,835 | | | | -2.2 | % |
| TOTAL | | | 61,428 | | | | 57,311 | | | | 7.2 | % |
(4) Volume and transactions in Brazil do not include beer
(5) Brazil includes beer revenues of Ps. 1,511.3 million for the second quarter of 2023 and Ps.1,282.1 million for the same period of the previous year.
| (1) | Volume is expressed in unit cases. Unit case refers to 192 ounces of finished beverage product (24 eight-ounce servings) and, when applied to soda fountains, refers to the volume of syrup, powders, and concentrate that is required to produce 192 ounces of finished beverage product. |
| (2) | Transactions refers to the number of single units (e.g., a can or a bottle) sold, regardless of their size or volume or whether they are sold individually or in multipacks, except for soda fountains, which represent multiple transactions based on a standard 12 oz. serving. |
| Coca-Cola FEMSA Reports 2Q23 Results | Page 39 of 41 | |
| July 25, 2023 | |
COCA-COLA FEMSA
YTD- VOLUME, TRANSACTIONS & REVENUES
Volume
| | | YTD 2023 | | | YTD 2022 | | | YoY | |
| | | Sparkling | | | Water (1) | | | Bulk (2) | | | Stills | | | Total | | | Sparkling | | | Water (1) | | | Bulk (2) | | | Stills | | | Total | | | Δ % | |
| Mexico (3) | | | 685.4 | | | | 63.4 | | | | 192.0 | | | | 73.4 | | | | 1,014.2 | | | | 668.7 | | | | 52.6 | | | | 149.4 | | | | 67.6 | | | | 938.3 | | | | 8.1 | % |
| Guatemala | | | 75.8 | | | | 3.6 | | | | - | | | | 4.6 | | | | 84.0 | | | | 64.5 | | | | 2.3 | | | | - | | | | 4.3 | | | | 71.0 | | | | 18.3 | % |
| CAM South | | | 66.5 | | | | 3.5 | | | | 1.0 | | | | 11.3 | | | | 82.4 | | | | 61.0 | | | | 3.8 | | | | 0.4 | | | | 10.2 | | | | 75.4 | | | | 9.2 | % |
| Mexico and Central America | | | 827.8 | | | | 70.5 | | | | 193.1 | | | | 89.3 | | | | 1,180.7 | | | | 794.2 | | | | 58.7 | | | | 149.8 | | | | 82.1 | | | | 1,084.7 | | | | 8.8 | % |
| Colombia | | | 125.2 | | | | 18.1 | | | | 6.8 | | | | 14.5 | | | | 164.6 | | | | 126.8 | | | | 16.1 | | | | 5.9 | | | | 15.0 | | | | 163.8 | | | | 0.5 | % |
| Brazil (4) | | | 421.8 | | | | 34.6 | | | | 4.7 | | | | 40.2 | | | | 501.3 | | | | 400.5 | | | | 31.6 | | | | 5.8 | | | | 43.6 | | | | 481.6 | | | | 4.1 | % |
| Argentina | | | 65.9 | | | | 9.8 | | | | 2.5 | | | | 8.5 | | | | 86.7 | | | | 66.0 | | | | 7.4 | | | | 2.0 | | | | 7.0 | | | | 82.4 | | | | 5.1 | % |
| Uruguay | | | 19.1 | | | | 5.0 | | | | - | | | | 1.1 | | | | 25.3 | | | | 18.1 | | | | 2.8 | | | | - | | | | 0.7 | | | | 21.5 | | | | 17.4 | % |
| South America | | | 632.1 | | | | 67.5 | | | | 13.9 | | | | 64.3 | | | | 777.9 | | | | 611.3 | | | | 57.9 | | | | 13.7 | | | | 66.4 | | | | 749.4 | | | | 3.8 | % |
| TOTAL | | | 1,459.8 | | | | 138.1 | | | | 207.0 | | | | 153.6 | | | | 1,958.5 | | | | 1,405.5 | | | | 116.6 | | | | 163.5 | | | | 148.4 | | | | 1,834.1 | | | | 6.8 | % |
| (1) Excludes water presentations larger than 5.0 Lt ; includes flavored water. |
| (2) Bulk Water = Still bottled water in 5.0, 19.0 and 20.0 - liter packaging presentations; includes flavored water |
| (3) Includes 32.6 million unit cases corresponding to the acquisition of Cristal from Embotelladoras Bepensa |
Transactions
| | | YTD 2023 | | | YTD 2022 | | | YoY | |
| | | Sparkling | | | Water | | | Stills | | | Total | | | Sparkling | | | Water | | | Stills | | | Total | | | Δ % | |
| Mexico (3) | | | 3,867.4 | | | | 449.9 | | | | 522.7 | | | | 4,840.0 | | | | 3,760.2 | | | | 371.1 | | | | 488.1 | | | | 4,619.4 | | | | 4.8 | % |
| Guatemala | | | 573.0 | | | | 28.9 | | | | 46.3 | | | | 648.2 | | | | 499.5 | | | | 22.7 | | | | 42.9 | | | | 565.2 | | | | 14.7 | % |
| CAM South | | | 491.2 | | | | 27.5 | | | | 123.5 | | | | 642.2 | | | | 450.8 | | | | 25.0 | | | | 114.5 | | | | 590.4 | | | | 8.8 | % |
| Mexico and Central America | | | 4,931.6 | | | | 506.3 | | | | 692.5 | | | | 6,130.4 | | | | 4,710.5 | | | | 418.9 | | | | 645.5 | | | | 5,774.9 | | | | 6.2 | % |
| Colombia | | | 920.8 | | | | 189.8 | | | | 157.0 | | | | 1,267.7 | | | | 894.5 | | | | 173.5 | | | | 161.7 | | | | 1,229.7 | | | | 3.1 | % |
| Brazil (4) | | | 2,749.5 | | | | 305.4 | | | | 449.5 | | | | 3,504.4 | | | | 2,586.1 | | | | 275.8 | | | | 430.1 | | | | 3,292.0 | | | | 6.5 | % |
| Argentina | | | 341.7 | | | | 63.4 | | | | 73.0 | | | | 478.1 | | | | 340.2 | | | | 47.5 | | | | 57.3 | | | | 445.0 | | | | 7.4 | % |
| Uruguay | | | 91.6 | | | | 18.3 | | | | 9.6 | | | | 119.5 | | | | 89.1 | | | | 10.7 | | | | 6.1 | | | | 105.9 | | | | 12.9 | % |
| South America | | | 4,103.7 | | | | 577.0 | | | | 689.1 | | | | 5,369.8 | | | | 3,909.8 | | | | 507.6 | | | | 655.2 | | | | 5,072.6 | | | | 5.9 | % |
| TOTAL | | | 9,035.2 | | | | 1,083.3 | | | | 1,381.6 | | | | 11,500.2 | | | | 8,620.4 | | | | 926.5 | | | | 1,300.7 | | | | 10,847.6 | | | | 6.0 | % |
Revenues
| Expressed in million Mexican Pesos | | YTD 2023 | | | YTD 2022 | | | Δ % | |
| Mexico | | | 59,528 | | | | 51,727 | | | | 15.1 | % |
| Guatemala | | | 6,333 | | | | 5,847 | | | | 8.3 | % |
| CAM South | | | 6,844 | | | | 5,837 | | | | 17.3 | % |
| Mexico and Central America | | | 72,705 | | | | 63,410 | | | | 14.7 | % |
| Colombia | | | 7,784 | | | | 8,860 | | | | -12.1 | % |
| Brazil (5) | | | 31,078 | | | | 29,370 | | | | 5.8 | % |
| Argentina | | | 4,975 | | | | 5,150 | | | | -3.4 | % |
| Uruguay | | | 2,098 | | | | 1,845 | | | | 13.7 | % |
| South America | | | 45,936 | | | | 45,225 | | | | 1.6 | % |
| TOTAL | | | 118,641 | | | | 108,635 | | | | 9.2 | % |
| (4) Volume and transactions in Brazil do not include beer |
| (5) Brazil includes beer revenues of Ps.2,961.0 million for the first six months of 2023 and Ps.2,532.3 million for the same period of the previous year. |
| (1) | Volume is expressed in unit cases. Unit case refers to 192 ounces of finished beverage product (24 eight-ounce servings) and, when applied to soda fountains, refers to the volume of syrup, powders, and concentrate that is required to produce 192 ounces of finished beverage product. |
| (2) | Transactions refers to the number of single units (e.g., a can or a bottle) sold, regardless of their size or volume or whether they are sold individually or in multipacks, except for soda fountains, which represent multiple transactions based on a standard 12 oz. serving. |
| Coca-Cola FEMSA Reports 2Q23 Results | Page 40 of 41 | |
| July 25, 2023 | |
COCA-COLA FEMSA
MACROECONOMIC INFORMATION
Inflation (1)
| | | LTM | | | 2Q23 | | | YTD | |
| Mexico | | | 5.18 | % | | | 0.30 | % | | | 1.27 | % |
| Colombia | | | 12.56 | % | | | 1.95 | % | | | 6.26 | % |
| Brasil | | | 4.30 | % | | | 1.72 | % | | | 3.38 | % |
| Argentina | | | 117.97 | % | | | 23.76 | % | | | 50.10 | % |
| Costa Rica | | | 1.31 | % | | | -0.79 | % | | | -1.14 | % |
| Panama | | | 0.14 | % | | | 0.70 | % | | | 1.82 | % |
| Guatemala | | | 7.02 | % | | | 0.14 | % | | | 2.10 | % |
| Nicaragua | | | 9.92 | % | | | 1.69 | % | | | 3.21 | % |
| Uruguay | | | 7.10 | % | | | 1.49 | % | | | 4.63 | % |
(1) Source: inflation estimated by the company based on historic publications from the Central Bank of each country.
Average Exchange Rates for each period (2)
| | | Quarterly Exchange Rate | | | Year to Date Exchange Rate | |
| | | (Local Currency per USD) | | | (Local Currency per USD) | |
| | | 2Q23 | | | 2Q22 | | | Δ % | | | YTD 23 | | | YTD 22 | | | Δ % | |
| México | | | 17.72 | | | | 20.04 | | | | -11.6 | % | | | 18.21 | | | | 20.28 | | | | -10.2 | % |
| Colombia | | | 4,426.37 | | | | 3,915.49 | | | | 13.0 | % | | | 4,592.50 | | | | 3,915.18 | | | | 17.3 | % |
| Brasil | | | 4.95 | | | | 4.92 | | | | 0.6 | % | | | 5.07 | | | | 5.08 | | | | -0.1 | % |
| Argentina | | | 232.18 | | | | 117.95 | | | | 96.8 | % | | | 212.30 | | | | 112.27 | | | | 89.1 | % |
| Costa Rica | | | 544.44 | | | | 677.15 | | | | -19.6 | % | | | 555.87 | | | | 662.13 | | | | -16.0 | % |
| Panama | | | 1.00 | | | | 1.00 | | | | 0.0 | % | | | 1.00 | | | | 1.00 | | | | 0.0 | % |
| Guatemala | | | 7.82 | | | | 7.69 | | | | 1.6 | % | | | 7.82 | | | | 7.69 | | | | 1.7 | % |
| Nicaragua | | | 36.40 | | | | 35.78 | | | | 1.7 | % | | | 36.35 | | | | 35.70 | | | | 1.8 | % |
| Uruguay | | | 38.61 | | | | 40.56 | | | | -4.8 | % | | | 38.89 | | | | 41.94 | | | | -7.3 | % |
End-of-period Exchange Rates
| | | Closing Exchange Rate | | | Closing Exchange Rate | |
| | | (Local Currency per USD) | | | (Local Currency per USD) | |
| | | Jun-23 | | | Jun-22 | | | Δ % | | | Mar-23 | | | Mar-22 | | | Δ % | |
| México | | | 17.07 | | | | 19.98 | | | | -14.6 | % | | | 18.11 | | | | 19.99 | | | | -9.4 | % |
| Colombia | | | 4,191.28 | | | | 4,127.47 | | | | 1.5 | % | | | 4,627.27 | | | | 3,748.15 | | | | 23.5 | % |
| Brasil | | | 4.82 | | | | 5.24 | | | | -8.0 | % | | | 5.08 | | | | 4.74 | | | | 7.2 | % |
| Argentina | | | 256.70 | | | | 125.23 | | | | 105.0 | % | | | 209.01 | | | | 111.01 | | | | 88.3 | % |
| Costa Rica | | | 549.48 | | | | 692.25 | | | | -20.6 | % | | | 545.95 | | | | 667.10 | | | | -18.2 | % |
| Panama | | | 1.00 | | | | 1.00 | | | | 0.0 | % | | | 1.00 | | | | 1.00 | | | | 0.0 | % |
| Guatemala | | | 7.85 | | | | 7.76 | | | | 1.2 | % | | | 7.80 | | | | 7.68 | | | | 1.6 | % |
| Nicaragua | | | 36.44 | | | | 35.87 | | | | 1.6 | % | | | 36.35 | | | | 35.69 | | | | 1.8 | % |
| Uruguay | | | 37.41 | | | | 39.86 | | | | -6.2 | % | | | 38.65 | | | | 41.12 | | | | -6.0 | % |
(2) Average exchange rate for each period computed with the average exchange rate of each month.
| Coca-Cola FEMSA Reports 2Q23 Results | Page 41 of 41 | |
| July 25, 2023 | |