Exhibit 99.1

4Q and Full Year 2024
Results
February 27, 2025
Investor Contact
(52) 818-328-6167
investor@femsa.com.mx
femsa.gcs-web.com
Media Contact
(52) 555-249-6843
comunicacion@femsa.com.mx
femsa.com

| | February 27, 2025 | Page 1 | |
HIGHLIGHTS
Monterrey, Mexico, February 27, 2025 — Fomento Económico Mexicano, S.A.B. de C.V. (“FEMSA”) (NYSE: FMX; BMV: FEMSAUBD, FEMSAUB) announced today its operational and financial results for the fourth quarter and full year of 2024.
| · | FEMSA: Total Consolidated Revenues grew 12.8% and Income from Operations increased 31.5% compared to 4Q23. |
| · | FEMSA Retail1: Proximity Americas total Revenues grew 13.2% and Income from operations increased 18.7% versus 4Q23. |
| · | SPIN: Spin by OXXO had 8.6 million active users2 representing 24.9% growth compared to 4Q23 while Spin Premia had 24.6 million active loyalty users2 representing 27.5% growth compared to 4Q23, and an average tender3 of 40.7%. |
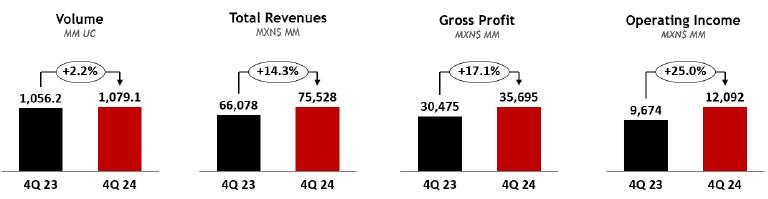
| · | COCA-COLA FEMSA: Total Revenues and Income from Operations grew 14.3% and 25.0%, respectively against 4Q23. |
Financial Summary for the Fourth Quarter and Full Year 2024
Change vs. comparable period
| | | Total Revenues | | | Gross Profit | | | Income from Operations | | | Same-Store Sales | |
| | | 4Q24 | | | YTD24 | | | 4Q24 | | | YTD24 | | | 4Q24 | | | YTD24 | | | 4Q24 | | | YTD24 | |
| FEMSA Consolidated | | 12.8 | % | | 11.2 | % | | 16.7 | % | | 15.0 | % | | 31.5 | % | | 19.8 | % | | | | | | |
| Proximity Americas | | 13.2 | % | | 10.3 | % | | 19.0 | % | | 17.0 | % | | 18.7 | % | | 11.2 | % | | 3.8 | % | | 4.2 | % |
| Proximity Europe | | 21.5 | % | | 14.2 | % | | 17.5 | % | | 14.6 | % | | 9.9 | % | | 45.3 | % | | N.A. | | | N.A. | |
| Health | | 13.3 | % | | 5.8 | % | | 21.2 | % | | 6.9 | % | | 109.7 | % | | 4.6 | % | | 9.4 | % | | (0.3 | %) |
| Fuel | | 8.0 | % | | 11.7 | % | | 2.4 | % | | 8.0 | % | | 6.9 | % | | 12.4 | % | | 9.7 | % | | 9.9 | % |
| Coca-Cola FEMSA | | 14.3 | % | | 14.2 | % | | 16.8 | % | | 16.0 | % | | 25.0 | % | | 17.4 | % | | | | | | |
José Antonio Fernández Carbajal, FEMSA’s Chief Executive Officer, commented:
“In the fourth quarter FEMSA delivered a strong close to a strong year, with double-digit growth in revenues, gross profit, and income from operations in most of our business units, driven by the strength of our platform and the effort of our teams, while also reflecting foreign exchange tailwinds from our international operations.
The solid trends in the fourth quarter’s top line were complemented by strong margin expansion at our two largest operations, Proximity Americas and Coca-Cola FEMSA, leveraging powerful execution in their core markets. Looking at the full year, margin expansion was achieved not only at Proximity Americas and Coca-Cola FEMSA, but also at Proximity Europe and Fuel.
Beyond our operations, during the year we continued to make progress with the remaining steps of FEMSA Forward, including in the execution of our capital allocation framework. In addition to high levels of capital expenditures as we continued to invest in our organic growth opportunities across business units, during 2024, we returned record amounts of capital through a combination of dividends and share repurchases, a process that we intend to accelerate in 2025 and 2026 as we move to maximize the efficiency of our balance sheet.
Finally, on the governance front, the Corporate Practices and Nominations Committee of FEMSA’s Board of Directors has formally launched the succession process for the CEO position. Please refer to the Recent Developments section of this release for further details.
We begin 2025 facing an increasingly challenging consumer environment in many of our markets, particularly Mexico, but we are confident we have a compelling opportunity set in front of us, a solid strategy to pursue those opportunities, and the best team in the business.”
| 1 | FEMSA Retail: Proximity Americas & Europe, Fuel and FEMSA Health. |
| 2 | Active User for Spin by OXXO: Any user with a balance or that has transacted within the last 56 days. |
| | Active User for Spin Premia: User that has transacted at least once with OXXO Premia within the last 90 days. |
| 3 | Tender: OXXO MXN sales with Spin Premia redemption or accrual / Total OXXO MXN Sales, during the period. |
| | February 27, 2025 | Page 2 | |
FEMSA Forward Update
Advancing FEMSA Forward:
Update on our capital allocation framework
In line with our FEMSA Forward strategy, on February 15, 2024, we shared FEMSA’s capital allocation framework and plans as approved by our Board of Directors. One year later, we have made important progress executing on these plans and are poised to accelerate the pace during 2025 and 2026.
Investing in our core
In line with our long range plan we expect to continue to deploy capital in our core organic initiatives to reach our original commitment of around of Ps. 50,000 million per year for 2025 and 2026, with close to Ps. 32,000 million a year of that deployed in Mexico, where we are one of the largest employers (over 260,000 employees), and taxpayers, expecting to pay over Ps. 41,000 million in aggregate income taxes for the period between fiscal 2025 and 2026. We are beginning to see the fruits of these investments in the reported figures for 2024 in the form of continued high hit-rate new store growth, merchandising and segmentation initiatives driving margin expansion, investment in production and market assets at KOF, and investments in both analog and digital capabilities throughout our portfolio that have created attractive returns and quick paybacks.
Developing new value capillaries
During 2024, we invested a relatively modest amount of approximately USD$385 million in inorganic initiatives, mostly related to the establishment of a beachhead for our proximity operations in the US. We continue to be on the lookout for opportunities that could generate value or add capabilities across our portfolio, maintaining high thresholds for both strategic fit and financial returns within our defined FEMSA Forward core business verticals, and our leverage objective of 2x Ex-KOF Net Leverage target, as we maximize the efficiency of our balance sheet.
Capital Returns
Having successfully executed the majority of the FEMSA Forward-related divestments, and after accounting for our expected organic and inorganic capital needs, we believe that returning capital to shareholders is a key component of the overall strategy, keeping in mind that all capital allocation actions are guided by the principle of driving intrinsic per share value through both operational and financial decisions.
Return of capital initiatives carried out during 2024
During 2024 we declared ordinary dividends of Ps. 3.6644 per FEMSAUB unit and Ps. 4.3972 per FEMSAUBD unit (Ps. 43.972 per ADS). We also announced extraordinary dividends of Ps. 2.5672 per FEMSAUB unit and Ps. 3.0804 per FEMSAUBD unit (Ps. 30.804 per ADS). Finally, we repurchased 102,201,323 FEMSAUBD units, representing approximately 2.86% of our total outstanding units as of December 31, 2024. These repurchased shares are currently held in our Treasury and will be proposed for cancellation at the Annual Shareholders’ Meeting on April 11th, 2025. On aggregate these actions returned an amount representing approximately 8.1% of FEMSA’s current market capitalization.
| | February 27, 2025 | Page 3 | |
Return of capital initiatives proposed for 2025
FEMSA’s Board of Directors has approved to submit to the 2025 Annual Shareholders Meeting the following proposals: i) Increase our ordinary dividends per unit by 4.2% compared to 2024, in line with Mexican inflation, or Ps. 3.8190 per FEMSAUB unit and Ps. 4.5826 per FEMSAUBD unit (Ps. 45.826 per ADS), to be paid in four quarterly installments beginning in April of 2025; ii) pay an additional extraordinary dividend of Ps. 8.4240 per FEMSAUB unit and Ps. 10.1084 per FEMSAUBD unit (Ps. 101.084 per ADS), over and above the approved ordinary dividends, to be disbursed in four quarterly installments on the same dates as the ordinary dividends; and iii) allocate to share repurchases an amount representing approximately 2.9% of FEMSA’s current market capitalization. These actions represent an aggregate amount of approximately 10.4% of FEMSA’s current market capitalization.
Considerations on capital initiatives for 2026
During 2026, assuming no extraordinary circumstances beyond our control, we plan to announce a minimum additional capital return representing approximately 4.2% of FEMSA’s current market capitalization, over and above the approved ordinary dividends for that year. Based on our cash flow generation and planned capital deployment during 2025 and 2026, we would expect to substantially advance towards our objective ex-KOF leverage ratio of 2x, maximizing the efficiency of our balance sheet.
| | February 27, 2025 | Page 4 | |
QUARTERLY RESULTS
Results are compared to the same period of previous year
FEMSA CONSOLIDATED
4Q24 Financial Summary
Amounts expressed in millions of Mexican Pesos (Ps.)
| | | 4Q24 | | | 4Q23 | | | Var. | | | Org. | |
| Total Revenues | | | 208,311 | | | | 184,732 | | | | 12.8 | % | | | 10.8 | % |
| Gross Profit | | | 90,906 | | | | 77,915 | | | | 16.7 | % | | | | |
| Gross Profit Margin (%) | | | 43.6 | | | | 42.2 | | | | 140bps | | | | | |
| Income from Operations | | | 22,634 | | | | 17,216 | | | | 31.5 | % | | | 31.5 | % |
| Operating Margin (%) | | | 10.9 | | | | 9.3 | | | | 160bps | | | | | |
| Adjusted EBITDA2 | | | 34,567 | | | | 27,462 | | | | 25.9 | % | | | 25.4 | % |
| EBITDA Margin (%) | | | 16.6 | | | | 14.9 | | | | 170bps | | | | | |
| Net Income | | | 10,961 | | | | 6,147 | | | | 78.3 | % | | | | |
Net Debt ex-KOF1
Amounts expressed in millions of Mexican Pesos (Ps.)
| As of December 31, 2024 | | Ps. | | | US$3 | |
| Cash and Investments | | | 150,267 | | | | 7,205 | |
| Financial Debt | | | 74,507 | | | | 3,573 | |
| Lease Liabilities | | | 105,792 | | | | 5,073 | |
| Net debt | | | 30,031 | | | | 1,440 | |
| ND / Adjusted EBITDA | | | 0.45 | x | | | - | |
Total revenues increased 12.8% in 4Q24 compared to 4Q23, driven by growth across all our business units, and reflecting the benefit from favorable exchange rate effects due to the depreciation of the Mexican peso against many of our foreign operating currencies.
Gross profit increased 16.7%. Gross margin increased 140 basis points, mainly reflecting margin expansions in Health, Proximity Americas and Coca-Cola FEMSA, offset by contraction in margins in Fuel and Proximity Europe.
Income from operations increased 31.5% driven by growth across all our business units. The consolidated operating margin was 10.9% as a percentage of total sales, representing an expansion of 160 basis points, driven by margin expansion at Proximity Americas, Coca-Cola FEMSA, and our Health Division. This was partially offset by a stable margin in Fuel and a margin contraction in Proximity Europe.
Our effective income tax rate was 52.9% in 4Q24. Our income tax provision was Ps. 8,769 million in 4Q24, reflecting a combination of one-off factors, such as certain non-deductible non-cash impairment and restructuring charges which reduced pre-tax income, and a structurally higher effective tax rate driven by increased non-deductible expenses, including an increase in the tax-exempt portion of compensation and non-recoverable losses at Spin.
Net consolidated income was Ps. 10,961million, compared to Ps. 6,147 million in 4Q23, reflecting: i) a higher non-cash foreign exchange gain of Ps. 2,673 million compared to a loss of Ps. 6,302 million loss in 4Q23 related to our U.S. dollar-denominated cash position positively impacted by the depreciation of the Mexican peso; and ii) a gain in net income from discontinued operations of Ps. 3,339 million compared to a loss of Ps. 3,235 million in 4Q23, which includes a gain of Ps. 4,165 million related to the divestment of Imbera and Torrey.
Net majority income was Ps. 1.90 per FEMSA Unit4 and US$0.91 per FEMSA ADS3.
Net Debt / EBITDA. As of December 31, 2024, cash and investments were Ps. 150,267 million and total debt was Ps. 180,299 million, resulting in net debt of Ps. 30,480 million. Our Net Debt / EBITDA ratio ex-KOF was 0.45x.
Capital expenditures amounted to Ps. 20,694 million, 9.9% as a percentage of total sales, and an increase of 32.0% compared to 4Q23, mainly driven by higher CAPEX at Coca-Cola FEMSA, mainly deployed to increase our production and distribution capacity, and in Proximity Americas, mainly allocated towards new store growth, remodeling and optimization of existing stores, and the development of commercial capabilities to enhance the value proposition and customer experience.
| 1 | ex-KOF: FEMSA Consolidated reported information – Coca-Cola FEMSA Consolidated reported information. |
| 2 | Adjusted EBITDA: Operating Income + Depreciation + Amortizations + other non-cash charges. Adjusted EBITDA ex-KOF: FEMSA Consolidated Adjusted EBITDA as described above – Coca-Cola FEMSA’s Consolidated Adjusted EBITDA + Dividends received by FEMSA from Coca-Cola FEMSA and other investments. |
| | All Net Debt calculations are shown on an Ex-KOF basis. For a detailed reconciliation of this metric please see table on page 16 of this document. |
| 3 | The exchange rate published by the Federal Reserve Bank of New York for December 31, 2024 was 20.8557 MXN per USD. |
| 4 | FEMSA Units consist of FEMSA BD Units and FEMSA B Units. Each FEMSA BD Unit is comprised of one Series B Share, two Series D-B Shares and two Series D-L Shares. Each FEMSA B Unit is comprised of five Series B Shares. The number of FEMSA Units outstanding as of December 31, 2024 was 3,578,226,270, equivalent to the total number of FEMSA Shares outstanding as of the same date, divided by 5. |
| | February 27, 2025 | Page 5 | |
PROXIMITY AMERICAS OXXO (Mexico, USA & Latam1) |  |
4Q24 Financial Summary
Amounts expressed in millions of Mexican Pesos (Ps.) except same-store sales
| | | 4Q24 | | | 4Q23 | | | Var. | | | Org. | |
| Same-store sales (thousands of Ps.) | | | 999.7 | | | | 963.5 | | | | 3.8 | % | | | | |
| Total Revenues | | | 80,992 | | | | 71,530 | | | | 13.2 | % | | | 8.1 | % |
| Gross Profit | | | 38,610 | | | | 32,452 | | | | 19.0 | % | | | 16.7 | % |
| Gross Profit Margin (%) | | | 47.7 | | | | 45.4 | | | | 230bps | | | | | |
| Income from Operations | | | 9,516 | | | | 8,020 | | | | 18.7 | % | | | 18.7 | % |
| Income from Operations Margin (%) | | | 11.7 | | | | 11.2 | | | | 50bps | | | | | |
| Adjusted EBITDA | | | 14,062 | | | | 11,486 | | | | 22.4 | % | | | 21.4 | % |
| Adjusted EBITDA Margin (%) | | | 17.4 | | | | 16.1 | | | | 130bps | | | | | |
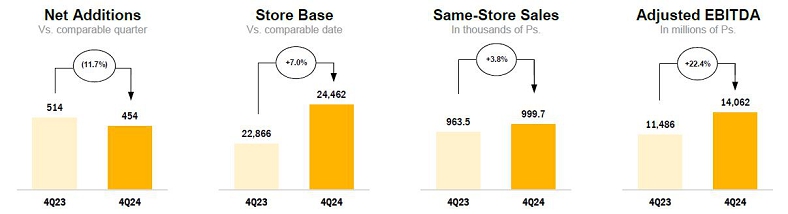
Total revenues increased 13.2% in 4Q24 compared to 4Q23, reflecting an increase in same-store sales for the Proximity Americas Division, driven by 6.8% growth in average customer ticket and a decrease of 2.8% in store traffic; and the addition of the US operation to the division, which we began consolidating on October 1st, 2024, reflecting a full quarter of results from this operation. These figures reflect a solid performance in a challenging quarter, with mixed results from the Thirst and Gathering consumption occasions, two of the most important for OXXO, with decreases in the beer and groceries categories, which were offset by a positive performance in soft drinks and other hydration beverages. During this period, the OXXO store base in Mexico, USA and Latam expanded by 454 units to reach 1,596 total net store additions for the last twelve months. This includes 249 stores from our acquisition of Delek’s retail operations in the USA. As of December 31, 2024, Proximity Americas had a total of 24,462 OXXO stores.
Gross profit reached 47.7% of total revenues, reflecting a 230-basis point expansion driven again by the contribution of financial services and an increase in commercial income, as well as revenue growth management initiatives which contributed to better pricing dynamics.
Income from operations represented 11.7% of total revenues, and a 50-basis point expansion compared to 4Q23, mainly explained by a higher gross margin, a slower growth rate in South America compared to last year, and a moderate increase in selling expenses reflecting cost containment and efficiency initiatives, as well as more normalized labor expenses. However, this was partially offset by higher operating expenses related to continued investments in commercial capabilities, including segmentation, revenue management, and data analytics.
1 OXXO Latam: OXXO Colombia, Chile and Peru.
| | February 27, 2025 | Page 6 | |
PROXIMITY AMERICAS Other formats |  |
Bara1
Total revenues increased by 38.7% in 4Q24 compared to 4Q23, reflecting an average same-store sales increase of 17.4%, driven by strong performance in the grocery, dairy and frozen food categories, as well as the addition of 120 net new Bara stores for the last twelve months. During the quarter, the Bara store base expanded by 63 units reaching a total of 479 Bara stores as of December 31, 2024.
Grupo Nós2
Total revenues of OXXO Brazil in 4Q24 grew 54.7%3 year-over-year. This figure reflects the successful evolution and expansion of the OXXO value proposition in the region, which resulted in same-store sales growth of 9.1%3, as well as the addition of 154 net new OXXO stores for the last twelve months. During the quarter, the store base expanded by 30 units. As of December 31, 2024, Grupo Nós had a total of 594 OXXO stores.
1 Bara store count and results are not consolidated within the Proximity Americas reported figures.
2 OXXO’s non-consolidated joint-venture with Raízen in Brazil.
3 In local currency, BRL
| | February 27, 2025 | Page 7 | |
4Q24 Financial Summary
Amounts expressed in millions of Mexican Pesos (Ps.)
| | | 4Q24 | | | 4Q23 | | | Var. | |
| Total Revenues | | | 13,870 | | | | 11,415 | | | | 21.5 | % |
| Gross Profit | | | 6,014 | | | | 5,120 | | | | 17.5 | % |
| Gross Profit Margin (%) | | | 43.4 | | | | 44.9 | | | | (150bps | ) |
| Income from Operations | | | 653 | | | | 594 | | | | 9.9 | % |
| Income from Operations Margin (%) | | | 4.7 | | | | 5.2 | | | | (50bps | ) |
| Adjusted EBITDA | | | 2,012 | | | | 1,845 | | | | 9.0 | % |
| Adjusted EBITDA Margin (%) | | | 14.5 | | | | 16.2 | | | | (170bps | ) |
Total revenues increased 21.5% in 4Q24 compared to 4Q23, reflecting growth in our retail revenue across all countries, supported by commercial capabilities and with a relevant impact from the appreciation of currencies against the Mexican peso. By the end of the period, Proximity Europe had 2,778 points of sale, a decrease of 30 points of sale in the last twelve months.
Gross profit reached 43.4% of total revenues, reflecting a 150 basis-point margin contraction explained by changes in mix compared to the same period last year, when foodservice grew ahead of retail sales, and a 17.5% increase compared to 4Q23, as higher sales and promotional income faced a tough comparison base from 4Q23.
Income from operations represented 4.7% of total revenues, a 50 basis-point decrease year-on-year, driven by higher operating expenses which rose by 18.4% to Ps. 5,361 million, mainly driven by higher administrative expenses reflecting a challenging comparison base from the results from B2B in 2023.
| | February 27, 2025 | Page 8 | |
| HEALTH |  |
4Q24 Financial Summary
Amounts expressed in millions of Mexican Pesos (Ps.) except same-store sales
| | | 4Q24 | | | 4Q23 | | | Var. | |
| Same-store sales (thousands of Ps.) | | | 982.6 | | | | 898.3 | | | | 9.4 | % |
| Total Revenues | | | 21,824 | | | | 19,254 | | | | 13.3 | % |
| Gross Profit | | | 6,814 | | | | 5,622 | | | | 21.2 | % |
| Gross Profit Margin (%) | | | 31.2 | | | | 29.2 | | | | 200bps | |
| Income from Operations | | | 1,202 | | | | 573 | | | | 109.7 | % |
| Income from Operations Margin (%) | | | 5.5 | | | | 3.0 | | | | 250bps | |
| Adjusted EBITDA | | | 2,352 | | | | 2,262 | | | | 4.0 | % |
| Adjusted EBITDA Margin (%) | | | 10.8 | | | | 11.7 | | | | (90bps | ) |
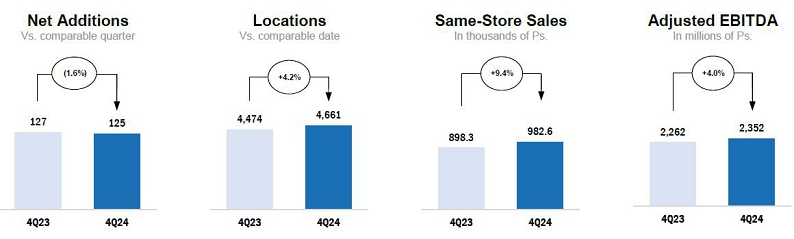
Total revenues increased 13.3% in 4Q24 compared to 4Q23, driven by revenue growth across Colombia, Chile and Ecuador and partially offset by a challenging competitive environment in Mexico. Revenues were aided by the appreciation of currencies against the Mexican peso. During the quarter, the store base increased by 125 units reaching a total of 4,661 locations across our territories, as of December 31, 2024. This figure reflects the addition of 187 net new locations in the last twelve months. Same-store sales increased by an average of 9.4%.
Gross profit was 31.2% of total revenues, representing a 200-basis point expansion year on year, reflecting strategic commercial efforts, proactive cost management and higher retail sales in Colombia. Sustained efficiencies were leveraged through our centralized purchasing office, enabling the division to optimize procurement.
Income from operations amounted to 5.5% of total revenues, an expansion of 250 basis points, resulting in an increase of 109.7%, mainly explained by a favorable comparison base that included a Ps. 527 million charge for uncollectible accounts in Colombia in 4Q23. Excluding this effect, income from operations would have increased 9.3% year-over-year. This result was supported by growth in Colombia and Ecuador, and stable results in Chile, partially offset by underperformance in Mexico. Operating expenses increased 11.2% to Ps. 5,612 million, explained by higher labor costs, utilities, and store expansion.
| | February 27, 2025 | Page 9 | |
| FUEL |  |
4Q24 Financial Summary
Amounts expressed in millions of Mexican Pesos (Ps.) except same-station sales
| | | 4Q24 | | | 4Q23 | | | Var. | |
| Same-station sales (thousands of Ps.) | | | 8,832.4 | | | | 8,049.5 | | | | 9.7 | % |
| Total Revenues | | | 16,331 | | | | 15,121 | | | | 8.0 | % |
| Gross Profit | | | 2,071 | | | | 2,022 | | | | 2.4 | % |
| Gross Profit Margin (%) | | | 12.7 | | | | 13.4 | | | | (70bps | ) |
| Income from Operations | | | 745 | | | | 697 | | | | 6.9 | % |
| Income from Operations Margin (%) | | | 4.6 | | | | 4.6 | | | | - | |
| Adjusted EBITDA | | | 1,092 | | | | 943 | | | | 15.8 | % |
| Adjusted EBITDA Margin (%) | | | 6.7 | | | | 6.2 | | | | 50bps | |
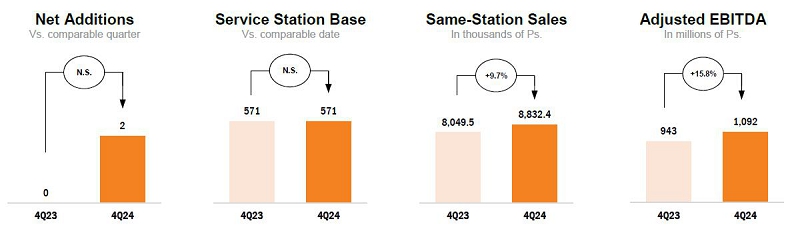
Total revenues increased 8.0% in 4Q24 compared to 4Q23, reflecting a 9.7% average same-station sales increase, driven by 4.4% growth in average volume and 5.1% increase in the average price per liter. The OXXO Gas retail network had 571 points of sale as of December 31, 2024.
Gross profit was 12.7% of total revenues, representing a 70-basis point contraction year on year, reflecting an increase in the cost of sales and an unfavorable mix due to higher institutional sales compared to retail sales during the quarter, partially offset by cost efficiencies and revenue management initiatives.
Income from operations accounted for 4.6% of total revenues. Operating expenses remained flat to Ps. 1,326 million, reflecting strict expense control and positive operating leverage.
| | February 27, 2025 | Page 10 | |
FEMSA Retail Operations Summary
Total Revenue Growth (% vs year ago)
| | | | 4Q24 | |
| Proximity Americas | | | | |
| OXXO1 | | | 8.1 | % |
| Mexico | | | 7.8 | % |
| OXXO Latam2 | | | 38.2 | % |
| | | | | |
| Other Proximity Americas formats | | | | |
| Bara | | | 38.7 | % |
| OXXO Brazil3 | | | 54.7 | % |
| | | | | |
| Proximity Europe4 | | | 5.3 | % |
| OXXO Gas | | | 8.0 | % |
| | | | | |
| FEMSA Health5 | | | 5.6 | % |
| Chile6 | | | 6.6 | % |
| Colombia7 | | | 10.1 | % |
| Ecuador8 | | | 2.3 | % |
| Mexico | | | (5.1 | )% |
| 1 | OXXO Consolidated figures shown in MXN including currency effects.
Excludes OXXO US operations |
| 2 | Includes OXXO Colombia, Chile and Peru, figure shown in MXN. |
| 3 | Local currency (BRL).
Operated through Grupo Nós, our joint-venture with Raízen. |
| 4 | Local currency (CHF). |
| 5 | Local currency weighted average. |
| 6 | Local currency (CLP). |
| 7 | Local currency (COP). |
| 8 | Local currency (USD). |
Total Unit Growth (% vs year ago)
| | | | 4Q24 | |
| Proximity Americas | | | | |
| OXXO | | | 7.0 | % |
| Mexico | | | 5.6 | % |
| OXXO Latam1 & USA | | | 40.2 | % |
| | | | | |
| Other Proximity Americas formats | | | | |
| Bara | | | 33.4 | % |
| OXXO Brazil2 | | | 35.0 | % |
| | | | | |
| Proximity Europe3 | | | (1.1 | )% |
| OXXO Gas | | | N.S. | |
| | | | | |
| FEMSA Health | | | 4.2 | % |
| Chile | | | 4.9 | % |
| Colombia | | | 16.0 | % |
| Ecuador | | | 3.2 | % |
| Mexico | | | (1.1 | )% |
| 1 | Includes OXXO Colombia, Chile and Perú. |
| 2 | Operated through Grupo Nós, our joint-venture with Raízen. |
| 3 | Includes company owned and franchised units. |
Same-Store Sales
| | | | 4Q24 | |
| Proximity Americas | | | | |
| OXXO1 | | | 3.8 | % |
| Mexico | | | 3.5 | % |
| OXXO Latam2 | | | 12.2 | % |
| | | | | |
| Other Proximity Americas formats | | | | |
| Bara | | | 17.4 | % |
| OXXO Brazil3 | | | 9.1 | % |
| | | | | |
| Proximity Europe4 | | | N.A. | |
| OXXO Gas | | | 9.7 | % |
| | | | | |
| FEMSA Health5 | | | 4.1 | % |
| Chile6 | | | 5.1 | % |
| Colombia7 | | | 31.2 | % |
| Ecuador8 | | | (1.4 | )% |
| Mexico | | | (8.3 | )% |
| 1 | OXXO Consolidated figures shown in MXN including currency effects.
Excludes OXXO US operations |
| 2 | Includes OXXO Colombia, Chile and Peru, figure shown in MXN. |
| 3 | Local currency (BRL).
Operated through Grupo Nós, our joint-venture with Raízen. |
| 4 | Local currency (CHF). |
| 5 | Local currency weighted average.
Only includes retail sales. FEMSA Health Include franchised stores in Ecuador. |
| 6 | Local currency (CLP). |
| 7 | Local currency (COP). |
| 8 | Local currency (USD). |
| | February 27, 2025 | Page 11 | |
| SPIN1 |  |
Spin by OXXO
Spin by OXXO acquired 0.6 million users during the quarter to reach 13.1 million total users in 4Q24, compared to 9.8 million users in 4Q23. This represents an increase of 32.8% YoY and a 2.4% compound monthly growth rate.
Active users2 represented 65.5% of the total acquired user base representing 24.9% growth and reaching 8.6 million. Total transactions per month increased 34.2%3 during the quarter to reach an average of 63.2 million per month in 4Q24, reflecting an increase in user engagement.
Spin Premia
Spin Premia acquired 2.8 million users during the quarter to reach 52.8 million total users in 4Q24, compared to 40.2 million users in 4Q23. This represents an increase of 31.5% YoY and a 2.3% compound monthly growth rate. Active users4 represented 46.6% of the total acquired user base representing 27.5% growth and reaching 24.6 million. The average tender5 during the quarter was 40.7%.
| COCA-COLA FEMSA |  |
Coca-Cola FEMSA’s financial results and discussion thereof are incorporated by reference from Coca-Cola FEMSA’s press release, which may be accessed by visiting coca-colafemsa.com.
1 Digital@FEMSA’s results are included within the Other business segment
2 Active User for Spin by OXXO: Any user with a balance or that has transacted within the last 56 days.
3 Represents the growth of average monthly transactions in 4Q24 compared to average monthly transactions in 4Q23.
4 Active User for Spin Premia: User that has transacted at least once with OXXO Premia within the last 90 days.
5 Tender: OXXO MXN sales with Spin Premia redemption or accrual / Total OXXO MXN Sales, during the period.
| | February 27, 2025 | Page 12 | |
RESULTS FOR THE FULL YEAR OF 2024
Results are compared to the same period of previous year
FEMSA CONSOLIDATED
Financial Summary for the Full Year 2024
Amounts expressed in millions of Mexican Pesos (Ps.)
| | | 2024 | | | 2023 | | | Var. | | | Org. | |
| Total Revenues | | | 781,585 | | | | 702,692 | | | | 11.2 | % | | | 10.7 | % |
| Gross Profit | | | 321,416 | | | | 279,507 | | | | 15.0 | % | | | | |
| Gross Profit Margin ()% | | | 41.1 | % | | | 39.8 | % | | | 130 bps | | | | | |
| Income from Operations | | | 70,668 | | | | 58,985 | | | | 19.8 | % | | | 19.8 | % |
| Operating Margin ()% | | | 9.0 | | | | 8.4 | | | | 60 bps | | | | | |
| Adjusted EBITDA1 | | | 115,594 | | | | 95,864 | | | | 20.6 | % | | | 20.5 | % |
| Adjusted EBITDA Margin ()% | | | 14.8 | | | | 13.6 | | | | 120 bps | | | | | |
| Consolidated Net Income | | | 41,687 | | | | 76,677 | | | | N.S. | | | | | |
Total revenues increased 11.2%, reflecting growth across all of our business units.
Gross profit increased 15.0%. Gross margin increased by 130 basis points to 41.1% of total revenues, reflecting a gross margin expansion at Proximity Americas, Coca-Cola FEMSA, Health and Proximity Europe Divisions. This was partially offset by a margin contraction at the Fuel Division.
Income from operations rose by 19.8%. Our consolidated operating margin increased 60 basis points to 9.0% of total revenues, reflecting margin expansion at Coca-Cola FEMSA, Proximity Americas, and Proximity Europe. This was partially offset by stable margins at Health and Fuel Divisions.
Our effective income tax rate was 37.0% for the full year 2024, compared to 22.3% in 2023. Our income tax provision was Ps. 24,661 million for the full year 2024, reflecting a tough comparison base in 2023 when a deferred tax asset was booked, reducing tax expenses. Additionally, the increase was driven by a combination of one-offs such as a higher marginal rate at KOF, non-recoverable tax losses from our Spin business, and impairment charges in OXXO Chile and Health Mexico; as well as a structurally higher effective tax rate due to increased non-deductible expenses, 60% of which are primarily payroll related.
Net consolidated income was Ps. 41,687 million reflecting a decline of 45.6% compared to 2023 explained by; i) a challenging comparative base from full year 2023, which included the reclassification of FEMSA’s investment in Heineken to discontinued operations and subsequent sale; ii) a lower interest income of Ps. 11,910 million compared to Ps. 17,609 million in of 2023 attributable a gain from the purchase of US$1.7 billion of debt during 2023; and iii) a higher interest expense amounting to Ps. 20,002 million compared to Ps. 14,916 million, net of interest gains, reflecting a tough comparison base from gains on derivative instruments in 2023. This was partially offset by a non-cash foreign exchange gain of Ps. 11,929 million related to FEMSA’s U.S. dollar-denominated cash position positive impacted by the depreciation of the Mexican peso.
Net majority income per FEMSA Unit2 was Ps. 7.88 (US$3.78 per ADS).
Capital expenditures amounted to Ps. 51,074 million, an increase of 31.1% compared to 2023, reflecting higher CAPEX in Coca-Cola FEMSA to increase our production and distribution capacity, our store expansion in Proximity Americas, and higher investments in core capabilities across our business units.
1 Adjusted EBITDA: Operating Income + Depreciation + Amortizations.
2 FEMSA Units consist of FEMSA BD Units and FEMSA B Units. Each FEMSA BD Unit is comprised of one Series B Share, two Series D-B Shares and two Series D-L Shares. Each FEMSA B Unit is comprised of five Series B Shares. The number of FEMSA Units outstanding as of December 31, 2024 was 3,578,226,270, equivalent to the total number of FEMSA Shares outstanding as of the same date, divided by 5.
| | February 27, 2025 | Page 13 | |
RECENT DEVELOPMENTS
| ● | As previously anticipated, during this year of 2025 the Company plans to carry out the succession of José Antonio Fernández Carbajal, who holds the position of acting CEO on an interim basis. |
Since late last year, the Corporate Practices and Nominations Committee of FEMSA’s Board of Directors (“CPNC”) has been diligently working on designing and developing the actions required for this important process.
During the Board meeting held yesterday, this Committee recommended the creation of a Special Committee of the Board to oversee this process throughout this year. The Board approved this recommendation:
| ● | The Special Committee will be chaired by Ricardo Saldívar, Chairman of the CPNC, |
| ● | The Committee will include all the other members of the CPNC: Gibu Thomas, Ricardo Guajardo, and Jaime El Koury. |
| ● | In addition, the following directors will also form part of the Special Committee: Michael Larson, Elane Stock, and Olga González. |
Upon completion of their evaluation, the Special Committee will submit its recommendation to the Board of Directors. We will communicate the Board’s decision at the appropriate time.
In designing this process, as in prior CEO designations, we have adhered to the highest corporate standards. We have engaged a leading global firm with extensive experience in such processes, along with other advisors from various specialties.
| ● | On January 27, 2025, FEMSA announced that Daniel Belaúnde, CEO of the Health Division for nearly a decade, decided to close his professional cycle at FEMSA. This was mutually agreed, and we support his decision. Daniel was key in the growth and positioning of the division, guiding the team to distinguish itself as innovative, resilient, high quality, and with a diverse and inclusive approach. |
Concurrently, Jacobo Caller, current CEO of the Multiformat Division, will assume the role of CEO of the Health Division and will continue to report to José Antonio Fernández Garza, CEO of FEMSA Proximity and Health. Jacobo has more than 35 years of experience in the retail industry globally, including the pharmacy sector. Since his arrival at FEMSA Proximity & Health, Jacobo has stood out for being a leader with a clear strategic vision, disciplined execution capabilities oriented towards results, and embracing a role as ambassador of our FEMSA culture.
In turn, Jaime Longoria, current CEO of OXXO Gas, will assume leadership of the Multiformat Division, reporting directly to José Antonio Fernández Garza, CEO of FEMSA Proximity and Health. Jaime has more than 25 years of experience at FEMSA, standing out for his extensive experience in multiple roles, most recently as CEO of OXXO Gas, where he distinguished himself for the excellent results of the business, and always living the cultural values of FEMSA.
For his part, David González, current OXXO GAS Network Director, has been appointed CEO of OXXO GAS and will report to Constantino Spas, CEO of the Americas and Mobility Division. David has more than 12 years of experience within FEMSA, Coca-Cola FEMSA and PTM (our recently divested plastics business).
| ● | On November 4, 2024, FEMSA announced the successful closing of its previously disclosed divestiture on July 17, 2024, of its refrigeration and foodservice equipment operations, Alpunto (including Imbera and Torrey), to Mill Point Capital LLC, for a total amount of $8,000 million pesos, on a cash-free, debt-free basis. |
| | February 27, 2025 | Page 14 | |
CONFERENCE CALL INFORMATION
Our Fourth Quarter and Full Year 2024 Conference Call will be held on: Thursday, February 27, 2025, 10:00 AM Eastern Time (9:00 AM Mexico City Time). The conference call will be webcast live through streaming audio.
| Telephone: | Toll Free US: | (866) 580 3963 |
| | International: | +1 (786) 697 3501 |
| | | |
| Webcast: | https://edge.media-server.com/mmc/p/qvjeojz7/ |
| | | |
| Conference ID: | FEMSA |
If you are unable to participate live, the conference call audio will be available on https://femsa.gcs-web.com/financial-reports/quarterly-results
ABOUT FEMSA
FEMSA is a company that creates economic and social value through companies and institutions and strives to be the best employer and neighbor to the communities in which it operates. It participates in the retail industry through a Proximity Americas Division operating OXXO, a small-format store chain, and other related retail formats, and Proximity Europe which includes Valora, our European retail unit which operates convenience and foodvenience formats. In the retail industry it also participates though a Health Division, which includes drugstores and related activities and Spin, which includes Spin by OXXO and Spin Premia, among other digital financial services initiatives. In the beverage industry, it participates through Coca-Cola FEMSA, the largest franchise bottler of Coca-Cola products in the world by volume. Across its business units, FEMSA has more than 392,000 employees in 18 countries. FEMSA is a member of the Dow Jones Best-in-Class World Index & Dow Jones Best-in-Class MILA Pacific Alliance Index, both from S&P Global; FTSE4Good Emerging Index; MSCI EM Latin America ESG Leaders Index; S&P/BMV Total México ESG, among other indexes.
| The translations of Mexican pesos into US dollars are included solely for the convenience of the reader, using the noon buying rate for Mexican pesos as published by the Federal Reserve Bank of New York on December 31, 2024, which was 20.8557 Mexican pesos per US dollar. |
FORWARD-LOOKING STATEMENTS
This report may contain certain forward-looking statements concerning our future performance that should be considered as good faith estimates made by us. These forward-looking statements reflect management’s expectations and are based upon currently available data. Actual results are subject to future events and uncertainties, which could materially impact our actual performance.
Nuestros Our consolidated financial statements as of and for the year ended December 31, 2024, are not yet available, and the independent audit of those financial statements is ongoing and has not yet been completed. The unaudited preliminary financial information as of and for the year ended December 31, 2024, presented herein, is preliminary and subject to change as we complete our financial closing procedures and prepare our consolidated financial statements, and as our independent registered public accounting firm completes its audit of such consolidated financial statements. As of the date of this release, our independent registered public accounting firm has not expressed an opinion or any other form of assurance on any financial information as of or for the year ended December 31, 2024, or on our internal control over financial reporting as of December 31, 2024. Our audited consolidated financial statements may differ materially from this preliminary information and will also include notes providing additional disclosures.
Ten pages of tables to follow
| | February 27, 2025 | Page 15 | |
FEMSA – Consolidated Income Statement
Amounts expressed in millions of Mexican Pesos (Ps.)
| | | For the fourth quarter of: | | | For the twelve months of: | |
| | | 2024 | | | %
of rev. | | | 2023 | | | %
of rev. | | | % Var. | | | % Org.(A) | | | 2024 | | | %
of rev. | | | 2023 | | | %
of rev. | | | % Var. | | | % Org. (A) | |
| Total revenues | | | 208,311 | | | 100.0 | | | 184,732 | | | 100.0 | | | 12.8 | | | 10.8 | | | 781,585 | | | 100.0 | | | 702,692 | | | 100.0 | | | 11.2 | | | 10.7 | |
| Cost of sales | | | 117,405 | | | 56.4 | | | 106,817 | | | 57.8 | | | 9.9 | | | | | | 460,168 | | | 58.9 | | | 423,185 | | | 60.2 | | | 8.7 | | | | |
| Gross profit | | | 90,906 | | | 43.6 | | | 77,915 | | | 42.2 | | | 16.7 | | | | | | 321,417 | | | 41.1 | | | 279,507 | | | 39.8 | | | 15.0 | | | | |
| Administrative expenses | | | 11,593 | | | 5.6 | | | 8,529 | | | 4.6 | | | 35.9 | | | | | | 39,091 | | | 5.0 | | | 32,307 | | | 4.6 | | | 21.0 | | | | |
| Selling expenses | | | 57,039 | | | 27.4 | | | 52,741 | | | 28.6 | | | 8.1 | | | | | | 211,864 | | | 27.1 | | | 188,732 | | | 26.9 | | | 12.3 | | | | |
| Other operating expenses (income), net (1) | | | (361 | ) | | (0.2 | ) | | (571 | ) | | 9.3 | | | (36.8 | ) | | | | | (206 | ) | | (0.0 | ) | | (517 | ) | | (0.1 | ) | | (60.2 | ) | | | |
| Income from operations (2) | | | 22,634 | | | 10.9 | | | 17,216 | | | 9.3 | | | 31.5 | | | 31.5 | | | 70,668 | | | 9.0 | | | 58,985 | | | 8.4 | | | 19.8 | | | 19.8 | |
| Other non-operating expenses (income) | | | 5,199 | | | | | | 2,974 | | | | | | 74.8 | | | | | | 5,864 | | | | | | (6,568 | ) | | | | | (189.3 | ) | | | |
| Interest expense | | | 5,237 | | | | | | 6,232 | | | | | | (16.0 | ) | | | | | 20,002 | | | | | | 14,916 | | | | | | 34.1 | | | | |
| Interest income | | | 2,813 | | | | | | 4,535 | | | | | | (38.0 | ) | | | | | 11,910 | | | | | | 17,609 | | | | | | (32.4 | ) | | | |
| Interest expense, net | | | 2,424 | | | | | | 1,697 | | | | | | 42.8 | | | | | | 8,092 | | | | | | (2,693 | ) | | | | | N.S. | | | | |
| Foreign exchange loss (gain) | | | (2,673 | ) | | | | | 6,302 | | | | | | (142.4 | ) | | | | | (11,929 | ) | | | | | 9,849 | | | | | | N.S. | | | | |
| Other financial expenses (income), net | | | (1,576 | ) | | | | | 6,137 | | | | | | (125.7 | ) | | | | | (10,029 | ) | | | | | 10,195 | | | | | | (198.4 | ) | | | |
| Financing expenses, net | | | 849 | | | | | | 7,834 | | | | | | (89.2 | ) | | | | | (1,937 | ) | | | | | 7,502 | | | | | | (125.8 | ) | | | |
| Income before income tax and participation in associates results | | | 16,586 | | | | | | 6,408 | | | | | | 158.8 | | | | | | 66,741 | | | | | | 58,051 | | | | | | 15.0 | | | | |
| Income tax | | | 8,769 | | | | | | (3,077 | ) | | | | | N.S. | | | | | | 24,661 | | | | | | 12,971 | | | | | | 90.1 | | | | |
| Participation in associates results (3) | | | (197 | ) | | | | | (103 | ) | | | | | 90.9 | | | | | | (508 | ) | | | | | (641 | ) | | | | | (20.7 | ) | | | |
| Continued Operations net income (Loss) | | | 7,620 | | | | | | 9,382 | | | | | | (18.8 | ) | | | | | 41,572 | | | | | | 44,439 | | | | | | (6.5 | ) | | | |
| Discontinued Operations net income (Loss) | | | 3,339 | | | | | | (3,235 | ) | | | | | N.S. | | | | | | 115 | | | | | | 32,238 | | | | | | (99.6 | ) | | | |
| Consolidated net income (Loss) | | | 10,961 | | | | | | 6,147 | | | | | | 78.3 | | | | | | 41,687 | | | | | | 76,677 | | | | | | (45.6 | ) | | | |
| Net majority income | | | 6,787 | | | | | | 3,077 | | | | | | 120.6 | | | | | | 28,186 | | | | | | 65,689 | | | | | | (57.1 | ) | | | |
| Net minority income | | | 4,174 | | | | | | 3,070 | | | | | | 36.0 | | | | | | 13,501 | | | | | | 10,988 | | | | | | 22.9 | | | | |
| | | | | | | | | | | | | | | | | | | | | | | | | | | | | | | | | | | | | | |
| Operative Cash Flow & CAPEX | | | 2024 | | | %
of rev. | | | 2023 | | | %
of rev. | | | % Var. | | | % Org.(A) | | | 2024 | | | %
of rev. | | | 2023 | | | %
of rev. | | | % Var. | | | % Org.(A) | |
| Income from operations | | | 22,634 | | | 10.9 | | | 17,216 | | | 9.3 | | | 31.5 | | | 31.5 | | | 70,668 | | | 9.0 | | | 58,985 | | | 8.4 | | | 19.8 | | | 19.8 | |
| Depreciation | | | 9,421 | | | 4.5 | | | 8,583 | | | 4.6 | | | 9.8 | | | | | | 35,199 | | | 4.5 | | | 31,378 | | | 4.5 | | | 12.2 | | | | |
| Amortization & other non-cash charges | | | 2,511 | | | 1.2 | | | 1,663 | | | 0.9 | | | 51.0 | | | | | | 9,728 | | | 1.2 | | | 5,501 | | | 0.8 | | | 76.8 | | | | |
| Adjusted EBITDA | | | 34,567 | | | 16.6 | | | 27,462 | | | 14.9 | | | 25.9 | | | 25.4 | | | 115,594 | | | 14.8 | | | 95,864 | | | 13.6 | | | 20.6 | | | 20.5 | |
| CAPEX | | | 20,694 | | | 9.9 | | | 15,679 | | | 8.5 | | | 32.0 | | | | | | 51,074 | | | 6.5 | | | 38,958 | | | 5.5 | | | 31.1 | | | | |
(A) Organic basis (% Org.) excludes the effects of significant mergers and acquisitions in the last twelve months.
(1) Other operating expenses (income), net = other operating expenses (income) +(-) equity method from operated associates.
(2) Income from operations = gross profit – administrative and selling expenses – other operating expenses (income), net.
(3) Mainly represents the results of our joint-venture with Raízen, Grupo Nós, net of taxes.
| | February 27, 2025 | Page 16 | |
FEMSA – Consolidated Balance Sheet
Amounts expressed in millions of Mexican Pesos (Ps.)
| ASSETS | | Dec-24 | | | Dec-23 | | | % Inc. | |
| Cash and cash equivalents | | | 139,834 | | | | 165,112 | | | | (15.3 | ) |
| Investments | | | 43,212 | | | | 26,728 | | | | 61.7 | |
| Accounts receivable | | | 43,192 | | | | 38,863 | | | | 11.1 | |
| Inventories | | | 67,464 | | | | 58,222 | | | | 15.9 | |
| Other current assets | | | 34,213 | | | | 41,415 | | | | (17.4 | ) |
| Current Assets Available for sale | | | 14,395 | | | | 25,819 | | | | (44.2 | ) |
| Total current assets | | | 342,311 | | | | 356,159 | | | | (3.9 | ) |
| Investments in shares | | | 29,376 | | | | 26,247 | | | | 11.9 | |
| Property, plant and equipment, net | | | 177,397 | | | | 141,530 | | | | 25.3 | |
| Right of use | | | 97,984 | | | | 87,941 | | | | 11.4 | |
| Intangible assets (1) | | | 146,418 | | | | 143,218 | | | | 2.2 | |
| Other assets | | | 58,720 | | | | 50,761 | | | | 15.7 | |
| TOTAL ASSETS | | | 852,207 | | | | 805,856 | | | | 5.8 | |
| LIABILITIES & STOCKHOLDERS’ EQUITY | | Dec-24 | | | Dec-23 | | | % Inc. | |
| Bank loans | | | 3,775 | | | | 2,453 | | | | 53.9 | |
| Current maturities of long-term debt | | | 5,278 | | | | 5,998 | | | | (12.0 | ) |
| Interest payable | | | 1,802 | | | | 1,677 | | | | 7.4 | |
| Current maturities of long-term leases | | | 13,794 | | | | 12,236 | | | | 12.7 | |
| Operating liabilities | | | 173,659 | | | | 148,446 | | | | 17.0 | |
| Short term liabilities available for sale | | | 6,952 | | | | 11,569 | | | | (39.9 | ) |
| Total current liabilities | | | 205,260 | | | | 182,381 | | | | 12.5 | |
| Long-term debt (2) | | | 139,151 | | | | 128,373 | | | | 8.4 | |
| Long-term leases | | | 94,293 | | | | 83,837 | | | | 12.5 | |
| Laboral obligations | | | 8,968 | | | | 6,920 | | | | 29.6 | |
| Other liabilities | | | 21,951 | | | | 25,976 | | | | (15.5 | ) |
| Total liabilities | | | 469,623 | | | | 427,487 | | | | 9.9 | |
| Total stockholders’ equity | | | 382,584 | | | | 378,369 | | | | 1.1 | |
| TOTAL LIABILITIES AND STOCKHOLERS’ EQUITY | | | 852,207 | | | | 805,856 | | | | 5.8 | |
| | | December 31, 2024 | |
| DEBT MIX (2) | | % of Total | | | Average Rate | |
| Denominated in: | | | | | | | | |
| Mexican pesos | | | 52.2 | % | | | 9.1 | % |
| U.S. Dollars | | | 28.2 | % | | | 3.4 | % |
| Euros | | | 7.3 | % | | | 2.6 | % |
| Swiss Francs | | | 0.0 | % | | | 0.0 | % |
| Colombian pesos | | | 1.2 | % | | | 8.1 | % |
| Argentine pesos | | | 0.4 | % | | | 50.1 | % |
| Brazilian reais | | | 9.5 | % | | | 9.8 | % |
| Chilean pesos | | | 1.2 | % | | | 6.4 | % |
| Total debt | | | 100.0 | % | | | 7.2 | % |
| | | | | | | | | |
| Fixed rate (2) | | | 82.3 | % | | | | |
| Variable rate (2) | | | 17.7 | % | | | | |
| DEBT MATURITY PROFILE | | 2025 | | | 2026 | | | 2027 | | | 2028 | | | 2029 | | | 2030+ | |
| % of Total Debt | | | 6.2 | % | | | 9.1 | % | | | 6.6 | % | | | 11.7 | % | | | 3.9 | % | | | 62.4 | % |
(1) Includes mainly the intangible assets generated by acquisitions.
(2) Includes the effect of derivative financial instruments on long-term debt.
| | February 27, 2025 | Page 17 | |
Net Debt & Adjusted EBITDA ex-KOF
Amounts expressed in millions of US Dollars (US.)
| | | Twelve months ended December 31, 2024 | |
| | | Reported Adj. EBITDA | | | Adjustments | | | Adj. EBITDA Ex-KOF3 | |
| Proximity Americas & Europe | | | 2,536 | | | | - | | | | 2,536 | |
| Fuel | | | 199 | | | | - | | | | 199 | |
| Health Division | | | 373 | | | | - | | | | 373 | |
| Envoy Solutions | | | - | | | | - | | | | - | |
| Coca-Cola FEMSA1 | | | 2,695 | | | | (2,695 | ) | | | - | |
| Other2 | | | (260 | ) | | | - | | | | (260 | ) |
| FEMSA Consolidated | | | 5,543 | | | | (2,695 | ) | | | 2,848 | |
| | | | | | | | | | | | | |
| Dividends Received3 | | | - | | | | 327 | | | | 327 | |
| | | | | | | | | | | | | |
| FEMSA Consolidated ex-KOF | | | 5,543 | | | | (2,368 | ) | | | 3,174 | |
| | | As of December 31, 2024 | |
| | | Reported | | | Adjustments | | | Ex-KOF | |
| Cash & Equivalents | | | 7.184 | | | | - | | | | 7,184 | |
| Coca-Cola FEMSA Cash & Equivalents | | | 1,572 | | | | (1,572 | ) | | | - | |
| Cash & Equivalents | | | 8,777 | | | | (1,572 | ) | | | 7,205 | |
| | | | | | | | | | | | | |
| Financial Debt4 | | | 3,572 | | | | - | | | | 3,572 | |
| Coca-Cola FEMSA Financial Debt | | | 3,534 | | | | (3,534 | ) | | | - | |
| Lease Liabilities | | | 5,073 | | | | - | | | | 5,073 | |
| Coca-Cola FEMSA Lease Liabilities | | | 110 | | | | (110 | ) | | | - | |
| Debt | | | 12,289 | | | | (3,644 | ) | | | 8,645 | |
| | | | | | | | | | | | | |
| FEMSA Net Debt | | | 3,512 | | | | (2,072 | ) | | | 1,440 | |
Translated to USD for readers’ convenience using the exchange rate published by the Federal Reserve Bank of New York for December 31, 2024 which was 20.8557 MXN per USD.
1 Coca-Cola FEMSA adjustment represents 100% of its LTM EBITDA.
2 Includes FEMSA Other Businesses (including Bara and Digital@FEMSA), FEMSA corporate expenses and the effects of consolidation adjustments
3 Reflects cash dividends received from Coca-Cola FEMSA for approximately US$317 mm and EUR$8 mm from Heineken during the last twelve months.
4 Includes EUR€ 500.0 mm in notes convertible to Heineken Holding N.V. shares.
| | February 27, 2025 | Page 18 | |
EPS with Repurchased Shares
Amounts expressed in millions of Mexican Pesos (Ps.)
As Reported
| Total Shares Outstanding |
| FEMSA Units Outstanding(1) | | | 3,578,226,270 | |
| | | | YTD | | | | 4Q24 | |
| Net majority income | | | 28,186 | | | | 6,787 | |
| | | | | | | | | |
| # FEMSA Units Outstanding(1) | | | 3,578,226,270 | |
| | | | | | | | | |
| EPS (Mxn Ps. / Unit) | | | 7.88 | | | | 1.90 | |
Proforma
| Total Shares Excluding Shares in Treasury |
| FEMSA Units Outstanding(1) | | | 3,476,024,947 | |
| Shares in Treasury |
| FEMSA Units Outstanding(1) | | | 102,201,323 | |
| | | | YTD | | | | 4Q24 | |
| Net majority income | | | 28,186 | | | | 6,787 | |
| | | | | | | | | |
| # FEMSA Units Outstanding(1) | | | 3,476,024,947 | |
| | | | | | | | | |
| EPS (Mxn Ps. / Unit) | | | 8.11 | | | | 1.95 | |
(1) FEMSA Units Outstanding consist of FEMSA BD Units and FEMSA B Units. The number of FEMSA Units outstanding is equivalent to the total number of FEMSA Shares outstanding as of the same date, divided by 5.
| | February 27, 2025 | Page 19 | |
Proximity Americas – Results of Operations
Amounts expressed in millions of Mexican Pesos (Ps.)
| | | For the fourth quarter of: | | | For the twelve months of: | |
| | | 2024 | | 2024
Org.(A) | | | %
of rev. | | | 2023 | | | %
of rev. | | | % Var. | | | % Org.(A) | | | 2024 | | | 2024
Org.(A) | | | %
of rev. | | | 2023 | | | %
of rev. | | | % Var. | | | % Org.(A) | |
| Total revenues | | | 80,992 | | | 77,320 | | | 100.0 | | | 71,530 | | | 100.0 | | | 13.2 | | | 8.1 | | | 307,197 | | | 303,525 | | | 100.0 | | | 278,520 | | | 100.0 | | | 10.3 | | | 9.0 | |
| Cost of sales | | | 42,381 | | | 39,457 | | | 52.3 | | | 39,078 | | | 54.6 | | | 8.5 | | | | | | 170,204 | | | 167,279 | | | 55.4 | | | 161,458 | | | 58.0 | | | 5.4 | | | | |
| Gross profit | | | 38,610 | | | 37,863 | | | 47.7 | | | 32,452 | | | 45.4 | | | 19.0 | | | 16.7 | | | 136,993 | | | 136,245 | | | 44.6 | | | 117,062 | | | 42.0 | | | 17.0 | | | 16.4 | |
| Administrative expenses | | | 2,756 | | | 2,670 | | | 3.4 | | | 2,006 | | | 2.8 | | | 37.4 | | | | | | 8,642 | | | 8,556 | | | 2.8 | | | 6,514 | | | 2.3 | | | 32.7 | | | | |
| Selling expenses | | | 26,160 | | | 25,589 | | | 32.3 | | | 22,806 | | | 31.9 | | | 14.7 | | | | | | 98,653 | | | 98,082 | | | 32.1 | | | 84,493 | | | 30.3 | | | 16.8 | | | | |
| Other operating expenses (income), net | | | 178 | | | 84 | | | 0.2 | | | (380 | ) | | (0.5 | ) | | (146.9 | ) | | | | | 481 | | | 386 | | | 0.2 | | | (216 | ) | | (0.1 | ) | | N.S. | | | | |
| Income from operations | | | 9,516 | | | 9,521 | | | 11.7 | | | 8,020 | | | 11.2 | | | 18.7 | | | 18.7 | | | 29,216 | | | 29,221 | | | 9.5 | | | 26,271 | | | 9.4 | | | 11.2 | | | 11.2 | |
| Depreciation | | | 2,765 | | | 2,639 | | | 3.4 | | | 3,229 | | | 4.5 | | | (14.4 | ) | | | | | 13,952 | | | 13,826 | | | 4.5 | | | 12,437 | | | 4.5 | | | 12.2 | | | | |
| Amortization & other non-cash charges | | | 1,780 | | | 1,780 | | | 2.2 | | | 237 | | | 0.3 | | | N.S. | | | | | | 2,474 | | | 2,474 | | | 0.8 | | | 976 | | | 0.4 | | | 153.4 | | | | |
| Adjusted EBITDA | | | 14,062 | | | 13,940 | | | 17.4 | | | 11,486 | | | 16.1 | | | 22.4 | | | 21.4 | | | 45,642 | | | 45,521 | | | 14.9 | | | 39,684 | | | 14.2 | | | 15.0 | | | 14.7 | |
| CAPEX | | | 3,904 | | | 3,902 | | | 4.8 | | | 3,972 | | | 5.6 | | | (1.7 | ) | | | | | 16,239 | | | 16,238 | | | 5.3 | | | 13,776 | | | 5.9 | | | 17.9 | | | | |
| | | | | | | | | | | | | | | | | | | | | | | | | | | | | | | | | | | | | | | | | | | | |
| Information of OXXO Stores | | | | | | | | | | | | | | | | | | | | | | | | | | | | | | | | | | | | | | | | | | | |
| Total stores | | | | | | | | | | | | | | | | | | | | | | | | 24,462 | | | | | | | | | 22,866 | | | | | | 7.0 | | | | |
| Stores Mexico | | | | | | | | | | | | | | | | | | | | | | | | 23,206 | | | | | | | | | 21,970 | | | | | | 5.6 | | | | |
| Stores South America (1) | | | | | | | | | | | | | | | | | | | | | | | | 1,256 | | | | | | | | | 896 | | | | | | 40.2 | | | | |
| | | | | | | | | | | | | | | | | | | | | | | | | | | | | | | | | | | | | | | | | | | | |
| Net new convenience stores: | | | | | | | | | | | | | | | | | | | | | | | | | | | | | | | | | | | | | | | | | | | |
| vs. Last quarter | | | 454 | | | | | | | | | 514 | | | | | | (11.7 | ) | | | | | | | | | | | | | | | | | | | | | | | | |
| Year-to-date | | | 1,596 | | | | | | | | | 1,408 | | | | | | 13.4 | | | | | | | | | | | | | | | | | | | | | | | | | |
| Last-twelve-months | | | 1,596 | | | | | | | | | 1,408 | | | | | | 13.4 | | | | | | | | | | | | | | | | | | | | | | | | | |
| | | | | | | | | | | | | | | | | | | | | | | | | | | | | | | | | | | | | | | | | | | | |
| Same-store data: (2) | | | | | | | | | | | | | | | | | | | | | | | | | | | | | | | | | | | | | | | | | | | |
| Sales (thousands of pesos) | | | 999.7 | | | | | | | | | 963.5 | | | | | | 3.8 | | | | | | 1,010.1 | | | | | | | | | 969.7 | | | | | | 4.2 | | | | |
| Traffic (thousands of transactions) | | | 17.2 | | | | | | | | | 17.7 | | | | | | (2.8 | ) | | | | | 17.9 | | | | | | | | | 18.1 | | | | | | (1.5 | ) | | | |
| Ticket (pesos) | | | 58.3 | | | | | | | | | 54.6 | | | | | | 6.8 | | | | | | 56.6 | | | | | | | | | 53.5 | | | | | | 5.7 | | | | |
(A) Organic basis (% Org.) excludes the effects of significant mergers and acquisitions in the last twelve months.
(1) This includes 249 stores from our acquisition of Delek’s retail operations, in the USA.
(2) Monthly average information per store, considering same stores with more than twelve months of operations, income from services are included.
| | February 27, 2025 | Page 20 | |
Proximity Europe – Results of Operations
Amounts expressed in millions of Mexican Pesos (Ps.)
| | | For the fourth quarter of: | | For the twelve months of: | |
| | | 2024 | | % of rev. | | 2023 | | % of rev. | | % Var. | | 2024 | | % of rev. | | 2023 | | % of rev. | | % Var. | |
| Total revenues | | | 13,870 | | | 100.0 | | | 11,415 | | | 100.0 | | | 21.5 | | | 49,755 | | | 100.0 | | | 43,552 | | | 100.0 | | | 14.2 | |
| Cost of sales | | | 7,856 | | | 56.6 | | | 6,295 | | | 55.1 | | | 24.8 | | | 28,412 | | | 57.1 | | | 24,930 | | | 57.2 | | | 14.0 | |
| Gross profit | | | 6,014 | | | 43.4 | | | 5,120 | | | 44.9 | | | 17.5 | | | 21,344 | | | 42.9 | | | 18,622 | | | 42.8 | | | 14.6 | |
| Administrative expenses | | | 1,198 | | | 8.6 | | | 896 | | | 7.8 | | | 33.7 | | | 3,793 | | | 7.6 | | | 3,231 | | | 7.4 | | | 17.4 | |
| Selling expenses | | | 4,373 | | | 31.5 | | | 3,955 | | | 34.6 | | | 10.6 | | | 15,748 | | | 31.7 | | | 14,371 | | | 33.0 | | | 9.6 | |
| Other operating expenses (income), net | | | (210 | ) | | (1.5 | ) | | (325 | ) | | (2.8 | ) | | (35.5 | ) | | (231 | ) | | (0.5 | ) | | (379 | ) | | (0.9 | ) | | (39.2 | ) |
| Income from operations | | | 653 | | | 4.7 | | | 594 | | | 5.2 | | | 9.9 | | | 2,033 | | | 4.1 | | | 1,399 | | | 3.2 | | | 45.3 | |
| Depreciation | | | 1,312 | | | 9.5 | | | 1,145 | | | 10.0 | | | 14.6 | | | 4,761 | | | 9.6 | | | 4,406 | | | 10.1 | | | 8.0 | |
| Amortization & other non-cash charges | | | 46 | | | 0.3 | | | 106 | | | 0.9 | | | (56.1 | ) | | 447 | | | 0.9 | | | 442 | | | 1.0 | | | 1.1 | |
| Adjusted EBITDA | | | 2,012 | | | 14.5 | | | 1,845 | | | 16.2 | | | 9.0 | | | 7,240 | | | 14.6 | | | 6,247 | | | 14.3 | | | 15.9 | |
| CAPEX | | | 987 | | | | | | 912 | | | | | | 8.3 | | | 2,270 | | | | | | 1,654 | | | | | | 37.2 | |
February 27, 2025 | Page 21
Health – Results of Operations
Amounts expressed in millions of Mexican Pesos (Ps.)
| | | For the fourth quarter of: | | | For the twelve months of: | |
| | | 2024 | | | % of rev. | | | 2023 | | | % of rev. | | | % Var. | | | 2024 | | | % of rev. | | | 2023 | | | % of rev. | | | % Var. | |
| Total revenues | | | 21,824 | | | | 100.0 | | | | 19,254 | | | | 100.0 | | | | 13.3 | | | | 79,755 | | | | 100.0 | | | | 75,358 | | | | 100.0 | | | | 5.8 | |
| Cost of sales | | | 15,010 | | | | 68.8 | | | | 13,632 | | | | 70.8 | | | | 10.1 | | | | 55,714 | | | | 69.9 | | | | 52,859 | | | | 70.1 | | | | 5.4 | |
| Gross profit | | | 6,814 | | | | 31.2 | | | | 5,622 | | | | 29.2 | | | | 21.2 | | | | 24,041 | | | | 30.1 | | | | 22,499 | | | | 29.9 | | | | 6.9 | |
| Administrative expenses | | | 1,124 | | | | 5.1 | | | | 550 | | | | 2.9 | | | | 104.3 | | | | 4,348 | | | | 5.5 | | | | 2,788 | | | | 3.7 | | | | 56.0 | |
| Selling expenses | | | 4,436 | | | | 20.3 | | | | 4,535 | | | | 23.6 | | | | (2.2 | ) | | | 16,144 | | | | 20.2 | | | | 16,402 | | | | 21.8 | | | | (1.6 | ) |
| Other operating expenses (income), net | | | 53 | | | | 0.2 | | | | (36 | ) | | | (0.2 | ) | | | N.S. | | | | 65 | | | | 0.1 | | | | (20 | ) | | | (0.0 | ) | | | N.S. | |
| Income from operations | | | 1,202 | | | | 5.5 | | | | 573 | | | | 3.0 | | | | 109.7 | | | | 3,483 | | | | 4.4 | | | | 3,329 | | | | 4.4 | | | | 4.6 | |
| Depreciation | | | 889 | | | | 4.1 | | | | 788 | | | | 4.1 | | | | 12.8 | | | | 3,255 | | | | 4.1 | | | | 3,099 | | | | 4.1 | | | | 5.0 | |
| Amortization & other non-cash charges | | | 262 | | | | 1.2 | | | | 901 | | | | 4.7 | | | | (71.0 | ) | | | 1,048 | | | | 1.3 | | | | 1,645 | | | | 2.2 | | | | (36.3 | ) |
| Adjusted EBITDA | | | 2,352 | | | | 10.8 | | | | 2,262 | | | | 11.7 | | | | 4.0 | | | | 7,786 | | | | 9.8 | | | | 8,073 | | | | 10.7 | | | | (3.6 | ) |
| CAPEX | | | 746 | | | | | | | | 755 | | | | | | | | (1.2 | ) | | | 1,835 | | | | | | | | 1,750 | | | | | | | | 4.8 | |
| | | | | | | | | | | | | | | | | | | | | | | | | | | | | | | | | | | | | | | | | |
| Information of Stores | | | | | | | | | | | | | | | | | | | | | | | | | | | | | | | | | | | | | | | | |
| Total stores | | | | | | | | | | | | | | | | | | | | | | | 4,661 | | | | | | | | 4,474 | | | | | | | | 4.2 | |
| Stores Mexico | | | | | | | | | | | | | | | | | | | | | | | 1,739 | | | | | | | | 1,759 | | | | | | | | (1.1 | ) |
| Stores South America | | | | | | | | | | | | | | | | | | | | | | | 2,922 | | | | | | | | 2,715 | | | | | | | | 7.6 | |
| | | | | | | | | | | | | | | | | | | | | | | | | | | | | | | | | | | | | | | | | |
| Net new stores: | | | | | | | | | | | | | | | | | | | | | | | | | | | | | | | | | | | | | | | | |
| vs. Last quarter | | | 125 | | | | | | | | 127 | | | | | | | | (1.6 | ) | | | | | | | | | | | | | | | | | | | | |
| Year-to-date | | | 187 | | | | | | | | 379 | | | | | | | | (50.7 | ) | | | | | | | | | | | | | | | | | | | | |
| Last-twelve-months | | | 187 | | | | | | | | 379 | | | | | | | | (50.7 | ) | | | | | | | | | | | | | | | | | | | | |
| | | | | | | | | | | | | | | | | | | | | | | | | | | | | | | | | | | | | | | | | |
| Same-store data: (1) | | | | | | | | | | | | | | | | | | | | | | | | | | | | | | | | | | | | | | | | |
| Sales (thousands of pesos) | | | 982.6 | | | | | | | | 898.3 | | | | | | | | 9.4 | | | | 918.8 | | | | | | | | 921.1 | | | | | | | | (0.3 | ) |
| (1) | Monthly average information per location, considering same locations with more than twelve months of all the operations of the Health Division. |
February 27, 2025 | Page 22
Fuel – Results of Operations
Amounts expressed in millions of Mexican Pesos (Ps.)
| | | For the fourth quarter of: | | | For the twelve months of: | |
| | | 2024 | | | % of rev. | | | 2023 | | | % of rev. | | | % Var. | | | 2024 | | | % of rev. | | | 2023 | | | % of rev. | | | % Var. | |
| Total revenues | | | 16,331 | | | | 100.0 | | | | 15,121 | | | | 100.0 | | | | 8.0 | | | | 65,365 | | | | 100.0 | | | | 58,499 | | | | 100.0 | | | | 11.7 | |
| Cost of sales | | | 14,260 | | | | 87.3 | | | | 13,099 | | | | 86.6 | | | | 8.9 | | | | 57,430 | | | | 87.9 | | | | 51,155 | | | | 87.4 | | | | 12.3 | |
| Gross profit | | | 2,071 | | | | 12.7 | | | | 2,022 | | | | 13.4 | | | | 2.4 | | | | 7,935 | | | | 12.1 | | | | 7,344 | | | | 12.6 | | | | 8.0 | |
| Administrative expenses | | | 109 | | | | 0.7 | | | | 100 | | | | 0.7 | | | | 8.7 | | | | 343 | | | | 0.5 | | | | 299 | | | | 0.5 | | | | 14.8 | |
| Selling expenses | | | 1,202 | | | | 7.4 | | | | 1,245 | | | | 8.2 | | | | (3.5 | ) | | | 4,792 | | | | 7.3 | | | | 4,548 | | | | 7.8 | | | | 5.4 | |
| Other operating expenses (income), net | | | 15 | | | | 0.1 | | | | (20 | ) | | | (0.1 | ) | | | (174.9 | ) | | | (9 | ) | | | (0.0 | ) | | | (1 | ) | | | (0.0 | ) | | | N.S. | |
| Income from operations | | | 745 | | | | 4.6 | | | | 697 | | | | 4.6 | | | | 6.9 | | | | 2,809 | | | | 4.3 | | | | 2,498 | | | | 4.3 | | | | 12.4 | |
| Depreciation | | | 257 | | | | 1.6 | | | | 286 | | | | 1.9 | | | | (10.0 | ) | | | 1,003 | | | | 1.5 | | | | 1,130 | | | | 1.9 | | | | (11.2 | ) |
| Amortization& other non-cash charges | | | 90 | | | | 0.5 | | | | (40 | ) | | | (0.3 | ) | | | N.S. | | | | 334 | | | | 0.5 | | | | 21 | | | | 0.0 | | | | N.S. | |
| Adjusted EBITDA | | | 1,092 | | | | 6.7 | | | | 943 | | | | 6.2 | | | | 15.8 | | | | 4,146 | | | | 6.3 | | | | 3,649 | | | | 6.2 | | | | 13.6 | |
| CAPEX | | | 185 | | | | | | | | 70 | | | | | | | | 163.0 | | | | 398 | | | | | | | | 186 | | | | | | | | 113.5 | |
| | | | | | | | | | | | | | | | | | | | | | | | | | | | | | | | | | | | | | | | | |
| Information of OXXO GAS Service Stations | | | | | | | | | | | | | | | | | | | | | | | | | | | | | | | | | | | | | | | | |
| Total stores | | | | | | | | | | | | | | | | | | | | | | | 571 | | | | | | | | 571 | | | | | | | | - | |
| Net new convenience stores: | | | | | | | | | | | | | | | | | | | | | | | | | | | | | | | | | | | | | | | | |
| vs. Last quarter | | | 2 | | | | | | | | 0 | | | | | | | | N.S. | | | | | | | | | | | | | | | | | | | | | |
| Year-to-date | | | 0 | | | | | | | | 3 | | | | | | | | N.S. | | | | | | | | | | | | | | | | | | | | | |
| Last-twelve-months | | | 0 | | | | | | | | 3 | | | | | | | | N.S. | | | | | | | | | | | | | | | | | | | | | |
| Volume (millions of liters) total stations | | | 666 | | | | | | | | 638 | | | | | | | | 4.4 | | | | | | | | | | | | | | | | | | | | | |
| | | | | | | | | | | | | | | | | | | | | | | | | | | | | | | | | | | | | | | | | |
| Same-store data: (1) | | | | | | | | | | | | | | | | | | | | | | | | | | | | | | | | | | | | | | | | |
| Sales (thousands of pesos) | | | 8,832.4 | | | | | | | | 8,049.5 | | | | | | | | 9.7 | | | | 8,558.4 | | | | | | | | 7,790.8 | | | | | | | | 9.9 | |
| Traffic (thousands of liters) | | | 401.6 | | | | | | | | 384.7 | | | | | | | | 4.4 | | | | 392.2 | | | | | | | | 374.9 | | | | | | | | 4.6 | |
| Average price per liter | | | 22.0 | | | | | | | | 20.9 | | | | | | | | 5.1 | | | | 21.8 | | | | | | | | 20.8 | | | | | | | | 5.0 | |
| (1) | Monthly average information per station, considering same stations with more than twelve months of operations. |
February 27, 2025 | Page 23
Coca-Cola FEMSA – Results of Operations
Amounts expressed in millions of Mexican Pesos (Ps.)
| | | For the fourth quarter of: | | | For the twelve months of: | |
| | | 2024 | | | % of rev. | | | 2023 | | | % of rev. | | | % Var. | | | 2024 | | | % of rev. | | | 2023 | | | % of rev. | | | % Var. | |
| Total revenues | | | 75,528 | | | | 100.0 | | | | 66,078 | | | | 100.0 | | | | 14.3 | | | | 279,793 | | | | 100.0 | | | | 245,088 | | | | 100.0 | | | | 14.2 | |
| Cost of sales | | | 39,936 | | | | 52.9 | | | | 35,603 | | | | 53.9 | | | | 12.2 | | | | 151,154 | | | | 54.0 | | | | 134,229 | | | | 54.8 | | | | 12.6 | |
| Gross profit | | | 35,592 | | | | 47.1 | | | | 30,475 | | | | 46.1 | | | | 16.8 | | | | 128,639 | | | | 46.0 | | | | 110,860 | | | | 45.2 | | | | 16.0 | |
| Administrative expenses | | | 3,620 | | | | 4.8 | | | | 3,131 | | | | 4.7 | | | | 15.6 | | | | 13,684 | | | | 4.9 | | | | 12,820 | | | | 5.2 | | | | 6.7 | |
| Selling expenses | | | 20,161 | | | | 26.7 | | | | 17,282 | | | | 26.2 | | | | 16.7 | | | | 74,321 | | | | 26.6 | | | | 63,278 | | | | 25.8 | | | | 17.5 | |
| Other operating expenses (income), net | | | (254 | ) | | | (0.3 | ) | | | 388 | | | | 0.6 | | | | (165.4 | ) | | | 688 | | | | 0.2 | | | | 582 | | | | 0.2 | | | | 18.2 | |
| Income from operations | | | 12,092 | | | | 16.0 | | | | 9,674 | | | | 14.6 | | | | 25.0 | | | | 40,141 | | | | 14.3 | | | | 34,180 | | | | 13.9 | | | | 17.4 | |
| Depreciation | | | 3,012 | | | | 4.0 | | | | 2,632 | | | | 4.0 | | | | 14.4 | | | | 11,140 | | | | 4.0 | | | | 9,695 | | | | 4.0 | | | | 14.9 | |
| Amortization & other non-cash charges | | | 1,000 | | | | 1.3 | | | | 843 | | | | 1.3 | | | | 18.7 | | | | 4,924 | | | | 1.8 | | | | 2,543 | | | | 1.0 | | | | 93.6 | |
| Adjusted EBITDA | | | 16,104 | | | | 21.3 | | | | 13,149 | | | | 19.9 | | | | 22.5 | | | | 56,205 | | | | 20.1 | | | | 46,418 | | | | 18.9 | | | | 21.1 | |
| CAPEX | | | 13,839 | | | | | | | | 9,683 | | | | | | | | 42.9 | | | | 29,553 | | | | | | | | 21,396 | | | | | | | | 38.1 | |
| | | | | | | | | | | | | | | | | | | | | | | | | | | | | | | | | | | | | | | | | |
| Sales Volumes | | | | | | | | | | | | | | | | | | | | | | | | | | | | | | | | | | | | | | | | |
| (Millions of unit cases) | | | | | | | | | | | | | | | | | | | | | | | | | | | | | | | | | | | | | | | | |
| Mexico and Central America | | | 589.6 | | | | 54.6 | | | | 580.9 | | | | 55.0 | | | | 1.5 | | | | 2,494.1 | | | | 59.0 | | | | 2,394.8 | | | | 59.2 | | | | 4.1 | |
| South America | | | 159.9 | | | | 14.8 | | | | 157.4 | | | | 14.9 | | | | 1.6 | | | | 571.3 | | | | 13.5 | | | | 577.9 | | | | 14.3 | | | | (1.1 | ) |
| Brazil | | | 329.6 | | | | 30.5 | | | | 318.0 | | | | 30.1 | | | | 3.7 | | | | 1,159.3 | | | | 27.4 | | | | 1,075.1 | | | | 26.6 | | | | 7.8 | |
| Total | | | 1,079.1 | | | | 100.0 | | | | 1,056.2 | | | | 100.0 | | | | 2.2 | | | | 4,224.6 | | | | 100.0 | | | | 4,047.8 | | | | 100.0 | | | | 4.4 | |
February 27, 2025 | Page 24
FEMSA Macroeconomic Information
| | | Inflation | | | End-of-period Exchange Rates | |
| | | 4Q 2024 | | | LTM (1) Dec-24 | | | Dec-24 | | Dec-23 | |
| | | | | | | | | Per USD | | Per MXN | | Per USD | | Per MXN | |
| Mexico | | | 1.00 | % | | | 4.21 | % | | | 20.2683 | | | 1.0000 | | | 16.89 | | | 1.0000 | |
| Colombia | | | 0.47 | % | | | 5.20 | % | | | 4,409.15 | | | 0.0046 | | | 3,822.05 | | | 0.0044 | |
| Brazil | | | 1.26 | % | | | 4.83 | % | | | 6.19 | | | 3.2731 | | | 4.84 | | | 3.4895 | |
| Argentina | | | 4.66 | % | | | 117.76 | % | | | 1,032.00 | | | 0.0196 | | | 808.45 | | | 0.0209 | |
| Chile | | | 0.57 | % | | | 4.53 | % | | | 996.46 | | | 0.0203 | | | 877.12 | | | 0.0193 | |
| Euro Zone | | | 0.47 | % | | | 2.45 | % | | | 0.95 | | | 21.2907 | | | 0.90 | | | 18.7611 | |
February 27, 2025 | Page 25

Mexico City, February 21, 2025, Coca-Cola FEMSA, S.A.B. de C.V. (BMV: KOFUBL, NYSE: KOF) (“Coca-Cola FEMSA,” “KOF” or the “Company”), the largest Coca-Cola franchise bottler in the world by sales volume, announces results for the fourth quarter of 2024.
FOURTH QUARTER HIGHLIGHTS
| · | Volume growth 2.2% |
| · | Revenue growth 14.3% |
| · | Operating income growth 25.0% |
| · | Majority net income growth 35.1% |
| · | Earnings per share1 were Ps. 0.43. (Earnings per unit were Ps. 3.47 and per ADS were Ps. 34.68.) |
| · | Reached more than 1.3 million active users in Juntos+ B2B platform; and more than 1.1 million in Premia Juntos+ loyalty program. |
TWELVE MONTHS HIGHLIGHTS
| · | Volume growth 4.4% |
| · | Revenue growth 14.2% |
| · | Operating income growth 17.4% |
| · | Majority net income growth 21.5% |
| · | Earnings per share1 were Ps. 1.41. (Earnings per unit were Ps. 11.30 and per ADS were Ps. 112.95.) |
| FINANCIAL SUMMARY FOR THE FOURTH QUARTER RESULTS |
| |
| Change vs. same period of last year |
| |
| | | | | Total Revenues | | | Gross Profit | | | Operating Income | | | Majority Net Income | |
| | | | | 4Q24 | | | FY 2024 | | | 4Q24 | | | FY 2024 | | | 4Q24 | | | FY 2024 | | | 4Q24 | | | FY 2024 | |
| | | Consolidated | | 14.3 | % | | 14.2 | % | | 17.1 | % | | 16.1 | % | | 25.0 | % | | 17.4 | % | | 35.1 | % | | 21.5 | % |
| As Reported | | Mexico & Central America | | 10.4 | % | | 11.8 | % | | 10.0 | % | | 12.7 | % | | 23.7 | % | | 14.9 | % | | | | | | |
| | South America | | 19.4 | % | | 17.8 | % | | 28.1 | % | | 22.3 | % | | 26.9 | % | | 22.7 | % | | | | | | |
| | | | | | | | | | | | | | | | | | | | | | | | | | | |
| | | Consolidated | | 13.0 | % | | 14.3 | % | | 15.5 | % | | 16.1 | % | | 23.2 | % | | 17.6 | % | | | | | | |
| Comparable (2) | | Mexico & Central America | | 7.2 | % | | 10.8 | % | | 6.7 | % | | 11.6 | % | | 19.0 | % | | 13.7 | % | | | | | | |
| | South America | | 21.0 | % | | 20.1 | % | | 29.5 | % | | 24.4 | % | | 29.3 | % | | 26.0 | % | | | | | | |
Ian Craig, Coca-Cola FEMSA’s CEO, commented:
“2024 marks the second chapter of our transformation. During the year, we continued to build on the growth momentum of our core business, strengthened our portfolio, and increased our customer base. On the digital front, we took Juntos+, our B2B omnichannel platform, to the next level with the deployment of advanced AI capabilities. Juntos+ now reaches 1.3 million active users across Latin America, with more than 1.1 million users engaged in our Juntos+ Premia loyalty plan. Notably, we successfully developed and began the rollout in Brazil of a new salesforce tool, Juntos+ Advisor. This tool leverages advanced AI models to enhance our salesforce capabilities and improve customer engagement. All of this, as we reinforced our desired culture across our operations.
Looking ahead, we remain optimistic about the opportunities across our markets. We are transforming Coca-Cola FEMSA into a highly adaptive organization to successfully navigate ever-changing environments. Indeed, last year we deployed a record amount of CAPEX, mainly focused on expanding production and distribution capacity. We are participating in a vibrant beverage industry within a growing region, and our teams are well-positioned to capture these opportunities and continue generating value for all of our stakeholders.”
| (1) | Quarterly earnings / outstanding shares. Earnings per share (EPS) were calculated using 16,806.7 million shares outstanding. For the convenience of the reader, as a KOFUBL Unit is comprised of 8 shares (3 Series B shares and 5 Series L shares), earnings per unit are equal to EPS multiplied by 8. Each ADS represents 10 KOFUBL Units. |
| (2) | Please refer to page 10 for our definition of “comparable” and a description of the factors affecting the comparability of our financial and operating performance. |
| Coca-Cola FEMSA Reports 4Q24 Results | Page 2 of 17 |  |
| February 21, 2025 | |
RECENT DEVELOPMENTS
| · | On December 9, 2024, Coca-Cola FEMSA paid the fourth installment of the ordinary dividend approved for Ps. 0.19 per share, for a total cash distribution of Ps. 3,193.26 million. |
| · | In 2024, Coca-Cola FEMSA reaffirmed its commitment to sustainability by updating its Sustainability Framework. Company-wide efforts led to significant improvements in sustainability assessments, such as the S&P Global Corporate Sustainability Assessment (CSA), earning inclusion in the Sustainability Yearbook 2025 and maintaining its position in the DJSI MILA Pacific Alliance Index. The Company also significantly improved its ratings in the FTSE4Good index, ISS-ESG, Sustainalytics, and CDP Climate Change and Water Stewardship. Last September, the Company achieved a water efficiency rate of 1.36 liters of water per liter of beverage produced, solidifying its position as a global leader in water efficiency. |
CONFERENCE CALL INFORMATION

| Coca-Cola FEMSA Reports 4Q24 Results | Page 3 of 17 | |
| February 21, 2025 | |
CONSOLIDATED FOURTH QUARTER RESULTS
CONSOLIDATED FOURTH QUARTER RESULTS
| | | As Reported | | | Comparable (1) | |
| Expressed in millions of Mexican pesos | | 4Q 2024 | | 4Q 2023 | | Δ% | | | Δ% | |
| Total revenues | | | 75,528 | | | 66,078 | | | 14.3 | % | | | 13.0 | % |
| Gross profit | | | 35,695 | | | 30,475 | | | 17.1 | % | | | 15.5 | % |
| Operating income | | | 12,092 | | | 9,674 | | | 25.0 | % | | | 23.2 | % |
| Adj. EBITDA (2) | | | 16,104 | | | 13,149 | | | 22.5 | % | | | 20.7 | % |
Volume increased 2.2% to 1,079.1 million unit cases, driven by volume growth across most of our territories. Volume growth was driven mainly by Brazil, Mexico, and Guatemala, partially offset by a slight volume decline in Colombia.
Total revenues increased 14.3% to Ps. 75,528 million. This increase was driven by volume growth, revenue management initiatives, and favorable mix effects. Excluding currency translation effects, total revenues increased 13.0%.
Gross profit increased 17.1% to Ps. 35,695 million, and gross margin increased 120 basis points to 47.3%. This expansion was driven mainly by our top-line growth, favorable mix effects coupled with easing sweetener and PET costs and favorable hedging initiatives. These effects were partially offset by higher fixed costs, such as maintenance, and the depreciation of our main operating currencies as applied to our U.S. dollar-denominated raw material costs. Excluding currency translation effects, gross profit increased 15.5%.
Operating income increased 25.0% to Ps. 12,092 million, and operating margin increased 140 basis points to 16.0%. This margin expansion was driven mainly by top-line growth and operating expense efficiencies, that mitigated margin pressures related to higher operating expenses such as maintenance, freight, operative foreign exchange loss, and labor. Additionally, we incurred a one-time net expense of Ps. 730 million, primarily related to asset write-offs, site cleaning, and debris removal following the impact of hurricanes in Guerrero and the flooding in Rio Grande do Sul. This figure already reflects the recognition of insurance claims in both Mexico and Brazil. Excluding currency translation effects, operating income increased 23.2%.
| (1) | Please refer to page 10 for our definition of “comparable” and a description of the factors affecting the comparability of our financial and operating performance. |
| (2) | Adjusted EBITDA = operating income + depreciation + amortization & other operating non-cash charges. |
| Coca-Cola FEMSA Reports 4Q24 Results | Page 4 of 17 | |
| February 21, 2025 | |
Comprehensive financing result recorded an expense of Ps. 980 million, compared to an expense of Ps. 1,285 million in the previous year. This decrease was driven mainly by a foreign exchange gain of Ps. 57 million in the fourth quarter of 2024 as compared to a loss of Ps. 317 million in the same period of the previous year, which was driven by the quarterly depreciation of the Mexican Peso and the Brazilian Real as applied to our U.S. dollar-denominated cash position. In addition, we recognized a higher gain in monetary positions in inflationary subsidiaries of Ps. 61 million as compared to a gain of Ps. 4 million in the same period of the previous year.
These effects were partially offset by a loss in financial instruments of Ps. 33 million as compared to a gain of Ps. 90 million in the same period of the previous year.
Finally, we recognized interest expense, net, of Ps. 1,065 million as compared to Ps. 1,062 million in the same period of the previous year as higher interest expense mainly driven by new financing in Argentina was offset by higher interest income related increases in notional and interest rates.
Income tax as a percentage of income before taxes was 33.1% as compared to 33.8% during the same period of 2023.
Net income attributable to equity holders of the company was Ps. 7,286 million as compared to Ps. 5,392 million during the same period of the previous year. This increase was driven mainly by operating income growth, coupled with a decrease in our comprehensive financing result. Earnings per share1 were Ps. 0.43 (Earnings per unit were Ps. 3.47 and per ADS were Ps. 34.68.).
| (1) | Quarterly earnings / outstanding shares. Earnings per share (EPS) were calculated using 16,806.7 million shares outstanding. For the convenience of the reader, as a KOFUBL Unit is comprised of 8 shares (3 Series B shares and 5 Series L shares), earnings per unit are equal to EPS multiplied by 8. Each ADS represents 10 KOFUBL Units. |
| Coca-Cola FEMSA Reports 4Q24 Results | Page 5 of 17 | |
| February 21, 2025 | |
CONSOLIDATED TWELVE months RESULTS
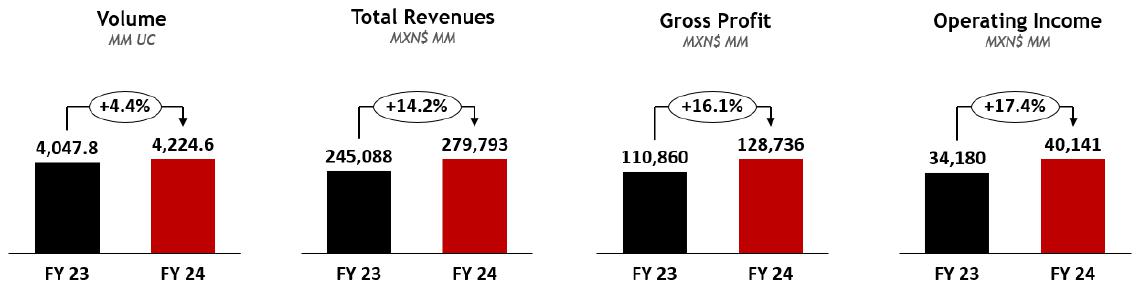
CONSOLIDATED FULL YEAR RESULTS
| | | As Reported | | | Comparable (1) | |
| Expressed in millions of Mexican pesos | | | FY 2024 | | | | FY 2023 | | | | Δ% | | | | Δ% | |
| Total revenues | | | 279,793 | | | | 245,088 | | | | 14.2 | % | | | 14.3 | % |
| Gross profit | | | 128,736 | | | | 110,860 | | | | 16.1 | % | | | 16.1 | % |
| Operating income | | | 40,141 | | | | 34,180 | | | | 17.4 | % | | | 17.6 | % |
| Adj. EBITDA (2) | | | 56,205 | | | | 46,418 | | | | 21.1 | % | | | 21.1 | % |
Volume increased 4.4% to 4,224.6 million unit cases, driven by volume growth in most of our territories, including Mexico, Brazil, Guatemala, Colombia, and our Central America South territories, partially offset by a decrease in Argentina and Uruguay.
Total revenues increased 14.2% to Ps. 279,793 million. This increase was driven by volume growth, revenue management initiatives, and favorable mix effects. Excluding currency translation effects, total revenues increased 14.3%.
Gross profit increased 16.1% to Ps. 128,736 million, and gross margin expanded 80 basis points to 46.0%. This gross profit increase was driven mainly by our top-line growth, favorable packaging and sweetener costs, and hedging initiatives. These effects were partially offset by fixed costs and the depreciation of most of our operating currencies as applied to our U.S. dollar-denominated raw material costs. Excluding currency translation effects, gross profit increased 16.1%.
Operating income increased 17.4% to Ps. 40,141 million, and operating margin increased 40 basis points to 14.3%. This increase was driven mainly by top-line growth and operating expense efficiencies. These effects were partially offset by increases in operating expenses such as labor, freight, and maintenance and a non-cash operating foreign exchange loss. In addition, we recognized additional net expenses of Ps. 1,637 million related to asset write-offs and the removal of debris resulting from the impact of the hurricanes in Mexico and the floodings in Brazil. This figure includes the recognition of insurance claims in Mexico and Brazil. Excluding currency translation effects, operating income increased 17.6%.
| (1) | Please refer to page 10 for our definition of “comparable” and a description of the factors affecting the comparability of our financial and operating performance. |
| (2) | Adjusted EBITDA = operating income + depreciation + amortization & other operating non-cash charges. |
| Coca-Cola FEMSA Reports 4Q24 Results | Page 6 of 17 | |
| February 21, 2025 | |
Comprehensive financing result recorded an expense of Ps. 3,906 million, compared to an expense of Ps. 4,697 million in the previous year. This decrease is explained mainly by a foreign exchange gain of Ps. 304 million as compared to a loss of Ps. 1,046 million, as our net cash exposure in U.S. dollars was positively impacted by the depreciation of the Mexican Peso and the Brazilian Real during 2024. In addition, we recorded a higher gain on monetary position of inflationary subsidiaries of Ps. 216 million as compared to Ps. 93 million.
These effects were partially offset by an increase in our interest expense, net, of Ps. 4,492 million as compared to an expense of Ps. 3,914 million in the same period of the previous year. This increase was mainly driven by an increase in our debt in Argentina and a reduction in our interest income.
Income tax as a percentage of income before taxes was 32.7% as compared to 30.5% during 2023. This increase was driven mainly by adjustments in deferred taxes.
Net income attributable to equity holders of the company increased 21.5% to reach Ps. 23,729 million during the year 2024, as compared to Ps. 19,536 million during the previous year. This increase was driven mainly by operating income growth, coupled with a decrease in our comprehensive financing result. These effects were partially offset by a higher income taxes rate. Earnings per share1 were Ps. 1.41 (Earnings per unit were Ps. 11.30 and per ADS were Ps. 112.95.).
| (1) | Quarterly earnings / outstanding shares. Earnings per share (EPS) were calculated using 16,806.7 million shares outstanding. For the convenience of the reader, as a KOFUBL Unit is comprised of 8 shares (3 Series B shares and 5 Series L shares), earnings per unit are equal to EPS multiplied by 8. Each ADS represents 10 KOFUBL Units. |
| Coca-Cola FEMSA Reports 4Q24 Results | Page 7 of 17 | |
| February 21, 2025 | |
MEXICO & CENTRAL AMERICA DIVISION FOURTH QUARTER RESULTS
| (Mexico, Guatemala, Costa Rica, Panama, and Nicaragua) |  |
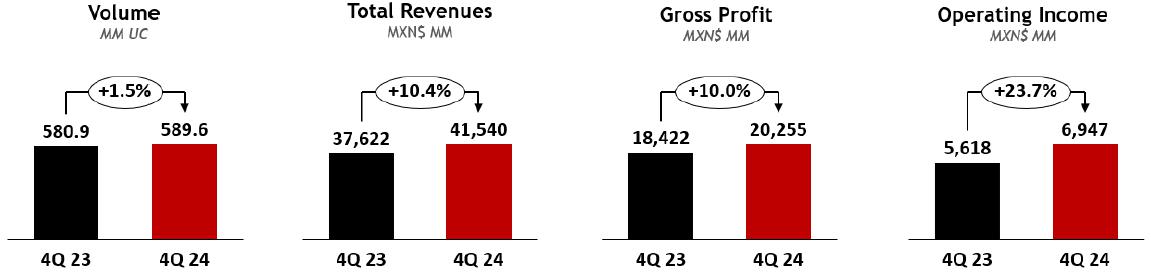
MEXICO & CENTRAL AMERICA DIVISION RESULTS
| | | As Reported | | | Comparable (1) | |
| Expressed in millions of Mexican pesos | | 4Q 2024 | | | 4Q 2023 | | | Δ% | | | Δ% | |
| Total revenues | | | 41,540 | | | | 37,622 | | | | 10.4 | % | | | 7.2 | % |
| Gross profit | | | 20,255 | | | | 18,422 | | | | 10.0 | % | | | 6.7 | % |
| Operating income | | | 6,947 | | | | 5,618 | | | | 23.7 | % | | | 19.0 | % |
| Adj. EBITDA (2) | | | 9,531 | | | | 7,704 | | | | 23.7 | % | | | 19.2 | % |
Volume increased 1.5%, driven by volume growth in all our territories across the division.
Total revenues increased 10.4% to Ps. 41,540 million, driven mainly by revenue management initiatives and the favorable translation effect from most of our operating currencies into Mexican Pesos. Excluding currency translation effects, total revenues increased 7.2%.
Gross profit increased 10.0% to Ps. 20,255 million, and gross margin contracted 20 basis points to 48.8%. This margin decrease was driven mainly by higher fixed costs, such as maintenance and the depreciation of the Mexican Peso as applied to our U.S. dollar-denominated raw material costs, that offset our top-line growth and easing sweetener and packaging costs, coupled with favorable hedging initiatives. Excluding currency translation effects, gross profit increased 6.7%.
Operating income increased 23.7% to Ps. 6,947 million, and operating margin increased 180 basis points to 16.7%. This margin increase was driven mainly by our top-line growth, and operating expense efficiencies that mitigated margin pressures related to higher operating expenses such as labor, freight, and maintenance, coupled with an operating foreign exchange loss. In addition, this quarter we recognized one-time net expenses of Ps. 399 million related to asset write-offs and the removal of debris related to the impact of hurricanes in Mexico. This figure includes the recognition of insurance claims. Excluding currency translation effects, operating income increased 19.0%.
| (1) | Please refer to page 10 for our definition of “comparable” and a description of the factors affecting the comparability of our financial and operating performance. |
| (2) | Adjusted EBITDA = operating income + depreciation + amortization & other operating non-cash charges. |
| Coca-Cola FEMSA Reports 4Q24 Results | Page 8 of 17 | |
| February 21, 2025 | |
SOUTH AMERICA DIVISION FOURTH QUARTER RESULTS
| (Brazil, Argentina, Colombia, and Uruguay) |  |
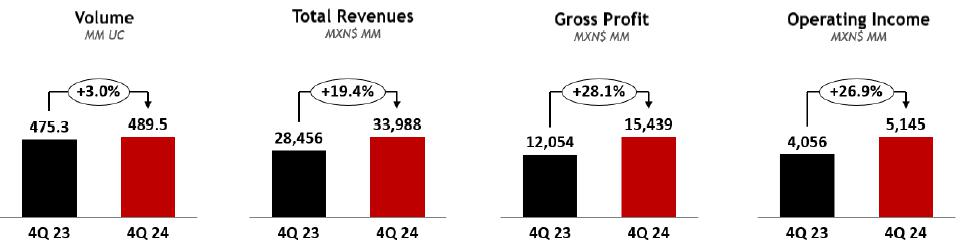
SOUTH AMERICA DIVISION RESULTS
| | | As Reported | | | Comparable (1) | |
| Expressed in millions of Mexican pesos | | 4Q 2024 | | | 4Q 2023 | | | Δ% | | | Δ% | |
| Total revenues | | | 33,988 | | | | 28,456 | | | | 19.4 | % | | | 21.0 | % |
| Gross profit | | | 15,439 | | | | 12,054 | | | | 28.1 | % | | | 29.5 | % |
| Operating income | | | 5,145 | | | | 4,056 | | | | 26.9 | % | | | 29.3 | % |
| Adj. EBITDA (2) | | | 6,572 | | | | 5,444 | | | | 20.7 | % | | | 22.8 | % |
Volume increased 3.0% to 489.5 million unit cases, driven mainly by 3.7% volume growth in Brazil, 8.9% volume growth in Uruguay, and a 2.9% increase in Argentina, partially offset by a 0.3% decrease in Colombia.
Total revenues increased 19.4% to Ps. 33,988 million. This increase was driven mainly by volume growth, coupled with revenue management initiatives. These effects were partially offset by unfavorable currency translation effects from the Argentine Peso and the Brazilian Real into Mexican pesos. Excluding currency translation effects, total revenues increased 21.0%.
Gross profit increased 28.1% to Ps. 15,439 million, and gross margin expanded 300 basis points to 45.4%. This expansion was driven mainly by top-line growth, coupled with a decrease in raw material costs, such as sweetener and PET, and fixed cost efficiencies, which were partially offset by purchases of finished products, and inventory write-offs in Brazil. Excluding currency translation effects, gross profit increased 29.5%.
Operating income increased 26.9% to Ps. 5,145 million, resulting in an operating margin expansion of 80 basis points to 15.1%. This increase was driven mainly by an increase in our gross profit, which was partially offset by higher operating expenses such as freight and marketing. In addition, this quarter we recognized one-time net expenses of Ps. 331 million related to asset write-offs and the removal of debris related to the impact of the floodings in Rio Grande do Sul. This figure includes the recognition of insurance claims. Excluding currency translation effects, operating income increased 29.3%.
| (1) | Please refer to page 10 for our definition of “comparable” and a description of the factors affecting the comparability of our financial and operating performance. |
| (2) | Adjusted EBITDA = operating income + depreciation + amortization & other operating non-cash charges. |
| Coca-Cola FEMSA Reports 4Q24 Results | Page 9 of 17 | |
| February 21, 2025 | |
DEFINITIONS
Volume is expressed in unit cases. Unit case refers to 192 ounces of finished beverage product (24 eight-ounce servings) and, when applied to soda fountains, refers to the volume of syrup, powders, and concentrate that is required to produce 192 ounces of finished beverage product.
Transactions refers to the number of single units (e.g., a can or a bottle) sold, regardless of their size or volume or whether they are sold individually or in multipacks, except for soda fountains, which represent multiple transactions based on a standard 12 oz. serving.
Operating income is a non-GAAP financial measure computed as “gross profit – operating expenses – other operating expenses, net + operative equity method (gain) loss in associates.”
Adjusted EBITDA is a non-GAAP financial measure computed as “operating income + depreciation + amortization & other operating non-cash charges.”
Earnings per share are equal to “quarterly earnings / outstanding shares.” Earnings per share (EPS) for all periods are adjusted to give effect to the stock split resulting in 16,806,658,096 shares outstanding. For the convenience of the reader, as a KOFUBL Unit is comprised of 8 shares (3 Series B shares and 5 Series L shares), earnings per unit are equal to EPS multiplied by 8. Each ADS represents 10 KOFUBL Units.
COMPARABILITY
Our “comparable” term means, with respect to a year-over-year comparison, the change of a given measure excluding the effects of: (i) mergers, acquisitions, and divestitures; and (ii) translation effects resulting from exchange rate movements. In preparing this measure, management has used its best judgment, estimates, and assumptions to maintain comparability.
| Coca-Cola FEMSA Reports 4Q24 Results | Page 10 of 17 | |
| February 21, 2025 | |
ABOUT THE COMPANY
Stock listing information: Mexican Stock Exchange, Ticker: KOFUBL | NYSE (ADS), Ticker: KOF | Ratio of KOFUBL to KOF = 10:1
Coca-Cola FEMSA, S.A.B. de C.V. is the largest franchise bottler in the world by sales volume. The Company produces and distributes trademark beverages of The Coca-Cola Company, offering a wide portfolio to more than 272 million consumers. With over 104,000 employees, the Company markets and sells approximately 4 billion unit cases through more than 2.1 million points of sale a year. Operating 56 manufacturing plants and 252 distribution centers, Coca-Cola FEMSA is committed to generating economic, social, and environmental value for all its stakeholders across the value chain. The Company is a member of the Dow Jones Sustainability MILA Pacific Alliance Index, FTSE4Good Emerging Index, and the S&P/BMV Total Mexico ESG Index, among others. Its operations encompass certain territories in Mexico, Brazil, Guatemala, Colombia, and Argentina and, nationwide, in Costa Rica, Nicaragua, Panama, Uruguay and, in Venezuela, through an investment in KOF Venezuela. For further information, please visit www.coca-colafemsa.com

ADDITIONAL INFORMATION
All of the financial information presented in this report was prepared under International Financial Reporting Standards (IFRS).
This news release may contain forward-looking statements concerning Coca-Cola FEMSA’s future performance, which should be considered as good faith estimates by Coca-Cola FEMSA. These forward-looking statements reflect management’s expectations and are based upon currently available data. Actual results are subject to future events and uncertainties, many of which are outside Coca-Cola FEMSA’s control, which could materially impact the Company’s actual performance. References herein to “US$” are to United States dollars. This news release contains translations of certain Mexican peso amounts into U.S. dollars for the convenience of the reader. These translations should not be construed as representations that Mexican peso amounts actually represent such U.S. dollar amounts or could be converted into U.S. dollars at the rate indicated.
(6 pages of tables to follow)
| Coca-Cola FEMSA Reports 4Q24 Results | Page 11 of 17 | |
| February 21, 2025 | |
COCA-COLA FEMSA
CONSOLIDATED INCOME STATEMENT
Millions of Pesos (1)
| | | For the Fourth Quarter of: | | | For Full Year: | |
| | | 2024 | | | % of Rev. | | | 2023 | | | % of Rev. | | | Δ% Reported | | | Δ% Comparable (7) | | | 2024 | | | % of Rev. | | | 2023 | | | % of Rev. | | | Δ% Reported | | | Δ% Comparable (7) | |
| Transactions (million transactions) | | | 6,445.3 | | | | | | | | 6,194.6 | | | | | | | | 4.0 | % | | | 4.0 | % | | | 24,929.2 | | | | | | | | 23,743.2 | | | | | | | | 5.0 | % | | | 5.0 | % |
| Volume (million unit cases) | | | 1,079.1 | | | | | | | | 1,056.2 | | | | | | | | 2.2 | % | | | 2.2 | % | | | 4,224.6 | | | | | | | | 4,047.8 | | | | | | | | 4.4 | % | | | 4.4 | % |
| Average price per unit case | | | 67.45 | | | | | | | | 60.24 | | | | | | | | 12.0 | % | | | | | | | 64.23 | | | | | | | | 58.54 | | | | | | | | 9.7 | % | | | | |
| Net revenues | | | 75,302 | | | | | | | | 65,830 | | | | | | | | 14.4 | % | | | | | | | 279,030 | | | | | | | | 244,264 | | | | | | | | 14.2 | % | | | | |
| Other operating revenues | | | 226 | | | | | | | | 248 | | | | | | | | -9.2 | % | | | | | | | 763 | | | | | | | | 824 | | | | | | | | -7.4 | % | | | | |
| Total revenues (2) | | | 75,528 | | | | 100.0 | % | | | 66,078 | | | | 100.0 | % | | | 14.3 | % | | | 13.0 | % | | | 279,793 | | | | 100.0 | % | | | 245,088 | | | | 100.0 | % | | | 14.2 | % | | | 14.3 | % |
| Cost of goods sold | | | 39,833 | | | | 52.7 | % | | | 35,603 | | | | 53.9 | % | | | 11.9 | % | | | | | | | 151,057 | | | | 54.0 | % | | | 134,228 | | | | 54.8 | % | | | 12.5 | % | | | | |
| Gross profit | | | 35,695 | | | | 47.3 | % | | | 30,475 | | | | 46.1 | % | | | 17.1 | % | | | 15.5 | % | | | 128,736 | | | | 46.0 | % | | | 110,860 | | | | 45.2 | % | | | 16.1 | % | | | 16.1 | % |
| Operating expenses | | | 23,883 | | | | 31.6 | % | | | 20,413 | | | | 30.9 | % | | | 17.0 | % | | | | | | | 88,101 | | | | 31.5 | % | | | 76,098 | | | | 31.0 | % | | | 15.8 | % | | | | |
| Other operative expenses, net | | | (253 | ) | | | -0.3 | % | | | 433 | | | | 0.7 | % | | | NA | | | | | | | | 688 | | | | 0.2 | % | | | 813 | | | | 0.3 | % | | | -15.4 | % | | | | |
| Operative equity method (gain) loss in associates(3) | | | (27 | ) | | | 0.0 | % | | | (45 | ) | | | -0.1 | % | | | -39.6 | % | | | | | | | (194 | ) | | | -0.1 | % | | | (232 | ) | | | -0.1 | % | | | -16.5 | % | | | | |
| Operating income (5) | | | 12,092 | | | | 16.0 | % | | | 9,674 | | | | 14.6 | % | | | 25.0 | % | | | 23.2 | % | | | 40,141 | | | | 14.3 | % | | | 34,180 | | | | 13.9 | % | | | 17.4 | % | | | 17.6 | % |
| Other non operative expenses, net | | | (36 | ) | | | 0.0 | % | | | 50 | | | | 0.1 | % | | | NA | | | | | | | | 31 | | | | 0.0 | % | | | 459 | | | | 0.2 | % | | | -93.3 | % | | | | |
| Non Operative equity method (gain) loss in associates (4) | | | (37 | ) | | | 0.0 | % | | | (132 | ) | | | -0.2 | % | | | -71.7 | % | | | | | | | (112 | ) | | | 0.0 | % | | | 17 | | | | 0.0 | % | | | NA | | | | | |
| Interest expense | | | 1,935 | | | | | | | | 1,791 | | | | | | | | 8.0 | % | | | | | | | 7,532 | | | | | | | | 7,102 | | | | | | | | 6.1 | % | | | | |
| Interest income | | | 870 | | | | | | | | 730 | | | | | | | | 19.2 | % | | | | | | | 3,039 | | | | | | | | 3,188 | | | | | | | | -4.7 | % | | | | |
| Interest expense, net | | | 1,065 | | | | | | | | 1,062 | | | | | | | | 0.3 | % | | | | | | | 4,492 | | | | | | | | 3,914 | | | | | | | | 14.8 | % | | | | |
| Foreign exchange loss (gain) | | | (57 | ) | | | | | | | 317 | | | | | | | | NA | | | | | | | | (304 | ) | | | | | | | 1,046 | | | | | | | | -129.1 | % | | | | |
| Loss (gain) on monetary position in inflationary subsidiaries | | | (61 | ) | | | | | | | (4 | ) | | | | | | | 1564.0 | % | | | | | | | (216 | ) | | | | | | | (93 | ) | | | | | | | 131.4 | % | | | | |
| Market value (gain) loss on financial instruments | | | 33 | | | | | | | | (90 | ) | | | | | | | NA | | | | | | | | (67 | ) | | | | | | | (169 | ) | | | | | | | -60.2 | % | | | | |
| Comprehensive financing result | | | 980 | | | | | | | | 1,285 | | | | | | | | -23.7 | % | | | | | | | 3,906 | | | | | | | | 4,697 | | | | | | | | -16.9 | % | | | | |
| Income before taxes | | | 11,185 | | | | | | | | 8,470 | | | | | | | | 32.1 | % | | | | | | | 36,316 | | | | | | | | 29,007 | | | | | | | | 25.2 | % | | | | |
| Income taxes | | | 3,686 | | | | | | | | 2,802 | | | | | | | | 31.6 | % | | | | | | | 11,768 | | | | | | | | 8,781 | | | | | | | | 34.0 | % | | | | |
| Result of discontinued operations | | | - | | | | | | | | - | | | | | | | | NA | | | | | | | | - | | | | | | | | - | | | | | | | | NA | | | | | |
| Consolidated net income | | | 7,499 | | | | | | | | 5,669 | | | | | | | | 32.3 | % | | | | | | | 24,549 | | | | | | | | 20,226 | | | | | | | | 21.4 | % | | | | |
| Net income attributable to equity holders of the company | | | 7,286 | | | | 9.6 | % | | | 5,392 | | | | 8.2 | % | | | 35.1 | % | | | 32.0 | % | | | 23,729 | | | | 8.5 | % | | | 19,536 | | | | 8.0 | % | | | 21.5 | % | | | 21.7 | % |
| Non-controlling interest | | | 213 | | | | 0.3 | % | | | 277 | | | | 0.4 | % | | | -22.9 | % | | | | | | | 820 | | | | 0.3 | % | | | 690 | | | | 0.3 | % | | | 18.8 | % | | | | |
| | | | | | | | | | | | | | | | | | | | | | | | | | | | | | | | | | | | | | | | | | | | | | | | | |
| Adj. EBITDA & CAPEX | | | 2024 | | | | % of Rev. | | | | 2023 | | | | % of Rev. | | | | Δ% Reported | | | | Δ% Comparable (7) | | | | 2024 | | | | % of Rev. | | | | 2023 | | | | % of Rev. | | | | Δ% Reported | | | | Δ% Comparable (7) | |
| Operating income (5) | | | 12,092 | | | | 16.0 | % | | | 9,674 | | | | 14.6 | % | | | 25.0 | % | | | 23.2 | % | | | 40,141 | | | | 14.3 | % | | | 34,180 | | | | 13.9 | % | | | 17.4 | % | | | 17.6 | % |
| Depreciation | | | 3,012 | | | | | | | | 2,632 | | | | | | | | 14.4 | % | | | | | | | 11,142 | | | | | | | | 9,695 | | | | | | | | 14.9 | % | | | | |
| Amortization and other operative non-cash charges | | | 1,000 | | | | | | | | 843 | | | | | | | | 18.6 | % | | | | | | | 4,922 | | | | | | | | 2,542 | | | | | | | | 93.6 | % | | | | |
| Adj. EBITDA (5)(6) | | | 16,104 | | | | 21.3 | % | | | 13,149 | | | | 19.9 | % | | | 22.5 | % | | | 20.7 | % | | | 56,205 | | | | 20.1 | % | | | 46,418 | | | | 18.9 | % | | | 21.1 | % | | | 21.1 | % |
| CAPEX(8) | | | 13,778 | | | | | | | | 9,837 | | | | | | | | 40.1 | % | | | | | | | 29,416 | | | | | | | | 21,396 | | | | | | | | 37.5 | % | | | | |
| (1) | Except volume and average price per unit case figures. |
| (2) | Please refer to page 15 and 16 for revenue breakdown. |
| (3) | Includes equity method in Jugos del Valle and Leão Alimentos, among others. |
| (4) | Includes equity method in PIASA, IEQSA, Beta San Miguel, IMER, and KSP Participacoes, among others. |
| (5) | The operating income and Adjusted EBITDA lines are presented as non-GAAP measures for the convenience of the reader. |
| (6) | Adjusted EBITDA = operating income + depreciation, amortization & other operating non-cash charges. |
| (7) | Please refer to page 10 for our definition of “comparable” and a description of the factors affecting the comparability of our financial and operating performance. |
| (8) | As of December 31, 2024, the investment in fixed assets effectively paid is equivalent to Ps. 25,316 million. |
| Coca-Cola FEMSA Reports 4Q24 Results | Page 12 of 17 | |
| February 21, 2025 | |
MEXICO & CENTRAL AMERICA DIVISION
RESULTS OF OPERATIONS
Millions of Pesos (1)
| | | For the Fourth Quarter of: | | | For the Full Year: | |
| | | 2024 | | | % of Rev. | | | 2023 | | | % of Rev. | | | Δ% Reported | | | Δ% Comparable (6) | | | 2024 | | | % of Rev. | | | 2023 | | | % of Rev. | | | Δ% Reported | | | Δ% Comparable (6) | |
| Transactions (million transactions) | | | 3,091.7 | | | | | | | | 2,981.7 | | | | | | | | 3.7 | % | | | 3.7 | % | | | 12,926.6 | | | | | | | | 12,344.9 | | | | | | | | 4.7 | % | | | 4.7 | % |
| Volume (million unit cases) | | | 589.6 | | | | | | | | 580.9 | | | | | | | | 1.5 | % | | | 1.5 | % | | | 2,494.1 | | | | | | | | 2,394.8 | | | | | | | | 4.1 | % | | | 4.1 | % |
| Average price per unit case | | | 69.66 | | | | | | | | 64.28 | | | | | | | | 8.4 | % | | | | | | | 66.48 | | | | | | | | 62.07 | | | | | | | | 7.1 | % | | | | |
| Net revenues | | | 41,517 | | | | | | | | 37,603 | | | | | | | | | | | | | | | | 166,972 | | | | | | | | 149,320 | | | | | | | | | | | | | |
| Other operating revenues | | | 23 | | | | | | | | 19 | | | | | | | | | | | | | | | | 24 | | | | | | | | 42 | | | | | | | | | | | | | |
| Total Revenues (2) | | | 41,540 | | | | 100.0 | % | | | 37,622 | | | | 100.0 | % | | | 10.4 | % | | | 7.2 | % | | | 166,996 | | | | 100.0 | % | | | 149,362 | | | | 100.0 | % | | | 11.8 | % | | | 10.8 | % |
| Cost of goods sold | | | 21,284 | | | | 51.2 | % | | | 19,200 | | | | 51.0 | % | | | | | | | | | | | 86,214 | | | | 51.6 | % | | | 77,698 | | | | 52.0 | % | | | | | | | | |
| Gross profit | | | 20,255 | | | | 48.8 | % | | | 18,422 | | | | 49.0 | % | | | 10.0 | % | | | 6.7 | % | | | 80,782 | | | | 48.4 | % | | | 71,665 | | | | 48.0 | % | | | 12.7 | % | | | 11.6 | % |
| Operating expenses | | | 13,485 | | | | 32.5 | % | | | 12,663 | | | | 33.7 | % | | | | | | | | | | | 53,810 | | | | 32.2 | % | | | 48,343 | | | | 32.4 | % | | | | | | | | |
| Other operative expenses, net | | | (176 | ) | | | -0.4 | % | | | 150 | | | | 0.0 | % | | | | | | | | | | | 457 | | | | 0.3 | % | | | 281 | | | | 0.2 | % | | | | | | | | |
| Operative equity method (gain) loss in associates (3) | | | (1 | ) | | | 0.0 | % | | | (9 | ) | | | 0.0 | % | | | | | | | | | | | (115 | ) | | | -0.1 | % | | | (130 | ) | | | -0.1 | % | | | | | | | | |
| Operating income (4) | | | 6,947 | | | | 16.7 | % | | | 5,618 | | | | 14.9 | % | | | 23.7 | % | | | 19.0 | % | | | 26,630 | | | | 15.9 | % | | | 23,170 | | | | 15.5 | % | | | 14.9 | % | | | 13.7 | % |
| Depreciation, amortization & other operating non-cash charges | | | 2,584 | | | | 6.2 | % | | | 2,086 | | | | 5.5 | % | | | | | | | | | | | 9,938 | | | | 6.0 | % | | | 7,652 | | | | 5.1 | % | | | | | | | | |
| Adj. EBITDA (4)(5) | | | 9,531 | | | | 22.9 | % | | | 7,704 | | | | 20.5 | % | | | 23.7 | % | | | 19.2 | % | | | 36,568 | | | | 21.9 | % | | | 30,822 | | | | 20.6 | % | | | 18.6 | % | | | 17.4 | % |
| | (1) | Except volume and average price per unit case figures. |
| | (2) | Please refer to page 15 and 16 for revenue breakdown. |
| | (3) | Includes equity method in Jugos del Valle, among others. |
| | (4) | The operating income and Adjusted EBITDA lines are presented as non-GAAP measures for the convenience of the reader. |
| | (5) | Adjusted EBITDA = operating income + depreciation, amortization & other operating non-cash charges. |
| | (6) | Please refer to page 10 for our definition of “comparable” and a description of the factors affecting the comparability of our financial and operating performance. |
SOUTH AMERICA DIVISION
RESULTS OF OPERATIONS
Millions of Pesos (1)
| | | For the Fourth Quarter of: | | | For the Full Year: | |
| | | 2024 | | | % of Rev. | | | 2023 | | | % of Rev. | | | Δ% Reported | | | Δ% Comparable (6) | | | 2024 | | | % of Rev. | | | 2023 | | | % of Rev. | | | Δ% Reported | | | Δ% Comparable (6) | |
| Transactions (million transactions) | | | 3,353.5 | | | | | | | | 3,212.9 | | | | | | | | 4.4 | % | | | 4.4 | % | | | 12,002.6 | | | | | | | | 11,398.3 | | | | | | | | 5.3 | % | | | 5.3 | % |
| Volume (million unit cases) | | | 489.5 | | | | | | | | 475.3 | | | | | | | | 3.0 | % | | | 3.0 | % | | | 1,730.6 | | | | | | | | 1,653.1 | | | | | | | | 4.7 | % | | | 4.7 | % |
| Average price per unit case | | | 64.80 | | | | | | | | 55.32 | | | | | | | | 17.1 | % | | | | | | | 60.98 | | | | | | | | 53.43 | | | | | | | | 14.1 | % | | | | |
| Net revenues | | | 33,785 | | | | | | | | 28,227 | | | | | | | | | | | | | | | | 112,058 | | | | | | | | 94,944 | | | | | | | | | | | | | |
| Other operating revenues | | | 203 | | | | | | | | 229 | | | | | | | | | | | | | | | | 739 | | | | | | | | 782 | | | | | | | | | | | | | |
| Total Revenues (2) | | | 33,988 | | | | 100.0 | % | | | 28,456 | | | | 100.0 | % | | | 19.4 | % | | | 21.0 | % | | | 112,797 | | | | 100.0 | % | | | 95,726 | | | | 100.0 | % | | | 17.8 | % | | | 20.1 | % |
| Cost of goods sold | | | 18,549 | | | | 54.6 | % | | | 16,403 | | | | 57.6 | % | | | | | | | | | | | 64,843 | | | | 57.5 | % | | | 56,531 | | | | 59.1 | % | | | | | | | | |
| Gross profit | | | 15,439 | | | | 45.4 | % | | | 12,054 | | | | 42.4 | % | | | 28.1 | % | | | 29.5 | % | | | 47,954 | | | | 42.5 | % | | | 39,195 | | | | 40.9 | % | | | 22.3 | % | | | 24.4 | % |
| Operating expenses | | | 10,398 | | | | 30.6 | % | | | 7,750 | | | | 27.2 | % | | | | | | | | | | | 34,291 | | | | 30.4 | % | | | 27,755 | | | | 29.0 | % | | | | | | | | |
| Other operative expenses, net | | | (77 | ) | | | -0.2 | % | | | 284 | | | | 1.0 | % | | | | | | | | | | | 231 | | | | 0.2 | % | | | 531 | | | | 0.6 | % | | | | | | | | |
| Operative equity method (gain) loss in associates (3) | | | (27 | ) | | | -0.1 | % | | | (36 | ) | | | -0.1 | % | | | | | | | | | | | (78 | ) | | | -0.1 | % | | | (102 | ) | | | -0.1 | % | | | | | | | | |
| Operating income (4) | | | 5,145 | | | | 15.1 | % | | | 4,056 | | | | 14.3 | % | | | 26.9 | % | | | 29.3 | % | | | 13,511 | | | | 12.0 | % | | | 11,011 | | | | 11.5 | % | | | 22.7 | % | | | 26.0 | % |
| Depreciation, amortization & other operating non-cash charges | | | 1,427 | | | | 4.2 | % | | | 1,389 | | | | 4.9 | % | | | | | | | | | | | 6,127 | | | | 5.4 | % | | | 4,585 | | | | 4.8 | % | | | | | | | | |
| Adj. EBITDA (4)(5) | | | 6,572 | | | | 19.3 | % | | | 5,444 | | | | 19.1 | % | | | 20.7 | % | | | 22.8 | % | | | 19,637 | | | | 17.4 | % | | | 15,596 | | | | 16.3 | % | | | 25.9 | % | | | 28.8 | % |
| | (1) | Except volume and average price per unit case figures. |
| | (2) | Please refer to page 15 and 16 for revenue breakdown. |
| | (3) | Includes equity method in Leão Alimentos, among others. |
| | (4) | The operating income and Adjusted EBITDA lines are presented as non-GAAP measures for the convenience of the reader. |
| | (5) | Adjusted EBITDA = operating income + depreciation, amortization & other operating non-cash charges. |
| | (6) | Please refer to page 10 for our definition of “comparable” and a description of the factors affecting the comparability of our financial and operating performance. |
| Coca-Cola FEMSA Reports 4Q24 Results | Page 13 of 17 | |
| February 21, 2025 | |
CONSOLIDATED BALANCE SHEET
Millions of Pesos
| Assets | | Dec-24 | | | Dec-23 | | | % Var. | |
| Current Assets | | | | | | | | | |
| Cash, cash equivalents and marketable securities | | | 32,779 | | | | 31,060 | | | | 6 | % |
| Total accounts receivable | | | 18,620 | | | | 17,749 | | | | 5 | % |
| Inventories | | | 14,059 | | | | 11,880 | | | | 18 | % |
| Other current assets | | | 9,675 | | | | 7,049 | | | | 37 | % |
| Total current assets | | | 75,132 | | | | 67,738 | | | | 11 | % |
| Non-Current Assets | | | - | | | | - | | | | | |
| Property, plant and equipment | | | 161,785 | | | | 133,406 | | | | 21 | % |
| Accumulated depreciation | | | (62,404 | ) | | | (54,676 | ) | | | 14 | % |
| Total property, plant and equipment, net | | | 99,381 | | | | 78,730 | | | | 26 | % |
| Right of use assets | | | 2,989 | | | | 2,388 | | | | 25 | % |
| Investment in shares | | | 10,233 | | | | 9,246 | | | | 11 | % |
| Intangible assets and other assets | | | 101,876 | | | | 101,162 | | | | 1 | % |
| Other non-current assets | | | 18,375 | | | | 14,256 | | | | 29 | % |
| Total Assets | | | 307,986 | | | | 273,520 | | | | 13 | % |
| Liabilities & Equity | | Dec-24 | | | Dec-23 | | | % Var. | |
| Current Liabilities | | | | | | | | | |
| Short-term bank loans and notes payable | | | 3,314 | | | | 140 | | | | 2267 | % |
| Suppliers | | | 33,773 | | | | 27,351 | | | | 23 | % |
| Short-term leasing Liabilities | | | 889 | | | | 752 | | | | 18 | % |
| Other current liabilities | | | 29,194 | | | | 26,673 | | | | 9 | % |
| Total current liabilities | | | 67,171 | | | | 54,916 | | | | 22 | % |
| Non-Current Liabilities | | | - | | | | - | | | | | |
| Long-term bank loans and notes payable | | | 70,383 | | | | 65,074 | | | | 8 | % |
| Long Term Leasing Liabilities | | | 2,295 | | | | 1,769 | | | | 30 | % |
| Other long-term liabilities | | | 17,595 | | | | 18,056 | | | | -3 | % |
| Total liabilities | | | 157,445 | | | | 139,815 | | | | 13 | % |
| Equity | | | - | | | | - | | | | | |
| Non-controlling interest | | | 7,113 | | | | 6,680 | | | | 6 | % |
| Total controlling interest | | | 143,428 | | | | 127,025 | | | | 13 | % |
| Total equity | | | 150,542 | | | | 133,705 | | | | 13 | % |
| Total Liabilities and Equity | | | 307,986 | | | | 273,520 | | | | 13 | % |
| | | Dec 30, 2024 | |
| Debt Mix | | % Total Debt (1) | | | % Interest Rate
Floating (1) (2) | | | Average
Rate | |
| Currency | | | | | | | | | | | | |
| Mexican Pesos | | | 59.1 | % | | | 3.7 | % | | | 8.7 | % |
| U.S. Dollars | | | 18.3 | % | | | 53.2 | % | | | 4.2 | % |
| Colombian Pesos | | | 2.4 | % | | | 15.5 | % | | | 8.1 | % |
| Brazilian Reals | | | 19.2 | % | | | 18.8 | % | | | 9.8 | % |
| Argentine Pesos | | | 0.9 | % | | | 0.0 | % | | | 50.1 | % |
| Total Debt | | | 100 | % | | | 23.9 | % | | | 8.4 | % |
| (1) | After giving effect to cross- currency swaps. |
| (2) | Calculated by weighting each year's outstanding debt balance mix. |
Debt Maturity Profile
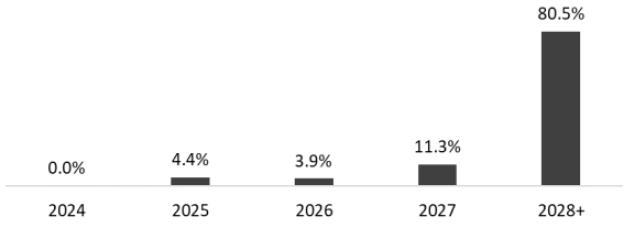
| Financial Ratios | | 4Q 2024 | | | FY 2024 | | | Δ% | |
| Net debt including effect of hedges (1)(3) | | | 38,329 | | | | 37,794 | | | | 1.4 | % |
| Net debt including effect of hedges / Adj. EBITDA (1)(3) | | | 0.68 | | | | 0.81 | | | | | |
| Adj. EBITDA/ Interest expense, net (1) | | | 12.51 | | | | 11.86 | | | | | |
| Capitalization (2) | | | 33.3 | % | | | 32.8 | % | | | | |
| (1) Net debt = total debt - cash |
| (2) Total debt / (total debt + shareholders' equity) |
| (3) After giving effect to cross-currency swaps. |
| Coca-Cola FEMSA Reports 4Q24 Results | Page 14 of 17 | |
| February 21, 2025 | |
COCA-COLA FEMSA
QUARTERLY- VOLUME, TRANSACTIONS & REVENUES
| Volume |
| | | 4Q 2024 | | | 4Q 2023 | | | YoY | |
| | | Sparkling | | | Water (1) | | | Bulk (2) | | | Stills | | | Total | | | Sparkling | | | Water (1) | | | Bulk (2) | | | Stills | | | Total | | | Δ % | |
| Mexico | | | 346.9 | | | | 29.1 | | | | 84.9 | | | | 36.6 | | | | 497.4 | | | | 346.1 | | | | 26.4 | | | | 85.8 | | | | 35.1 | | | | 493.4 | | | | 0.8 | % |
| Guatemala | | | 44.4 | | | | 2.5 | | | | - | | | | 2.3 | | | | 49.2 | | | | 41.3 | | | | 2.1 | | | | - | | | | 2.3 | | | | 45.7 | | | | 7.5 | % |
| CAM South | | | 36.3 | | | | 0.9 | | | | 0.9 | | | | 4.9 | | | | 43.0 | | | | 34.7 | | | | 1.1 | | | | 0.9 | | | | 5.0 | | | | 41.8 | | | | 3.0 | % |
| Mexico and Central America | | | 427.6 | | | | 32.5 | | | | 85.8 | | | | 43.8 | | | | 589.6 | | | | 422.1 | | | | 29.7 | | | | 86.7 | | | | 42.5 | | | | 580.9 | | | | 1.5 | % |
| Colombia | | | 71.4 | | | | 10.0 | | | | 3.7 | | | | 6.6 | | | | 91.6 | | | | 70.9 | | | | 10.2 | | | | 3.5 | | | | 7.4 | | | | 91.9 | | | | -0.3 | % |
| Brazil (3) | | | 274.5 | | | | 24.6 | | | | 2.8 | | | | 27.7 | | | | 329.6 | | | | 266.4 | | | | 22.4 | | | | 3.2 | | | | 26.0 | | | | 318.0 | | | | 3.7 | % |
| Argentina | | | 39.0 | | | | 7.1 | | | | 1.9 | | | | 4.6 | | | | 52.6 | | | | 37.8 | | | | 6.6 | | | | 1.9 | | | | 4.8 | | | | 51.1 | | | | 2.9 | % |
| Uruguay | | | 12.4 | | | | 2.1 | | | | - | | | | 1.1 | | | | 15.7 | | | | 12.0 | | | | 1.7 | | | | - | | | | 0.8 | | | | 14.4 | | | | 8.9 | % |
| South America | | | 397.4 | | | | 43.8 | | | | 8.4 | | | | 40.0 | | | | 489.5 | | | | 387.0 | | | | 40.8 | | | | 8.5 | | | | 39.0 | | | | 475.3 | | | | 3.0 | % |
| TOTAL | | | 824.9 | | | | 76.3 | | | | 94.2 | | | | 83.7 | | | | 1,079.1 | | | | 809.1 | | | | 70.5 | | | | 95.2 | | | | 81.5 | | | | 1,056.2 | | | | 2.2 | % |
| (1) Excludes water presentations larger than 5.0 Lt ; includes flavored water. | | | | | | |
| (2) Bulk Water = Still bottled water in 5.0, 19.0 and 20.0 - liter packaging presentations; includes flavored water | | | | | | |
| Transactions | | | | | | | | | | | | | | | | | | | | | | | | | | | |
| | | 4Q 2024 | | | 4Q 2023 | | | YoY | |
| | | Sparkling | | | Water | | | Stills | | | Total | | | Sparkling | | | Water | | | Stills | | | Total | | | Δ % | |
| Mexico | | | 1,937.0 | | | | 208.6 | | | | 259.2 | | | | 2,404.7 | | | | 1,900.7 | | | | 190.7 | | | | 243.8 | | | | 2,335.2 | | | | 3.0 | % |
| Guatemala | | | 339.1 | | | | 16.3 | | | | 24.9 | | | | 380.3 | | | | 313.4 | | | | 14.8 | | | | 24.0 | | | | 352.2 | | | | 8.0 | % |
| CAM South | | | 248.2 | | | | 10.3 | | | | 48.2 | | | | 306.7 | | | | 231.1 | | | | 11.4 | | | | 51.8 | | | | 294.3 | | | | 4.2 | % |
| Mexico and Central America | | | 2,524.3 | | | | 235.2 | | | | 332.2 | | | | 3,091.7 | | | | 2,445.2 | | | | 216.9 | | | | 319.7 | | | | 2,981.7 | | | | 3.7 | % |
| Colombia | | | 511.0 | | | | 101.4 | | | | 49.4 | | | | 661.7 | | | | 513.5 | | | | 106.6 | | | | 68.2 | | | | 688.2 | | | | -3.9 | % |
| Brazil (3) | | | 1,821.5 | | | | 213.9 | | | | 314.3 | | | | 2,349.8 | | | | 1,705.0 | | | | 191.3 | | | | 292.1 | | | | 2,188.3 | | | | 7.4 | % |
| Argentina | | | 189.1 | | | | 40.9 | | | | 37.0 | | | | 267.0 | | | | 182.6 | | | | 41.0 | | | | 44.5 | | | | 268.1 | | | | -0.4 | % |
| Uruguay | | | 57.7 | | | | 8.3 | | | | 9.1 | | | | 75.1 | | | | 55.0 | | | | 6.6 | | | | 6.5 | | | | 68.2 | | | | 10.1 | % |
| South America | | | 2,579.3 | | | | 364.4 | | | | 409.8 | | | | 3,353.5 | | | | 2,456.1 | | | | 345.5 | | | | 411.2 | | | | 3,212.9 | | | | 4.4 | % |
| TOTAL | | | 5,103.6 | | | | 599.6 | | | | 742.0 | | | | 6,445.3 | | | | 4,901.3 | | | | 562.4 | | | | 730.9 | | | | 6,194.6 | | | | 4.0 | % |
| Revenues | | | | | | | | | |
| | | | | | | | | | |
| Expressed in million Mexican Pesos | | 4Q 2024 | | | 4Q 2023 | | | Δ % | |
| Mexico | | | 33,078 | | | | 30,709 | | | | 7.7 | % |
| Guatemala | | | 4,123 | | | | 3,353 | | | | 23.0 | % |
| CAM South | | | 4,339 | | | | 3,560 | | | | 21.9 | % |
| Mexico and Central America | | | 41,540 | | | | 37,622 | | | | 10.4 | % |
| Colombia | | | 6,145 | | | | 5,094 | | | | 20.6 | % |
| Brazil (4) | | | 22,099 | | | | 20,125 | | | | 9.8 | % |
| Argentina | | | 3,996 | | | | 1,932 | | | | 106.8 | % |
| Uruguay | | | 1,748 | | | | 1,305 | | | | 33.9 | % |
| South America | | | 33,988 | | | | 28,456 | | | | 19.4 | % |
| TOTAL | | | 75,528 | | | | 66,078 | | | | 14.3 | % |
| (3) Volume and transactions in Brazil do not include beer |
| (4) Brazil includes beer revenues of Ps. 1,571.7 million for the fourth quarter of 2024 and Ps. 1,734.2 million for the same period of the previous year. |
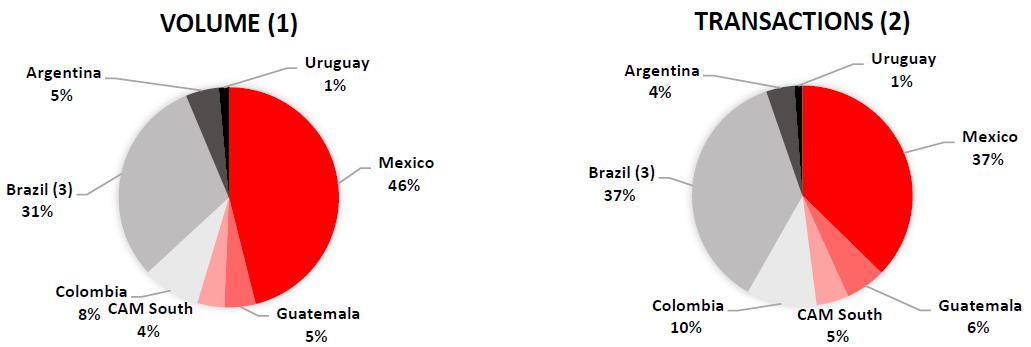
| (1) | Volume is expressed in unit cases. Unit case refers to 192 ounces of finished beverage product (24 eight-ounce servings) and, when applied to soda fountains, refers to the volume of syrup, powders, and concentrate that is required to produce 192 ounces of finished beverage product. |
| (2) | Transactions refers to the number of single units (e.g., a can or a bottle) sold, regardless of their size or volume or whether they are sold individually or in multipacks, except for soda fountains, which represent multiple transactions based on a standard 12 oz. serving. |
| Coca-Cola FEMSA Reports 4Q24 Results | Page 15 of 17 | |
| February 21, 2025 | |
COCA-COLA FEMSA
YTD- VOLUME, TRANSACTIONS & REVENUES
| Volume |
| |
| | | YTD 2024 | | | YTD 2023 | | | YoY | |
| | | Sparkling | | | Water (1) | | | Bulk (2) | | | Stills | | | Total | | | Sparkling | | | Water (1) | | | Bulk (2) | | | Stills | | | Total | | | Δ % | |
| Mexico | | | 1,454.8 | | | | 136.1 | | | | 375.2 | | | | 158.2 | | | | 2,124.3 | | | | 1,408.7 | | | | 121.7 | | | | 376.6 | | | | 145.9 | | | | 2,052.9 | | | | 3.5 | % |
| Guatemala | | | 174.0 | | | | 9.8 | | | | - | | | | 9.0 | | | | 192.8 | | | | 157.6 | | | | 7.7 | | | | - | | | | 8.9 | | | | 174.2 | | | | 10.7 | % |
| CAM South | | | 145.6 | | | | 5.6 | | | | 3.8 | | | | 22.0 | | | | 177.0 | | | | 136.4 | | | | 6.1 | | | | 2.7 | | | | 22.5 | | | | 167.7 | | | | 5.5 | % |
| Mexico and Central America | | | 1,774.3 | | | | 151.5 | | | | 379.0 | | | | 189.3 | | | | 2,494.1 | | | | 1,702.7 | | | | 135.4 | | | | 379.3 | | | | 177.3 | | | | 2,394.8 | | | | 4.1 | % |
| Colombia | | | 267.9 | | | | 40.4 | | | | 15.6 | | | | 28.4 | | | | 352.3 | | | | 264.7 | | | | 39.2 | | | | 14.0 | | | | 29.6 | | | | 347.6 | | | | 1.4 | % |
| Brazil (3) | | | 966.1 | | | | 83.3 | | | | 10.2 | | | | 99.7 | | | | 1,159.3 | | | | 902.4 | | | | 75.2 | | | | 10.2 | | | | 87.4 | | | | 1,075.1 | | | | 7.8 | % |
| Argentina | | | 126.4 | | | | 21.4 | | | | 7.1 | | | | 13.4 | | | | 168.3 | | | | 135.1 | | | | 21.0 | | | | 5.8 | | | | 16.8 | | | | 178.7 | | | | -5.8 | % |
| Uruguay | | | 40.6 | | | | 6.9 | | | | - | | | | 3.2 | | | | 50.7 | | | | 40.6 | | | | 8.7 | | | | - | | | | 2.4 | | | | 51.7 | | | | -1.9 | % |
| South America | | | 1,400.9 | | | | 152.1 | | | | 32.9 | | | | 144.7 | | | | 1,730.6 | | | | 1,342.7 | | | | 144.2 | | | | 30.0 | | | | 136.1 | | | | 1,653.1 | | | | 4.7 | % |
| TOTAL | | | 3,175.3 | | | | 303.5 | | | | 411.9 | | | | 333.9 | | | | 4,224.6 | | | | 3,045.4 | | | | 279.7 | | | | 409.3 | | | | 313.5 | | | | 4,047.8 | | | | 4.4 | % |
| (1) Excludes water presentations larger than 5.0 Lt ; includes flavored water. |
| (2) Bulk Water = Still bottled water in 5.0, 19.0 and 20.0 - liter packaging presentations; includes flavored water |
Transactions
| | | YTD 2024 | | | YTD 2023 | | | YoY | |
| | | Sparkling | | | Water | | | Stills | | | Total | | | Sparkling | | | Water | | | Stills | | | Total | | | Δ % | |
| Mexico | | | 8,071.4 | | | | 948.3 | | | | 1,112.2 | | | | 10,131.9 | | | | 7,835.7 | | | | 866.4 | | | | 1,026.9 | | | | 9,729.0 | | | | 4.1 | % |
| Guatemala | | | 1,299.1 | | | | 65.2 | | | | 95.3 | | | | 1,459.6 | | | | 1,179.8 | | | | 56.9 | | | | 91.9 | | | | 1,328.5 | | | | 9.9 | % |
| CAM South | | | 1,058.5 | | | | 56.0 | | | | 220.6 | | | | 1,335.1 | | | | 996.4 | | | | 53.6 | | | | 237.3 | | | | 1,287.4 | | | | 3.7 | % |
| Mexico and Central America | | | 10,428.9 | | | | 1,069.6 | | | | 1,428.1 | | | | 12,926.6 | | | | 10,011.8 | | | | 976.9 | | | | 1,356.2 | | | | 12,344.9 | | | | 4.7 | % |
| Colombia | | | 1,951.1 | | | | 412.9 | | | | 228.8 | | | | 2,592.8 | | | | 1,942.5 | | | | 411.8 | | | | 302.2 | | | | 2,656.5 | | | | -2.4 | % |
| Brazil (3) | | | 6,428.1 | | | | 725.8 | | | | 1,132.2 | | | | 8,286.2 | | | | 5,887.7 | | | | 655.1 | | | | 981.1 | | | | 7,523.9 | | | | 10.1 | % |
| Argentina | | | 634.6 | | | | 129.4 | | | | 113.4 | | | | 877.4 | | | | 689.8 | | | | 135.2 | | | | 149.3 | | | | 974.4 | | | | -10.0 | % |
| Uruguay | | | 193.3 | | | | 26.9 | | | | 26.1 | | | | 246.2 | | | | 190.7 | | | | 32.6 | | | | 20.3 | | | | 243.6 | | | | 1.1 | % |
| South America | | | 9,207.1 | | | | 1,295.0 | | | | 1,500.5 | | | | 12,002.6 | | | | 8,710.7 | | | | 1,234.7 | | | | 1,452.9 | | | | 11,398.3 | | | | 5.3 | % |
| TOTAL | | | 19,636.0 | | | | 2,364.6 | | | | 2,928.6 | | | | 24,929.2 | | | | 18,722.5 | | | | 2,211.6 | | | | 2,809.1 | | | | 23,743.2 | | | | 5.0 | % |
| Revenues | | | | | | | | | |
| | | | | | | | | | |
| Expressed in million Mexican Pesos | | YTD 2024 | | | YTD 2023 | | | Δ % | |
| Mexico | | | 135,906 | | | | 122,615 | | | | 10.8 | % |
| Guatemala | | | 15,524 | | | | 13,016 | | | | 19.3 | % |
| CAM South | | | 15,566 | | | | 13,731 | | | | 13.4 | % |
| Mexico and Central America | | | 166,996 | | | | 149,362 | | | | 11.8 | % |
| Colombia | | | 20,994 | | | | 17,680 | | | | 18.7 | % |
| Brazil (4) | | | 74,126 | | | | 66,963 | | | | 10.7 | % |
| Argentina | | | 12,557 | | | | 6,668 | | | | 88.3 | % |
| Uruguay | | | 5,119 | | | | 4,415 | | | | 15.9 | % |
| South America | | | 112,797 | | | | 95,726 | | | | 17.8 | % |
| TOTAL | | | 279,793 | | | | 245,088 | | | | 14.2 | % |
| (3) Volume and transactions in Brazil do not include beer |
| (4) Brazil includes beer revenues of Ps. 5,276.1 million for the full year of 2024 and Ps. 6,116.7 million for the same period of the previous year. |
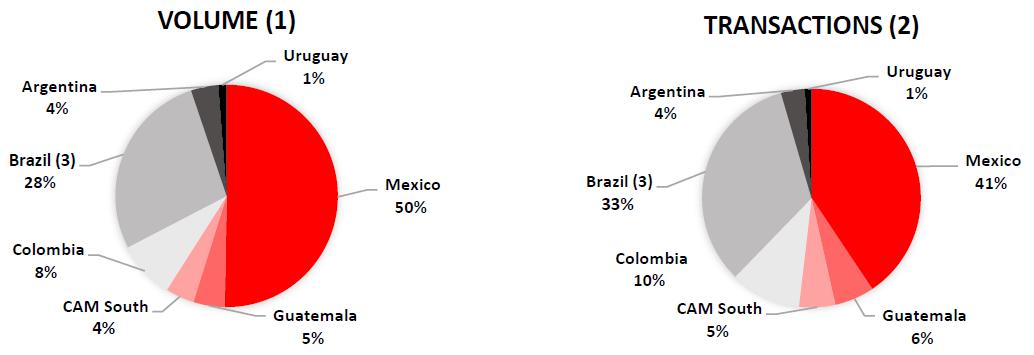
| (1) | Volume is expressed in unit cases. Unit case refers to 192 ounces of finished beverage product (24 eight-ounce servings) and, when applied to soda fountains, refers to the volume of syrup, powders, and concentrate that is required to produce 192 ounces of finished beverage product. |
| (2) | Transactions refers to the number of single units (e.g., a can or a bottle) sold, regardless of their size or volume or whether they are sold individually or in multipacks, except for soda fountains, which represent multiple transactions based on a standard 12 oz. serving. |
| Coca-Cola FEMSA Reports 4Q24 Results | Page 16 of 17 | |
| February 21, 2025 | |
Inflation (1)
| | | | LTM | | | | 4Q24 | | | | YTD | |
| Mexico | | | 4.21 | % | | | 1.32 | % | | | 4.21 | % |
| Colombia | | | 5.20 | % | | | 0.55 | % | | | 5.20 | % |
| Brasil | | | 4.83 | % | | | 1.81 | % | | | 4.83 | % |
| Argentina | | | 117.76 | % | | | 7.87 | % | | | 117.76 | % |
| Costa Rica | | | 0.84 | % | | | 0.47 | % | | | 0.84 | % |
| Panama | | | -0.19 | % | | | -0.55 | % | | | -0.19 | % |
| Guatemala | | | 1.70 | % | | | -0.57 | % | | | 1.70 | % |
| Nicaragua | | | 2.84 | % | | | -0.10 | % | | | 2.84 | % |
| Uruguay | | | 5.49 | % | | | 1.15 | % | | | 5.49 | % |
(1) Source: inflation estimated by the company based on historic publications from the Central Bank of each country.
| Average Exchange Rates for each period (2) | | | | | | | | | |
| | | | | | | | | | |
| | | Quarterly Exchange Rate
(Local Currency per USD) | | | Year to Date Exchange Rate
(Local Currency per USD) | |
| | | | 4Q24 | | | | 4Q23 | | | | Δ% | | | | YTD 24 | | | | YTD 23 | | | | Δ% | |
| México | | | 20.07 | | | | 17.58 | | | | 14.1 | % | | | 18.30 | | | | 17.77 | | | | 3.0 | % |
| Colombia | | | 4,351.70 | | | | 4,071.19 | | | | 6.9 | % | | | 4,074.44 | | | | 4,325.96 | | | | -5.8 | % |
| Brasil | | | 5.84 | | | | 4.95 | | | | 18.0 | % | | | 5.39 | | | | 4.99 | | | | 7.9 | % |
| Argentina | | | 1001.46 | | | | 448.97 | | | | 123.1 | % | | | 916.29 | | | | 296.61 | | | | 208.9 | % |
| Costa Rica | | | 513.80 | | | | 534.44 | | | | -3.9 | % | | | 518.22 | | | | 547.36 | | | | -5.3 | % |
| Panama | | | 1.00 | | | | 1.00 | | | | 0.0 | % | | | 1.00 | | | | 1.00 | | | | 0.0 | % |
| Guatemala | | | 7.72 | | | | 7.83 | | | | -1.5 | % | | | 7.76 | | | | 7.83 | | | | -0.9 | % |
| Nicaragua | | | 36.62 | | | | 36.58 | | | | 0.1 | % | | | 36.62 | | | | 36.44 | | | | 0.5 | % |
| Uruguay | | | 42.67 | | | | 39.53 | | | | 7.9 | % | | | 40.21 | | | | 38.82 | | | | 3.6 | % |
| | | | | | | | | | | | | | | | | | | | | | | | | |
| End-of-period Exchange Rates |
| |
| | | Closing Exchange Rate
(Local Currency per USD) | | | Closing Exchange Rate
(Local Currency per USD) | |
| | | | Dec-24 | | | | Dec-23 | | | | Δ% | | | | Sep-24 | | | | Sep-23 | | | | Δ% | |
| México | | | 20.27 | | | | 16.89 | | | | 20.0 | % | | | 19.63 | | | | 17.62 | | | | 11.4 | % |
| Colombia | | | 4,409.15 | | | | 3,822.05 | | | | 15.4 | % | | | 4,164.21 | | | | 4,053.76 | | | | 2.7 | % |
| Brasil | | | 6.19 | | | | 4.84 | | | | 27.9 | % | | | 5.45 | | | | 5.01 | | | | 8.8 | % |
| Argentina | | | 1,032.00 | | | | 808.45 | | | | 27.7 | % | | | 970.50 | | | | 349.95 | | | | 177.3 | % |
| Costa Rica | | | 512.73 | | | | 526.88 | | | | -2.7 | % | | | 522.87 | | | | 542.35 | | | | -3.6 | % |
| Panama | | | 1.00 | | | | 1.00 | | | | 0.0 | % | | | 1.00 | | | | 1.00 | | | | 0.0 | % |
| Guatemala | | | 7.71 | | | | 7.83 | | | | -1.5 | % | | | 7.72 | | | | 7.86 | | | | -1.7 | % |
| Nicaragua | | | 36.62 | | | | 36.62 | | | | 0.0 | % | | | 36.62 | | | | 36.53 | | | | 0.3 | % |
| Uruguay | | | 44.07 | | | | 39.02 | | | | 12.9 | % | | | 41.64 | | | | 38.56 | | | | 8.0 | % |
(2) Average exchange rate for each period computed with the average exchange rate of each month.
| Coca-Cola FEMSA Reports 4Q24 Results | Page 17 of 17 | |
| February 21, 2025 | |