QuickLinks -- Click here to rapidly navigate through this document
EXHIBIT 2
MANAGEMENT'S DISCUSSION AND ANALYSIS
OF FINANCIAL CONDITION AND RESULTS OF OPERATIONS
The Company's Consolidated Financial Statements have been prepared in accordance with Canadian generally accepted accounting principles ("GAAP"). The information below should be read in conjunction with the Consolidated Financial Statements. Certain figures previously reported have been reclassified to conform to the basis of presentation adopted for the current year. All amounts in this report are in Canadian dollars, unless otherwise stated.
YEAR ENDED SEPTEMBER 29, 2002 COMPARED WITH YEAR ENDED SEPTEMBER 30, 2001
Basis of Comparison
In order to obtain a better understanding of our current year's performance, the Company believes that the basis of comparison for fiscal 2001 should be pro forma results for the prior year before a number of unusual items and other adjustments which totalled $49.5 million net of tax. These unusual items and other adjustments were detailed in the management's discussion and analysis last year and directly affected a number of items in our financial statements including gross margins, selling, general and administration (SG&A) and depreciation and amortization expenses. Accordingly, in our discussion we refer to pro forma comparisons for fiscal 2001, as set out in the table below:
| (000's) | fiscal 2001 Audited | fiscal 2001 Pro Forma | |||||
|---|---|---|---|---|---|---|---|
| Gross Margin | $ | 106,300 | $ | 139,767 | |||
| Gross Margin % | 21.1 | % | 27.5 | % | |||
| SG&A | 76,075 | 53,888 | |||||
| Depreciation & Amortization | 16,209 | 15,430 | |||||
| Net Income | $ | 816 | $ | 50,328 | |||
| Diluted EPS | $ | 0.03 | $ | 1.72 | |||
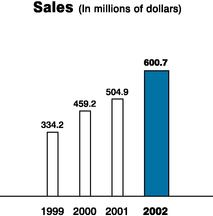
Sales
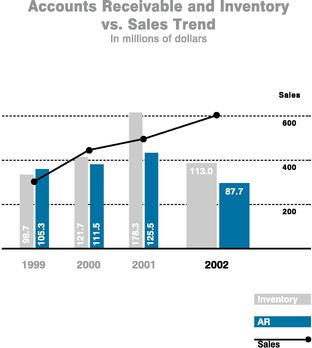
Sales for fiscal 2002 reached $600.7 million, up 19.0% from $504.9 million in fiscal 2001. Unit sales increased by 19.2% over fiscal 2001 to 19.4 million dozens. Gildan has further reinforced its number one market share position in the overall T-shirt category in the United States since the fourth quarter of fiscal 2001.
U.S. industry shipments of T-shirts from distributors to screen-printers increased by 0.4%, sport shirt shipments declined by 9.9% while fleece shipments increased by 0.3% for the first nine months of calendar 2002. The sport shirt category continues to be weak due to the downturn in corporate promotional activity. During the same period, sales of Gildan T-shirts by distributors grew by 16.3% while sales of Gildan sport shirts and fleece products grew by 37.8% and 15.5% respectively. This strong growth of Gildan products is the result of continued market share penetration. The Company has also continued to expand its direct to screen-printer business in fiscal 2002.
64
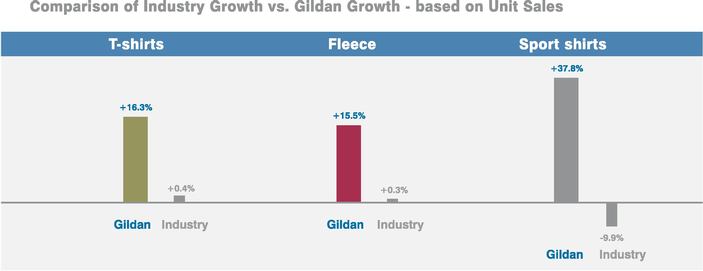
Source for all U.S. market share data: S.T.A.R.S. Report, ACNielsen Market Decisions. All data is for nine months ended September 30, 2002
The Company has continued to expand its European business where it achieved a 37.0% increase in unit volume over the prior year. The Company has maintained its leading market share position in Canada.
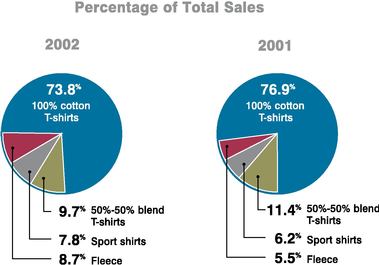
The sport shirt and fleece categories represented 16.5% of total sales in fiscal 2002 compared to 11.7% in fiscal 2001. Favourable product mix offset unit selling price reductions, and resulted in the Company maintaining its overall average selling price.
The Company is pursuing its business plan with a continuing focus on sales growth and projects further market share penetration in all of its target markets. On this basis, the Company expects to have revenues of approximately $660 million in fiscal 2003.
65
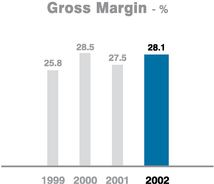
Gross Margin
Gross margins were 28.1% for fiscal 2002 compared to 27.5% last year. The increase in gross margin was due to the impact of lower overall cotton costs, further manufacturing efficiencies and favourable product mix, which more than offset lower selling prices.
The Company's manufacturing plan is focused on continuing to lower its manufacturing costs and to increase capacity to support sales growth. The Company has reduced manufacturing costs in part through vertical integration into yarn-spinning. In fiscal 2001, the Company acquired its first spinning facility in Long Sault, Ontario and has invested in modernizing this facility to increase capacity and reduce costs. In fiscal 2002, the Company acquired its second spinning facility in Montreal. These two facilities will provide the Canadian textile operations virtually all of its commodity yarn requirements by the end of fiscal 2003.
As well, in the fourth quarter of fiscal 2002, the Company successfully commenced operations of a world-class, greenfield integrated knitting, dyeing, bleaching and cutting facility in Rio Nance, Honduras. By the end of fiscal 2002, this facility had an annualized capacity of 5 million dozen T-shirts per year. Production costs currently being achieved are lower than the Company's expectations, and we are confident that this facility will continue to achieve further significant reductions in production costs as capacity is increased.
The Company will also benefit from the reduction of duty costs and lower transportation costs as a result of increasing production at the Rio Nance facility.
Selling, General and Administration
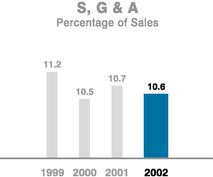
Selling, general and administration expenses were $63.9 million or 10.6% of sales for fiscal 2002 compared to $53.9 million or 10.7% of sales for fiscal 2001. The most significant increase in expenses over the prior year relates to the Company's performance-based incentive program. The Company exceeded its target for return on net assets in the current year, in contrast to fiscal 2001 where targets were not achieved
66
and no bonuses were paid out. The remainder of the increase in expenses over the prior year is the result of higher variable selling and distribution expenses combined with investments in infrastructure required to meet the Company's growth plans.
Depreciation and Interest Expense
Depreciation expense was $17.6 million in fiscal 2002 compared to $15.4 million in fiscal 2001. The increase in depreciation expense reflects the Company's investment in capital expenditures incurred to provide for the long-term sales growth and increased vertical integration.
Interest expense for fiscal 2002 was $13.3 million, slightly lower than in fiscal 2001. The decrease in interest expense was due to reduction in borrowing levels as a result of the Company's success in generating cash flow and working capital during the course of the fiscal year.
Income taxes
The Company's international sales structure implemented in fiscal 1999 results in the income from international sales carrying tax at relatively low levels. The Company's effective tax rate in fiscal 2002 was 9.9% compared to 11.4% in fiscal 2001 before unusual items and other adjustments. The Company expects the effective tax rate to continue to decline in fiscal 2003 as sales continue to grow in our international division and are increasingly sourced from the Honduran textile facility.
Earnings
Net earnings for fiscal 2002 were $66.5 million or $2.26 per diluted share compared to $50.3 million or $1.72 per diluted share in fiscal 2001. The 32.2% increase in earnings is the result of the 19.0% increase in sales at higher margins partially offset by higher selling, general and administration expenses and higher depreciation expense.
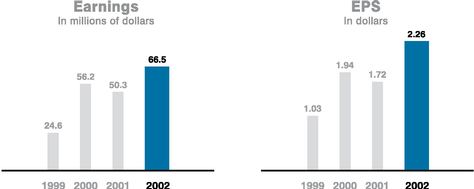
2000 & 1999 — Before debt prepayment charge in each year
The Canadian Institute of Chartered Accountants has issued a new standard for the accounting of stock-based compensation affecting fiscal years commencing on or after January 1, 2002. Accordingly, the Company will adopt this new standard on a prospective basis commencing in fiscal 2003. The Company has
67
calculated the pro-forma impact on earnings for the year ended September 29, 2002 for stock-based awards granted in this fiscal year to be approximately $0.3 million or $0.01 per diluted share.
The Company currently expects its earnings range to be $2.60 to $2.70 per diluted share in fiscal 2003 based on sales of approximately $660 million.
Balance Sheet
Accounts receivable decreased by $37.8 million to $87.7 million at September 29, 2002 compared to $125.5 million at September 30, 2001. The reduction in trade accounts receivable was due to stronger cash collections in the current year, resulting in days' sales outstanding of 44 days at September 29, 2002, compared to 92 days at the end of fiscal 2001. Inventories decreased by $65.4 million to $113.0 million at September 29, 2002, compared to $178.4 million at the end of fiscal 2001. Days of finished goods on hand were 112 days at September 29, 2002 compared to 157 days at September 30, 2001.
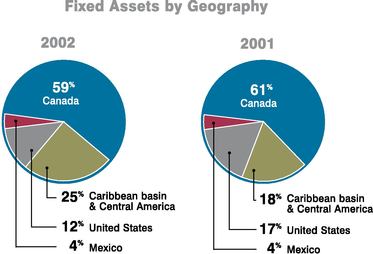
In fiscal 2002, the Company invested $65.8 million in fixed assets net of disposals. These investments have allowed the Company to further vertically integrate our manufacturing process as well as add new low-cost knitting, dyeing, bleaching, cutting and finishing capacity. In the current year, the Company invested in the expansion and modernization of the Long Sault Spinning facility purchased in fiscal 2001. This modernization will be completed in fiscal 2003. The Company also invested in the purchase of a second yarn-spinning facility in Montreal in fiscal 2002 and will complete the modernization of this facility in fiscal 2003. These two facilities will supply virtually all of the commodity yarn required for the Canadian textile operations by the end of fiscal 2003.
The Company also invested in an integrated knitting, dyeing, bleaching and cutting facility in Rio Nance, Honduras. In fiscal 2003, the Company will continue to invest in equipment for this facility to further increase its capacity.
In fiscal 2001, the Company invested $49.1 million in fixed assets, net of disposals, principally for the completion of its U.S. distribution centre, a sewing plant in Mexico, the purchase of the Long Sault, Ontario spinning facility and to begin construction of the textile facility in Rio Nance, Honduras.
Total assets at the end of fiscal 2002 were $496.6 million compared to $476.7 million at the end of fiscal 2001, an increase of 4.2%. Working capital was $188.8 million at September 29, 2002 compared to $208.1 million at September 30, 2001. The current ratio at September 29, 2002 was 3.1:1 compared to 2.9:1 at the end of fiscal 2001.
68
Financing and Cash Resources
Cash flows from operating activities were $178.1 million in fiscal 2002 compared to a use of cash of $12.3 million in fiscal 2001. The significant improvement was the result of higher net earnings combined with the generation of $84.6 million of cash from working capital activities in fiscal 2002, compared to a use of cash of $28.7 million in fiscal 2001. The reduction of working capital was the result of a significant improvement in inventory turnover combined with a reduction in days' sales outstanding. Free cash flow (cash flows from operations less cash used in investing activities) amounted to $110.9 million in fiscal 2002 compared to a use of cash of $61.6 million last year.
At September 29, 2002, none of the Company's revolving facility was utilized. In addition, the Company had cash and cash equivalents of $70.9 million. At September 30, 2001, $35.1 million of the Company's $145.0 million revolving bank facility was being utilized. On July 11, 2002, the Company negotiated a new secured revolving credit facility of $150.0 million with a three-year term, to provide greater flexibility for its future growth.
Management expects that cash flows from its operating earnings, together with its year-end cash balances and its unutilized bank facilities, will be sufficient to meet any foreseeable cash needs for fiscal 2003. The Company expects to continue to generate free cash flow in fiscal 2003.
In the past, the Company has not paid a dividend in order to conserve cash to finance its ongoing growth and expansion. The payment of dividends is reviewed periodically by the Board of Directors.
The Company has obtained approval from the Toronto Stock Exchange to make a normal course issue bid in order to repurchase a maximum of 200,000 Class A Subordinate voting shares. This represents less than 1% of the total Class A shares issued and outstanding at November 30, 2002.
Business Risk
In order to be successful, the Company must continuously be aware of global changes and risks affecting its markets and competitive environment. Risk areas include changes in international trade legislation and taxation, changes in cotton prices and currency fluctuations. However, the Company does not currently foresee any changes that cannot be addressed or that are likely to significantly impair the outlook and subsequently the achievement of the business plan.
International Trade Legislation Risk
The textile and apparel industries in both Canada and the United States have historically received a relatively higher degree of international trade protection than some other industries. However, this protection is diminishing as a result of the implementation of trade agreements reached in the last ten years. The ultimate effect of the changes in quotas, duties and tariffs on our business is uncertain.
69
In 1995, the Agreement on Textiles and Clothing came into effect requiring importing countries, including Canada, the United States and Western Europe, to eliminate quotas on imports of textiles and apparel from exporting countries by 2005. This could result in increased competition from developing countries which historically have lower labour costs than in North America. This agreement only applies to countries that are members of the World Trade Organization. Pursuant to this agreement, none of our products are currently subject to quotas in the United States.
The United States recently enacted the Trade and Development Act of 2000. This legislation provides for duty relief for goods entering the United States which have been sewn in certain Caribbean basin and Sub-Saharan African Nations, provided that such goods are made from fabric that was formed in the United States from yarn which was spun in the United States.
The Company's manufacturing plan is designed to position Gildan to take advantage of international trade liberalization as outlined above.
Taxation Risk
The Company's sales structure results in the income generated from its international sales being subject to relatively low income tax rates. The structure is supported by the legislation under current domestic laws as well as through the application of income tax treaties between various countries in which the Company operates. The Company conducts annual transfer pricing studies to substantiate the transactions between the various related parties within the Company.
It should be noted that any unanticipated changes to either current domestic law in the countries in which the Company operates, or any changes to the income tax treaties the Company currently relies on, may potentially impact the effective tax rate of the Company.
Price of Cotton Risk
The price of cotton has fluctuated substantially over the past several years due to price volatility in the cotton industry. We generally enter into future contracts to cover the price of our anticipated cotton requirements for each fiscal year. Because we enter into these agreements for our cotton requirements, we may not be able to benefit from price decreases which might occur during the given fiscal year. Additionally, in the event that we have not provided for sufficient future contracts, we are not protected against price increases.
Foreign Currency Fluctuations Risk
The Company operates as an international business and its financial results are exposed to the effects of changes in financial markets and economic conditions. The functional and reporting currency is the Canadian dollar. A large proportion of revenues and expenses are denominated in non-Canadian currencies and consequently the Company is subject to the effect of movements in relevant Canadian dollar exchange rates.
The Company enters into forward contracts as it deems appropriate to hedge some or all of its anticipated net currency exposures. Gains and losses resulting from designated hedge contracts are recognized in income in the same period that the hedged exposure is recognized. At September 29, 2002, there were no US dollar hedging arrangements outstanding.
Year ended September 30, 2001 compared with year ended October 1, 2000
Sales for fiscal 2001 increased by 10.0% to $504.9 million, compared with $459.2 million in fiscal 2000, due to further market share penetration in existing markets in Canada and the United States, as well as expansion into Europe. The Company achieved the No. 1 market share position in the 100% cotton T-shirt segment in the United States in the second quarter of fiscal 2001. Gross margins declined from 28.5% in fiscal 2000 to 27.5% in fiscal 2001, primarily due to a decline in average selling prices due to a more competitive environment combined with an unfavourable product mix in the T-shirt category. Selling, general and administrative expenses were $53.9 million or 10.7% of sales in fiscal 2001 compared to $48.3 million or
70
10.5% of sales in fiscal 2000. The increase is the result of higher variable selling and distribution expenses combined with an increase in infrastructure. Net income was $50.3 million or $1.72 per diluted share in fiscal 2001 compared to $56.2 million or $1.94 per share in fiscal 2000, before the debt prepayment charge. The decline in net earnings was due to higher interest and depreciation charges in fiscal 2001.
Forward-Looking Statements
Certain statements included in this management discussion and analysis may constitute "forward-looking statements" within the meaning of the U.S. Private Securities Litigation Reform Act of 1995. We refer you to the Company's filings with the Canadian securities regulatory authorities and the U.S. Securities and Exchange Commission for a discussion of the various factors that may affect the Company's future results.
Readers are cautioned not to place undue reliance on forward-looking statements, as there can be no assurance that the plans, intentions or expectations upon which they are based will occur. By their nature, forward-looking statements involve numerous assumptions, known and unknown risks and uncertainties, both general and specific, that contribute to the possibility that the predictions, forecasts, projections and other forward-looking statements will not occur, which may cause the Company's actual performance and financial results in future periods to differ materially from any estimates or projections of future performance or results expressed or implied by such forward-looking statements.
We believe that the expectations represented by such forward-looking statements are reasonable, there can be no assurance that such expectations will prove to be correct. Furthermore, the forward-looking statements contained in this report are made as of the date of this report, and we do not undertake any obligation to update publicly or to revise any of the included forward-looking statements, whether as a result of new information, future events or otherwise. The forward-looking statements contained in this report are expressly qualified by this cautionary statement.
71
MANAGEMENT'S DISCUSSION AND ANALYSIS OF FINANCIAL CONDITION AND RESULTS OF OPERATIONS