EXHIBIT INDEX
Exhibit No. | Description | |
| 1 | Management's Discussion and Analysis of the Registrant for the year ended October 5, 2003 | |
| 2 | Audited comparative consolidated financial statements of the Registrant as at and for the year ended October 5, 2003 | |
| 3 | Consent of KPMG LLP | |
| 4 | Officers' Certifications Required by Rule 13a-14(a) or Rule 15d-14(a) | |
| 5 | Officers' Certifications Required by Rule 13a-14(b) or Rule 15d- 14(b) and Section 1350 of Chapter 63 of Title 18 of the United States Code | |
EXHIBIT 1
![]()
look to Gildan
for strong results
MD&A - MANAGEMENT DISCUSSION AND ANALYSIS
OF FINANCIAL CONDITION AND RESULTS OF OPERATIONS
The information below should be read in conjunction with the Consolidated Financial Statements and Auditors’ Report included in this Annual Report. The Company’s Consolidated Financial Statements have been prepared in accordance with Canadian generally accepted accounting principles (“GAAP”). The effect of significant differences between Canadian and U.S. GAAP has been disclosed in Note 15 to the consolidated financial statements. All amounts in this report are in Canadian dollars, unless otherwise stated. Gildan’s Audit and Finance Committee and its Board of Directors have reviewed this MD&A to ensure consistency with the approved strategy of the Company.
Gildan is a vertically integrated manufacturer and marketer of premium quality branded basic activewear for sale principally in the wholesale imprinted activewear segment of the Canadian, U.S., European and other international markets.
The Company’s product lines include T-shirts, sport shirts and sweatshirts in both 100% cotton and 50% cotton/50% polyester blends and in a variety of weights, sizes, colours and styles. The Company sells its products as blanks, which are ultimately decorated with designs and logos for sale to consumers.
Gildan is focused on constantly reinforcing its positioning as the most cost-efficient producer of premium quality activewear in the industry.
Year ended October 5, 2003, compared with year ended September 29, 2002
RESULTS OF OPERATIONS
The year ended October 5, 2003 included 53 weeks of operating results instead of the normal 52 weeks. Since the Company has a floating year-end, an extra week is included in its results every sixth year. During fiscal 2003, the extra week was added to the third quarter, which in seasonal terms was the largest quarter of the year.
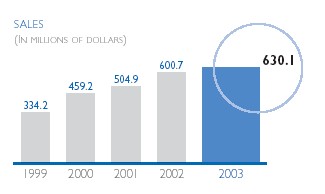
SALES
Sales for fiscal 2003 reached $630.1 million, up 4.9% from $600.7 million during fiscal 2002. Unit sales increased 16.5% during the year from 19.4 to 22.6 million dozen. The increase in unit sales was largely offset by lower average selling prices and the impact of the devaluation of the U.S. dollar.
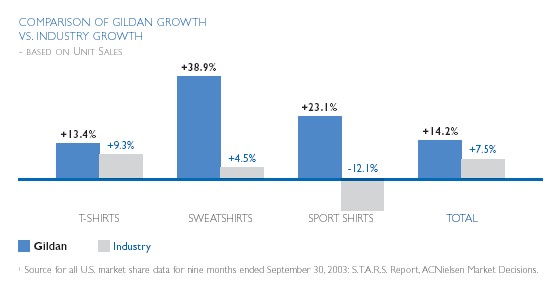
U.S. industry1 unit shipments of T-shirts and sweartshirts from distributors to screen-printers increased by 9.3% and 4.5% respectively for the first nine months of the calendar year, a significant increase from last year’s growth of 0.4% and 0.3% respectively. The sport shirt category, which continues to show weakness due to lower corporate promotional budgets, declined 12.1% for the first nine months of the calendar year.
![]()
Unit sales of Gildan T-shirts by U.S. distributors grew by 13.4%,while sales of Gildan sport shirts and sweatshirts grew 23.1% and 38.9% respectively. This strong growth was due to increased market share penetration. The Company maintained its strong market leadership position in the overall T-shirt category in the United States, with a market share of 28.9%, versus 28.1% a year ago. Gildan continued to achieve significant penetration in the sport shirt and sweatshirt categories, where its market share increased to 19.7% from 14.1% and 13.9% from 10.8% respectively from last year.
During fiscal 2003, Gildan continued to expand its European business with total dollar sales increasing 14.8% with a corresponding increase of 12.1% in unit sales.
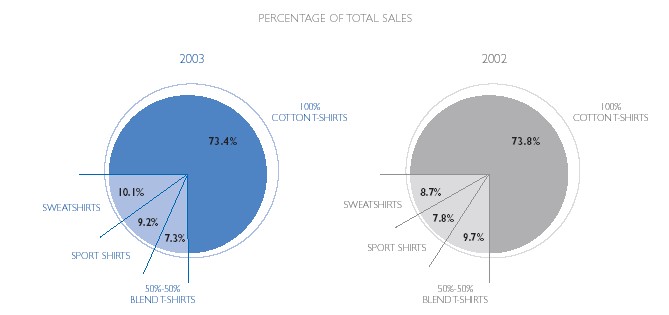
The sport shirt and sweatshirt categories now comprise 19.3% of total sales compared to 16.5% during fiscal 2002. Favourable product mix partially offset unit selling price reductions, which resulted in a decline in the Company’s overall average selling price.
GROSS MARGINS
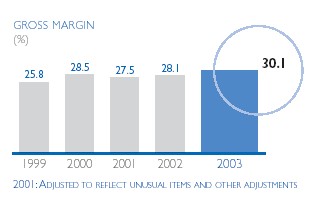
Gross margins for fiscal 2003 were $189.8 million or 30.1% of sales, compared to $168.7 million or 28.1% of sales during fiscal 2002. The increase in gross margin percentage was due to the impact of manufacturing efficiencies generated through recent capital investments, together with lower raw material costs and a more favourable product mix.
These factors were largely offset by lower selling prices as the Company continued to pursue its strategy of driving greater market share by generating manufacturing efficiencies and largely passing on the benefits to customers in the form of reduced selling prices.
During fiscal 2002, the Company successfully commenced operations of a world-class, greenfield integrated knitting, dyeing, bleaching and cutting facility in Rio Nance, Honduras. The annualized capacity of this facility increased from 5 million dozen T-shirts per year at the end of fiscal 2002 to over 10 million dozen at the end of fiscal 2003. It will be further expanded in fiscal 2004 to a total annualized capacity of 16 to 18 million dozen. This facility is expected to satisfy capacity requirements to support projected growth through the end of fiscal 2005.
Manufacturing costs were also reduced in part through vertical integration into yarn spinning. In fiscal 2002, the Company acquired its second yarn-spinning facility in Montreal. Together with the facility in Long Sault, Ontario, which was acquired in fiscal 2001 and subsequently expanded and upgraded with the latest generation of yarn-spinning technology, these facilities provided the Canadian textile operations with virtually all of their commodity yarn requirements during fiscal 2003.
SELLING, GENERAL AND ADMINISTRATIVE EXPENSES
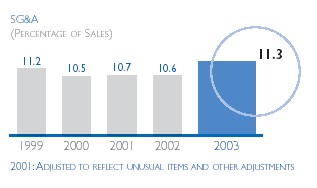
Selling, general and administrative expenses were $71.2 million or 11.3% of sales during fiscal 2003, compared to $63.9 million or 10.6% of sales during fiscal 2002. The most significant increases were related to director and officer insurance premiums, increases in account receivable reserves, consulting fees and travel expenses due to the growth of our offshore operations. The Company expects that for fiscal 2004 selling, general and administrative expenses will be at a similar level as a percentage of sales as fiscal 2003.
DEPRECIATION AND INTEREST EXPENSES
Depreciation and amortization expense was $23.6 million in fiscal 2003, compared to $17.6 million in fiscal 2002. The increase in depreciation expense in fiscal 2003 was the result of our significant investment in our Rio Nance textile facility and yarn spinning facilities in fiscal 2002. These facilities operated during all of fiscal 2003 as compared to only a portion of fiscal 2002.
Interest expense was $9.5 million during fiscal 2003, down significantly from the $13.3 million that was incurred during fiscal 2002. The decrease was the result of overall lower borrowing levels as the Company had generated significant cash flow in the second half of fiscal 2002.
The Company’s international sales structure international sales subject to tax at relatively low levels. The was 9.7% compared to 9.9% in fiscal 2002. The rate decline in fiscal 2003 was not as significant as expected due to the devaluation of the U.S. dollar during the year, which generated an unrealized foreign exchange gain from the revaluation of long-term debt denominated in U.S. dollars within the Company’s Canadian legal entity. Although this gain was fully offset on a pre-tax basis by an exchange loss on conversion of U.S. denominated working capital held by foreign subsidiaries, a higher proportion of overall income taxes were reflected at the higher Canadian tax rate for the year.
The Company expects that the effective tax rate will continue to decline in fiscal 2004 if the value of the U.S. dollar stabilizes, as sales continue to grow in our international division and are increasingly sourced from our Honduras textile facility.
EARNINGS
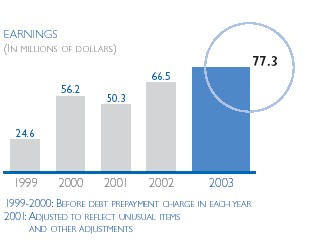
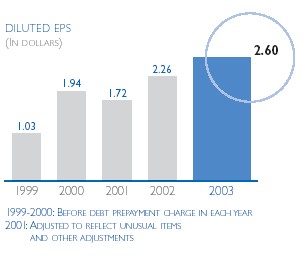
Net earnings for fiscal 2003 were $77.3 million or $2.60 per diluted share, compared to $66.5 million, or $2.26 per diluted share in fiscal 2002, up respectively 16.2% and 15.0%. The increase in net earnings was due to increased unit sales and higher gross margins, reduced interest expense and the inclusion of one extra week in the Company’s results for fiscal 2003. The positive impact of these factors was largely offset by lower selling prices, the negative impact of the weak U.S. dollar and higher depreciation subsequent to the Company’s major capital investment project. In U.S. dollars2, net earnings for fiscal 2003amounted to US$53.2 million, or US$1.79 per diluted share, up respectively 25.5% and 23.4% from fiscal 2002.
During fiscal 2003,the Company adopted the CICA’s new standard for the accounting of stock options on a prospective basis. The Company has calculated the pro-forma impact of the fair value of stock options granted on earnings for the year ended October 5, 2003 to be approximately $0.3 million, or $0.01 per diluted share.
The following table sets forth certain summarized unaudited quarterly financial and other data for the periods presented. The financial data has been derived from unaudited financial statements that, in the opinion of management, reflect all adjustments, consisting only of normal recurring adjustments, necessary for a fair presentation of such quarterly data. The operating results for any quarter are not necessarily indicative of the results to be expected for any future period.
2 The U.S. dollar net earnings and earnings per share are based on the Canadian GAAP results converted at the average exchange rates for the respective periods.
FISCAL 2003
(in millions, except per share data) | 1ST QTR. | 2ND QTR. | 3RD QTR. | 4TH QTR. | ||||||||||
| SALES | $ | 102 | .3 | $ | 173 | .1 | $ | 204 | .0 | $ | 150 | .7 | ||
| UNIT SALES (DOZEN) | 3 | .3 | 6 | .1 | 7 | .4 | 5 | .8 | ||||||
| NET EARNINGS | $ | 5 | .8 | $ | 20 | .4 | $ | 31 | .3 | $ | 19 | .8 | ||
| BASIC EPS | $ | 0 | .20 | $ | 0 | .70 | $ | 1 | .06 | $ | 0 | .67 | ||
| DILUTED EPS | $ | 0 | .20 | $ | 0 | .69 | $ | 1 | .05 | $ | 0 | .66 | ||
WEIGHTED AVERAGE # OF SHARES OUTSTANDING (in thousands) | ||||||||||||||
| - BASIC | 28,945 | 29,160 | 29,373 | 29,478 | ||||||||||
| - DILUTED | 29,600 | 29,715 | 29,768 | 29,808 | ||||||||||
FISCAL 2002
| (in millions, except per share data) | 1ST QTR. | 2ND QTR. | 3RD QTR. | 4TH QTR. | ||||||||||
| SALES | $ | 88 | .4 | $ | 156 | .7 | $ | 195 | .7 | $ | 159 | .9 | ||
| UNIT SALES (DOZEN) | 2 | .7 | 5 | .0 | 6 | .4 | 5 | .3 | ||||||
| NET EARNINGS | $ | 2 | .8 | $ | 16 | .4 | $ | 27 | .7 | $ | 19 | .6 | ||
| BASIC EPS | $ | 0 | .10 | $ | 0 | .58 | $ | 0 | .97 | $ | 0 | .68 | ||
| DILUTED EPS | $ | 0 | .10 | $ | 0 | .56 | $ | 0 | .94 | $ | 0 | .66 | ||
WEIGHTED AVERAGE # OF SHARES OUTSTANDING (in thousands) | ||||||||||||||
| - BASIC | 28,208 | 28,381 | 28,570 | 28,807 | ||||||||||
| - DILUTED | 29,098 | 29,298 | 29,510 | 29,540 | ||||||||||
BALANCE SHEET
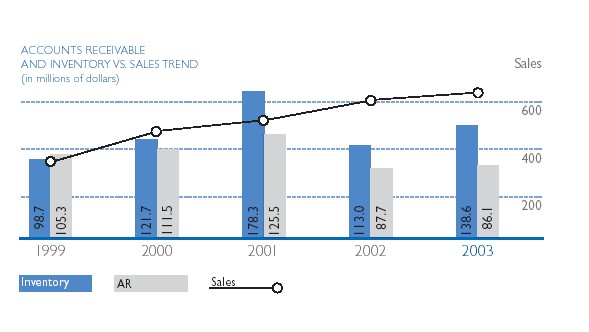
On October 5, 2003, the Company’s accounts receivable were $86.1 million compared to $87.7 million at the end of fiscal 2002. The reduction was due to a decrease in days sales outstanding on net trade receivables from 44 days to 42 days. In U.S. dollars, accounts receivable increased in line with sales growth, but on a Canadian dollar basis this increase was more than offset by the effect of the devaluation of the U.S. dollar. Inventory levels increased by $25.6 million to $138.6 million on October 5, 2003, from $113.0 million at the end of fiscal 2002. The increase was mainly due to an additional 1.1 million dozen of finished goods in ending inventory. This increase in finished goods will be utilized to support expected sales growth. The Company expects to have sufficient inventory and manufacturing capacity to support its projected sales growth for fiscal 2004.
Net capital expenditures for fiscal 2003 were $58.6 million. These investments allowed the Company to add new low-cost knitting, dyeing, bleaching, cutting and finishing capacity. During fiscal 2003, the scope of the Rio Nance textile facility was expanded to increase its maximum production capacity and to allow for a higher proportion of colours. The Company also completed the modernization of both the Long Sault and Montreal spinning facilities, and continued to expand its integrated sewing operations.
During fiscal 2002, the Company invested $65.8 million in fixed assets net of disposals. The Company expanded and modernized the Long Sault spinning facility purchased in fiscal 2001. A second yarn-spinning facility was also purchased in Montreal in fiscal 2002. The Company also began its major investment in its integrated textile facility in Rio Nance, Honduras.
Total assets were $575.4 million on October 5, 2003, compared to $496.6 million at the end of the previous year. Working capital was $207.6 million compared to $188.8 million on September 29, 2002. The current ratio at October 5, 2003 was 2.7:1 compared to 3.1:1 at the end of fiscal 2002.
FINANCING AND CASH RESOURCES
Cash flow from operating activities for the year ended October 5, 2003 was $90.1 million, compared to $178.1 million the previous year. Free cash flow3amounted to $31.5 million in fiscal 2003 compared to $110.9 million in fiscal 2002. The cash flow and free cash flow generated in fiscal 2002 reflected a significant improvement in days sales outstanding and inventory turnover from a high base in 2001. The Company ended fiscal 2003 with cash and cash equivalents of $92.9 million.
Long-term debt on October 5, 2003 amounted to $98.5 million compared to $121.1 million at the end of the previous fiscal year. At the end of both fiscal 2002 and fiscal 2003, none of the Company's $150.0 million revolving bank facility was utilized and the net debt4to total capitalization ratio was 0.02:1 at the end of fiscal 2003 compared to 0.16:1 at the end of fiscal 2002. The Company expects to continue to have a strong capital position in fiscal 2004 and to have excellent liquidity to start repaying its U.S. senior notes in June 2004.
In the past, the Company has not paid a dividend in order to conserve cash to finance its ongoing growth and expansion. The Company has determined that it will continue to conserve its cash in fiscal 2004 but will re-evaluate the merits of introducing a dividend at the end of the fiscal year.
The Company obtained approval from the Toronto Stock Exchange to make a normal course issuer bid in order to repurchase a maximum of 200,000 Class A Subordinate voting shares in the open market commencing December 20, 2002 and ending December 19, 2003.This represents less than 1% of the total Class A shares issued and outstanding. As at October 5, 2003, no shares had been repurchased under this plan. The Company has renewed, subject to regulatory approval, the normal course issuer bid in order to repurchase a maximum of 200,000 Class A Subordinate voting shares during the period from December 22, 2003 to December 21, 2004.
In the normal course of business, the Company enters into contractual obligations that will require it to disburse cash over future periods. The following table sets forth the for the following items as at October 5, 2003:
PAYMENTS DUE BY PERIOD | ||||||
| (in millions) | TOTAL | LESS THAN 1 YEAR | 1 - 3 YEARS | 4 - 5 YEARS | AFTER 5 YEARS | |
| LONG TERM DEBT | $ 96.6 | $ 24.2 | $ 48.3 | $ 24.1 | $ — | |
| CAPITAL LEASE | ||||||
| OBLIGATIONS | 2.0 | 2.0 | — | — | — | |
| OPERATING LEASES | 19.8 | 5.3 | 7.7 | 3.5 | 3.3 | |
| PURCHASE OBLIGATIONS | 141.5 | 141.5 | — | — | — | |
| OTHER LONG TERM | ||||||
| OBLIGATIONS | 2.3 | 2.3 | — | — | — | |
| TOTAL CONTRACTUAL | ||||||
| OBLIGATIONS | $ 262.2 | $ 175.3 | $ 56.0 | $ 27.6 | $ 3.3 | |
Management expects that cash flow from its operating earnings, together with its year-end cash balances and unutilized bank facilities, will be sufficient to meet any foreseeable cash needs for fiscal 2004.
3 Cash flow from operating activities less cash used in investing activities.
4 Total long-term debt less cash and cash equivalents.
![]()
OUTLOOK
The Company has historically measured and presented its financial statements in Canadian dollars in accordance with Canadian GAAP. Effective October 6, 2003, the commencement of fiscal 2004, the Company adopted the U.S. dollar as its functional currency. A significant portion of revenues, expenses, assets and liabilities are denominated in U.S. dollars and the Company’s marketing and manufacturing operations are increasingly international in scope. Effective the same date, the U.S. dollar was adopted as the Company’s reporting currency. The Company will continue to report its results in accordance with Canadian GAAP. Historical financial information in U.S. dollars has been provided in the Investor Relations section of the Company’s Web site, which can be accessed at www.gildan.com.
As a result of adopting the U.S.dollar as its functional currency, both Canadian and U.S. GAAP require all opening assets and liabilities to be translated into U.S. dollars at the exchange rate prevailing at the time of giving effect to the change in functional currency. Using the October 6, 2003 exchange rate, the translated value of opening inventories and fixed assets is approximately US$23 million higher than the amount that would have resulted from the application of exchange rates prevailing at the dates these assets were manufactured or acquired. Accordingly, a one-time currency gain of US$23 million resulting from the upward revaluation of inventories and fixed assets has been reflected directly in the balance sheet as part of a separate component of shareholders’equity. The increase of these opening values will have a corresponding offsetting negative impact on future earnings as these inventories are consumed, and fixed assets are depreciated. The upward revaluation of opening inventori es will result in lower gross margins in the first half of fiscal 2004 only, as they are consumed in cost of sales, with an adverse effect on diluted EPS in the first and second quarters of US$0.06 and US$0.04 respectively. Also, the significant increase in values for opening fixed assets in U.S. dollars will result in higher annual depreciation expense on an ongoing basis. In fiscal 2004, depreciation will be increased by US$1.8 million after tax, or US$0.06 per share. The combined impact of these factors will be to reduce diluted EPS in fiscal 2004 by approximately US$0.16 per share.
The Company is projecting a diluted EPS range of US$2.25 - $2.30 for fiscal 2004, up 25.7% - 28.5% from fiscal 2003, before reflecting the estimated US$0.16 per share impact as a result of revaluing inventories and fixed assets. After taking account of the accounting changes resulting from the transition to U.S. functional currency, the Company expects to report diluted EPS for fiscal 2004 of US$2.10 - $2.15, up 17.3% - 20.1% from fiscal 2003. These projections include the assumption of a 15% increase in unit sales together with a slight increase in selling prices in fiscal 2004 over fiscal 2003, to reflect partial pass-through of higher cotton costs.
Capital expenditures are projected to be approximately US$60 million in fiscal 2004. The major projects include the expansion of the Rio Nance textile facility, the addition of a new sewing facility in Nicaragua and the construction of a new textile facility in the Dominican Republic to be operational in fiscal 2005. Sewing facilities in Haiti and the Dominican Republic are expected to support the new textile production for the Dominican Republic.
The new capacity in the Dominican Republic/Haiti and Honduras/Nicaragua is expected to be utilized primarily to support the Company’s projected continuing sales growth in its existing products and market channels, as well as to rationalize and streamline its overall production capacity. Offshore facilities will focus on high-volume, longer-run product lines and Canadian textile facilities will focus on lower-volume, more specialized product lines. Other incremental growth opportunities include the penetration of new geographical markets and further development of the Company's private label programs for imprinted sportswear brands. The new investments are expected to result in a significant further reduction in manufacturing costs over the next 5 years.
As the Company continues to bring on new capacity subsequent to the first Dominican Republic facility, it believes that the extension of its wholesale brand into retail will represent the most attractive long-term strategy to leverage its existing manufacturing strengths and core competencies, ensure its continuing long-term growth and strategic development, and ultimately create maximum value for its shareholders. The Company’s positioning as the leading brand in the wholesale channel results in a growing consumer awareness of the Company’s product lines and product quality, providing a strong foundation on which to build a recognized consumer brand through the retail channel. Over the next 5 years, the Company plans to manage its initial entry into retail markets in a conservative and gradual manner with its available capacity, and build a solid base from which to drive significant long-term penetration. The Company will r efine its detailed marketing plan for retail during fiscal 2004 and begin to penetrate the retail market for activewear in fiscal 2005.
![]()
CRITICAL ACCOUNTING POLICIES
Several of our accounting policies involve significant judgments and uncertainties. The policies with the greatest potential effect on our results of operations and financial position include the estimate of collectability of accounts receivable and the recovery value of obsolete or overstocked inventory. For accounts receivable,we estimate the net collectability, considering both historical and anticipated trends of trade deductions and returns taken by our customers, allowances we provide to our customers to flow goods through the distributor channel, and the possibility of non-collection due to the financial position of our customers. The Company regularly monitors credit risk exposure of its customers and takes steps to mitigate the risk of loss, including obtaining credit insurance. For inventory, we estimate the amount of goods that we will not be able to sell in the normal course of business and write down the value of these goods to the recovery value expected to be realized. If we incorrectly anticipate these trends or unexpected events occur, our results of operations could be materially affected.
Stock-Based Compensation and Other Stock-Based Payments
Starting fiscal 2004, the Company will adopt the fair value based approach of the Canadian Institute of Chartered Accountants (“CICA”) Handbook Section 3870, “Stock-Based Compensation and Other Stock-Based Payments”. Under the fair value based approach, the fair value at the grant date of stock options is estimated using the Black-Scholes option pricing model and the compensation expense is recognized over the stock option vesting period.
Hedging Relationships
In December 2001, the CICA issued Accounting Guideline 13 (“AcG-13”), “Hedging Relationships”. The guideline establishes requirements for the identification, documentation, designation and effectiveness of hedging relationships, which would have been effective for fiscal years beginning on or after July 1, 2002. During 2002, the implementation date was delayed and is now effective for the Company in fiscal 2004. The Company does not expect AcG-13 to have an initial material impact on its financial statements.
Impairment of Long-Lived Assets
In December 2002, the CICA issued Handbook Section 3063, “Impairment of Long-Lived Assets”. Section 3063 provides accounting guidance for the determination of a long-lived asset impairment as well as recognition, measurement and disclosure of the impairment. This section will be effective for the Company’s 2004 fiscal year. The Company does not expect Section 3063 to have an initial impact on its financial statements.
Asset Retirement Obligations
In March 2003, the CICA issued Handbook Section 3110, “Asset Retirement Obligations”. This section requires that the fair value of an asset retirement obligation be recorded as a liability only when there is a legal obligation associated with a removal activity. This section is effective for the Company's 2004 fiscal year. The Company does not expect this section to have an initial material impact on its financial statements.
FINANCIAL INSTRUMENTS AND OTHER INSTRUMENTS
For a complete discussion of the risks and significant assumptions used in determining the fair value of the Company’s financial instruments, please refer to Note 13 of our consolidated financial statements.
The Company is subject to a variety of business risks. These include changes in international trade and tax legislation, changes in raw material prices, and shifts in consumer demand, as well as currency fluctuations. Some of these risks are described below.
International trade legislation riskThe textile and apparel industries in both Canada and the United States have historically received a relatively higher degree of international trade protection than some other industries. However, this protection is diminishing as a result of the implementation of trade agreements reached during the last ten years. The ultimate effect of the changes in quotas, duties and tariffs on our business is uncertain.
In 1995, theAgreement on Textiles and Clothingcame into effect requiring importing countries including Canada, the United States and Western Europe to eliminate quotas on imports of textiles and apparel from exporting countries by 2005. This could result in increased competition from developing countries, which historically have lower labour costs than in North America. This agreement only applies to countries that are members of the World Trade Organization.The Company feels it is well positioned against such competition because it has developed cost-efficient manufacturing capability by investing in state-of-the-art facilities in Central America and the Caribbean Basin.
The United States enacted theTrade and Development Act of 2000. This legislation provides for duty relief for goods entering the United States which have been sewn in certain Caribbean Basin and Sub-Saharan nations, provided that such goods are made from U.S. formed fabric or regional formed fabric using U.S. spun yarn.
The Company’s manufacturing plan is designed to position Gildan to take advantage of international trade liberalization as outlined above.
Taxation riskThe Company’s sales structure results in the income generated from its international sales being subject to relatively low income tax rates. The structure is supported by current domestic laws in the countries in which the Company operates as well as through the application of income tax treaties between various countries in which the Company operates. The Company conducts annual transfer pricing studies to substantiate the transactions between the various related parties within the Company.
It should be noted that any unanticipated changes to either current domestic laws in the countries in which the Company operates, or any changes to the income tax treaties the Company currently relies on, could impact the effective tax rate of the Company.
Price of materials riskThe price of raw materials, especially cotton, has fluctuated substantially during the past several years due to price volatility in the cotton market. Because we enter into future contracts for our cotton requirements we may not be able to benefit from price decreases but the Company is protected against price increases which might occur during any given fiscal year. Additionally, in the event that we have not provided for sufficient future contracts, we may not be protected against price increases, but would benefit from any price decreases. We have entered into future contracts to cover the price of our anticipated cotton requirements for the 2004 fiscal year, at prices which are well below market levels at the fiscal 2003 year end.
Foreign currency fluctuations riskThe Company operates as an international business and its financial results are exposed to the effects of changes in financial markets and economic conditions. Effective at the beginning of fiscal 2004, the functional and reporting currency is the U.S. dollar. A relatively small proportion of revenues and expenses are denominated in currencies other than the U.S. dollar, including the Canadian dollar, and consequently the Company’s exposure due to the effects of movements in relevant U.S. dollar exchange rates will be minimized.
A detailed discussion on potential business risks is included in the risk factors section of the Annual Information Form filed by the Company with the various Canadian securities commissions and the annual report on Form 40-F filed with the U.S. Securities and Exchange Commission, which are hereby incorporated by reference.
DISCLOSURE OF OUTSTANDING SHARE DATA
As of November 30, 2003 there were 23,427,335 Class A subordinate shares and 6,094,000 Class B multiple voting shares issued and outstanding along with 837,309 options outstanding.
Year ended September 29, 2002, compared with year ended September 30, 2001
BASIS OF COMPARISON
In order to obtain a better understanding of our performance in fiscal 2002, the Company believes that the basis of comparison with fiscal 2001 should reflect a number of unusual items and other adjustments, which totaled $49.5 million net of tax in fiscal 2001. These adjustments were detailed in the management discussion and analysis for fiscal 2001, and directly affected a number of items in our financial statements including gross margins, selling, general and administration, depreciation and amortization expenses. Accordingly, in our discussion we refer to comparisons, which incorporate the following adjustments for fiscal 2001:
FISCAL 2001
| (in thousands, except per share data) | AUDITED | PRO FORMA | ||||||
| GROSS MARGIN | $ | 106,300 | $ | 139,767 | ||||
| GROSS MARGIN % | 21.1 | % | 27.5 | % | ||||
| SG&A | $ | 76,075 | $ | 53,888 | ||||
| DEPRECIATION AND AMORTIZATION | $ | 16,209 | $ | 15,430 | ||||
| NET INCOME | $ | 816 | $ | 50,328 | ||||
| DILUTED EPS | $ | 0.03 | $ | 1.72 | ||||
Sales for fiscal 2002 increased by 19.0%, to $600.7 million, compared with $504.9 million in fiscal 2001, due to further expansion in existing markets in North America and in Europe. During fiscal 2002, the Company continued to maintain its No.1 market share position in the 100% cotton T-shirt segment in the United States that it established in the second quarter of fiscal 2001. Gross margins increased slightly during the period to 28.1% of sales, compared to 27.5% in fiscal 2001, mostly due to the impact of lower cotton prices, increases in manufacturing efficiencies and a favourable product mix which more than offset lower selling prices. Selling, general and administrative expenses remained relatively stable as a percentage of sales, coming in at 10.6% compared to 10.7% in fiscal 2001. Net earnings in fiscal 2002 were $66.5 million, or $2.26 per diluted share, compared to $50.3 million or $1.72 per diluted share in fiscal 2001. The i ncrease was due to the 19.0% growth in sales at higher gross margins, which was partially offset by an increase in depreciation expense.
FORWARD LOOKING STATEMENTS
Certain statements included in this management discussion and analysis may constitute “forward looking statements” within the meaning of theU.S. Private Securities Litigation Reform Actof 1995. We refer you to the Company’s filings with the Canadian securities regulatory authorities and the U.S. Securities Exchange Commission for a discussion of the various factors that may affect the Company's future results.
Readers are cautioned however not to place undue reliance on forward looking statements as there can be no assurance that the plans, intentions or expectations upon which they are based will occur. By their nature, forward looking statements involve numerous assumptions, known and unknown risks and uncertainties, both general and specific, that contribute to the possibility that the predictions, forecasts, projections and other forward looking statements will not occur. This may cause the Company's actual performance and financial results in future periods to differ materially from any estimates or projections of future performance or results expressed or implied by such forward looking statements.
We believe that the expectations represented by such forward looking statements are reasonable, yet there can be no assurance that such expectations will prove to be correct. Furthermore, the forward looking statements contained in this report are made as of the date of this report, and we do not undertake any obligation to update publicly or to revise any of the included forward looking statements, whether as a result of new information, future events or otherwise. The forward looking statements contained in this report are expressly qualified by this cautionary statement.
look to Gildan
for accurate financial reporting
MANAGEMENT'S RESPONSIBILITY FOR FINANCIAL REPORTING
The accompanying consolidated financial statements have been prepared by management and approved by the Board of Directors of the Company. The consolidated financial statements were prepared in accordance with accounting principles generally accepted in Canada and, where appropriate, reflect management’s best estimates and judgements. Management is responsible for the accuracy, integrity and objectivity of the consolidated financial statements within reasonable limits of materiality, and for the consistency of financial data included in the text of the Annual Report with that contained in the consolidated financial statements.
To assist management in the discharge of these responsibilities, the Company maintains a system of internal controls designed to provide reasonable assurance that its assets are safeguarded, that only valid and authorized transactions are executed and that accurate, timely and comprehensive financial information is prepared.
The Company’s Audit and Finance Committee is appointed by the Board of Directors annually and is comprised exclusively of outside, independent directors. The Audit and Finance Committee meets with management as well as with the independent auditors to satisfy itself that management is properly discharging its financial reporting responsibilities and to review the consolidated financial statements and the independent auditors’report. The Audit and Finance Committee reports its findings to the Board of Directors for consideration in approving the consolidated financial statements for presentation to the shareholders. The independent auditors have direct access to the Audit and Finance Committee of the Board of Directors.
The consolidated financial statements have been independently audited by KPMG LLP, Chartered Accountants, on behalf of the shareholders, in accordance with generally accepted auditing standards.Their report outlines the nature of their audit and expresses their opinion on the consolidated financial statements of the Company.

We have audited the consolidated balance sheets of Gildan Activewear Inc. as at October 5, 2003 and September 29, 2002, and the consolidated statements of earnings, retained earnings and cash flows for the years ended October 5, 2003, September 29, 2002 and September 30, 2001.
These financial statements are the responsibility of the Company’s management. Our responsibility is to express an opinion on these financial statements based on our audits.
We conducted our audits in accordance with Canadian generally accepted auditing standards and United States generally accepted auditing standards. Those standards require that we plan and perform an audit to obtain reasonable assurance whether the financial statements are free of material misstatement. An audit includes examining, on a test basis, evidence supporting the amounts and disclosures in the financial statements.
An audit also includes assessing the accounting principles used and significant estimates made by management, as well as evaluating the overall financial statement presentation.
In our opinion, these consolidated financial statements present fairly, in all material respects, the financial position of the Company as at October 5, 2003 and September 29, 2002 and the results of its operations and its cash flows for the years ended October 5, 2003, September 29, 2002 and September 30, 2001 in accordance with Canadian generally accepted accounting principles.
![]()
Chartered Accountants
Montréal, Canada
November24, 2003
EXHIBIT 2
![]()
look to Gildan's
consolidated financial statements
| Consolidated Balance Sheets October 5, 2003, and September 29, 2002 (In Canadian dollars) |
| 2003 | 2002 | |||||
|---|---|---|---|---|---|---|
| ASSETS | ||||||
| CURRENT ASSETS: | ||||||
| Cash and cash equivalents | $ 92,860,064 | $ 70,905,497 | ||||
| Accounts receivable | 86,056,754 | 87,746,113 | ||||
| Inventories | 138,611,100 | 112,970,468 | ||||
| Prepaid expenses and deposits | 5,154,822 | 3,656,987 | ||||
| Future income taxes (note 9) | 6,270,000 | 5,028,000 | ||||
| 328,952,740 | 280,307,065 | |||||
| FIXED ASSETS (NOTE 2) | 241,523,893 | 209,247,348 | ||||
| OTHER ASSETS (NOTE 3) | 4,928,518 | 7,084,926 | ||||
| $575,405,151 | $496,639,339 | |||||
| LIABILITIES AND SHAREHOLDERS' EQUITY | ||||||
| CURRENT LIABILITIES: | ||||||
| Accounts payable and accrued liabilities | $ 90,098,348 | $ 82,167,747 | ||||
| Income taxes payable | 5,234,699 | 3,063,050 | ||||
| Current portion of long-term debt (note 4) | 26,089,454 | 6,249,039 | ||||
| 121,422,501 | 91,479,836 | |||||
| LONG-TERM DEBT (NOTE 4) | 72,420,923 | 114,866,404 | ||||
| FUTURE INCOME TAXES (NOTE 9) | 27,743,000 | 20,385,000 | ||||
| SHAREHOLDERS' EQUITY: | ||||||
| Share capital (note 5) | 111,563,663 | 104,924,975 | ||||
| Contributed surplus | 322,866 | 322,866 | ||||
| Retained earnings | 241,932,198 | 164,660,258 | ||||
| 353,818,727 | 269,908,099 | |||||
| COMMITMENTS AND CONTINGENT LIABILITIES (NOTE 7) | ||||||
| $575,405,151 | $496,639,339 | |||||
See accompanying notes to consolidated financial statements.
![]()
| Consolidated Statement of Earnings Years ended October 5, 2003, September 29, 2002 and September 30, 2001 (In Canadian dollars) |
2003 | 2002 | 2001 | |
| SALES | $630,139,018 | $600,660,380 | $ 504,867,353 |
| COST OF SALES (NOTE 10) | 440,293,451 | 431,996,459 | 398,566,740 |
| GROSS PROFIT | 189,845,567 | 168,663,921 | 106,300,613 |
| SELLING, GENERAL AND ADMINISTRATIVE | |||
| EXPENSES (NOTE 10) | 71,153,448 | 63,926,673 | 76,074,745 |
| EARNINGS BEFORE | |||
| THE UNDERNOTED ITEMS | 118,692,119 | 104,737,248 | 30,225,868 |
| DEPRECIATION | |||
| AND AMORTIZATION (NOTE 10) | 23,614,704 | 17,591,885 | 16,208,560 |
| INTEREST | 9,463,475 | 13,341,823 | 13,628,350 |
| 33,078,179 | 30,933,708 | 29,836,910 | |
| EARNINGS BEFORE INCOME TAXES | 85,613,940 | 73,803,540 | 388,958 |
| INCOME TAXES (RECOVERY) (NOTE 9) | 8,342,000 | 7,312,000 | (427,000) |
| NET EARNINGS | $ 77,271,940 | $ 66,491,540 | $ 815,958 |
| EARNINGS PER SHARE (NOTE 11): | |||
| Basic | $ 2.64 | $ 2.33 | $ 0.03 |
| Diluted | 2.60 | 2.26 | 0.03 |
See accompanying notes to consolidated financial statements.
| Consolidated Statement of Retained Earnings Years ended October 5, 2003, September 29, 2002 and September 30, 2001 (In Canadian dollars) |
| 2003 | 2002 | 2001 | |
| RETAINED EARNINGS, | |||
| BEGINNING OF YEAR | $ 164,660,258 | $ 98,168,718 | $ 97,352,760 |
| NET EARNINGS | 77,271,940 | 66,491,540 | 815,958 |
| RETAINED EARNINGS, END OF YEAR | $ 241,932,198 | $ 164,660,258 | $ 98,168,718 |
See accompanying notes to consolidated financial statements.
![]()
| Consolidated Statement of Cash Flows Years ended October 5, 2003, September 29, 2002 and September 30, 2001 (In Canadian dollars) |
| 2003 | 2002 | 2001 | |||||
| CASH FLOWS FROM OPERATING ACTIVITIES: | |||||||
| Net earnings | $ 77,271,940 | $ 66,491,540 | $ 815,958 | ||||
| Adjustments for: | |||||||
| Depreciation and amortization | 23,614,704 | 17,591,885 | 16,208,560 | ||||
| Future income taxes | 6,116,000 | 5,013,000 | (268,000) | ||||
| Loss on disposal of fixed assets | 321,043 | 949,092 | 7,534 | ||||
| Foreign exchange (gain) loss | (44,279 | ) | 3,443,038 | (416,640) | |||
| Net changes in non-cash working capital balances: | |||||||
| Accounts receivable | (11,222,582 | ) | 38,170,839 | (13,129,676) | |||
| Inventories | (25,640,632 | ) | 65,380,407 | (56,636,049) | |||
| Prepaid expenses and deposits | (1,648,912 | ) | 599,018 | (225,444) | |||
| Accounts payable and accrued liabilities | 19,072,679 | (21,026,308 | ) | 39,545,292 | |||
| Income taxes payable | 2,294,728 | 1,488,272 | 1,755,409 | ||||
| 90,134,689 | 178,100,783 | (12,343,056) | |||||
| CASH FLOWS FROM FINANCING ACTIVITIES: | |||||||
| (Decrease) increase in revolving bank loan | — | (35,083,026 | ) | 35,083,026 | |||
| Repayment of capital leases | (5,007,368 | ) | (5,119,718 | ) | (5,164,290) | ||
| Increase in other long-term debt | 390,422 | 2,974,000 | — | ||||
| Repayment of other long-term debt | (1,411,227 | ) | (6,433,817 | ) | (2,209,780) | ||
| Proceeds from the issuance of shares | 6,638,688 | 4,563,338 | 986,726 | ||||
| Increase in deferred financing charges | (40,521 | ) | (1,086,020 | ) | (405,514) | ||
| 569,994 | (40,185,243) | 28,290,168 | |||||
| CASH FLOWS FROM INVESTING ACTIVITIES: | |||||||
| Purchase of fixed assets, net of disposals | (58,576,710 | ) | (65,764,900 | ) | (49,149,541) | ||
| Decrease (increase) in other assets | 6,178 | (1,395,301 | ) | (133,199) | |||
| (58,570,532) | (67,160,201) | (49,282,740) | |||||
| EFFECT OF EXCHANGE RATE CHANGES | |||||||
| ON CASH AND CASH EQUIVALENTS | (10,179,584 | ) | 150,158 | (156,753) | |||
| NET INCREASE (DECREASE) IN CASH | |||||||
| AND CASH EQUIVALENTS DURING THE YEAR | 21,954,567 | 70,905,497 | (33,492,381) | ||||
| CASH AND CASH EQUIVALENTS, | |||||||
| BEGINNING OF YEAR | 70,905,497 | — | 33,492,381 | ||||
| CASH AND CASH EQUIVALENTS, | |||||||
| END OF YEAR | $ 92,860,064 | $ 70,905,497 | $ — | ||||
| Supplemental disclosure of cash flow information (note 12 (b)) | |||||||
See accompanying notes to consolidated financial statements.
| Notes to Consolidated Financial Statements Years ended October 5, 2003, September 29, 2002 and September 30, 2001 (In Canadian dollars) |
Gildan Activewear Inc. (the “Company”) is incorporated under theCanada Business Corporations Act. Its principal business activity is the manufacture and sale of activewear apparel. The Company’s fiscal year ends on the first Sunday following September 28. All references to 2003, 2002 and 2001 represent the fiscal years ended October 5, 2003, September 29, 2002 and September 30, 2001. Fiscal 2003 includes 53 weeks instead of the normal 52 weeks. The inclusion of an extra week occurs in every sixth fiscal year due to the Company’s floating year-end date. | |
1. |
|
| The consolidated financial statements are expressed in Canadian dollars and have been prepared in accordance with accounting principles generally accepted in Canada. These principles conform, in all material respects, with accounting principles generally accepted in the United States, except as described in note 15. The principal accounting policies of the Company are summarized as follows: | |
(a) Principles of consolidation: | |
| The accompanying consolidated financial statements include the accounts of the Company and its subsidiaries.All significant inter-company balances and transactions have been eliminated on consolidation. | |
(b) Cash and cash equivalents: | |
The Company considers all liquid investments with maturities of three months or less when acquired to be cash equivalents. | |
| (c) Inventories: | |
| Inventories are stated at the lower of cost and market value. Cost is established based on the first-in, first-out method. Market value is defined as replacement cost for raw materials and net realizable value for work in process and finished goods. | |
| (d) Fixed assets: | |
| Fixed assets are recorded at cost. Depreciation and amortization are calculated on a straight-line basis at the following annual rates: |
ASSET | RATE | ||
|---|---|---|---|
| BUILDINGS AND IMPROVEMENTS | 2 1/2% TO 20% | ||
| EQUIPMENT | 6 2/3% TO 25% | ||
| EQUIPMENT UNDER CAPITAL LEASES | 6 2/3% TO 25% | ||
(e) Deferred charges: | |
| The costs of obtaining long-term financing are deferred and amortized on a straight-line basis over the term of the related debt, ranging over a period of 3 to 7 years. Plant start-up costs are deferred and amortized over 2 years. The amortization of these charges is included in depreciation and amortization. | |
| (f) Use of estimates: | |
| The preparation of financial statements in conformity with generally accepted accounting principles requires management to make estimates and assumptions that affect the reported amounts of assets and liabilities and disclosure of contingent assets and liabilities at the date of the financial statements and the reported amounts of revenues and expenses during the reporting period. Actual results could differ from those estimates. |
![]()
1. | SIGNIFICANT ACCOUNTING POLICIES (CONTINUED):
|
(g) Foreign exchange: | |
Monetary assets and liabilities denominated in foreign currencies are translated at the rates of exchange at the balance sheet date. Other balance sheet items denominated in foreign currencies are translated at the rates prevailing at the respective transaction dates. Income and expenses denominated in foreign currencies are translated at average rates prevailing during the year. Gains or losses on foreign exchange are recorded in the consolidated statements of earnings. | |
| The foreign subsidiaries are considered to be integrated foreign operations and their accounts have been translated using the temporal method with translation gains and losses included in the consolidated statements of earnings. | |
| As a result of a significant portion of revenues, expenses and assets and liabilities being denominated in U.S. dollars and the increasing international focus of the Company’s operations, the U.S. dollar will become the currency of measurement and the reporting currency effective October 6, 2003, the commencement of our 2004 fiscal year. | |
(h) Revenue recognition: | |
| Sales are recognized upon shipment of products to customers since title passes upon shipment. At the time of sale,estimates are made based upon existing programs for customer price discounts and rebates. Accruals required for new programs which relate to prior sales are recorded at the time the new program is introduced. | |
(i) Financial instruments: | |
| The Company may periodically use derivative financial instruments, such as forward foreign exchange contracts and cross-currency swap and cross-currency interest rate swap arrangements to manage risks related to fluctuations in exchange rates and interest rates. Derivative financial instruments are not used for trading purposes. Forward foreign exchange contracts are entered into with maturities not exceeding twelve months. | |
| Gains and losses on forward foreign exchange contracts are recognized through income and generally offset transaction losses or gains on the foreign currency cash flows, which they are intended to hedge. Gains and losses on swap arrangements are recognized and charged to income on a basis that corresponds with changes in the related underlying item. | |
(j) Income taxes: | |
| The Company utilizes the asset and liability method for accounting for income taxes which requires the establishment of future tax assets and liabilities, measured at substantively enacted tax rates, for all temporary differences caused when the tax bases of assets and liabilities differ from those reported in the financial statements. Future income tax assets are evaluated, and if realization is not considered to be more likely than not, a valuation allowance is provided. | |
(k) Stock-based compensation plans: | |
| Effective September 30, 2002, the Company adopted prospectively the new recommendations of the Canadian Institute of Chartered Accountants (“CICA”) Handbook Section 3870, with respect to the accounting for stock-based compensation and other stock-based payments. The new recommendations require that all stock-based payments to non-employees, and employee awards that are direct awards of stock, call for settlement in cash or other assets, or are stock appreciation rights that call for settlement by the issuance of equity instruments, granted on or after adoption of the standard be accounted for using the fair value method. The Company presently does not have any such awards which must be accounted for using the fair value method. For all other stock-based employee compensation awards, the new standards permit the Company to continue to follow its existing policy of using the settlement date method of accounting . Under this method, no compensation expense is recognized when such stock-based compensation awards are issued to employees. | |
| The Company has employee share purchase plans and a stock option plan which are described in notes 5 and 6 respectively. No compensation expense is recognized under the stock-based compensation plans. The stock options are granted at an exercise price equal to the market value of the common shares at the date of grant. Any consideration paid by employees on exercise of stock options or purchase of stock is credited to share capital. | |
| If the fair value-based accounting method under Handbook Section 3870 had been used during the year ended October 5, 2003, the net earnings and related earnings per share figures would be as follows. The pro forma disclosure does not consider the effect of awards granted prior to September 30, 2002. As this is the first year of application, comparative disclosures are not provided. | |
![]()
2003 | |
| NET EARNINGS, AS REPORTED | $ 77,271,940 |
| DEDUCT: | |
| Total stock-based employee compensation expense | |
| determined under fair value based method | |
| for all awards | 345,530 |
| PRO FORMA NET EARNINGS | $ 76,926,410 |
| EARNINGS PER SHARE: | |
| Basic: | |
| As reported | $ 2.64 |
| Pro forma | 2.63 |
| Diluted: | |
| As reported | 2.60 |
| Pro forma | 2.59 |
| The weighted average fair value of each option granted is estimated on the date of grant using the Black-Scholes pricing model with the following weighted average assumptions: risk-free interest rate of 3.72%; expected volatility of 36.09%; expected life of 3 years; expected dividend yield of nil. | |
| The weighted average grant-date fair value per share for options granted during the year ended October 5,2003 is $10.65 per share which would be amortized over the vesting period. | |
| (l) Employee future benefits: | |
| The Company offers group defined contribution plans to eligible employees whereby the Company matches employees' contributions upto a fixed percentage of the employee’s salary. Contributions by the Company to trustee-managed investment portfolios are expensed as incurred. The Company does not provide its employees with post-retirement defined benefit pensions, health, insurance and other benefits. | |
| (m) Earnings per share: | |
| Basic earnings per share are computed by dividing net earnings by the weighted average number of common shares outstanding for the year. Diluted earnings per share are computed in the same manner except the weighted average number of common shares outstanding for the period is increased to include additional shares from the assumed exercise of options, if dilutive. | |
| The number of additional shares is calculated by assuming that outstanding options are exercised and that the proceeds from such exercises are used to repurchase common shares at the average share price for the period. | |
| (n) Research and investment tax credits and government grants: | |
| Research and investment tax credits and government grants are recorded as a reduction of the related expense or the cost of the assets acquired. Tax credits are recorded in the accounts when reasonable assurance exists that they will be realized. | |
![]()
2. | FIXED ASSETS: |
| 2003 | ||||||||
| COST | ACCUMULATED DEPRECIATION AND AMORTIZATION | NET BOOK VALUE | ||||||
| LAND | $ | 14,538,682 | $ | — | $ | 14,538,682 | ||
| BUILDINGS AND IMPROVEMENTS | 72,109,477 | 8,171,240 | 63,938,237 | |||||
| EQUIPMENT | 199,903,300 | 49,490,834 | 150,412,466 | |||||
| EQUIPMENT UNDER CAPITAL LEASES | 22,481,310 | 9,846,802 | 12,634,508 | |||||
| $ | 309,032,769 | $ | 67,508,876 | $ | 241,523,893 | |||
| 2002 | ||||||||
| COST | ACCUMULATED DEPRECIATION AND AMORTIZATION | NET BOOK VALUE | ||||||
| LAND | $ | 13,574,563 | $ | — | $ | 13,574,563 | ||
| BUILDINGS AND IMPROVEMENTS | 66,478,802 | 5,869,949 | 60,608,853 | |||||
| EQUIPMENT | 150,127,748 | 33,010,768 | 117,116,980 | |||||
| EQUIPMENT UNDER CAPITAL LEASES | 28,329,528 | 10,382,576 | 17,946,952 | |||||
| $ | 258,510,641 | $ | 49,263,293 | $ | 209,247,348 | |||
3. |
During fiscal 2003, fixed assets were acquired at an aggregate cost of $56,487,356 (2002 - $74,526,963; 2001 - $55,908,925), none of which were acquired by means of capital leases (2002 - $1,024,508; 2001 - $88,928).
FIXED ASSETS: |
| 2003 | 2002 | ||||
LOANS TO DIRECTORS AND OFFICERS (a) | $ | 750,000 | $ | 900,000 | |
| DEFERRED CHARGES, NET OF ACCUMULATED AMORTIZATION | 2,095,442 | 2,722,500 | |||
| PREPAID EQUIPMENT RENTAL | 791,561 | 940,651 | |||
| DEPOSITS | 1,011,389 | 1,157,775 | |||
| CROSS-CURRENCY SWAP (b) | — | 1,164,000 | |||
| OTHER | 280,126 | 200,000 | |||
| $ | 4,928,518 | $ | 7,084,926 | ||
|
(a)The loans to directors and officers are non-interest bearing and the balance is repayable in annual installments of $150,000.
|
4. | LONG-TERM DEBT: |
| 2003 | 2002 | ||||
| SECURED: | |||||
| Senior notes (US$70,000,000) | $ | 93,744,00 | $ | 110,271,000 | |
| Obligations under capital leases, bearing interest | |||||
| at rates varying from 5.21% to 16.08%, maturing | |||||
| at various dates through 2005 | 1,970,941 | 7,026,062 | |||
| Term loan, bearing interest at 7.58%, | |||||
| maturing during 2004 | 34,517 | 687,951 | |||
| 95,749,458 | 117,985,013 | ||||
| Current portion of secured debt | 25,375,054 | 5,570,277 | |||
| $ | 70,374,404 | $ | 112,414,736 | ||
| UNSECURED: | |||||
| Term loans, bearing interest at rates up to 6% | |||||
| per annum, maturing at various dates through 2008 | $ | 2,760,919 | $ | 3,130,430 | |
| Current portion of unsecured debt | 714,400 | 678,762 | |||
$ | 2,046,519 | 2,451,668 | |||
| Total unsecured and secured long-term debt | $ | 72,420,92 | $ | 114,866,404 | |
|
The senior notes are repayable in four equal annual instalments commencing in June 2004, bear interest at 9.51% on US$55,000,000 and 9.88% on US$15,000,000 and are secured by tangible and intangible property of the Company. The foreign currency risk associated with the senior notes was initially fully hedged through the use of a cross-currency rate swap arrangemen under which interest the Company had fixed repayments on the senior notes. All quarterly interest payments relating to this debt were also converted to Canadian dollars for the term. During fiscal 2001, the Company cancelled US$55 million of the cross-currency interest rate swap arrangement. A gain of approximately $1.6 million realized on the cancellation of the swap arrangement is being deferred and amortized over the term of the senior notes. As at October 5, 2003, approximately $700,000 (2002 - $1.0 million) of the gain remains deferred on the consolidated balance sheets in accounts payable and accrued liabilities. The combined effective interest rate on the senior notes for fiscal 2002 - 9.43%) 2003 was 9.42% (excluding the effect of the amortization of the gain realized on the cancellation of the swap. The Company has a revolving term credit facility for a maximum of $150,000,000 which matures in July 2006. The facility is secured by a first ranking moveable hypothec and security interest on the majority of the Company's accounts receivable, inventories, intangible assets, equipment and tangible moveable assets. There was no balance outstanding under this facility at October 5, 2003 and September 29, 2002. Under various financing arrangements with its bankers and other long-term lenders, the Company is required to meet certain covenants. The Company was in compliance with all of these covenants as at October 5, 2003 and September 29, 2002. Principal payments due on long-term debt, other than obligations under capital leases, are as follows: |
Fiscal year | |||
| 2004 | $ | 24,184,917 | |
| 2005 | 24,130,852 | ||
| 2006 | 24,151,326 | ||
| 2007 | 23,972,254 | ||
| 2008 | 100,087 | ||
| $ | 96,539,436 | ||
4. | LONG-TERM DEBT (CONTINUED): |
| Fiscal year | ||
| 2004 | $ 1,950,372 | |
| 2005 | 66,952 | |
| TOTAL MINIMUM LEASE PAYMENTS | 2,017,324 | |
| LESS IMPUTED INTEREST | 46,383 | |
| $ 1,970,941 | ||
5. | SHARE CAPITAL: |
| 2003 | 2002 | |||||||||
| SHARES | BOOK VALUE | SHARES | BOOK VALUE | |||||||
| AUTHORIZED WITHOUT LIMIT AS TO | ||||||||||
| NUMBER AND WITHOUT PAR VALUE: | ||||||||||
| First preferred shares, issuable in series, | ||||||||||
| non-voting | ||||||||||
| Second preferred shares, issuable | ||||||||||
| in series, non-voting | ||||||||||
| Class A subordinate voting shares, | ||||||||||
| participating, one vote per share | ||||||||||
| Class B multiple voting shares, | ||||||||||
| participating, eight votes per share | ||||||||||
| ISSUED AND OUTSTANDING: | ||||||||||
| Class A subordinate voting shares: | ||||||||||
| Total outstanding,beginning of year | 22,826,964 | $ 99,841,579 | 22,095,460 | $ 95,278,241 | ||||||
| Shares issued under employee | ||||||||||
| share purchase plan | 5,361 | 173,689 | 8,096 | 181,721 | ||||||
| Shares issued pursuant to exercise | ||||||||||
| of stock options | 593,641 | 6,464,999 | 723,408 | 4,381,617 | ||||||
| Total outstanding,end of year | 23,425,966 | 106,480,267 | 22,826,964 | 99,841,579 | ||||||
| Class B multiple voting shares | 6,094,000 | 5,083,396 | 6,094,000 | 5,083,396 | ||||||
| 29,519,966 | $ 111,563,663 | 28,920,964 | $ 104,924,975 | |||||||
(a) | The Company has employee share purchase plans which allow eligible employees to authorize payroll deductions of up to 10% of their salary to purchase, from treasury, Class A subordinate voting shares of the Company at a price of 90% of the then current stock price as defined in the plans. Employees purchasing shares under the plans must hold the shares for a minimum of one year. The Company has reserved 700,000 Class A subordinate voting shares for issuance under the plans. |
(b) | On December 5, 2002, the Board of Directors approved a stock repurchase program authorizing the Company to purchase up to 200,000 of the Company's Class A subordinate voting shares in the open market commencing December 19, 2003. As at October 5, 2003, no shares had been repurchased under this plan. |
6. | STOCK OPTION PLAN: |
| NUMBER | WEIGHTED AVERAGE EXERCISE PRICE | |||||
| OPTIONS OUTSTANDING, SEPTEMBER 30, 2001 | 2,093,644 | $ 13 | .45 | |||
| GRANTED | 163,552 | 19 | .68 | |||
| EXERCISED | (723,408 | ) | 6 | .06 | ||
| CANCELLED | (104,834 | ) | 11 | .24 | ||
| OPTIONS OUTSTANDING, SEPTEMBER 29, 2002 | 1,428,954 | 18 | .07 | |||
| GRANTED | 121,206 | 37 | .05 | |||
| EXERCISED | (593,641 | ) | 10 | .89 | ||
| CANCELLED | (116,333 | ) | 21 | .01 | ||
| OPTIONS OUTSTANDING, OCTOBER 5,2003 | 840,186 | $ 25 | .47 | |||
The following table summarizes information about stock options outstanding and exercisable at October 5, 2003:
| OPTIONS OUTSTANDING | OPTIONS EXERCISABLE | ||||||||||
| RANGE OF EXERCISE PRICES | NUMBER | WEIGHTED AVERAGE EXERCISE PRICE | WEIGHTED REMAINING AVERAGE CONTRACTUAL LIFE (YRS) | NUMBER | WEIGHTED AVERAGE EXERCISE PRICE | ||||||
| $ 5.15 - $ 9.75 | 82,194 | $ 7.03 | 5.17 | 82,194 | $ 7.03 | ||||||
| $14.38 - $19.70 | 87,033 | 15.83 | 6.85 | 18,667 | 14.38 | ||||||
| $20.00 - $25.68 | 346,620 | 24.48 | 7.25 | 84,011 | 24.87 | ||||||
| $27.00 - $34.58 | 204,539 | 31.82 | 7.45 | 40,333 | 34.58 | ||||||
| $34.80 - $40.89 | 119,800 | 37.18 | 9.24 | — | — | ||||||
| 840,186 | $ 25.47 | 7.34 | 225,205 | $ 19.22 | |||||||
![]()
7. | COMMENTS AND CONTINGENT LIABILITIES : |
| Fiscal year | |||
| 2004 | $ 5,347,000 | ||
| 2005 | 4,392,000 | ||
| 2006 | 3,310,000 | ||
| 2007 | 2,005,000 | ||
| 2008 | 1,468,000 | ||
| THEREAFTER | 3,257,000 | ||
| $ 19,779,000 | |||
(b)As at October 5, 2003, there were contractual obligations outstanding of approximately $3,127,000 for the acquisition of fixed assets (2002 — $10,388,000). |
(c)The Company is a party to claims and litigation arising in the normal course of operations. The Company does not expect the resolution of these matters to have a materially adverse effect on the financial position or results of operations of the Company. |
8. | GUARANTEES: |
| In February 2003, the CICA issued Accounting Guideline 14, Disclosure of Guarantees (“AcG-14”) which clarifies disclosure requirements for certain guarantees. | |
| In the normal course of business, the Company enters into various agreements that may contain features that meet the AcG-14 definition of a guarantee. AcG-14 defines a guarantee to be a contract (including an indemnity) that contingently requires the Company to make payments to a third party based on (i) changes in an underlying that is related to an asset, a liability or an equity of the guaranteed party or (ii) failure of another party to perform under an obligating agreement. | |
| Significant guarantees that have been provided to third parties are the following: | |
| The Company, including certain of its subsidiaries, have granted irrevocable standby letters of credit and surety bonds, issued by highly rated financial institutions, to third parties to indemnify them in the event the Company does not perform its contractual obligations. As at October 5, 2003, the maximum potential liability under these guarantees was $12.6 million, of which $11.2 million was surety bonds and $1.4 million was for standby letters of credit. | |
| As at October 5, 2003, the Company has not recorded a liability with respect to these guarantees, as the Company does not expect to make any payments in excess of what is recorded on the Company’s financial statements for the aforementioned items. The standby letters of credit mature at various dates during 2004, and the surety bonds are automatically renewed on an annual basis. | |
9. | INCOME TAXES: |
| The income tax provision differs from the amount computed by applying the combined Canadian federal and provincial tax rates to earnings before income taxes. The reasons for the difference and the related tax effects are as follows: | |
| 2003 | 2002 | 2001 | |||||||||
| COMBINED BASIC CANADIAN FEDERAL | |||||||||||
| AND PROVINCIAL INCOME TAXES | $ | 28,252,000 | $ | 25,979,000 | $ | 149,000 | |||||
| INCREASE (DECREASE) IN INCOME TAXES | |||||||||||
| RESULTING FROM: | |||||||||||
| Manufacturing and processing credit | (160,000 | ) | (195,000 | ) | 821,000 | ||||||
| Effect of different tax rates on | |||||||||||
| earnings of foreign subsidiaries | (22,239,000 | ) | (22,639,000 | ) | (4,861,000 | ) | |||||
| Effect of non-deductible expenses | |||||||||||
| and other | 2,489,000 | 4,167,000 | 3,464,000 | ||||||||
| $ | 8,342,000 | $ | 7,312,000 | $ | (427,000 | ) | |||||
![]()
|
| 2003 | 2002 | 2001 | |||||
| CURRENT INCOME TAXES | $ | 2,226,000 | $ | 2,299,000 | $ | (159,000) | |
| FUTURE INCOME TAXES | 6,116,000 | 5,013,000 | (268,000) | ||||
| $ | 8,342,000 | $ | 7,312,000 | $ | (427,000) | ||
Future income taxes reflect the net effects of temporary differences between the carrying amounts of assets and liabilities for financial reporting purposes and the amounts used for income tax purposes. Significant components of the Company's future tax position are as follows::
|
| 2003 | 2002 | ||||
| FUTURE INCOME TAX ASSETS: | |||||
| Non-capital losses | $ | 2,125,000 | $ | — | |
| Inventory | 2,105,000 | 2,427,000 | |||
| Reserves and accruals | 1,236,000 | 1,189,000 | |||
| Share issue costs and other | 804,000 | 1,412,000 | |||
| 6,270,000 | 5,028,000 | ||||
| FUTURE INCOME TAX LIABILITIES: | |||||
| Fixed assets and other | 27,743,000 | 20,385,000 | |||
| NET FUTURE INCOME TAX LIABILITY | $ | 21,473,000 | $ | 15,357,000 | |
| |
10. | UNUSUAL ITEMS: The following unusual costs were incurred in fiscal 2001 and are included in the consolidated statements of earnings: |
| 2001 | ||
| CHARGED TO: | ||
| COST OF SALES: | ||
| Cotton contract loss (a) | $14,308,667 | |
| Restructuring costs (b) | 3,582,617 | |
| $17,891,284 | ||
| SELLING, GENERAL AND ADMINISTRATION: | ||
| Abandoned acquisition related costs (c) | $15,014,936 | |
| Restructuring costs (b) | 2,996,000 | |
| $18,010,936 | ||
| DEPRECIATION AND AMORTIZATION: | ||
| Restructuring costs (b) | $ 779,470 | |
| TOTAL | $36,681,690 | |
![]()
10. | UNUSUAL ITEMS (CONTINUED): |
(a) | The Company recorded a provision for losses which were expected to arise from commitments for the future purchase of raw materials at substantially higher than the then current market prices. |
(b) | The Company relocated its distribution centre and closed various manufacturing facilities in order to consolidate them into other lower cost operations. The costs incurred consisted mainly of lease costs, severance payments and the write-off of deferred start-up costs. As at October 5, 2003, the remaining provision, amounting to $1.2 million (2002 - $2.0 million), relates to future obligations under leased premises and is included in accounts payable and accrued liabilities on the consolidated balance sheets. |
(c) | The Company incurred direct costs related to a proposed business acquisition which was not completed. Accordingly, the costs were expensed in the year. In addition, an action was filed by the target company against the Company, alleging possession and use of confidential information by a former employee of the plaintiff who was in the employ of the Company. In October 2001, the Company and plaintiff agreed to an amicable out-of-court settlement of all outstanding issues in this matter. The litigation settlement and legal costs incurred by the Company to defend the lawsuit were charged to income in fiscal 2001. |
11. | EARNINGS PER SHARE: |
| A reconciliation between basic and diluted earnings per share is as follows: |
| 2003 | 2002 | 2001 | ||||||
| BASIC EARNINGS PER SHARE: | ||||||||
| Basic weighted average number | ||||||||
| of common shares outstanding | 29,241,646 | 28,491,495 | 28,145,989 | |||||
| Basic earnings per share | $ | 2.64 | $ | 2.33 | $ | 0.03 | ||
| DILUTED EARNINGS PER SHARE: | ||||||||
| Basic weighted average number | ||||||||
| of common shares outstanding | 29,241,646 | 28,491,495 | 28,145,989 | |||||
| Plus impact of stock options | 484,043 | 870,060 | 1,080,384 | |||||
| Diluted common shares | 29,725,689 | 29,361,555 | 29,226,373 | |||||
| Diluted earnings per share | $ | 2.60 | $ | 2.26 | $ | 0.03 | ||
All options outstanding for fiscal 2003 were dilutive. Excluded from the above calculation for 2002 and 2001 are 144,800 and 645,120 stock options ranging in prices from $34.58 to $35.12 and from $20.00 to $34.58 respectively, which were deemed to be antidilutive because the exercise prices were greater than the average market price of the common shares. |
12. | OTHER INFORMATION: |
(a) | The following items were included in the determination of the Company's net earnings: |
| 2003 | 2002 | 2001 | |||||
| DEPRECIATION EXPENSE | |||||||
| OF FIXED ASSETS | $ | 22,599,039 | $ | 15,297,250 | $ | 13,265,489 | |
| INTEREST EXPENSE ON LONG-TERM DEBT | 9,952,881 | 13,439,948 | 13,720,931 | ||||
| FOREIGN EXCHANGE GAIN (LOSS) | 1,647,795 | (968,633) | (1,906,216 | ) | |||
| DEFINED CONTRIBUTION PLAN EXPENSE | 552,430 | 368,682 | 160,795 | ||||
| AMORTIZATION EXPENSE OF DEFERRED | |||||||
| CHARGES AND OTHER | 1,015,665 | 2,294,635 | 2,943,071 | ||||
![]()
(b) | Supplemental cash flow disclosure: |
| 2003 | 2002 | 2001 | ||||
| CASH PAID DURING THE YEAR FOR: | ||||||
| Interest | $ | 9,499,215 | $ | 13,587,113 | $ | 13,172,660 |
| Income taxes | 1,548,967 | 795,141 | 1,196,166 | |||
| NON-CASH TRANSACTIONS: | ||||||
| Acquisition of fixed assets through | ||||||
| the assumption of debt | ||||||
| and settlement of amounts | ||||||
| due to the Company | — | — | 6,800,000 | |||
| Additions to fixed assets included | ||||||
| in accounts payable | ||||||
| and accrued liabilities | 3,145,138 | 6,470,616 | 1,337,900 | |||
| CASH AND CASH EQUIVALENTS | ||||||
| CONSIST OF: | ||||||
| Cash balances with banks | $ | 67,860,064 | $ | 45,700,697 | $ | — |
| Short-term investments | 25,000,000 | 25,204,800 | — | |||
| $ | 92,860,064 | $ | 70,905,497 | $ | — | |
13. | FINANCIAL INSTRUMENTS : |
| (a) Foreign currency risk management: | |
A substantial portion of the Company's sales are denominated in US a natural. The Company used the revenue stream in US dollars as a natural hedge against purchases of fixed assets and expenses denominated in US dollars. From time to time, the Company also uses forward foreign exchange contracts and cross-currency swap arrangements to hedge its foreign exchange exposure on cash flows related to payables, accounts receivable and cash in US dollars, pounds sterling and Euros. In addition, the Company uses a cross-currency interest rate swap to hedge a portion of its foreign currency denominated long-term debt against fluctuations in exchange rates. | |
| The following table summarizes the Company's commitments to buy and sell foreign currencies as at October 5, 2003 and September 29, 2002: | |
| NOTIONAL AMOUNT | EXCHANGE RATE | MATURITY | NOTIONAL CANADIAN EQUIVALENT | ||
| 2003: | |||||
| SELL CONTRACTS: | |||||
| Foreign exchange contracts: | Euro/US$ | 601,000 | 1.4366 | October 2003 | $ 863,397(1) |
| Euro/US$ | 969,000 | 1.4356 | November 2003 | 1,391,096 | |
| 2002: | |||||
| BUY CONTRACTS | |||||
| Foreign exchange contracts: | Euro/CA$ | 2,185,000 | 1.5460 | October 2002 | $3,378,000 |
(1) Exchange rate as at October 5, 2003 was used to translate amounts in foreign currencies.
| A forward foreign exchange contract represents an obligation to buy or sell a foreign currency and a swap agreement represents an obligation to exchange principal and/or interest amounts with a counterparty. Credit risk exists in event of failure the by a counterparty to meet its obligations. The Company reduces this risk by dealing only with highly rated counterparties, normally major North American financial institutions. |
![]()
13. | FINANCIAL INSTRUMENTS (CONTINUED): |
| (b) Credit risk: | |
The Company's financial instruments that are exposed to concentrations of credit risk consist primarily of cash equivalents and trade receivables. | |
| (c) Fair value disclosure: | |
Fair value estimates are made as of a specific point in time, using available information about the financial instrument. These estimates are subjective in nature and often cannot be determined with precision. The Company has determined that the carrying value of its short-term financial assets and liabilities approximates fair values as at the balance sheet dates because of the short-term maturity of those instruments. The fair value of long-term debt is $111,931,196 (2002 — $123,862,362) compared to a carrying value of $98,510,377 (2002 — $121,115,443) as at October 5, 2003. The fair value of the cross-currency interest rate swap at October 5, 2003 was $(1,670,369) (2002 — $3,010,092) and the carrying value was $(2,377,500) (2002 — $1,164,000). The fair value of loans to directors and officers is not significantly different from its carrying value. The method of calculating fair values for the financial instruments is described below. The fair value of the Company’s long-term debt bearing interest at fixed rates was calculated using the present value of future payments of principal and interest discounted at the current market rates of interest available to the Company for the same or similar debt instruments with the same remaining maturities. For long-term debt bearing interest at variable rates, the fair value is considered to approximate the carrying value. The fair value of the swap was determined based on market rates prevailing at the balance sheet date obtained from the Company's financial institution and represented the estimated amount that the Company would receive (pay) to settle the contract at the balance sheet date. | |
(d)Interest rate risk: | |
| The Company's exposure to interest rate fluctuations is with respect to the use of its bank facility which bears interest at floating rates. | |
14. | SEGMENTED INFORMATION: |
| The Company manufactures and sells activewear apparel. The Company operates in one business segment. | |
| (a) Major customers and revenues by geographic areas: | |
| (I) Percentages related to individual customers accounting for greater than 10% of total sales are as follows: | |
2003 | 2002 | 2001 | ||
| COMPANY A | 13.9% | 14.8% | 14.9% | |
| COMPANY B | 13.6% | 10.7% | 10.7% | |
During September 2003, Company A acquired Company B.
![]()
(II) Sales were derived from customers located in the following geographic areas: | |
| 2003 | 2002 | 2001 | ||||||
| INTERNATIONAL | $ | 571,247,485 | $ | 537,472,747 | $ | 442,099,830 | ||
| CANADA | 58,891,533 | 63,187,633 | 62,767,523 | |||||
| $ | 630,139,018 | $ | 600,660,380 | $ | 504,867,353 | |||
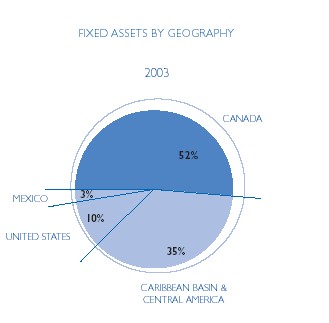
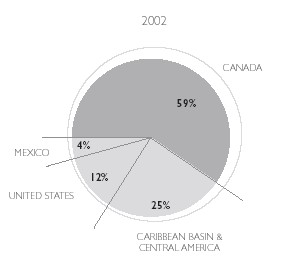
| (b) Fixed assets by geographic areas are as follows: | |
| 2003 | 2002 | |||||
| CANADA | $ | 124,875,897 | $ | 123,723,507 | ||
| CARIBBEAN BASIN AND CENTRAL AMERICA | 83,702,553 | 52,983,181 | ||||
| UNITED STATES | 24,818,880 | 24,832,233 | ||||
| MEXICO | 8,126,563 | 7,708,427 | ||||
| $ | 241,523,893 | $ | 209,247,348 | |||
15. | CANADIAN AND UNITED STATES ACCOUNTING DIFFERENCES: |
The consolidated financial statements of the Company are expressed in Canadian dollars and are prepared in accordance with Canadian generally accepted accounting principles (“GAAP”), which conform, in all material respects, with those generally accepted in the United States, except as described below: | |
| (a) Consolidated statements of earnings: | |
| 2003 | 2002 | 2001 | ||||||
| NET EARNINGS IN ACCORDANCE WITH | ||||||||
| CANADIAN GAAP | $ 77,271,940 | $ 66,491,540 | $ 815,958 | |||||
| SWAP (EXPENSE) REVENUE (I) | (1,461,000 | ) | 416,000 | 2,448,000 | ||||
| START-UP COSTS (II) | 183,750 | 221,252 | 693,187 | |||||
| STOCK-BASED COMPENSATION (III) | (752,000 | ) | — | — | ||||
| TAX EFFECT OF ABOVE ADJUSTMENTS | 366,000 | (262,000 | ) | (779,000 | ) | |||
| NET EARNINGS IN ACCORDANCE | ||||||||
| WITH UNITED STATES GAAP | $ 75,608,690 | $ 66,866,792 | $ 3,178,145 | |||||
| EARNINGS PER SHARE UNDER | ||||||||
| UNITED STATES GAAP: | ||||||||
| Basic | $ 2.59 | $ 2.35 | $ 0.11 | |||||
| Diluted | 2.54 | 2.28 | 0.11 | |||||
| WEIGHTED AVERAGE NUMBER | ||||||||
| OF COMMON SHARES OUTSTANDING | ||||||||
| UNDER UNITED STATES GAAP: | ||||||||
| Basic | 29,241,646 | 28,491,495 | 28,145,989 | |||||
| Diluted | 29,725,689 | 29,361,555 | 29,226,373 | |||||
![]()
15. | CANADIAN AND UNITED STATES ACCOUNTING DIFFERENCES (CONTINUED): | |
| (a) Consolidated statements of earnings (continued): | ||
| (I) Swap revenue: | ||
| Under United States GAAP, SFAS No. 133 “Accounting for Derivative Instruments and Hedging Activities” requires that all derivative instruments be recognized as assets or liabilities and be measured at fair value. For fiscal 2001, a gain of $2,448,000 was recorded in income which included a transition adjustment gain of $1,137,000 arising from the adoption of the recommendations effective October 1, 2000, recognition of a gain realized at the cancellation of a cross-currency interest rate swap during the year, and an unrealized gain based on the fair value of a cross-currency interest rate swap over its carrying value as at September 30, 2001. | ||
For fiscal 2003, a net loss of $1,461,000 (2002 — gain of $416,000) has been included in income representing the recognition of an unrealized loss of $1,139,000 (2002 — gain of $738,000) based on the fair value of the cross-currency interest rate swap over its carrying value as at October 5, 2003 and the reversal of the amortization of $322,000 (2002 — $322,000) under Canadian GAAP of the gain realized at the cancellation of a cross-currency interest rate swap which was recognized in income for United States GAAP purposes in prior years. | ||
| Under Canadian GAAP, there is no requirement to record derivative instruments used for hedging purposes at fair values. Further, the gain realized on cancellation of the cross-currency interest rate swap arrangement is deferred and amortized over the term of the related debt. | ||
| (II) Start-up costs: | ||
Costs incurred during the start-up period for new manufacturing and distribution facilities are deferred and amortized on a straight-line basis over two years. United States GAAP requires such costs to be expensed as incurred. The adjustment to net earnings in accordance with United States GAAP includes the write-off of current year’s start-up costs and the reversal of the amortization of start-up costs deferred under Canadian GAAP. | ||
| (III) Stock-based compensation: | ||
| United States GAAP requires the measurement and recognition of compensation expense related to certain stock-based compensation. As permitted by the provisions of SFAS No. 123, the Company has measured compensation cost using the intrinsic value method being the excess of the quoted market price of the Company’s stock at the grant date over the amount the employee must pay for the stock. Accordingly, as no excess exists at the grant date, no compensation expense is recognized for stock option awards. However, certain of the Company’s stock options are considered as variable under United States GAAP because a modification to accelerate the vesting period was made during fiscal 2003. As a result, compensation cost is measured on the effective date of the modification | ||
| Under Canadian GAAP, the Company uses the settlement date method of accounting for options and compensation expense is not recognized. | ||
| (b) Consolidated statements of cash flows: | ||
| 2003 | 2002 | 2001 | ||||||||||
| CASH AND CASH EQUIVALENTS, | ||||||||||||
| UNITED STATES GAAP, BEGINNING OF YEAR | $ | 70,905,497 | $ | — | $ | 33,492,381 | ||||||
| CHANGES DUE TO UNITED STATES GAAP: | ||||||||||||
| Operating activities on a Canadian basis | 90,134,689 | 178,100,783 | (12,343,056 | ) | ||||||||
| Start-up costs | 183,750 | 221,252 | 693,187 | |||||||||
| Operating activities cash flow, | ||||||||||||
| United States GAAP | 90,318,439 | 178,322,035 | (11,649,869 | ) | ||||||||
| Investing activities on a Canadian basis | (58,570,532 | ) | (67,160,201 | ) | (49,282,740 | ) | ||||||
| Start-up costs | (183,750 | ) | (221,252 | ) | (693,187 | ) | ||||||
| Investing activities cash flow, | ||||||||||||
| United States GAAP | (58,754,282 | ) | (67,381,453 | ) | (49,975,927 | ) | ||||||
| Financing activities on a Canadian basis | ||||||||||||
| and under United States GAAP | 569,994 | (40,185,243 | ) | 28,290,168 | ||||||||
| EFFECT OF EXCHANGE RATE CHANGES | ||||||||||||
| ON CASH AND CASH EQUIVALENTS | (10,179,584 | ) | 150,158 | (156,753 | ) | |||||||
| CASH AND CASH EQUIVALENTS, | ||||||||||||
| UNITED STATES GAAP, END OF YEAR | $ | 92,860,064 | $ | 70,905,497 | $ | — | ||||||
![]()
| (c) Consolidated balance sheets: | ||
Differences between Canadian and United States GAAP are not material in the presentation of the assets, liabilities and shareholders' equity. However, the following differences should be noted: | ||
| 2003 | 2002 | ||||
| OTHER ASSETS UNDER CANADIAN GAAP | $ 4,928,518 | $ 7,084,926 | |||
| START-UP COSTS | (552,940 | ) | (736,690 | ) | |
| CROSS-CURRENCY SWAP | — | 1,846,000 | |||
| OTHER ASSETS UNDER UNITED STATES GAAP | $ 4,375,578 | $ 8,194,236 | |||
| ACCOUNTS PAYABLE AND ACCRUED LIABILITIES | |||||
| UNDER CANADIAN GAAP | $ 90,098,348 | $ 82,167,747 | |||
| CROSS-CURRENCY SWAP | (707,000 | ) | — | ||
| REVERSAL OF DEFERRED GAIN | |||||
| ON CROSS-CURRENCY SWAP | (696,000 | ) | (1,018,000 | ) | |
| ACCOUNTS PAYABLE AND ACCRUED LIABILITIES | |||||
| UNDER UNITED STATES GAAP | $ 88,695,348 | $ 81,149,747 | |||
| FUTURE INCOME TAX LIABILITIES UNDER | |||||
| CANADIAN GAAP | $ 27,743,000 | $ 20,385,000 | |||
| FUTURE TAXES RELATED TO GAAP | |||||
| ADJUSTMENTS | 385,000 | 751,000 | |||
| FUTURE INCOME TAX LIABILITIES UNDER | |||||
| UNITED STATES GAAP | $ 28,128,000 | $ 21,136,000 | |||
| SHAREHOLDERS' EQUITY UNDER | |||||
| CANADIAN GAAP | $ 353,818,727 | $ 269,908,099 | |||
| UNITED STATES GAAP CUMULATIVE | |||||
| NET EARNINGS ADJUSTMENTS | 465,060 | 1,376,310 | |||
| SHAREHOLDERS' EQUITY UNDER UNITED | |||||
| STATES GAAP | $ 354,283,787 | $ 271,284,409 | |||
|
(d) Comprehensive income: | |
Under United States GAAP, SFAS No.130, “Reporting Comprehensive Income” establishes standards for reporting and presentation of comprehensive income and its components in a full set of financial statements. Comprehensive income consists of net income and all other changes in shareholders’equity that do not result from transactions with shareholders. These changes include cumulative foreign currency translation adjustments. The Statement requires only additional disclosures in the consolidated financial statements; it does not affect the Company's financial position or results of operations. | ||
Since there are no elements within the consolidated financial statements which would be classified as comprehensive income, a separate financial statement of comprehensive income is not required. | ||
| Comprehensive income is the same as net income under US GAAP. | ||
![]()
15. | CANADIAN AND UNITED STATES ACCOUNTING DIFFERENCES (CONTINUED): | |
| (e) Supplementary information: | ||
| Under United States GAAP and SEC rules, separate disclosure is required for the following statement of earnings and balance sheet items. There is no similar requirement under Canadian GAAP. | ||
| 2003 | 2002 | 2001 | |||||
| STATEMENTS OF EARNINGS: | |||||||
| Rental expenses | $ | 1,893,000 | $ | 1,917,000 | $ | 2,905,000 | |
| Advertising expenses | 7,423,000 | 8,189,000 | 7,762,000 | ||||
| BALANCE SHEETS: | |||||||
| Accounts payable | 47,400,325 | 41,223,580 | 25,337,000 | ||||
| Accrued liabilities | 41,295,023 | 39,926,167 | 71,522,000 | ||||
| Allowance for doubtful accounts, | |||||||
| price discounts and rebates | 28,946,000 | 26,956,000 | 13,597,000 | ||||
| COMPARATIVE FIGURES : | |
| Certain comparative figures have been reclassified in order to conform with the current year's presentation. | ||
![]()
look to Gildan's
long-term stock price appreciation
NYSE: GIL
TSX: GIL.A
Shares outstanding at October 5, 2003: 29,519,966
| OPEN 09/30/02 | YEAR HIGH | YEAR LOW | CLOSE 10/05/03 | YEAR VOLUME | |
| NYSE (USD) | $ 20.75 | $ 30.79 | $ 19.12 | $ 28.40 | 5,308,700 |
| TSX | $ 32.80 | $ 42.50 | $ 30.00 | $ 38.11 | 16,622,080 |
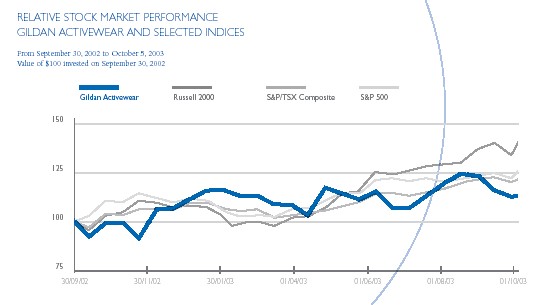
EXHIBIT 3
THE BOARD OF DIRECTORS
GILDAN ACTIVEWEAR INC.
We hereby consent to the use in the Annual Report of Gildan Activewear Inc. on Form 40-F (the “Annual Report”), dated February 20, 2004, of our Auditors’ Report dated November 24, 2003 relating to the consolidated financial statements of Gildan Activewear Inc. as at October 5, 2003 and September 29, 2002 and the consolidated statements of earnings, retained earnings and cash flows for the years ended October 5, 2003, September 29, 2002 and September 30, 2001.
/s/ KPMG LLP
Chartered Accountants
February 20, 2004
Montreal, Canada

EXHIBIT 4
CERTIFICATION
REQUIRED BY RULE 13a-14(a)
OR RULE 15d-14(a)
I, H. Greg Chamandy, Chairman of the Board and Co-Chief Executive Officer of Gildan Activewear Inc., certify that:
| 1. | I have reviewed this annual report on Form 40-F of Gildan Activewear Inc.; | |
| 2. | Based on my knowledge, this report does not contain any untrue statement of a material fact or omit to state a material fact necessary to make the statements made, in light of the circumstances under which such statements were made, not misleading with respect to the period covered by this report; |
| 3. | Based on my knowledge, the financial statements, and other financial information included in this report, fairly present in all material respects the financial condition, results of operations and cash flows of the issuer as of, and for, the periods presented in this report; |
| 4. | The issuer’s other certifying officer and I are responsible for establishing and maintaining disclosure controls and procedures (as defined in Exchange Act Rules 13a-15(e) and 15d-15(e)) for the issuer and have: |
| (a) | Designed such disclosure controls and procedures, or caused such disclosure controls and procedures to be designed under our supervision, to ensure that material information relating to the issuer, including its consolidated subsidiaries, is made known to us by others within those entities, particularly during the period in which this report is being prepared; |
| (b) | Evaluated the effectiveness of the issuer’s disclosure controls and procedures and presented in this report our conclusions about the effectiveness of the disclosure controls and procedures, as of the end of the period covered by this report based on such evaluation; and |
| (c) | Disclosed in this report any change in the issuer’s internal control over financial reporting that occurred during the period covered by the annual report that has materially affected, or is reasonably likely to materially affect, the issuer’s internal control over financial reporting; and |
| 5. | The issuer’s other certifying officer and I have disclosed, based on our most recent evaluation of internal control over financial reporting, to the issuer’s auditors and the audit and finance committee of the issuer’s board of directors (or persons performing the equivalent functions): |
| (a) | All significant deficiencies and material weaknesses in the design or operation of internal control over financial reporting which are reasonably likely to adversely affect the issuer’s ability to record, process, summarize and report financial information; and |
| (b) | Any fraud, whether or not material, that involves management or other employees who have a significant role in the issuer’s internal control over financial reporting. |
Date: February 20, 2004
| /s/ H. Greg Chamandy |
| Name: H. Greg Chamandy |
| Title: Chairman of the Board and Co-Chief Executive Officer |
CERTIFICATION
REQUIRED BY RULE 13a-14(a)
OR RULE 15d-14(a)
I, Laurence G. Sellyn, Executive Vice-President, Finance and Chief Financial Officer of Gildan Activewear Inc., certify that:
| 1. | I have reviewed this annual report on Form 40-F of Gildan Activewear Inc.; |
| 2. | Based on my knowledge, this report does not contain any untrue statement of a material fact or omit to state a material fact necessary to make the statements made, in light of the circumstances under which such statements were made, not misleading with respect to the period covered by this report; |
| 3. | Based on my knowledge, the financial statements, and other financial information included in this report, fairly present in all material respects the financial condition, results of operations and cash flows of the issuer as of, and for, the periods presented in this report; |
| 4. | The issuer’s other certifying officer and I are responsible for establishing and maintaining disclosure controls and procedures (as defined in Exchange Act Rules 13a-15(e) and 15d-15(e)) for the issuer and have: |
| (a) | Designed such disclosure controls and procedures, or caused such disclosure controls and procedures to be designed under our supervision, to ensure that material information relating to the issuer, including its consolidated subsidiaries, is made known to us by others within those entities, particularly during the period in which this report is being prepared; |
| (b) | Evaluated the effectiveness of the issuer’s disclosure controls and procedures and presented in this report our conclusions about the effectiveness of the disclosure controls and procedures, as of the end of the period covered by this report based on such evaluation; and |
| (c) | Disclosed in this report any change in the issuer’s internal control over financial reporting that occurred during the period covered by the annual report that has materially affected, or is reasonably likely to materially affect, the issuer’s internal control over financial reporting; and |
| 5. | The issuer’s other certifying officer and I have disclosed, based on our most recent evaluation of internal control over financial reporting, to the issuer’s auditors and the audit and finance committee of the issuer’s board of directors (or persons performing the equivalent functions): |
| (a) | All significant deficiencies and material weaknesses in the design or operation of internal control over financial reporting which are reasonably likely to adversely affect the issuer’s ability to record, process, summarize and report financial information; and |
| (b) | Any fraud, whether or not material, that involves management or other employees who have a significant role in the issuer’s internal control over financial reporting. |
Date: February 20, 2004
| /s/ Laurence G. Sellyn | |
| Name: | Laurence G. Sellyn |
| Title: | Executive Vice-Presient, Finance and Chief |
| Financial Officer | |
EXHIBIT 5
CERTIFICATION
REQUIRED BY RULE 13a-14(b) OR RULE 15d-14(b) AND
SECTION 1350 OF CHAPTER 63 OF TITLE 18
OF THE UNITED STATES CODE
Gildan Activewear Inc. (the “Corporation”) is filing its annual report on Form 40-F for the fiscal year ended October 5, 2003 (the “Report”) with the United States Securities and Exchange Commission.
I, H. Greg Chamandy, Chairman of the Board and Co-Chief Executive Officer of the Corporation, certify, pursuant to 18 U.S.C. section 1350, as enacted pursuant to section 906 of the Sarbanes-Oxley Act of 2002, that:
| 1. | The Report fully complies with the requirements of Section 13(a) or 15(d) of the Securities Exchange Act of 1934; and |
| 2. | The information contained in the Report fairly presents, in all material respects, the financial condition and results of operations of the Corporation. |
Date: February 20, 2004
| /s/ H. Greg Chamandy |
| Name: H. Greg Chamandy |
| Title: Chairman of the Board and Co-Chief Executive Officer |
CERTIFICATION
REQUIRED BY RULE 13a-14(b) OR RULE 15d-14(b) AND
SECTION 1350 OF CHAPTER 63 OF TITLE 18
OF THE UNITED STATES CODE
Gildan Activewear Inc. (the “Corporation”) is filing its annual report on Form 40-F for the fiscal year ended October 5, 2003 (the “Report”) with the United States Securities and Exchange Commission.
I, Laurence G. Sellyn, Executive Vice-President, Finance and Chief Financial Officer of the Corporation, certify, pursuant to 18 U.S.C. section 1350, as enacted pursuant to section 906 of the Sarbanes-Oxley Act of 2002, that:
| 1. | The Report fully complies with the requirements of Section 13(a) or 15(d) of the Securities Exchange Act of 1934; and |
| 2. | The information contained in the Report fairly presents, in all material respects, the financial condition and results of operations of the Corporation. |
Date: February 20, 2004
| /s/ Laurence G. Sellyn | |
| Name: | Laurence G. Sellyn |
| Title: | Executive Vice-Presient, Finance and Chief |
| Financial Officer | |