


2012
REPORT TO
SHAREHOLDERS
December 7, 2012
 | MANAGEMENT’S DISCUSSION AND ANALYSIS |
This Management’s Discussion and Analysis (MD&A) comments on Gildan’s operations, performance and financial condition as at and for the years ended September 30, 2012 and October 2, 2011, compared to the preceding years. For a complete understanding of our business environment, trends, risks and uncertainties and the effect of accounting estimates on our results of operations and financial condition, this annual MD&A should be read together with the 2012 audited annual consolidated financial statements and the related notes. This annual MD&A is dated December 7, 2012. All amounts in this report are in U.S. dollars, unless otherwise noted.
International Financial Reporting Standards (IFRS)
This is the Company’s first annual report under IFRS as issued by the International Accounting Standards Board (IASB) and should be read in conjunction with our audited annual consolidated financial statements for the year ended September 30, 2012. For periods beginning after October 2, 2011, the Company has adopted IFRS for the preparation of its consolidated financial statements and has applied IFRS 1,First-time adoption of IFRS. The comparative figures for the fiscal year ended October 2, 2011, have been recast to comply with IFRS. Prior to October 2, 2011, the Company prepared its consolidated financial statements in accordance with previous Canadian GAAP. See note 29 to the 2012 audited annual consolidated financial statements for details on the reconciliations of the Company’s financial statements from previous Canadian GAAP to IFRS.
All financial information contained in this annual MD&A and in the audited annual consolidated financial statements has been prepared in accordance with International Financial Reporting Standards (IFRS), except for information pertaining to periods prior to fiscal 2011 and certain information discussed in the paragraph entitled “Definition and Reconciliation of Non-GAAP Measures” in this annual MD&A. The audited annual consolidated financial statements and this MD&A were reviewed by Gildan’s Audit and Finance Committee and were approved by our Board of Directors.
Additional information about Gildan, including our 2012 Annual Information Form, is available on our website at www.gildan.com, on the SEDAR website at www.sedar.com, and on the EDGAR section of the U.S. Securities and Exchange Commission website (which includes the Annual Report on Form 40-F) at www.sec.gov.
This document contains forward-looking statements, which are qualified by reference to, and should be read together with, the “Caution Regarding Forward-Looking Statements” notice on page 43.
In this annual MD&A, “Gildan”, the “Company”, or the words “we”, “us”, “our” refer, depending on the context, either to Gildan Activewear Inc. or to Gildan Activewear Inc. together with its subsidiaries.
OUR BUSINESS
OVERVIEW
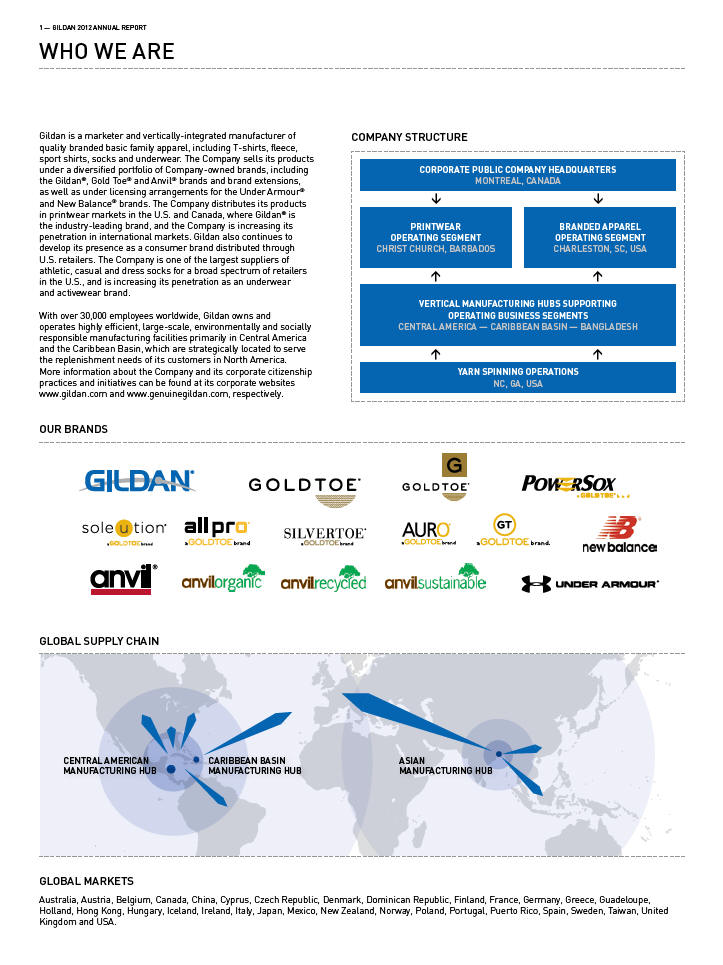
Gildan is a marketer and globally low-cost vertically-integrated manufacturer of quality branded basic family apparel. We market our products under a portfolio of company-owned brands, including the Gildan®, Gold Toe® and Anvil® brands and brand extensions, as well as under licensing arrangements for the Under Armour® and New Balance® brands. We design, manufacture and source basic products characterized by low-fashion risk and frequent replenishment, such as T-shirts, fleece, sport shirts, socks and underwear, the majority of which are made of cotton and synthetic fibres. We sell our products to customers requiring an efficient supply chain and consistent product quality for high-volume continuous replenishment programs in the North American and international printwear markets and to U.S. retailers. Gildan®is the leading activewear brand in the printwear market in the U.S. and Canada, and is increasing its penetration in international markets, such as Europe, Mexico and the Asia-Pacific region. In the U.S. retail market, we are one of the largest suppliers of athletic, casual and dress socks sold to a broad spectrum of retailers and are pursuing a strategy to become a major supplier of basic branded activewear and underwear for this market. In addition to supplying retailers, Gildan also manufactures select activewear programs for leading global consumer brands. With over 30,000 employees worldwide, Gildan owns and operates highly
GILDAN 2012 REPORT TO SHAREHOLDERS P.2
| | MANAGEMENT’S DISCUSSION AND ANALYSIS |
efficient, large-scale, environmentally and socially responsible manufacturing facilities in Central America and the Caribbean Basin and also owns and operates a facility in Bangladesh to support its sales in Asia and Europe.
OUR OPERATING SEGMENTS
As of fiscal 2012, the Company began managing and reporting its business as two operating segments, Printwear and Branded Apparel, each of which is a reportable segment for financial reporting purposes. Each segment has its own management that is accountable and responsible for the segment’s operations, results and financial performance. These segments are principally organized by the major customer markets they serve. The following summary describes the operations of each of the Company’s operating segments:
Printwear segment
The Printwear segment, headquartered in Christ Church, Barbados, designs, manufactures, sources and distributes undecorated activewear products in large quantities primarily to wholesale distributors in printwear markets in over 30 countries across North America, Europe and the Asia-Pacific region. The products sold through our Printwear segment consist mainly of undecorated or “blank” T-shirts, fleece and sport shirts marketed primarily under our Gildan® brand. More recently, following the acquisition of Anvil Holdings, Inc. (Anvil) on May 9, 2012, the Anvil® brand and brand extensions were added to our brand portfolio. In addition, during fiscal 2012, we reached an agreement to license the New Balance® brand for performance activewear products in the printwear distributor channel in the U.S. and Canada. Wholesale distributors buy our products and subsequently sell to screenprinters and embroiderers who decorate the products with designs and logos. Screenprinters and embroiderers then sell the imprinted activewear to a highly diversified range of end-use markets, including educational institutions, athletic dealers, event merchandisers, promotional product distributors, charity organizations, entertainment promoters, travel and tourism venues and retailers. Our activewear products are used in a variety of daily activities by individuals, including work and school uniforms and athletic team wear, and for various other purposes to convey individual, group and team identity.
Branded Apparel segment
The Branded Apparel segment, headquartered in Charleston, South Carolina, designs, manufactures, sources, and distributes branded family apparel, which includes socks, underwear and activewear products, primarily to U.S. retailers. Currently, the majority of our Branded Apparel segment sales consist of a variety of styles of socks, sold primarily under various company-owned and licensed brands, as well as select national retailers’ brands. We are now pursuing a strategy to grow our sales of underwear and activewear products in the U.S. retail market as we add new production capacity. We are increasingly focused on developing the Gildan brand within the retail channel. In fiscal 2011, the acquisition of Gold Toe Moretz Holdings Corp. (Gold Toe Moretz), a leading supplier of high-quality branded athletic, casual and dress socks for U.S. retailers, allowed us to significantly expand our brand portfolio to include the core Gold Toe® brand, which has high consumer brand recognition in national chains, department stores, and price clubs; the SilverToe® brand sold to a national chain; the GT® brand which we believe has further potential for development in the mass-market; the PowerSox® athletic performance brand which is distributed mainly through sports specialty retailers and national chains; the Auro® brand for the mass-market; and All Pro®, an athletic sock brand for the mass-market. We also have contractual licensing relationships with Under Armour® and New Balance® as the exclusive U.S. sock licensee for these brands. Furthermore, with the acquisition of Anvil, the Branded Apparel segment now also includes the manufacture and distribution of activewear products for leading consumer brands, including major sportswear and family entertainment brands.
GILDAN 2012 REPORT TO SHAREHOLDERS P.3
| | MANAGEMENT’S DISCUSSION AND ANALYSIS |
OUR OPERATIONS
Manufacturing operations
We have developed a significant manufacturing infrastructure in two main hubs in Central America and the Caribbean Basin, where we have built modern textile and sock manufacturing facilities and have established sewing operations. In addition, we own a small vertically-integrated manufacturing facility for the production of activewear in Bangladesh which mainly serves our international markets.
Central American manufacturing hub
Our largest manufacturing hub is based in Honduras and includes three large-scale vertically-integrated textile facilities for the production of activewear and underwear, Rio Nance 1, Rio Nance 2 and Rio Nance 5. Our newest and largest facility, Rio Nance 5 commenced operations at the end of fiscal 2011 and continued to ramp-up production during fiscal 2012. Rio Nance 5 is expected to be the most cost efficient of our manufacturing facilities once it is fully ramped-up. While accelerating the production ramp-up of Rio Nance 5, we suspended production at the Rio Nance 1 facility temporarily in order to modernize and refurbish the facility and improve the facility’s cost efficiency. The textiles produced at the Rio Nance complex are sewn in our sewing facilities in Honduras and Nicaragua. At the same complex, we have also constructed and operate two large-scale, integrated sock manufacturing facilities, Rio Nance 3 and Rio Nance 4. Rio Nance 4 began production during fiscal 2010 and is expected to support future sales growth in the sock category in addition to supporting production for a portion of our sock product-line previously sourced from third-party contractors, in order to reduce our sock manufacturing costs. In addition, during fiscal 2012, we acquired a small textile facility in Honduras and sewing facilities in Honduras and Nicaragua through the acquisition of Anvil.
Caribbean Basin manufacturing hub
Our Caribbean Basin manufacturing hub includes a vertically-integrated textile facility for the production of activewear fabric in Bella Vista, Dominican Republic. Textiles produced at our manufacturing facility in the Dominican Republic are sewn at third-party contractor operations in Haiti and at our sewing facility in the Dominican Republic.
While we internally produce the majority of the products we sell, we also have sourcing capabilities to complement Gildan’s large scale, vertically-integrated manufacturing.
Yarn-spinning
We satisfy our yarn requirements primarily by sourcing in the U.S. from third-party yarn suppliers with which we have supply agreements, as well as from our own yarn-spinning facilities in the U.S. previously owned by a joint venture, CanAm Yarns, LLC (CanAm). During the first quarter of fiscal 2013, CanAm became a wholly-owned subsidiary, following our acquisition of the remaining 50% interest. The Company is currently planning to modernize and expand the two CanAm yarn-spinning facilities and is also planning a new yarn-spinning facility in the U.S. for the production of ring-spun yarn which will be utilized as part of the Company’s branded product offering in the Branded Apparel segment.
Sales, marketing and distribution
Our sales and marketing offices are responsible for customer-related functions, including sales management, marketing, customer service, credit management, sales forecasting and production planning, and inventory control and logistics for each of their respective operating segments.
Printwear segment
Our sales and marketing office servicing our global printwear markets is located in Christ Church, Barbados. Following the acquisition of Anvil during fiscal 2012, Anvil’s U.S. and international distributor sales infrastructure was consolidated and integrated into our operations in Barbados. We distribute our activewear products for the printwear markets primarily out of our main distribution centre in Eden, North Carolina. We also use third-party warehouses in the western United States, Canada, Mexico, Europe and Asia to service our customers in these markets.
GILDAN 2012 REPORT TO SHAREHOLDERS P.4
| | MANAGEMENT’S DISCUSSION AND ANALYSIS |
Branded Apparel segment
Our primary sales and marketing office for our Branded Apparel segment is located in Charleston, South Carolina at the same location as our primary distribution centre servicing our retail customers. In addition, we also service retail customers from smaller distribution centres in North Carolina and South Carolina. We also operate 32 Gold Toe retail stores located in outlet malls throughout the United States.
Employees and corporate office
We currently employ over 30,000 full-time employees worldwide. Our corporate head office is located in Montreal, Canada.
COMPETITIVE ENVIRONMENT
The market for our products is highly competitive and is served by domestic and international manufacturers or suppliers. Competition is generally based upon price, with reliable quality and service also being critical requirements for success. Consumer brand recognition and appeal are also factors in the retail market. Our competitive strengths include our expertise in building and operating large-scale, vertically-integrated, strategically-located manufacturing hubs. Our capital investments in manufacturing allow us to operate efficiently and reduce costs, offer competitive pricing, consistent product quality, and a reliable supply chain, which efficiently services replenishment programs with short production/delivery cycle times. Continued innovations in our manufacturing processes have also allowed us to deliver enhanced product features, further improving the value proposition of our product offering to our customers. We have enhanced our consumer brand portfolio with the addition of the Gold Toe® brand and brand extensions and the Under Armour® and New Balance® licensed brands. The Company is focused on further developing its brands and is making a significant investment in advertising in support of further enhancement of its Gildan® and Gold Toe® brands. Our commitment to pursuing leading environmental and social responsibility practices is also an increasingly important factor for our customers.
Printwear segment
Our primary competitors in North America include major apparel manufacturers such as Fruit of the Loom, Inc. (Fruit of the Loom) and Russell Corporation (Russell), both subsidiaries of Berkshire Hathaway Inc. (Berkshire), Hanesbrands Inc., and smaller U.S.-based manufacturers, including Alstyle Apparel, a division of Ennis Corp., Delta Apparel Inc., as well as Central American and Mexican manufacturers. Competitors in the European printwear market include Fruit of the Loom and Russell, as well as competitors that do not have integrated manufacturing operations and source products from suppliers in Asia.
Branded Apparel segment
In the retail channel we compete primarily with Hanesbrands Inc. and Berkshire’s subsidiaries, Fruit of the Loom and Russell. In addition, our company-owned and licensed sock brands compete with companies such as Renfro Corporation, which manufactures and sources socks for owned and licensed brands, as well as brands from well-established U.S. fashion apparel and sportswear companies, which primarily source their products from Asia.
ECONOMIC ENVIRONMENT AND BUSINESS OUTLOOK
Demand in the U.S. distributor channel, the largest market for our Printwear segment, began to recover in the second quarter of fiscal 2012, after selling prices were reduced to reflect lower cotton costs, and has continued on a positive trend. However, there can be no assurance that improved demand trends will be maintained or will continue. For our Branded Apparel segment, weak macroeconomic conditions during fiscal 2012 affected the retail market resulting in retailers carefully managing inventory levels during the year. While we anticipate sales growth in our Branded Apparel segment for fiscal 2013, which is expected to result from having secured new Gildan® branded programs in fiscal 2012 and early in fiscal 2013, it is difficult to assess the health of consumer demand in the market going forward. Growth in the U.S. has been slow and uncertainty about the economy remains, which could negatively affect consumer sentiment and spending.
GILDAN 2012 REPORT TO SHAREHOLDERS P.5
| | MANAGEMENT’S DISCUSSION AND ANALYSIS |
The unprecedented volatility in the cost of cotton in fiscal 2011, which saw cotton prices reach historic highs in the first half of the year followed by an equally rapid and steep reversal in the second half of fiscal 2011, hurt overall profitability in the apparel industry in the first half of fiscal 2012. Activewear margins in the first half of fiscal 2012 for our Printwear segment were significantly negatively affected by the consumption of inventory produced in fiscal 2011 with high cost cotton. In addition, the Company’s net loss reported in the first quarter of fiscal 2012 was impacted by significant inventory destocking by U.S. distributors in anticipation of selling price reductions from suppliers. In the first quarter of fiscal 2012, we reduced our selling prices in the U.S. distributor channel. We believe that lower selling prices helped stimulate the recovery in demand in the U.S. distributor channel in fiscal 2012 and reinforced our industry leading position in this market. Similarly, in the first half of fiscal 2012, the Branded Apparel segment was also affected by the consumption of inventory produced with high cost cotton.
We anticipate results in fiscal 2013 will benefit from the consumption of inventory produced with lower year over year cotton costs based on our current cotton commitments and assuming current levels of cotton futures prices for the portion of our cotton commitments that have not been fixed at this time. However, inflation in labour and electricity and other input costs in fiscal 2013 are expected to offset in part the benefit of lower cotton costs. For fiscal 2013, the Company is assuming lower selling prices and increased promotional discounting for its Printwear segment. There can be no assurance that selling prices in fiscal 2013 will not come under more pressure than the level of pricing assumed by the Company, as a result of deteriorating market conditions, increased competitive promotional activity or a further decline in cotton futures prices. In the Branded Apparel segment, Gildan has maintained selling prices during fiscal 2012 after having implemented price increases mainly towards the end of fiscal 2011, as Gildan’s selling price increases to retailers at that time did not reflect the full pass-through of high-cost cotton. There can be no assurance that selling prices in the retail market will remain stable during fiscal 2013.
A discussion of management’s expectations as to our outlook for fiscal 2013 is contained in our fourth quarter earnings results press release dated November 29, 2012 under the sections entitled “Fiscal 2013 Guidance” and “Fiscal 2013 Cash Flow”.
STRATEGY AND OBJECTIVES
Our growth strategy comprises the following initiatives:
| 1. | Maximize printwear market penetration and opportunities |
| While we have achieved a leadership position in the U.S. and Canadian printwear market, particularly in the U.S. wholesale distributor market, we continue to pursue additional growth opportunities to increase our penetration in the North American and international printwear markets as we expand our production capacity and introduce new products for these markets. |
| | |
| During fiscal 2012, we began the ramp-up of our newest textile facility, Rio Nance 5. During the production ramp-up of Rio Nance 5, we suspended production temporarily at our most mature facility, Rio Nance 1, in order to modernize and refurbish the facility and improve its cost efficiency. Rio Nance 1 is expected to be available to resume operations in the second half of fiscal 2013 and production at the facility will be ramped-up as required. The addition of Rio Nance 5 and the resumption of production at Rio Nance 1 are expected to support our capacity requirements for our planned growth over the next few years. |
| | |
| In the third quarter of fiscal 2012, we acquired Anvil, as described under the heading entitled “Business Acquisitions” in the Operating Results section. The acquisition of Anvil further enhances the Company’s leadership position in the U.S. printwear market. We believe the Anvil® brand positioning is complementary to the Gildan® brand. Anvil has positioned itself as a supplier of niche products within the U.S. distributor channel, including products such as Anvilorganic®, Anvilrecycled® and Anvilsustainable®. We believe we have an opportunity to further grow our sales in the U.S. printwear market and increase our combined market share. |
GILDAN 2012 REPORT TO SHAREHOLDERS P.6
| | MANAGEMENT’S DISCUSSION AND ANALYSIS |
| The introduction of new products such as softer T-shirts and sport shirts, new styles tailored for women, a product-line with tear-away labels, performance products, enhanced sport shirts offerings and work wear assortments could enable us to further increase our market share penetration by servicing certain niches of the printwear market in which we previously did not participate. Recent product initiatives include our upcoming introduction of a New Balance® sports performance line for activewear products in the printwear distributor channel in the U.S. and Canada. This initiative represents an expansion of our licensing relationship with New Balance® for which the Company is the exclusive U.S. sock licensee. Additionally, in fiscal 2013 we will be introducing a basic performance activewear product-line under the Gildan Performance® brand. Through innovations in our manufacturing process, our Gildan Performance® line will have advanced features in moisture management, such as our Aquafx® technology delivering premium wicking and evaporation properties, as well as our Freshcare® anti-microbial properties incorporated into the textile production process to ensure long-lasting performance. |
| | |
| We also intend to continue to expand our presence in targeted international printwear markets which currently represent less than 10% of the Company’s consolidated sales. During fiscal 2012, our unit sales from international markets increased approximately 30% compared to fiscal 2011. |
| | |
| 2. | Continue penetration of retail market as a full-line supplier of branded family apparel |
| We intend to continue to leverage our existing core competencies, successful business model and competitive strengths to further grow our sales to U.S. retailers. As in the printwear market, success factors in penetrating the retail channel include consistent quality, competitive pricing and fast and flexible replenishment, together with a commitment to corporate social responsibility and environmental sustainability. We sell our products in the retail channel under the Gildan® and Gold Toe® brands and related brand extensions, as well as under licensing agreements for the Under Armour® and New Balance® brands. We are a leading supplier of socks in the U.S. mass-market retail channel. We are increasingly focusing on the steady development of our company-owned and exclusively licensed brands to retailers. We intend to leverage our current distribution with retailers, our manufacturing scale and expertise and our ongoing marketing investment to support the further development of company-owned and licensed brands to create additional sales growth opportunities in socks and other product categories. |
| | |
| During fiscal 2012 and early in fiscal 2013, we secured new branded programs for fiscal 2013 with national retail customers, as well as with regional retail chains, which will provide significant exposure and visibility for the Gildan® brand. These new programs include underwear, socks and activewear. We also made significant progress in our key initiative to grow the proportion of our sales of Company branded programs. The Company also reached an agreement to further extend the term of its exclusive U.S. sock license for the Under Armour® brand. In fiscal 2012, we retained a U.S. branding and marketing agency for the further development of the Gildan® and Gold Toe® portfolio of consumer brands and we intend to increase our investment in advertising in support of these brands. |
| | |
| We are also focused on building our relationships as a supply chain partner to global consumer brands that are increasingly looking to source large-scale replenishment programs from manufacturers that meet rigorous quality and social compliance criteria and have an efficient supply chain strategically located in the Western Hemisphere. With the acquisition of Anvil, we now have strong established relationships with major sportswear and family entertainment companies. While we pursue further sales growth within this customer segment we believe there is an opportunity to leverage these relationships to expand into other product categories. We also believe there are potential opportunities to expand existing brand license relationships into new product categories. |
| | |
| 3. | Continue to generate manufacturing and distribution cost reductions |
| We continuously seek to improve our manufacturing and distribution processes and cost structure by developing and investing in projects for capacity expansion, cost-reduction, as well as for further product quality enhancement. As previously discussed, during fiscal 2012, we proceeded with the ramp-up of Rio Nance 5 and initiated plans to modernize and refurbish our Rio Nance 1 facility |
GILDAN 2012 REPORT TO SHAREHOLDERS P.7
| | MANAGEMENT’S DISCUSSION AND ANALYSIS |
| and improve its cost efficiency. Rio Nance 5 is expected to be the most cost efficient of our manufacturing facilities. During the first quarter of fiscal 2013, the Company completed the acquisition of the remaining 50% of CanAm. Gildan is currently planning to modernize and expand the two CanAm yarn-spinning facilities and is also planning a new yarn-spinning facility in the U.S. The strategic rationale for the Company’s investment in vertically-integrated yarn-spinning is to support its projected sales growth and to continue to pursue its business model of investing in global low-cost manufacturing technology and in product technology which will provide consistent superior product quality. The Company is investing in ring-spun yarn technology which will provide enhanced quality features as well as qualify for duty-free access to U.S. markets under the Dominican Republic–Central America–United States Free Trade Agreement (CAFTA-DR), which requires the use of U.S. yarn or yarn spun in other CAFTA-DR member countries. Ring-spun products will be utilized as part of the Company’s branded product offering in Branded Apparel. |
| | |
| We continue to execute our plans to reduce our reliance on high-cost fossil fuels and further reduce our impact on the environment by installing additional biomass facilities as an alternate source of natural renewable energy, and other initiatives to increase the efficiency of our energy-intensive equipment and processes, which reflect the Company’s commitment to environmental sustainability. During fiscal 2012, we completed the installation of biomass facilities for steam generation for our textile production in Honduras, which is expected to lower our energy costs related to steam generation in fiscal 2013. The Company plans to continue to invest in biomass projects during fiscal 2013. |
| | |
| The acquisition of Gold Toe Moretz also creates the potential to achieve cost synergies by combining certain overhead functions of both companies and integrating certain high-volume products supplied by Gold Toe Moretz into Gildan’s vertically-integrated sock manufacturing in Honduras. We are also seeking to achieve acquisition synergies from the integration of Anvil’s production for the printwear market into Gildan’s low-cost vertical manufacturing, the integration of Anvil’s U.S. and international distributor sales and marketing functions into Gildan’s existing Printwear business, consolidation of purchasing of raw materials and other purchased cost inputs, the elimination of certain duplicate administrative functions, and savings on ongoing working capital requirements. |
| | |
| 4. | Reinvest cash flow |
| We will continue to evaluate opportunities to reinvest our cash flows generated from operations. We believe we will generate free cash flow after financing our working capital and capital expenditure requirements to support our organic growth. In order to re-invest our free cash flow, we will continue to seek complementary strategic acquisition opportunities which meet our return on investment criteria, based on our risk-adjusted cost of capital. In addition, we pay a dividend. On November 29, 2012, the Company announced that its Board of Directors approved an increase in the amount of the current quarterly dividend per share by 20%. |
We are subject to a variety of business risks that may affect our ability to maintain our current market share and profitability, as well as our ability to achieve our short and long-term strategic objectives. These risks are described under the “Financial Risk Management” and “Risks and Uncertainties” sections of this annual MD&A.
GILDAN 2012 REPORT TO SHAREHOLDERS P.8
| | MANAGEMENT’S DISCUSSION AND ANALYSIS |
OPERATING RESULTS
BUSINESS ACQUISITIONS
Anvil
On May 9, 2012, the Company acquired 100% of the common shares of Anvil for cash consideration of $87.4 million, net of cash acquired. Anvil is a supplier of high-quality basic T-shirts and sport shirts. The acquisition of Anvil further enhances the Company’s leadership position in the U.S. printwear market, and also positions the Company with potential growth opportunities as a supply chain partner to leading consumer brands with rigorous criteria for product quality and social responsibility. The acquisition is also expected to generate cost savings from integration synergies. The Company financed the acquisition by the utilization of its revolving long-term credit facility.
The Company accounted for this acquisition using the acquisition method in accordance with IFRS 3, Business Combinations, and the results of Anvil have been consolidated with those of the Company from the date of acquisition. Consequently, the audited annual consolidated financial statements for the year ended September 30, 2012 include the results of Anvil from May 9, 2012 to September 30, 2012. We have determined the fair value of the assets acquired and liabilities assumed based on management’s best estimate of their fair values and taking into account all relevant information available at that time. Please refer to note 5 to the 2012 audited annual consolidated financial statements for a summary of the amounts recognized for the assets acquired and liabilities assumed at the date of acquisition.
Gold Toe Moretz
On April 15, 2011, the Company acquired 100% of the common shares of Gold Toe Moretz for consideration transferred of $347.7 million, net of cash acquired, including contingent consideration of $5.3 million. Gold Toe Moretz is a leading supplier of high-quality branded athletic, casual and dress socks for national chains, mass-market retailers, price clubs, department stores and specialty sporting goods stores in the United States. The acquisition of Gold Toe Moretz provided the Company with enhanced brand management expertise which is being utilized to further the development of the Gildan® brand. In addition to the introduction of leading consumer brands, the acquisition significantly expanded and diversified the Company’s channels of distribution in the U.S. retail market. The Company financed the acquisition by using approximately $100 million of cash on hand and approximately $250 million drawn on its revolving long-term credit facility.
Gildan accounted for this acquisition using the acquisition method in accordance with IFRS 3, Business Combinations, and the results of Gold Toe Moretz have been consolidated with those of Gildan from the date of acquisition. Consequently, the 2011 audited annual consolidated financial statements include the results of Gold Toe Moretz from April 15, 2011 to October 2, 2011. We have determined the fair value of the assets acquired and liabilities assumed based on management’s best estimate of their fair values and taking into account all relevant information available at that time. Please refer to note 5 to the 2012 audited annual consolidated financial statements for a summary of the amounts recognized for the assets acquired and liabilities assumed at the date of acquisition.
NON-GAAP MEASURES
We use non-GAAP measures to assess our operating performance. Securities regulations require that companies caution readers that earnings and other measures adjusted to a basis other than IFRS do not have standardized meanings and are unlikely to be comparable to similar measures used by other companies. Accordingly, they should not be considered in isolation. We use non-GAAP measures including adjusted net earnings, adjusted diluted EPS, EBITDA, free cash flow, total indebtedness, and net indebtedness to measure our performance from one period to the next without the variation caused by certain adjustments that could potentially distort the analysis of trends in our operating performance, and because we believe such measures provide meaningful information on the Company’s financial condition and financial performance.
GILDAN 2012 REPORT TO SHAREHOLDERS P.9
| | MANAGEMENT’S DISCUSSION AND ANALYSIS |
We refer the reader to the section entitled “Definition and Reconciliation of Non-GAAP Measures” in this MD&A for the definition and complete reconciliation of all non-GAAP measures used and presented by the Company to the most directly comparable IFRS measures.
SELECTED ANNUAL INFORMATION
| | | IFRS | | | Previous Canadian GAAP | |
| (in $ millions, except per share amounts) | | 2012 | | | 2011 | | | 2011 | | | 2010 | |
Net sales | | 1,948.3 | | | 1,725.7 | | | 1,726.0 | | | 1,311.5 | |
Cost of sales | | 1,552.1 | | | 1,288.1 | | | 1,288.3 | | | 947.2 | |
Gross profit | | 396.2 | | | 437.6 | | | 437.7 | | | 364.3 | |
Selling, general and administrative expenses | | 226.0 | | | 198.8 | | | 199.1 | | | 154.7 | |
Restructuring and acquisition-related costs | | 15.0 | | | 18.2 | | | 8.5 | | | 8.7 | |
Operating income | | 155.2 | | | 220.6 | | | 230.1 | | | 200.9 | |
Financial expenses, net | | 11.6 | | | 6.1 | | | 5.4 | | | 0.8 | |
Non-controlling interest in consolidated joint venture | | - | | | - | | | 0.5 | | | 3.8 | |
Equity earnings in investment in joint venture | | (0.6 | ) | | (0.5 | ) | | - | | | - | |
Earnings before income taxes | | 144.2 | | | 215.0 | | | 224.2 | | | 196.3 | |
Income tax recovery | | (4.3 | ) | | (19.2 | ) | | (15.7 | ) | | (1.9 | ) |
Net earnings | | 148.5 | | | 234.2 | | | 239.9 | | | 198.2 | |
| | | | | | | | | | | | |
Earnings per share: | | | | | | | | | | | | |
Basic | | 1.22 | | | 1.93 | | | 1.97 | | | 1.64 | |
Diluted | | 1.22 | | | 1.91 | | | 1.96 | | | 1.63 | |
| | | | | | | | | | | | |
Total assets | | 1,896.4 | | | 1,858.5 | | | 1,889.7 | | | 1,327.5 | |
Total long-term financial liabilities | | 181.0 | | | 209.0 | | | 209.0 | | | - | |
| Certain minor rounding variances exist between the financial statements and this summary. | |
The analysis that follows is for fiscal 2012, fiscal 2011 and fiscal 2010. The Company did not recast its fiscal 2010 financial information in accordance with IFRS and, as such, fiscal 2010 financial information is not entirely comparable with fiscal 2012 financial information. The variance analysis between fiscal 2011 and fiscal 2010, in this MD&A, is based on figures in accordance with previous Canadian GAAP for both fiscal 2011 and fiscal 2010.
Net sales
Consolidated net sales in fiscal 2012 amounted to $1,948.3 million, up $222.6 million, or 12.9%, from $1,725.7 million in fiscal 2011. Printwear segment sales in fiscal 2012 were $1,334.3 million, up slightly from sales of $1,327.7 million last year. Branded Apparel segment sales were $614.0 million, up $216.0 million, or 54.3% from $398.0 million in fiscal 2011. Consolidated net sales for fiscal 2012 were in line with the Company's guidance provided on August 2, 2012 of sales of approximately $1,950 million.
The increase in consolidated net sales in fiscal 2012 compared to fiscal 2011 was due to the impact of the acquisitions of Gold Toe Moretz and Anvil, higher Printwear unit sales volumes, as well as higher selling prices and more favourable product-mix for Branded Apparel, partially offset by lower net selling prices for Printwear and lower organic unit volumes in Branded Apparel due to weak retail market conditions and the transition out of private label programs. The increase in Printwear unit sales volumes in fiscal 2012 was mainly attributable to increased demand in the U.S. distributor channel and further market share penetration in the U.S. and international printwear markets, partly offset by significant inventory destocking in the first quarter of fiscal 2012 in the U.S. distributor channel, which was not fully replenished during the year. Sales from Canada of $67.8 million in fiscal 2012 were up 6.9% compared to sales of $63.4 million in fiscal 2011 driven by higher unit sales volumes. Net sales from international markets of $141.9 million during fiscal 2012 increased $19.6 million, or 16.0% compared to $122.3 million in fiscal 2011 reflecting
GILDAN 2012 REPORT TO SHAREHOLDERS P.10
| | MANAGEMENT’S DISCUSSION AND ANALYSIS |
higher unit sales volumes, offset in part by lower average selling prices and the impact of the decrease in the value of local currencies compared to the U.S. dollar.
Fiscal 2011 compared to fiscal 2010
Net sales in fiscal 2011 totalled $1,726.0 million, up 31.6%, from $1,311.5 million in fiscal 2010. Sales of activewear and underwear in fiscal 2011 were $1,406.0 million, up 29.6% from $1,085.0 million in fiscal 2010, and sales of socks were $320.0 million, up 41.3% from $226.5 million in fiscal 2010.
The increase in activewear and underwear sales in fiscal 2011 compared to fiscal 2010 was primarily due to higher average net selling prices and increased unit sales volumes. Unit sales growth of activewear and underwear was due to an increase in industry demand in the U.S. distributor channel in the first half of fiscal 2011, increased market share penetration in other printwear markets and increased shipments of activewear and underwear to mass-market retailers, partially offset by a decline in overall market demand in the U.S. distributor channel in the second half of fiscal 2011. Canadian sales totalled $63.4 million in fiscal 2011, up 17.0% compared to sales of $54.2 million in fiscal 2010 due to higher average selling prices and the appreciation of the Canadian dollar, partially offset by lower unit volume sales. Net sales from international markets of $122.3 million during fiscal 2011 increased $19.8 million, or 19.3% compared to international sales of $102.5 million in fiscal 2010 due to higher average selling prices and higher unit volume sales in most of the markets we serve, partially offset by the discontinuation of certain programs previously serviced from our Bangladesh facility. The increase in socks sales for fiscal 2011 was due to the impact of the acquisition of Gold Toe Moretz and the implementation of selling price increases, partially offset by lower organic sales of socks, in part attributable to inventory destocking by mass-market retailers.
Gross profit
Consolidated gross profit is the result of our net sales less cost of sales. Gross margin reflects gross profit as a percentage of sales. Our cost of sales includes all raw material costs, manufacturing conversion costs, including manufacturing depreciation expense, sourcing costs, inbound freight and inter-facility transportation costs, and outbound freight to customers. Cost of sales also includes the costs of purchased finished goods, costs relating to purchasing, receiving and inspection activities, manufacturing administration, third-party manufacturing services, sales-based royalty costs, insurance, inventory write-downs, and customs and duties. Our reporting of gross profit and gross margin may not be comparable to these metrics as reported by other companies, since some entities include warehousing and handling costs, and/or exclude depreciation expense, outbound freight to customers and royalty costs from cost of sales.
Consolidated gross profit for fiscal 2012 was $396.2 million, down $41.4 million from gross profit of $437.6 million in fiscal 2011. As a percentage of sales, gross margins in fiscal 2012 were 20.3%, down from 25.4% in fiscal 2011. The decline in gross margin was mainly due to higher cotton costs, lower average net selling prices for Printwear and a special distributor inventory devaluation discount incurred in the first quarter of fiscal 2012, as well as manufacturing inefficiencies, including the impact of transitional inefficiencies related to the ramp-down of our Rio Nance 1 facility and the ramp-up of Rio Nance 5, and manufacturing shutdown costs during the year. The negative effect of these factors was partially offset by the impact of the Gold Toe Moretz acquisition, favourable efficiencies in sock manufacturing and higher selling prices and more favourable product-mix in the Branded Apparel segment. Gross margins in the second half of fiscal 2012 improved significantly compared to gross margins in the first half of the fiscal year as the Company consumed inventory with increasingly lower cost cotton compared to the first half of fiscal 2012.
Fiscal 2011 compared to fiscal 2010
Gross profit for fiscal 2011 was $437.7 million, up $73.4 million from gross profit of $364.3 million in fiscal 2010. As a percentage of sales, gross margin in fiscal 2011 declined to 25.4% compared to gross margin of 27.8% in fiscal 2010. The decline in gross margin was primarily due to significantly higher cotton costs compared to the prior year, which as a percentage of net sales, more than offset the impact of higher average net selling prices.
GILDAN 2012 REPORT TO SHAREHOLDERS P.11
| | MANAGEMENT’S DISCUSSION AND ANALYSIS |
Selling, general and administrative expenses
Selling, general and administrative (SG&A) expenses include warehousing and handling costs, selling and administrative personnel costs, co-op advertising and marketing expenses, costs of leased facilities and equipment, professional fees, non-manufacturing depreciation and amortization expense, and other general and administrative expenses. SG&A expenses also include bad debt expense and amortization of intangible assets.
SG&A expenses were $226.0 million in fiscal 2012, or 11.6% of net sales, up $27.2 million compared to SG&A expenses of $198.8 million, or 11.5% of net sales in fiscal 2011. The increase in SG&A expenses in fiscal 2012 compared to last year was due to the impact of the acquisitions of Gold Toe Moretz and Anvil. Excluding the impact of the acquisitions of Gold Toe Moretz and Anvil, SG&A expenses in fiscal 2012 declined compared to last year primarily due to lower variable compensation expenses, distribution efficiencies in the Branded Apparel segment and the non-recurrence of a prior year loss relating to the early termination of the Company’s previous corporate aircraft lease, which more than offset higher amortization of intangible assets related to the acquisition of Gold Toe Moretz, and increased marketing expenses.
Fiscal 2011 compared to fiscal 2010
SG&A expenses were $199.1 million in fiscal 2011, up $44.4 million compared to SG&A expenses of $154.7 million in fiscal 2010. SG&A expenses as a percent of net sales for fiscal 2011 decreased to 11.5% compared to 11.8% of net sales in fiscal 2010. The increase in SG&A expenses was primarily due to the impact of the acquisition of Gold Toe Moretz, increases in compensation expenses, legal and professional fees and retail marketing expenses combined with the impact of the higher-valued Canadian dollar on corporate administrative expenses.
Restructuring and acquisition-related costs
Restructuring and acquisition-related costs amounted to $15.0 million in fiscal 2012, including $9.0 million related to business acquisitions and changes in management structure and $6.0 million related to facility closures and relocations. In fiscal 2011, restructuring and acquisition-related costs amounted to $18.2 million, including $11.2 million related to business acquisitions and changes in management structure and $7.0 million related to facility closures. Costs related to facility closures in fiscal 2012 and fiscal 2011 consisted primarily of asset write-downs and employee termination benefits incurred in connection with facilities closed in prior years, which are currently included in assets held for sale. Costs related to business acquisitions and changes in management structure in fiscal 2012 consisted primarily of transaction, exit and integration costs, and employee termination benefits in connection with the acquisition of Anvil, net of a purchase gain of $6.7 million, as well as employee termination benefits in connection with the acquisition of Gold Toe Moretz. Costs related to business acquisitions and changes in management structure in fiscal 2011 consisted primarily of transaction costs and costs relating to the wind-up of a pension plan in connection with the acquisition of Gold Toe Moretz.
The Company expects to incur additional carrying costs relating to the closed facilities, which will be accounted for as restructuring charges as incurred and until all assets related to the closures are disposed. Any fair value adjustments and gains or losses on the disposal of the assets held for sale will also be accounted for as restructuring charges as incurred.
Fiscal 2011 compared to fiscal 2010
Restructuring and acquisition-related costs in fiscal 2011 and fiscal 2010 under previous Canadian GAAP were $8.5 million and $8.7 million, respectively and were comprised of costs related to facility closures. An IFRS adjustment of $9.7 million resulted in higher restructuring and acquisition-related costs for fiscal 2011 under IFRS when compared to previous Canadian GAAP primarily due to the difference in accounting between IFRS and previous Canadian GAAP for acquisition-related costs in connection with business combinations.
GILDAN 2012 REPORT TO SHAREHOLDERS P.12
| | MANAGEMENT’S DISCUSSION AND ANALYSIS |
Operating income
During fiscal 2012, the Company reported operating income of $155.2 million, down $65.4 million or 29.6% compared to operating income of $220.6 million for fiscal 2011. The decrease in consolidated operating income reflected lower operating income from the Printwear segment, particularly as it incurred an operating loss in the first quarter of fiscal 2012. The operating income decline in Printwear was partially offset by improved operating income performance in the Branded Apparel segment and lower corporate and other expenses related mainly to lower variable compensation expenses and the non-recurrence of a prior year loss related to the early termination of the Company’s previous corporate aircraft lease.
Financial expenses, net
Net financial expenses include: interest expense on borrowings, including realized gains and/or losses on interest rate swaps designated for hedge accounting; bank and other financial charges; interest income on funds invested; accretion of interest on discounted provisions; net foreign currency losses and/or gains; and losses and/or gains on financial derivatives that do not meet the criteria for effective hedge accounting. Net financial expense amounted to $11.6 million in fiscal 2012, compared to net financial expense of $6.1 million in fiscal 2011. The increase of $5.5 million in net financial expense in fiscal 2012 was primarily due to higher interest expense resulting from increased borrowings from the Company’s revolving long-term credit facility.
Fiscal 2011 compared to fiscal 2010
Net financial expense amounted to $5.4 million in fiscal 2011, compared to net financial expense of $0.8 million in fiscal 2010. The increase of $4.6 million in net financial expense in fiscal 2011 resulted mainly from increased interest expense and bank charges due primarily to the financing of the acquisition of Gold Toe Moretz and a loss related to derivative financial instruments which were not designated as hedges for accounting purposes.
Income taxes
The Company recorded an income tax recovery of $4.3 million for fiscal 2012 compared to an income tax recovery of $19.2 million for fiscal 2011. Excluding the impact of restructuring and acquisition-related costs in both years, the Company recorded an income tax expense of $1.9 million for fiscal 2012 compared to an income tax recovery of $13.7 million in fiscal 2011. The income tax recovery for fiscal 2011 was due primarily to the recognition of deferred income tax assets related to higher tax losses incurred by the Company’s U.S. legal entities during the year related to the Branded Apparel segment, the benefits of which have been recognized as it is probable that we will be able to utilize the losses in future years. The lower income tax recovery in fiscal 2012 compared to fiscal 2011 was due to the improved profitability of our Branded Apparel segment.
The Company’s growth plans for the Branded Apparel segment are expected to result in an increased proportion of the Company’s profits earned in higher tax rate jurisdictions, and consequently, would result in an increase to the Company’s overall effective income tax rate in future years.
Net earnings
Net earnings for fiscal 2012 of $148.5 million, or $1.22 per share on a diluted basis, were down 36.6% and 36.1%, respectively compared with net earnings of $234.2 million, or $1.91 per share on a diluted basis in fiscal 2011. Before the after tax impact of restructuring and acquisition-related costs, the Company reported adjusted net earnings and adjusted diluted EPS for fiscal 2012 of $157.3 million and $1.29 compared with adjusted net earnings of $246.9 million, or $2.02 per share, respectively, for the prior year. The decline in the Company’s earnings compared to last year was primarily due to lower consolidated gross margins compared to last year and higher income taxes, partially offset by the accretive impact of the acquisitions of Gold Toe Moretz and Anvil, and higher Printwear unit sales volumes.
Adjusted diluted EPS for fiscal 2012 were essentially in line with the Company’s earnings guidance of approximately $1.30 per share provided on August 2, 2012.
Fiscal 2011 compared to fiscal 2010
Net earnings for fiscal 2011 of $239.9 million, or $1.96 per share on a diluted basis, were up 21.0% and 20.2%, respectively compared with net earnings of $198.2 million, or $1.63 per share on a diluted basis in fiscal 2010. Adjusted net earnings and adjusted diluted EPS for fiscal 2011 totalled $245.5 million and $2.01 per share compared with adjusted net earnings of $203.6 million, or $1.67 per share for the prior
GILDAN 2012 REPORT TO SHAREHOLDERS P.13
| | MANAGEMENT’S DISCUSSION AND ANALYSIS |
year. The increase in the Company’s earnings results for fiscal 2011 compared to the prior year was due to sales growth for activewear, the earnings accretion from the Gold Toe Moretz acquisition and higher income tax recoveries, which more than offset higher cotton and other input costs, lower organic sock sales and increased selling, general and administrative expenses.
SEGMENTED OPERATING REVIEW
| (in $ millions) | | 2012 | | | 2011 | | | Variation | |
Segment net sales: | | | | | | | | | |
Printwear | | 1,334.3 | | | 1,327.7 | | | 6.6 | |
Branded Apparel | | 614.0 | | | 398.0 | | | 216.0 | |
Total net sales | | 1,948.3 | | | 1,725.7 | | | 222.6 | |
| | | | | | | | | |
Segment operating income (loss): | | | | | | | | | |
Printwear | | 209.4 | | | 330.2 | | | (120.8 | ) |
Branded Apparel | | 32.8 | | | (16.2 | ) | | 49.0 | |
Total segment operating income | | 242.2 | | | 314.0 | | | (71.8 | ) |
Corporate and other(1) | | (87.0 | ) | | (93.4 | ) | | 6.4 | |
Total operating income | | 155.2 | | | 220.6 | | | (65.4 | ) |
(1) Includes corporate head office expenses, restructuring and acquisition-related costs, and amortization of intangible assets.
Certain minor rounding variances exist between the financial statements and this summary. | |
Printwear
Net sales
Printwear segment net sales in fiscal 2012 amounted to $1,334.3 million, slightly up from $1,327.7 million in fiscal 2011. The slight improvement in sales reflected the benefit of the Anvil acquisition and sales growth from our international markets driven by increased market share penetration, which essentially offset lower net selling prices for the year that resulted from the Company’s decision to reduce selling prices in the first quarter of fiscal 2012. Excluding the impact of Anvil, unit sales volumes were up in fiscal 2012 due to increased unit volumes from international markets, partly offset by a unit volume decline in the U.S. printwear market as a result of the significant inventory destocking by U.S. distributors in the first quarter of fiscal 2012, which was not fully offset by the replenishment of inventories by U.S. distributors and the recovery in demand during the balance of the year.
Operating income
The Printwear segment reported operating income of $209.4 million for fiscal 2012 compared to operating income of $330.2 million in fiscal 2011. The operating income decline in fiscal 2012 was primarily due to higher cotton costs in the first half of fiscal 2012 and lower net selling prices combined with the impact of significant inventory destocking by U.S. distributors in the first quarter of fiscal 2012, which was not fully replenished during the year. Operating income in fiscal 2012 was also negatively impacted by a special inventory devaluation discount of approximately $19 million granted to U.S. distributors in the first quarter of fiscal 2012, transitional manufacturing inefficiencies related to the ramp-up of Rio Nance 5 and the ramp-down of Rio Nance 1, and higher costs related to production downtime during the year. These negative factors more than offset the benefit of increased penetration in international markets and the impact of the Anvil acquisition.
Branded Apparel
Net sales
Branded Apparel segment net sales amounted to $614.0 million for fiscal 2012, up $216.0 million, or 54.3%, compared to fiscal 2011. The growth in Branded Apparel segment sales compared to last year was primarily due to the Gold Toe Moretz and Anvil acquisitions together with higher net selling prices and
GILDAN 2012 REPORT TO SHAREHOLDERS P.14
| | MANAGEMENT’S DISCUSSION AND ANALYSIS |
more favourable product-mix, partially offset by lower organic unit volumes due to weak retail market conditions and the exit from private label programs.
Operating income / loss
The Branded Apparel segment reported operating income of $32.8 million in fiscal 2012, up $49.0 million compared to an operating loss of $16.2 million in the same period last year. The significant improvement in operating performance in fiscal 2012 compared to last year was due to the accretive impact of the Gold Toe Moretz and Anvil acquisitions, higher net selling prices and more favourable product mix as the Company increasingly continues to focus on more profitable branded programs. These positive factors were partially offset by higher cotton costs in the first half of fiscal 2012 and the impact of retailers managing inventories during weak market conditions in fiscal 2012.
SUMMARY OF QUARTERLY RESULTS
The table below sets forth certain summarized unaudited quarterly financial data for the eight most recently completed quarters, in accordance with IFRS. This quarterly information is unaudited and has been prepared on the same basis as the audited annual consolidated financial statements. The operating results for any quarter are not necessarily indicative of the results to be expected for any period.
| | | | | | | | | | | | 2012 | | | | | | | | | | | | 2011 | |
(in $ millions, except per share amounts) | | Q4 | | | Q3 | (2) | | Q2 | | | Q1 | | | Q4 | | | Q3 | (1) | | Q2 | | | Q1 | |
| | | | | | | | | | | | | | | | | | | | | | | | |
Net sales | | 561.7 | | | 600.2 | | | 482.6 | | | 303.8 | | | 481.6 | | | 529.7 | | | 383.2 | | | 331.2 | |
Net earnings (loss) | | 89.0 | | | 78.6 | | | 26.9 | | | (46.1 | ) | | 48.5 | | | 88.1 | | | 61.7 | | | 35.9 | |
Net earnings (loss) per share | | | | | | | | | | | | | | | | | | | | | | | | |
Basic(3) | | 0.73 | | | 0.65 | | | 0.22 | | | (0.38 | ) | | 0.40 | | | 0.72 | | | 0.51 | | | 0.30 | |
Diluted(3) | | 0.73 | | | 0.64 | | | 0.22 | | | (0.38 | ) | | 0.40 | | | 0.72 | | | 0.50 | | | 0.29 | |
Total assets | | 1,896.4 | | | 1,939.2 | | | 1,854.5 | | | 1,806.8 | | | 1,858.5 | | | 1,857.3 | | | 1,433.7 | | | 1,359.8 | |
Total long-term financial liabilities | | 181.0 | | | 306.0 | | | 333.0 | | | 305.0 | | | 209.0 | | | 252.0 | | | - | | | - | |
Weighted average number of shares outstanding(in ‘000s) | | | | | | | | | | | | | | | | | | | | | | | | |
Basic | | 121,473 | | | 121,527 | | | 121,518 | | | 121,434 | | | 121,548 | | | 121,649 | | | 121,515 | | | 121,394 | |
Diluted | | 122,322 | | | 122,047 | | | 121,985 | | | 121,434 | | | 122,143 | | | 122,506 | | | 122,273 | | | 122,161 | |
(1) Results reflect the acquisition of Gold Toe Moretz from April 15, 2011.
(2) Results reflect the acquisition of Anvil from May 9, 2012.
(3) Quarterly EPS may not add to year-to-date EPS due to rounding.
Certain minor rounding variances exist between the financial statements and this summary. | |
SEASONALITY AND OTHER FACTORS AFFECTING THE VARIABILITY OF RESULTS AND FINANCIAL CONDITION
Our results of operations for interim periods and for full fiscal years are impacted by the variability of certain factors, including, but not limited to, changes in end-use demand and customer demand, our customers’ decision to increase or decrease their inventory levels, changes in our sales mix, and fluctuations in selling prices and raw material costs. While our products are sold on a year-round basis, our business experiences seasonal changes in demand which results in quarterly fluctuations in operating results. Historically, net sales have been lowest in the first quarter and highest in the third quarter of the fiscal year, reflecting the seasonality of the Printwear segment net sales, which have historically accounted for a majority of the Company’s consolidated net sales. Demand for T-shirts is lowest in the first fiscal quarter and highest in the third quarter of each fiscal year, when distributors purchase inventory for the peak Summer selling season. Demand for fleece is typically highest, in advance of the Fall and Winter seasons, in the third and fourth quarters of each fiscal year. For our sock products, demand is typically highest in the first and fourth quarters of each fiscal year, stimulated largely by the cooler weather and the need to support requirements for the back-to-school period and the holiday season in retail.
GILDAN 2012 REPORT TO SHAREHOLDERS P.15
| | MANAGEMENT’S DISCUSSION AND ANALYSIS |
Historically, we have typically operated our mature facilities at full capacity throughout the year in order to be cost efficient. Consequently, with the seasonal sales trends of our business, we experience fluctuations in our inventory levels throughout the year, in particular a build-up of T-shirt inventory levels in the first half of the year.
In the first quarter of fiscal 2012, the Company reported a net loss due to the impact of significant distributor inventory destocking, a special distributor inventory devaluation discount of approximately $19 million, and a charge to cost of sales of approximately $9 million relating to extended holiday production downtime in December.
Our results are also impacted by fluctuations in the price of raw materials and other input costs. Cotton and polyester fibres are the primary raw materials used in the manufacture of our products, and we also use chemicals, dyestuffs and trims which we purchase from a variety of suppliers. Cotton prices, which directly affect the cost of the cotton fibres we purchase, are affected by weather, consumer demand, speculation on the commodities market, the relative valuations and fluctuations of the currencies of producer versus consumer countries and other factors that are generally unpredictable. While we enter into contracts in advance of delivery to establish firm prices for the cotton component of our yarn, our realized cotton costs can fluctuate significantly between interim and annual reporting periods. Energy costs in our results of operations are also affected by fluctuations in crude oil and petroleum prices, which can also influence transportation costs and the cost of related items used in our business, such as polyester fibres, chemicals, dyestuffs and trims.
As noted under the section entitled “Economic Environment and Business Outlook”, the Company’s results in the first half and in part in the third quarter of fiscal 2012 were significantly negatively affected by the consumption of inventory manufactured with cotton purchased at historically high cotton price levels during the unprecedented rise of cotton prices which occurred in 2011. In addition, in the first quarter of fiscal 2012, the Company reduced selling prices for its Printwear products ahead of the consumption of this high-cost inventory. Consequently, gross margins were negatively impacted during this period relative to historical levels due to the misalignment of industry selling prices and the cost of cotton in inventories being consumed. Gross margins in the fourth quarter of fiscal 2012 reflected the return to more normal levels of historical profitability as industry selling prices and the cost of cotton in inventories consumed in the quarter were more closely aligned.
Business acquisitions may affect the comparability of results. As noted in the table under “Summary of Quarterly Results”, the quarterly financial data reflects the acquisition of Gold Toe Moretz from April 15, 2011 and the acquisition of Anvil from May 9, 2012.
Management decisions to consolidate or reorganize operations, including the closure of facilities, may result in significant restructuring costs in an interim or annual period. In addition, the effect of asset write-downs, including provisions for bad debts and slow moving inventories, can affect the variability of our results. The section entitled “Restructuring and acquisition-related costs” in this annual MD&A contains a discussion of costs related to the Company’s restructuring activities and business acquisitions.
In the third quarter of fiscal 2012, following the transition of production from Rio Nance 1 to Rio Nance 5, the Company suspended production at its Rio Nance 1 facility temporarily as it proceeds with plans to modernize and refurbish the facility. Consequently, a non-cash charge of approximately $0.03 per share to write off obsolete equipment at Rio Nance 1 was recorded in the third quarter of fiscal 2012 and results in the second half of the fiscal year also include transitional manufacturing inefficiencies related to the ramp-down of the Rio Nance 1 facility and the ramp-up of Rio Nance 5. Depreciation expense will continue to be recorded on non-obsolete idle equipment during the temporary closure of Rio Nance 1.
Our reported amounts for sales, SG&A expenses, and financial expenses/income are impacted by fluctuations in the U.S. dollar versus certain other currencies as described in the “Financial Risk Management” section of this annual MD&A. The Company may periodically use derivative financial instruments to manage risks related to fluctuations in foreign exchange rates.
GILDAN 2012 REPORT TO SHAREHOLDERS P.16
| | MANAGEMENT’S DISCUSSION AND ANALYSIS |
FOURTH QUARTER RESULTS
Consolidated net sales in the fourth quarter of fiscal 2012 amounted to $561.7 million, up $80.1 million, or 16.6% from $481.6 million in the fourth quarter of fiscal 2011, and in line with the Company’s guidance of approximately $560 million provided on August 2, 2012. Sales for the Printwear segment amounted to $376.8 million, up $26.3 million, or 7.5% from $350.5 million in the fourth quarter of fiscal 2011, and sales for the Branded Apparel segment were $184.8 million, up $53.7 million, or 41.0%, from $131.1 million in the fourth quarter of last year.
The increase in sales in the Printwear segment compared to the fourth quarter of fiscal 2011 was due to higher unit sales volumes, as a result of continuing organic growth in the U.S. market, the impact of the Anvil acquisition, and continuing penetration in the Company’s target international markets. The impact on Printwear net sales revenues of higher unit sales volumes was partially offset by lower net selling prices, unfavourable product-mix, and higher seasonal inventory destocking in the U.S. distributor channel compared to the fourth quarter of fiscal 2011.
The growth in sales for the Branded Apparel segment was due primarily to the impact of the acquisition of Anvil, together with more favourable product-mix and higher net selling prices. Excluding Anvil, sales revenues for Branded Apparel in the fourth quarter were up approximately 18% compared to the fourth quarter of fiscal 2011.
Consolidated gross profit for the fourth quarter of fiscal 2012 of $160.2 million increased by $60.8 million from consolidated gross profit of $99.4 million during the fourth quarter of fiscal 2011. As a percentage of sales, gross margins for the fourth quarter of fiscal 2012 were 28.5%, up from 20.6% in the fourth quarter of fiscal 2011. The significant increase in gross margins was due to the impact of lower-cost cotton and more favourable product-mix and higher selling prices for Branded Apparel, partially offset by lower selling prices and unfavourable product-mix for Printwear, together with higher manufacturing input costs, as well as a charge related to a product labelling issue in the Branded Apparel segment which was disclosed in the Company’s press release dated October 16, 2012.
SG&A expenses in the fourth quarter of fiscal 2012 were $64.1 million, or 11.4% of net sales, compared with $53.4 million, or 11.1% of net sales, in the fourth quarter of fiscal 2011. The increase in SG&A expenses was largely due to the impact of the acquisition of Anvil, increased marketing and advertising expenses and higher legal and professional fees. Excluding the impact of the acquisition of Anvil, SG&A expenses in the fourth quarter of fiscal 2012 were approximately $58.0 million up approximately 8.6% from fiscal 2011.
In the fourth quarter, the Printwear segment reported operating income of $100.7 million, compared with $68.4 million in the fourth quarter of fiscal 2011. The operating income increase in Printwear was primarily due to the impact of lower cotton costs, higher unit sales volumes, and the accretive impact of the Anvil acquisition, partially offset by lower selling prices and unfavourable product-mix. The Branded Apparel segment reported quarterly operating income of $15.1 million, compared with an operating loss of $5.7 million in the fourth quarter of fiscal 2011. The improved results for Branded Apparel were due to lower cotton costs, more favourable product-mix, higher selling prices, and the accretive impact of the Anvil acquisition, partially offset by the charge for the labelling issue, previously noted.
Net earnings for the fourth quarter of fiscal 2012 were $89.0 million or $0.73 per share on a diluted basis, up respectively 83.5% and 82.5% from $48.5 million or $0.40 per share in the fourth quarter of fiscal 2011. Results for the fourth quarter of fiscal 2012 and fiscal 2011 include after-tax restructuring and acquisition-related costs of $5.9 million, and $3.5 million, respectively, primarily related to the write-down of real estate assets held for divestiture since the closure of U.S. sock manufacturing operations, as well as severance costs resulting from the integration of acquisitions. Excluding restructuring and acquisition-related costs in both years, adjusted net earnings for the fourth quarter of fiscal 2012 amounted to $94.9 million, or $0.78 per share, up 82.5% and 81.4% respectively, compared to $52.0 million, or $0.43 per share in the fourth quarter of fiscal 2011. The Company had previously projected adjusted net earnings of close to $0.80 per share for the fourth quarter, when it reported its third quarter results on August 2, 2012. Adjusted net
GILDAN 2012 REPORT TO SHAREHOLDERS P.17
| | MANAGEMENT’S DISCUSSION AND ANALYSIS |
earnings for the fourth quarter included an after-tax charge of $0.02 per share related to the product labelling issue previously noted, which had not been anticipated in the Company’s fourth quarter EPS guidance. The growth in the Company’s net earnings in the fourth quarter compared to last year was due to the benefit of significantly lower cotton costs, higher Printwear unit sales volumes, more favourable product-mix and higher selling prices for Branded Apparel and the initial accretion from the acquisition of Anvil. These positive factors were partially offset by lower net selling prices for Printwear, primarily reflecting the selling price reduction implemented in the first quarter of fiscal 2012, unfavourable Printwear product-mix, higher electricity, labour and other manufacturing input costs, the above-mentioned charge relating to the labelling issue, and higher income taxes due to the improved profitability of Branded Apparel.
FINANCIAL CONDITION
Trade accounts receivable, which are net of accrued sales discounts, amounted to $260.6 million as at September 30, 2012 compared to $191.6 million at the end of fiscal 2011. The increase in trade accounts receivable of $69.0 million, or 36% was mainly due to higher sales in the fourth quarter compared to the same period of fiscal 2011, and the inclusion of accounts receivable from the acquisition of Anvil which amounted to $26.1 million as of September 30, 2012.
Inventories as at September 30, 2012 were $553.1 million compared to $568.3 million at the end of fiscal 2011. Excluding the inventories from the acquisition of Anvil which amounted to $65.6 million as at September 30, 2012, inventories decreased by $80.8 million from the end of fiscal 2011, due mainly to lower average unit costs as a result of significantly lower cotton costs, partially offset by a planned increase in activewear inventory volumes to service projected demand.
Assets held for sale of $8.0 million as at September 30, 2012 and $13.1 million as at October 2, 2011 include property, plant and equipment primarily relating to closed facilities. The decrease in assets held for sale was due mainly to a $5.0 million charge recorded for the reduction in the fair value of assets held for sale, primarily for our former sock manufacturing and distribution facilities in Fort Payne, Alabama that were closed in prior years.
Property, plant and equipment, which are net of accumulated depreciation, including asset impairment losses, amounted to $552.4 million at September 30, 2012, compared to $550.3 million at October 2, 2011. The slight increase of $2.1 million reflected net capital additions of $68.1 million and the inclusion of $14.8 million of property, plant and equipment acquired from Anvil, offset by depreciation of $80.8 million. Capital additions included expenditures primarily for our Rio Nance 5 textile facility and our biomass energy project in Honduras. Capital expenditures for fiscal 2012 were slightly below the Company’s previous projection of approximately $90 million provided on August 2, 2012 due to the later timing of certain expenditures which will now be incurred in fiscal 2013.
Deferred income tax assets net of deferred income tax liabilities were $3.4 million at September 30, 2012 compared to net deferred income tax liabilities of $12.0 million at the end of fiscal 2011. The variation in deferred income taxes was due to a deferred income tax recovery of $10.3 million and the acquisition of Anvil, which resulted in the assumption of approximately $5.1 million of net deferred income tax assets at May 9, 2012 due to the tax effect of temporary differences between the accounting and tax basis of net assets acquired.
Intangible assets are comprised of customer contracts and relationships, trademarks, license agreements, non-compete agreements and computer software, and amounted to $260.0 million as at September 30, 2012 compared to $261.7 million at the end of fiscal 2011. The decrease of $1.7 million reflects amortization of $16.8 million, partially offset by $9.7 million related to the acquisition of Anvil and $5.4 million related to expenditures for the acquisition of the rights to the Gold Toe® trademark in Canada and computer software.
GILDAN 2012 REPORT TO SHAREHOLDERS P.18
| | MANAGEMENT’S DISCUSSION AND ANALYSIS |
Goodwill of $141.9 million as at September 30, 2012 remained unchanged from the end of fiscal 2011. Management performed its annual review for impairment of goodwill, and trademarks which are considered to be indefinite life intangible assets, and concluded that there has been no impairment as at September 30, 2012.
Total assets were $1,896.4 million as at September 30, 2012, compared to $1,858.5 million at the end of the previous year. Working capital was $659.2 million as at September 30, 2012 compared to $577.7 million as at October 2, 2011. The current ratio at the end of fiscal 2012 was 3.6 compared to 2.9 at the end of fiscal 2011.
Accounts payable and accrued liabilities amounted to $256.4 million as at September 30, 2012 compared to $298.0 million at the end of fiscal 2011. Excluding the accounts payable related to the acquisition of Anvil which amounted to $34.6 million as at September 30, 2012, accounts payable and accrued liabilities decreased by $76.2 million. The decrease from the end of fiscal 2011 was mainly due to the impact of lower cotton costs, as well as lower accruals for variable compensation expenses.
Employee benefit obligations of $19.6 million as at September 30, 2012 (October 2, 2011 - $20.2 million) include liabilities related to the Company’s defined benefit plans, which consists primarily of $12.2 million (October 2, 2011 - $12.6 million) related to the Company’s statutory severance obligations for its active employees located in the Caribbean Basin and Central America, and $5.8 million (October 2, 2011 - $6.4 million) related to the pension liability assumed in connection with the acquisition of Gold Toe Moretz in fiscal 2011.
Provisions of $13.0 million as at September 30, 2012 increased by $4.8 million compared to $8.2 million at the end of fiscal 2011. The increase is due primarily to a provision of $4.5 million related to decommissioning and site-restoration liabilities recorded in connection with the acquisition of Anvil.
CASH FLOWS
Cash flows from operating activities in fiscal 2012 were $219.6 million compared to cash flows from operating activities of $163.6 million for the previous year. Despite significantly lower net earnings this year due primarily to the net loss that was reported in the first quarter of fiscal 2012, operating cash flows increased by $56.0 million in fiscal 2012 when compared to last year primarily as a result of lower increases in non-cash working capital balances. The increase in non-cash working capital for fiscal 2012 negatively impacted operating cash flows by $23.1 million compared with a negative impact of $118.4 million for fiscal 2011. The year-over-year variance in working capital was due mainly to the impact during fiscal 2012 of changes in cotton prices on average inventory costs, with declining prices resulting in a significant decrease in inventories during fiscal 2012, while increasing cotton prices during fiscal 2011 contributed to an increase in inventories at the end of last year. The positive impact of the decrease in inventories was partially offset by the negative impact on operating cash flows of the decrease in accounts payable as a result of declining cotton costs, as well as the increase in accounts receivable as noted in the “Financial Condition” section of this annual MD&A.
Cash flows used in investing activities were $162.0 million in fiscal 2012, compared to $488.0 million in fiscal 2011. Cash flows used in investing activities in fiscal 2012 included cash outflows for the acquisition of Anvil of $87.4 million combined with capital spending of $76.8 million. Cash flows used in investing activities in fiscal 2011 included cash outflows for the acquisition of Gold Toe Moretz of $342.4 million combined with capital spending of $160.0 million, partially offset by proceeds on the disposal of a corporate asset of $13.2 million. For fiscal 2012, capital additions included expenditures primarily for our Rio Nance 5 textile facility and our biomass energy project in Honduras as noted under the “Financial Condition” section of this annual MD&A. For fiscal 2011, capital additions consisted primarily of the construction of our Rio Nance 5 textile facility, as well as expenditures related to the ramp-up of our Rio Nance 4 sock facility, our biomass energy project in Honduras, and other capacity expansion projects.
GILDAN 2012 REPORT TO SHAREHOLDERS P.19
| | MANAGEMENT’S DISCUSSION AND ANALYSIS |
Free cash flow totalled $145.0 million in fiscal 2012 compared to $18.0 million for the same period last year, due to the higher operating cash flows as noted above, and lower capital expenditures. Free cash flow for fiscal 2012 exceeded the Company’s previous estimate of free cash flow in excess of $100 million provided on August 2, 2012 primarily as a result of the lower than anticipated working capital requirements and capital expenditures. Free cash flow is comprised of cash flows from operating activities, including net changes in non-cash working capital balances, less cash used in investing activities, excluding business acquisitions. See the heading entitled “Free Cash Flow” under the section entitled “Definition and Reconciliation of Non-GAAP Measures” in this annual MD&A.
Cash flows used in financing activities in fiscal 2012 amounted to $69.1 million compared to cash flows from financing activities of $155.6 million in fiscal 2011. Net cash flows used in financing activities in fiscal 2012 reflected a net reduction of amounts drawn on our revolving long-term credit facility of $28.0 million, compared to an increase in funds drawn on the revolving long-term credit facility of $209.0 million for the same period last year which reflected funds that were utilized to finance the acquisition of Gold Toe Moretz. The Company paid an aggregate of $36.6 million of dividends during fiscal 2012 for dividends declared in November 2011, February 2012, May 2012, and August 2012. During fiscal 2011, the Company only paid three quarterly dividends due to the timing of the Company’s initiation of its quarterly dividend in fiscal 2011. The Company also repurchased and cancelled 0.4 million common shares during fiscal 2011 for a total cost of $10.5 million under our normal course issuer bid. During fiscal 2012, the Company purchased common shares of Gildan on the open market for an amount totaling $6.0 million compared to $2.2 million in fiscal 2011, for the purpose of settling the vesting of non-Treasury RSUs in lieu of cash.
LIQUIDITY AND CAPITAL RESOURCES
In recent years, we have funded our operations and capital requirements with cash generated from operations. A revolving long-term credit facility has been periodically utilized to finance seasonal peak working capital requirements and business acquisitions, including our acquisition of Anvil in May 2012 and Gold Toe Moretz in April 2011. Our primary uses of funds on an ongoing basis are for working capital requirements, capital expenditures, and payment of dividends. In addition, we may also use funds for business acquisitions.
We have a committed revolving long-term credit facility of $800 million, on an unsecured basis. Amounts drawn under the facility during fiscal 2012 bore interest at a variable banker’s acceptance or U.S. LIBOR-based interest rate plus a spread ranging from 125 to 200 basis points. As at September 30, 2012, $181 million (October 2, 2011 – $209 million) was drawn under this facility bearing an effective interest rate for the period of 2.2%, including the impact of interest rate swaps. In addition, an amount of $6.0 million (October 2, 2011 - $5.8 million) has been committed against this facility to cover various letters of credit.In November 2012, we amended the revolving long-term credit facility to extend the maturity date from June 2016 to January 2018. The amended agreement provides for an annual extension clause, subject to the approval of the lenders. It also provides for a reduction in drawn pricing when the net debt to EBITDA ratio is below 1.0:1, and reduced undrawn pricing. Amounts drawn under the facility now bear interest at a variable banker’s acceptance or U.S. LIBOR-based interest rate plus a spread ranging from 100 to 200 basis points.
Total indebtedness as at September 30, 2012 was $181.0 million compared to $209.0 million as at October 2, 2011. We ended the year with net indebtedness of $110.6 million compared to net indebtedness of $127.0 million as at the end of fiscal 2011, as the excess of free cash flows over cash requirements for acquisitions and divided payments was used to reduce our level of net indebtedness. Total indebtedness is comprised of bank indebtedness and long-term debt (including the current portion), and net indebtedness is calculated as total indebtedness net of cash and cash equivalents as described under the section entitled “Definition and Reconciliation of Non-GAAP measures” in this annual MD&A.
As disclosed in note 12 to the 2012 audited annual consolidated financial statements, the Company is required to comply with certain covenants including maintenance of a net debt to trailing twelve months
GILDAN 2012 REPORT TO SHAREHOLDERS P.20
| | MANAGEMENT’S DISCUSSION AND ANALYSIS |
EBITDA ratio below 3.0:1, although the credit agreement provides that this limit may be exceeded in the short term under certain circumstances, as well as an interest coverage ratio of at least 3.5:1. EBITDA is defined under the facility as net earnings before interest, income taxes, depreciation and amortization, with adjustments for certain non-recurring items. As at September 30, 2012, the Company was in compliance with these covenants.
Gildan is currently projecting capital expenditures for fiscal 2013 of approximately $200 million, including a total of approximately $85 million for yarn-spinning investments. The balance of the fiscal 2013 capital expenditure program is primarily for expansion of textile capacity in Honduras, including the carry-over of expenditures from fiscal 2012 for Rio Nance 5 and the refurbishment of Rio Nance 1, as well as for expansion of distribution capacity, including the construction of a new distribution centre in Honduras and continued investments in biomass projects.
We expect that cash flows from operating activities and the unutilized financing capacity under our revolving long-term credit facility will continue to provide us with sufficient liquidity for the foreseeable future to fund our organic growth strategy, including anticipated working capital and capital expenditure requirements, to fund dividends to shareholders, as well as provide us with financing flexibility to take advantage of potential acquisition opportunities which complement our organic growth strategy.
The Company, upon approval from its Board of Directors, may issue or repay long-term debt, issue or repurchase shares, or undertake other activities as deemed appropriate under the specific circumstances.
OUTSTANDING SHARE DATA
Our common shares are listed on the New York Stock Exchange (NYSE) and the Toronto Stock Exchange (TSX) under the symbol GIL. As at November 30, 2012 there were 121,612,283 common shares issued and outstanding along with 1,233,323 stock options and 877,514 dilutive restricted share units (Treasury RSUs) outstanding. Each stock option entitles the holder to purchase one common share at the end of the vesting period at a pre-determined option price. Each Treasury RSU entitles the holder to receive one common share from treasury at the end of the vesting period, without any monetary consideration being paid to the Company. However, the vesting of at least 50% of each Treasury RSU grant is contingent on the achievement of performance conditions that are primarily based on the Company’s average return on assets performance for the period as compared to the S&P/TSX Capped Consumer Discretionary Index, excluding income trusts, or as determined by the Board of Directors.
DECLARATION OF DIVIDEND
During fiscal 2012, the Company paid dividends of $36.6 million. On November 28, 2012, the Board of Directors approved a 20% increase in the amount of the current quarterly dividend and declared a cash dividend of $0.09 per share for an expected aggregate payment of $10.9 million which will be paid on January 7, 2013 on all of the issued and outstanding common shares of the Company, rateably and proportionately to the holders of record on December 13, 2012. This dividend is an “eligible dividend” for the purposes of the Income Tax Act (Canada) and any other applicable provincial legislation pertaining to eligible dividends.
The Board of Directors consider several factors when deciding to declare quarterly cash dividends, including the Company’s present and future earnings, cash flows, capital requirements and present and/or future regulatory and legal restrictions. There can be no assurance as to the declaration of future quarterly cash dividends. Although the Company’s revolving long-term credit facility requires compliance with lending covenants in order to pay dividends, these covenants are not currently, and are not expected to be, a constraint to the payment of dividends under the Company’s dividend policy.
GILDAN 2012 REPORT TO SHAREHOLDERS P.21
| | MANAGEMENT’S DISCUSSION AND ANALYSIS |
NORMAL COURSE ISSUER BID
In December 2011, the Company implemented a normal course issuer bid to repurchase for cancellation up to one million outstanding common shares of the Company on the TSX and the NYSE representing approximately 0.8% of its issued and outstanding common shares, in accordance with the requirements of the TSX (the “NCIB”). During fiscal 2012, there were no repurchases under the NCIB. The Company did not renew the NCIB which expired on December 5, 2012.
LEGAL PROCEEDINGS
Securities class actions
In June 2008, the Company and certain of its senior officers were named as defendants in a number of class action lawsuits filed in the United States District Court for the Southern District of New York, which were subsequently consolidated, alleging claims under the U.S. securities laws, as well as in class action lawsuits filed in the Ontario Superior Court of Justice and in the Quebec Superior Court. Each of these U.S. and Canadian lawsuits alleged, among other things, that the defendants misrepresented the Company’s financial condition and its financial prospects in its earnings guidance concerning the 2008 fiscal year, which guidance was subsequently revised on April 29, 2008.
In August 2010, the Company entered into an agreement to settle all claims raised in these class action lawsuits and final court approval of the settlement was obtained from each of the courts in February and March 2011. Consequently, all of the actions have been dismissed. The settlement agreement provided for a total settlement amount of $22.5 million, which was entirely funded by the Company’s insurers. Therefore no provision has been recorded in the consolidated financial statements and no amounts have been disbursed by the Company in respect of the settlement.
Claims and litigation
On October 12, 2012, Russell Brands, LLC, an affiliate of Fruit of the Loom, filed a lawsuit against the Company in the United States District Court of the Western District of Kentucky at Bowling Green, alleging trademark infringement and unfair competition and seeking injunctive relief and unspecified money damages. The litigation concerns labelling errors on certain inventory products shipped by Gildan to one of its customers. Upon being made aware of the error, the Company took immediate action to retrieve the disputed products. The Company believes that the value of the products in dispute is immaterial.
OUTLOOK
A discussion of management’s expectations as to our outlook for fiscal 2013 is contained in our fourth quarter earnings results press release dated November 29, 2012 under the sections entitled “Fiscal 2013 Guidance” and “Fiscal 2013 Cash Flow”. The press release is available on the SEDAR website atwww.sedar.com, on the EDGAR website atwww.sec.govand on our website atwww.gildan.com.
FINANCIAL RISK MANAGEMENT
This section of the MD&A provides disclosures relating to the nature and extent of the Company’s exposure to risks arising from financial instruments, including credit risk, liquidity risk, foreign currency risk and interest rate risk, as well as risks arising from commodity prices, and how the Company manages those risks. The disclosures under this section, in conjunction with the information in note 16 to the 2012 audited annual consolidated financial statements, are designed to meet the requirements of IFRS 7,Financial Instruments: Disclosures, and are therefore incorporated into, and are an integral part of, the 2012 audited annual consolidated financial statements.
The Company may periodically use derivative financial instruments to manage risks related to fluctuations in foreign exchange rates, commodity prices and interest rates. Derivative financial instruments are not used for trading purposes.
GILDAN 2012 REPORT TO SHAREHOLDERS P.22
| | MANAGEMENT’S DISCUSSION AND ANALYSIS |
CREDIT RISK
Credit risk is the risk of an unexpected loss if a customer or counterparty to a financial instrument fails to meet its contractual obligations, and arises primarily from the Company’s trade receivables. The Company may also have credit risk relating to cash and cash equivalents, forward foreign exchange contracts, zero-cost collar options and interest rate swaps, which it manages by dealing only with highly-rated North American and European financial institutions. Our trade receivables and credit exposure fluctuate throughout the year based on the seasonality of our sales and other factors. The Company’s average trade receivables and credit exposure during an interim reporting period may be significantly higher than the balance at the end of that reporting period.
The Company’s credit risk for trade receivables is concentrated, as the majority of its sales are to a relatively small group of wholesale distributors within the Printwear segment and mass-market retailers within the Branded Apparel segment. As at September 30, 2012, the Company’s ten largest trade debtors accounted for 56% of trade accounts receivable, of which one wholesale customer within the Printwear segment accounted for 9% and one mass-market retailer within the Branded Apparel segment accounted for 11%. Of the Company’s top ten trade debtors, seven are in the Printwear segment, three are in the Branded Apparel segment and all ten are located in the United States. The remaining trade receivable balances are dispersed among a larger number of debtors across many geographic areas including the United States, Canada, Europe, Mexico and the Asia-Pacific region.
Most sales are invoiced with payment terms of between 30 to 60 days. In accordance with industry practice, sales to wholesale distributors of certain seasonal products, primarily in the second half of the fiscal year, are invoiced with extended payment terms, generally not exceeding six months. From time-to-time, the Company may initiate other special incentive programs with extended payment terms.
Most of the Company’s customers have been transacting with the Company or its subsidiaries for several years. Many distributors and other customers in the Printwear segment are highly-leveraged with significant reliance on trade credit terms provided by a few major vendors, including the Company, and third-party debt financing, including bank debt secured with accounts receivable and inventory pledged as collateral. The financial leverage of these customers may limit or prevent their ability to refinance existing indebtedness or to obtain additional financing, and could affect their ability to comply with restrictive debt covenants and meet other obligations. The profile and credit quality of the Company’s customers in the Branded Apparel segment varies significantly. Adverse changes in a customer’s financial condition could cause us to limit or discontinue business with that customer, require us to assume more credit risk relating to that customer’s future purchases or result in uncollectible accounts receivable from that customer. Future credit losses relating to any one of our top ten customers could be material and could result in a material charge to earnings.
The Company’s extension of credit to customers involves considerable judgment and is based on an evaluation of each customer’s financial condition and payment history. The Company has established various internal controls designed to mitigate credit risk, including a dedicated credit function which recommends customer credit limits and payment terms that are reviewed and approved on a quarterly basis by senior management at the Company’s sales offices in Barbados and Charleston, South Carolina. Where available, the Company’s credit departments periodically review external ratings and customer financial statements, and in some cases obtain bank and other references. New customers are subject to a specific vetting and pre-approval process. From time to time, the Company will temporarily transact with customers on a prepayment basis where circumstances warrant. While the Company’s credit controls and processes have been effective in mitigating credit risk, these controls cannot eliminate credit risk and there can be no assurance that these controls will continue to be effective, or that the Company’s low credit loss experience will continue.
The Company’s exposure to credit risk for trade receivables by geographic area and operating segment was as follows as at:
GILDAN 2012 REPORT TO SHAREHOLDERS P.23
| | MANAGEMENT’S DISCUSSION AND ANALYSIS |
| (in $ millions) | | September 30, 2012 | | | October 2, 2011 | | | October 4, 2010 | |
Trade receivables by geographic area: | | | | | | | | | |
United States | | 237.5 | | | 163.3 | | | 118.4 | |
Canada | | 5.1 | | | 8.2 | | | 6.4 | |
Europe and other | | 18.0 | | | 20.1 | | | 20.9 | |
Total trade receivables | | 260.6 | | | 191.6 | | | 145.7 | |
| | | | | | | | | |
Trade receivables by operating segment: | | | | | | | | | |
Printwear | | 142.5 | | | 118.0 | | | 96.3 | |
Branded Apparel | | 118.1 | | | 73.6 | | | 49.4 | |
Total trade receivables | | 260.6 | | | 191.6 | | | 145.7 | |
| | | | | | | | | | |
| The aging of trade receivable balances was as follows as at: | |
| | | | | | | | | | |
| (in $ millions) | | September 30, 2012 | | | October 2, 2011 | | | October 4, 2010 | |
Not past due | | 226.6 | | | 166.9 | | | 129.1 | |
Past due 0-30 days | | 32.9 | | | 21.0 | | | 17.5 | |
Past due 31-60 days | | 3.0 | | | 2.8 | | | 3.5 | |
Past due 61-120 days | | 1.2 | | | 1.4 | | | 1.2 | |
Past due over 121 days | | 1.4 | | | 3.6 | | | 1.4 | |
Trade receivables | | 265.1 | | | 195.7 | | | 152.7 | |
Less allowance for doubtful accounts | | (4.5 | ) | | (4.1 | ) | | (7.0 | ) |
Total trade receivables | | 260.6 | | | 191.6 | | | 145.7 | |
LIQUIDITY RISK
Liquidity risk is the risk that the Company will not be able to meet its financial obligations as they fall due. We require continued access to capital markets to support our operations as well as to achieve our strategic plans. We rely on cash resources, debt and cash flows generated from operations to satisfy our financing requirements. Any impediments to our ability to continue to meet the covenants and conditions contained in our revolving long-term credit facility as well as our ability to access capital markets, or the failure of a financial institution participating in our revolving long-term credit facility, or an adverse perception in capital markets of our financial condition or prospects, could have a material impact on our financing capability. In addition, our access to financing at reasonable interest rates could become influenced by the economic and credit market environment.
We manage liquidity risk through the management of our capital structure and financial leverage, as outlined in note 26 to the 2012 audited annual consolidated financial statements. In addition, we manage liquidity risk by continuously monitoring actual and projected cash flows, taking into account the seasonality of our sales and receipts. We also monitor the impact of credit market conditions in the current environment. The Board of Directors reviews and approves the Company’s operating and capital budgets, as well as transactions such as the declaration of dividends, the initiation of share repurchase programs, mergers, acquisitions and other major investments or divestitures.
Off-balance sheet arrangements and maturity analysis of contractual obligations
In the normal course of business, we enter into contractual obligations that will require us to disburse cash over future periods. All commitments have been reflected in our consolidated statements of financial position except for operating leases and other purchase obligations including minimum annual lease payments under operating leases for premises, equipment, aircraft and minimum royalty payments, which are included in the table of contractual obligations that follows. The following table sets forth the maturity of our contractual obligations by period for the following items as at September 30, 2012, excluding derivative financial instruments and future interest payments:
GILDAN 2012 REPORT TO SHAREHOLDERS P.24
| | MANAGEMENT’S DISCUSSION AND ANALYSIS |
| | | Carrying | | | Contractual | | | Less than 1 | | | 1 to 3 | | | 4 to 5 | | | More than 5 | |
| (in $ millions) | | amount | | | cash flows | | | fiscal year | | | fiscal years | | | fiscal years | | | fiscal years | |
| | | | | | | | | | | | | | | | | | | |
Accounts payable and accrued liabilities | | 256.4 | | | 256.4 | | | 256.4 | | | - | | | - | | | - | |
Long-term debt | | 181.0 | | | 181.0 | | | - | | | 181.0 | | | - | | | - | |
Purchase obligations | | - | | | 131.1 | | | 131.1 | | | - | | | - | | | - | |
Operating leases and other obligations | | - | | | 140.3 | | | 26.7 | | | 75.4 | | | 32.8 | | | 5.4 | |
Total contractual obligations | | 437.4 | | | 708.8 | | | 414.2 | | | 256.4 | | | 32.8 | | | 5.4 | |
As disclosed in note 25 to our 2012 audited annual consolidated financial statements, we have granted corporate guarantees, irrevocable standby letters of credit and surety bonds to third parties to indemnify them in the event the Company and some of its subsidiaries do not perform their contractual obligations. As at September 30, 2012, the maximum potential liability under these guarantees was $16.5 million, of which $6.9 million was for surety bonds and $9.6 million was for corporate guarantees and standby letters of credit.
Derivative financial instruments
The Company may periodically use derivative financial instruments to manage risks related to fluctuations in exchange rates, commodity prices and interest rates. Derivative financial instruments are not used for speculative purposes. As at September 30, 2012, the Company had forward foreign exchange contracts outstanding in order to minimize the exposure of forecasted cash inflows and outflows in currencies other than the U.S. dollar. Please refer to note 16 to the 2012 audited annual consolidated financial statements for a description of the maturities, carrying values and fair values of the derivative financial instruments outstanding as at September 30, 2012.
FOREIGN CURRENCY RISK
The majority of the Company’s cash flows and financial assets and liabilities are denominated in U.S. dollars, which is the Company’s functional and reporting currency. Foreign currency risk is limited to the portion of the Company’s business transactions denominated in currencies other than U.S. dollars, primarily for sales and distribution expenses for customers outside of the United States, and head office expenses in Canada. The Company’s exposure relates primarily to changes in the U.S. dollar versus the Canadian dollar, the British pound, the Euro, the Australian dollar and the Mexican peso exchange rates. For the Company’s foreign currency transactions, fluctuations in the respective exchange rates relative to the U.S. dollar will create volatility in the Company’s cash flows and the reported amounts for sales and SG&A expenses in its consolidated statements of earnings and comprehensive income, both on a period-to-period basis and compared with operating budgets and forecasts. Additional earnings variability arises from the translation of monetary assets and liabilities denominated in currencies other than the U.S. dollar at the rates of exchange at each reporting dates, the impact of which is reported as a foreign exchange gain or loss and included in financial expense (income) in the statements of earnings and comprehensive income.
The Company also incurs a portion of its manufacturing costs in foreign currencies, primarily payroll costs paid in Honduran Lempiras. The Lempira to U.S. dollar exchange rate has not fluctuated significantly in recent years. However, should there be a change in the Lempira to U.S. dollar exchange rate in the future, such change may have an impact on our operating results.
The Company’s objective in managing its foreign currency risk is to minimize its net exposures to foreign currency cash flows, by transacting with third parties in U.S. dollars to the maximum extent possible and practical, and holding cash and cash equivalents and incurring borrowings in U.S. dollars. The Company monitors and forecasts the values of net foreign currency cash flows, and from time-to-time will authorize the use of derivative financial instruments such as forward foreign exchange contracts, and zero-cost collar
GILDAN 2012 REPORT TO SHAREHOLDERS P.25
| | MANAGEMENT’S DISCUSSION AND ANALYSIS |
options to economically hedge a portion of foreign currency cash flows, with maturities of up to two years. The Company had forward foreign exchange contracts outstanding as at September 30, 2012 consisting primarily of contracts to sell or buy Euros, British pounds, Australian dollars, Canadian dollars, and Mexican pesos in exchange for U.S. dollars. These outstanding contracts and other foreign exchange contracts that were settled during fiscal 2012 were designated as cash flow hedges and qualified for hedge accounting. We refer the reader to note 16 to the 2012 audited annual consolidated financial statements for details of these financial derivative contracts and the impact of applying hedge accounting.
The following tables provide an indication of the Company’s significant foreign currency exposures included in the consolidated statement of financial position as at September 30, 2012 arising from financial instruments:
| | | September 30, 2012 | |
| (in U.S. $ millions) | | CAD | | | EUR | | | GBP | | | MXN | | | AUD | |
Cash and cash equivalents | | 16.0 | | | 1.1 | | | 1.2 | | | 0.6 | | | 1.1 | |
Trade accounts receivable | | 4.8 | | | 2.8 | | | 2.9 | | | 6.3 | | | 3.2 | |
Accounts payable and accrued liabilities | | (24.9 | ) | | (2.8 | ) | | (0.3 | ) | | - | | | - | |
Based on the Company’s foreign currency exposures arising from financial instruments noted above, and the impact of outstanding derivative financial instruments designated as effective hedging instruments, varying the foreign exchange rates to reflect a 5 percent strengthening of the U.S. dollar would have increased (decreased) net earnings and other comprehensive income as follows, assuming that all other variables remained constant:
| | | For the year ended September 30, 2012 | |
| (in U.S. $ millions) | | CAD | | | EUR | | | GBP | | | MXN | | | AUD | |
Impact on net earnings before income taxes | | 0.2 | | | (0.1 | ) | | (0.2 | ) | | (0.3 | ) | | (0.2 | ) |
Impact on other comprehensive income before income taxes | | 1.3 | | | 2.1 | | | 1.2 | | | 0.1 | | | 0.4 | |
An assumed 5 percent weakening of the U.S. dollar during the year ended September 30, 2012 would have had an equal but opposite effect on the above currencies to the amounts shown above, on the basis that all other variables remain constant.
COMMODITY RISK FOR COTTON
The Company is subject to the commodity risk of cotton prices and cotton price movements, as the majority of its products are made of 100% cotton or blends of cotton and synthetic fibres. The Company purchases cotton-based yarn from third party yarn manufacturers as well as from its yarn-spinning joint venture, CanAm. The Company assumes the risk of cotton price fluctuations for these yarn purchases. The Company enters into contracts, up to eighteen months in advance of future delivery dates, to establish fixed prices for its cotton and cotton yarn purchases in order to reduce the effects of fluctuations in the cost of cotton used in the manufacture of its products. These contracts are not used for trading purposes, and are not considered to be financial instruments that would need to be accounted for at fair value in the Company’s consolidated financial statements. Without taking into account the impact of fixed price contracts, a change of $0.01 per pound in cotton prices would affect the Company’s annual raw material costs by approximately $4 million, based on estimated production levels for fiscal 2013.
The Company has the ability to enter into derivative financial instruments, including market-traded cotton futures and option contracts, to manage its exposure to movements in commodity prices. Such contracts would be accounted for at fair value in the consolidated financial statements in accordance with the accounting standards applicable to financial instruments. At the end of fiscal 2012 and 2011, the Company had no significant cotton related derivative financial instruments outstanding.
GILDAN 2012 REPORT TO SHAREHOLDERS P.26
| | MANAGEMENT’S DISCUSSION AND ANALYSIS |
INTEREST RATE RISK
The Company’s interest rate risk is primarily related to the Company’s revolving long-term credit facility, for which amounts drawn are primarily subject to LIBOR rates in effect at the time of borrowing, plus a margin. Although LIBOR-based borrowings under the credit facility can be fixed for periods of up to six months, the Company generally fixes rates for periods of one to three months. The interest rates on amounts drawn on this facility and on any future borrowings will vary and are unpredictable. Increases in short term interest rates and increases in interest rates on new debt issues may result in a material increase in interest charges.
The Company has the ability to enter into derivative financial instruments that would effectively fix its cost of current and future borrowings for an extended period of time. As at September 30, 2012, the Company had interest rate swap contracts outstanding to fix the variable interest rates on the designated interest payments of a portion of the borrowings under the revolving long-term credit facility, which were designated as cash flows hedges and qualified for hedge accounting. We refer the reader to note 16 to the 2012 audited annual consolidated financial statements for details of the interest rate swap contracts and the impact of applying hedge accounting.
Based on the value of interest-bearing financial instruments during the year ended September 30, 2012, an assumed 0.5 percentage point increase in interest rates during such period would have increased (decreased) net earnings and other comprehensive income as follows:
| (in $ millions) | | For the year ended September 30, 2012 | |
Impact on net earnings before income taxes | | (1.1 | ) |
Impact on other comprehensive income before income taxes | | 2.2 | |
An assumed 0.5 percentage point decrease in interest rates would have had an equal but opposite effect on net earnings and other comprehensive income to the amounts shown above.
CRITICAL ACCOUNTING ESTIMATES AND JUDGMENTS
Our significant accounting policies are described in note 3 to our 2012 audited annual consolidated financial statements. The preparation of financial statements in conformity with IFRS requires management to make estimates and assumptions that affect the application of accounting policies and the reported amounts of assets, liabilities, income and expenses. Actual results may differ from these estimates.
Estimates and underlying assumptions are reviewed on an ongoing basis. Revisions to accounting estimates are recognized in the period in which the estimates are revised and in any future periods affected. We have not made any significant changes to our estimates in the past two years.
CRITICAL JUDGMENTS IN APPLYING ACCOUNTING POLICIES
The following are critical judgements that management has made in the process of applying accounting policies and that have the most significant effect on the amounts recognized in the consolidated financial statements:
Determination of cash-generating units (CGUs)
The identification of CGUs and grouping of assets into the respective CGUs is based on currently available information about actual utilization experience and expected future business plans. Management has taken into consideration various factors in identifying its CGUs including how the Company manages and monitors its operations, which is essentially based on operating segments that are organized by the major customer markets they serve. As such, the Company has identified its CGUs for purposes of testing the
GILDAN 2012 REPORT TO SHAREHOLDERS P.27
| | MANAGEMENT’S DISCUSSION AND ANALYSIS |
recoverability and impairment of non-financial assets to be the same as the segments used for financial reporting purposes, which are the Printwear and Branded Apparel operating segments.
Income taxes
The Company’s income tax provisions and income tax assets and liabilities are based on interpretations of applicable tax laws, including income tax treaties between various countries in which the Company operates as well as underlying rules and regulations with respect to transfer pricing. These interpretations involve judgments and estimates and may be challenged through government taxation audits that the Company is regularly subject to. New information may become available that causes the Company to change its judgment regarding the adequacy of existing income tax assets and liabilities; such changes will impact net earnings in the period that such a determination is made.
KEY SOURCES OF ESTIMATION UNCERTAINTY
Key sources of estimation uncertainty that have a significant risk of resulting in a material adjustment to the carrying amount of assets and liabilities within the next financial year are as follows:
Allowance for doubtful accounts
The Company makes an assessment of whether accounts receivable are collectable, which takes into account the credit-worthiness of each customer in order to estimate an appropriate allowance for doubtful accounts. Furthermore, these estimates must be continuously evaluated and updated. The Company is not able to predict changes in the financial condition of its customers, and if circumstances related to its customers’ financial condition deteriorate, the estimates of the recoverability of trade accounts receivable could be materially affected and the Company may be required to record additional allowances. Alternatively, if the Company provides more allowances than needed, a reversal of a portion of such allowances in future periods may be required based on actual collection experience.
Inventory valuation
The Company regularly reviews inventory quantities on hand and records a provision for those inventories no longer deemed to be fully recoverable. The cost of inventories may no longer be recoverable if those inventories are slow moving, damaged, if they have become obsolete, or if their selling prices or estimated forecast of product demand decline. If actual market conditions are less favorable than previously projected, or if liquidation of the inventory no longer deemed to be fully recoverable is more difficult than anticipated, additional provisions may be required.
Business combinations
Business combinations are accounted for in accordance with the acquisition method. On the date that control is obtained, the identifiable assets, liabilities and contingent liabilities of the acquired company are measured at their fair value. Depending on the complexity of determining these valuations, the Company uses appropriate valuation techniques which are generally based on a forecast of the total expected future net discounted cash flows. These valuations are linked closely to the assumptions made by management regarding the future performance of the related assets and the discount rate applied.
Recoverability and impairment of non-financial assets
The calculation of value in use for purposes of measuring the recoverable amount of non-financial asset involves the use of significant assumptions and estimates with respect to a variety of factors, including expected sales, gross margins, SG&A expenses, capital expenditures, cash flows and the selection of an appropriate discount rate, all of which are subject to inherent uncertainties and subjectivity. The assumptions are based on annual business plans and other forecasted results as well as discount rates which are used to reflect market based estimates of the risks associated with the projected cash flows, based on the best information available as of the date of the impairment test. Changes in circumstances, such as technological advances, adverse changes in third party licensing arrangements, changes to the Company’s business strategy, and changes in economic conditions can result in actual useful lives and future cash flows differing significantly from estimates and could result in increased charges for amortization or impairment. Revisions to the estimated useful lives of finite life non-financial assets or
GILDAN 2012 REPORT TO SHAREHOLDERS P.28
| | MANAGEMENT’S DISCUSSION AND ANALYSIS |
future cash flows constitute a change in accounting estimate and are applied prospectively. There can be no assurance that the estimates and assumptions used in the impairment tests will prove to be accurate predictions of the future. If the future adversely differs from management’s best estimate of key economic assumptions, and if associated cash flows materially decrease, the Company may be required to record material impairment charges related to its non-financial assets.
Measurement of the estimate of expected expenditures for decommissioning and site restoration costs
The measurement of the provision for decommissioning and site restoration costs requires assumptions to be made including expected timing of the event which would result in the outflow of resources, the range of possible methods of decommissioning and site restoration, and the expected costs that would be incurred to settle any decommissioning and site restoration liabilities. The Company has measured the provision using the present value of the expected expenditures which requires assumptions on the discount rate to use. Revisions to any of the assumptions and estimates used by management may result in changes to the expected expenditures to settle the liability which would require adjustments to the provision which may have an impact on the operating results of the Company in the period the change occurs.
Income taxes
The Company recognizes deferred income tax assets for unused tax losses, and deductible temporary differences only to the extent that, in management’s opinion, it is probable that future taxable profit will be available against which available tax losses and temporary differences can be utilized. The Company’s projections of future taxable profit involve the use of significant assumptions and estimates with respect to a variety of factors, including future sales and operating expenses. There can be no assurance that the estimates and assumptions used in our projections of future taxable income will prove to be accurate predictions of the future, and in the event that our assessment of the recoverability of these deferred tax assets changes in the future, a material reduction in the carrying value of these deferred tax assets could be required, with a corresponding charge to net earnings.
ACCOUNTING POLICIES AND NEW ACCOUNTING STANDARDS NOT YET APPLIED
ACCOUNTING POLICIES
For periods beginning on or after October 2, 2011, the Company has adopted IFRS as issued by the International Accounting Standards Board (IASB) for the preparation of its consolidated financial statements. The comparative figures for the fiscal year ended October 2, 2011 have been recast to comply with IFRS. See note 29 to the 2012 audited consolidated financial statements for details on the reconciliations of the Company’s financial statements from previous Canadian GAAP to IFRS. The Company applied the accounting policies described in note 3 to the 2012 audited consolidated financial statements.
NEW ACCOUNTING STANDARDS AND INTERPRETATIONS NOT YET APPLIED
A number of new accounting standards, and amendments to accounting standards and interpretations, are not yet effective for the year ending September 30, 2012, and have not been applied in preparing the audited annual consolidated financial statements. These include:
Financial instruments
In October 2010, the IASB released IFRS 9, Financial Instruments, which is the first part of a three-part project to replace IAS 39, Financial Instruments: Recognition and Measurement. This first part only covers classification and measurement of financial assets and financial liabilities, with impairment of financial assets and hedge accounting being addressed in the other two parts.
IFRS 9 uses a single approach to determine whether a financial asset is measured at amortized cost or fair value, replacing the multiple rules in IAS 39. The approach in IFRS 9 is based on how an entity manages
GILDAN 2012 REPORT TO SHAREHOLDERS P.29
| | MANAGEMENT’S DISCUSSION AND ANALYSIS |
its financial instruments and the contractual cash flow characteristics of the financial assets. Most of the requirements in IAS 39 for classification and measurement of financial liabilities were carried forward in IFRS 9. However, requirements for measuring a financial liability at fair value have changed, as the portion of the changes in fair value related to the entity’s own credit risk must be presented in other comprehensive income rather than in net earnings. IFRS 9 will be effective for the Company’s fiscal year beginning on October 5, 2015, with earlier application permitted. The Company has not yet assessed the impact of the adoption of this standard on its consolidated financial statements.
Consolidation
In May 2011, the IASB released IFRS 10, Consolidated Financial Statements, which replaces SIC-12, Consolidation - Special Purpose Entities, and parts of IAS 27, Consolidated and Separate Financial Statements. The new standard builds on existing principles by identifying the concept of control as the determining factor in whether an entity should be included in a company’s consolidated financial statements. The standard provides additional guidance to assist in the determination of control where it is difficult to assess. IFRS 10 will be effective for the Company’s fiscal year beginning on September 30, 2013, with earlier application permitted. The Company has not yet assessed the impact of the adoption of this standard on its consolidated financial statements.
Joint arrangements
In May 2011, the IASB released IFRS 11, Joint Arrangements, which supersedes IAS 31, Interests in Joint Ventures, and SIC-13, Jointly Controlled Entities - Non-monetary Contributions by Venturers. IFRS 11 focuses on the rights and obligations of a joint arrangement, rather than its legal form as is currently the case under IAS 31. The standard addresses inconsistencies in the reporting of joint arrangements by requiring the equity method to account for interests in joint ventures. IFRS 11 will be effective for the Company’s fiscal year beginning on September 30, 2013, with earlier application permitted. The Company has not yet assessed the impact of the adoption of this standard on its consolidated financial statements.
Disclosure of interests in other entities
In May 2011, the IASB released IFRS 12, Disclosure of Interests in Other Entities. IFRS 12 is a new and comprehensive standard on disclosure requirements for all forms of interests in other entities, including subsidiaries, joint arrangements, associates, and unconsolidated structured entities. The standard requires an entity to disclose information regarding the nature and risks associated with its interests in other entities and the effects of those interests on its financial position, financial performance and cash flows. IFRS 12 will be effective for the Company’s fiscal year beginning on September 30, 2013, with earlier application permitted. The Company has not yet assessed the impact of the adoption of this standard on its consolidated financial statements.
Fair value measurement
In May 2011, the IASB released IFRS 13, Fair value measurement. IFRS 13 will improve consistency and reduce complexity by providing a precise definition of fair value and a single source of fair value measurement and disclosure requirements for use across IFRS. The standard will be effective for the Company’s fiscal year beginning on September 30, 2013, with earlier application permitted. The Company has not yet assessed the impact of the adoption of this standard on its consolidated financial statements.
Financial statement presentation
In June 2011, the IASB amended IAS 1, Presentation of Financial Statements. The principal change resulting from the amendments to IAS 1 is a requirement to group together items within other comprehensive income that may be reclassified to the statement of income. The amendments also reaffirm existing requirements that items in other comprehensive income and net income should be presented as either a single statement or two consecutive statements. The amendments to IAS 1 will be effective for the Company’s fiscal year beginning on October 1, 2012. As the amendments only require changes in the presentation of items in other comprehensive income, the Company does not expect the amendments to the standard to have a material impact on its consolidated financial statements.
GILDAN 2012 REPORT TO SHAREHOLDERS P.30
| | MANAGEMENT’S DISCUSSION AND ANALYSIS |
Employee benefits
In June 2011, the IASB amended IAS 19, Employee Benefits. Amongst other changes, the amendments require entities to compute the financing cost component of defined benefit plans by applying the discount rate used to measure post-employment benefit obligations to the net post-employment benefit obligations (usually, the present value of defined benefit obligations less the fair value of plan assets). Furthermore, the amendments to IAS 19 enhance the disclosure requirements for defined benefit plans, providing additional information about the characteristics of defined benefit plans and the risks that entities are exposed to through participation in those plans. The amendment to IAS 19 will be effective for the Company’s fiscal years beginning on September 30, 2013, with earlier application permitted. The Company has not yet assessed the impact of the adoption of the amendments on its consolidated financial statements.
RELATED PARTY TRANSACTIONS
We purchase a portion of our yarn requirements from our yarn spinning joint venture, CanAm, which as at September 30, 2012 was a jointly-controlled entity over which the Company exercises joint control. The purchase of yarn from CanAm is in the normal course of operations and is measured at the exchange amounts, which is the amount of consideration established and agreed to by the related parties. For fiscal 2012, total purchases of yarn from CanAm were $126.1 million compared to $142.6 million in fiscal 2011. As at September 30, 2012, the Company had an outstanding payable to CanAm of $2.0 million compared to $3.3 million as of October 2, 2011. The Company also had a note receivable from CanAm of $3.9 million which was fully reimbursed during the third quarter of fiscal 2012. During the first quarter of fiscal 2013, we completed the acquisition of the remaining 50% of CanAm. We also lease warehouse and office space from an officer of a subsidiary of the Company under operating leases. The payments made on these leases are in accordance with the terms of the lease agreements established and agreed to by the related parties, which amounted to $0.9 million for fiscal 2012, compared to $0.6 million for fiscal 2011. There were no amounts owing as at September 30, 2012 and October 2, 2011.
DISCLOSURE CONTROLS AND PROCEDURES
As stated in the Canadian Securities Administrators’ National Instrument 52-109,Certification of Disclosure in Issuers’ Annual and Interim Filings, disclosure controls and procedures means controls and other procedures of an issuer that are designed to provide reasonable assurance that information required to be disclosed by the issuer in its annual filings, interim filings or other reports filed or submitted by it under securities legislation is recorded, processed, summarized and reported within the time periods specified in the securities legislation and include controls and procedures designed to ensure that information required to be disclosed by an issuer in its annual filings, interim filings or other reports filed or submitted under securities legislation is accumulated and communicated to the issuer’s management, including its certifying officers, as appropriate to allow timely decisions regarding required disclosure.
An evaluation was carried out under the supervision of, and with the participation of, our management, including our Chief Executive Officer and our Chief Financial Officer, of the effectiveness of our disclosure controls and procedures as at September 30, 2012. For the year ended September 30, 2012, management’s evaluation of the effectiveness of its disclosure controls and procedures excluded the disclosure controls and procedures of Anvil, a subsidiary acquired by the Company in an acquisition consummated on May 9, 2012, the results of which are included in the audited annual consolidated financial statements of the Company for the year ended September 30, 2012, to the extent Anvil’s disclosure controls and procedures are subsumed by internal control over financial reporting. The consolidated results of the Company for the year ended September 30, 2012 include net sales of $86.1 million and net earnings of $2.1 million relating to Anvil’s results of operations since the date of acquisition. Anvil accounted for approximately $96.4 million of current assets, $26.1 million of non-current assets, $34.6 million of current liabilities and $5.1 million of non-current liabilities, in the Company’s audited consolidated statement of financial position as at September 30, 2012. Based on that evaluation, which excluded Anvil’s disclosure controls and procedures, our Chief Executive Officer and our Chief Financial Officer concluded that our disclosure controls and procedures were effective as of the end of such period.
GILDAN 2012 REPORT TO SHAREHOLDERS P.31
| | MANAGEMENT’S DISCUSSION AND ANALYSIS |
Canadian and U.S. securities regulations and related interpretations allow issuers to limit the scope of the design and evaluation of disclosure controls and procedures of a business that an issuer acquired not more than 365 days before the last day of the period covered by the Company’s filings.
INTERNAL CONTROL OVER FINANCIAL REPORTING
Management’s annual report on internal control over financial reporting
Our management is responsible for establishing and maintaining adequate internal control over financial reporting, as such term is defined in Rules 13(a)-15(f) and 15(d)-15(f) under the U.S. Securities Exchange Act of 1934.
Our internal control over financial reporting includes those policies and procedures that: (1) pertain to the maintenance of records that, in reasonable detail, accurately and fairly reflect the transactions and dispositions of our assets; (2) provide reasonable assurance that transactions are recorded as necessary to permit preparation of financial statements in accordance with generally accepted accounting principles, and that our receipts and expenditures are being made only in accordance with authorization of our management and directors; and (3) provide reasonable assurance regarding prevention or timely detection of unauthorized acquisition, use or disposition of our assets that could have a material effect on the financial statements.
Under the supervision and with the participation of our Chief Executive Officer and our Chief Financial Officer, management conducted an evaluation of the effectiveness of our internal control over financial reporting, as at September 30, 2012, based on the framework set forth inInternal Control-Integrated Framework issued by the Committee of Sponsoring Organizations of the Treadway Commission (COSO). For the year ended September 30, 2012, management’s evaluation of internal control over financial reporting excluded the internal control over financial reporting of Anvil, a subsidiary acquired by the Company in an acquisition consummated on May 9, 2012, the results of which are included in the audited annual consolidated financial statements of the Company for the year ended September 30, 2012. Based on that evaluation, which excluded Anvil’s internal control over financial reporting, our Chief Executive Officer and our Chief Financial Officer concluded that our internal control over financial reporting was effective as of that date.
Canadian and U.S. securities regulations and related interpretations allow issuers to limit the evaluation of internal control over financial reporting of a business that an issuer acquired not more than 365 days before the last day of the period covered by the Company’s filings.
Attestation report of independent registered public accounting firm
KPMG LLP, an independent registered public accounting firm, which audited and reported on our financial statements in this Report to Shareholders, has issued an unqualified attestation report on the effectiveness of our internal control over financial reporting as at September 30, 2012.
Changes in internal control over financial reporting
There have been no changes during fiscal 2012 in our internal control over financial reporting that have materially affected, or are reasonably likely to materially affect, our internal control over financial reporting.
The design of any system of controls and procedures is based in part upon certain assumptions about the likelihood of certain events. There can be no assurance that any design will succeed in achieving its stated goals under all potential future conditions, regardless of how remote.
GILDAN 2012 REPORT TO SHAREHOLDERS P.32
| | MANAGEMENT’S DISCUSSION AND ANALYSIS |
RISKS AND UNCERTAINTIES
In addition to the risks previously described under the sections “Financial Risk Management”, “Critical Accounting Estimates and Judgments”, and those described elsewhere in this annual MD&A, this section describes the principal risks that could have a material and adverse effect on our financial condition, results of operations or business, cash flows or the trading price of our common shares, as well as cause actual results to differ materially from our expectations expressed in or implied by our forward-looking statements. The risks listed below are not the only risks that could affect the Company. Additional risks and uncertainties not currently known to us or that we currently deem to be immaterial may also materially and adversely affect our financial condition, results of operations, cash flows or business.
Our ability to implement our strategies and plans
The growth of our business depends on the successful execution of our key strategic initiatives, specifically to maximize market share penetration in printwear markets, leverage our successful business model to further penetrate the mass-market retail channel, continue to generate manufacturing and distribution cost reductions, and continue to evaluate opportunities to reinvest cash flows. We may not be able to successfully implement our growth strategy in the future, including growing our market share in the U.S., where we currently have the majority of our sales, and in further penetrating international printwear markets. Success factors may be different and economic returns may be lower in new market channels and new geographical markets which the Company enters. In addition, we may not be successful in further developing our company-owned brands and obtaining and successfully introducing new programs in the U.S. retail channel, including increasing our sales of underwear and activewear to retailers, or achieving targeted levels of profitability in our Branded Apparel segment. Failure to develop new business in new market channels or new geographical markets will limit our opportunities for growth. Also, there can be no assurance that we do not encounter operational issues that may affect or disrupt our production or supply chain or that we will be successful in optimizing our manufacturing and distribution cost reduction initiatives. In addition, our ability to generate cash flows from operations will depend on the success we have in executing our key strategic initiatives, which in turn will ultimately impact our ability to reinvest cash flows or distribute cash flows to our shareholders. We may be unable to identify acquisition targets, successfully integrate a newly acquired business, or achieve expected synergies from such integration.
Our ability to compete effectively
The markets for our products are highly competitive. Competition is generally based upon price, with reliable quality and service also being critical requirements for success. Our competitive strengths include our expertise in building and operating large-scale, vertically-integrated, strategically-located manufacturing hubs which has allowed us to operate efficiently and reduce costs, offer competitive pricing, and a reliable supply chain. There can be no assurance that we will be able to maintain our low cost manufacturing and distribution structure, and remain competitive in the areas of price, quality, service, and marketing. In addition, there can be no assurance that the level and intensity of competition will not increase, or that competitors will not improve their competitive position relative to Gildan’s. Any changes in our ability to compete effectively in the future may result in the loss of customers to competitors, reduction in customer orders or shelf space, lower prices, the need for customer price incentives and other forms of marketing support to our customers, all of which could have an adverse effect on our profitability if we are unable to offset such negative impact with new business or cost reductions.
Our ability to integrate acquisitions
The Company’s strategic opportunities include the potential reinvestment of cash into complementary acquisitions that could support, strengthen or expand our business. The integration of newly acquired businesses may prove to be more challenging, take more time than originally anticipated and result in significant additional costs and/or operational issues, all of which could adversely affect our financial condition and results of operations. In addition, we may not be able to fully realize expected synergies and other benefits.
GILDAN 2012 REPORT TO SHAREHOLDERS P.33
| | MANAGEMENT’S DISCUSSION AND ANALYSIS |
Adverse changes in general economic conditions
Although we manufacture basic, non-fashion, continuous replenishment products used by consumers in a wide variety of applications, general economic and financial conditions, globally or in one or more of the markets we serve, may adversely affect our business. If there is a decline in economic growth and in consumer and commercial activity, and/or if adverse financial conditions exist in the credit markets, as in the case of the global credit crisis in 2008 and 2009, this may lead to lower demand for our products resulting in sales volume reductions and lower selling prices, and may cause us to operate at levels below our optimal production capacity, which would result in higher unit production costs, all of which could adversely affect our profitability and reduce cash flows from operations. Weak economic and financial conditions could also negatively affect the financial condition of our customers, which could result in lower sales volumes and increased credit risk. The nature and extent of the Company’s credit risks are described under the section “Financial Risk Management”.
Our reliance on a small number of significant customers
We rely on a small number of customers for a significant portion of our total sales. In fiscal 2012 our largest and second largest customers accounted for 14.8% and 12.0% (2011 – 19.4% and 12.1%) of total sales respectively, and our top ten customers accounted for 58.1% (2011 – 63.5%) of total sales. We expect that these customers will continue to represent a significant portion of our sales in the future.
Future sales volumes and profitability could be adversely affected should one or more of the following events occur:
- a significant customer substantially reduces its purchases or ceases to buy from us, or Gildan elects to reduce its volume of business with or cease to sell to a significant customer, and we cannot replace that business with sales to other customers on similar terms;
- a large customer exercises its purchasing power to negotiate lower prices or to require Gildan to incur additional service and other costs;
- further industry consolidation leads to greater customer concentration and competition; and
- a large customer encounters financial difficulties and is unable to meet its financial obligations.
Our customers do not commit to purchase minimum quantities
Our contracts with our customers do not require them to purchase a minimum quantity of our products or commit to minimum shelf space allocation for our products. If any of our customers experience a significant business downturn or fail to remain committed to our products, they may reduce or discontinue purchases from us. Although we have maintained long-term relationships with many of our wholesale distributor and retail customers, there can be no assurance that historic levels of business from any of our customers will continue in the future.
Our ability to anticipate evolving consumer preferences and trends
While we currently focus on basic, non-fashion products, the apparel industry, particularly within the retail channel, is subject to evolving consumer preferences and trends. Our success may be negatively impacted by changes in consumer preferences which do not fit with Gildan’s core competency of marketing and large-scale manufacturing of basic, non-fashion apparel products. If we are unable to successfully anticipate, identify or react to changing styles or trends or misjudge the market for our products, our sales could be negatively impacted and we may be faced with unsold inventory which could adversely impact our profitability.
Our ability to manage production and inventory levels effectively in relation to changes in customer demand
Demand for our products may vary from year to year. We aim to appropriately balance our production and inventory with our ability to meet market demand. Based on discussions with our customers and internally generated projections reflecting our analysis of factors impacting industry demand, we produce and carry finished goods inventory to meet the expected demand for delivery of specific product categories. If, after producing and carrying inventory in anticipation of deliveries, demand is significantly less than expected, we may have to carry inventory for extended periods of time, or sell excess inventory at reduced prices.
GILDAN 2012 REPORT TO SHAREHOLDERS P.34
| | MANAGEMENT’S DISCUSSION AND ANALYSIS |
In either case, our profits would be reduced. Excess inventory could also result in lower production levels, resulting in lower plant and equipment utilization and lower absorption of fixed operating costs. Alternatively, we are also exposed to loss of sales opportunities and market share, if we produce insufficient inventory to satisfy our customers’ demand for specific product categories as a result of underestimating market demand or not meeting production targets, in which case our customers could seek to fulfill their product needs from competitors and reduce the amount of business they do with us.
Fluctuations and volatility in the price of raw materials used to manufacture our products
Cotton and polyester fibers are the primary raw materials used in the manufacture of our products. We also use chemicals, dyestuffs and trims which we purchase from a variety of suppliers. The price of cotton fluctuates and is affected by weather, consumer demand, speculation in the commodities market, the relative valuations and fluctuations of the currencies of producer versus consumer countries and other factors that are generally unpredictable and beyond our control. In addition, fluctuations in crude oil or petroleum prices affect our energy consumption costs and can also influence transportation costs and the cost of related items used in our business, such as polyester fibers, chemicals, dyestuffs and trims. As discussed under the heading entitled “Commodity Risk” in the “Financial Risk Management” section of this annual MD&A, the Company purchases cotton and polyester fibers through its yarn-spinning facilities, and also purchases processed cotton yarn and blended yarn from outside vendors, at prices that are correlated with the price of cotton and polyester fibers. The Company may enter into contracts up to eighteen months in advance of future delivery dates to establish fixed prices for cotton and cotton yarn purchases and reduce the effect of price fluctuations in the cost of cotton used in the manufacture of its products. For future delivery periods where such fixed price contracts have been entered into, the Company will be protected against cotton price increases but would not be able to benefit from cotton price decreases. Conversely, in the event that we have not entered into sufficient fixed priced contracts for cotton or have not made other arrangements to lock in the price of cotton yarn in advance of delivery, we will not be protected against cotton price increases, but will be in a position to benefit from any cotton price decreases. A significant increase in raw material costs, particularly cotton costs, could have a material adverse effect on our business, results of operations and financial condition, if the increase or part of the increase is not mitigated through additional manufacturing and distribution cost reductions and/or higher selling prices, or if resulting selling price increases adversely impact demand for the Company’s products. In addition, when the Company fixes its cotton costs for future delivery periods and the cost of cotton subsequently decreases significantly for that delivery period, the Company may need to reduce selling prices, which could adversely impact the Company’s results of operations.
Our dependence on key suppliers
Our ability to meet our customers’ needs depends on our ability to maintain an uninterrupted supply of raw materials and finished goods from third party suppliers. More specifically, we source cotton and polycotton yarns primarily from the United States and from a limited number of outside suppliers. In addition, the majority of the products sold by our recently acquired Gold Toe Moretz subsidiary are purchased from a number of third party suppliers in Asia. Our business, financial condition or results of operations could be adversely affected if there is a significant change in our relationship with any of our principal suppliers of yarn or finished goods, or if any of these key suppliers have difficulty sourcing cotton fibers and other raw materials, experience production disruptions, fail to maintain production quality, experience transportation disruptions or encounter financial difficulties. These events can result in lost sales, cancellation charges or excessive markdowns, all of which can adversely affect our business, financial condition or results of operations.
Climate, political, social and economic risks in the countries in which we operate or from which we source production
The majority of our products are manufactured in Central America, primarily in Honduras and the Caribbean Basin, and to a lesser extent in Bangladesh, as described in the section entitled “Our Operations”. As a result of the acquisition of Gold Toe Moretz we are now purchasing significant volumes of finished goods from third party suppliers in Asia. Some of the countries in which we operate or source from have experienced political, social and economic instability in the past, and we cannot be certain of their future stability. In addition, most of our facilities are located in geographic regions that are exposed to
GILDAN 2012 REPORT TO SHAREHOLDERS P.35
| | MANAGEMENT’S DISCUSSION AND ANALYSIS |
the risk of, and have experienced in the past, hurricanes, floods and earthquakes, and any such events in the future could have a material adverse impact on our business.
The following conditions or events could disrupt our supply chain, interrupt production at our facilities or those of our suppliers, materially increase our cost of sales and other operating expenses, result in material asset losses, or require additional capital expenditures to be incurred:
- fires, pandemics, extraordinary weather conditions or natural disasters, such as hurricanes, tornadoes, floods, tsunamis and earthquakes;
- political instability, labour unrest, war or terrorism;
- disruptions in shipping and freight forwarding services;
- interruptions in the availability of basic services and infrastructure, including power and water shortages.
We rely on certain international trade agreements and preference programs and are subject to evolving international trade regulations
As a multinational corporation, we are affected by international trade legislation, bilateral and multilateral trade agreements and trade preference programs in the countries in which we operate, source and sell products. In order to remain globally competitive, we have strategically positioned our manufacturing facilities to take advantage of a number of trade liberalization measures, providing us duty free access to many of our markets. Such measures are advantageous because of the otherwise generally high duty rates that apply to apparel products in many countries. The Company relies on a number of preferential trade programs which provide duty free access to the U.S. market, including the Caribbean Basin Trade Partnership Act and the Dominican Republic – Central America – United States Free Trade Agreement. The Company relies on similar arrangements to access the European Union, Canada and other markets. Changes to trade agreements or trade preference programs that the Company currently relies on may negatively impact our global competitive position. The likelihood that the agreements and preference programs around which we have built our manufacturing supply chain will be modified, repealed, or allowed to expire, and the extent of the impact of such changes on our business, cannot be determined with certainty.
Most trade agreements provide for the application of safeguards in the form of reinstatement of normal duties if increased imports cause or threaten to cause substantial injury to a domestic industry. The likelihood that a safeguard will be adopted and the extent of its impact on our business cannot be determined with certainty.
In 2012, the United States implemented free trade agreements with South Korea, Colombia and Panama and has also continued free trade negotiations with a group of countries under the umbrella of the TransPacific Partnership ("TPP"). Countries participating in the TPP negotiations at this time are Australia, Brunei, Canada, Chile, Mexico, Malaysia, New Zealand, Peru, Singapore and Vietnam. The United States’ entry into new free trade agreements may negatively affect our competitive position in the United States. Overall, new agreements or arrangements that further liberalize access to our key developed country markets could potentially impact our competiveness in those markets negatively. The likelihood that any such agreements, measures or programs will be adopted, modified, repealed, or allowed to expire, and the extent of the impact of such changes on our business, cannot be determined with certainty.
In addition, the Company is subject to customs audits and origin verifications in the various countries in which it operates. Although we believe that our customs compliance programs are effective, we cannot predict the outcome of any governmental audit.
In recent years, governmental bodies have responded to the increased threat of terrorist activity by requiring greater levels of inspection of imported goods and imposing security requirements on importers, carriers and others in the global supply chain. These added requirements can sometimes cause delays and increase costs in bringing imported goods to market. We believe we have effectively addressed these requirements in order to maximize velocity in our supply chain, but changes in security requirements or tightening of security procedures, for example, in the aftermath of a terrorist incident, could cause delays in our goods reaching the markets in which we distribute our products.
GILDAN 2012 REPORT TO SHAREHOLDERS P.36
| | MANAGEMENT’S DISCUSSION AND ANALYSIS |
Factors or circumstances that could increase our effective income tax rate
The Company benefits from a low overall effective corporate tax rate as the majority of its profits are earned and the majority of its sales, marketing and manufacturing operations are carried out in low tax rate jurisdictions in Central America and the Caribbean Basin. The Company’s income tax filing positions and income tax provisions are based on interpretations of applicable tax laws, including income tax treaties between various countries in which the Company operates as well as underlying rules and regulations with respect to transfer pricing. These interpretations involve judgments and estimates and may be challenged through government taxation audits that the Company is regularly subject to. Although the Company believes its tax filing positions are sustainable, we cannot predict with certainty the outcome of any audit undertaken by taxation authorities in any jurisdictions in which we operate, and the final result may vary compared to the estimates and assumptions used by management in determining the Company’s consolidated income tax provision and in valuing its income tax assets and liabilities. Depending on the ultimate outcome of any such audit, there may be a material adverse impact on the Company’s financial condition, results of operations and cash flows. In addition, if the Company were to receive a tax reassessment by a taxation authority prior to the ultimate resolution of an audit, the Company could be required to submit an advance deposit on the amount reassessed.
The Company’s overall effective income tax rate may also be adversely affected by the following: unanticipated changes to current domestic laws in the countries in which the Company operates; changes to the income tax treaties the Company currently relies on; an increase in income and withholding tax rates; changes to free trade and export processing zone rules in certain countries where the Company is currently not subject to income tax; and, a higher proportion of the Company’s overall profits being earned in higher tax rate jurisdictions due to changes in the locations of the Company’s operations, changes in the mix of profits between operating segments or other factors.
We have not recognized a deferred income tax liability for the undistributed profits of our subsidiaries, as we currently have no intention to repatriate these profits. If our expectations or intentions change in the future, we could be required to recognize a charge to earnings for the tax liability relating to the undistributed profits of our subsidiaries, which could also result in a corresponding cash outflow in the years in which the earnings would be repatriated. As at September 30, 2012, the estimated income taxes payable that would result in the event of a full repatriation of these undistributed profits is approximately $28 million.
Compliance with environmental, health and safety regulations
We are subject to various federal, state and local environmental laws and regulations in the jurisdictions in which we operate concerning, among other things, wastewater discharges, storm water flows, and solid waste disposal. Our manufacturing plants generate small quantities of hazardous waste, which are either recycled or disposed of by licensed waste management companies. Through our Corporate Environmental Policy, Environmental Code of Practice and Environmental Management System, we seek not only to comply with applicable laws and regulations, but also to reduce our environmental footprint through waste prevention, recovery and treatment. Although we believe that we are in compliance in all material respects with the regulatory requirements of those jurisdictions in which our facilities are located, the extent of our liability, if any, for past failures to comply with laws, regulations and permits applicable to our operations cannot be reasonably determined.
In line with our commitment to the environment, as well as to the health and safety of our employees, we incur capital and other expenditures each year that are aimed at achieving compliance with current environmental standards and applicable occupational health and safety laws and regulations. For fiscal 2012, the environmental protection requirements with regard to the Company’s operations did not have a significant financial or operational impact on the Company's capital expenditures, earnings and competitive position. Although we do not expect that the amount of these expenditures in the future will have a material adverse effect on our operations, financial condition or liquidity, future changes in federal, state, or local regulations, interpretations of existing regulations or the discovery of currently unknown problems or conditions may result in substantial additional environmental remediation expenditures, negative publicity which could harm our reputation, or a disruption to our supply chain, which could have a material adverse effect on our business.
GILDAN 2012 REPORT TO SHAREHOLDERS P.37
| | MANAGEMENT’S DISCUSSION AND ANALYSIS |
Our significant reliance on our information systems for our business operations
We place significant reliance on our information systems, including our JD Edwards Enterprise Resource Planning (ERP) system. We are in the process of upgrading our ERP system to the current release. We depend on our information systems to purchase raw materials and supplies, schedule and manage production, process transactions, summarize results, respond to customer inquiries, manage inventories and ship goods on a timely basis to our customers. There can be no assurance that we will not experience operational problems with our information systems as a result of system failures, viruses, security breaches, disasters or other causes, or in connection with the implementation of the upgrade to our ERP system. In addition, there can be no assurance that we will be able to timely modify or adapt our systems to meet evolving requirements for our business. Any material disruption or slowdown of our systems could cause operational delays and other impacts that could have a material adverse effect on our business.
Adverse changes in third party licensing arrangements and licensed brands
A number of products are designed, manufactured, sourced and sold under trademarks that we license from third parties, under contractual licensing relationships that are subject to periodic renewal, such as Under Armour® and New Balance® branded socks. Because we do not control the brands licensed to us, our licensors could make changes to their brands or business models that could result in a significant downturn in a brand’s business, adversely affecting our sales and results of operations. If any licensor fails to adequately maintain or protect their trademarks, engages in behaviour with respect to the licensed marks that would cause us reputational harm, or if any of the brands licensed to us violates the trademark rights of a third party or are deemed to be invalid or unenforceable, we could experience a significant downturn in that brand’s business, adversely affecting our sales and results of operations, and we may be required to expend significant amounts on public relations, advertising, legal and other termination costs. In addition, if any of these licensors chooses to cease licensing these brands to us in the future, our sales and results of operations would be adversely affected.
Our ability to protect our intellectual property rights
Our trademarks are important to our marketing efforts and have substantial value. We aggressively protect these trademarks from infringement and dilution through appropriate measures, including court actions and administrative proceedings; however, the actions we have taken to establish and protect our trademarks and other intellectual property may not be adequate. We cannot be certain that others will not imitate our products or infringe our intellectual property rights. Infringement or counterfeiting of our products could diminish the value of our brands or otherwise adversely affect our business. In addition, unilateral actions in the United States or other countries, such as changes to or the repeal of laws recognizing trademark or other intellectual property rights, could have an impact on our ability to enforce those rights.
From time to time we are involved in opposition and cancellation proceedings with respect to our intellectual property, which could affect its validity, enforceability and use. The value of our intellectual property could diminish if others assert rights in, or ownership of, or oppose our applications to register, our trademarks and other intellectual property rights. In some cases, there may be trademark owners who have prior rights to our trademarks or to similar trademarks, which could harm our ability to sell products under or register such trademarks. In addition, we have registered trademarks in certain foreign jurisdictions and the laws of foreign countries may not protect our intellectual property rights to the same extent as do the laws of the United States. We do not own trademark rights to all of our brands in all jurisdictions, which may limit the future sales growth of certain branded products in such jurisdictions. Furthermore, actions we have taken to protect our intellectual property rights may not be adequate to prevent others from seeking to invalidate our trademarks or block sales of our products as a violation of the trademarks and intellectual property rights of others.
In some cases, litigation may be necessary to protect our trademarks and other intellectual property rights, to enforce our rights or defend against claims by third parties alleging that we infringe, dilute, misappropriate or otherwise violate third party trademark or other intellectual property rights. Any litigation or claims brought by or against us, whether with or without merit, and whether successful or not, could result in substantial costs and diversion of our resources, which could adversely affect our business, financial condition, results of operation and cash flows. Any intellectual property litigation claims against us
GILDAN 2012 REPORT TO SHAREHOLDERS P.38
| | MANAGEMENT’S DISCUSSION AND ANALYSIS |
could result in the loss or compromise of our intellectual property rights, could subject us to significant liabilities, require us to seek licenses on unfavorable terms, if available at all, and/or require us to rebrand our products and services, any of which could adversely affect our business, financial condition, results of operations and cash flows.
Changes in our relationship with our employees or changes to domestic and foreign employment regulations
We employ approximately 30,000 employees worldwide. As a result, changes in domestic and foreign laws governing our relationships with our employees, including wage and human resources laws and regulations, fair labour standards, overtime pay, unemployment tax rates, workers’ compensation rates and payroll taxes, would likely have a direct impact on our operating costs. The vast majority of our employees are employed outside of Canada and the United States. A significant increase in wage rates in the countries in which we operate could have a material impact on our operating costs.
The Company has historically been able to operate in a productive manner in all of its manufacturing facilities without experiencing significant labour disruptions, such as strikes or work stoppages. Some of our employees are members of labour organizations and, with the acquisition of Anvil on May 9, 2012, we are now a party to collective bargaining agreements at our Anvil sewing facilities in Honduras and Nicaragua. In connection with its textile operations in the Dominican Republic, the Company was previously a party to a collective bargaining agreement with a union registered with the Dominican Ministry of Labor, covering approximately 900 employees. The collective bargaining agreement was terminated in February 2011 upon the mutual consent of the Company and the union, although the union is still claiming to represent a majority of the factory workers. A second union is also claiming that it represents the majority of the workers at the plant and the matter is now before the Dominican Republic Labour Court. Notwithstanding the termination of the agreement, the Company is continuing to provide all of the benefits to the employees covered by the original agreement. If labour relations were to change or deteriorate at any of our facilities or any of our third-party contractors’ facilities, this could adversely affect the productivity and cost structure of the Company’s manufacturing operations.
Negative publicity as a result of violation in local labour laws or international labour standards, unethical labour and other business practices
We are committed to ensuring that all of our operations comply with our strict internal Code of Conduct, local and international laws, and the codes and principles to which we subscribe, including those of Worldwide Responsible Accredited Production (WRAP) and the Fair Labor Association (FLA). While the majority of our manufacturing operations are conducted through company-owned facilities, we also utilize third-party contractors, which we do not control, to complement our vertically-integrated production. If one of our own manufacturing operations or one of our third-party contractors or sub-contractors violates or is accused of violating local or international labour laws or other applicable regulations, or engages in labour or other practices that would be viewed, in any market in which our products are sold, as unethical, we could suffer negative publicity which could harm our reputation and result in a loss of sales.
Our dependence on key management and our ability to attract and/or retain key personnel
Our success depends upon the continued contributions of our key management, some of whom have unique talents and experience and would be difficult to replace in short order. The loss or interruption of the services of a key executive could have a material adverse effect on our business during the transitional period that would be required to restructure the organization or for a successor to assume the responsibilities of the key management position. Our future success will also depend on our ability to attract and retain key managers, sales people and other personnel. We may not be able to attract or retain these employees, which could adversely affect our business.
Product safety regulation
We are subject to consumer product safety laws and regulations that could affect our business. In the United States, we are subject to theConsumer Product Safety Act, as amended by theConsumer Product Safety Improvement Actof 2008, to theFederal Hazardous Substances Act, to theFlammable Fabrics Act,
GILDAN 2012 REPORT TO SHAREHOLDERS P.39
| | MANAGEMENT’S DISCUSSION AND ANALYSIS |
and to the rules and regulations promulgated pursuant to such statutes. Such laws provide for substantial penalties for non-compliance. These statutes and regulations include requirements for testing and certification for flammability of wearing apparel, for lead content and lead in surface coatings in children’s products, and for phthalate content in child care articles, including plasticized components of children’s sleepwear. As of December 31, 2011, the Consumer Product Safety Commission (the “CPSC”) lifted its stay of enforcement with respect to phthalate testing and certification, and is actively enforcing all of the requirements listed above. In addition, we are also subject to similar laws and regulations in the various individual states in which our products are sold.
In Canada, we are subject to similar laws and regulations, the most significant of which are theHazardous Products Act(the “HPA”) and theCanada Consumer Product Safety Act(the “CCPSA”). The CCPSA came into force on June 20, 2011. It is aimed at emphasizing industry's responsibility to provide safe products, strengthening enforcement authorities, providing more and better information for the public, improving the safety of imported products, ensuring better record keeping, and instituting mandatory reporting. Regulations currently in place under the HPA will be incorporated into the CCPSA or, where necessary because of structural differences between the two statutes, replaced by new CCPSA regulations. For example, the CCPSA’sChildren’s Sleepwear Regulationsreplaced the HPA’sHazardous Products (Children's Sleepwear) Regulations. The CCPSA also provides for new regulations, such as the textile flammability regulations. As under U.S. laws, surface coatings and phthalates are also regulated under the CCPSA.
In the European Union, we are also subject to product safety regulations, the most significant of which are imposed pursuant to theGeneral Product Safety Directive. We are also subject to similar laws and regulations in the other jurisdictions in which our products are sold.
Compliance with existing and future product safety laws and regulations and enforcement policies may require that we incur capital and other costs, which may be significant. Non-compliance with applicable product safety laws and regulations may result in substantial fines and penalties, costs related to the recall, replacement and disposal of non-compliant products, as well as negative publicity which could harm our reputation and result in a loss of sales. Our customers may also require us to meet existing and additional consumer safety requirements, which may result in our inability to provide the products in the manner required. Although we believe that we are in compliance in all material respects with applicable product safety laws and regulations in the jurisdictions in which we operate, the extent of our liability, if any, for past failure to comply with laws, regulations and permits applicable to our operations cannot be reasonably determined.
Litigation and/or regulatory actions
Our business involves the risk of legal and regulatory actions regarding such matters as product liability, employment practices, trademark infringement, bankruptcies and other claims. Due to the inherent uncertainties of litigation or regulatory actions in both domestic and foreign jurisdictions, we cannot accurately predict the ultimate outcome of any such proceedings. These proceedings could cause us to incur costs and may require us to devote resources to defend against these claims and could ultimately result in a loss against these claims or other remedies such as product recalls, which could adversely affect our financial condition and results of operations.
As part of the regulatory and legal environments in which we operate, Gildan is subject to anti-bribery laws that prohibit improper payments directly or indirectly to government officials, authorities or persons defined in those anti-bribery laws in order to obtain business or other improper advantages in the conduct of business. Failure by our employees, subcontractors, suppliers, agents and/or partners to comply with anti-bribery laws could impact Gildan in various ways that include, but are not limited to, criminal, civil and administrative legal sanctions, negative publicity, and could have a significant adverse impact on Gildan’s results.
Data security and privacy breaches
Our business involves the regular collection and use of sensitive and confidential information regarding customers and employees. These activities are highly regulated and privacy and information security laws are complex and constantly changing. Non-compliance with these laws and regulations can lead to legal
GILDAN 2012 REPORT TO SHAREHOLDERS P.40
| | MANAGEMENT’S DISCUSSION AND ANALYSIS |
liability. Furthermore, despite the security measures we have in place, any actual or perceived information security breach, whether due to "cyber attack", computer viruses or human error, could lead to damage to our reputation and a resulting material adverse effect on our financial condition and results of operations.
DEFINITION AND RECONCILIATION OF NON-GAAP MEASURES
We use non-GAAP measures to assess our operating performance and financial condition. The terms and definitions of the non-GAAP measures used in this report and a reconciliation of each non-GAAP measure to the most directly comparable GAAP measure are provided below. The non-GAAP measures are presented on a consistent basis for all periods presented in this annual MD&A. These non-GAAP measures do not have any standardized meanings prescribed by IFRS and are therefore unlikely to be comparable to similar measures presented by other companies. Accordingly, they should not be considered in isolation.
Adjusted net earnings and adjusted diluted EPS
To measure our performance from one period to the next, without the variations caused by the impacts of restructuring and acquisition-related costs, net of related income tax recoveries, management uses adjusted net earnings and adjusted diluted earnings per share, which are calculated as net earnings and diluted earnings per share excluding these items. We exclude these items because they affect the comparability of our financial results and could potentially distort the analysis of trends in our business performance. Excluding these items does not imply they are necessarily non-recurring.
| (in $ millions, except per share amounts) | | 2012 | | | 2011 | |
Net earnings | | 148.5 | | | 234.2 | |
Adjustments for: | | | | | | |
Restructuring and acquisition-related costs | | 15.0 | | | 18.2 | |
Income tax recovery on restructuring and acquisition-related costs | | (6.2 | ) | | (5.5 | ) |
Adjusted net earnings | | 157.3 | | | 246.9 | |
| | | | | | |
Basic EPS | | 1.22 | | | 1.93 | |
Diluted EPS | | 1.22 | | | 1.91 | |
Adjusted diluted EPS | | 1.29 | | | 2.02 | |
| Certain minor rounding variances exist between the financial statements and this summary. | |
EBITDA
EBITDA is calculated as earnings before financial expenses, income taxes and depreciation and amortization and excludes the impact of restructuring and acquisition-related costs as well as the equity earnings in investment in joint venture. We use EBITDA, among other measures, to assess the operating performance of our business. We also believe this measure is commonly used by investors and analysts to measure a company’s ability to service debt and to meet other payment obligations, or as a common valuation measurement. We exclude depreciation and amortization expenses, which are non-cash in nature and can vary significantly depending upon accounting methods or non-operating factors such as historical cost. Excluding these items does not imply they are necessarily non-recurring.
GILDAN 2012 REPORT TO SHAREHOLDERS P.41
| | MANAGEMENT’S DISCUSSION AND ANALYSIS |
| (in $ millions) | | 2012 | | | 2011 | |
Net earnings | | 148.5 | | | 234.2 | |
Restructuring and acquisition-related costs | | 15.0 | | | 18.2 | |
Depreciation and amortization | | 94.6 | | | 74.1 | |
Financial expenses, net | | 11.6 | | | 6.1 | |
Income tax recovery | | (4.3 | ) | | (19.2 | ) |
Equity earnings in investment in joint venture | | (0.6 | ) | | (0.5 | ) |
EBITDA | | 264.8 | | | 312.9 | |
| Certain minor rounding variances exist between the financial statements and this summary. | |
Free cash flow
Free cash flow is defined as cash from operating activities including net changes in non-cash working capital balances, less cash flow used in investing activities excluding business acquisitions. We consider free cash flow to be an important indicator of the financial strength and performance of our business, because it shows how much cash is available after capital expenditures to repay debt and to reinvest in our business, and/or to redistribute to our shareholders. We believe this measure is commonly used by investors and analysts when valuing a business and its underlying assets.
(in $ millions) | | 2012 | | | 2011 | |
Cash flows from operating activities | | 219.6 | | | 163.6 | |
Cash flows used in investing activities | | (162.0 | ) | | (488.0 | ) |
Adjustment for: | | | | | | |
Business acquisitions | | 87.4 | | | 342.4 | |
Free cash flow | | 145.0 | | | 18.0 | |
| Certain minor rounding variances exist between the financial statements and this summary. | |
Total indebtedness and net indebtedness
Total indebtedness is comprised of bank indebtedness and long-term debt (including any current portion), and net indebtedness is calculated as total indebtedness net of cash and cash equivalents. We consider total indebtedness and net indebtedness to be important indicators of the financial leverage of the Company.
| (in $ millions) | | September 30, 2012 | | | October 2, 2011 | |
Long-term debt and total indebtedness | | 181.0 | | | 209.0 | |
Cash and cash equivalents | | (70.4 | ) | | (82.0 | ) |
Net indebtedness | | 110.6 | | | 127.0 | |
| Certain minor rounding variances exist between the financial statements and this summary. | |
GILDAN 2012 REPORT TO SHAREHOLDERS P.42
| | MANAGEMENT’S DISCUSSION AND ANALYSIS |
CAUTION REGARDING FORWARD-LOOKING STATEMENTS
Certain statements included in this MD&A constitute “forward-looking statements” within the meaning of the U.S.Private Securities Litigation Reform Act of 1995and Canadian securities legislation and regulations, and are subject to important risks, uncertainties and assumptions. This forward-looking information includes, amongst others, information with respect to our objectives and the strategies to achieve these objectives, as well as information with respect to our beliefs, plans, expectations, anticipations, estimates and intentions. Forward-looking statements generally can be identified by the use of conditional or forward-looking terminology such as “may”, “will”, “expect”, “intend”, “estimate”, “project”, “assume”, “anticipate”, “plan”, “foresee”, “believe” or “continue” or the negatives of these terms or variations of them or similar terminology. We refer you to the Company’s filings with the Canadian securities regulatory authorities and the U.S. Securities and Exchange Commission, as well as the risks described under the “Financial Risk Management” and “Risks and Uncertainties” sections of this MD&A, and the risks described under the “Critical Accounting Estimates and Judgments” section of this MD&A for a discussion of the various factors that may affect the Company’s future results. Material factors and assumptions that were applied in drawing a conclusion or making a forecast or projection are also set out throughout this document.
Forward-looking information is inherently uncertain and the results or events predicted in such forward-looking information may differ materially from actual results or events. Material factors, which could cause actual results or events to differ materially from a conclusion, forecast or projection in such forward-looking information, include, but are not limited to:
- our ability to implement our growth strategies and plans, including achieving market share gains, obtaining and successfully introducing new sales programs, implementing cost reduction initiatives and completing and successfully integrating acquisitions;
- the intensity of competitive activity and our ability to compete effectively;
- adverse changes in general economic and financial conditions globally or in one or more of the markets we serve;
- our reliance on a small number of significant customers;
- the fact that our customers do not commit contractually to minimum quantity purchases;
- our ability to anticipate changes in consumer preferences and trends;
- our ability to manage production and inventory levels effectively in relation to changes in customer demand;
- fluctuations and volatility in the price of raw materials used to manufacture our products, such as cotton and polyester fibres;
- our dependence on key suppliers and our ability to maintain an uninterrupted supply of raw materials and finished goods;
- the impact of climate, political, social and economic risks in the countries in which we operate or from which we source production;
- disruption to manufacturing and distribution activities due to such factors as operational issues, disruptions in transportation logistic functions, labour disruptions, political or social instability, bad weather, natural disasters, pandemics and other unforeseen adverse events;
- changes to international trade legislation that the Company is currently relying on in conducting its manufacturing operations or the application of safeguards thereunder;
- factors or circumstances that could increase our effective income tax rate, including the outcome of any tax audits or changes to applicable tax laws or treaties;
- compliance with applicable environmental, tax, trade, employment, health and safety, anti- corruption, privacy and other laws and regulations in the jurisdictions in which we operate;
- our significant reliance on computerized information systems for our business operations, including our JD Edwards Enterprise Resource Planning (ERP) system which is currently being upgraded to the latest system release, Enterprise One;
- changes in our relationship with our employees or changes to domestic and foreign employment laws and regulations;
GILDAN 2012 REPORT TO SHAREHOLDERS P.43
| | MANAGEMENT’S DISCUSSION AND ANALYSIS |
- negative publicity as a result of violation of local labour laws or international labour standards, or unethical labour or other business practices by the Company or one of its third-party contractors;
- our dependence on key management and our ability to attract and/or retain key personnel;
- changes to and failure to comply with consumer product safety laws and regulations;
- adverse changes in third party licensing arrangements and licensed brands;
- our ability to protect our intellectual property rights;
- changes in accounting policies and estimates;
- exposure to risks arising from financial instruments, including credit risk, liquidity risk, foreign currency risk and interest rate risk, as well as risks arising from commodity prices; and
- the adverse impact of any current or future legal and regulatory actions.
These factors may cause the Company’s actual performance and financial results in future periods to differ materially from any estimates or projections of future performance or results expressed or implied by such forward-looking statements. Forward-looking statements do not take into account the effect that transactions or non-recurring or other special items announced or occurring after the statements are made, may have on the Company’s business. For example, they do not include the effect of business dispositions, acquisitions, other business transactions, asset write-downs, asset impairment losses or other charges announced or occurring after forward-looking statements are made. The financial impact of such transactions and non-recurring and other special items can be complex and necessarily depends on the facts particular to each of them.
There can be no assurance that the expectations represented by our forward-looking statements will prove to be correct. The purpose of the forward-looking statements is to provide the reader with a description of management’s expectations regarding the Company’s future financial performance and may not be appropriate for other purposes. Furthermore, unless otherwise stated, the forward-looking statements contained in this report are made as of the date hereof, and we do not undertake any obligation to update publicly or to revise any of the included forward-looking statements, whether as a result of new information, future events or otherwise unless required by applicable legislation or regulation. The forward-looking statements contained in this report are expressly qualified by this cautionary statement.
December 7, 2012
GILDAN 2012 REPORT TO SHAREHOLDERS P.44
| CONSOLIDATED FINANCIAL STATEMENTS |
MANAGEMENT’S RESPONSIBILITY FOR FINANCIAL REPORTING
The accompanying consolidated financial statements have been prepared by management and approved by the Board of Directors of the Company. The consolidated financial statements were prepared in accordance with International Financial Reporting Standards and, where appropriate, reflect management’s best estimates and judgments. Where alternative accounting methods exist, management has chosen those methods deemed most appropriate in the circumstances. Management is responsible for the accuracy, integrity and objectivity of the consolidated financial statements within reasonable limits of materiality, and for maintaining a system of internal controls over financial reporting as described in “Management’s annual report on internal control over financial reporting” of the 2012 Annual Management’s Discussion and Analysis. Management is also responsible for the preparation and presentation of other financial information included in the 2012 Annual Report and its consistency with the consolidated financial statements.
The Audit and Finance Committee, which is appointed annually by the Board of Directors and comprised exclusively of independent directors, meets with management as well as with the independent auditors and internal auditors to satisfy itself that management is properly discharging its financial reporting responsibilities and to review the consolidated financial statements and the independent auditors’ report. The Audit and Finance Committee reports its findings to the Board of Directors for consideration in approving the consolidated financial statements for presentation to the shareholders. The Audit and Finance Committee considers, for review by the Board of Directors and approval by the shareholders, the engagement or reappointment of the independent auditors.
The consolidated financial statements have been independently audited by KPMG LLP, on behalf of the shareholders, in accordance with Canadian generally accepted auditing standards and the standards of the Public Company Accounting Oversight Board (United States). Their report outlines the nature of their audit and expresses their opinion on the consolidated financial statements of the Company. In addition, our auditors have issued an attestation report on the Company’s internal controls over financial reporting as at September 30, 2012. KPMG LLP has direct access to the Audit and Finance Committee of the Board of Directors.
| (Signed: Glenn J. Chamandy) | (Signed: Laurence G. Sellyn) |
| | |
| Glenn J. Chamandy | Laurence G. Sellyn |
| President and Chief Executive Officer | Executive Vice-President, |
| | Chief Financial and Administrative Officer |
| | |
| December 7, 2012 | |
GILDAN 2012 REPORT TO SHAREHOLDERS P.45
| | CONSOLIDATED FINANCIAL STATEMENTS |
INDEPENDENT AUDITORS’ REPORT OF REGISTERED PUBLIC ACCOUNTING FIRM
To the Shareholders of Gildan Activewear Inc.
We have audited the accompanying consolidated financial statements of Gildan Activewear Inc. (the "Company"), which comprise the consolidated statements of financial position as at September 30, 2012, October 2, 2011 and October 4, 2010, the consolidated statements of earnings and comprehensive income, changes in equity and cash flows for the years ended September 30, 2012 and October 2, 2011, and notes, comprising a summary of significant accounting policies and other explanatory information.
Management’s Responsibility for the Consolidated Financial Statements
Management is responsible for the preparation and fair presentation of these consolidated financial statements in accordance with International Financial Reporting Standards as issued by the International Accounting Standards Board, and for such internal control as management determines is necessary to enable the preparation of consolidated financial statements that are free from material misstatement, whether due to fraud or error.
Auditors’ Responsibility
Our responsibility is to express an opinion on these consolidated financial statements based on our audits. We conducted our audits in accordance with Canadian generally accepted auditing standards and the standards of the Public Company Accounting Oversight Board (United States). Those standards require that we comply with ethical requirements and plan and perform the audit to obtain reasonable assurance about whether the consolidated financial statements are free from material misstatement.
An audit involves performing procedures to obtain audit evidence about the amounts and disclosures in the consolidated financial statements. The procedures selected depend on our judgment, including the assessment of the risks of material misstatement of the consolidated financial statements, whether due to fraud or error. In making those risk assessments, we consider internal control relevant to the entity’s preparation and fair presentation of the consolidated financial statements in order to design audit procedures that are appropriate in the circumstances. An audit also includes evaluating the appropriateness of accounting policies used and the reasonableness of accounting estimates made by management, as well as evaluating the overall presentation of the consolidated financial statements.
We believe that the audit evidence we have obtained in our audits is sufficient and appropriate to provide a basis for our audit opinion.
Opinion
In our opinion, the consolidated financial statements present fairly, in all material respects, the consolidated financial position of Gildan Activewear Inc. as at September 30, 2012, October 2, 2011 and October 4, 2010, and its consolidated financial performance and its consolidated cash flows for the years ended September 30, 2012 and October 2, 2011 in accordance with International Financial Reporting Standards as issued by the International Accounting Standards Board.
We have also audited, in accordance with the standards of the Public Company Accounting Oversight Board (United States), the Company's internal control over financial reporting as at September 30, 2012, based on criteria established inInternal Control - Integrated Frameworkissued by the Committee of Sponsoring Organizations of the Treadway Commission (COSO), and our report dated November 28, 2012 expressed an unqualified opinion on the effectiveness of the Company's internal control over financial reporting.

Montréal, Canada
November 28, 2012
| *CPA auditor, CA, public accountancy permit No. A120841 | KPMG LLP is a Canadian limited liability partnership and a member firm of the KPMG network of independent member firms affiliated with KPMG International Cooperative ("KPMG International"), a Swiss entity. KPMG Canada provides services to KPMG LLP. |
GILDAN 2012 REPORT TO SHAREHOLDERS P.46
CONSOLIDATED FINANCIAL STATEMENTS
REPORT OF INDEPENDENT REGISTERED PUBLIC ACCOUNTING FIRM
To the Shareholders and Board of Directors of Gildan Activewear Inc.
We have audited Gildan Activewear Inc.'s internal control over financial reporting as at September 30, 2012, based on the criteria established in Internal Control - Integrated Framework issued by the Committee of Sponsoring Organizations of the Treadway Commission (COSO).Gildan Activewear Inc.’s management is responsible for maintaining effective internal control over financial reporting and for its assessment of the effectiveness of internal control over financial reporting as presented in the section entitled “Management’s Annual Report on Internal Control over Financial Reporting” included in Management’s Discussion and Analysis. Our responsibility is to express an opinion on the Company's internal control over financial reporting based on our audit.
We conducted our audit in accordance with the standards of the Public Company Accounting Oversight Board (United States). Those standards require that we plan and perform the audit to obtain reasonable assurance about whether effective internal control over financial reporting was maintained in all material respects. Our audit included obtaining an understanding of internal control over financial reporting, assessing the risk that a material weakness exists, and testing and evaluating the design and operating effectiveness of internal control based on the assessed risk. Our audit also included performing such other procedures as we considered necessary in the circumstances. We believe that our audit provides a reasonable basis for our opinion.
A company's internal control over financial reporting is a process designed to provide reasonable assurance regarding the reliability of financial reporting and the preparation of financial statements for external purposes in accordance with generally accepted accounting principles. A company's internal control over financial reporting includes those policies and procedures that (1) pertain to the maintenance of records that, in reasonable detail, accurately and fairly reflect the transactions and dispositions of the assets of the company; (2) provide reasonable assurance that transactions are recorded as necessary to permit preparation of financial statements in accordance with generally accepted accounting principles, and that receipts and expenditures of the company are being made only in accordance with authorizations of management and directors of the company; and (3) provide reasonable assurance regarding prevention or timely detection of unauthorized acquisition, use, or disposition of the company's assets that could have a material effect on the financial statements.
Because of its inherent limitations, internal control over financial reporting may not prevent or detect misstatements. Also, projections of any evaluation of effectiveness to future periods are subject to the risk that controls may become inadequate because of changes in conditions, or that the degree of compliance with the policies or procedures may deteriorate.
In our opinion, Gildan Activewear Inc. maintained, in all material respects, effective internal control over financial reporting as of September 30, 2012, based on criteria established inInternal Control - Integrated Frameworkissued by the Committee of Sponsoring Organizations of the Treadway Commission (COSO).
Management has excluded from its assessment of the effectiveness of internal control over financial reporting as of September 30, 2012 the internal control over financial reporting of Anvil Holdings, Inc. (Anvil) which Gildan Activewear Inc. acquired on May 9, 2012. The total assets and total net sales of Anvil represent approximately 6.5% of the consolidated total assets and approximately 4.4% of the consolidated net sales included in the consolidated financial statements of Gildan Activewear Inc. as at and for the year ended September 30, 2012. Our audit of internal control over financial reporting of Gildan Activewear Inc. also excluded an evaluation of the internal control over financial reporting of Anvil.
We also have audited in accordance with Canadian generally accepted auditing standards and the standards of the Public Company Accounting Oversight Board (United States), the consolidated statements of financial position of Gildan Activewear Inc. as at September 30, 2012, October 2, 2011 and October 4, 2010 and the related consolidated statements of earnings and comprehensive income, changes in equity and cash flows for the years ended September 30, 2012 and October 2, 2011, and our report dated November 28, 2012 expressed an unqualified (unmodified) opinion on those consolidated financial statements.

Montréal, Canada
November 28, 2012
| *CPA auditor, CA, public accountancy permit No. A120841 | KPMG LLP is a Canadian limited liability partnership and a member firm of the KPMG network of independent member firms affiliated with KPMG International Cooperative ("KPMG International"), a Swiss entity. KPMG Canada provides services to KPMG LLP. |
GILDAN 2012 REPORT TO SHAREHOLDERS P.47
| | CONSOLIDATED FINANCIAL STATEMENTS |
| GILDAN ACTIVEWEAR INC. |
| CONSOLIDATED STATEMENTS OF FINANCIAL POSITION |
| (in thousands of U.S. dollars) |
| | | September 30, | | | October 2, | | | October 4, | |
| | | 2012 | | | 2011 | | | 2010 | |
| | | | | | (note 29 | ) | | (note 29 | ) |
Current assets: | | | | | | | | | |
Cash and cash equivalents (note 6) | $ | 70,410 | | $ | 82,025 | | $ | 250,843 | |
Trade accounts receivable (note 7) | | 260,595 | | | 191,594 | | | 145,684 | |
Income taxes receivable | | 353 | | | 515 | | | - | |
Inventories (note 8) | | 553,068 | | | 568,311 | | | 329,518 | |
Prepaid expenses and deposits | | 14,451 | | | 10,827 | | | 8,848 | |
Assets held for sale (note 19) | | 8,029 | | | 13,142 | | | 3,246 | |
Other current assets | | 8,694 | | | 9,228 | | | 8,670 | |
Total current assets | | 915,600 | | | 875,642 | | | 746,809 | |
Non-current assets: | | | | | | | | | |
Property, plant and equipment (note 9) | | 552,437 | | | 550,324 | | | 483,013 | |
Investment in joint venture | | 12,126 | | | 13,038 | | | 12,533 | |
Intangible assets (note 10) | | 259,981 | | | 261,653 | | | 66,811 | |
Goodwill (note 10) | | 141,933 | | | 141,933 | | | 10,197 | |
Deferred income taxes (note 20) | | 3,371 | | | - | | | - | |
Other non-current assets | | 10,989 | | | 15,909 | | | 15,140 | |
Total non-current assets | | 980,837 | | | 982,857 | | | 587,694 | |
Total assets | $ | 1,896,437 | | $ | 1,858,499 | | $ | 1,334,503 | |
| | | | | | | | | |
Current liabilities: | | | | | | | | | |
Accounts payable and accrued liabilities | $ | 256,442 | | $ | 297,960 | | $ | 179,795 | |
Income taxes payable | | - | | | - | | | 5,024 | |
Current portion of long-term debt | | - | | | - | | | 16,879 | |
Total current liabilities | | 256,442 | | | 297,960 | | | 201,698 | |
Non-current liabilities: | | | | | | | | | |
Long-term debt (note 12) | | 181,000 | | | 209,000 | | | - | |
Deferred income taxes (note 20) | | - | | | 11,977 | | | 4,771 | |
Employee benefit obligations (note 13) | | 19,612 | | | 20,246 | | | 12,179 | |
Provisions (note 14) | | 13,042 | | | 8,226 | | | 7,951 | |
Total non-current liabilities | | 213,654 | | | 249,449 | | | 24,901 | |
Total liabilities | | 470,096 | | | 547,409 | | | 226,599 | |
| | | | | | | | | |
Commitments, guarantees and contingent liabilities (note 25) | | | | | | | | | |
| | | | | | | | | |
Equity: | | | | | | | | | |
Share capital | | 101,113 | | | 100,436 | | | 97,036 | |
Contributed surplus | | 25,579 | | | 16,526 | | | 10,091 | |
Retained earnings | | 1,306,724 | | | 1,194,804 | | | 1,002,487 | |
Accumulated other comprehensive income | | (7,075 | ) | | (676 | ) | | (1,710 | ) |
Total equity attributable to shareholders of the Company | | 1,426,341 | | | 1,311,090 | | | 1,107,904 | |
Total liabilities and equity | $ | 1,896,437 | | $ | 1,858,499 | | $ | 1,334,503 | |
See accompanying notes to consolidated financial statements.
On behalf of the Board of Directors:
| (Signed: Glenn J. Chamandy) | (Signed: Russell Goodman) |
| Director | Director |
| Glenn J. Chamandy | Russell Goodman |
GILDAN 2012 REPORT TO SHAREHOLDERS P.48
| | CONSOLIDATED FINANCIAL STATEMENTS |
| GILDAN ACTIVEWEAR INC. |
| CONSOLIDATED STATEMENTS OF EARNINGS AND COMPREHENSIVE INCOME |
| Years ended September 30, 2012 and October 2, 2011 |
| (in thousands of U.S. dollars, except per share data) |
| | | 2012 | | | 2011 | |
| | | | | (note 29 | ) |
Net sales | $ | 1,948,253 | | $ | 1,725,712 | |
Cost of sales | | 1,552,128 | | | 1,288,106 | |
Gross profit | | 396,125 | | | 437,606 | |
Selling, general and administrative expenses (note 18) | | 226,035 | | | 198,858 | |
Restructuring and acquisition-related costs (note 19) | | 14,962 | | | 18,177 | |
Operating income | | 155,128 | | | 220,571 | |
Financial expenses, net (note 16(c)) | | 11,598 | | | 6,142 | |
Equity earnings in investment in joint venture | | (597 | ) | | (504 | ) |
Earnings before income taxes | | 144,127 | | | 214,933 | |
Income tax recovery (note 20) | | (4,337 | ) | | (19,223 | ) |
Net earnings | | 148,464 | | | 234,156 | |
Other comprehensive (loss) income, net of related income taxes (note 16(d)) | | | | | | |
Cash flow hedges | | (6,399 | ) | | 1,034 | |
Actuarial gain (loss) on employee benefit obligations | | 323 | | | (3,952 | ) |
| | (6,076 | ) | | (2,918 | ) |
Comprehensive income | $ | 142,388 | | $ | 231,238 | |
| | | | | | |
| | | | | | |
Earnings per share: | | | | | | |
Basic (note 21) | $ | 1.22 | | $ | 1.93 | |
Diluted (note 21) | $ | 1.22 | | $ | 1.91 | |
See accompanying notes to consolidated financial statements.
GILDAN 2012 REPORT TO SHAREHOLDERS P.49
| | CONSOLIDATED FINANCIAL STATEMENTS |
| GILDAN ACTIVEWEAR INC. |
| CONSOLIDATED STATEMENTS OF CHANGES IN EQUITY |
| Years ended September 30, 2012 and October 2, 2011 |
| (in thousands or thousands of U.S. dollars) |
| | | | | | | | | | | | Accumulated | | | | | | | |
| | | | | | | | | | | | other | | | | | | | |
| | | Share capital | | | Contributed | | | comprehensive | | | Retained | | | Total | |
| | Number | | | Amount | | | surplus | | | income (loss) | | | earnings | | | equity | |
Balance, October 4, 2010 (note 29) | | 121,352 | | $ | 97,036 | | $ | 10,091 | | $ | (1,710 | ) | $ | 1,002,487 | | $ | 1,107,904 | |
| | | | | | | | | | | | | | | | | | |
Share-based compensation related to stock options and Treasury restricted share units | | - | | | - | | | 4,899 | | | - | | | - | | | 4,899 | |
Shares issued under employee share purchase plan | | 23 | | | 642 | | | - | | | - | | | - | | | 642 | |
Shares issued pursuant to exercise of stock options | | 379 | | | 3,594 | | | (219 | ) | | - | | | - | | | 3,375 | |
Shares issued or distributed pursuant to vesting of restricted share units | | 26 | | | 588 | | | (588 | ) | | - | | | - | | | - | |
Shares issued for costs incurred in a business acquisition | | 30 | | | 1,065 | | | - | | | - | | | - | | | 1,065 | |
Shares repurchased and cancelled (note 15) | | (400 | ) | | (337 | ) | | - | | | - | | | (10,200 | ) | | (10,537 | ) |
Share repurchases (note 15) | | (79 | ) | | (2,152 | ) | | 2,152 | | | - | | | - | | | - | |
Dividends declared | | - | | | - | | | 191 | | | - | | | (27,687 | ) | | (27,496 | ) |
Transactions with shareholders of the Company recognized directly in equity | | (21 | ) | | 3,400 | | | 6,435 | | | - | | | (37,887 | ) | | (28,052 | ) |
| | | | | | | | | | | | | | | | | | |
Cash flow hedges | | - | | | - | | | - | | | 1,034 | | | - | | | 1,034 | |
Actuarial loss on employee benefit obligations | | - | | | - | | | - | | | - | | | (3,952 | ) | | (3,952 | ) |
Net earnings | | - | | | - | | | - | | | - | | | 234,156 | | | 234,156 | |
Comprehensive income | | - | | | - | | | - | | | 1,034 | | | 230,204 | | | 231,238 | |
| | | | | | | | | | | | | | | | | | |
Balance, October 2, 2011 (note 29) | | 121,331 | | $ | 100,436 | | $ | 16,526 | | $ | (676 | ) | $ | 1,194,804 | | $ | 1,311,090 | |
| | | | | | | | | | | | | | | | | | |
Share-based compensation related to stock options and Treasury restricted share units | | - | | | - | | | 4,606 | | | - | | | - | | | 4,606 | |
Shares issued under employee share purchase plan | | 28 | | | 728 | | | - | | | - | | | - | | | 728 | |
Shares issued pursuant to exercise of stock options | | 56 | | | 982 | | | (209 | ) | | - | | | - | | | 773 | |
Shares issued or distributed pursuant to vesting of restricted share units | | 181 | | | 4,957 | | | (4,957 | ) | | - | | | - | | | - | |
Share-based consideration in connection with a business acquisition (note 5) | | - | | | - | | | 3,432 | | | - | | | - | | | 3,432 | |
Share repurchases (note 15) | | (210 | ) | | (5,990 | ) | | 5,929 | | | - | | | - | | | (61 | ) |
Dividends declared | | - | | | - | | | 252 | | | - | | | (36,867 | ) | | (36,615 | ) |
Transactions with shareholders of the Company recognized directly in equity | | 55 | | | 677 | | | 9,053 | | | - | | | (36,867 | ) | | (27,137 | ) |
| | | | | | | | | | | | | | | | | | |
Cash flow hedges | | - | | | - | | | - | | | (6,399 | ) | | - | | | (6,399 | ) |
Actuarial gain on employee benefit obligations | | - | | | - | | | - | | | - | | | 323 | | | 323 | |
Net earnings | | - | | | - | | | - | | | - | | | 148,464 | | | 148,464 | |
Comprehensive income (loss) | | - | | | - | | | - | | | (6,399 | ) | | 148,787 | | | 142,388 | |
| | | | | | | | | | | | | | | | | | |
Balance, September 30, 2012 | | 121,386 | | $ | 101,113 | | $ | 25,579 | | $ | (7,075 | ) | $ | 1,306,724 | | $ | 1,426,341 | |
See accompanying notes to consolidated financial statements.
GILDAN 2012 REPORT TO SHAREHOLDERS P.50
| | CONSOLIDATED FINANCIAL STATEMENTS |
| GILDAN ACTIVEWEAR INC. |
| CONSOLIDATED STATEMENTS OF CASH FLOWS |
| Years ended September 30, 2012 and October 2, 2011 |
| (in thousands of U.S. dollars) |
| | | 2012 | | | 2011 | |
| | | | | | (note 29 | ) |
Cash flows from (used in) operating activities: | | | | | | |
Net earnings | $ | 148,464 | | $ | 234,156 | |
Adjustments to reconcile net earnings to cash flows from operating activities (note 23(a)) | | 94,221 | | | 47,917 | |
| | 242,685 | | | 282,073 | |
Changes in non-cash working capital balances: | | | | | | |
Trade accounts receivable | | (36,660 | ) | | (18,861 | ) |
Income taxes receivable | | 2,440 | | | (5,341 | ) |
Inventories | | 77,111 | | | (177,821 | ) |
Prepaid expenses and deposits | | (1,828 | ) | | (569 | ) |
Other current assets | | (2,368 | ) | | 1,553 | |
Accounts payable and accrued liabilities | | (61,798 | ) | | 82,605 | |
Cash flows from operating activities | | 219,582 | | | 163,639 | |
| | | | | | |
Cash flows from (used in) financing activities: | | | | | | |
(Decrease) increase in amounts drawn under revolving long-term credit facility | | (28,000 | ) | | 209,000 | |
Dividends paid | | (36,615 | ) | | (27,496 | ) |
Repayment of other long-term debt | | - | | | (17,233 | ) |
Proceeds from the issuance of shares | | 1,501 | | | 4,017 | |
Repurchase and cancellation of shares (note 15(d)) | | - | | | (10,537 | ) |
Repurchase of shares (note 15(e)) | | (5,990 | ) | | (2,152 | ) |
Cash flows from (used in) financing activities | | (69,104 | ) | | 155,599 | |
| | | | | | |
Cash flows from (used in) investing activities: | | | | | | |
Purchase of property, plant and equipment | | (71,316 | ) | | (155,178 | ) |
Purchase of intangible assets | | (5,439 | ) | | (4,776 | ) |
Business acquisitions (note 5) | | (87,373 | ) | | (342,368 | ) |
Proceeds on disposal of corporate asset (note 23(a)) | | - | | | 13,226 | |
Proceeds on disposal of assets held for sale | | 600 | | | 1,125 | |
Dividend received from investment in joint venture | | 1,509 | | | - | |
Cash flows used in investing activities | | (162,019 | ) | | (487,971 | ) |
| | | | | | |
Effect of exchange rate changes on cash and cash equivalents denominated in foreign currencies | | (74 | ) | | (85 | ) |
Net decrease in cash and cash equivalents during the year | | (11,615 | ) | | (168,818 | ) |
Cash and cash equivalents, beginning of year | | 82,025 | | | 250,843 | |
Cash and cash equivalents, end of year | $ | 70,410 | | $ | 82,025 | |
| | | | | | |
Cash paid during the period (included in cash flows from operating activities): | | | | | | |
Interest | $ | 8,101 | | $ | 3,481 | |
Income taxes | | 4,331 | | | 8,620 | |
| | | | | | | |
| Supplemental disclosure of cash flow information (note 23) | | | | | | |
| See accompanying notes to consolidated financial statements. | | | | | | |
GILDAN 2012 REPORT TO SHAREHOLDERS P.51
| | NOTES TO CONSOLIDATED FINANCIAL STATEMENTS |
NOTES TO CONSOLIDATED FINANCIAL STATEMENTS
Years ended September 30, 2012 and October 2, 2011
(Tabular amounts in thousands or thousands of U.S. dollars except per share data, unless otherwise indicated)
1. REPORTING ENTITY:
Gildan Activewear Inc. (the "Company") is domiciled in Canada and is incorporated under theCanada Business Corporations Act.Its principal business activity is the manufacture and sale of activewear, socks and underwear. The Company’s fiscal year ends on the first Sunday following September 28.
The address of the Company’s registered office is 600 de Maisonneuve Boulevard West, Suite 3300, Montreal, Quebec. The consolidated financial statements include the accounts of the Company and its subsidiaries and its interest in a joint venture. The Company is a publicly listed entity and its shares are traded on the Toronto Stock Exchange and New York Stock Exchange under the symbol GIL.
2. BASIS OF PREPARATION:
| (a) | Statement of compliance: |
| The Company’s consolidated financial statements have been prepared in accordance with International Financial Reporting Standards (“IFRS”) as issued by the International Accounting Standards Board (“IASB”). These are the Company’s first annual consolidated financial statements in accordance with IFRS and IFRS 1, First-time Adoption of International Financial Reporting Standards has been applied. An explanation of the impact of the changeover from previous Canadian GAAP to IFRS of our reported financial position, financial performance and cash flows is provided in note 29, First Time Adoption of IFRS. |
| | | |
| These consolidated financial statements for fiscal year ended September 30, 2012 were authorized for issuance by the Board of Directors of the Company on November 28, 2012. |
| | | |
| (b) | Basis of measurement: |
| The consolidated financial statements have been prepared on the historical cost basis except for the following items in the consolidated statements of financial position: |
| | Derivative financial instruments which are measured at fair value; |
| | Non-current assets held for sale which are stated at the lower of carrying amount and fair value less costs to sell; |
| | Liabilities for cash-settled share-based payment arrangements which are measured at fair value; |
| | Employee benefit obligations related to defined benefit plans which are measured as the net total of the fair value of plan assets and the present value of the defined benefit obligation; |
| | Provision for decommissioning and site restoration costs which is measured at the present value of the expenditures expected to be required to settle the obligation; |
| | Contingent consideration in connection with a business combination which is measured at fair value; and |
| | Identifiable assets acquired and liabilities assumed in connection with a business combination which are initially measured at fair value. |
The functional and presentation currency of the Company is the U.S. dollar.
GILDAN 2012 REPORT TO SHAREHOLDERS P.52
| | NOTES TO CONSOLIDATED FINANCIAL STATEMENTS |
3. SIGNIFICANT ACCOUNTING POLICIES:
The accounting policies set out below have been applied consistently to all periods presented in these consolidated financial statements and in preparing the opening IFRS statement of financial position as at October 4, 2010 for the purposes of the transition to IFRS, unless otherwise indicated.
| (a) | Basis of consolidation: |
| | | |
| (i) | Business combinations: |
| | Business combinations are accounted for using the acquisition method. Accordingly, the consideration transferred for the acquisition of a business is the fair value of the assets transferred, and any debt and equity interests issued by the Company on the date control of the acquired company is obtained. The consideration transferred includes the fair value of any asset or liability resulting from a contingent consideration arrangement. Contingent consideration classified as equity is not remeasured and its subsequent settlement is accounted for within equity. Contingent consideration classified as an asset or a liability that is a financial instrument is remeasured at fair value, with any resulting gain or loss recognized in net earnings. Acquisition- related costs, other than those associated with the issue of debt or equity securities, are expensed as incurred and are included in restructuring and acquisition-related costs in the consolidated statement of earnings and comprehensive income. Identifiable assets acquired and liabilities and contingent liabilities assumed in a business combination are generally measured initially at their fair values at the acquisition date. The Company recognizes any non-controlling interest in an acquired company on an acquisition-by-acquisition basis either at fair value or at the non-controlling interest’s proportionate share of the acquired company’s net identifiable assets. The excess of the consideration transferred over the fair value of the identifiable net assets acquired is recorded as goodwill. If the total of consideration transferred and non-controlling interest recognized is less than the fair value of the net assets of the business acquired, a purchase gain is recognized immediately in the statement of earnings and comprehensive income. Intragroup transactions, balances and unrealized gains or losses on transactions between group companies are eliminated. |
| | | |
| (ii) | Subsidiaries: |
| | Subsidiaries are entities controlled by the Company. The financial statements of subsidiaries are included in the consolidated financial statements from the date that control commences until the date that control ceases. The accounting policies of subsidiaries are aligned with the policies adopted by the Company. |
| | | |
| (iii) | Investment in a joint venture: |
| | The Company’s investment in a yarn spinning joint venture with Frontier Spinning Mills, Inc., CanAm Yarns, LLC (“CanAm”) is considered a jointly controlled entity over which the Company exercises joint control. Investments in jointly controlled entities are accounted for using the equity method. Under the equity method of accounting, the investment in a joint venture is initially recognized in the consolidated statement of financial position at cost and subsequently adjusted to recognize the Company’s share of the post-acquisition earnings and movements in other comprehensive income in the consolidated statement of earnings and comprehensive income. Dividends received by an equity accounted investee are deducted from the carrying amount of the investment when the dividends are declared. The Company’s investment in a joint venture includes goodwill identified on acquisition, if any, net of any accumulated impairment losses. If the Company’s share of losses in a joint venture equals or exceeds its interests in the joint venture (which includes any long- term interests that, in substance, form part of the group’s net investment in the joint venture), the Company does not recognize further losses, unless it has incurred obligations or made payments on behalf of the joint venture. Unrealized gains on transactions between the Company and the joint venture are eliminated to the extent of the Company’s interest in the joint venture. Unrealized losses are also eliminated unless the transaction provides evidence of an impairment of the asset transferred. Accounting policies of the joint venture have been modified where necessary to ensure consistency with the policies adopted by the Company. |
| | | |
| (b) | Foreign currency translation: |
| Monetary assets and liabilities of the Company’s Canadian and foreign operations denominated in currencies other than the U.S. dollar are translated using exchange rates in effect at the reporting date. Non-monetary assets and liabilities denominated in currencies other than U.S. dollars are translated at the rates prevailing at the respective transaction dates. Income and expenses denominated in currencies other than U.S. dollars are translated at average rates prevailing during the year. Gains or losses on foreign exchange are recorded in net earnings, and presented in the statement of earnings and comprehensive income within financial expenses. |
GILDAN 2012 REPORT TO SHAREHOLDERS P.53
| | NOTES TO CONSOLIDATED FINANCIAL STATEMENTS |
| 3.SIGNIFICANT ACCOUNTING POLICIES (continued): |
| (c) | Cash and cash equivalents: |
| The Company considers all liquid investments with maturities of three months or less when acquired to be cash equivalents. |
| | |
| (d) | Trade accounts receivable: |
| Trade accounts receivable consist of amounts due from our normal business activities. An allowance for doubtful accounts is maintained to reflect expected credit losses. Bad debts are provided for based on collection history and specific risks identified on a customer-by-customer basis. Uncollected accounts are written off through the allowance for doubtful accounts. |
| | |
| (e) | Inventories: |
| Inventories are stated at the lower of first-in first-out cost and net realizable value. Inventory costs include the purchase price and other costs directly related to the acquisition of raw materials and spare parts held for use in the manufacturing process, and the cost of purchased finished goods. Inventory costs also include the costs directly related to the conversion of materials to finished goods, such as direct labour, and a systematic allocation of fixed and variable production overhead, including manufacturing depreciation expense. The allocation of fixed production overheads to the cost of inventories is based on the normal capacity of the production facilities. Normal capacity is the average production expected to be achieved over a number of periods under normal circumstances. Net realizable value is the estimated selling price in the ordinary course of business, less the estimated costs of completion and selling expenses. Raw materials and spare parts are not written down if the finished products in which they will be incorporated are expected to be sold at or above cost. |
| | |
| (f) | Assets held for sale: |
| Non-current assets are classified as assets held for sale, and are reported in current assets in the statement of financial position, when their carrying amount is to be recovered principally through a sale transaction and a sale is considered highly probable. Assets held for sale are stated at the lower of carrying amount and fair value less costs to sell. |
| | |
| (g) | Property, plant and equipment: |
| Property, plant and equipment are initially recorded at cost, and are subsequently carried at cost less any accumulated depreciation and any accumulated impairment losses. The cost of an item of property, plant and equipment includes expenditures that are directly attributable to the acquisition or construction of an asset. The cost of self-constructed assets includes the cost of materials and direct labour, site preparation costs, initial delivery and handling costs, installation and assembly costs, and any other costs directly attributable to bringing the assets to the location and condition necessary for the assets to be capable of operating in the manner intended by management. The cost of property, plant and equipment also includes, when applicable, the initial present value estimate of the costs of dismantling and removing the asset and restoring the site on which it is located at the end of its useful life, and any applicable borrowing costs. Purchased software that is integral to the functionality of the related equipment is capitalized as part of other equipment. Subsequent costs are included in an asset’s carrying amount or recognized as a separate asset, as appropriate, only when it is probable that future economic benefits are present and the cost of the item can be measured reliably. The costs of day-to-day servicing of property, plant and equipment are expensed as incurred in the consolidated statement of earnings and comprehensive income. For the purpose of impairment testing of property, plant and equipment, see note 3(j). Gains and losses on the disposal of an item of property, plant and equipment are determined by comparing the proceeds from disposal with the carrying amount of property, plant and equipment, and are recognized in the statement of earnings and comprehensive income. |
| | |
| Land is not depreciated. The cost of property, plant and equipment less its residual value, if any, is depreciated on a straight-line basis over the following estimated useful lives: |
| | Asset | | Useful life | |
| | Buildings and improvements | | 5 to 40 years | |
| | Manufacturing equipment | | 3 to 10 years | |
| | Other equipment | | 2 to 10 years | |
GILDAN 2012 REPORT TO SHAREHOLDERS P.54
| | NOTES TO CONSOLIDATED FINANCIAL STATEMENTS |
| 3.SIGNIFICANT ACCOUNTING POLICIES (continued): |
| (g) | Property, plant and equipment (continued): |
| Significant components of property, plant and equipment which are identified as having different useful lives are depreciated separately over their respective useful lives. Depreciation methods, useful lives and residual values, if applicable, are reviewed and adjusted, if appropriate, on a prospective basis at the end of each fiscal year. |
| | |
| Assets not yet utilized in operations include expenditures incurred to date for plant expansions which are still in process and equipment not yet placed into service as at the reporting date. Depreciation on these assets commences when the assets are available for use. |
| | |
| Borrowing costs |
| Borrowing costs that are directly attributable to the acquisition or construction of a qualifying asset are capitalized as part of the cost of the asset. A qualifying asset is one that necessarily takes a substantial period of time to get ready for its intended use. Capitalization of borrowing costs ceases when the asset is completed and ready for its intended use. All other borrowing costs are recognized as financial expenses as incurred. The Company had no capitalized borrowing costs as at September 30, 2012, October 2, 2011 and October 4, 2010. |
| | |
| (h) | Intangible assets: |
| Intangible assets are measured at cost less accumulated amortization and any accumulated impairment losses. Intangible assets include identifiable intangible assets acquired in a business combination, and consist of customer contracts and customer relationships, license agreements, non-compete agreements, and trademarks. Intangible assets also include computer software that is not an integral part of the related hardware. For the purpose of impairment testing of intangible assets, see note 3(j). Indefinite life intangible assets represent intangible assets which the Company controls with no contractual or legal expiration date, and therefore are not amortized as there is no foreseeable time limit to their useful economic life. An assessment of indefinite life intangible assets is performed annually to determine whether events and circumstances continue to support an indefinite useful life, and any change in the useful life assessment from indefinite to finite is accounted for as a change in accounting estimate on a prospective basis. Intangible assets with finite lives are amortized on a straight-line basis over the following estimated useful-lives: |
| | Asset | | Useful life | |
| | Customer contracts and customer relationships | | 7 to 20 years | |
| | License agreements | | 7 years | |
| | Computer software | | 4 to 7 years | |
| | Non-compete agreements | | 2 years | |
Trademarks are not amortized as they are considered to be indefinite life intangible assets.
| | The costs of information technology projects that are directly attributable to the design and testing of identifiable and unique software products, including internally developed computer software are recognized as intangible assets when the following criteria are met: |
| | | it is technically feasible to complete the software product so that it will be available for use; |
| | | management intends to complete the software product and use it; |
| | | there is an ability to use the software product; |
| | | it can be demonstrated how the software product will generate probable future economic benefits; |
| | | adequate technical, financial and other resources to complete the development and to use the software product are available; and |
| | the expenditures attributable to the software product during its development can be reliably measured. |
Other development expenditures that do not meet these criteria are recognized as an expense as incurred. Development costs previously recognized as an expense are not recognized as an asset in a subsequent period.
GILDAN 2012 REPORT TO SHAREHOLDERS P.55
| | NOTES TO CONSOLIDATED FINANCIAL STATEMENTS |
| 3.SIGNIFICANT ACCOUNTING POLICIES (continued): |
| (i) | Goodwill: |
| Goodwill is measured at cost less accumulated impairment losses, if any. |
| | |
| Goodwill arising on business combinations on or after October 4, 2010 |
| Goodwill is measured as the excess of the consideration transferred and the recognized amount of the non- controlling interest in the acquired business, if any, over the fair value of net identifiable assets acquired and liabilities assumed of an acquired business. For the purpose of impairment testing of goodwill, see note 3(j). |
| | |
| Goodwill arising on business combinations before October 4, 2010 |
| Goodwill recorded as at October 4, 2010 in connection with business combinations which occurred prior to October 4, 2010 is included in the consolidated statement of financial position on the basis of its deemed cost, which represents the amount recorded under previous Canadian GAAP. |
| | |
| (j) | Impairment of non-financial assets: |
| Non-financial assets that have an indefinite useful life such as goodwill and trademarks are not subject to amortization and are tested annually for impairment or more frequently if events or changes in circumstances indicate that the asset might be impaired. Assets that are subject to amortization are assessed at the end of each reporting period as to whether there is any indication of impairment, or whenever events or changes in circumstances indicate that the carrying amount may not be recoverable. An impairment loss is recognized for the amount by which the asset’s carrying amount exceeds its recoverable amount. The recoverable amount is the higher of an asset’s value in use and fair value less costs to sell. The recoverable amount is determined for an individual asset, unless the asset does not generate cash inflows that are largely independent of those from other assets or groups of assets, in which case assets are grouped at the lowest levels for which there are separately identifiable cash inflows (i.e. cash-generating units or CGUs). |
| | |
| In assessing value in use, the estimated future cash flows expected to be derived from the asset or CGU by the Company are discounted to their present value using a pre-tax discount rate that reflects current market assessments of the time value of money and the risks specific to the asset and or the CGU. In assessing fair value less costs to sell, the Company uses the best information available to reflect the amount that the Company could obtain, at the time of the impairment test, from the disposal of the asset or CGU in an arm’s length transaction between knowledgeable, willing parties, after deducting the estimated costs of disposal. |
| | |
| For the purpose of testing goodwill for impairment, goodwill acquired in a business combination is allocated to a CGU or a group of CGUs that is expected to benefit from the synergies of the combination, regardless of whether other assets or liabilities of the acquired company are assigned to those CGUs. Impairment losses recognized are allocated first to reduce the carrying amount of any goodwill allocated to the CGU, and then to reduce the carrying amounts of the other assets in the CGU on a pro rata basis. Impairment losses are recognized in net earnings. |
| | |
| Reversal of impairment losses |
| A goodwill impairment loss is not reversed. Impairment losses on non-financial assets other than goodwill recognized in prior periods are assessed at each reporting date for any indications that the loss has decreased or no longer exists. An impairment loss is reversed if there has been a change in the estimates used to determine the recoverable amount. An impairment loss is reversed only to the extent that the asset’s carrying amount does not exceed the carrying amount that would have been determined, net of depreciation or amortization, if no impairment loss had been recognized. |
GILDAN 2012 REPORT TO SHAREHOLDERS P.56
| | NOTES TO CONSOLIDATED FINANCIAL STATEMENTS |
| 3.SIGNIFICANT ACCOUNTING POLICIES (continued): |
| (k) | Financial instruments: |
Financial assets
Financial assets are classified into the following categories, and depend on the purpose for which the financial assets were acquired.
| | (i) | Financial assets at fair value through profit or loss |
| | | A financial asset is classified at fair value through profit or loss (“FVTPL”) if it is classified as held for trading or is designated as such upon initial recognition. Derivatives are also categorized as held for trading unless they are designated as hedges. Upon initial recognition transaction costs are recognized in net earnings as incurred. Financial assets at fair value through profit or loss are measured at fair value, and changes therein are recognized in net earnings. Assets in this category are classified as current assets if expected to be settled within 12 months; otherwise, they are classified as non-current. The Company currently has no financial assets at fair value through profit or loss. |
| | | | |
| | (ii) | Held-to-maturity financial assets |
| | | A financial asset is classified as held-to maturity if the Company has the intent and ability to hold debt securities to maturity. Held-to-maturity financial assets are recognized initially at fair value plus any directly attributable transaction costs. Subsequent to initial recognition held-to-maturity financial assets are measured at amortized cost using the effective interest method, less any impairment losses. Any sale or reclassification of a more than insignificant amount of held-to-maturity investments not close to their maturity would result in the reclassification of all held-to-maturity investments as available-for-sale, and prevent the Company from classifying investment securities a held-to-maturity for the current and the following two fiscal years. The Company currently has no financial assets classified as held-to-maturity. |
| | | | |
| | (iii) | Loans and receivables |
| | | Loans and receivables are financial assets with fixed or determinable payments that are not quoted in an active market. Such assets are recognized initially at fair value plus any directly attributable transaction costs. Subsequent to initial recognition loans and receivables are measured at amortized cost using the effective interest method, less any impairment losses. The Company currently classifies its cash and cash equivalents, trade accounts receivable, certain other current assets, and long-term non-trade receivable as loans and receivables. |
| | | | |
| | (iv) | Available-for-sale financial assets |
| | | Available-for-sale financial assets are non-derivative financial assets that are designated as available-for-sale and that are not classified in any of the previous categories. Subsequent to initial recognition, they are measured at fair value and changes therein, other than impairment losses are recognized in other comprehensive income and presented within equity in accumulated other comprehensive income. When an investment is derecognized, the cumulative gain or loss in other comprehensive income is transferred to profit or loss. The Company currently has no financial assets classified as available-for-sale. |
| | | | |
| | | The Company derecognizes a financial asset when the contractual rights to the cash flows from the asset expire, or it transfers the rights to receive the contractual cash flows on the financial asset in a transaction in which substantially all the risks and rewards of ownership of the financial asset are transferred. |
Financial liabilities
| | (i) | Financial liabilities at fair value through profit or loss |
| | | Financial liabilities at fair value through profit or loss are initially recognized at fair value and are re-measured at each reporting date with any changes therein recognized in net earnings. The Company currently has no financial liabilities at fair value through profit or loss. |
GILDAN 2012 REPORT TO SHAREHOLDERS P.57
| | NOTES TO CONSOLIDATED FINANCIAL STATEMENTS |
| 3.SIGNIFICANT ACCOUNTING POLICIES (continued): |
| (k) | Financial instruments (continued): |
| | | |
| (ii) | Other financial liabilities |
| | Other financial liabilities are recognized initially at fair value less any directly attributable transaction costs. Subsequent to initial recognition other financial liabilities are measured at amortized cost using the effective interest method. The Company currently classifies accounts payable and accrued liabilities (excluding derivative financial instruments designated as effective hedging instruments and contingent consideration), and long-term debt as other financial liabilities. |
| | | |
| | Financial assets and liabilities are offset and the net amount presented in the statement of financial position when, and only when, the Company has a legal right to offset the amounts and intends either to settle on a net basis or to realize the asset and settle the liability simultaneously. |
| | | |
| | The Company derecognizes a financial liability when its contractual obligations are discharged or cancelled or expire. |
| | Fair value of financial instruments |
| | Financial instruments measured at fair value use the following fair value hierarchy to prioritize the inputs used in measuring fair value: |
| | | Level 1: quoted prices (unadjusted) in active markets for identical assets or liabilities; |
| | | Level 2: inputs other than quoted prices included within Level 1 that are observable for the asset or liability, either directly (i.e. as prices) or indirectly (i.e. derived from prices); and |
| | Level 3: inputs for the asset or liability that are not based on observable market data. |
| | | Impairment of financial assets |
| | | The Company assesses at the end of each reporting period whether there is objective evidence that a financial asset or group of financial assets is impaired. A financial asset or a group of financial assets is impaired and impairment losses are incurred only if there is objective evidence of impairment as a result of one or more events that occurred after the initial recognition of the asset (a ‘loss event’) and that loss event (or events) has an impact on the estimated future cash flows of the financial asset or group of financial assets that can be reliably estimated. Evidence of impairment may include indications that the debtors or a group of debtors is experiencing significant financial difficulty, default or delinquency in interest or principal payments, the probability that they will enter bankruptcy or other financial reorganization, and where observable data indicate that there is a measurable decrease in the estimated future cash flows, such as changes in arrears or economic conditions that correlate with defaults. |
| | | |
| | | If, in a subsequent period, the amount of the impairment loss decreases and the decrease can be related objectively to an event occurring after the impairment was recognized (such as an improvement in the debtor’s credit rating), the reversal of the previously recognized impairment loss is recognized in net earnings. |
| | | |
| | (l) | Derivative financial instruments and hedging relationships: |
| | | The Company enters into derivative financial instruments to hedge its market risk exposures. On initial designation of the hedge, the Company formally documents the relationship between the hedging instruments and hedged items, including the risk management objectives and strategy in undertaking the hedge transaction, together with the methods that will be used to assess the effectiveness of the hedging relationship. The Company makes an assessment, both at the inception of the hedge relationship as well as on an ongoing basis, whether the hedging instruments are expected to be “highly effective” in offsetting the changes in the fair value or cash flows of the respective hedged items during the period for which the hedge is designated, and whether the actual results of each hedge are within a range of 80-125 percent. For a cash flow hedge of a forecasted transaction, the transaction should be highly probable to occur and should present an exposure to variations in cash flows that could ultimately affect reported net earnings. |
| | | |
| | | Derivatives are recognized initially at fair value, and attributable transaction costs are recognized in net earnings as incurred. Subsequent to initial recognition, derivatives are measured at fair value, and changes therein are accounted for as described below. |
GILDAN 2012 REPORT TO SHAREHOLDERS P.58
| | NOTES TO CONSOLIDATED FINANCIAL STATEMENTS |
| 3.SIGNIFICANT ACCOUNTING POLICIES (continued): |
| (l) | Derivative financial instruments and hedging relationships (continued): |
| | |
| Cash flow hedges |
| When a derivative is designated as the hedging instrument in a hedge of the variability in cash flows attributable to a particular risk associated with a recognized asset or liability or a highly probable forecasted transaction that could affect net earnings, the effective portion of changes in the fair value of the derivative is recognized in other comprehensive income and presented in accumulated other comprehensive income in equity. The intrinsic value of zero-cost collar options is designated as cash flow hedges. Consequently, gains and losses related to the time value of zero-cost collar options are immediately recognized in earnings in the same caption as the item being hedged. The amount recognized in other comprehensive income is removed and included in net earnings in the same period as the hedged cash flows affect net earnings under the same line item in the consolidated statement of earnings and comprehensive income as the hedged item. Any ineffective portion of changes in the fair value of the derivative is recognized immediately in net earnings. If the hedging instrument no longer meets the criteria for hedge accounting, expires or is sold, terminated, exercised, or the designation is revoked, then hedge accounting is discontinued prospectively. The cumulative gain or loss previously recognized in other comprehensive income remains in accumulated other comprehensive income until the forecasted transaction affects profit or loss. If the forecasted transaction is no longer expected to occur, then the balance in accumulated other comprehensive income is recognized immediately in net earnings. |
| | |
| When the hedged item is a non-financial asset, the amount recognized in other comprehensive income is transferred to net earnings in the same period that the hedged item affects net earnings. |
| | |
| Embedded derivatives |
| Embedded derivatives are separated from the host contract and accounted for separately if the economic characteristics and risks of the host contract and the embedded derivative are not closely related, a separate instrument with the same terms as the embedded derivative would meet the definition of a derivative, and the combined instrument is not measured at fair value through profit or loss. |
| | |
| Other derivatives |
| When a derivative financial instrument is not designated in a qualifying hedge relationship, all changes in its fair value are recognized immediately in net earnings. |
| | |
| (m) | Accounts payable and accrued liabilities: |
| Accounts payable and accrued liabilities are recognized initially at fair value and subsequently measured at amortized cost using the effective interest method. Accounts payable and accrued liabilities are classified as current liabilities if payment is due within one year, otherwise, they are presented as non-current liabilities. |
| | |
| (n) | Long-term debt: |
| Long-term debt is recognized initially at fair value, and is subsequently carried at amortized cost. Initial facility fees are deferred and treated as an adjustment to the instrument's effective interest rate and recognized as an expense over the instrument's estimated life if it is probable that the facility will be drawn down. However, if it is not probable that a facility will be drawn down, then the fees are considered service fees and are deferred and recognized as an expense on a straight-line basis over the commitment period. |
| | |
| The Company classifies its existing revolving long-term credit facility as a non-current liability on the basis that the Company has the discretion to refinance or rollover amounts drawn under the facility for at least twelve months following the reporting date. |
| | |
| (o) | Employee benefits: |
| | |
| Short-term employee benefits |
| Short-term employee benefits include wages, salaries, compensated absences and bonuses. Short-term employee benefit obligations are measured on an undiscounted basis and are expensed as the related service is provided. A liability is recognized for the amount expected to be paid under short-term cash bonus or profit sharing plans if the Company has a present legal or constructive obligation to pay this amount as a result of past service provided by the employee, and the obligation can be estimated reliably. Short-term employee benefit obligations are included in accounts payable and accrued liabilities. |
GILDAN 2012 REPORT TO SHAREHOLDERS P.59
| | NOTES TO CONSOLIDATED FINANCIAL STATEMENTS |
| 3. SIGNIFICANT ACCOUNTING POLICIES (continued): |
| (o) | Employee benefits (continued): |
| | |
| Defined contribution plans |
| The Company offers group defined contribution plans to eligible employees whereby the Company matches employees' contributions up to a fixed percentage of the employee's salary. Contributions by the Company to trustee-managed investment portfolios or employee associations are expensed as incurred. Benefits are also provided to employees through defined contribution plans administered by the governments in the countries in which the Company operates. The Company’s contributions to these plans are recognized in the period when services are rendered. |
| | |
| Defined benefit plans |
| The Company also maintains a funded qualified defined benefit plan (“Retirement Plan”) covering certain employees of Gold Toe Moretz. The Retirement Plan has been frozen since January 1, 2007, and as such no additional employees became participants in the Retirement Plan and existing participants in the Retirement Plan ceased accruing any additional benefits after that date. The pension obligation is actuarially determined using the projected benefit method to determine plan obligations and related periodic costs. Assets of the Retirement Plan are invested in high quality money market funds and are recorded at fair value. Plan valuations require economic assumptions, including expected rates of return on plan assets, discount rates to value plan obligations, and participant demographic assumptions including mortality rates. Because the Retirement Plan is frozen, salary escalation is not considered in the actuarial valuation, and there are no current service costs incurred. |
| | |
| The Company also maintains a liability for statutory severance and pre-notice benefit obligations for active employees located in the Caribbean Basin and Central America which is payable to the employees in a lump sum payment upon termination of employment. The liability is based on management’s best estimates of the ultimate costs to be incurred to settle the liability and is based on a number of assumptions and factors, including historical trends, actuarial assumptions and economic conditions. |
| | |
| Liabilities related to defined benefit plans are included in employee benefit obligations in the consolidated statement of financial position. Actuarial gains and losses arising from experience adjustments and changes in actuarial assumptions are recognized directly to other comprehensive income in the period in which they arise, and are immediately transferred to retained earnings without reclassification to net earnings in a subsequent period. |
| | |
| (p) | Provisions: |
| Provisions are recognized when the Company has a present legal or constructive obligation as a result of past events, it is probable that an outflow of resources will be required to settle the obligation, and the amount has been reliably estimated. Provisions are not recognized for future operating losses. Provisions are measured at the present value of the expenditures expected to be required to settle the obligation using a pre-tax rate that reflects current market assessments of the time value of money and the risks specific to the obligation. The increase in the provision due to passage of time is recognized as financial expense. |
| | |
| Decommissioning and site restoration costs |
| The Company recognizes decommissioning and site restoration obligations for future removal and site restoration costs associated with the restoration of certain property, plant and equipment should it decide to discontinue some of its activities. A corresponding amount is added to the carrying value of the related asset and amortized over the remaining life of the underlying asset. |
| | |
| Onerous contracts |
| A provision for onerous contracts is recognized if the unavoidable costs of meeting the obligations specified in a contractual arrangement exceed the economic benefits expected to be received from the contract. Provisions for onerous contracts are measured at the lower of the cost of fulfilling the contract and the expected cost of terminating the contract. |
GILDAN 2012 REPORT TO SHAREHOLDERS P.60
| | NOTES TO CONSOLIDATED FINANCIAL STATEMENTS |
| 3.SIGNIFICANT ACCOUNTING POLICIES (continued): |
| (q) | Share capital: |
| Common shares are classified as equity. Incremental costs directly attributable to the issue of common shares and stock options are recognized as a deduction from equity, net of any tax effects. |
| | |
| When the Company repurchases its own shares, the consideration paid, including any directly attributable incremental costs (net of income taxes) is deducted from equity attributable to the company’s equity holders until the shares are cancelled or reissued. Where such common shares are subsequently reissued, any consideration received, net of any directly attributable incremental transaction costs and the related income tax effects, is included in equity attributable to the Company’s equity holders. |
| | |
| (r) | Dividends declared: |
| Dividends declared to the Company’s shareholders are recognized as a liability in the consolidated statement of financial position in the period in which the dividends are approved by the Company’s Board of Directors. |
| | |
| (s) | Revenue recognition: |
| Revenue is recognized upon shipment of products to customers, since title passes upon shipment, and to the extent that the selling price is fixed or determinable. At the time of sale, estimates are made for customer price discounts and volume rebates based on the terms of existing programs. Sales are recorded net of these program costs and estimated sales returns, which are based on historical experience, current trends and other known factors, and exclude sales taxes. New programs which relate to prior sales are recognized at the time the new program is introduced. |
| | |
| (t) | Cost of sales and gross profit: |
| Cost of sales includes all raw material costs, manufacturing conversion costs, including manufacturing depreciation expense, sourcing costs, inbound freight and inter-facility transportation costs, and outbound freight to customers. Cost of sales also includes the cost of purchased finished goods, costs relating to purchasing, receiving and inspection activities, manufacturing administration, third-party manufacturing services, sales-based royalty costs, insurance, inventory write-downs, and customs and duties. Gross profit is the result of sales less cost of sales. The Company’s gross profit may not be comparable to this metric as reported by other companies, since some entities include warehousing and handling costs, and/or exclude depreciation expense, outbound freight to customers and royalty costs from cost of sales. |
| | |
| (u) | Selling, general and administrative expenses: |
| Selling, general and administrative (“SG&A”) expenses include warehousing and handling costs, selling and administrative personnel costs, co-op advertising and marketing expenses, costs of leased facilities and equipment, professional fees, non-manufacturing depreciation and amortization expense, and other general and administrative expenses. SG&A expenses also include bad debt expense and amortization of intangible assets. |
| | |
| (v) | Product introduction expenditures: |
| Product introduction expenditures are one-time fees paid to retailers to allow the Company’s products to be placed on store shelves. These fees are recognized as a reduction in revenue. If the Company receives a benefit over a period of time and certain other criteria are met, these fees are recorded as an asset and are amortized as a reduction of revenue over the term of the arrangement. The Company evaluates the recoverability of these assets on a quarterly basis. |
| | |
| (w) | Restructuring and acquisition-related costs: |
| Restructuring and acquisition-related costs are expensed when incurred, or when a legal or constructive obligation exists. Restructuring and acquisition-related costs are comprised of costs directly related to the closure of business locations or the relocation of business activities, changes in management structure, as well as transaction and integration costs incurred pursuant to business acquisitions. Restructuring and acquisition-related costs include: severance and termination benefits, including the termination of employee benefit plans; gains or losses from the re-measurement and disposal of assets held for sale; facility exit and closure costs; costs incurred to eliminate redundant business activities pursuant to business acquisitions; legal, accounting and other professional fees (excluding costs of issuing debt or equity) directly incurred in connection with a business acquisition; purchase gains on business acquisitions; and the re-measurement of liabilities related to contingent consideration incurred in connection with a business acquisition. |
GILDAN 2012 REPORT TO SHAREHOLDERS P.61
| | NOTES TO CONSOLIDATED FINANCIAL STATEMENTS |
| 3.SIGNIFICANT ACCOUNTING POLICIES (continued): |
| (x) | Cotton-based yarn procurements: |
| The Company contracts to buy cotton-based yarn with future delivery dates at fixed prices in order to reduce the effects of fluctuations in the prices of cotton used in the manufacture of its products. These contracts are not used for trading purposes and are not considered to be financial instruments. The Company commits to fixed prices on a percentage of its cotton-based yarn requirements up to eighteen months in the future. If the cost of committed prices for cotton-based yarn plus estimated costs to complete production exceed current selling prices, a loss is recognized for the excess as a charge to cost of sales. |
| | |
| (y) | Financial expenses (income): |
| Financial expenses (income) include: interest expense on borrowings, including realized gains and/or losses on interest rate swaps designated for hedge accounting; bank and other financial charges; interest income on funds invested; accretion of interest on discounted provisions; net foreign currency losses and/or gains; and losses and/or gains on financial derivatives that do not meet the criteria for effective hedge accounting. |
| | |
| (z) | Income taxes: |
| Income tax expense is comprised of current and deferred income taxes, and is included in net earnings except to the extent that it relates to a business acquisition, or items recognized directly in equity or in other comprehensive income. Current tax is the expected tax payable or receivable on the taxable income or loss for the year, using tax rates enacted or substantively enacted at the reporting date, and any adjustment to tax payable in respect of previous years. |
| | |
| Deferred income tax assets and liabilities are measured at the tax rates that are expected to be applied to temporary differences when they reverse, based on the laws that have been enacted or substantively enacted by the reporting date, for all temporary differences caused when the tax bases of assets and liabilities differ from those reported in the financial statements. The Company recognizes deferred income tax assets for unused tax losses, and deductible temporary differences only to the extent that, in management’s opinion, it is probable that future taxable profit will be available against which the temporary differences can be utilized. Deferred tax assets are reviewed at each reporting date and are reduced to the extent that it is no longer probable that the related tax benefit will be realized. Deferred income tax is provided on temporary differences arising on the Company’s investments in subsidiaries and its jointly-controlled entity, except for deferred income tax liabilities where the timing of the reversal of the temporary difference is controlled by the group and it is probable that the temporary difference will not reverse in the foreseeable future. Deferred tax is not recognized for the following temporary differences: the initial recognition of assets or liabilities in a transaction that is not a business combination and that affects neither accounting nor taxable profit or loss, and differences relating to investments in subsidiaries and jointly controlled entities to the extent that it is probable that they will not reverse in the foreseeable future. In addition, deferred tax is not recognized for taxable temporary differences arising on the initial recognition of goodwill. |
| | |
| Deferred income tax assets and liabilities are offset when there is a legally enforceable right to offset and when the deferred income taxes assets and liabilities relate to income taxes levied by the same taxation authority on either the same taxable entity or different taxable entities where there is an intention to settle the balances on a net basis. |
| | |
| In determining the amount of current and deferred income taxes, the Company takes into account the impact of uncertain tax positions and whether additional taxes and interest may be due. Provisions for uncertain tax positions are measured at the best estimate of the amounts expected to be paid upon ultimate resolution. The Company periodically reviews and adjusts its estimates and assumptions of income tax assets and liabilities as circumstances warrant, such as changes to tax laws, administrative guidance, change in management’s assessment of the technical merits of its positions due to new information, and the resolution of uncertainties through either the conclusion of tax audits or expiration of prescribed time limits within relevant statutes. |
GILDAN 2012 REPORT TO SHAREHOLDERS P.62
| | NOTES TO CONSOLIDATED FINANCIAL STATEMENTS |
3. SIGNIFICANT ACCOUNTING POLICIES (continued):
| (aa) | Earnings per share: |
| Basic earnings per share are computed by dividing net earnings by the weighted average number of common shares outstanding for the year. Diluted earnings per share are computed using the weighted average number of common shares outstanding for the period adjusted to include the dilutive impact of stock options and restricted share units. The number of additional shares is calculated by assuming that all common shares held in trust for the purpose of settling Non-treasury restricted share units have been delivered, all dilutive outstanding options are exercised and all dilutive outstanding Treasury restricted share units have vested, and that the proceeds from such exercises, as well as the amount of unrecognized share-based compensation which is considered to be assumed proceeds, are used to repurchase common shares at the average share price for the period. For Treasury restricted share units, only the unrecognized share-based compensation is considered assumed proceeds since there is no exercise price paid by the holder. |
| (bb) | Share based payments: |
Stock options and Treasury restricted share units
Stock options and Treasury restricted share units are equity settled share based payments, which are measured at fair value at the grant date. For stock options, the compensation cost is measured using the Black-Scholes option pricing model, and is expensed over the award's vesting period. For Treasury restricted share units, compensation cost is measured at the fair value of the underlying common share, and is expensed over the award's vesting period. Compensation expense is recognized in net earnings with a corresponding increase in contributed surplus. Any consideration paid by plan participants on the exercise of stock options is credited to share capital. Upon the exercise of stock options and the vesting of Treasury restricted share units, the corresponding amounts credited to contributed surplus are transferred to share capital. Stock options and Treasury restricted share units that are dilutive and meet the non-market performance conditions as at the reporting date are considered in the calculation of diluted earnings per share, as per note 3(aa) to these consolidated financial statements.
Non-Treasury restricted share units expected to be settled in cash
Non-Treasury restricted share units are expected to be settled in cash, except to the extent that common shares have been purchased on the open market and held in a trust for the purpose of settling the Non-Treasury restricted share units in shares in lieu of cash. Non-Treasury restricted share units expected to be settled in cash are accounted for as cash settled awards, with the recognized compensation expense included in accounts payable and accrued liabilities. Compensation expense is initially measured at fair value at the grant date and is recognized in net earnings over the vesting period. The liability is re-measured at fair value, based on the market price of the Company’s common shares, at each reporting date. Re-measurements during the vesting period are recognised immediately to net earnings to the extent that they relate to past services, and recognition is amortized over the remaining vesting period to the extent that they relate to future services. The cumulative compensation cost that will ultimately be recognized is the fair value of the Company's shares at the settlement date.
Non-Treasury restricted share units expected to be settled in common shares
Non-Treasury restricted share units are expected to be settled in common shares only when common shares have been purchased on the open market and held in a trust for the purpose of settling a corresponding amount of non-Treasury restricted share units in common shares in lieu of cash. At the time common shares are purchased on the open market and designated for future settlement of a corresponding amount of non-Treasury restricted share units, any accumulated accrued compensation expense previously credited to accounts payable and accrued liabilities for such non-Treasury restricted share units is transferred to contributed surplus, and compensation expense continues to be recognized over the remaining vesting period, based on the purchase cost of the common shares that are held in trust, with a corresponding increase to contributed surplus. In addition, the common shares purchased by the trust are considered as being temporarily held in treasury, as described in note 15(e) to these consolidated financial statements. Upon delivery of the common shares for settlement of vesting non-Treasury restricted share units, the corresponding amounts in contributed surplus are transferred to share capital.
GILDAN 2012 REPORT TO SHAREHOLDERS P.63
| | NOTES TO CONSOLIDATED FINANCIAL STATEMENTS |
| 3. SIGNIFICANT ACCOUNTING POLICIES (continued): |
| (bb) | Share based payments (continued): |
| | |
| | Estimates for forfeitures and performance conditions |
| The measurement of compensation expense for stock options, Treasury restricted share units and non-Treasury restricted share units is net of estimated forfeitures. For the portion of Treasury restricted share units and Non- Treasury restricted share units that are issuable based on non-market performance conditions, the amount recognized as an expense is adjusted to reflect the number of awards for which the related service and performance conditions are expected to be met, such that the amount ultimately recognized as an expense is based on the number of awards that do meet the related service and non-market performance conditions at the vesting date. |
| | |
| | Deferred share unit plan |
| The Company has a deferred share unit plan for independent members of the Company’s Board of Directors, who receive a portion of their compensation in the form of deferred share units (“DSUs”). These DSUs are cash settled awards, and are initially recognized in net earnings based on fair value at the grant date. The DSU obligation is included in accounts payable and accrued liabilities and is re-measured at fair value, based on the market price of the Company’s common shares, at each reporting date. |
| | |
| | Employee share purchase plans |
| For employee share purchase plans, the Company's contribution, on the employee's behalf, is recognized as compensation expense with an offset to share capital, and consideration paid by employees on purchase of common shares is also recorded as an increase to share capital. |
| (cc) | Leases: |
| Leases in which a significant portion of the risks and rewards of ownership are not assumed by the Company are classified as operating leases. Payments made under operating leases (net of any incentives received from the lessor) are charged to net earnings on a straight-line basis over the lease term. |
| | |
| Leases of property, plant and equipment where the Company has substantially all of the risks and rewards of ownership are classified as finance leases. Finance leases are capitalized at the lease’s commencement at the lower of the fair value of the leased property and the present value of the minimum lease payments. The property, plant and equipment acquired under finance leases are depreciated over the shorter of the useful life of the asset and the lease term. |
| | |
| Determining whether an arrangement contains a lease |
| At inception of an arrangement where the Company receives the right to use an asset, the Company determines whether such an arrangement is or contains a lease. A specific asset is the subject of a lease if fulfillment of the arrangement is dependent on the use of that specified asset. An arrangement conveys the right to use the asset if the arrangement conveys to the Company the right to control the use of the underlying asset. |
| (dd) | Use of estimates and judgments: |
| The preparation of financial statements in conformity with IFRS requires management to make estimates and assumptions that affect the application of accounting policies and the reported amounts of assets, liabilities, income and expenses. Actual results may differ from these estimates. |
| | |
| Estimates and underlying assumptions are reviewed on an ongoing basis. Revisions to accounting estimates are recognized in the period in which the estimates are revised and in any future periods affected. The Company has not made any significant changes to its estimates in the past two years. |
GILDAN 2012 REPORT TO SHAREHOLDERS P.64
| | NOTES TO CONSOLIDATED FINANCIAL STATEMENTS |
| 3. SIGNIFICANT ACCOUNTING POLICIES (continued): |
(dd) | Use of estimates and judgments (continued): |
| | |
| | Critical judgments in applying accounting policies: |
| | |
| The following are critical judgements that management has made in the process of applying accounting policies and that have the most significant effect on the amounts recognized in the consolidated financial statements: |
| | |
| | Determination of Cash Generating Units (CGUs) |
| The identification of CGUs and grouping of assets into the respective CGUs is based on currently available information about actual utilization experience and expected future business plans. Management has taken into consideration various factors in identifying its CGUs including how the Company manages and monitors its operations, which is essentially based on operating segments that are organized by the major customer markets they serve. As such, the Company has identified its CGUs for purposes of testing the recoverability and impairment of non-financial assets to be the same as the segments used for financial reporting purposes, which are the Printwear and Branded Apparel operating segments. |
| | |
| | Income taxes |
| The Company’s income tax provisions and income tax assets and liabilities are based on interpretations of applicable tax laws, including income tax treaties between various countries in which the Company operates as well as underlying rules and regulations with respect to transfer pricing. These interpretations involve judgments and estimates and may be challenged through government taxation audits that the Company is regularly subject to. New information may become available that causes the Company to change its judgment regarding the adequacy of existing income tax assets and liabilities; such changes will impact net earnings in the period that such a determination is made. |
| | |
| | Key sources of estimation uncertainty |
| | |
| Key sources of estimation uncertainty that have a significant risk of resulting in a material adjustment to the carrying amount of assets and liabilities within the next financial year are as follows: |
| | |
| | Allowance for doubtful accounts |
| The Company makes an assessment of whether accounts receivable are collectable, which takes into account the credit-worthiness of each customer in order to estimate an appropriate allowance for doubtful accounts. Furthermore, these estimates must be continuously evaluated and updated. The Company is not able to predict changes in the financial condition of its customers, and if circumstances related to its customers’ financial condition deteriorate, the estimates of the recoverability of trade accounts receivable could be materially affected and the Company may be required to record additional allowances. Alternatively, if the Company provides more allowances than needed, a reversal of a portion of such allowances in future periods may be required based on actual collection experience. |
| | |
| | Inventory valuation |
| The Company regularly reviews inventory quantities on hand and records a provision for those inventories no longer deemed to be fully recoverable. The cost of inventories may no longer be recoverable if those inventories are slow moving, damaged, if they have become obsolete, or if their selling prices or estimated forecast of product demand decline. If actual market conditions are less favorable than previously projected, or if liquidation of the inventory no longer deemed to be fully recoverable is more difficult than anticipated, additional provisions may be required. |
| | |
| | Business combinations |
| Business combinations are accounted for in accordance with the acquisition method. On the date that control is obtained, the identifiable assets, liabilities and contingent liabilities of the acquired company are measured at their fair value. Depending on the complexity of determining these valuations, the Company uses appropriate valuation techniques which are generally based on a forecast of the total expected future net discounted cash flows. These valuations are linked closely to the assumptions made by management regarding the future performance of the related assets and the discount rate applied. |
GILDAN 2012 REPORT TO SHAREHOLDERS P.65
| | NOTES TO CONSOLIDATED FINANCIAL STATEMENTS |
| 3. | SIGNIFICANT ACCOUNTING POLICIES (continued): |
(dd) | Use of estimates and judgments (continued): |
| | |
| | Recoverability and impairment of non-financial assets |
| The calculation of value in use for purposes of measuring the recoverable amount of non-financial asset involves the use of significant assumptions and estimates with respect to a variety of factors, including expected sales, gross margins, SG&A expenses, capital expenditures, cash flows and the selection of an appropriate discount rate, all of which are subject to inherent uncertainties and subjectivity. The assumptions are based on annual business plans and other forecasted results as well as discount rates which are used to reflect market based estimates of the risks associated with the projected cash flows, based on the best information available as of the date of the impairment test. Changes in circumstances, such as technological advances, adverse changes in third party licensing arrangements, changes to the Company’s business strategy, and changes in economic conditions can result in actual useful lives and future cash flows differing significantly from estimates and could result in increased charges for amortization or impairment. Revisions to the estimated useful lives of finite life non-financial assets or future cash flows constitute a change in accounting estimate and are applied prospectively. There can be no assurance that the estimates and assumptions used in the impairment tests will prove to be accurate predictions of the future. If the future adversely differs from management’s best estimate of key economic assumptions, and if associated cash flows materially decrease, the Company may be required to record material impairment charges related to its non-financial assets. |
| | |
| | Measurement of the estimate of expected expenditures for decommissioning and site restoration costs |
| The measurement of the provision for decommissioning and site restoration costs requires assumptions to be made including expected timing of the event which would result in the outflow of resources, the range of possible methods of decommissioning and site restoration, and the expected costs that would be incurred to settle any decommissioning and site restoration liabilities. The Company has measured the provision using the present value of the expected expenditures which requires assumptions on the discount rate to use. Revisions to any of the assumptions and estimates used by management may result in changes to the expected expenditures to settle the liability which would require adjustments to the provision which may have an impact on the operating results of the Company in the period the change occurs. |
| | |
| | Income taxes |
| The Company recognizes deferred income tax assets for unused tax losses, and deductible temporary differences only to the extent that, in management’s opinion, it is probable that future taxable profit will be available against which available tax losses and temporary differences can be utilized. The Company’s projections of future taxable profit involve the use of significant assumptions and estimates with respect to a variety of factors, including future sales and operating expenses. There can be no assurance that the estimates and assumptions used in our projections of future taxable income will prove to be accurate predictions of the future, and in the event that our assessment of the recoverability of these deferred tax assets changes in the future, a material reduction in the carrying value of these deferred tax assets could be required, with a corresponding charge to net earnings. |
| 4.NEW ACCOUNTING STANDARDS AND INTERPRETATIONS NOT YET APPLIED: |
A number of new accounting standards, and amendments to accounting standards and interpretations, are not yet effective for the year ending September 30, 2012, and have not been applied in preparing these audited annual consolidated financial statements. These include:
Financial instruments
In October 2010, the IASB released IFRS 9, Financial Instruments, which is the first part of a three-part project to replace IAS 39, Financial Instruments: Recognition and Measurement. This first part only covers classification and measurement of financial assets and financial liabilities, with impairment of financial assets and hedge accounting being addressed in the other two parts.
IFRS 9 uses a single approach to determine whether a financial asset is measured at amortized cost or fair value, replacing the multiple rules in IAS 39. The approach in IFRS 9 is based on how an entity manages its financial instruments and the contractual cash flow characteristics of the financial assets. Most of the requirements in IAS 39 for classification and measurement of financial liabilities were carried forward in IFRS 9. However, requirements for measuring a financial liability at fair value have changed, as the portion of the changes in fair value related to the entity’s own credit risk must be presented in other comprehensive income rather than in net earnings. IFRS 9 will be effective for the Company’s fiscal year beginning on October 5, 2015, with earlier application permitted. The Company has not yet assessed the impact of the adoption of this standard on its consolidated financial statements.
GILDAN 2012 REPORT TO SHAREHOLDERS P.66
| | NOTES TO CONSOLIDATED FINANCIAL STATEMENTS |
| 4.NEW ACCOUNTING STANDARDS AND INTERPRETATIONS NOT YET APPLIED (continued): |
Consolidation
In May 2011, the IASB released IFRS 10, Consolidated Financial Statements, which replaces SIC-12, Consolidation -Special Purpose Entities, and parts of IAS 27, Consolidated and Separate Financial Statements. The new standard builds on existing principles by identifying the concept of control as the determining factor in whether an entity should be included in a company’s consolidated financial statements. The standard provides additional guidance to assist in the determination of control where it is difficult to assess. IFRS 10 will be effective for the Company’s fiscal year beginning on September 30, 2013, with earlier application permitted. The Company has not yet assessed the impact of the adoption of this standard on its consolidated financial statements.
Joint arrangements
In May 2011, the IASB released IFRS 11, Joint Arrangements, which supersedes IAS 31, Interests in Joint Ventures, and SIC-13, Jointly Controlled Entities - Non-monetary Contributions by Venturers. IFRS 11 focuses on the rights and obligations of a joint arrangement, rather than its legal form as is currently the case under IAS 31. The standard addresses inconsistencies in the reporting of joint arrangements by requiring the equity method to account for interests in joint ventures. IFRS 11 will be effective for the Company’s fiscal year beginning on September 30, 2013, with earlier application permitted. The Company has not yet assessed the impact of the adoption of this standard on its consolidated financial statements.
Disclosure of interests in other entities
In May 2011, the IASB released IFRS 12, Disclosure of Interests in Other Entities. IFRS 12 is a new and comprehensive standard on disclosure requirements for all forms of interests in other entities, including subsidiaries, joint arrangements, associates, and unconsolidated structured entities. The standard requires an entity to disclose information regarding the nature and risks associated with its interests in other entities and the effects of those interests on its financial position, financial performance and cash flows. IFRS 12 will be effective for the Company’s fiscal year beginning on September 30, 2013, with earlier application permitted. The Company has not yet assessed the impact of the adoption of this standard on its consolidated financial statements.
Fair value measurement
In May 2011, the IASB released IFRS 13, Fair value measurement. IFRS 13 will improve consistency and reduce complexity by providing a precise definition of fair value and a single source of fair value measurement and disclosure requirements for use across IFRS. The standard will be effective for the Company’s fiscal year beginning on September 30, 2013, with earlier application permitted. The Company has not yet assessed the impact of the adoption of this standard on its consolidated financial statements.
Financial statement presentation
In June 2011, the IASB amended IAS 1, Presentation of Financial Statements. The principal change resulting from the amendments to IAS 1 is a requirement to group together items within other comprehensive income that may be reclassified to the statement of income. The amendments also reaffirm existing requirements that items in other comprehensive income and net income should be presented as either a single statement or two consecutive statements. The amendments to IAS 1 will be effective for the Company’s fiscal year beginning on October 1, 2012. As the amendments only require changes in the presentation of items in other comprehensive income, the Company does not expect the amendments to the standard to have a material impact on its consolidated financial statements.
Employee benefits
In June 2011, the IASB amended IAS 19, Employee Benefits. Amongst other changes, the amendments require entities to compute the financing cost component of defined benefit plans by applying the discount rate used to measure post-employment benefit obligations to the net post-employment benefit obligations (usually, the present value of defined benefit obligations less the fair value of plan assets). Furthermore, the amendments to IAS 19 enhance the disclosure requirements for defined benefit plans, providing additional information about the characteristics of defined benefit plans and the risks that entities are exposed to through participation in those plans. The amendment to IAS 19 will be effective for the Company’s fiscal years beginning on September 30, 2013, with earlier application permitted. The Company has not yet assessed the impact of the adoption of the amendments on its consolidated financial statements.
GILDAN 2012 REPORT TO SHAREHOLDERS P.67
| | NOTES TO CONSOLIDATED FINANCIAL STATEMENTS |
Anvil Holdings, Inc.
On May 9, 2012, the Company acquired 100% of the common shares of Anvil Holdings, Inc. (“Anvil”) for cash consideration of $87.4 million, net of cash acquired. Anvil is a supplier of high-quality basic T-shirts and sport shirts. The acquisition of Anvil further enhances the Company’s leadership position in the U.S. printwear market, and also positions the Company with potential growth opportunities as a supply chain partner to leading consumer brands with rigorous criteria for product quality and social responsibility. The acquisition is also expected to generate cost savings from integration synergies. The Company financed the acquisition by the utilization of its revolving long-term credit facility.
The Company accounted for this acquisition using the acquisition method in accordance with IFRS 3, Business Combinations, and the results of Anvil have been consolidated with those of the Company from the date of acquisition. The Company has determined the fair value of the assets acquired and liabilities assumed based on management’s best estimate of their fair values and taking into account all relevant information available at that time.
The following table summarizes the amounts recognized for the assets acquired and liabilities assumed at the date of acquisition:
Assets acquired: | | | |
Trade accounts receivable | $ | 31,491 | |
Income taxes receivable | | 2,253 | |
Inventories | | 59,005 | |
Prepaid expenses and deposits | | 1,796 | |
Other current assets | | 501 | |
Property, plant and equipment | | 14,753 | |
Intangible assets (i) | | 9,700 | |
Deferred income taxes | | 5,066 | |
Other assets | | 1,714 | |
| | 126,279 | |
| | | |
Liabilities assumed: | | | |
Accounts payable and accrued liabilities | | (26,276 | ) |
Employee benefit obligations | | (1,451 | ) |
Provisions | | (4,500 | ) |
| | (32,227 | ) |
| | | |
Net identifiable assets acquired | | 94,052 | |
Purchase gain on business acquisition | | (6,679 | ) |
Consideration transferred (excluding cash acquired of $627) | $ | 87,373 | |
| (i) | The intangible assets acquired are comprised of customer relationships in the amount of $5.0 million, which are being amortized on a straight line basis over their estimated useful lives of seven years, and trademarks in the amount of $4.7 million, which are not being amortized as they are considered to be indefinite life intangible assets. |
The fair value of acquired trade accounts receivable was $31.5 million. Gross contractual amounts receivable were $32.9 million and the best estimate at the date of acquisition of the contractual cash flows not expected to be collected amounted to $1.4 million.
The excess of the net assets acquired over the consideration transferred represents a purchase gain on business acquisition of approximately $6.7 million. Excluded from the purchase gain are $1.2 million of acquisition-related transaction costs and $10.2 million of charges relating to a restructuring plan pursuant to the acquisition of Anvil. These charges were identified during the acquisition process, but were not recognized as liabilities assumed in the acquisition accounting in accordance with IFRS. The purchase gain in connection with this acquisition is not taxable. The purchase gain, acquisition-related transaction costs and charges relating to the restructuring plan have been included in restructuring and acquisition-related costs in the consolidated statements of earnings and comprehensive income.
GILDAN 2012 REPORT TO SHAREHOLDERS P.68
| | NOTES TO CONSOLIDATED FINANCIAL STATEMENTS |
| 5.BUSINESS ACQUISITIONS (continued): |
Anvil Holdings, Inc. (continued)
The consolidated results of the Company for fiscal 2012 include net sales of $86.1 million and net earnings of $2.1 million relating to Anvil’s results of operation since the date of acquisition, excluding the purchase gain on business acquisition of $6.7 million and acquisition-related transaction costs of $1.2 million. Anvil’s net earnings before the after-tax impact of restructuring and acquisition-related costs since the date of acquisition to September 30, 2012 amounted to $9.0 million.
If the acquisition of Anvil is accounted for on a pro forma basis as if it had occurred at the beginning of the Company’s fiscal year, the Company’s consolidated net sales and net earnings for the year ended September 30, 2012 would have been $2,081.5 million and $138.0 million, respectively. These pro forma figures have been estimated based on the results of Anvil’s operations prior to being purchased by the Company, adjusted to reflect the fair value adjustments, which arose on the date of acquisition, as if the acquisition occurred on October 3, 2011, and should not be viewed as indicative of the Company’s future results.
Gold Toe Moretz Holdings Corp.
On April 15, 2011, the Company acquired 100% of the common shares of Gold Toe Moretz Holdings Corp. (“Gold Toe Moretz”) for consideration transferred of $347.7 million, net of cash acquired, including contingent consideration of approximately $5.3 million. Gold Toe Moretz is a leading supplier of high-quality branded athletic, casual and dress socks for national chains, mass-market retailers, price clubs, department stores and specialty sporting goods stores in the United States. The acquisition of Gold Toe Moretz provided the Company with enhanced brand management expertise which is being utilized to further the development of the Gildan® brand. In addition to the introduction of leading consumer brands, the acquisition significantly expanded and diversified the Company’s channels of distribution in the U.S. retail market.
The Company financed the acquisition by using approximately $100 million of cash on hand and approximately $250 million drawn on the Company’s revolving long-term credit facility.
The Company accounted for this acquisition using the acquisition method in accordance with IFRS 3, Business Combinations, and the results of Gold Toe Moretz have been consolidated with those of the Company from the date of acquisition. The Company has determined the fair value of the assets acquired and liabilities assumed based on management’s best estimate of their fair values and taking into account all relevant information available at that time.
Acquisition-related transaction costs of $7.3 million have been included in restructuring and acquisition-related costs in the consolidated statements of earnings and comprehensive income. The fair value of acquired trade accounts receivable was $28.2 million. Gross contractual amounts receivable were $28.5 million and the best estimate at the date of acquisition of the contractual cash flows not expected to be collected amounted to $0.3 million.
The contingent consideration at the date of acquisition was comprised of up to 150,000 common shares which were issued in the form of treasury restricted share units (“Treasury RSUs”) contingent on specified future events. The contingent consideration is classified as a financial liability and is included in accounts payable and accrued liabilities. The contingent consideration was initially measured at fair value, and is re-measured at fair value at each reporting date through net earnings in restructuring and acquisition-related costs. Fair value has been estimated based on the Company’s share price at the reporting date and the best estimate of the number of Treasury RSUs expected to vest. During fiscal 2012, certain specified future events were confirmed resulting in 120,000 Treasury RSUs with a fair value of $3.4 million being reclassified from accounts payable and accrued liabilities to contributed surplus with no further remeasurements in the fair value because there is no longer any variability in the number of common shares required to settle the liability. The balance of the contingent consideration payable as at September 30, 2012 is $1.0 million (October 2, 2011 - $3.9 million) which reflects the fair value of the remaining 30,000 Treasury RSUs expected to vest. The re-measurement of the contingent consideration resulted in a charge to net earnings and comprehensive income for fiscal 2012 of $0.5 million (2011 - credit of $1.5 million), and is included in restructuring and acquisition-related costs (see note 19).
GILDAN 2012 REPORT TO SHAREHOLDERS P.69
| | NOTES TO CONSOLIDATED FINANCIAL STATEMENTS |
| 5.BUSINESS ACQUISITIONS (continued): |
Gold Toe Moretz Holdings Corp. (continued)
The following table summarizes the amounts recognized for the assets acquired and liabilities assumed at the date of acquisition:
Assets acquired: | | | |
Trade accounts receivable | $ | 28,150 | |
Income taxes receivable | | 208 | |
Inventories | | 57,549 | |
Prepaid expenses and deposits | | 1,410 | |
Other current assets | | 122 | |
Property, plant and equipment | | 3,523 | |
Intangible assets (i) | | 204,700 | |
Other assets | | 495 | |
| | 296,157 | |
| | | |
Liabilities assumed: | | | |
Accounts payable and accrued liabilities | | (31,969 | ) |
Employee benefit obligations | | (17,068 | ) |
Deferred income taxes | | (31,178 | ) |
| | (80,215 | ) |
| | | |
Net identifiable assets acquired | | 215,942 | |
Goodwill | | 131,736 | |
Consideration transferred (excluding cash acquired of $3,576) | $ | 347,678 | |
| | | |
Consideration transferred: | | | |
Cash paid at closing, net of cash acquired of $3,576 | $ | 342,368 | |
Contingent consideration | | 5,310 | |
| $ | 347,678 | |
Goodwill recorded in connection with this acquisition is not deductible for tax purposes.
| (i) | The intangible assets below, with the exception of the trademarks, are being amortized on a straight line basis over their estimated useful lives. The trademarks are not being amortized as they are considered to be indefinite life intangible assets. |
| | Trademarks | | Indefinite life | | $ | 94,000 | |
| | License agreements | | 7 years | | | 51,000 | |
| | Customer relationships | | 20 years | | | 58,000 | |
| | Non-compete agreements | | 2 years | | | 1,700 | |
| | | | | | $ | 204,700 | |
GILDAN 2012 REPORT TO SHAREHOLDERS P.70
| | NOTES TO CONSOLIDATED FINANCIAL STATEMENTS |
| 6.CASH AND CASH EQUIVALENTS: |
| | | September 30, | | | October 2, | | | October 4, | |
| | | 2012 | | | 2011 | | | 2010 | |
| | | | | | | | | | |
| Bank balances | $ | 68,748 | | $ | 80,474 | | $ | 188,680 | |
| Term deposits | | 1,662 | | | 1,551 | | | 62,163 | |
| | $ | 70,410 | | $ | 82,025 | | $ | 250,843 | |
| 7.TRADE ACCOUNTS RECEIVABLE: |
| | | September 30, | | | October 2, | | | October 4, | |
| | | 2012 | | | 2011 | | | 2010 | |
| | | | | | | | | | |
| Trade accounts receivable | $ | 265,090 | | $ | 195,700 | | $ | 152,653 | |
| Allowance for doubtful accounts | | (4,495 | ) | | (4,106 | ) | | (6,969 | ) |
| | $ | 260,595 | | $ | 191,594 | | $ | 145,684 | |
| The movement in the allowance for doubtful accounts in respect of trade receivables was as follows: |
| | | 2012 | | | 2011 | |
| | | | | | | |
Balance, beginning of year | $ | (4,106 | ) | $ | (6,969 | ) |
Bad debt recovery (expense) | | 401 | | | (632 | ) |
Write-off of trade accounts receivable | | 648 | | | 3,757 | |
Increase due to business acquisitions (note 5) | | (1,438 | ) | | (262 | ) |
Balance, end of year | $ | (4,495 | ) | $ | (4,106 | ) |
| | | September 30, | | | October 2, | | | October 4, | |
| | | 2012 | | | 2011 | | | 2010 | |
| | | | | | | | | | |
Raw materials and spare parts inventories | $ | 61,841 | | $ | 66,914 | | $ | 50,862 | |
Work in process | | 37,358 | | | 31,710 | | | 37,410 | |
Finished goods | | 453,869 | | | 469,687 | | | 241,246 | |
| | $ | 553,068 | | $ | 568,311 | | $ | 329,518 | |
The amount of inventories recognized as an expense and included in cost of sales was $1,517.8 million for fiscal 2012 (2011 - $1,262.7 million), which included an expense of $4.2 million (2011 - $6.2 million) related to the write-down of inventory to net realizable value.
| 9.PROPERTY, PLANT AND EQUIPMENT: |
| | | | | | | | | | | | | | | Assets not yet | | | | |
| | | | | | Buildings and | | | Manufacturing | | | Other | | | utilized in | | | | |
| | | Land | | | improvements | | | equipment | | | equipment | | | operations | | | Total | |
| | | | | | | | | | | | | | | | | | | |
Net carrying amount | | | | | | | | | | | | | | | | | | |
At September 30, 2012 | $ | 38,936 | | $ | 165,864 | | $ | 289,418 | | $ | 46,450 | | $ | 11,769 | | $ | 552,437 | |
At October 2, 2011 | $ | 35,113 | | $ | 141,649 | | $ | 273,190 | | $ | 52,825 | | $ | 47,547 | | $ | 550,324 | |
At October 4, 2010 | $ | 34,487 | | $ | 122,005 | | $ | 227,143 | | $ | 55,059 | | $ | 44,319 | | $ | 483,013 | |
GILDAN 2012 REPORT TO SHAREHOLDERS P.71
| | NOTES TO CONSOLIDATED FINANCIAL STATEMENTS |
| 9.PROPERTY, PLANT AND EQUIPMENT (continued): |
| | | | | | | | | | | | | | | Assets not yet | | | | |
| | | | | | Buildings and | | | Manufacturing | | | Other | | | utilized in | | | | |
| 2012 | | Land | | | improvements | | | equipment | | | equipment | | | operations | | | Total | |
| | | | | | | | | | | | | | | | | | | |
Cost | | | | | | | | | | | | | | | | | | |
Balance, October 2, 2011 | $ | 35,113 | | $ | 194,530 | | $ | 464,886 | | $ | 91,853 | | $ | 47,547 | | $ | 833,929 | |
Additions | | 3,620 | | | 17,066 | | | 35,891 | | | 4,689 | | | 8,755 | | | 70,021 | |
Additions through business acquisitions | | 100 | | | 2,703 | | | 7,310 | | | 1,626 | | | 3,014 | | | 14,753 | |
Transfers from or to assets held for sale | | 114 | | | (212 | ) | | - | | | - | | | - | | | (98 | ) |
Transfers | | - | | | 17,337 | | | 30,210 | | | - | | | (47,547 | ) | | - | |
Disposals | | (11 | ) | | (392 | ) | | (5,956 | ) | | (1,544 | ) | | - | | | (7,903 | ) |
Balance, September 30, 2012 | $ | 38,936 | | $ | 231,032 | | $ | 532,341 | | $ | 96,624 | | $ | 11,769 | | $ | 910,702 | |
| | | | | | | | | | | | | | | | | | |
Depreciation | | | | | | | | | | | | | | | | | | |
Balance, October 2, 2011 | $ | - | | $ | 52,881 | | $ | 191,696 | | $ | 39,028 | | $ | - | | $ | 283,605 | |
Depreciation expense | | - | | | 12,494 | | | 55,763 | | | 12,560 | | | - | | | 80,817 | |
Transfers from or to assets held for sale | | - | | | (137 | ) | | - | | | - | | | - | | | (137 | ) |
Disposals | | - | | | (70 | ) | | (4,536 | ) | | (1,414 | ) | | - | | | (6,020 | ) |
Balance, September 30, 2012 | $ | - | | $ | 65,168 | | $ | 242,923 | | $ | 50,174 | | $ | - | | $ | 358,265 | |
| | | | | | | | | | | | | | | Assets not yet | | | | |
| | | | | | Buildings and | | | Manufacturing | | | Other | | | utilized in | | | | |
| 2011 | | Land | | | improvements | | | equipment | | | equipment | | | operations | | | Total | |
| | | | | | | | | | | | | | | | | | | |
Cost | | | | | | | | | | | | | | | | | | |
Balance, October 4, 2010 | $ | 34,487 | | $ | 168,747 | | $ | 386,846 | | $ | 85,966 | | $ | 44,319 | | $ | 720,365 | |
Additions | | 1,825 | | | 15,221 | | | 74,374 | | | 20,017 | | | 47,078 | | | 158,515 | |
Additions through business acquisitions | | 140 | | | 1,040 | | | - | | | 1,874 | | | 469 | | | 3,523 | |
Transfers from or to assets held for sale | | (1,339 | ) | | (15,228 | ) | | (6,199 | ) | | (1,640 | ) | | - | | | (24,406 | ) |
Transfers | | - | | | 24,750 | | | 14,279 | | | 5,290 | | | (44,319 | ) | | - | |
Disposals | | - | | | - | | | (4,414 | ) | | (19,654 | ) | | - | | | (24,068 | ) |
Balance, October 2, 2011 | $ | 35,113 | | $ | 194,530 | | $ | 464,886 | | $ | 91,853 | | $ | 47,547 | | $ | 833,929 | |
| | | | | | | | | | | | | | | | | | |
Depreciation | | | | | | | | | | | | | | | | | | |
Balance, October 4, 2010 | $ | - | | $ | 46,742 | | $ | 159,703 | | $ | 30,907 | | $ | - | | $ | 237,352 | |
Depreciation expense | | - | | | 10,743 | | | 40,233 | | | 13,192 | | | - | | | 64,168 | |
Transfers from or to assets held for sale | | - | | | (4,604 | ) | | (6,189 | ) | | (1,454 | ) | | - | | | (12,247 | ) |
Disposals | | - | | | - | | | (2,051 | ) | | (3,617 | ) | | - | | | (5,668 | ) |
Balance, October 2, 2011 | $ | - | | $ | 52,881 | | $ | 191,696 | | $ | 39,028 | | $ | - | | $ | 283,605 | |
Assets not yet utilized in operations include expenditures incurred to date for plant expansions which are still in process and equipment not yet placed into service as at the end of the reporting period.
As at September 30, 2012, there were contractual purchase obligations outstanding of approximately $38.3 million for the acquisition of property, plant and equipment compared to $54.9 million as of October 2, 2011.
GILDAN 2012 REPORT TO SHAREHOLDERS P.72
| | NOTES TO CONSOLIDATED FINANCIAL STATEMENTS |
| 10. INTANGIBLE ASSETS AND GOODWILL: |
Intangible assets
| | | Customer | | | | | | | | | | | | | | | | |
| | | contracts and | | | | | | | | | | | | Non- | | | | |
| | | customer | | | | | | License | | | Computer | | | compete | | | | |
| | | relationships | | | Trademarks | | | agreements | | | software | | | agreements | | | Total | |
| | | | | | | | | | | | | | | | | | | |
| Net carrying amount | | | | | | | | | | | | | | | | | | |
| At September 30, 2012 | $ | 110,567 | | $ | 102,045 | | $ | 39,913 | | $ | 6,996 | | $ | 460 | | $ | 259,981 | |
| At October 2, 2011 | $ | 112,266 | | $ | 94,000 | | $ | 47,516 | | $ | 6,561 | | $ | 1,310 | | $ | 261,653 | |
| At October 4, 2010 | $ | 59,050 | | $ | - | | $ | - | | $ | 7,761 | | $ | - | | $ | 66,811 | |
| | | Customer | | | | | | | | | | | | | | | | |
| | | contracts and | | | | | | | | | | | | Non- | | | | |
| | | customer | | | | | | License | | | Computer | | | compete | | | | |
| 2012 | | relationships | | | Trademarks | | | agreements | | | software | | | agreements | | | Total | |
| | | | | | | | | | | | | | | | | | | |
Cost | | | | | | | | | | | | | | | | | | |
Balance, October 2, 2011 | $ | 128,866 | | $ | 94,000 | | $ | 51,000 | | $ | 26,038 | | $ | 1,700 | | $ | 301,604 | |
Additions | | - | | | 3,345 | | | - | | | 2,094 | | | - | | | 5,439 | |
Additions through business acquisitions | | 5,000 | | | 4,700 | | | - | | | - | | | - | | | 9,700 | |
Disposals | | - | | | - | | | - | | | (27 | ) | | - | | | (27 | ) |
Balance, September 30, 2012 | $ | 133,866 | | $ | 102,045 | | $ | 51,000 | | $ | 28,105 | | $ | 1,700 | | $ | 316,716 | |
| | | | | | | | | | | | | | | | | | |
Amortization | | | | | | | | | | | | | | | | | | |
Balance, October 2, 2011 | $ | 16,600 | | $ | - | | $ | 3,484 | | $ | 19,477 | | $ | 390 | | $ | 39,951 | |
Amortization for the year | | 6,699 | | | - | | | 7,603 | | | 1,659 | | | 850 | | | 16,811 | |
Disposals | | - | | | - | | | - | | | (27 | ) | | - | | | (27 | ) |
Balance, September 30, 2012 | $ | 23,299 | | $ | - | | $ | 11,087 | | $ | 21,109 | | $ | 1,240 | | $ | 56,735 | |
| | | Customer | | | | | | | | | | | | | | | | |
| | | contracts and | | | | | | | | | | | | Non- | | | | |
| | | customer | | | | | | License | | | Computer | | | compete | | | | |
| 2011 | | relationships | | | Trademarks | | | agreements | | | software | | | agreements | | | Total | |
| | | | | | | | | | | | | | | | | | | |
Cost | | | | | | | | | | | | | | | | | | |
Balance, October 4, 2010 | $ | 70,866 | | $ | - | | $ | - | | $ | 26,453 | | $ | - | | $ | 97,319 | |
Additions | | - | | | - | | | - | | | 4,776 | | | - | | | 4,776 | |
Additions through business acquisitions | | 58,000 | | | 94,000 | | | 51,000 | | | - | | | 1,700 | | | 204,700 | |
Disposals | | - | | | - | | | - | | | (5,191 | ) | | - | | | (5,191 | ) |
Balance, October 2, 2011 | $ | 128,866 | | $ | 94,000 | | $ | 51,000 | | $ | 26,038 | | $ | 1,700 | | $ | 301,604 | |
| | | | | | | | | | | | | | | | | | |
Amortization | | | | | | | | | | | | | | | | | | |
Balance, October 4, 2010 | $ | 11,816 | | $ | - | | $ | - | | $ | 18,692 | | $ | - | | $ | 30,508 | |
Amortization for the year | | 4,784 | | | - | | | 3,484 | | | 4,733 | | | 390 | | | 13,391 | |
Disposals | | - | | | - | | | - | | | (3,948 | ) | | - | | | (3,948 | ) |
Balance, October 2, 2011 | $ | 16,600 | | $ | - | | $ | 3,484 | | $ | 19,477 | | $ | 390 | | $ | 39,951 | |
GILDAN 2012 REPORT TO SHAREHOLDERS P.73
| | NOTES TO CONSOLIDATED FINANCIAL STATEMENTS |
| 10.INTANGIBLE ASSETS AND GOODWILL (continued): |
Goodwill
| | | 2012 | | | 2011 | |
| | | | | | | |
| Balance, beginning of period | $ | 141,933 | | $ | 10,197 | |
| Goodwill acquired (note 5) | | - | | | 131,736 | |
| Balance, end of period | $ | 141,933 | | $ | 141,933 | |
Recoverability of cash-generating units
Goodwill acquired through business acquisitions and trademarks with indefinite useful lives have been allocated to CGUs that are expected to benefit from the synergies of the acquisition, as follows:
| | | September 30, | | | October 2, | | | October 4, | |
| | | 2012 | | | 2011 | | | 2010 | |
| | | | | | | | | | |
| Branded Apparel | | | | | | | | | |
| Goodwill | $ | 138,445 | | $ | 138,445 | | $ | 6,709 | |
| Trademarks | | 97,345 | | | 94,000 | | | - | |
| | | 235,790 | | | 232,445 | | | 6,709 | |
| | | | | | | | | | |
| Printwear | | | | | | | | | |
| Goodwill | | 3,488 | | | 3,488 | | | 3,488 | |
| Trademarks | | 4,700 | | | - | | | - | |
| | $ | 8,188 | | $ | 3,488 | | $ | 3,488 | |
In assessing whether goodwill and indefinite life intangible assets are impaired, the carrying amount of the CGUs (including goodwill and indefinite life intangible assets) are compared to their recoverable amount. The recoverable amounts of CGUs are based on the higher of the value in use and fair value less costs to sell. The Company performed the annual impairment review for goodwill and indefinite life intangible assets as at September 30, 2012, and the estimated recoverable amounts exceeded the carrying amounts of the CGUs and there was no impairment identified.
Recoverable amount – Branded Apparel
The Company determined the recoverable amount of the Branded Apparel CGU based on a value in use calculation using cash flow projections, which take into account financial budgets and forecasts approved by senior management covering a five-year period with a terminal value calculated by discounting the final year in perpetuity. The key assumptions for the value in use calculation include estimated sales volumes, selling prices and input costs, as well as discount rates which are based on estimates of the risks associated with the projected cash flows based on the best information available as of the date of the impairment test. The pre-tax discount rate applied to cash flow projections is 15.2% . The growth rate used to calculate the terminal value is based on growth rates reflecting inflation ranging from 1% to 2% and do not exceed the long-term historical growth rate and industry average growth rate. The Company determined that no reasonably possible change in the assumptions would have resulted in any impairment of goodwill or indefinite life intangible assets.
GILDAN 2012 REPORT TO SHAREHOLDERS P.74
| | NOTES TO CONSOLIDATED FINANCIAL STATEMENTS |
The Company's subsidiary in Bangladesh, Shahriyar Fabric Industries Limited, has a banking facility limited to a maximum aggregate amount of $23.8 million (BDT 1,950,000,000). The banking facility bears interest at a variable LIBOR-based rate plus a spread ranging from 250 to 400 basis points, and any borrowings are due on demand. There were no amounts drawn under the line of credit at September 30, 2012, October 2, 2011 and October 4, 2010.
The Company has a committed revolving long-term credit facility of $800 million, on an unsecured basis. Amounts drawn under the facility during fiscal 2012 bore interest at a variable banker’s acceptance or U.S. LIBOR-based interest rate plus a spread ranging from 125 to 200 basis points. As at September 30, 2012, $181.0 million (October 2, 2011 - $209.0 million; October 4, 2010 - nil) was drawn under this facility bearing an effective interest rate for the period of 2.2%, including the impact of interest rate swaps. In addition, an amount of $6.0 million (October 2, 2011 -$5.8 million; October 4, 2010 - $12.7 million) has been committed against this facility to cover various letters of credit as described in note 25. The revolving long-term credit facility requires the Company to comply with certain covenants including maintenance of a net debt to trailing twelve months EBITDA ratio below 3.0:1, although the credit agreement provides that this limit may be exceeded in the short term under certain circumstances, as well as an interest coverage ratio of at least 3.5:1. EBITDA is defined under the facility as net earnings before interest, income taxes, depreciation and amortization, with adjustments for certain non-recurring items. As at September 30, 2012, the Company was in compliance with these covenants.
In November 2012, the Company amended its revolving long-term credit facility to extend the maturity date from June 2016 to January 2018. The amended agreement provides for an annual extension clause, subject to the approval of the lenders. It also provides for a reduction in drawn pricing when the net debt to EBITDA ratio is below 1.0:1, and reduced undrawn pricing.
| 13.EMPLOYEE BENEFIT OBLIGATIONS: |
| | | September 30, | | | October 2, | | | October 4, | |
| | | 2012 | | | 2011 | | | 2010 | |
| | | | | | | | | | |
| Defined benefit pension plan | $ | 5,871 | | $ | 6,419 | | $ | 1,233 | |
| Statutory severance obligation | | 12,246 | | | 12,586 | | | 10,231 | |
| Defined contribution plan | | 1,495 | | | 1,241 | | | 715 | |
| | $ | 19,612 | | $ | 20,246 | | $ | 12,179 | |
| (a) | Defined benefit plan: |
| | |
| The Company has a funded qualified defined benefit pension plan (“Retirement Plan”) covering certain employees of Gold Toe Moretz. At the time of the acquisition of Gold Toe Moretz in April 2011, the Retirement Plan was in a net deficit position of $17.1 million. Management’s intention was to fully fund the deficit, and subsequently liquidate and wind-up the Retirement Plan, and steps taken in this regard since the date of acquisition have included funding contributions of $19 million in fiscal 2011 and the de-risking of the Retirement Plan through settlement payments totaling $8.3 million for fiscal 2012 (2011 - $39 million for the period from April 15, 2011 to October 2, 2011). An actuarial valuation was performed at September 30, 2012, October 2, 2011 and at the date of acquisition. The last valuation for funding purposes was performed on January 1, 2012, and the next valuation for funding purposes is expected to be performed on January 1, 2013. The Company has not made funding contributions in fiscal 2012, but expects to contribute approximately $6.5 million to the Retirement Plan in fiscal 2013 followed by the termination and wind-up of the Retirement Plan shortly thereafter. |
GILDAN 2012 REPORT TO SHAREHOLDERS P.75
| | NOTES TO CONSOLIDATED FINANCIAL STATEMENTS |
13. EMPLOYEE BENEFIT OBLIGATIONS (continued):
| (a) | Defined benefit plan (continued): |
The funded status of the Company’s Retirement Plan was as follows:
| | | | 2012 | | | 2011 | |
| | | | | | | | |
| | Benefit obligation, beginning of year(1) | $ | 18,983 | | $ | 51,249 | |
| | Interest cost | | 595 | | | 1,051 | |
| | Actuarial (gain) loss | | (765 | ) | | 3,390 | |
| | Settlement (gain) charge | | (725 | ) | | 4,176 | |
| | Benefits paid | | (180 | ) | | (1,879 | ) |
| | Plan settlements | | (8,337 | ) | | (39,004 | ) |
| | Benefit obligation, end of year | $ | 9,571 | | $ | 18,983 | |
| | | | | | | | |
| | Fair value of plan assets, beginning of year(1) | $ | 12,564 | | $ | 34,181 | |
| | Employer contributions | | - | | | 19,000 | |
| | Plan settlements | | (8,337 | ) | | (39,005 | ) |
| | Expected return on plan assets | | 273 | | | 543 | |
| | Actuarial loss | | (620 | ) | | (276 | ) |
| | Benefits paid | | (180 | ) | | (1,879 | ) |
| | Fair value of plan assets, end of year | $ | 3,700 | | $ | 12,564 | |
| | | | | | | | |
| | Funded status and plan deficit / defined benefit pension liability, end of year | $ | 5,871 | | $ | 6,419 | |
| | (1) As at April 15, 2011 for fiscal 2011 | |
The plan assets are invested entirely in high quality money market funds. The expected rate of return on plan assets of 3.5% is based on published capital market assumptions for high quality money market funds. The actual loss on plan assets for fiscal 2012 was $0.3 million (2011 - actual gain of $0.3 million).
The net periodic pension (gain) expense of the Company’s Retirement Plan for the years ended September 30, 2012 and October 2, 2011 includes the following components:
| | | | 2012 | | | 2011 | |
| | | | | | | | |
| | Interest cost | $ | 595 | | $ | 1,051 | |
| | Expected return on plan assets | | (273 | ) | | (543 | ) |
| | Settlement (gain) charge | | (725 | ) | | 4,176 | |
| | Net periodic pension (gain) expense - included in restructuring and acquisition-related costs | $ | (403 | ) | $ | 4,684 | |
Weighted-average assumptions to determine benefit obligations and net periodic benefit cost:
| | | | 2012 | | | 2011 | |
| | | | | | | | |
| | Benefit obligation: | | | | | | |
| | Discount rate | | 3.40% | | | 4.42% | |
| | | | | | | | |
| | Net periodic benefit cost: | | | | | | |
| | Discount rate | | 4.37% | | | 5.00% | |
| | Rate of return on plan assets | | 3.50% | | | 3.50% | |
GILDAN 2012 REPORT TO SHAREHOLDERS P.76
| | NOTES TO CONSOLIDATED FINANCIAL STATEMENTS |
| 13.EMPLOYEE BENEFIT OBLIGATIONS (continued): |
| | | | 2012 | | | 2011 | |
| | | | | | | | |
| | Benefit obligation, beginning of year | $ | 12,586 | | $ | 10,231 | |
| | Service cost | | 7,691 | | | 8,088 | |
| | Interest cost | | 3,093 | | | 2,517 | |
| | Actuarial (gain) loss | | (178 | ) | | 1,643 | |
| | Benefits paid | | (10,946 | ) | | (9,893 | ) |
| | Benefit obligation, end of year | $ | 12,246 | | $ | 12,586 | |
| A discount rate of approximately 12% was used to calculate the accumulated benefit obligation of statutory severance. |
| | |
| (c) | Defined contribution plan: |
| | |
| During fiscal 2012, defined contribution expenses were $2.0 million (2011 - $2.1 million). |
| | |
| (d) | Actuarial losses recognized in other comprehensive income: |
| | |
| The cumulative amount of actuarial losses recognized in other comprehensive income as at September 30, 2012 was $3.6 million (October 2, 2011 - $3.9 million) which have been reclassified to retained earnings in the period in which they were recognized. |
| | | 2012 | |
| | | | |
| Balance, beginning of year | $ | 8,226 | |
| Assumed in a business acquisition (note 5) | | 4,500 | |
| Accretion of interest | | 316 | |
| Balance, end of year | $ | 13,042 | |
Provisions include estimated future costs of decommissioning and site restoration for certain assets located at the Company’s textile and sock facilities and a distribution centre in the U.S. for which the timing of settlement is uncertain, but has been estimated to be in excess of twenty years.
| (a) | Shareholder rights plan: |
| | |
| The Company has a shareholder rights plan which provides the Board of Directors and the shareholders with additional time to assess any unsolicited take-over bid for the Company and, where appropriate, pursue other alternatives for maximizing shareholder value. |
| | |
| (b) | Accumulated other comprehensive income: |
| | |
| Accumulated other comprehensive income includes the changes in the fair value of the effective portion of qualifying cash flow hedging instruments outstanding at the end of the period. |
GILDAN 2012 REPORT TO SHAREHOLDERS P.77
| | NOTES TO CONSOLIDATED FINANCIAL STATEMENTS |
| (c) | Share capital: |
| | |
| Authorized: |
| Common shares, authorized without limit as to number and without par value. First preferred shares, without limit as to number and without par value, issuable in series and non-voting. Second preferred shares, without limit as to number and without par value, issuable in series and non-voting. As at September 30, 2012 and October 2, 2011 none of the first and second preferred shares were issued. |
| | |
| Issued: |
| As at September 30, 2012, there were 121,386,090 common shares (October 2, 2011 - 121,330,544) issued and outstanding, which are net of 210,400 common shares (October 2, 2011 - 79,108) that have been purchased and are held in trust as described in note 15(e). |
| | |
| (d) | Normal course issuer bid: |
| | |
| On December 2, 2011 the TSX approved the renewal of the Company’s normal course issuer bid to purchase up to one million common shares, representing approximately 0.8% of its issued and outstanding common shares, in accordance with the requirements of the TSX. Common shares purchased under the NCIB are cancelled. During fiscal 2012, there were no repurchases under the NCIB. |
| | |
| During fiscal 2011, the Company repurchased and cancelled a total of 0.4 million common shares for a total cost of $10.5 million. Of the total cost, $0.3 million was charged to share capital and $10.2 million was charged to retained earnings as there was no amount of contributed surplus attributable to these common shares. |
| | |
| (e) | Common shares purchased as settlement for non-Treasury RSUs: |
| | |
| In September 2011, the Company established a trust for the purpose of settling the vesting of non-Treasury RSUs. For non-Treasury RSUs that are to be settled in common shares in lieu of cash, the Company directs the trustee to purchase common shares of the Company on the open market to be held in trust for and on behalf of the holders of non-Treasury RSUs until they are delivered for settlement, when the non-Treasury RSUs vest. At the time the common shares are purchased, the amounts previously credited to accounts payable and accrued liabilities for the non-Treasury RSUs initially expected to be settled in cash are transferred to contributed surplus. For accounting purposes, the common shares are considered as held in treasury, and recorded as a temporary reduction of outstanding common shares and share capital. Upon delivery of the common shares for settlement of the non-Treasury RSUs, the number of common shares outstanding is increased, and the amount in contributed surplus is transferred to share capital. The common shares purchased as settlement for non-Treasury RSUs were as follows: |
| | | | | | | | | | 2012 | | | | | | | | | 2011 | |
| | | | | | | | | | Average | | | | | | | | | Average | |
| | | | Shares | | | Amount | | | cost | | | Shares | | | Amount | | | Cost | |
| | | | | | | | | | | | | | | | | | | | |
| | Balance, beginning of year | | 79 | | $ | 2,152 | | $ | 27.24 | | | - | | $ | - | | $ | - | |
| | Distributed | | (79 | ) | | (2,152 | ) | | 27.24 | | | - | | | - | | | - | |
| | Purchased | | 210 | | | 5,990 | | | 28.52 | | | 79 | | | 2,152 | | | 27.24 | |
| | Balance, end of year | | 210 | | $ | 5,990 | | $ | 28.52 | | | 79 | | $ | 2,152 | | $ | 27.24 | |
Subsequent to year end, the Company distributed 205,536 common shares with an average cost of $28.52 per share as settlement for the vesting of the equivalent number of non-Treasury RSUs.
| 16.FINANCIAL INSTRUMENTS: |
Disclosures relating to the nature and extent of the Company’s exposure to risks arising from financial instruments, including credit risk, liquidity risk, foreign currency risk and interest rate risk, as well as risks arising from commodity prices, and how the Company manages those risks, are included in the section entitled “Financial Risk Management” of the Management’s Discussion and Analysis of the Company’s operations, performance and financial position as at September 30, 2012. Accordingly, these disclosures are incorporated into these consolidated financial statements by cross-reference.
GILDAN 2012 REPORT TO SHAREHOLDERS P.78
| | NOTES TO CONSOLIDATED FINANCIAL STATEMENTS |
| 16.FINANCIAL INSTRUMENTS (continued): |
| (a) | Financial instruments – carrying amounts and fair values: |
| | |
| The carrying amounts and fair values of financial assets and liabilities included in the consolidated statements of financial position are as follows: |
| | | | September 30, | | | October 2, | | | October 4, | |
| | | | 2012 | | | 2011 | | | 2010 | |
| | | | | | | | | | | |
| | Financial assets | | | | | | | | | |
| | Loans and receivables: | | | | | | | | | |
| | Cash and cash equivalents | $ | 70,410 | | $ | 82,025 | | $ | 250,843 | |
| | Trade accounts receivable | | 260,595 | | | 191,594 | | | 145,684 | |
| | Other current assets | | 8,561 | | | 5,929 | | | 7,571 | |
| | Long-term non-trade receivable included in other non-current assets | | 509 | | | 1,120 | | | 953 | |
| | Restricted cash related to the acquisition of Prewett included in other non-current assets | | - | | | - | | | 5,788 | |
| | Derivative financial instruments designated as effective hedging instruments | | 133 | | | 3,299 | | | 1,099 | |
| | | | | | | | | | | |
| | Financial liabilities | | | | | | | | | |
| | Other financial liabilities: | | | | | | | | | |
| | Accounts payable and accrued liabilities | $ | 247,622 | | $ | 290,103 | | $ | 176,707 | |
| | Long-term debt - bearing interest at variable rates | | 181,000 | | | 209,000 | | | - | |
| | Derivative financial instruments designated as effective hedging instruments | | 7,870 | | | 4,007 | | | 3,088 | |
| | Contingent consideration | | 950 | | | 3,850 | | | - | |
| The Company has determined that the fair value of its short-term financial assets and liabilities approximates their respective carrying amounts as at the reporting dates because of the short-term maturity of those instruments. The fair values of the long-term receivable and the restricted cash included in other assets, and the Company’s interest-bearing financial liabilities also approximate their respective carrying amounts. The fair values of cash and cash equivalents and derivative financial instruments were measured using Level 2 inputs in the fair value hierarchy. In determining the fair value of financial assets and financial liabilities, including derivative financial instruments, the Company takes into account its own credit risk and the credit risk of the counterparty. |
| | |
| (b) | Derivative financial instruments: |
| | |
| During fiscal 2012 and fiscal 2011, the Company entered into forward foreign exchange contracts and zero-cost collar options in order to reduce the exposure of forecasted cash flows in currencies other than the U.S. dollar. The forward foreign exchange contracts and the intrinsic value of zero-cost collar options were designated as cash flow hedges and qualified for hedge accounting. The forward foreign exchange contracts outstanding as at September 30, 2012 consisted primarily of contracts to reduce the exposure to fluctuations in Euros, Canadian dollars, Pounds sterling, Australian dollars and Mexican pesos, against the U.S. dollar. For fiscal 2012 and fiscal 2011, the derivatives designated as cash flow hedges were considered to be fully effective and no ineffectiveness has been recognized in net earnings. |
GILDAN 2012 REPORT TO SHAREHOLDERS P.79
| | NOTES TO CONSOLIDATED FINANCIAL STATEMENTS |
| 16.FINANCIAL INSTRUMENTS (continued): |
| (b) | Derivative financial instruments (continued): |
| | |
| The following table summarizes the Company’s commitments to buy and sell foreign currencies as at September 30, 2012: |
| | | | | | | | | | | | Carrying and fair value | | | Maturity | |
| | | Notional | | | | | | | | | | | | Accounts | | | | |
| | | foreign | | | | | | | | | | | | payable | | | | |
| | | currency | | | Average | | | Notional | | | Other | | | and | | | | |
| | | amount | | | exchange | | | U.S. $ | | | current | | | accrued | | | 0 to 12 | |
| September 30, 2012 | | equivalent | | | rate | | | equivalent | | | assets | | | liabilities | | | months | |
| | | | | | | | | | | | | | | | | | |
Forward foreign exchange contracts designated as cash flow hedges: | |
Sell EUR/Buy USD | | 34,000 | | | 1.2553 | | $ | 42,679 | | $ | 20 | | $ | (1,326 | ) | $ | (1,306 | ) |
Sell CAD/Buy USD | | 27,500 | | | 1.0089 | | | 27,744 | | | 52 | | | (224 | ) | | (172 | ) |
Sell GBP/Buy USD | | 16,400 | | | 1.5899 | | | 26,074 | | | - | | | (523 | ) | | (523 | ) |
Sell AUD/Buy USD | | 8,400 | | | 1.0325 | | | 8,673 | | | 45 | | | - | | | 45 | |
Sell MXN/Buy USD | | 36,000 | | | 0.0770 | | | 2,771 | | | 16 | | | - | | | 16 | |
| | | | | | | $ | 107,941 | | $ | 133 | | $ | (2,073 | ) | $ | (1,940 | ) |
During fiscal 2011, the Company entered into a series of interest rate swap contracts to fix the variable interest rates on the designated interest payments of a portion of the borrowings under the revolving long-term credit facility. As at September 30, 2012, the interest rate swap contracts were designated as cash flow hedges and qualified for hedge accounting. The following table summarizes the outstanding interest rate swap contracts as at September 30, 2012:
| Notional | | | | | | | | | | | | | | Carrying and fair value | |
| amount of | | | | | | | | Fixed | | | Floating | | | Accounts payable | |
| borrowings | | Maturity date | | | Pay / Receive | | | rate | | | rate | | | and accrued liabilities | |
| | | | | | | | | | | | | | | | |
| $ 125,000 | | June 3, 2016 | | | Pay fixed rate /
Receive floating rate | | | 1.08% to 1.88% | | | 1-month U.S. LIBOR | | $ | (5,797 | ) |
| (c) | Financial expenses, net: |
| | | | 2012 | | | 2011 | |
| | | | | | | | |
| | Interest expense on financial liabilities recorded at amortized cost | $ | 7,315 | | $ | 3,238 | |
| | Bank and other financial charges | | 3,676 | | | 2,216 | |
| | Interest accretion on discounted provision | | 324 | | | 275 | |
| | Foreign exchange loss (gain) (i) | | 283 | | | (1,098 | ) |
| | Derivative loss on financial instruments not designated for hedge accounting | | - | | | 1,511 | |
| | | $ | 11,598 | | $ | 6,142 | |
| | (i) | Foreign exchange loss (gain) |
| | | | 2012 | | | 2011 | |
| | | | | | | | |
| | Loss (gain) relating to financial assets and liabilities | $ | 238 | | $ | (1,104 | ) |
| | Other foreign exchange loss | | 45 | | | 6 | |
| | | $ | 283 | | $ | (1,098 | ) |
GILDAN 2012 REPORT TO SHAREHOLDERS P.80
| | NOTES TO CONSOLIDATED FINANCIAL STATEMENTS |
| 16. FINANCIAL INSTRUMENTS (continued): |
| (d) | Other comprehensive income (loss): |
| | | | 2012 | | | 2011 | |
| | | | | | | | |
| | Net loss on derivatives designated as cash flow hedges | $ | (4,955 | ) | $ | (4,448 | ) |
| | Income taxes | | 50 | | | 45 | |
| | | | | | | | |
| | Amounts reclassified from other comprehensive income to net earnings, and included in: | | | | | | |
| | Net sales | | (2,993 | ) | | 5,177 | |
| | Selling, general and administrative expenses | | (563 | ) | | (1,045 | ) |
| | Financial expenses, net | | 2,029 | | | 1,360 | |
| | Income taxes | | 33 | | | (55 | ) |
| | Cash flow hedges (loss) income | | (6,399 | ) | | 1,034 | |
| | | | | | | | |
| | Actuarial gain (loss) on employee benefit obligations | | 323 | | | (5,309 | ) |
| | Income taxes | | - | | | 1,357 | |
| | | | | | | | |
| | Other comprehensive loss | $ | (6,076 | ) | $ | (2,918 | ) |
As at September 30, 2012, approximately $3.0 million of net losses presented in accumulated other comprehensive income are expected to be reclassified to net earnings within the next twelve months.
| 17. | SHARE-BASED COMPENSATION: |
| (a) | Employee share purchase plans: |
| | |
| The Company has employee share purchase plans which allow eligible employees to authorize payroll deductions of up to 10% of their salary to purchase from Treasury, common shares of the Company at a price of 90% of the then current share price as defined in the plans. Employees purchasing shares under the plans subsequent to January 1, 2008 must hold the shares for a minimum of two years. The Company has reserved 2,500,000 common shares for issuance under the plans. As at September 30, 2012, a total of 295,493 shares (October 2, 2011 - 266,925) were issued under these plans. Included as compensation costs in selling, general and administrative expenses is $0.1 million (2011 - $0.1 million) relating to the employee share purchase plans. |
| | |
| (b) | Stock options and restricted share units: |
| | |
| The Company’s Long-Term Incentive Plan (the "LTIP") includes stock options and restricted share units. The LTIP allows the Board of Directors to grant stock options, dilutive restricted share units ("Treasury RSUs") and non- dilutive restricted share units ("non-Treasury RSUs") to officers and other key employees of the Company and its subsidiaries. On February 2, 2006, the shareholders of the Company approved an amendment to the LTIP to fix at 6,000,316 the number of common shares that are issuable pursuant to the exercise of stock options and the vesting of Treasury RSUs. As at September 30, 2012, 2,306,592 common shares remained authorized for future issuance under this plan. |
| | |
| The exercise price payable for each common share covered by a stock option is determined by the Board of Directors at the date of the grant, but may not be less than the closing price of the common shares of the Company on the trading day immediately preceding the effective date of the grant. Stock options granted since fiscal 2007 vest equally beginning on the second, third, fourth and fifth anniversary of the grant date, with the exception of a special one-time award of 409,711 options which cliff vest on the fifth anniversary of the grant date, and expire no more than seven or ten years after the date of the grant. All stock options granted prior to fiscal 2007 have fully vested. |
GILDAN 2012 REPORT TO SHAREHOLDERS P.81
| | NOTES TO CONSOLIDATED FINANCIAL STATEMENTS |
| 17.SHARE-BASED COMPENSATION (continued): |
| (b) | Stock options and restricted share units (continued): |
| | |
| Holders of Treasury RSUs, non-Treasury RSUs and deferred share units are entitled to dividends declared by the Company which are recognized in the form of additional equity awards equivalent in value to the dividends paid on common shares. The vesting conditions of the additional equity awards are subject to the same performance objectives and other terms and conditions as the underlying equity awards. The additional awards related to outstanding Treasury RSUs and non-Treasury RSUs expected to be settled in common shares are credited to contributed surplus when the dividends are declared, whereas the additional awards related to outstanding non- Treasury RSUs expected to be settled in cash and deferred share units are credited to accounts payable and accrued liabilities. |
| | |
| Outstanding stock options were as follows: |
| | | | | | | Weighted average | |
| | | | | | | exercise price | |
| | | | Number | | | (CA$) | |
| | | | | | | | |
| | Stock options outstanding, October 4, 2010 | | 1,299 | | $ | 19.57 | |
| | Changes in outstanding stock options: | | | | | | |
| | Granted | | 69 | | | 28.64 | |
| | Exercised | | (379 | ) | | 8.72 | |
| | Forfeited | | (28 | ) | | 26.88 | |
| | Stock options outstanding, October 2, 2011 | | 961 | | | 24.28 | |
| | Changes in outstanding stock options: | | | | | | |
| | Granted | | 190 | | | 27.20 | |
| | Exercised | | (56 | ) | | 14.09 | |
| | Forfeited | | (41 | ) | | 28.50 | |
| | Stock options outstanding, September 30, 2012 | | 1,054 | | $ | 25.18 | |
As at September 30, 2012, 246,006 outstanding options were exercisable at the weighted average exercise price of CA$28.58 (October 2, 2011 - 244,296 options at CA$27.25) . For stock options exercised during fiscal 2012, the weighted average share price at the date of exercise was CA$25.09 (2011 - CA$32.22) . Based on the Black-Scholes option pricing model, the grant date weighted average fair value of options granted during the twelve months ended September 30, 2012 was $11.42 (October 2, 2011 - $13.36) . Expected volatilities are based on the historical volatility of Gildan’s share price. The risk-free rate used is equal to the yield available on Government of Canada bonds at the date of grant with a term equal to the expected life of the options.
| | | | 2012 | | | 2011 | |
| | | | | | | | |
| | Exercise price | $ | 27.20 | | $ | 28.64 | |
| | Risk-free interest rate | | 1.31% | | | 2.01% | |
| | Expected volatility | | 52.75% | | | 52.37% | |
| | Expected life | | 5.25 years | | | 5.25 years | |
| | Expected dividend yield | | 1% | | | - | |
GILDAN 2012 REPORT TO SHAREHOLDERS P.82
| | NOTES TO CONSOLIDATED FINANCIAL STATEMENTS |
| 17.SHARE-BASED COMPENSATION (continued): |
| (b) | Stock options and restricted share units (continued): |
| | |
| The following table summarizes information about stock options issued and outstanding and exercisable at September 30, 2012: |
| | | | Options issued and outstanding | | | Options exercisable | |
| | | | | | | Remaining | | | | |
| | Exercise prices (CA$) | | Number | | | contractual life (yrs) | | | Number | |
| | | | | | | | | | | |
| | $ 20.12 | | 81 | | | 4 | | | 20 | |
| | $ 22.13 | | 410 | | | 7 | | | - | |
| | $ 23.49 | | 149 | | | 3 | | | 70 | |
| | $ 27.17 | | 95 | | | 1 | | | 95 | |
| | $ 27.20 | | 178 | | | 6 | | | - | |
| | $ 28.64 | | 60 | | | 5 | | | - | |
| | $ 39.39 | | 81 | | | 2 | | | 61 | |
| | | | 1,054 | | | | | | 246 | |
A Treasury RSU represents the right of an individual to receive one common share on the vesting date without any monetary consideration being paid to the Company. With limited exceptions, all Treasury RSUs awarded to date vest within a five-year vesting period. The vesting of at least 50% of each Treasury RSU grant is contingent on the achievement of performance conditions that are primarily based on the Company’s average return on assets performance for the period as compared to the S&P/TSX Capped Consumer Discretionary Index, excluding income trusts, or as determined by the Board of Directors.
Outstanding Treasury RSUs were as follows:
| | | | | | | Weighted average | |
| | | | Number | | | fair value per unit | |
| | | | | | | | |
| | Treasury RSUs outstanding, October 4, 2010 | | 748 | | $ | 19.93 | |
| | Changes in outstanding Treasury RSUs: | | | | | | |
| | Granted | | 62 | | | 35.40 | |
| | Granted for dividends declared | | 6 | | | 29.93 | |
| | Settled through the issuance of common shares | | (26 | ) | | 22.68 | |
| | Forfeited | | (29 | ) | | 25.78 | |
| | Treasury RSUs granted as contingent consideration (note 5) | | 150 | | | 35.40 | |
| | Treasury RSUs outstanding, October 2, 2011 | | 911 | | | 23.34 | |
| | Changes in outstanding Treasury RSUs: | | | | | | |
| | Granted | | 68 | | | 26.60 | |
| | Granted for dividends declared | | 10 | | | 25.10 | |
| | Settled through the issuance of common shares | | (102 | ) | | 27.32 | |
| | Forfeited | | (3 | ) | | 27.61 | |
| | Treasury RSUs outstanding, September 30, 2012 | | 884 | | $ | 23.13 | |
As at September 30, 2012 and October 2, 2011, none of the awarded and outstanding Treasury RSUs were vested.
GILDAN 2012 REPORT TO SHAREHOLDERS P.83
| | NOTES TO CONSOLIDATED FINANCIAL STATEMENTS |
| 17. SHARE-BASED COMPENSATION (continued): |
| (b) | Stock options and restricted share units (continued): |
| | |
| The compensation expense included in selling, general and administrative expenses and cost of sales, in respect of the options and Treasury RSUs, for fiscal 2012 was $4.6 million (2011 - $4.9 million). The counterpart has been recorded as contributed surplus. When the underlying shares are issued to the employees, the amounts previously credited to contributed surplus are transferred to share capital. As described in note 5, the compensation expense excludes the value of 150,000 Treasury RSUs granted in connection with the acquisition of Gold Toe Moretz as they are considered contingent consideration. |
| | |
| Outstanding non-Treasury RSUs were as follows: |
| | | | Number | |
| | | | | |
| | Non-Treasury RSUs outstanding, October 4, 2010 | | 313 | |
| | Changes in outstanding non-Treasury RSUs: | | | |
| | Granted | | 151 | |
| | Granted for dividends declared | | 3 | |
| | Settled | | (29 | ) |
| | Forfeited | | (42 | ) |
| | Non-Treasury RSUs outstanding, October 2, 2011 | | 396 | |
| | Changes in outstanding non-Treasury RSUs: | | | |
| | Granted | | 247 | |
| | Granted for dividends declared | | 7 | |
| | Settled | | (94 | ) |
| | Forfeited | | (27 | ) |
| | Non-Treasury RSUs outstanding, September 30, 2012 | | 529 | |
| Non-Treasury RSUs have the same features as Treasury RSUs, except that their vesting period is a maximum of three years and they can be settled in cash based on the Company’s share price on the vesting date, or through the delivery of common shares purchased on the open market. The settlement amount for non-Treasury RSUs expected to be settled in cash is based on the Company's five-day average share price at the vesting date. Beginning in fiscal 2010, 100% of non-Treasury RSUs awarded to executive officers have vesting conditions that are dependent upon the financial performance of the Company relative to a benchmark group of Canadian publicly listed companies. In addition, up to two times the actual number of non-Treasury RSUs awarded to executive officers can vest if exceptional financial performance is achieved. As at September 30, 2012 and October 2, 2011, none of the outstanding non-Treasury RSUs were vested. |
| | |
| The compensation expense included in selling, general and administrative expenses and cost of sales, in respect of the non-Treasury RSUs, for fiscal 2012 was $6.1 million (2011 - $3.7 million). As at September 30, 2012, 318,923 non-Treasury RSUs (October 2, 2011 – 317,377) were expected to be settled in cash, for which a recognized amount of $4.3 million (October 2, 2011 - $3.9 million) is included in accounts payable and accrued liabilities, based on a fair value per non-Treasury RSU of $31.68. |
| | |
| (c) | Deferred share unit plan: |
| | |
| The Company has a deferred share unit plan for independent members of the Company’s Board of Directors who must receive at least 50% of their annual board retainers in the form of deferred share units ("DSUs"). The value of these DSUs is based on the Company’s share price at the time of payment of the retainers or fees. DSUs granted under the plan will be redeemable and the value thereof payable in cash only after the director ceases to act as a director of the Company. As at September 30, 2012, there were 110,322 (October 2, 2011 - 78,416; October 4, 2010 - 53,602) DSUs outstanding at a value of $3.5 million (October 2, 2011 - $2.0 million; October 4, 2010 - $1.5 million). This amount is included in accounts payable and accrued liabilities. The DSU obligation is adjusted each quarter based on the market value of the Company’s common shares. The Company includes the cost of the DSU plan in selling, general and administrative expenses. |
GILDAN 2012 REPORT TO SHAREHOLDERS P.84
| | NOTES TO CONSOLIDATED FINANCIAL STATEMENTS |
| 17.SHARE-BASED COMPENSATION (continued): |
| (c) | Deferred share unit plan (continued): |
| | |
| Changes in outstanding DSUs were as follows: |
| | | | Number | |
| | | | | |
| | DSUs outstanding, October 4, 2010 | | 54 | |
| | Granted | | 24 | |
| | DSUs outstanding, October 2, 2011 | | 78 | |
| | Granted | | 31 | |
| | Granted for dividends declared | | 1 | |
| | DSUs outstanding, September 30, 2012 | | 110 | |
| 18.SUPPLEMENTARY INFORMATION RELATING TO THE NATURE OF EXPENSES: |
| (a) | Selling, general and administrative expenses: |
| | | | 2012 | | | 2011 | |
| | | | | | | | |
| | Selling expenses | $ | 75,206 | | $ | 50,397 | |
| | Administrative expenses | | 89,601 | | | 93,132 | |
| | Distribution expenses | | 61,228 | | | 55,329 | |
| | | $ | 226,035 | | $ | 198,858 | |
| (b) | Employee benefit expenses: |
| | | | 2012 | | | 2011 | |
| | | | | | | | |
| | Short-term employee benefits | $ | 254,994 | | $ | 239,958 | |
| | Share-based payments | | 10,970 | | | 8,689 | |
| | Post-employment benefits | | 21,344 | | | 20,055 | |
| | | $ | 287,308 | | $ | 268,702 | |
| (c) | Lease expense: |
| | |
| During the year ended September 30, 2012 an amount of $14.0 million was recognized in the statement of earnings and comprehensive income relating to operating leases (2011 - $10.2 million). |
GILDAN 2012 REPORT TO SHAREHOLDERS P.85
| | NOTES TO CONSOLIDATED FINANCIAL STATEMENTS |
| 19.RESTRUCTURING AND ACQUISITION-RELATED COSTS, AND ASSETS HELD FOR SALE: |
Restructuring and acquisition-related costs are presented in the following table, and are comprised of costs directly related to the closure of business locations or the relocation of business activities, changes in management structure, as well as transaction, exit and integration costs incurred pursuant to business acquisitions.
| | | | | | Business | | | | |
| | | | | | acquisitions | | | | |
| | | Facility | | | and changes in | | | | |
| | | closures and | | | management | | | | |
2012 | | relocations | | | structure | | | Total | |
| | | | | | | | | |
Gain on disposal of assets held for sale | $ | (130 | ) | $ | - | | $ | (130 | ) |
Impairment and write-down of assets held for sale | | 4,981 | | | - | | | 4,981 | |
Employee termination and benefit costs | | 533 | | | 7,324 | | | 7,857 | |
Net pension recovery | | - | | | (403 | ) | | (403 | ) |
Exit, relocation and other costs | | 616 | | | 6,971 | | | 7,587 | |
Re-measurement of contingent consideration in connection with a business acquisition (note 5) | | - | | | 532 | | | 532 | |
Purchase gain on business acquisition (note 5) | | - | | | (6,679 | ) | | (6,679 | ) |
Acquisition-related transaction costs | | - | | | 1,217 | | | 1,217 | |
| $ | 6,000 | | $ | 8,962 | | $ | 14,962 | |
| | | | | | Business | | | | |
| | | | | | acquisitions | | | | |
| | | Facility | | | and changes in | | | | |
| | | closures and | | | management | | | | |
| 2011 | | relocations | | | structure | | | Total | |
| | | | | | | | | |
Loss on disposal of assets held for sale | $ | 634 | | $ | - | | $ | 634 | |
Impairment and write-down of assets held for sale | | 1,722 | | | - | | | 1,722 | |
Employee termination and benefit costs | | 2,764 | | | 123 | | | 2,887 | |
Net pension expense | | - | | | 4,684 | | | 4,684 | |
Exit, relocation and other costs | | 1,898 | | | 540 | | | 2,438 | |
Re-measurement of contingent consideration in connection with a business acquisition (note 5) | | - | | | (1,460 | ) | | (1,460 | ) |
Acquisition-related transaction costs | | - | | | 7,272 | | | 7,272 | |
| $ | 7,018 | | $ | 11,159 | | $ | 18,177 | |
Facility closure and relocation costs incurred in fiscal 2012 and fiscal 2011 relate primarily to the closure, between fiscal 2009 and fiscal 2011, of the following facilities that are currently included in assets held for sale:
- The closure of the Company’s U.S. sock knitting and finishing operations in Fort Payne, Alabama in connection with the consolidation of its sock manufacturing operations in Honduras; and
- The consolidation of the Company’s distribution centre in Martinsville, Virginia and Fort Payne, Alabama into its primary distribution centre servicing Branded Apparel customers in Charleston, South Carolina.
Acquisition-related costs incurred in fiscal 2012 and fiscal 2011 relate primarily to costs incurred, net of a purchase gain on business acquisition, pursuant to the acquisition of Anvil in fiscal 2012 and Gold Toe Moretz in fiscal 2011 as described in note 5.
Net pension recovery of $0.4 million in fiscal 2012 (2011 – net pension expense of $4.7 million) relates to Gold Toe Moretz’s defined benefit pension plan which was incurred primarily as a result of the Company’s plan to liquidate and wind-up the Retirement Plan as described in note 13(a).
GILDAN 2012 REPORT TO SHAREHOLDERS P.86
| | NOTES TO CONSOLIDATED FINANCIAL STATEMENTS |
| 19.RESTRUCTURING AND ACQUISITION-RELATED COSTS, AND ASSETS HELD FOR SALE (continued): |
Assets held for sale of $8.0 million as at September 30, 2012 (October 2, 2011 - $13.1 million; October 4, 2010 - $3.2 million) include property, plant and equipment primarily relating to closed facilities. The Company expects to incur additional carrying costs relating to the closed facilities, which will be accounted for as restructuring charges as incurred until all assets related to the closures are disposed. Any gains or losses on the disposal of the assets held for sale relating to closed facilities will also be accounted for as restructuring charges as incurred.
The income tax provision differs from the amount computed by applying the combined Canadian federal and provincial tax rates to earnings before income taxes. The reasons for the difference and the related tax effects are as follows:
| | | 2012 | | | 2011 | |
| | | | | | |
Earnings before income taxes | $ | 144,127 | | $ | 214,933 | |
Applicable tax rate | | 27.2% | | | 28.8% | |
Income taxes at applicable statutory rate | | 39,246 | | | 61,901 | |
(Decrease) increase in income taxes resulting from: | | | | | | |
Effect of different tax rates on earnings of foreign subsidiaries | | (51,640 | ) | | (83,276 | ) |
Income tax (recovery) charge for prior taxation years | | 974 | | | (413 | ) |
Non-recognition of tax benefits related to tax losses and temporary differences | | 5,910 | | | 2,572 | |
Effect of non-deductible expenses and other | | 1,173 | | | (7 | ) |
Total income tax recovery | $ | (4,337 | ) | $ | (19,223 | ) |
Average effective tax rate (recovery) | | (3.0% | ) | | (8.9% | ) |
The Company’s applicable statutory tax rate is the Canadian combined rate applicable in the jurisdictions in which the Company operates. The decrease is mainly due to the reduction of the Canadian Federal income tax rate applicable to the Company effective January 1, 2012 from 16.5% to 15%.
The details of income tax expense (recovery) are as follows:
| | | 2012 | | | 2011 | |
| | | | | | | |
Current income taxes | $ | 6,005 | | $ | 3,376 | |
| | | | | | |
Deferred income taxes: | | | | | | |
Origination and reversal of temporary differences | | (16,286 | ) | | (25,334 | ) |
Non-recognition of tax benefits related to tax losses and temporary differences | | 5,910 | | | 2,572 | |
Effect of substantively enacted income tax rates changes | | 34 | | | 163 | |
| | (10,342 | ) | | (22,599 | ) |
| $ | (4,337 | ) | $ | (19,223 | ) |
GILDAN 2012 REPORT TO SHAREHOLDERS P.87
| | NOTES TO CONSOLIDATED FINANCIAL STATEMENTS |
| 20.INCOME TAXES (continued): |
Significant components of the Companyメs deferred income tax assets and liabilities relate to the following temporary differences and unused tax losses:
| | | September 30, | | | October 2, | | | October 4, | |
| | | 2012 | | | 2011 | | | 2010 | |
| | | | | | | | | |
Deferred tax assets: | | | | | | | | | |
Non-capital losses | $ | 66,386 | | $ | 67,142 | | $ | 13,655 | |
Non-deductible reserves and accruals | | 27,405 | | | 15,236 | | | 5,215 | |
Other items | | 9,357 | | | 4,067 | | | 3,179 | |
| $ | 103,148 | | $ | 86,445 | | $ | 22,049 | |
Unrecognized deferred tax assets | | (12,053 | ) | | (3,123 | ) | | (1,179 | ) |
Deferred tax assets | $ | 91,095 | | $ | 83,322 | | $ | 20,870 | |
| | | | | | | | | |
Deferred tax liabilities: | | | | | | | | | |
Property, plant and equipment | $ | (189 | ) | $ | (3,871 | ) | $ | (5,890 | ) |
Intangible assets | | (87,535 | ) | | (91,428 | ) | | (19,751 | ) |
Deferred tax liabilities | $ | (87,724 | ) | $ | (95,299 | ) | $ | (25,641 | ) |
| | | | | | | | | |
| $ | 3,371 | | $ | (11,977 | ) | $ | (4,771 | ) |
The details of changes to deferred income tax assets and liabilities were as follows:
| | | 2012 | | | 2011 | |
| | | | | | | |
Balance, beginning of year, net | $ | (11,977 | ) | $ | (4,771 | ) |
Recognized in the statement of earnings: | | | | | | |
Non-capital losses | | (859 | ) | | 21,851 | |
Non-deductible reserves and accruals | | 152 | | | 725 | |
Property, plant and equipment | | 5,939 | | | 779 | |
Intangible assets | | 7,337 | | | 3,828 | |
Other items | | 3,683 | | | (2,640 | ) |
Unrecognized deferred tax assets | | (5,910 | ) | | (1,944 | ) |
| | 10,342 | | | 22,599 | |
Business acquisitions | | 5,066 | | | (31,178 | ) |
Other | | (60 | ) | | 1,373 | |
Balance, end of year, net | $ | 3,371 | | $ | (11,977 | ) |
As at September 30, 2012, the Company has tax credits, capital and non-capital loss carryforwards and other taxable temporary differences available to reduce future taxable income for tax purposes representing a tax benefit of approximately $12.1 million, for which no deferred tax asset has been recognized (October 2, 2011 - $3.1 million; October 4, 2010 - $1.2 million). The tax credits and capital and non-capital loss carryforwards expire between 2019 and 2032. The utilization of the recognized deferred tax asset is supported by projections of future profitability of the Company.
The Company has not recognized a deferred income tax liability for the undistributed profits of our subsidiaries, as the Company currently has no intention to repatriate these profits. If expectations or intentions change in the future, the Company may be subject to an additional tax liability upon distribution of these earnings in the form of dividend or otherwise. As at September 30, 2012, a deferred income tax liability of approximately $28 million would result from the recognition of the taxable temporary differences of approximately $123 million.
GILDAN 2012 REPORT TO SHAREHOLDERS P.88
| | NOTES TO CONSOLIDATED FINANCIAL STATEMENTS |
Reconciliation between basic and diluted earnings per share is as follows:
| | | 2012 | | | 2011 | |
| | | | | | | |
Net earnings - basic and diluted | $ | 148,464 | | $ | 234,156 | |
| | | | | | |
Basic earnings per share: | | | | | | |
Basic weighted average number of common shares outstanding | | 121,488 | | | 121,526 | |
Basic earnings per share | $ | 1.22 | | $ | 1.93 | |
| | | | | | |
Diluted earnings per share: | | | | | | |
Basic weighted average number of common shares outstanding | | 121,488 | | | 121,526 | |
Plus dilutive impact of stock options, Treasury RSUs and common shares held in trust | | 580 | | | 757 | |
Diluted weighted average number of common shares outstanding | | 122,068 | | | 122,283 | |
Diluted earnings per share | $ | 1.22 | | $ | 1.91 | |
Excluded from the above calculation for the year ended September 30, 2012 are 823,687 stock options (2011 -155,848) and 62,000 Treasury RSUs (2011 - nil) which were deemed to be anti-dilutive.
| 22. DEPRECIATION AND AMORTIZATION: |
| | | 2012 | | | 2011 | |
| | | | | | | |
Depreciation of property, plant and equipment | $ | 80,625 | | $ | 64,168 | |
Adjustment for the variation of depreciation of property, plant and equipment included in inventories at the beginning and end of the year | | (2,863 | ) | | (3,423 | ) |
Depreciation of property, plant and equipment included in net earnings | | 77,762 | | | 60,745 | |
Amortization of intangible assets (excluding software) | | 15,152 | | | 8,658 | |
Amortization of software | | 1,659 | | | 4,733 | |
Depreciation and amortization included in net earnings | $ | 94,573 | | $ | 74,136 | |
Depreciation and amortization expense for fiscal 2012 includes an impairment charge of $6.0 million, which consists primarily of a charge of $3.9 million related to the retirement, before the end of the previously estimated useful lives, of certain machinery and equipment in connection with the ramp-down of the Company’s Rio Nance 1 textile facility in Honduras.
GILDAN 2012 REPORT TO SHAREHOLDERS P.89
| | NOTES TO CONSOLIDATED FINANCIAL STATEMENTS |
| 23.SUPPLEMENTAL CASH FLOW DISCLOSURE: |
| (a) | Adjustments to reconcile net earnings to cash flows from operating activities: |
| | | | 2012 | | | 2011 | |
| | | | | | | | |
| | Depreciation and amortization (note 22) | $ | 94,573 | | $ | 74,136 | |
| | Purchase gain on business acquisition (note 5) | | (6,679 | ) | | - | |
| | Loss (gain) on re-measurement of contingent consideration in connection with a business acquisition (note 5) | | 532 | | | (1,460 | ) |
| | Restructuring charges related to assets held for sale and property, plant and equipment (note 19) | | 4,851 | | | 2,356 | |
| | Loss on disposal of property, plant and equipment | | 1,619 | | | 1,877 | |
| | Loss on disposal of corporate asset (i) | | - | | | 3,693 | |
| | Share-based compensation costs | | 4,606 | | | 4,899 | |
| | Deferred income taxes | | (10,342 | ) | | (22,599 | ) |
| | Equity earnings in investment in joint venture | | (597 | ) | | (504 | ) |
| | Unrealized net loss on foreign exchange and financial derivatives | | 160 | | | 255 | |
| | Other non-current assets | | 6,634 | | | (701 | ) |
| | Employee benefit obligations | | (1,452 | ) | | (14,310 | ) |
| | Provisions | | 316 | | | 275 | |
| | | $ | 94,221 | | $ | 47,917 | |
| | (i) | During fiscal 2011, the Company purchased a corporate aircraft under a finance lease pursuant to an early purchase option for approximately $16.9 million. Immediately following the purchase, the Company sold the corporate aircraft to an unrelated third party for proceeds of $13.2 million, resulting in a loss of $3.7 million which is included in selling, general and administrative expenses. The Company has leased a new corporate aircraft which is being accounted for as an operating lease. |
| (b) | Non-cash transactions: |
| | | | 2012 | | | 2011 | |
| | | | | | | | |
| | Variance of non-cash transactions: | | | | | | |
| | Additions to property, plant and equipment included in accounts payable and accrued liabilities | $ | (1,295 | ) | $ | 2,927 | |
| | Proceeds on disposal of property, plant and equipment in other non-current assets | | - | | | 427 | |
| | | | | | | | |
| | Non-cash ascribed value credited to contributed surplus for dividends attributed to Treasury RSUs | $ | 252 | | $ | 191 | |
| | Non-cash ascribed value credited to share capital from shares issued or distributed pursuant to vesting of restricted share units and exercise of stock options | | 5,166 | | | 807 | |
| | Shares issued for lease termination costs incurred in a business acquisition | | - | | | 1,065 | |
GILDAN 2012 REPORT TO SHAREHOLDERS P.90
| | NOTES TO CONSOLIDATED FINANCIAL STATEMENTS |
| 24.RELATED PARTY TRANSACTIONS: |
| (a) | Joint ventures: |
| | |
| The Company has transactions with CanAm. These transactions are based on arm’s length terms and are measured at the exchange amount, which is the amount of consideration established and agreed to by the related parties. All outstanding balances are to be settled in cash within twelve months of the reporting date. None of the balances are secured. The following is a summary of the related party transactions and balances owed: |
| | | | 2012 | | | 2011 | |
| | | | | | | | |
| | Transactions: | | | | | | |
| | Yarn purchases | $ | 126,126 | | $ | 142,601 | |
| | Yarn sales | | 1,304 | | | 1,188 | |
| | Dividend received | | 1,509 | | | - | |
| | | | | | | | |
| | Balances outstanding: | | | | | | |
| | Other non-current assets (loan receivable) | | - | | | 3,895 | |
| | Accounts payable and accrued liabilities | | 2,027 | | | 3,270 | |
The Company has no contingent liabilities or capital commitments with the joint venture. On October 29, 2012, the Company acquired the remaining 50% ownership interest of CanAm as described in note 28 to these consolidated financial statements.
The following table illustrates the Company’s proportionate share of summarized financial information of CanAm as at and for the years then ended:
| | | | September 30, | | | October 2, | | | October 4, | |
| | | | 2012 | | | 2011 | | | 2010 | |
| | | | | | | | | | | |
| | Share of the joint venture's statement of financial position: | | | | | | | | | |
| | Current assets | $ | 6,449 | | $ | 8,973 | | $ | 8,075 | |
| | Non-current assets | | 6,878 | | | 8,130 | | | 7,680 | |
| | Current liabilities | | (2,044 | ) | | (5,477 | ) | | (2,132 | ) |
| | Non-current liabilities | | - | | | - | | | (2,386 | ) |
| | Equity | $ | 11,283 | | $ | 11,626 | | $ | 11,237 | |
| | | | | | | | | | | |
| | | | | | | 2012 | | | 2011 | |
| | | | | | | | | | | |
| | Share of the joint venture's income and expenses: | | | | | | | | | |
| | Income | | | | $ | 62,260 | | $ | 70,994 | |
| | Expenses | | | | | 61,094 | | | 70,605 | |
| | | | | | $ | 1,166 | | $ | 389 | |
| (b) | Key management personnel compensation: |
| | |
| Key management personnel includes those individuals that have authority and responsibility for planning, directing and controlling the activities of the Company, directly or indirectly, and is comprised of the members of the executive management team and the Board of Directors. The amount for compensation expense recognized in net earnings for key management personnel was as follows: |
| | | | 2012 | | | 2011 | |
| | Short-term employee benefits | $ | 3,263 | | $ | 6,415 | |
| | Post-employment benefits | | 131 | | | 194 | |
| | Share-based payments | | 6,976 | | | 5,000 | |
| | | $ | 10,370 | | $ | 11,609 | |
GILDAN 2012 REPORT TO SHAREHOLDERS P.91
| | NOTES TO CONSOLIDATED FINANCIAL STATEMENTS |
| 24.RELATED PARTY TRANSACTIONS (continued): |
| (c) | Other: |
| | |
| The Company leases warehouse and office space from an officer of a subsidiary of the Company under operating leases. The payments made on these leases were in accordance with the terms of the lease agreements established and agreed to by the related parties, which amounted to $0.9 million for fiscal 2012 (2011 - $0.6 million). There were no amounts owing as at September 30, 2012 and October 2, 2011. |
| 25.COMMITMENTS, GUARANTEES AND CONTINGENT LIABILITIES: |
| (a) | Security class actions: |
| | |
| In June 2008, the Company and certain of its senior officers were named as defendants in a number of class action lawsuits filed in the United States District Court for the Southern District of New York, which were subsequently consolidated, alleging claims under the U.S. securities laws, as well as in class action lawsuits filed in the Ontario Superior Court of Justice and in the Quebec Superior Court. Each of these U.S. and Canadian lawsuits alleged, among other things, that the defendants misrepresented the Company’s financial condition and its financial prospects in its earnings guidance concerning the 2008 fiscal year, which guidance was subsequently revised on April 29, 2008. |
| | |
| In August 2010, the Company entered into an agreement to settle all claims raised in these class action lawsuits and final court approval of the settlement was obtained from each of the courts in February and March 2011. Consequently, all of the actions have been dismissed. The settlement agreement provided for a total settlement amount of $22.5 million, which was entirely funded by the Company’s insurers. Therefore no provision has been recorded in the consolidated financial statements and no amounts have been disbursed by the Company in respect of the settlement. |
| | |
| (b) | Claims and litigation |
| | |
| On October 12, 2012, Russell Brands, LLC, an affiliate of Fruit of the Loom, filed a lawsuit against the Company in the United States District Court of the Western District of Kentucky at Bowling Green, alleging trademark infringement and unfair competition and seeking injunctive relief and unspecified money damages. The litigation concerns labelling errors on certain inventory products shipped by Gildan to one of its customers. Upon being made aware of the error, the Company took immediate action to retrieve the disputed products. The Company believes that the value of the products in dispute is immaterial. |
| | |
| The Company is a party to other claims and litigation arising in the normal course of operations. The Company does not expect the resolution of these matters to have a material adverse effect on the financial position or results of operations of the Company. |
| | |
| (c) | Guarantees: |
| | |
| The Company, and some of its subsidiaries, have granted corporate guarantees, irrevocable standby letters of credit and surety bonds, to third parties to indemnify them in the event the Company and some of its subsidiaries do not perform their contractual obligations. As at September 30, 2012, the maximum potential liability under these guarantees was $16.5 million (October 2, 2011 - $15.1 million; October 4, 2010 - $21.8 million), of which $6.9 million was for surety bonds and $9.6 million was for corporate guarantees and standby letters of credit (October 2, 2011 - $5.0 million and $10.1 million; October 4, 2010 - $5.1 million and $16.7 million, respectively). The surety bonds are automatically renewed on an annual basis, the corporate guarantees and standby letters of credit mature at various dates in fiscal 2013. |
| | |
| As at September 30, 2012, the Company has recorded no liability with respect to these guarantees, as the Company does not expect to make any payments for the aforementioned items. |
GILDAN 2012 REPORT TO SHAREHOLDERS P.92
| | NOTES TO CONSOLIDATED FINANCIAL STATEMENTS |
The Company’s objective in managing capital is to ensure sufficient liquidity to pursue its organic growth strategy and undertake selective acquisitions, while at the same time taking a conservative approach towards financial leverage and management of financial risk.
The Company’s capital is composed of net debt and shareholders’ equity. Net debt consists of interest-bearing debt less cash and cash equivalents. The Company’s primary uses of capital are to finance working capital requirements, capital expenditures, payment of dividends, and business acquisitions. The Company currently funds these requirements out of its internally-generated cash flows and the periodic use of its revolving long-term bank credit facility. The Company used its revolving long-term credit facility to finance the acquisition of Gold Toe Moretz in fiscal 2011 and to finance the acquisition of Anvil in fiscal 2012.
In November 2012, the Company amended its revolving long-term credit facility to extend the maturity date from June 2016 to January 2018. The amended agreement provides for an annual extension clause, subject to the approval of the lenders. It also provides for reduced drawn pricing when the net debt to EBITDA ratio is below 1.0:1, and reduced undrawn pricing.
The primary measure used by the Company to monitor its financial leverage is its ratio of net debt to earnings before financial expenses/income, taxes, depreciation and amortization, and restructuring and acquisition-related costs (“EBITDA”), which it aims to maintain at less than a maximum of 3.0:1. Net debt is defined as long-term debt less cash and cash equivalents. As at September 30, 2012 and October 2, 2011 the Company’s net debt to EBITDA ratio was below 1.0:1.
In order to maintain or adjust its capital structure, the Company, upon approval from its Board of Directors, may issue or repay long-term debt, issue shares, repurchase shares, pay dividends or undertake other activities as deemed appropriate under the specific circumstances.
During fiscal 2012, the Company paid an aggregate of $36.6 million of dividends (2011 - $27.5 million) representing a quarterly dividend of $0.075 per share. On November 28, 2012 the Board of Directors declared a quarterly dividend of $0.09 per share for an expected aggregate payment of $10.9 million which will be paid on January 7, 2013 on all of the issued and outstanding common shares of the Company, rateably and proportionately to the holders of record on December 13, 2012. This dividend is an “eligible dividend” for the purposes of the Income Tax Act (Canada) and any other applicable provincial legislation pertaining to eligible dividends.
The Board of Directors will consider several factors when deciding to declare quarterly cash dividends, including the Company’s present and future earnings, cash flows, capital requirements and present and/or future regulatory and legal restrictions. There can be no assurance as to the declaration of future quarterly cash dividends. Although the Company’s revolving long-term credit facility requires compliance with lending covenants in order to pay dividends, these covenants are not currently, and are not expected to be, a constraint to the payment of dividends under the Company’s dividend policy.
The Company is not subject to any capital requirements imposed by a regulator.
During the first quarter of fiscal 2012, the Company began managing and reporting its business as two operating segments, Printwear and Branded Apparel, each of which is a reportable segment for financial reporting purposes. Each segment has its own management that is accountable and responsible for the segment’s operations, results and financial performance. These segments are principally organized by the major customer markets they serve. The Company previously managed and reported its operations under one reportable business segment, being high-volume, basic, frequently replenished, non-fashion apparel. The following summary describes the operations of each of the Company’s operating segments:
Printwear: The Printwear segment, headquartered in Barbados, designs, manufactures, sources, and distributes globally undecorated activewear products primarily to wholesale distributors and decorators in over 30 countries across North America, Europe and the Asia-Pacific region.
Branded Apparel: The Branded Apparel segment, headquartered in Charleston, South Carolina, designs, manufactures, sources, and distributes socks, underwear and activewear products primarily to U.S. retailers.
GILDAN 2012 REPORT TO SHAREHOLDERS P.93
| | NOTES TO CONSOLIDATED FINANCIAL STATEMENTS |
| 27.SEGMENT INFORMATION (continued): |
Following the acquisition of Anvil as described in note 5, the Printwear segment includes the results of operations of Anvil’s printwear business, while the Branded Apparel segment includes Anvil’s operations related to the manufacture and distribution of activewear products for leading consumer brands, including major sportswear and family entertainment brands.
The chief operating decision-maker assesses segment performance based on segment operating income which is defined as operating income before corporate head office expenses, restructuring and acquisition-related costs, and amortization of intangible assets. The accounting policies of the segments are the same as those described in note 3 of these consolidated financial statements.
The segment disclosures below include comparative financial information for the year ended October 2, 2011, which have been presented on the same reportable segment basis as fiscal 2012. Certain comparative figures for entity-wide net sales disclosures have been reclassified to conform with the current year’s presentation.
| | | 2012 | | | 2011 | |
| | | | | | | |
Segmented net sales: | | | | | | |
Printwear | $ | 1,334,252 | | $ | 1,327,682 | |
Branded Apparel | | 614,001 | | | 398,030 | |
Total net sales | $ | 1,948,253 | | $ | 1,725,712 | |
| | | | | | |
Segment operating income (loss): | | | | | | |
Printwear | $ | 209,426 | | $ | 330,220 | |
Branded Apparel | | 32,827 | | | (16,180 | ) |
Total segment operating income | $ | 242,253 | | $ | 314,040 | |
| | | | | | |
Reconciliation to consolidated earnings before income taxes: | | | | | | |
Total segment operating income | $ | 242,253 | | $ | 314,040 | |
Amortization of intangible assets, excluding software | | (15,152 | ) | | (8,658 | ) |
Corporate expenses | | (57,011 | ) | | (66,634 | ) |
Restructuring and acquisition-related costs | | (14,962 | ) | | (18,177 | ) |
Financial expenses, net | | (11,598 | ) | | (6,142 | ) |
Equity earnings in investment in joint venture | | 597 | | | 504 | |
Earnings before income taxes | $ | 144,127 | | $ | 214,933 | |
| | | | | | |
Additions to property, plant and equipment and intangible assets (including additions from business acquisitions): | | | | | | |
Printwear | $ | 73,205 | | $ | 119,664 | |
Branded Apparel | | 21,929 | | | 246,077 | |
Corporate | | 4,779 | | | 5,773 | |
| $ | 99,913 | | $ | 371,514 | |
| | | | | | |
Depreciation of property, plant and equipment: | | | | | | |
Printwear | $ | 54,473 | | $ | 37,885 | |
Branded Apparel | | 21,195 | | | 19,841 | |
Corporate | | 2,094 | | | 3,019 | |
| $ | 77,762 | | $ | 60,745 | |
GILDAN 2012 REPORT TO SHAREHOLDERS P.94
| | NOTES TO CONSOLIDATED FINANCIAL STATEMENTS |
| 27.SEGMENT INFORMATION (continued): |
The reconciliation of total assets to segmented assets is as follows:
| | | September 30, | | | October 2, | | | October 4, | |
| | | 2012 | | | 2011 | | | 2010 | |
| | | | | | | | | | |
Segmented assets (i): | | | | | | | | | |
Printwear | $ | 886,209 | | $ | 884,755 | | $ | 637,728 | |
Branded Apparel | | 887,510 | | | 833,481 | | | 387,256 | |
Total segmented assets | | 1,773,719 | | | 1,718,236 | | | 1,024,984 | |
Unallocated assets: | | | | | | | | | |
Cash and cash equivalents | | 70,410 | | | 82,025 | | | 250,843 | |
Income taxes receivable | | 353 | | | 515 | | | - | |
Assets held for sale | | 8,029 | | | 13,142 | | | 3,246 | |
Investment in joint venture | | 12,126 | | | 13,038 | | | 12,533 | |
Deferred income taxes | | 3,371 | | | - | | | - | |
Other - primarily corporate assets | | 28,429 | | | 31,543 | | | 42,897 | |
Consolidated assets | $ | 1,896,437 | | $ | 1,858,499 | | $ | 1,334,503 | |
(i) Segmented assets include the net carrying amounts of intangible assets and goodwill.
Property, plant and equipment, intangible assets, and goodwill, were allocated to geographic areas as follows:
| | | September 30, | | | October 2, | | | October 4, | |
| | | 2012 | | | 2011 | | | 2010 | |
| | | | | | | | | | |
| United States | $ | 450,581 | | $ | 461,654 | | $ | 132,488 | |
| Canada | | 15,101 | | | 13,620 | | | 31,874 | |
| Honduras | | 350,856 | | | 334,976 | | | 245,434 | |
| Caribbean Basin | | 109,056 | | | 116,909 | | | 120,960 | |
| Bangladesh | | 17,289 | | | 15,879 | | | 15,612 | |
| Other | | 11,468 | | | 10,872 | | | 13,653 | |
| | $ | 954,351 | | $ | 953,910 | | $ | 560,021 | |
Net sales by major product group:
| | | 2012 | | | 2011 | |
| | | | | | | |
| Activewear and underwear | $ | 1,472,510 | | $ | 1,405,707 | |
| Socks | | 475,743 | | | 320,005 | |
| | $ | 1,948,253 | | $ | 1,725,712 | |
Net sales were derived from customers located in the following geographic areas:
| | | 2012 | | | 2011 | |
| | | | | | | |
| United States | $ | 1,738,564 | | $ | 1,539,994 | |
| Canada | | 67,752 | | | 63,424 | |
| Europe and other | | 141,937 | | | 122,294 | |
| | $ | 1,948,253 | | $ | 1,725,712 | |
GILDAN 2012 REPORT TO SHAREHOLDERS P.95
| | NOTES TO CONSOLIDATED FINANCIAL STATEMENTS |
| 27.SEGMENT INFORMATION (continued): |
The Company has two customers accounting for at least 10% of total net sales.
| | | 2012 | | | 2011 | |
| | | | | | | |
| Customer A | | 14.8% | | | 19.4% | |
| Customer B | | 12.0% | | | 12.1% | |
| 28.EVENTS AFTER THE REPORTING PERIOD: |
On October 29, 2012, the Company acquired the remaining 50% interest of CanAm, its jointly-controlled entity, for cash consideration of $2.5 million, net of cash acquired of $8.8 million. The strategic rationale of the acquisition of the remaining 50% interest, combined with the Company’s plans to modernize and expand CanAm’s two yarn-spinning facilities, is to support the Company’s projected sales growth and also to continue to pursue the Company’s business model of investing in global low-cost manufacturing technology and in product technology which will provide consistent superior product quality. The acquisition will be financed by the utilization of the Company’s revolving long-term bank credit facility. The Company will account for this acquisition using the acquisition method in accordance with IFRS 3, Business Combinations, and the results of CanAm will be consolidated with those of the Company from the date of acquisition. The Company has not yet completed the accounting for the business acquisition including the determination of the fair values of the identifiable net assets acquired.
GILDAN 2012 REPORT TO SHAREHOLDERS P.96
| | NOTES TO CONSOLIDATED FINANCIAL STATEMENTS |
| 29.FIRST TIME ADOPTION OF IFRS: |
As stated in note 2(a), these are the Company’s first audited annual consolidated financial statements prepared in accordance with IFRS.
The Company has applied the accounting policies set out in note 3 in the preparation of the consolidated financial statements for the year ended September 30, 2012, the comparative information presented in the consolidated financial statements related to the year ended October 2, 2011 and the opening IFRS consolidated statement of financial position as at October 4, 2010 (the Company’s transition date).
This note provides a reconciliation, with explanatory notes, of the adjustments made by the Company in recasting the following financial information previously prepared in accordance with previous Canadian GAAP:
- Consolidated statements of financial position as at October 2, 2011 and October 4, 2010; and
- Consolidated statement of earnings and comprehensive income for the year ended October 2, 2011.
IFRS 1 Exemptions
IFRS 1, First Time Adoption of International Financial Reporting Standards, requires first time adopters to retrospectively apply all effective IFRS standards as of its first annual financial statements, which for the Company is September 30, 2012. However, IFRS 1 also provides first-time adopters certain optional exemptions and mandatory exceptions from full retrospective application. The following outlines the optional exemptions and mandatory exception that the Company has applied at the transition date:
Optional exemptions:
Foreign exchange cumulative translation adjustments- The exemption permits the balance of any cumulative translation adjustment (“CTA”) to be eliminated by an adjustment to opening retained earnings at the transition date. As a result, the Company eliminated its CTA balance of $26.2 million which was included in accumulated other comprehensive income through an adjustment to retained earnings at the transition date.
Decommissioning and restoration liabilities- The exemption permits the Company not to apply IFRIC 1, Changes in Existing Decommissioning, Restoration and Similar Liabilities, retrospectively to calculate the opening depreciated cost of the asset relating to decommissioning and site restoration costs under IFRS, but rather to use a simplified approach based on the discounted value of the liability at the transition date.
Business combinations- The exemption permits the Company not to apply IFRS 3, Business Combinations, to business combinations occurring prior to the transition date.
Share-based payment transactions- The exemption permits the Company to apply IFRS 2, Share-based Payment, only to equity instruments that were granted after November 7, 2002, which have not yet vested at the transition date.
Borrowing costs- The exemption permits the capitalization of borrowing costs to be limited to qualifying assets for which commencement date for capitalization is on or after the date of transition.
Mandatory exceptions:
Estimates– Hindsight is not used to create or revise estimates. The estimates previously made by the Company under Canadian GAAP were not revised for the application of IFRS except where necessary to reflect differences in accounting standards.
GILDAN 2012 REPORT TO SHAREHOLDERS P.97
| | NOTES TO CONSOLIDATED FINANCIAL STATEMENTS |
| 29.FIRST TIME ADOPTION OF IFRS (continued): |
Reconciliation of financial position and equity at October 2, 2011 from Canadian GAAP to IFRS:
| | | | | | IFRS adjustments | | | | | | | |
| | | | | | CanAm | | | Other | | | | | | | |
| | | Canadian GAAP | | | Adjustments | | | Adjustments | | | | | | IFRS | |
| | | | | | Note 1 | | | | | | Note | | | | |
Current assets: | | | | | | | | | | | | | | | |
Cash and cash equivalents | $ | 88,802 | | $ | (6,777 | ) | $ | - | | | | | $ | 82,025 | |
Trade accounts receivable | | 191,594 | | | - | | | - | | | | | | 191,594 | |
Income taxes receivable | | 515 | | | - | | | - | | | | | | 515 | |
Inventories | | 575,594 | | | (7,283 | ) | | - | | | | | | 568,311 | |
Prepaid expenses and deposits | | 10,966 | | | (139 | ) | | - | | | | | | 10,827 | |
Assets held for sale | | - | | | - | | | 13,142 | | | 3 | | | 13,142 | |
Deferred income taxes | | 11,666 | | | - | | | (11,666 | ) | | 4 | | | - | |
Other current assets | | 9,307 | | | (79 | ) | | - | | | | | | 9,228 | |
Total current assets | | 888,444 | | | (14,278 | ) | | 1,476 | | | | | | 875,642 | |
Property, plant and equipment | | 565,398 | | | (16,155 | ) | | 4,528 | | | 5 | | | 550,324 | |
| | | | | | | | (3,447 | ) | | 6 | | | | |
Investment in joint venture | | - | | | 13,038 | | | - | | | | | | 13,038 | |
Assets held for sale | | 13,142 | | | - | | | (13,142 | ) | | 3 | | | - | |
Intangible assets | | 256,467 | | | - | | | 5,186 | | | 7 | | | 261,653 | |
Goodwill | | 153,219 | | | - | | | (5,815 | ) | | 9 | | | 141,933 | |
| | | | | | | | 3,345 | | | 9 | | | | |
| | | | | | | | (5,839 | ) | | 12 | | | | |
| | | | | | | | (2,977 | ) | | 13 | | | | |
Other assets | | 13,051 | | | 3,887 | | | (1,029 | ) | | 8 | | | 15,909 | |
Total assets | $ | 1,889,721 | | $ | (13,508 | ) | $ | (17,714 | ) | | | | $ | 1,858,499 | |
Current liabilities: | | | | | | | | | | | | | | | |
Accounts payable and accrued liabilities | $ | 315,269 | | $ | (3,359 | ) | $ | 3,850 | | | 9 | | $ | 297,960 | |
| | | | | | | | (13,827 | ) | | 10 | | | | |
| | | | | | | | (3,973 | ) | | 14 | | | | |
Total current liabilities | | 315,269 | | | (3,359 | ) | | (13,950 | ) | | | | | 297,960 | |
Long-term debt | | 209,000 | | | - | | | - | | | | | | 209,000 | |
Deferred income taxes | | 26,575 | | | - | | | (11,666 | ) | | 4 | | | 11,977 | |
| | | | | | | | (2,097 | ) | | 8 | | | | |
| | | | | | | | (1,425 | ) | | 9 | | | | |
| | | | | | | | 452 | | | 13 | | | | |
| | | | | | | | (1,357 | ) | | 14 | | | | |
| | | | | | | | (373 | ) | | 6 | | | | |
| | | | | | | | 1,868 | | | 7 | | | | |
Employee benefit obligations | | - | | | - | | | 13,827 | | | 10 | | | 20,246 | |
| | | | | | | | (1,220 | ) | | 13 | | | | |
| | | | | | | | 7,639 | | | 14 | | | | |
Provisions | | - | | | - | | | 8,226 | | | 5 | | | 8,226 | |
Non-controlling interest in consolidated joint venture | | 11,562 | | | (11,562 | ) | | - | | | | | | - | |
Total liabilities | | 562,406 | | | (14,921 | ) | | (76 | ) | | | | | 547,409 | |
Equity | | | | | | | | | | | | | | | |
Share capital | | 100,436 | | | - | | | - | | | | | | 100,436 | |
Contributed surplus | | 16,526 | | | - | | | - | | | | | | 16,526 | |
Retained earnings | | 1,184,781 | | | 1,413 | | | 26,248 | | | 11 | | | 1,194,804 | |
| | | | | | | | (2,309 | ) | | 14 | | | | |
| | | | | | | | (1,643 | ) | | 15 | | | | |
| | | | | | | | (13,686 | ) | | | | | | |
Accumulated other comprehensive income | | 25,572 | | | - | | | (26,248 | ) | | 11 | | | (676 | ) |
Total equity attributable to shareholders of the Company | | 1,327,315 | | | 1,413 | | | (17,638 | ) | | | | | 1,311,090 | |
Total liabilities and equity | $ | 1,889,721 | | $ | (13,508 | ) | $ | (17,714 | ) | | | | $ | 1,858,499 | |
GILDAN 2012 REPORT TO SHAREHOLDERS P.98
| | NOTES TO CONSOLIDATED FINANCIAL STATEMENTS |
| 29.FIRST TIME ADOPTION OF IFRS (continued): |
Reconciliation of financial position and equity at October 4, 2010 from Canadian GAAP to IFRS:
| | | | | IFRS adjustments | | | | | | | |
| | | | | CanAm | | | Other | | | | | | | |
| | Canadian GAAP | | | Adjustments | | | Adjustments | | | | | | IFRS | |
| | | | | Note 1 | | | | | | Note | | | | |
Current assets: | | | | | | | | | | | | | | | |
Cash and cash equivalents | $ | 258,442 | | $ | (7,599 | ) | $ | - | | | | | $ | 250,843 | |
Trade accounts receivable | | 145,684 | | | - | | | - | | | | | | 145,684 | |
Inventories | | 332,542 | | | (3,024 | ) | | - | | | | | | 329,518 | |
Prepaid expenses and deposits | | 9,584 | | | (245 | ) | | (491 | ) | | 2 | | | 8,848 | |
Assets held for sale | | - | | | - | | | 3,246 | | | 3 | | | 3,246 | |
Deferred income taxes | | 6,340 | | | - | | | (6,340 | ) | | 4 | | | - | |
Other current assets | | 9,079 | | | (409 | ) | | - | | | | | | 8,670 | |
Total current assets | | 761,671 | | | (11,277 | ) | | (3,585 | ) | | | | | 746,809 | |
Property, plant and equipment | | 479,292 | | | (15,731 | ) | | 16,998 | | | 2 | | | 483,013 | |
| | | | | | | | 4,808 | | | 5 | | | | |
| | | | | | | | (2,354 | ) | | 6 | | | | |
Investment in joint venture | | - | | | 12,533 | | | - | | | | | | 12,533 | |
Assets held for sale | | 3,246 | | | - | | | (3,246 | ) | | 3 | | | - | |
Intangible assets | | 61,321 | | | - | | | 5,490 | | | 7 | | | 66,811 | |
Goodwill | | 10,197 | | | - | | | - | | | | | | 10,197 | |
Other assets | | 11,805 | | | 4,364 | | | (1,029 | ) | | 8 | | | 15,140 | |
Total assets | $ | 1,327,532 | | $ | (10,111 | ) | $ | 17,082 | | | | | $ | 1,334,503 | |
Current liabilities: | | | | | | | | | | | | | | | |
Accounts payable and accrued liabilities | $ | 186,205 | | $ | (46 | ) | $ | 5,815 | | | 9 | | $ | 179,795 | |
| | | | | | | | (12,179 | ) | | 10 | | | | |
Income taxes payable | | 5,024 | | | - | | | - | | | | | | 5,024 | |
Current portion of long-term debt | | - | | | - | | | 16,879 | | | 2 | | | 16,879 | |
Total current liabilities | | 191,229 | | | (46 | ) | | 10,515 | | | | | | 201,698 | |
Deferred income taxes | | 10,816 | | | - | | | (1,366 | ) | | 8 | | | 4,771 | |
| | | | | | | | (6,340 | ) | | 4 | | | | |
| | | | | | | | (315 | ) | | 6 | | | | |
| | | | | | | | 1,976 | | | 7 | | | | |
Employee benefit obligations | | - | | | - | | | 12,179 | | | 10 | | | 12,179 | |
Provisions | | - | | | - | | | 7,951 | | | 5 | | | 7,951 | |
Non-controlling interest in consolidated joint venture | | 11,058 | | | (11,058 | ) | | - | | | | | | - | |
Total liabilities | | 213,103 | | | (11,104 | ) | | 24,600 | | | | | | 226,599 | |
Equity | | | | | | | | | | | | | | | |
Share capital | | 97,036 | | | - | | | - | | | | | | 97,036 | |
Contributed surplus | | 10,091 | | | - | | | - | | | | | | 10,091 | |
Retained earnings | | 982,764 | | | 993 | | | (372 | ) | | 2 | | | 1,002,487 | |
| | | | | | | | (3,143 | ) | | 5 | | | | |
| | | | | | | | (2,039 | ) | | 6 | | | | |
| | | | | | | | 3,514 | | | 7 | | | | |
| | | | | | | | 337 | | | 8 | | | | |
| | | | | | | | (5,815 | ) | | 9 | | | | |
| | | | | | | | 26,248 | | | 11 | | | | |
Accumulated other comprehensive income | | 24,538 | | | - | | | (26,248 | ) | | 11 | | | (1,710 | ) |
Total equity attributable to shareholders of the Company | | 1,114,429 | | | 993 | | | (7,518 | ) | | | | | 1,107,904 | |
Total liabilities and equity | $ | 1,327,532 | | $ | (10,111 | ) | $ | 17,082 | | | | | $ | 1,334,503 | |
GILDAN 2012 REPORT TO SHAREHOLDERS P.99
| | NOTES TO CONSOLIDATED FINANCIAL STATEMENTS |
| 29. FIRST TIME ADOPTION OF IFRS (continued): |
Reconciliation of comprehensive income for the year ended October 2, 2011 from Canadian GAAP to IFRS:
| | | | | IFRS adjustments | | | | | | | |
| | Canadian | | | CanAm | | | Other | | | | | | | |
| | GAAP | | | Adjustments | | | Adjustments | | | | | | IFRS | |
| | | | | Note 1 | | | | | | Note | | | | |
| | | | | | | | | | | | | | | |
Net sales | $ | 1,726,041 | | $ | (329 | ) | $ | - | | | | | $ | 1,725,712 | |
Cost of sales | | 1,288,293 | | | 316 | | | 280 | | | 5 | | | 1,288,106 | |
| | | | | | | | 860 | | | 6 | | | | |
| | | | | | | | (1,643 | ) | | 15 | | | | |
Gross profit | | 437,748 | | | (645 | ) | | 503 | | | | | | 437,606 | |
| | | | | | | | | | | | | | | |
Selling, general and administrative expenses | | 199,132 | | | 9 | | | 304 | | | 7 | | | 198,858 | |
| | | | | | | | (820 | ) | | 2 | | | | |
| | | | | | | | 233 | | | 6 | | | | |
Restructuring and acquisition-related costs | | 8,465 | | | - | | | 7,666 | | | 12 | | | 18,177 | |
| | | | | | | | (1,460 | ) | | 9 | | | | |
| | | | | | | | 3,506 | | | 13 | | | | |
Operating income | | 230,151 | | | (654 | ) | | (8,926 | ) | | | | | 220,571 | |
| | | | | | | | | | | | | | | |
Financial expenses, net | | 5,485 | | | (66 | ) | | 448 | | | 2 | | | 6,142 | |
| | | | | | | | 275 | | | 5 | | | | |
Non-controlling interest in consolidated joint venture | | 504 | | | (504 | ) | | - | | | | | | - | |
Equity (earnings) loss in investment in joint venture | | - | | | (504 | ) | | - | | | | | | (504 | ) |
Earnings before income taxes | | 224,162 | | | 420 | | | (9,649 | ) | | | | | 214,933 | |
| | | | | | | | | | | | | | | |
Income tax recovery | | (15,742 | ) | | - | | | (731 | ) | | 8 | | | (19,223 | ) |
| | | | | | | | (58 | ) | | 6 | | | | |
| | | | | | | | (108 | ) | | 7 | | | | |
| | | | | | | | 540 | | | 9 | | | | |
| | | | | | | | (1,827 | ) | | 12 | | | | |
| | | | | | | | (1,297 | ) | | 13 | | | | |
Net earnings | | 239,904 | | | 420 | | | (6,168 | ) | | | | | 234,156 | |
| | | | | | | | | | | | | | | |
Other comprehensive income, net of related income taxes | | 1,034 | | | - | | | (2,309 | ) | | 14 | | | (2,918 | ) |
| | | | | | | | (1,643 | ) | | 15 | | | | |
Comprehensive income | $ | 240,938 | | $ | 420 | | $ | (10,120 | ) | | | | $ | 231,238 | |
| | | | | | | | | | | | | | | |
Earnings per share: | | | | | | | | | | | | | | | |
Basic EPS | $ | 1.97 | | | | | | | | | | | $ | 1.93 | |
Basic weighted average number of shares outstanding | | 121,526 | | | | | | | | | | | | 121,526 | |
| | | | | | | | | | | | | | | |
Diluted EPS | $ | 1.96 | | | | | | | | | | | $ | 1.91 | |
Diluted weighted average number of shares outstanding | | 122,283 | | | | | | | | | | | | 122,283 | |
GILDAN 2012 REPORT TO SHAREHOLDERS P.100
| | NOTES TO CONSOLIDATED FINANCIAL STATEMENTS |
| 29.FIRST TIME ADOPTION OF IFRS (continued): |
NOTES TO RECONCILIATIONS FROM CANADIAN GAAP TO IFRS:
| 1) | Investment in joint venture |
Under Canadian GAAP, the Company consolidated the accounts of its yarn-spinning joint venture CanAm. Under IFRS, CanAm is considered a jointly controlled entity over which the Company has joint control. Consequently, the Company no longer consolidates CanAm and accounts for the investment using the equity method as at October 4, 2010, which is the opening IFRS statement of financial position date.
Impact on consolidated statements of financial position as at October 2, 2011 and October 4, 2010:Under IFRS, the Company’s net investment in CanAm is presented as a long-term asset on one line in the consolidated statement of financial position, for an amount equal to the Company’s initial investment and its cumulative share of undistributed earnings.
| | October 2, 2011 | | | October 4, 2010 | |
| | | | | | |
Increase in investment in joint venture | $ | 13,038 | | $ | 12,533 | |
Decrease in assets (excluding investment in joint venture) | | (26,546 | ) | | (22,644 | ) |
Decrease in total liabilities and equity | | (13,508 | ) | | (10,111 | ) |
Impact on consolidated statement of earnings and comprehensive income for the year ended October 2, 2011:Consolidated net earnings and comprehensive income are not significantly affected by this change. Non-material adjustments to certain components of net earnings have been made as the Company’s share of CanAm’s net earnings are presented in a separate caption in the statement of earnings, appearing below the gross profit subtotal as opposed to presenting the results of CanAm on each line of the statement of earnings and comprehensive income.
| 2) | Corporate aircraft lease |
A previous lease of a corporate aircraft, which was accounted for as an operating lease under Canadian GAAP, met the criteria for a finance lease under IFRS at the transition date primarily due to the fact that the Company had given notice to the lessor in fiscal 2010 to exercise an early purchase option. Accordingly, this lease was recognized on the statement of financial position as a finance lease.
Impact on consolidated statements of financial position as at October 2, 2011 and October 4, 2010:The impact of reclassifying the corporate aircraft lease, previously classified as an operating lease, resulted in an increase in property, plant and equipment, an increase in current liabilities, and a decrease to prepaid expenses and deposits as at October 4, 2010. During the second quarter of fiscal 2011, the Company completed the purchase of the corporate aircraft and immediately sold it to an external, unrelated party. There was no impact on net earnings in the accounting for the disposal of the corporate aircraft between Canadian GAAP and IFRS, therefore, there was no adjustment required at October 2, 2011 for the difference which existed at October 4, 2010.
| | | October 2, 2011 | | | October 4, 2010 | |
| | | | | | | |
| Decrease in prepaid expenses and deposits | $ | - | | $ | (491 | ) |
| Increase in property, plant and equipment | | - | | | 16,998 | |
| Increase in current portion of long-term debt | | - | | | 16,879 | |
| Decrease in equity | | - | | | (372 | ) |
GILDAN 2012 REPORT TO SHAREHOLDERS P.101
| | NOTES TO CONSOLIDATED FINANCIAL STATEMENTS |
| 29. FIRST TIME ADOPTION OF IFRS (continued): |
NOTES TO RECONCILIATIONS FROM CANADIAN GAAP TO IFRS (continued):
| 2) | Corporate aircraft lease (continued) |
Impact on consolidated statement of earnings and comprehensive income for the year ended October 2, 2011:The impact of the difference in lease classification was a decrease in selling, general and administrative expenses (“SG&A”) due to the reversal of rent expense, partially offset by the depreciation incurred on the asset that was reclassified as a finance lease. Conversely, financial expenses increased due to the interest accretion on the debt related to the finance lease.
| | | Twelve months ended | |
| | | October 2, 2011 | |
| | | | |
| Decrease in SG&A | $ | (820 | ) |
| Increase in financial expenses | | 448 | |
| Increase in comprehensive income | | 372 | |
During the second quarter of fiscal 2011, the Company entered into a new lease for a corporate aircraft which was being accounted for as an operating lease under Canadian GAAP and which is also being accounted for as an operating lease under IFRS.
Under Canadian GAAP, assets held for sale were classified as non-current assets. Under IFRS, assets held for sale are classified as current assets.
Impact on consolidated statements of financial position as at October 2, 2011 and October 4, 2010:This difference has resulted in an adjustment of $13.1 million as at October 2, 2011 and $3.2 million as at October 4, 2010 to reclassify assets held for sale from non-current to current assets.
Impact on consolidated statement of earnings and comprehensive income for the year ended October 2, 2011:There is no impact on net earnings and comprehensive income.
| 4) | Classification of deferred income taxes |
Under Canadian GAAP, deferred income taxes are classified as current and non-current based on the classification of the underlying assets or liabilities to which they relate or, if there is no underlying recognized asset or liability, based on the expected reversal of the temporary difference. Under IFRS, deferred income taxes are classified as non-current. Also under IFRS deferred income tax assets and deferred income tax liabilities are offset if the taxable entity has a legally enforceable right to offset current income tax liabilities and current income tax assets, and the deferred income tax assets and liabilities relate to income taxes levied by the same taxation authority on the same taxable entity.
Impact on consolidated statements of financial position as at October 2, 2011 and October 4, 2010:This difference has resulted in an adjustment of $11.7 million as at October 2, 2011 and $6.3 million as at October 4, 2010 to reclassify deferred income tax assets from current to non-current. The reclassification of deferred income tax assets has been offset against non-current deferred tax liabilities.
Impact on consolidated statement of earnings and comprehensive income for the year ended October 2, 2011:There is no impact on net earnings and comprehensive income.
GILDAN 2012 REPORT TO SHAREHOLDERS P.102
| | NOTES TO CONSOLIDATED FINANCIAL STATEMENTS |
| 29.FIRST TIME ADOPTION OF IFRS (continued): |
NOTES TO RECONCILIATIONS FROM CANADIAN GAAP TO IFRS (continued):
| 5) | Decommissioning and site restoration costs |
Under Canadian GAAP, asset retirement obligations, which are referred to as liabilities for decommissioning and site restoration costs under IFRS, were not required to be recognized when the timing and/or method of settlement was conditional on a future event, the entity had several options to settle the obligation, and the obligation had an indeterminate settlement date. Under IFRS, when the method and timing of the future settlement of an existing obligation are uncertain, an entity should determine a range of possible outcomes and methods of settlement and make an estimate of the future obligation. Under Canadian GAAP, the Company did not recognize any liability and corresponding asset for the estimated future costs of decommissioning and site restoration for certain assets located at its textile and sock facilities since the criteria for recognition had not been met. However, it was determined that an obligation exists under IFRS. The Company has elected to use an optional exemption that allows the use of a simplified approach to calculate the IFRS adjustment for the depreciated cost of the property, plant and equipment at the transition date relating to the decommissioning and site restoration liability, as opposed to recalculating the asset value since its inception date as would otherwise be required under IFRS.
Impact on consolidated statements of financial position as at October 2, 2011 and October 4, 2010:The estimate of the present value of future decommissioning and site restoration costs for certain assets at the Company’s offshore locations resulted in the recognition as at October 4, 2010 of a site restoration liability classified as a non-current liability, an increase to property, plant and equipment, and a reduction to equity to reflect the accumulated depreciation for the property, plant and equipment since inception.
| | | October 2, 2011 | | | October 4, 2010 | |
| | | | | | | |
| Increase in property, plant and equipment | $ | 4,528 | | $ | 4,808 | |
| Increase in provisions | | 8,226 | | | 7,951 | |
| Decrease in equity | | (3,698 | ) | | (3,143 | ) |
Impact on consolidated statement of earnings and comprehensive income for the year ended October 2, 2011:The increase in property, plant and equipment has resulted in an increase in depreciation expense, which is reported in cost of sales, as well as an increase in financial expenses to reflect the interest accretion on the decommissioning and site restoration liability.
| | | Twelve months ended | |
| | | October 2, 2011 | |
| | | | |
| Increase in cost of sales | $ | 280 | |
| Increase in financial expenses | | 275 | |
| Decrease in comprehensive income | | (555 | ) |
| 6) | Components of property, plant and equipment |
Under Canadian GAAP, the cost of an item of property, plant and equipment made up of significant separable component parts was allocated to the component parts only when practicable and when estimates could have been made of the lives of the separate components. Under IFRS, each part of an item of property, plant and equipment with a cost that is significant in relation to the total cost of the item shall be depreciated separately, each with its own useful life, resulting in depreciation expense which may differ from depreciation expense under Canadian GAAP.
Impact on consolidated statements of financial position as at October 2, 2011 and October 4, 2010:The impact of the identification of significant components of certain buildings resulted in a reduction to property, plant and equipment, primarily due to lower useful lives assigned to certain components.
GILDAN 2012 REPORT TO SHAREHOLDERS P.103
| | NOTES TO CONSOLIDATED FINANCIAL STATEMENTS |
| 29. FIRST TIME ADOPTION OF IFRS (continued): |
NOTES TO RECONCILIATIONS FROM CANADIAN GAAP TO IFRS (continued):
| 6) | Components of property, plant and equipment (continued) |
| | | October 2, 2011 | | | October 4, 2010 | |
| | | | | | | |
| Decrease in property, plant and equipment | $ | (3,447 | ) | $ | (2,354 | ) |
| Decrease in deferred income tax liabilities | | (373 | ) | | (315 | ) |
| Decrease in equity | | (3,074 | ) | | (2,039 | ) |
Impact on consolidated statement of earnings and comprehensive income for the year ended October 2, 2011:The impact of the lower useful lives of the components of certain buildings resulted in an increase in depreciation expense resulting in an increase in cost of sales and of SG&A expenses.
| | | Twelve months ended | |
| | | October 2, 2011 | |
| | | | |
| Increase in cost of sales | $ | 860 | |
| Increase in SG&A | | 233 | |
| Income taxes | | (58 | ) |
| Decrease in comprehensive income | | (1,035 | ) |
| 7) | Income taxes - Deferred income tax assets in a business combination recognized subsequent to themeasurement period |
Under Canadian GAAP, additional deferred income tax assets of an acquired company that were not initially recognized within the measurement period, but were recognized subsequent to the measurement period were recognized first as a reduction of goodwill, then as a reduction of intangible assets before any adjustment was recognized in net earnings. Under IFRS, additional deferred tax assets of an acquired company that are recognized after the measurement period do not result in a reduction of intangible assets, and are instead recognized in net earnings. Under Canadian GAAP, the Company had recorded the recognition of a deferred income tax asset subsequent to the measurement period, in connection with a business combination which occurred prior to the IFRS transition date, as a reduction of intangible assets.
Impact on consolidated statements of financial position as at October 2, 2011 and October 4, 2010:This difference has resulted in an increase to intangible assets, to reverse the reduction of intangible assets described above.
| | | October 2, 2011 | | | October 4, 2010 | |
| | | | | | | |
| Increase in intangible assets | $ | 5,186 | | $ | 5,490 | |
| Increase in deferred income tax liabilities | | 1,868 | | | 1,976 | |
| Increase in equity | | 3,318 | | | 3,514 | |
GILDAN 2012 REPORT TO SHAREHOLDERS P.104
| | NOTES TO CONSOLIDATED FINANCIAL STATEMENTS |
| 29.FIRST TIME ADOPTION OF IFRS (continued): |
NOTES TO RECONCILIATIONS FROM CANADIAN GAAP TO IFRS (continued):
| 7) | Income taxes - Deferred income tax assets in a business combination recognized subsequent to themeasurement period (continued) |
Impact on consolidated statement of earnings and comprehensive income for the year ended October 2, 2011:The increase in intangible assets has resulted in an increase in amortization expense, which is reported in SG&A.
| | | Twelve months ended | |
| | | October 2, 2011 | |
| | | | |
| Increase in SG&A | $ | 304 | |
| Income taxes | | (108 | ) |
| Decrease in comprehensive income | | (196 | ) |
| 8) | Income taxes - Assets transferred between entities within the consolidated group |
Under Canadian GAAP, deferred income tax assets and liabilities were not recognized for temporary differences arising from assets transferred between entities within the consolidated group, although any income tax expense/recovery incurred by the selling entity was recorded on the statement of financial position as a non-tax asset/liability. Under IFRS, the tax expense/recovery incurred by the selling entity is not deferred, but a deferred income tax asset/liability is recorded for the temporary difference resulting from the internal transfer (essentially the change in the tax basis), measured at the buying entity’s tax rate.
Impact on consolidated statements of financial position as at October 2, 2011 and October 4, 2010:This difference has resulted in the reversal of a non-tax asset which was included in other assets, and the recognition of deferred income tax assets, which have been offset against deferred income tax liabilities. The adjustment to decrease deferred income tax liabilities reflects the tax effect of temporary differences for certain inventories which have been transferred between entities within the consolidated group, using the buying entity’s tax rate.
| | | October 2, 2011 | | | October 4, 2010 | |
| | | | | | | |
| Decrease in other assets | $ | (1,029 | ) | $ | (1,029 | ) |
| Decrease in deferred income tax liabilities | | (2,097 | ) | | (1,366 | ) |
| Increase in equity | | 1,068 | | | 337 | |
Impact on consolidated statement of earnings and comprehensive income for the year ended October 2, 2011:This difference has resulted in a decrease in income taxes with a corresponding increase in net earnings and comprehensive income.
| | | Twelve months ended | |
| | | October 2, 2011 | |
| | | | |
| Income taxes | $ | (731 | ) |
| Increase in comprehensive income | | 731 | |
GILDAN 2012 REPORT TO SHAREHOLDERS P.105
| | NOTES TO CONSOLIDATED FINANCIAL STATEMENTS |
| 29.FIRST TIME ADOPTION OF IFRS (continued): |
NOTES TO RECONCILIATIONS FROM CANADIAN GAAP TO IFRS (continued):
| 9) | Business combinations - Contingent consideration |
Under Canadian GAAP, contingent consideration was recognized at the date of acquisition of a business when the amount could have been reasonably estimated and the outcome was determinable beyond reasonable doubt. Otherwise, contingent consideration was recognized when resolved as an additional cost of the purchase (which usually resulted in such costs being added to goodwill). Under IFRS, contingent consideration is recognized at the date of acquisition at fair value, generally as a liability, and the impact of changes in the subsequent re-measurement of contingent consideration is generally recorded in net earnings.
Impact on consolidated statements of financial position as at October 2, 2011 and October 4, 2010:At October 4, 2010, an adjustment has been recorded to recognize a liability of $5.8 million at the transition date with a corresponding decrease to retained earnings, with respect to contingent consideration which was part of a business combination that occurred prior to the IFRS transition date and which was recognized under Canadian GAAP after the transition date. This adjustment has been charged to retained earnings under IFRS rather than goodwill because IFRS does not permit transition date adjustments to be made to goodwill in this case. During the second quarter of fiscal 2011, the contingent consideration was resolved for an amount of $5.8 million which was recorded as an increase to goodwill under Canadian GAAP. As a result, no IFRS adjustment was required at October 2, 2011 to recognize a liability for the contingent consideration, however an adjustment was required to reduce goodwill by $5.8 million since IFRS does not permit adjustments to goodwill in this case.
| | | October 2, 2011 | | | October 4, 2010 | |
| | | | | | | |
| Decrease in goodwill | $ | (5,815 | ) | $ | - | |
| Increase in accounts payable and accrued liabilities | | - | | | 5,815 | |
| Decrease in equity | | (5,815 | ) | | (5,815 | ) |
The acquisition of Gold Toe Moretz in fiscal 2011 (see note 5 to the audited annual consolidated financial statements) included a contingent consideration of approximately $5.3 million. The contingent consideration was not recognized under Canadian GAAP, but must be recognized under IFRS, resulting in an adjustment to increase accounts payable and accrued liabilities to recognize the estimated fair value of the contingent consideration at the date of acquisition, with a corresponding increase to goodwill of approximately $3.3 million, net of deferred income taxes. The contingent consideration was subsequently re-measured at October 2, 2011 as described below which resulted in a decrease of the contingent consideration payable from $5.3 million to $3.9 million.
| | | October 2, 2011 | | | October 4, 2010 | |
| | | | | | | |
| Increase in goodwill | $ | 3,345 | | $ | - | |
| Increase in accounts payable and accrued liabilities | | 3,850 | | | - | |
| Decrease in deferred income tax liabilities | | (1,425 | ) | | - | |
| Increase in equity | | 920 | | | - | |
GILDAN 2012 REPORT TO SHAREHOLDERS P.106
| | NOTES TO CONSOLIDATED FINANCIAL STATEMENTS |
| 29.FIRST TIME ADOPTION OF IFRS (continued): |
NOTES TO RECONCILIATIONS FROM CANADIAN GAAP TO IFRS (continued):
| 9) | Business combinations - Contingent consideration (continued) |
Impact on consolidated statement of earnings and comprehensive income for the year ended October 2, 2011:The re-measurement of the contingent consideration mentioned above relating to the Gold Toe Moretz acquisition resulted in a credit to net earnings during the fourth quarter of fiscal 2011, and was included in restructuring and acquisition-related costs.
| | | Twelve months ended | |
| | | October 2, 2011 | |
| | | | |
| Decrease in restructuring and acquisition-related costs | $ | (1,460 | ) |
| Income taxes | | 540 | |
| Increase in comprehensive income | | 920 | |
| 10) | Classification of statutory severance and other post-employment benefit obligations |
Impact on consolidated statements of financial position as at October 2, 2011 and October 4, 2010:An adjustment has been recorded to reclassify statutory severance and other post-employment benefit obligations of $13.8 million as at October 2, 2011 and $12.2 million as at October 4, 2010 from accounts payable and accrued liabilities to non-current employee benefit obligations.
Impact on consolidated statement of earnings and comprehensive income for the year ended October 2, 2011:There is no impact on net earnings and comprehensive income.
| 11) | Foreign exchange cumulative translation differences |
Impact on consolidated statements of financial position as at October 2, 2011 and October 4, 2010:The Company has elected to use an exemption which permits the balance of any cumulative translation adjustment (“CTA”) to be eliminated by an adjustment to opening retained earnings at the transition date. As a result, the Company eliminated its CTA balance of $26.2 million which was included in accumulated other comprehensive income through an adjustment to retained earnings as at October 2, 2011 and October 4, 2010.
Impact on consolidated statement of earnings and comprehensive income for the year ended October 2, 2011:There is no impact on net earnings and comprehensive income.
| 12) | Business combinations – Restructuring and acquisition-related costs |
Under IFRS, transaction costs and restructuring costs are generally charged to earnings as incurred. Under Canadian GAAP, transaction costs and certain anticipated post-acquisition restructuring and integration costs incurred in connection with the acquisition of Gold Toe Moretz in fiscal 2011 were included in the cost of the purchase (which resulted in such costs being added to goodwill, net of income taxes).
Impact on consolidated statement of financial position as at October 4, 2010:There is no impact on the consolidated statement of financial position as at October 4, 2010.
Impact on consolidated statement of financial position as at October 2, 2011 and consolidated statement of earnings and comprehensive income for the year ended October 2, 2011:An adjustment of $7.7 million was recorded as a charge to restructuring and acquisition-related costs in the third quarter of fiscal 2011 with a $5.8 million reduction to goodwill and a decrease in income taxes of $1.8 million, regarding acquisition-related costs incurred in connection with the acquisition of Gold Toe Moretz in the third quarter of fiscal 2011.
GILDAN 2012 REPORT TO SHAREHOLDERS P.107
| | NOTES TO CONSOLIDATED FINANCIAL STATEMENTS |
| 29. FIRST TIME ADOPTION OF IFRS (continued): |
NOTES TO RECONCILIATIONS FROM CANADIAN GAAP TO IFRS (continued):
| 12) | Business combinations – Restructuring and acquisition-related costs (continued) |
| | | October 2, 2011 | | | October 4, 2010 | |
| | | | | | | |
| Decrease in goodwill | $ | (5,839 | ) | $ | - | |
| Decrease in equity | | (5,839 | ) | | - | |
| | | Twelve months ended | |
| | | October 2, 2011 | |
| | | | |
| Increase in restructuring and acquisition-related costs | $ | 7,666 | |
| Income taxes | | (1,827 | ) |
| Decrease in comprehensive income | | (5,839 | ) |
| 13) | Business combinations – Employee benefits |
Under both Canadian GAAP and IFRS, the funded status of a defined benefit pension plan of an acquired company is fully recognized at the acquisition date. Under Canadian GAAP, the effects of any planned amendments, terminations or curtailments are included in the measurement of the funded status of the plan at the date of acquisition. However under IFRS, the effects of any planned, but not executed, amendments, terminations, or curtailments to defined benefit pension plans and other post-employment plans acquired are excluded from the measurement of the funded status of those plans at the date of acquisition. Such actions are recognized post business combination as a charge or credit to earnings, as the actions occur.
Impact on consolidated statement of financial position as at October 4, 2010:No impact on the consolidated statement of financial position as at October 4, 2010.
Impact on consolidated statement of financial position as at October 2, 2011 and consolidated statement of earnings and comprehensive income for the year ended October 2, 2011:As a result of the planned termination of the Gold Toe Moretz defined benefit pension plan, the initial measurement of the accrued pension benefit liability at the date of acquisition was higher under Canadian GAAP resulting in an IFRS adjustment to decrease accounts payable and accrued liabilities by $4.7 million, and a decrease to goodwill of $3 million, net of deferred income taxes. The subsequent impact on net earnings related to differences between Canadian GAAP and IFRS in the measurement of the accrued benefit liability at October 2, 2011 resulted in an additional pension expense of $3.5 million under IFRS, which was included in restructuring and acquisition-related costs, since the charge was due to the partial settlement of the defined benefit pension plan, bringing the net adjustment to employee benefit obligations to $1.2 million at October 2, 2011.
| | | October 2, 2011 | | | October 4, 2010 | |
| | | | | | | |
| Decrease in goodwill | $ | (2,977 | ) | $ | - | |
| Decrease in employee benefit obligations | | (1,220 | ) | | - | |
| Increase in deferred income tax liabilities | | 452 | | | - | |
| Decrease in equity | | (2,209 | ) | | - | |
GILDAN 2012 REPORT TO SHAREHOLDERS P.108
| | NOTES TO CONSOLIDATED FINANCIAL STATEMENTS |
| 29.FIRST TIME ADOPTION OF IFRS (continued): |
NOTES TO RECONCILIATIONS FROM CANADIAN GAAP TO IFRS (continued):
| 13) | Business combinations – Employee benefits (continued) |
| | | Twelve months ended | |
| | | October 2, 2011 | |
| | | | |
| Increase in restructuring and acquisition-related costs | $ | 3,506 | |
| Income taxes | | (1,297 | ) |
| Decrease in comprehensive income | | (2,209 | ) |
| 14) | Employee benefits – Actuarial gains/losses related to defined benefit plans |
Under IFRS, companies are permitted an accounting policy choice of either (i) recognizing the full funded status of defined benefit plans and recording the entire amount of actuarial gains or losses in earnings immediately; (ii) recognizing a partial amount of the funded status and recording the actuarial gains or losses in earnings using the “corridor method” for the portion of actuarial gains or losses exceeding a certain minimum threshold; or (iii) recognizing the entire amount of actuarial gains or losses to other comprehensive income with no systematic periodic amortization to earnings. The Company’s accounting policy choice under Canadian GAAP for the Gold Toe Moretz defined benefit plan was to use the “corridor method” and recognize only the portion of actuarial gains or losses that exceeded a certain threshold, of which the excess amounted to nil in fiscal 2011. Canadian GAAP also permitted companies to apply different accounting policy choices when more than one defined benefit plan existed. Under IFRS, companies must apply the same accounting policy for all types of defined benefit plans. The Company has adopted an accounting policy for its defined benefit plans under IFRS to recognize the entire amount of actuarial gains or losses in other comprehensive income with no systematic periodic amortization to earnings.
Impact on consolidated statement of financial position as at October 4, 2010:There is no impact on the consolidated statement of financial position as at October 4, 2010.
Impact on consolidated statement of financial position as at October 2, 2011 and consolidated statement of earnings and comprehensive income for the year ended October 2, 2011:An adjustment of $4.0 million was recorded in order to reclassify the pension liability previously recorded in accounts payable and accrued liabilities under Canadian GAAP to non-current employee benefit obligations under IFRS. An adjustment was also recorded to increase the pension liability by $3.7 million as at October 2, 2011 under IFRS (resulting in a total increase to employee benefit obligations of $7.6 million), with a corresponding charge of $2.3 million, net of deferred income taxes, to other comprehensive income to reflect the funded status of the defined benefit pension plan.
| | | October 2, 2011 | | | October 4, 2010 | |
| | | | | | | |
| Decrease in accounts payable and accrued liabilities | $ | (3,973 | ) | $ | - | |
| Increase in employee benefit obligations | | 7,639 | | | - | |
| Decrease in deferred income tax liabilities | | (1,357 | ) | | - | |
| Decrease in equity | | (2,309 | ) | | - | |
| | | Twelve months ended | |
| | | October 2, 2011 | |
| | | | |
| Decrease in other comprehensive income | $ | (2,309 | ) |
| Decrease in comprehensive income | | (2,309 | ) |
GILDAN 2012 REPORT TO SHAREHOLDERS P.109
| | NOTES TO CONSOLIDATED FINANCIAL STATEMENTS |
| 29.FIRST TIME ADOPTION OF IFRS (continued): |
NOTES TO RECONCILIATIONS FROM CANADIAN GAAP TO IFRS (continued):
| 15) | Employee Benefits – Statutory severance liability |
The Company maintains a liability for statutory severance and pre-notice benefit obligations for active employees located in the Caribbean Basin and Central America which is payable to the employees in a lump sum payment upon termination of employment. The liability meets the definition of a defined benefit plan under both Canadian GAAP and IFRS. As described in note 14) above, under Canadian GAAP, companies were permitted to apply different accounting policy choices when more than one defined benefit plan existed. As such, the Company’s accounting policy under Canadian GAAP for the statutory severance liability was to recognize the entire amount of actuarial gains or losses in earnings which amounted to an actuarial loss of approximately $1.6 million based on an actuarial valuation that was performed in the fourth quarter of fiscal 2011. As mentioned in note 14) above, the Company has adopted an accounting policy for its defined benefit plans under IFRS to recognize the entire amount of actuarial gains or losses to other comprehensive income with no systematic periodic amortization to earnings. As such, a reclassification adjustment was required in the fourth quarter of fiscal 2011 resulting in a decrease to cost of sales and a decrease to other comprehensive income of $1.6 million.
Impact on consolidated statements of financial position as at October 2, 2011 and October 4, 2010:There is no impact on the consolidated statements of financial position as at October 2, 2011 and October 4, 2010.
Impact on consolidated statement of earnings and comprehensive income for the year ended October 2, 2011:
| | | Twelve months ended | |
| | | October 2, 2011 | |
| | | | |
| Decrease in cost of sales | $ | (1,643 | ) |
| Decrease in other comprehensive income | | (1,643 | ) |
| 16) | Statement of cash flows |
The transition from Canadian GAAP to IFRS has not had a significant impact on the consolidated statement of cash flows for the fiscal year ended October 2, 2011, except for the following:
| | | Canadian | | | | | | | |
| | | GAAP | | | Adjustments | | | IFRS | |
| | | | | | | | | |
Cash flows from operating activities | $ | 181,550 | | $ | (17,911 | ) | $ | 163,639 | |
Cash flows from financing activities | | 172,832 | | | (17,233 | ) | | 155,599 | |
Cash flows used in investing activities | | (523,937 | ) | | 35,966 | | | (487,971 | ) |
Effect of exchange rate changes on cash and cash equivalents denominated in foreign currencies | | (85 | ) | | - | | | (85 | ) |
Net decrease in cash and cash equivalents during the period | | (169,640 | ) | | 822 | | | (168,818 | ) |
Cash and cash equivalents, beginning of period | | 258,442 | | | (7,599 | ) | | 250,843 | |
Cash and cash equivalents, end of period | $ | 88,802 | | $ | (6,777 | ) | $ | 82,025 | |
The decrease in cash flows from operating activities for the year ended October 2, 2011 from Canadian GAAP to IFRS of $17.9 million is due primarily to: (i) the impact of the decrease in net earnings resulting from the expensing of acquisition-related costs incurred in connection with the acquisition of Gold Toe Moretz of $7.7 million as described in note 12) to the reconciliations from Canadian GAAP to IFRS; (ii) the impact of the decrease in accounts payable and accrued liabilities as a result of the contingent consideration of $5.8 million which was recorded at the transition date under IFRS in connection with a business combination which occurred prior to the transition date and was paid during fiscal 2011 as described in note 9) to the reconciliations from Canadian GAAP to IFRS; and (iii) the impact of the change of accounting for the Company’s investment in CanAm as described in note 1) to the reconciliations from Canadian GAAP to IFRS which resulted in a decrease in cash flows from operating activities of $4.0 million.
GILDAN 2012 REPORT TO SHAREHOLDERS P.110
| | NOTES TO CONSOLIDATED FINANCIAL STATEMENTS |
| 29.FIRST TIME ADOPTION OF IFRS (continued): |
NOTES TO RECONCILIATIONS FROM CANADIAN GAAP TO IFRS (continued):
| 16) | Statement of cash flows (continued) |
The decrease in cash flows from financing activities for the year ended October 2, 2011 from Canadian GAAP to IFRS of $17.2 million is primarily due to the impact of the repayment of the finance lease obligation in the amount of $17.0 million as a result of the disposal of the corporate aircraft which was reclassified as a finance lease under IFRS as described in note 2) to the reconciliations from Canadian GAAP to IFRS.
The decrease in cash flows used in investing activities for the year ended October 2, 2011 from Canadian GAAP to IFRS of $36 million is primarily due to: (i) the impact of the reclassification of the corporate aircraft lease as a finance lease in which the repayment of the finance lease obligation of $17 million described above, was previously offset against the proceeds of disposal in investing activities; (ii) the impact of the acquisition-related costs incurred in connection with the acquisition of Gold Toe Moretz in the amount of $7.7 million described above which was previously included as a cash outflow in investing activities under Canadian GAAP; (iii) the impact of the contingent consideration of $5.8 million described above which was settled in fiscal 2011 and was not considered as part of investing activities under IFRS; and (iv) the impact of the change of accounting for the Company’s investment in CanAm from Canadian GAAP to IFRS which resulted in an increase in cash flows from investing activities of $4.8 million.
GILDAN 2012 REPORT TO SHAREHOLDERS P.111