Exhibit 13.1
Annual Report to Stockholders
| Pulaski Financial Corp. |
| |
| 2011 Annual Report |
BUSINESS OF THE COMPANY
Pulaski Financial Corp. (the “Company”) is a diversified, community-based, financial institution holding company headquartered in St. Louis, Missouri. We conduct operations primarily through Pulaski Bank, a federally chartered savings bank (“Pulaski” or the “Bank”). Pulaski Bank provides an array of financial products and services for businesses and consumers primarily through its thirteen full-service offices in the St. Louis metropolitan area and six loan production offices in the St. Louis and Kansas City metropolitan areas and Wichita, Kansas.
We have grown our assets and deposits internally by building our residential and commercial lending operations, opening de novo branches, and hiring experienced bankers with existing customer relationships in our market. Our goal is to continue to deliver value to our shareholders and to enhance our franchise value and earnings through controlled growth in our banking operations, while maintaining the personal, community-oriented customer service that has characterized our success to date.
1
SELECTED CONSOLIDATED FINANCIAL INFORMATION
| | At or for the Years Ended September 30, | |
| | 2011 | | 2010 | | 2009 | | 2008 | | 2007 | |
| | (In thousands, except per share amounts) | |
FINANCIAL CONDITION DATA | | | | | | | | | | | |
Total assets | | $ | 1,309,209 | | $ | 1,452,817 | | $ | 1,406,426 | | $ | 1,304,150 | | $ | 1,131,465 | |
Loans receivable, net | | 1,021,273 | | 1,046,273 | | 1,132,095 | | 1,088,737 | | 949,826 | |
Mortgage loans held for sale | | 100,719 | | 253,578 | | 109,130 | | 71,966 | | 58,536 | |
Debt and equity securities | | 14,457 | | 8,001 | | 1,997 | | 144 | | 16,399 | |
Capital stock of Federal Home Loan Bank | | 3,100 | | 9,774 | | 11,650 | | 10,896 | | 8,306 | |
Mortgage-backed securities | | 9,986 | | 19,142 | | 28,165 | | 25,925 | | 3,027 | |
Cash and cash equivalents | | 57,071 | | 15,603 | | 37,451 | | 29,078 | | 23,774 | |
Deposits | | 1,122,525 | | 1,115,203 | | 1,191,629 | | 915,311 | | 835,489 | |
Advances from the Federal Home Loan Bank | | 29,000 | | 181,000 | | 61,000 | | 210,600 | | 158,400 | |
Borrowings from the Federal Reserve | | — | | — | | — | | 40,000 | | — | |
Subordinated debentures | | 19,589 | | 19,589 | | 19,589 | | 19,589 | | 19,589 | |
Stockholders’ equity — preferred | | 31,527 | | 31,088 | | 30,655 | | — | | — | |
Stockholders’ equity — common | | 88,643 | | 85,265 | | 86,306 | | 82,361 | | 80,804 | |
| | | | | | | | | | | |
OPERATING DATA | | | | | | | | | | | |
Interest and dividend income | | $ | 60,253 | | $ | 65,104 | | $ | 67,823 | | $ | 73,266 | | $ | 70,925 | |
Interest expense | | 12,951 | | 18,392 | | 26,215 | | 37,653 | | 41,834 | |
Net interest income | | 47,302 | | 46,712 | | 41,608 | | 35,613 | | 29,091 | |
Provision for loan losses | | 14,800 | | 26,064 | | 23,031 | | 7,735 | | 3,855 | |
Net interest income after provision for loan losses | | 32,502 | | 20,648 | | 18,577 | | 27,878 | | 25,236 | |
Securities gains (losses) | | — | | — | | 303 | | (7,774 | ) | 273 | |
Other non-interest income | | 12,998 | | 14,840 | | 19,264 | | 12,785 | | 10,748 | |
Total non-interest expense | | 34,285 | | 31,936 | | 31,437 | | 29,316 | | 22,773 | |
Income before income taxes | | 11,215 | | 3,552 | | 6,707 | | 3,573 | | 13,484 | |
Income taxes | | 3,150 | | 259 | | 1,630 | | 684 | | 4,501 | |
Net income | | 8,065 | | 3,293 | | 5,077 | | 2,889 | | 8,983 | |
Preferred stock dividends declared and discount accretion | | 2,066 | | 2,060 | | 1,265 | | — | | — | |
Income available to common shares | | $ | 5,999 | | $ | 1,233 | | $ | 3,812 | | $ | 2,889 | | $ | 8,983 | |
| | | | | | | | | | | |
COMMON SHARE DATA | | | | | | | | | | | |
Basic earnings per common share | | $ | 0.57 | | $ | 0.12 | | $ | 0.37 | | $ | 0.29 | | $ | 0.92 | |
Diluted earnings per common share | | $ | 0.55 | | $ | 0.12 | | $ | 0.37 | | $ | 0.28 | | $ | 0.88 | |
Dividends declared per common share | | $ | 0.38 | | $ | 0.38 | | $ | 0.38 | | $ | 0.37 | | $ | 0.35 | |
Book value per common share | | $ | 8.07 | | $ | 7.87 | | $ | 8.31 | | $ | 8.06 | | $ | 8.13 | |
Weighted average common shares — basic | | 10,543 | | 10,381 | | 10,179 | | 9,914 | | 9,814 | |
Weighted average common shares — diluted | | 10,988 | | 10,627 | | 10,402 | | 10,239 | | 10,256 | |
Common shares outstanding at end of period | | 10,987 | | 10,838 | | 10,389 | | 10,216 | | 9,935 | |
2
| | At or for the Years Ended September 30, | |
| | 2011 | | 2010 | | 2009 | | 2008 | | 2007 | |
| | | | | | | | | | | |
KEY OPERATING RATIOS | | | | | | | | | | | |
Return on average assets | | 0.58 | % | 0.24 | % | 0.36 | % | 0.23 | % | 0.85 | % |
Return on average total equity | | 6.73 | | 2.80 | | 4.64 | | 3.34 | | 11.07 | |
Return on average common equity | | 6.77 | | 1.42 | | 4.36 | | 3.34 | | 11.07 | |
Interest rate spread | | 3.51 | | 3.34 | | 2.85 | | 2.81 | | 2.63 | |
Net interest margin | | 3.67 | | 3.54 | | 3.10 | | 3.08 | | 2.97 | |
Efficiency ratio | | 56.87 | | 52.12 | | 51.24 | | 61.19 | | 58.63 | |
Dividend payout ratio | | 69.09 | | 316.67 | | 102.70 | | 130.36 | | 39.20 | |
Non-interest expense to average assets | | 2.49 | | 2.30 | | 2.21 | | 2.40 | | 2.22 | |
Average interest-earning assets to average interest-bearing liabilities | | 115.75 | | 114.41 | | 112.77 | | 108.29 | | 107.79 | |
Average total equity to average total assets | | 8.69 | | 8.46 | | 7.74 | | 6.99 | | 7.71 | |
Allowance for loan losses to total loans receivable at end of period | | 2.46 | | 2.52 | | 1.79 | | 1.16 | | 1.09 | |
Allowance for loan losses to non-performing loans | | 48.17 | | 45.29 | | 34.68 | | 61.76 | | 99.44 | |
Net charge-offs to average outstanding loans receivable during the period | | 1.51 | | 1.76 | | 1.31 | | 0.52 | | 0.14 | |
Non-performing assets to total assets | | 5.51 | | 5.13 | | 4.82 | | 1.87 | | 1.20 | |
| | | | | | | | | | | |
OTHER DATA | | | | | | | | | | | |
Number of: | | | | | | | | | | | |
Full-time equivalent employees | | 410 | | 457 | | 465 | | 427 | | 421 | |
Full-service offices | | 13 | | 12 | | 12 | | 12 | | 11 | |
Residential mortgage loan production offices | | 6 | | 6 | | 5 | | 3 | | 3 | |
| | | | | | | | | | | |
REGULATORY CAPITAL RATIOS (1) | | | | | | | | | | | |
Tangible capital | | 10.18 | % | 9.02 | % | 9.19 | % | 7.93 | % | 8.79 | % |
Core capital | | 10.18 | | 9.02 | | 9.19 | | 7.93 | | 8.79 | |
Total risk-based capital | | 13.59 | | 12.39 | | 12.33 | | 10.59 | | 11.18 | |
(1) Capital ratios are for Pulaski Bank.
3
MANAGEMENT’S DISCUSSION AND ANALYSIS OF
FINANCIAL CONDITION AND RESULTS OF OPERATIONS
GENERAL
Management’s discussion and analysis of financial condition and results of operations is intended to assist in understanding our financial condition and results of operations. The information contained in this section should be read in conjunction with the consolidated financial statements and accompanying notes contained elsewhere in this annual report.
This report may contain certain “forward-looking statements” within the meaning of the federal securities laws, which are made in good faith pursuant to the “safe harbor” provisions of the Private Securities Litigation Reform Act of 1995. These statements are not historical facts; rather, they are statements based on management’s current expectations regarding our business strategies, intended results and future performance. Forward-looking statements are generally preceded by terms such as “expects,” “believes,” “anticipates,” “intends” and similar expressions.
Management’s ability to predict results or the effect of future plans or strategies is inherently uncertain. Factors that could affect actual results include market interest rates and interest rate trends, the general economic climate in the market area in which we operate, as well as nationwide, our ability to control costs and expenses, products and pricing offered by competitors, loan delinquency rates, demand for loans and deposits, changes in the quality or composition of our loan portfolio, changes in accounting principles and changes in federal and state legislation and regulation. Additional factors that may affect our results are discussed in the section titled “Risk Factors” in our annual report on Form 10-K and in other reports filed with the Securities and Exchange Commission. These factors should be considered in evaluating the forward-looking statements and undue reliance should not be placed on such statements. We assume no obligation to update any forward-looking statements.
PULASKI’S COMMUNITY BANKING STRATEGY
Pulaski Bank is one of the top residential lenders in its market areas, with $1.51 billion of new residential mortgage loans originated during the year ended September 30, 2011. In addition, we originated $424.6 million of commercial loans during the year. Despite a challenging economic environment, we were able to leverage these customer relationships, which helped us maintain a stable deposit base. Our community banking strategy is centered on building long-term relationships with small- to medium-sized businesses and retail customers and emphasizes high-quality, responsive and personalized customer service. Pulaski has a 89-year history of serving many St. Louis neighborhoods and has positioned itself to be a “True Community Bank” to metropolitan St. Louis. Our strategy has enabled us to capture a 1.62% share of the $71 billion St. Louis deposit market at June 30, 2011, as reported by the Federal Deposit Insurance Corporation. Pulaski Bank maintains the twelfth largest deposit market share in the St. Louis metropolitan area.
We believe there is a significant opportunity for a locally managed, community-focused bank to provide a full range of financial services to retail customers and small- and middle-market businesses. A large amount of local deposits have been acquired by regional and national banks during the past decade, which has created larger banks that are perceived by many customers as impersonal or unresponsive. By offering quicker decision making in the delivery of banking products and services, offering customized products where needed, and providing our customers access to our senior decision makers, we distinguish ourselves from the larger regional and national banks operating in our market areas. Conversely, our larger capital base and product mix enable us to compete effectively against smaller banks with limited services and capabilities.
4
PRIMARY BUSINESS LINES
Crucial to our community banking strategy is growth in the Company’s three primary business lines: commercial banking services, retail mortgage lending and retail banking services. We believe the marketplace is more competitive than ever and, to achieve successful results, these products must be delivered with superior and efficient customer service.
Commercial Banking Services. Our commercial banking services are centered on serving small- to medium-sized businesses and the Company’s operation in the St. Louis market continues to be driven by its staff of experienced commercial bankers and the commercial banking relationships they generate. Our commercial loan portfolio includes permanent mortgage loans secured by owner and non-owner occupied commercial and multi-family residential real estate, commercial and industrial loans, and to a much lesser extent, commercial and multi-family construction loans and land acquisition and development loans.
Commercial loan originations totaled $424.6 million during the year ended September 30, 2011 compared with $330.0 million in fiscal 2010. Although the Company, along with the entire banking industry, continued to be negatively impacted by the distressed economic climate, we continued to originate commercial loans to our most credit-worthy customers under tightened credit standards. The commercial loan portfolio increased $9.7 million, or 1.71%, during the year to $570.9 million at September 30, 2011. Commercial and industrial loans increased $25.2 million to $180.8 million at September 30, 2011 and commercial real estate loans increased $21.4 million to $277.6 million. Partially offsetting this activity, commercial and multi-family construction and development loans decreased $9.0 million to $13.9 million at September 30, 2011 and land acquisition and development loans decreased $23.0 million to $51.5 million, as we continued to decrease our exposure to construction and development lending because of the weakened national and local economic conditions.
Our commercial loan customers are also among the best sources of core deposit accounts. Commercial checking and money market demand accounts totaled $210.8 million, or 18.78% of total deposits, at September 30, 2011 compared to $211.7 million, or 18.98% of total deposits, at September 30, 2010.
Retail Mortgage Lending. The Company originates conforming, residential mortgage loans directly through commission-based sales staffs in the St. Louis and Kansas City metropolitan areas and Wichita, Kansas. We are a leading mortgage originator in the St. Louis and Kansas City markets, and have successfully leveraged our reputation for strength and quality customer service with our staff of experienced mortgage loan officers who have strong community relationships. Substantially all of the loans originated in the retail mortgage division are one- to four-family residential loans secured by properties in our market areas that are sold to investors on a servicing-released basis. Such sales generate mortgage revenues, which is the Company’s largest source of non-interest income. In addition, loans that are closed and are held pending their sale to investors provide a valuable source of interest income until they are sold.
Residential mortgage loans originated for sale to investors totaled $1.43 billion during the year ended September 30, 2011 compared with $1.81 billion in fiscal 2010. The low level of market interest rates that existed during most of 2010 created an increased demand for loans to refinance existing mortgages. This demand continued into the first quarter of fiscal 2011 and resulted in near record volumes of loan origination activity during the quarter until market interest rates began to rise late in December 2010. We again saw an increased demand for loan refinancings during the last part of the September 2011 quarter as market interest rates fell to historically low levels. Mortgage loan refinancing activity represented approximately 57% of total loans originated for sale during the year ended September 30, 2011 compared with 50% during fiscal 2010. In addition, although the market demand for loans to finance the sale of homes remained soft during 2011 as the result of the distressed economic climate and low level of home sale activity, we were able to capture a large part of such purchase activity by capitalizing on our strong reputation within our markets and
5
our solid relationships with local realtors. The following is a quarterly summary of residential loans originated for sale by purpose for the years ended September 30, 2011 and 2010.
| | 2011 | | 2010 | |
| | Mortgage | | Home | | | | Mortgage | | Home | | | |
| | Refinancings | | Sales | | Total | | Refinancings | | Sales | | Total | |
First quarter | | $ | 433,895 | | $ | 195,559 | | $ | 629,454 | | $ | 218,199 | | $ | 237,584 | | $ | 455,783 | |
Second quarter | | 120,893 | | 87,705 | | 208,598 | | 150,563 | | 175,471 | | 326,034 | |
Third quarter | | 70,102 | | 186,055 | | 256,157 | | 139,450 | | 307,218 | | 446,668 | |
Fourth quarter | | 177,379 | | 161,337 | | 338,716 | | 434,395 | | 146,609 | | 581,004 | |
Total | | $ | 802,269 | | $ | 630,656 | | $ | 1,432,925 | | $ | 942,607 | | $ | 866,882 | | $ | 1,809,489 | |
We sold $1.59 billion of residential loans to investors during the year ended September 30, 2011, which generated mortgage revenues totaling $5.7 million, compared to $1.67 billion of loans sold and $7.8 million of revenues for the year ended September 30, 2010. The net profit margins on loans sold decreased to 0.36% during 2011 compared with 0.47% during fiscal 2010. We realized lower profit margins on loans sold during the first half of fiscal 2011 primarily as the result of operational processing challenges we experienced related to the high mortgage loan refinancing volumes in the December 2010 quarter and tightening investor documentation and underwriting requirements. Such challenges resulted in extended processing times and our inability to deliver a number of loans held for sale at December 31, 2010 to investors within the original interest rate lock commitment periods. As a result, we ultimately delivered these loans to investors during the March 2011 quarter at significantly reduced gross profit margins as such loans were repriced at reduced market values. We resolved these operational challenges during the March 2011 quarter, resulting in improved gross profit margins in the last half of the 2011 fiscal year. The net profit margin on loans sold during the quarter ended September 30, 2011 increased to 0.59%. We expect these improved efficiencies to continue into fiscal year 2012, resulting in increased net profit margins over those realized during the year ended September 30, 2011.
Also reducing mortgage revenues were charges to earnings totaling $1.7 million and $655,000 during the years ended September 30, 2011 and 2010, respectively, for estimated liabilities due to the Company’s loan investors under contractual obligations related to loans that were previously sold and became delinquent or defaulted. Refer to Note 12 of Notes to Consolidated Financial Statements for a discussion of the Company’s treatment of the estimated liability.
We do not sell loans directly to government-sponsored enterprises, but rather to large national seller servicers on a servicing-released basis. Reflecting industry-wide trends, we experienced an increase in repurchase requests from our investors during the year ended September 30, 2011. In response, we strengthened our review and appeal procedures to respond to such requests. The Company’s loans originated for sale are primarily made to our customers within our market areas of metropolitan St. Louis and Kansas City, and Wichita, Kansas and are locally underwritten according to government agency and investor standards. In addition, all loans sold to our investors are subject to stringent quality control reviews by such investors before the purchases are funded. As a result, we have been successful in defending and resolving a large number of recent repurchase requests.
Another important source of revenue generated by our mortgage banking operation is interest income on mortgage loans that are held for sale pending delivery to the Company’s loan investors. Because such loans are generally held for short periods of time pending delivery to such investors, we are able to fund them with short-term, low cost-funding sources, which generally results in interest-rate spreads higher than other interest-earning assets held by the Company. Interest income on loans held for sale decreased 11.4% to $5.5 million for the year ended September 30, 2011 compared with $6.3 million last year. The decrease was due to a $4.8 million decrease in the average balance resulting from the decreased loan origination activity combined with a 37 basis point decrease in the average yield resulting from lower market interest rates.
6
Loans sold during the year ended September 30, 2011 exceeded loans originated resulting in a $152.9 million, or 60.3%, decrease in mortgage loans held for sale to $100.7 million at September 30, 2011 from $253.6 million at September 30, 2010.
Although we primarily originate residential mortgage loans for sale to investors, we have historically retained a certain number of loans in portfolio, consisting of first mortgage, second mortgage and home equity lines of credit, which are revolving lines of credit secured by residential real estate. However, over the past several years, we have repeatedly tightened our underwriting standards in response to the prevailing economic conditions and have de-emphasized this type of lending. In addition, the low interest rate environment that has existed over the past several periods has significantly diminished the demand for variable-rate first mortgage loans, which have generally been our primary portfolio product in prior periods. As a result, the aggregate balance of residential first mortgage, residential second mortgage and home equity lines of credit decreased $35.9 million, or 7.1%, to $470.0 million at September 30, 2011 compared with $505.9 million at September 30, 2010.
Retail Banking Services. Core deposits, which include checking, money market and savings accounts, provide a stable funding source for the Bank’s asset growth and produce valuable fee income. Their growth continues to be one of our primary, long-term strategic objectives. Our approach to attracting deposits involves three key components: providing excellence in customer service, offering customers best-in-class products, and providing customers with convenient banking locations.
We offer our customers the ability to receive FDIC deposit insurance on their balances in excess of the standard amount of $250,000 per depositor in several ways. We participate in the Promontory Interfinancial Network (“Promontory”) Certificate of Deposit Account Registry Service (“CDARS”), which enables our customers to receive FDIC insurance on their account balances up to $10 million. We offer similar arrangements on money market deposit accounts through Promontory and a large international bank. These accounts are offered directly to the Bank’s customers in our St. Louis market. We also participate in the FDIC’s Transaction Account Guarantee Program which provides full FDIC insurance coverage through December 31, 2013 for non-interest-bearing transaction accounts and qualifying NOW accounts, regardless of the dollar amount.
Due to the overall shrinkage in loans receivable and loans held for sale during the year that created excess liquidity, management lowered the rates on certain non-relationship deposits in an effort to cost-effectively manage the level of excess liquidity by reducing the level of such deposits. As a result, core deposits decreased $16.1 million, or 2.2%, to $698.3 million at September 30, 2011 from $714.3 million at September 30, 2010, primarily as the result of a $14.1 million decrease in deposits from municipal and other public entities. The combined balances of checking and money market accounts held by municipal and other public entities decreased to $71.4 million at September 30, 2011 from $85.5 million at September 30, 2010. Core deposits held by retail and commercial customers remained relatively stable during the year. The combined balances of retail checking and money market accounts decreased $1.4 million to $369.6 million at September 30, 2011 from $371.0 million at September 30, 2010, while savings account balances increased $5.4 million to $35.7 million at September 30, 2011 from $30.3 million at September 30, 2010. The combined balances of commercial checking and money market accounts decreased $878,000 to $210.8 million at September 30, 2011 from $211.7 million at September 30, 2010. As the result of declining market interest rates during fiscal 2011 combined with actions taken by management to reduce the interest rates on certain types of deposits, the weighted-average cost of interest-bearing checking accounts and money market accounts decreased to 0.28% and 0.33%, respectively, at September 30, 2011, compared to 0.90% and 0.52%, respectively, at September 30, 2010.
Certificates of deposit increased $23.4 million to $424.2 million at September 30, 2011 from $400.9 million at September 30, 2010. The increase was the result of a $33.0 million increase in retail certificates of deposits
7
to $321.3 million at September 30, 2011, partially offset by an $8.2 million decrease in certificates of deposit held by commercial customers to $60.1 million and a $1.5 million decrease in certificates of deposit held by municipal and other public entities to $34.4 million at the same date. Total deposits increased $7.3 million, or 0.70%, to $1.12 billion at September 30, 2011.
Retail banking fees, which include fees charged to customers who have overdrawn their checking accounts and service charges on other retail banking products, increased 10% to $4.1 million for the year ended September 30, 2011 compared to $3.8 million for the year ended September 30, 2010. The increase in retail banking fees during the 2011 periods resulted primarily from a change in deposit fee structure.
CRITICAL ACCOUNTING POLICIES
We have established various accounting policies that govern the application of U.S. generally accepted accounting principles in the preparation of our consolidated financial statements. Our significant accounting policies are described in the footnotes to the consolidated financial statements that appear in this report. Certain accounting policies involve significant judgments and assumptions by management that have a material impact on the carrying value of certain assets and liabilities. We consider the accounting for the allowance for loan losses to be a critical accounting policy. The judgments and assumptions used by management are based on historical experience and other factors, which are believed to be reasonable under the circumstances. Because of the nature of the judgments and assumptions made by management, actual results could differ from these judgments and estimates that could have a material impact on the carrying values of assets and liabilities and our results of operations.
We maintain an allowance for loan losses to absorb probable losses in our loan portfolio. Determining the amount of the allowance involves a high degree of judgment. The balance in the allowance is based upon management’s quarterly estimates of expected losses inherent in the loan portfolio. Management’s estimates are determined by quantifying certain risks in the portfolio that are affected primarily by changes in the composition and size of the portfolio combined with an analysis of past due and adversely classified loans. These estimates can also be affected by the following factors: changes in lending policies and procedures, including underwriting standards and collections; charge-off and recovery practices; changes in national and local economic conditions and developments; assessment of collateral values by obtaining independent appraisals; and changes in the experience, ability, and depth of lending management staff. Refer to Note 1 of Notes to the Consolidated Financial Statements for a detailed description of our risk assessment process.
8
AVERAGE BALANCE SHEETS
The following table sets forth information regarding average balances of assets and liabilities as well as the total dollar amounts of interest income from average interest-earning assets and interest expense on average interest-bearing liabilities, resultant yields, interest rate spread, net interest margin, and ratio of average interest-earning assets to average interest-bearing liabilities for the periods indicated.
| | Years Ended September 30, | |
| | 2011 | | 2010 | | 2009 | |
| | | | Interest | | | | | | Interest | | | | | | Interest | | | |
| | Average | | and | | Yield/ | | Average | | and | | Yield/ | | Average | | and | | Yield/ | |
| | Balance | | Dividends | | Cost | | Balance | | Dividends | | Cost | | Balance | | Dividends | | Cost | |
| | (Dollars in thousands) | |
Interest-earning assets: | | | | | | | | | | | | | | | | | | | |
Loans receivable: (1) | | | | | | | | | | | | | | | | | | | |
Residential real estate | | $ | 274,948 | | $ | 15,817 | | 5.75 | % | $ | 296,516 | | $ | 17,977 | | 6.06 | % | $ | 328,108 | | $ | 20,952 | | 6.39 | % |
Commercial | | 595,021 | | 31,002 | | 5.21 | % | 601,234 | | 31,083 | | 5.17 | % | 598,179 | | 29,987 | | 5.01 | % |
Home equity lines of credit | | 188,154 | | 6,924 | | 3.68 | % | 216,004 | | 8,476 | | 3.92 | % | 230,237 | | 9,346 | | 4.06 | % |
Consumer | | 2,945 | | 94 | | 3.21 | % | 3,519 | | 154 | | 4.37 | % | 3,613 | | 196 | | 5.44 | % |
Total loans receivable | | 1,061,068 | | 53,837 | | 5.07 | % | 1,117,273 | | 57,690 | | 5.16 | % | 1,160,137 | | 60,481 | | 5.21 | % |
Mortgage loans held for sale | | 132,093 | | 5,549 | | 4.20 | % | 136,919 | | 6,259 | | 4.57 | % | 119,770 | | 5,768 | | 4.82 | % |
Securities and other | | 97,378 | | 867 | | 0.89 | % | 64,637 | | 1,155 | | 1.71 | % | 62,729 | | 1,574 | | 2.51 | % |
Total interest-earning assets | | 1,290,539 | | 60,253 | | 4.67 | % | 1,318,829 | | 65,104 | | 4.94 | % | 1,342,636 | | 67,823 | | 5.05 | % |
| | | | | | | | | | | | | | | | | | | |
Non-interest-earning assets | | 89,115 | | | | | | 73,592 | | | | | | 70,829 | | | | | |
Total assets | | $ | 1,379,654 | | | | | | $ | 1,392,421 | | | | | | $ | 1,413,465 | | | | | |
| | | | | | | | | | | | | | | | | | | |
Interest-bearing liabilities: | | | | | | | | | | | | | | | | | | | |
Interest-bearing checking | | $ | 354,684 | | $ | 2,564 | | 0.72 | % | $ | 330,815 | | $ | 3,667 | | 1.11 | % | $ | 221,164 | | $ | 3,504 | | 1.58 | % |
Savings | | 31,970 | | 57 | | 0.18 | % | 29,714 | | 59 | | 0.20 | % | 26,845 | | 57 | | 0.21 | % |
Money market | | 195,441 | | 1,343 | | 0.69 | % | 230,634 | | 2,334 | | 1.01 | % | 159,196 | | 1,676 | | 1.05 | % |
Certificates of deposit | | 431,810 | | 7,411 | | 1.72 | % | 444,925 | | 10,074 | | 2.26 | % | 569,530 | | 16,279 | | 2.86 | % |
Total interest-bearing deposits | | 1,013,905 | | 11,375 | | 1.12 | % | 1,036,088 | | 16,134 | | 1.56 | % | 976,735 | | 21,516 | | 2.20 | % |
FHLB advances | | 81,422 | | 1,071 | | 1.32 | % | 96,948 | | 1,743 | | 1.80 | % | 120,288 | | 3,507 | | 2.92 | % |
Borrowings from the Federal Reserve Bank | | — | | — | | — | | 82 | | — | | 0.59 | % | 71,690 | | 320 | | 0.45 | % |
Note payable | | — | | — | | — | | — | | — | | — | | 2,324 | | 113 | | 4.88 | % |
Subordinated debentures | | 19,589 | | 506 | | 2.58 | % | 19,589 | | 515 | | 2.63 | % | 19,589 | | 759 | | 3.88 | % |
Total interest-bearing liabilities | | 1,114,916 | | 12,952 | | 1.16 | % | 1,152,707 | | 18,392 | | 1.60 | % | 1,190,626 | | 26,215 | | 2.20 | % |
| | | | | | | | | | | | | | | | | | | |
Non-interest-bearing liabilities: | | | | | | | | | | | | | | | | | | | |
Non-interest-bearing deposits | | 130,499 | | | | | | 108,188 | | | | | | 99,127 | | | | | |
Other non-interest-bearing liabilities | | 14,380 | | | | | | 13,767 | | | | | | 14,286 | | | | | |
Total non-interest-bearing liabilities | | 144,879 | | | | | | 121,955 | | | | | | 113,413 | | | | | |
| | | | | | | | | | | | | | | | | | | |
Stockholders’ equity | | 119,859 | | | | | | 117,759 | | | | | | 109,426 | | | | | |
| | | | | | | | | | | | | | | | | | | |
Total liabilities and stockholders’ equity | | $ | 1,379,654 | | | | | | $ | 1,392,421 | | | | | | $ | 1,413,465 | | | | | |
| | | | | | | | | | | | | | | | | | | | | | |
Net interest income | | | | $ | 47,301 | | | | | | $ | 46,712 | | | | | | $ | 41,608 | | | |
| | | | | | | | | | | | | | | | | | | |
Interest rate spread (2) | | | | | | 3.51 | % | | | | | 3.34 | % | | | | | 2.85 | % |
| | | | | | | | | | | | | | | | | | | |
Net interest margin (3) | | | | | | 3.67 | % | | | | | 3.54 | % | | | | | 3.10 | % |
| | | | | | | | | | | | | | | | | | | |
Ratio of average interest-earning assets to average interest-bearing liabilities | | 115.75 | % | | | | | 114.41 | % | | | | | 112.77 | % | | | | |
(1) Include non-accrual loans with an average balance of $62.4 million, $53.7 million and $36.2 million for the fiscal years ended September 30, 2011, 2010 and 2009, respectively.
(2) Yield on interest-earning assets less cost of interest-bearing liabilities.
(3) Net interest income divided by average interest-earning assets.
9
RATE VOLUME ANALYSIS
The following table allocates the period-to-period changes in the Company’s various categories of interest income and expense between changes due to changes in volume (calculated by multiplying the change in average volumes of the related interest-earning asset or interest-bearing liability category by the prior year’s rate) and changes due to changes in rate (change in rate multiplied by the prior year’s volume). Changes due to changes in rate/volume (changes in rate multiplied by changes in volume) have been allocated proportionately between changes in volume and changes in rate.
| | 2011 Compared to 2010 | | 2010 Compared to 2009 | |
| | Increase (Decrease) Due to | | Increase (Decrease) Due to | |
| | Rate | | Volume | | Net | | Rate | | Volume | | Net | |
| | (In thousands) | |
Interest-earning assets: | | | | | | | | | | | | | |
Loans receivable: | | | | | | | | | | | | | |
Residential real estate | | $ | (892 | ) | $ | (1,268 | ) | $ | (2,160 | ) | $ | (1,038 | ) | $ | (1,937 | ) | $ | (2,975 | ) |
Commercial | | 240 | | (321 | ) | (81 | ) | 945 | | 151 | | 1,096 | |
Home equity lines of credit | | (499 | ) | (1,053 | ) | (1,552 | ) | (312 | ) | (558 | ) | (870 | ) |
Consumer | | (38 | ) | (22 | ) | (60 | ) | (37 | ) | (5 | ) | (42 | ) |
Total loans receivable | | (1,189 | ) | (2,664 | ) | (3,853 | ) | (442 | ) | (2,349 | ) | (2,791 | ) |
Mortgage loans held for sale | | (494 | ) | (216 | ) | (710 | ) | (309 | ) | 800 | | 491 | |
Securities and other | | 3 | | (291 | ) | (288 | ) | (164 | ) | (255 | ) | (419 | ) |
| | | | | | | | | | | | | |
Total net change in income on interest-earning assets | | (1,680 | ) | (3,171 | ) | (4,851 | ) | (915 | ) | (1,804 | ) | (2,719 | ) |
| | | | | | | | | | | | | |
Interest-bearing liabilities: | | | | | | | | | | | | | |
Interest-bearing checking | | (1,355 | ) | 252 | | (1,103 | ) | (1,238 | ) | 1,401 | | 163 | |
Savings | | (7 | ) | 5 | | (2 | ) | (4 | ) | 6 | | 2 | |
Money market | | (669 | ) | (322 | ) | (991 | ) | (209 | ) | 867 | | 658 | |
Certificates of deposit | | (2,371 | ) | (292 | ) | (2,663 | ) | (2,814 | ) | (3,391 | ) | (6,205 | ) |
Total interest-bearing deposits | | (4,402 | ) | (357 | ) | (4,759 | ) | (4,265 | ) | (1,117 | ) | (5,382 | ) |
FHLB advances | | (420 | ) | (252 | ) | (672 | ) | (1,171 | ) | (593 | ) | (1,764 | ) |
Borrowings from the Federal Reserve Bank | | — | | — | | — | | 76 | | (396 | ) | (320 | ) |
Note payable | | — | | — | | — | | (56 | ) | (57 | ) | (113 | ) |
Subordinated debentures | | (9 | ) | — | | (9 | ) | (244 | ) | — | | (244 | ) |
| | | | | | | | | | | | | |
Total net change in expense on interest-bearing liabilities | | (4,831 | ) | (609 | ) | (5,440 | ) | (5,660 | ) | (2,163 | ) | (7,823 | ) |
| | | | | | | | | | | | | |
Net change in net interest income | | $ | 3,151 | | $ | (2,562 | ) | $ | 589 | | $ | 4,745 | | $ | 359 | | $ | 5,104 | |
10
COMPARISON OF OPERATING RESULTS FOR THE
YEARS ENDED SEPTEMBER 30, 2011 AND 2010
OVERVIEW
Net income for the year ended September 30, 2011 increased 144.9% to $8.1 million, or $0.55 per diluted common share, compared to $3.3 million, or $0.12 per diluted common share, for the year ended September 30, 2010. Reducing income available to common shares were dividends and discount accretion on the Company’s preferred stock, issued as part of the U.S. Treasury’s Troubled Asset Relief Program (“TARP”) Capital Purchase Program, totaling $2.1 million, or $0.19 per diluted common share for each of the years ended September 30, 2011 and 2010.
NET INTEREST INCOME
Net interest income is the difference between interest and dividend income on interest-earning assets, such as loans and securities, and the interest expense on interest-bearing liabilities used to fund those assets, including deposits, advances from the Federal Home Loan Bank of Des Moines (“FHLB”), borrowings from the Federal Reserve Bank of St. Louis (“Federal Reserve”) and other borrowings. The amount of net interest income is affected by both changes in the level of interest rates and the amount and composition of interest-earning assets and interest-bearing liabilities.
Net interest income increased $590,000 to $47.3 million for the year ended September 30, 2011 compared to $46.7 million for the year ended September 30, 2010. The increase was primarily the result of expansion in the net interest margin, which increased to 3.67% in 2011 compared to 3.54% in 2010, partially offset by a decrease in average interest-earning assets. The net interest margin benefited from market-driven declines in the cost of deposits combined with actions taken by management to reduce the interest rates on certain types of deposits.
Total interest and dividend income decreased $4.9 million to $60.3 million for the year ended September 30, 2011 compared to $65.1 million for the year ended September 30, 2010 due to declines in the average balance and average yield of interest-earning assets. The average yield decreased from 4.94% for fiscal 2010 to 4.67% for fiscal 2011 and the average balance decreased from $1.32 billion to $1.29 billion during the same periods, respectively.
The decrease in the average balance was primarily due to a $56.2 million decline in the average balance of loans receivable to $1.06 billion for fiscal 2011, partially offset by a $37.0 million net increase in the average balance of other interest-earning assets, excluding securities and mortgage loans held for sale, to $63.7 million for fiscal 2011. The average balances of residential real estate loans, home equity lines of credit and commercial loans declined $21.6 million, $27.8 million and $6.2 million, respectively, due to soft market demand for the Company’s portfolio loan products. The decrease in the average yield was primarily due to the market driven declines in the average yields on loans receivable and loans held for sale. See Primary Business Lines.
Total interest expense decreased $5.4 million to $13.0 million for fiscal 2011 compared to $18.4 million for fiscal 2010 due primarily to a decline in the average cost of funds, and to a much lesser extent, a decline in the average balance of interest-bearing liabilities. The average cost of funds decreased from 1.60% for 2010 to 1.16% for 2011 and the average balance of interest-bearing liabilities decreased from $1.15 billion to $1.11 billion during the same periods, respectively.
The decreased average cost was primarily the result of lower market interest rates during the period. The lower average balance of interest-bearing liabilities resulted from decreases in the average balances of deposits and borrowings from the FHLB. The Company primarily funds its assets with savings deposits from its retail and commercial customers, which typically carry a lower cost than most of the Company’s wholesale funding sources. This funding source is supplemented with wholesale funds consisting primarily of advances from the FHLB, short-term borrowings from the Federal Reserve and time deposits from national brokers. Management actively
11
chooses among these wholesale funding sources depending on their relative costs and the Company’s overall borrowing capacity at the FHLB and the Federal Reserve. See Liquidity Risk.
Interest expense on deposits decreased $4.8 million, or 29.5%, to $11.4 million during the year ended September 30, 2011 compared to $16.1 million for the year ended September 30, 2010 primarily as the result of a market-driven decrease in the average cost to 1.12% from 1.56% during the same periods, repectively. The average balance of interest-bearing deposits decreased to $1.01 billion for the year ended September 30, 2011 from $1.04 billion for the year ended September 30, 2010. See Primary Business Lines.
Interest expense on advances from the Federal Home Loan Bank decreased $671,000, or 38.5%, to $1.1 million during the year ended September 30, 2011 compared to $1.7 million for the year ended September 30, 2010 as the result of decreases in the average cost and average balance. The average balance decreased to $81.4 million for the year ended September 30, 2011 from $96.9 million for the year ended September 30, 2010 and the average cost decreased from 1.80% to 1.32% during the same periods, respectively. The lower average balance resulted from the repayment of short-term advances with the decrease in total interest-earning assets. The decreased average cost was the result of lower market interest rates during the 2011 period.
PROVISION FOR LOAN LOSSES
The provision for loan losses for the year ended September 30, 2011 was $14.8 million compared to $26.1 million for the same period a year ago. See Non-Performing Assets and Allowance for Loan Losses.
NON-INTEREST INCOME
Total non-interest income decreased $1.8 million to $13.0 million for the year ended September 30, 2011 compared to $14.8 million for the year ended September 30, 2010 primarily as the result of a decrease in mortgage revenues partially offset by an increase in retail banking fees and investment brokerage revenues.
Mortgage revenues decreased 27.7% to $5.7 million during the year ended September 30, 2011 compared to $7.8 million during the year ended September 30, 2010 on decreased loan sales and lower net profit margins. See Primary Business Lines.
Retail banking fees increased 9.8% to $4.1 million in fiscal 2011 compared to $3.8 million for fiscal 2010 primarily as a result of a change in the deposit fee structure during fiscal 2011. See Primary Business Lines.
Investment brokerage revenues remained relatively constant at $1.9 million for the year September 30, 2011 compared to $1.8 million for the same period a year ago. The Company operates an investment brokerage division whose operations consist principally of brokering bonds from wholesale brokerage houses to bank, municipal and individual investors. Revenues are generated on trading spreads and fluctuate with changes in trading volumes and market interest rates.
NON-INTEREST EXPENSE
Total non-interest expense increased $2.3 million, or 7.4%, to $34.3 million for the year ended September 30, 2011 compared to $31.9 million for the year ended September 30, 2010. Significant fluctuations are discussed below.
Salaries and employee benefits expense increased $1.0 million, or 7.5%, to $15.0 million for the year ended September 30, 2011 from $14.0 million for the year ended September 30, 2010. The increase was primarily due to lower level of absorption of direct, fixed compensation costs, resulting from the decreased mortgage loan activity, that were deferred against mortgage loans originated. The impact of this activity was partially offset by reductions in the Company’s workforce during the last half of fiscal 2011 to reflect the lower activity levels.
Occupancy, equipment and data processing expense increased $701,000 to $9.0 million for the year ended September 30, 2011 from $8.3 million for the year ended September 30, 2010. The increase was largely related to
12
the additions of a full-service banking facility in the St. Louis metropolitan area and loan production offices in the Kansas City metropolitan area and Wichita, Kansas, and also to expenses related to the enhancement of certain capabilities of the Bank’s data processing systems.
FDIC deposit insurance premium expense increased $451,000 to $2.4 million for the year ended September 30, 2011 compared to $2.0 million for the year ended September 30, 2010. Effective April 1, 2011, the FDIC changed its method of assessing insurance premiums on all financial institutions from a deposit-based method to an asset-based method, resulting in a significant decrease in the Company’s assessment rate during the last half of fiscal 2011. The increase in expense was also the result of an increase in the deposit insurance rate during the first six months of fiscal 2011.
Other non-interest expense increased $259,000, or 16.4%, to $1.8 million for the year ended September 30, 2011 compared to $1.6 million for the year ended September 30, 2010. The increase was primarily due to $158,000 of expenses related to the relocation and home sales of certain Company executives during 2011 and a $119,000 increase in supervisory examination fees as a result of the increase in total assets.
INCOME TAXES
The provision for income taxes increased from $259,000 for the year ended September 30, 2010 to $3.1 million for the year ended September 30, 2011. The effective tax rate was 28.09% in fiscal 2011 compared with 7.30% in fiscal 2010. The effective tax rates differed from the Federal statutory rate of 34% primarily as the result of non-taxable income related to bank-owned life insurance and tax-exempt interest income on certain loans receivable. The lower effective rate in 2010 compared to 2011 was due to the lower total pre-tax income in 2010 resulting in a higher ratio of non-taxable income to such pre-tax income. See Note 14 of Notes to the Consolidated Financial Statements.
13
NON-PERFORMING ASSETS AND ALLOWANCE FOR LOAN LOSSES
Non-performing assets at September 30, 2011 and 2010 are summarized as follows:
| | September 30, | | September 30, | |
| | 2011 | | 2010 | |
| | (Dollars in thousands) | |
Non-accrual loans: (1) | | | | | |
Residential real estate: | | | | | |
First mortgage | | $ | 5,870,575 | | $ | 6,726,710 | |
Second mortgage | | 1,176,790 | | 1,522,066 | |
Home equity lines of credit | | 4,083,574 | | 2,205,504 | |
Commercial & multi-family real estate | | 2,374,682 | | 5,538,651 | |
Land acquisition & development | | 229,386 | | 8,796,057 | |
Real estate construction & development | | 853,961 | | 1,188,743 | |
Commercial & industrial | | 210,188 | | 417,171 | |
Consumer & other | | 240,466 | | 101,425 | |
Total non-accrual loans | | 15,039,622 | | 26,496,327 | |
Troubled debt restructurings: (2) | | | | | |
Current under restructured terms: | | | | | |
Residential real estate: | | | | | |
First mortgage | | 14,910,743 | | 16,093,071 | |
Second mortgage | | 1,861,045 | | 2,186,284 | |
Home equity lines of credit | | 1,248,272 | | 1,050,152 | |
Commercial & multi-family real estate | | 4,358,519 | | 183,528 | |
Land acquisition & development | | — | | 97,501 | |
Real estate construction & development | | 1,538,470 | | 3,305,869 | |
Commercial & industrial | | 560,212 | | 1,683,568 | |
Consumer & other | | — | | 82,631 | |
Total current troubled debt restructurings | | 24,477,261 | | 24,682,604 | |
Past due under restructured terms: | | | | | |
Residential real estate: | | | | | |
First mortgage | | 9,372,433 | | 7,251,091 | |
Second mortgage | | 452,293 | | 339,397 | |
Home equity lines of credit | | 998,978 | | 727,859 | |
Commercial & multi-family real estate | | 2,225,540 | | — | |
Land acquisition & development | | 120,724 | | 64,857 | |
Real estate construction & development | | 50,812 | | — | |
Commercial & industrial | | 416,661 | | — | |
Consumer & other | | 226,638 | | — | |
Total past due troubled debt restructurings | | 13,864,079 | | 8,383,204 | |
Total troubled debt restructurings | | 38,341,340 | | 33,065,808 | |
Total non-performing loans | | 53,380,962 | | 59,562,135 | |
Real estate acquired in settlement of loans: | | | | | |
Residential real estate | | 3,037,013 | | 3,632,598 | |
Commercial real estate | | 15,680,801 | | 11,267,714 | |
Total real estate acquired in settlement of loans | | 18,717,814 | | 14,900,312 | |
Total non-performing assets | | $ | 72,098,776 | | $ | 74,462,447 | |
| | | | | |
Ratio of non-performing loans to total loans receivable | | 5.11 | % | 5.56 | % |
Ratio of non-performing assets to total assets | | 5.51 | % | 5.13 | % |
Ratio of non-performing loans excluding current troubled debt restructurings as a percent of total loans | | 2.77 | % | 3.26 | % |
Ratio of non-performing assets excluding current troubled debt restructurings as a percent of total assets | | 3.64 | % | 3.43 | % |
Ratio of allowance for loan losses as a percent of total loans | | 2.46 | % | 2.52 | % |
Ratio of allowance for loan losses to non-performing loans | | 48.17 | % | 45.29 | % |
Ratio of allowance for loan losses as a percent of non-performing loans excluding current troubled debt restructurings and related allowance for loan losses | | 84.50 | % | 75.47 | % |
(1) Amounts do not include troubled debt restructurings that are on a non-accrual basis.
(2) Amounts include non-accrual loans totaling $38.3 million and $33.1 million at September 30, 2011 and 2010, respectively.
14
Non-performing assets decreased $2.4 million to $72.1 million at September 30, 2011 compared with $74.5 million at September 30, 2010 primarily as a result of an $11.5 million decrease in non-accrual loans partially offset by a $5.3 million increase in troubled debt restructurings and a $3.8 million increase in real estate acquired through foreclosure.
Loans are placed on non-accrual status when, in the opinion of management, the ultimate collectibility of interest or principal is no longer probable. Management considers many factors before placing a loan on non-accrual status, including the overall financial condition of the borrower, the progress of management’s collection efforts and the value of the underlying collateral. Refer to Note 5 of Notes to Consolidated Financial Statements for a discussion of the Company’s treatment of non-accrual interest. Excluding non-accrual troubled debt restructurings, non-accrual loans totaled $15.0 million at September 30, 2011 compared with $26.5 million at September 30, 2010. The decrease was primarily the result of a $12.3 million decrease in non-accruing commercial loans partially offset by a $677,000 increase in non-accruing residential loans.
Contributing to the decrease in non-accrual commercial loans during fiscal 2011 was the partial charge-off and foreclosure on properties securing several loans to one commercial borrower that were secured by a retail strip shopping center and adjoining land held for future development in a rural community in southern Missouri. The principal balances of the loans, which were included in non-accrual commercial and multi-family real estate loans and non-accrual land acquisition and development loans at September 30, 2010, totaled $3.1 million and $8.7 million, respectively. The Company recorded partial charge-offs totaling $4.2 million during the December 2010 and June 2011 quarters and subsequently foreclosed on the properties during July 2011, resulting in an increase in real estate acquired in settlement of loans of $7.5 million during the quarter ended September 30, 2011.
A loan is classified as a troubled debt restructuring if the Company, for economic or legal reasons related to the borrower’s financial difficulties, grants a concession to the borrower that it would not otherwise consider. Refer to Note 5 of Notes to Consolidated Financial Statements for a discussion of the Company’s treatment of troubled debt restructurings. Restructured residential loans totaled $28.8 million at September 30, 2011 compared with $27.6 million at September 30, 2010. Management continued its efforts to proactively modify loan repayment terms with residential borrowers who were experiencing financial difficulties in the current economic climate with the belief that these actions would maximize the Company’s ultimate recoveries on these loans. The restructured terms of the loans generally included a reduction of the interest rates and the addition of past-due interest to the principal balance of the loans. Many of these borrowers were current at the time of their modifications and showed strong intent and ability to repay their obligations under the modified terms. During the years ended September 30, 2011 and 2010, the Company restructured approximately $11 million and $15 million, respectively, of loans to troubled residential borrowers and returned approximately $11 million and $8 million, respectively, of previously restructured residential loans to performing status as the result of the borrowers’ favorable performance history since restructuring. At September 30, 2011, $28.8 million, or 75% of total restructured loans, related to residential borrowers compared to $27.6 million, or 84% of total restructured loans, at September 30, 2010. At September 30, 2011, 62% of these residential borrowers were performing as agreed under the modified terms of the loans compared with 70% at September 30, 2010. The decrease in the percentage of residential borrowers that were performing as agreed under the modified terms was primarily due to a $2.1 million increase in restructured residential first mortgage loans that were past due.
Restructured commercial loans totaled $9.3 million at September 30, 2011 compared to $5.3 million at September 30, 2010. During the years ended September 30, 2011 and 2010, the Company restructured approximately $9 million and $5 million, respectively, of loans to troubled commercial borrowers. The restructured terms of the loans generally included a reduction of the interest rates or renewal of maturing loans at interest rates that were determined to be less than risk-adjusted market interest rates on similar credits, temporary deferral of payment due dates, and the addition of past-due interest to the principal balance of the loans.
Real estate acquired in settlement of loans increased to $18.7 million at September 30, 2011 compared to $14.9 million at September 30, 2010. The increase was primarily the result of the foreclosure of several loans to one commercial borrower totaling $7.5 million discussed above, partially offset by the sale of several residential
15
and commercial real estate properties and the write downs to fair value less estimated selling costs of several properties. Real estate foreclosure losses and expense was $2.9 million for the year ended September 30, 2011 compared to $2.8 million for the year ended September 30, 2010. Real estate foreclosure losses and expense includes realized losses on the final disposition of foreclosed properties, additional write-downs for declines in the fair market values of properties subsequent to foreclosure, and expenses incurred in connection with maintaining the properties until they are sold. Expense during the 2011 period includes $2.1 million of additional write downs on properties due to declines in their estimated fair values since their acquisition compared to $2.2 million in the 2010 period. Refer to Note 20 of Notes to the Consolidated Financial Statements for a discussion of fair value measurements on real estate acquired in settlement of loans.
The following table is a summary of the activity in the allowance for loan losses for the years ended September 30, 2011 and 2010:
| | 2011 | | 2010 | |
| | | | | |
Balance, beginning of year | | $ | 26,975,717 | | $ | 20,579,170 | |
Provision charged to expense | | 14,800,000 | | 26,064,000 | |
Charge-offs, net of recoveries: | | | | | |
Residential real estate: | | | | | |
First mortgage | | 4,453,129 | | 3,390,091 | |
Second mortgage | | 1,976,629 | | 2,023,832 | |
Home equity lines of credit | | 2,848,362 | | 4,141,887 | |
Commercial: | | | | | |
Commercial & multi-family real estate | | 1,534,417 | | 4,235,565 | |
Land acquisition & development | | 4,380,048 | | 1,144,690 | |
Real estate construction & development | | 48,608 | | 2,249,473 | |
Commercial & industrial | | 728,964 | | 2,316,172 | |
Consumer & other | | 91,938 | | 165,743 | |
Total charge-offs, net | | 16,062,095 | | 19,667,453 | |
Balance, end of year | | $ | 25,713,622 | | $ | 26,975,717 | |
The following table contains a breakdown of the principal balance of loans receivable at September 30, 2011 by class and the ratio of net charge-offs to the average balance of each class for the years ended September 30, 2011 and 2010, and the average annual charge-offs for the five years ended September 30, 2011 and 2010.
| | | | Net Charge-Offs as a | |
| | | | Percent of Average Loan Category | |
| | Principal | | | | | | Annualized | |
| | Balance at | | Year Ended | | Five Years Ended | |
| | September 30, | | September 30, | | September 30, | |
| | 2011 | | 2011 | | 2010 | | 2011 | | 2010 | |
| | (Dollars In Thousands) | | | | | | | | | |
Residential real estate: | | | | | | | | | | | |
First mortgage | | $ | 242,091 | | 1.79 | % | 1.26 | % | 1.05 | % | 0.73 | % |
Second mortgage | | 51,535 | | 3.52 | % | 3.35 | % | 1.97 | % | 1.45 | % |
Home equity lines of credit | | 176,324 | | 1.51 | % | 1.92 | % | 1.06 | % | 0.79 | % |
Commercial (1) | | 570,860 | | 1.18 | % | 1.72 | % | 0.98 | % | 0.84 | % |
Consumer and other | | 3,117 | | 0.09 | % | 0.15 | % | 0.12 | % | 0.13 | % |
Total loans receivable | | $ | 1,043,927 | | 1.51 | % | 1.76 | % | 1.10 | % | 0.85 | % |
(1) | Commercial includes land acquisition and development, real estate construction & development, commercial & multi-family real estate, and commercial & industrial loans. |
The provision for loan losses for the year ended September 30, 2011 was $14.8 million compared with $26.1 million in 2010. The larger provision recorded in the prior year was primarily due to increases in non-
16
performing assets and certain other asset quality indicators such as delinquencies and internal adversely classified assets during the prior year, higher levels of net charge-offs in the prior year and the increase in certain loss factors in the Company’s general valuation allowance model during the June 2010 quarter.
Net charge-offs for the year ended September 30, 2011 were $16.1 million, or 1.51% of average loans, compared with $19.7 million, or 1.76% of average loans, for fiscal 2010. Because a large portion of the Company’s loan portfolio is typically collateralized by real estate, losses occur more frequently when property values are declining and borrowers are losing equity in the underlying collateral. Declines in real estate values in the Company’s market areas, as well as nationally, contributed to the significant levels of charge-offs in fiscal 2011 and 2010.
Net charge-offs during the year ended September 30, 2011 included $4.2 million, or 26% of total net charge-offs, related to the one commercial relationship that was secured primarily by a retail strip shopping center and adjacent land held for future development discussed above. Net charge-offs during the year ended September 30, 2010 included $3.7 million, or 19% of total charge-offs, related to one commercial relationship that was secured by a retail strip shopping center in Naples, Florida. Although the Company’s commercial lending practices generally limit lending to the St. Louis metropolitan area, the Company has occasionally made exceptions to this guideline on a limited basis to provide financing outside of these metropolitan areas to its St. Louis-based customers who have historically demonstrated successful performance.
The ratio of the allowance for loan losses to loans receivable decreased to 2.46% at September 30, 2011 compared to 2.52% at September 30, 2010. The ratio of the allowance for loan losses to non-performing loans was 48.17% at September 30, 2011 compared to 45.29% at September 30, 2010. Excluding restructured loans that were performing under their restructured terms and the related allowance for loan losses, the ratio of the allowance for loan losses to the remaining non-performing loans was 84.50% at September 30, 2011 compared to 75.47% at September 30, 2010. Management believes the changes in these coverage ratios are appropriate due to the change in the mix of non-performing loans during the period, specifically troubled debt restructurings that were performing under their restructured terms.
Refer to Note 5 of Notes to Consolidated Financial Statements for a discussion of the Company’s loan loss allowance methodology. Management believes that the amount maintained in the allowance is adequate to absorb probable losses inherent in the portfolio. Although management believes that it uses the best information available to make such determinations, future adjustments to the allowance for loan losses may be necessary and results of operations could be significantly and adversely affected if circumstances differ substantially from the assumptions used in making the determinations. While management believes it has established the allowance for loan losses in accordance with U.S. generally accepted accounting principles, there can be no assurance that the Bank’s regulators, in reviewing the loan portfolio, will not request a significant increase in the allowance for loan losses. In addition, because future events affecting borrowers and collateral cannot be predicted with certainty, there can be no assurance that the existing allowance for loan losses is adequate or that a substantial increase will not be necessary should the quality of any loans deteriorate as a result of the factors discussed above. Any material increase in the allowance for loan losses will adversely affect the Company’s financial condition and results of operations.
17
The following table summarizes the unpaid principal balances of impaired loans at September 30, 2011 and 2010. Such unpaid principal balances have been reduced by all partial charge-offs of the related loans to the allowance for loan losses. Refer to Note 5 of Notes to the Consolidated Financial Statements for a summary of the Company’s accounting policies regarding impaired loans.
| | September 30, 2011 | | September 30, 2010 | |
| | Impaired | | Impaired | | | | Impaired | | Impaired | | | |
| | Loans with | | Loans with | | Total | | Loans with | | Loans with | | Total | |
| | Specific | | No Specific | | Impaired | | Specific | | No Specific | | Impaired | |
| | Allowance | | Allowance | | Loans | | Allowance | | Allowance | | Loans | |
Residential real estate first mortgage | | $ | 14,605,368 | | $ | 15,548,383 | | $ | 30,153,751 | | $ | 7,805,475 | | $ | 22,265,397 | | $ | 30,070,872 | |
Residential real estate second mortgage | | 1,780,640 | | 1,709,488 | | 3,490,128 | | 1,075,800 | | 2,971,947 | | 4,047,747 | |
Home equity lines of credit | | 4,275,455 | | 2,055,369 | | 6,330,824 | | 1,720,474 | | 2,263,042 | | 3,983,516 | |
Land acquisition and development | | 285,254 | | 64,856 | | 350,110 | | 8,796,057 | | 162,358 | | 8,958,415 | |
Real estate construction & development | | 697,968 | | 1,745,275 | | 2,443,243 | | 126,992 | | 4,367,621 | | 4,494,613 | |
Commercial & multi-family real estate | | 3,638,111 | | 5,320,630 | | 8,958,741 | | 4,439,491 | | 1,282,688 | | 5,722,179 | |
Commercial & industrial | | 719,457 | | 467,604 | | 1,187,061 | | 2,062,052 | | 38,688 | | 2,100,740 | |
Consumer and other | | 455,350 | | 11,754 | | 467,104 | | 97,423 | | 86,633 | | 184,056 | |
Total | | $ | 26,457,603 | | $ | 26,923,359 | | $ | 53,380,962 | | $ | 26,123,764 | | $ | 33,438,374 | | $ | 59,562,138 | |
Residential real estate first mortgage, second mortgage and home equity lines of credit that were determined to be impaired but had no related specific allowance totaled $19.3 million at September 30, 2011 compared with $27.5 million at September 30, 2010. Such loans were determined to be impaired and were placed on non-accrual status because management determined that the Company will be unable to collect all amounts due on a timely basis according to the loan contract, including scheduled interest payments. However, after evaluation of the fair value of the underlying collateral, the delinquency status of the notes and the ability of the borrowers to repay the principal balance of the loans, management determined that no impairment losses were probable on these impaired residential loans at September 30, 2011 and 2010. The decrease in principal balance of such loans between the periods was primarily due to an increase in residential real estate first mortgage loans with identified losses requiring the establishment of specific allowances.
Commercial loans, including land acquisition development and construction loans, real estate construction and development loans, commercial and multi-family real estate loans and commercial and industrial loans, that were determined to be impaired but had no related specific allowance totaled $7.6 million at September 30, 2011 compared with $5.9 million at September 30, 2010. Such loans were determined to be impaired and were placed on non-accrual status because management determined that the Company will be unable to collect all amounts due on a timely basis according to the loan contract, including scheduled interest payments. The principal balance of commercial and multi-family real estate loans with no related specific allowance increased from $1.3 million at September 30, 2010 to $5.3 million at September 30, 2011. Management determined that the Company will be unable to collect all scheduled interest payments due according to the loan contracts on several large relationships secured by commercial real estate. However, after evaluation of the current fair value of the underlying collateral, management determined that no impairment losses requiring a specific allowance for loan losses were probable on these loans. The principal balance of real estate construction and development loans with no related specific allowance decreased from $4.4 million at September 30, 2010 to $1.7 million at September 30, 2011 primarily as the result of principal repayments received on such loans. After evaluation of the fair value of the underlying collateral securing the remaining balances of collateral dependent loans, expected future cash flows of non-collateral dependent loans, the ability of the borrowers to repay the principal balance of the loans and the amount of partial charge offs that had been previously recorded, management determined that no further impairment losses requiring a specific allowance for loan losses were probable on impaired commercial loans at September 30, 2011 and 2010.
FINANCIAL CONDITION
Cash and cash equivalents increased $41.5 million to $57.1 million at September 30, 2011 from $15.6 million at September 30, 2010. Federal funds sold and overnight interest-bearing deposit accounts increased to
18
$40.6 million at September 30, 2011 compared to $4.0 million at September 30, 2010. Cash and amount due from depository institutions increased to $16.4 million at September 30, 2011 compared to $11.6 million at September 30, 2010. The increases were primarily the result of an increase in overnight deposits held at the Federal Reserve Bank of St. Louis as funds received from the decrease in the balance of loans held for sale were invested on a short-term basis.
Debt securities available for sale increased to $14.5 million at September 30, 2011 from $8.0 million at September 30, 2010. Mortgage-backed securities available for sale decreased to $2.8 million at September 30, 2011 from $8.8 million at September 30, 2010 and mortgage-backed securities held to maturity decreased to $7.2 million at September 30, 2011 from $10.3 million at September 30, 2010. Such securities are held primarily as collateral to secure large commercial and municipal deposits. The total balance held in these securities is adjusted, as individual securities mature or repay, to reflect fluctuations in the balances of the deposits they are securing.
Capital Stock of the Federal Home Loan Bank decreased $6.7 million to $3.1 million at September 30, 2011 from $9.8 million at September 30, 2010. The Bank is generally required to hold a specific amount of stock based upon its total FHLB borrowings outstanding. The decreased balance is related to the decrease in borrowings from the FHLB.
Bank-owned life insurance increased $1.1 million to $30.8 million at September 30, 2011 from $29.8 million at September 30, 2010. The increase was attributable to appreciation of the cash surrender values of existing policies. Increases in cash surrender values are treated as other income and are tax exempt.
Advances from the Federal Home Loan Bank decreased $152.0 million to $29.0 million at September 30, 2011 from $181.0 million at September 30, 2010. The Company supplements its primary funding source, retail deposits, with wholesale funding sources consisting of borrowings from the FHLB, brokered certificates of deposit acquired on a national level and short-term borrowings from the discount window of the Federal Reserve Bank. Management actively chooses among these wholesale funding sources depending on their relative costs. The decrease in borrowings in fiscal 2011 was primarily the result of the decline in the balance of loans held for sale which was used to repay short-term advances. See Liquidity Risk.
Total stockholders’ equity increased $3.8 million to $120.2 million at September 30, 2011 from $116.4 million at September 30, 2010. Increasing stockholders’ equity were net income totaling $8.1 million, the acquisition of shares by the equity trust totaling $447,000 net, the amortization of equity trust expense of $355,000 and stock option and award expense of $590,000. Decreasing stockholders’ equity were cash dividends paid on common stock and preferred stock of $4.2 million and $1.6 million, respectively.
COMPARISON OF OPERATING RESULTS FOR THE
YEARS ENDED SEPTEMBER 30, 2010 AND 2009
OVERVIEW
Net income for the year ended September 30, 2010 decreased 35.1% to $3.3 million, or $0.12 per diluted common share, compared to $5.1 million, or $0.37 per diluted common share, for the year ended September 30, 2009. Reducing income available to common shares for the year ended September 30, 2010 were dividends and discount accretion on the Company’s preferred stock totaling $2.1 million, or $0.19 per diluted common share compared to $1.3 million, or $0.12 per diluted common share for the year ended September 30, 2009.
NET INTEREST INCOME
Net interest income increased $5.1 million to $46.7 million for the year ended September 30, 2010 compared to $41.6 million for the year ended September 30, 2009. The increase was primarily the result of expansion in the net interest margin, which increased to 3.54% in 2010 compared with 3.10% in 2009. The net interest margin
19
benefited from market-driven declines in the cost of deposits and wholesale borrowings and growth in the average balance of mortgage loans held for sale, which typically produce higher interest-rate spreads than other interest-earning assets held by the Company.
Total interest and dividend income decreased $2.7 million to $65.1 million for the year ended September 30, 2010 compared to $67.8 million for the year ended September 30, 2009 due to declines in the average balance and average yield of interest-earning assets. The average yield decreased from 5.05% for 2009 to 4.94% for 2010 and the average balance decreased from $1.34 billion to $1.32 billion during the same periods, respectively.
The decrease in the average balance was primarily due to a $42.9 million decline in the average balance of loans receivable to $1.12 billion for 2010, partially offset by a $17.1 million increase in the average balance of loans held for sale to $136.9 million for 2010. The average balances of residential real estate loans and home equity lines of credit declined $31.6 million and $14.2 million, respectively, as the Company de-emphasized this type of lending, while the average balance of commercial loans increased $3.1 million. The decrease in the average yield was primarily due to the market driven declines in the average yields on loans receivable and loans held for sale.
Total interest expense decreased $7.8 million to $18.4 million for fiscal 2010 compared to $26.2 million for fiscal 2009 due to a decline in the average cost of funds and the average balance of interest-bearing liabilities. The average cost of funds decreased from 2.20% for 2009 to 1.60% for 2010 and the average balance of interest-bearing liabilities decreased from $1.19 billion to $1.15 billion during the same periods, respectively.
The lower average balance of interest-bearing liabilities resulted from decreases in the average balances of borrowings from the Federal Reserve and the FHLB, partially offset by an increase in the average balance of deposits. The decreased average cost was the result of lower market interest rates during the period, growth in core deposits and a shift in the mix of wholesale funding sources.
Interest expense on deposits decreased $5.4 million, or 25.0%, to $16.1 million during the year ended September 30, 2010 compared to $21.5 million for the year ended September 30, 2009 as the result of a decrease in the average cost partially offset by an increase in the average balance. The average balance of interest-bearing deposits increased to $1.04 billion for the year ended September 30, 2010 from $976.7 million for the year ended September 30, 2009 while the average cost of deposits decreased from 2.20% to 1.56% during the same periods, respectively. Growth in average total deposits during 2010 was used to repay certain wholesale borrowings.
Interest expense on advances from the Federal Home Loan Bank decreased $1.8 million, or 50.3%, to $1.7 million during the year ended September 30, 2010 compared to $3.5 million for the year ended September 30, 2009 as the result of decreases in the average cost and average balance. The average balance decreased to $96.9 million for the year ended September 30, 2010 from $120.3 million for the year ended September 30, 2009 and the average cost decreased from 2.92% to 1.80% during the same period, respectively. The lower average balance resulted from the repayment of short-term advances with the increase in deposits and decrease in total interest-earning assets. The decreased average cost was the result of lower market interest rates during the 2010 period.
Interest expense on borrowings from the Federal Reserve Bank decreased $319,000, or 99.8%, to $500 during the year ended September 30, 2010. During 2010, the Company repaid all of the borrowings from the Federal Reserve with lower-cost borrowings from the FHLB.
PROVISION FOR LOAN LOSSES
The provision for loan losses for the year ended September 30, 2010 was $26.1 million compared to $23.0 million for the same period a year ago. The increased provision for loan losses in 2010 related primarily to increased charge-offs and an increase in the level of non-performing loans.
20
NON-INTEREST INCOME
Total non-interest income decreased $4.7 million to $14.8 million for the year ended September 30, 2010 compared to $19.6 million for the year ended September 30, 2009 primarily as the result of decreases in mortgage revenues, gains on sales of securities and retail banking fees, partially offset by an increase in investment brokerage revenues.
Mortgage revenues decreased 38.2% to $7.8 million during the year ended September 30, 2010 on loan sales of $1.67 billion, compared to mortgage revenues of $12.7 million during the year ended September 30, 2009 on loan sales of $2.02 billion.
Retail banking fees decreased 3.0% to $3.8 million in 2010 compared to $3.9 million for 2009 primarily as a result of tightened consumer spending in the current difficult economic environment.
Investment brokerage revenues increased 34.5% to $1.8 million for the year September 30, 2010 compared to $1.3 million for the same period a year ago. The increase in revenues during 2010 was the result of an increase in sales volume as many of the Bank’s customers shifted funds from loan originations to lower-risk bonds because of the current economic environment.
Gain (loss) on sales of securities was a net gain of $303,000 for the year ended September 30, 2009, related primarily to the sale of $50 million in Federal Home Loan Bank bonds that were classified as available for sale. There were no such sales in 2010.
NON-INTEREST EXPENSE
Total non-interest expense increased $499,000, or 1.6%, to $31.9 million for the year ended September 30, 2010 compared to $31.4 million for the year ended September 30, 2009. Significant fluctuations are discussed below.
Salaries and employee benefits expense decreased $305,000, or 2.1%, to $14.0 million for the year ended September 30, 2010 from $14.3 million for the year ended September 30, 2009. The decrease in salaries and employee benefits expense in 2010 was primarily due to lower expense related to the Bank-sponsored 401(k) Plan resulting from the suspension of the employer match beginning in calendar year 2010.
Occupancy, equipment and data processing expense increased $207,000 to $8.3 million for the year ended September 30, 2010 from $8.1 million for the year ended September 30, 2009. The increase was largely related to an increase in expense related to the enhancement of certain capabilities of the Bank’s data processing systems, an increase in expense related to the use of an independent security company to provide security guards at certain of the Bank’s branch offices and increased data processing and other expenses related to the elevated level of loan and deposit activity.
Advertising expense decreased $485,000 to $566,000 for the year ended September 30, 2010 compared to $1.1 million for the year ended September 30, 2009 primarily due to a reduction in the overall level of advertising during fiscal 2010 in connection with a more focused effort to control such expenses.
Professional services increased $230,000 to $1.7 million for the year ended September 30, 2010 compared to $1.5 million for the year ended September 30, 2009. The increase was the result of an increase in expenses related to regulatory compliance and increased loan collection activity resulting from the depressed economic environment.
FDIC deposit insurance premium expense decreased $275,000 to $2.0 million for the year ended September 30, 2010 compared to $2.3 million for the year ended September 30, 2009. In 2009, the Bank paid $700,000 as its share of an industry-wide FDIC special assessment. The lower expense in 2010 was the result of the absence of such special assessment, partially offset by the industry-wide increases in FDIC deposit insurance rates and increased premiums due to deposit growth.
21
Real estate foreclosure losses and expense was $2.8 million for the year ended September 30, 2010 compared with $1.3 million for the year ended September 30, 2009. The increased expense for 2010 was primarily the result of an $826,000 write-down in the March 2010 quarter of a parcel of raw ground, which was acquired through foreclosure in a prior period, due to an estimated decline in its fair market value based upon a new appraisal and the $400,000 write-down of the retail strip shopping center discussed above.
Other non-interest expense decreased $362,000, or 18.5%, to $1.6 million for the year ended September 30, 2010 compared to $2.0 million for the year ended September 30, 2009. The decrease was primarily due to a $246,000 loss related to the impairment of the Company’s equity interest in a small-bank fund during 2009. The equity interest was sold during 2010 resulting in a gain of $179,000.
INCOME TAXES
The provision for income taxes decreased from $1.6 million for the year ended September 30, 2009 to $259,000 for the year ended September 30, 2010. The effective tax rate was 7.30% in 2010 compared with 24.3% in 2009. The effective tax rates differed from the Federal statutory rate of 34% primarily as the result of non-taxable income related to bank-owned life insurance and tax-exempt interest on loans. The lower effective rate in 2010 compared to 2009 was due to the decrease in total pre-tax income resulting in a higher ratio of non-taxable income to such pre-tax income.
MARKET RISK ANALYSIS
Market risk is the risk of loss arising from adverse changes in the fair values of financial instruments or other assets caused by changes in interest rates, currency exchange rates, or equity prices. Interest rate risk is the Company’s primary market risk and results from timing differences in the repricing of assets and liabilities, changes in relationships between rate indices, and the potential exercise of explicit or embedded options. The Company uses several measurement tools provided by a national asset liability management consultant to help manage these risks. Management provides key assumptions to the consultant, which are used as inputs into the measurement tools. Following is a summary of two different tools management uses on a quarterly basis to monitor and manage interest rate risk.
Earnings Simulation Modeling. Net income is affected by changes in the level of interest rates, the shape of the yield curve and the general market pressures affecting current market interest rates at the time of simulation. Many interest rate indices do not move uniformly, creating certain disunities between them. For example, the spread between a thirty-day, prime-based asset and a thirty-day, FHLB advance may not be uniform over time. The earnings simulation model projects changes in net interest income caused by the effect of changes in interest rates on interest-earning assets and interest-bearing liabilities. Simulation results are measured as a percentage change in net interest income compared to the static-rate or “base case” scenario. The model considers increases and decreases in asset and liability volumes using prepayment assumptions as well as rate changes. Rate changes are modeled gradually over a twelve-month period, referred to as a “rate ramp.” The model projects only changes in interest income and expense and does not project changes in non-interest income, non-interest expense, provision for loan losses, the impact of changing tax rates, or any actions that the Company might take to counter the effect of market interest rate movements. At September 30, 2011, net interest income simulation showed a negative 270 basis point change from the base case in a 200 basis point ramped rising rate environment and a negative 40 basis point change from the base case in a 100 basis point ramped declining rate environment. The projected decreases in net interest income are within the Asset/Liability Committee’s guidelines in a 200 basis point increasing or 100 basis point decreasing interest rate environment. However, management continually monitors signs of elevated risks and takes certain actions to limit these risks.
The following table summarizes the results of the Company’s income simulation model as of September 30, 2011 and 2010.
22
| | Change in Net Interest Income | |
| | 2011 | | 2010 | |
| | Year 1 | | Year 2 | | Year 1 | | Year 2 | |
Change in Market Interest Rates: | | | | | | | | | |
200 basis point ramped increase | | (2.7 | )% | (5.1 | )% | (2.9 | )% | (2.2 | )% |
Base case - no change | | — | | (2.5 | )% | — | | — | |
100 basis point ramped decrease | | (0.4 | )% | (1.7 | )% | (0.9 | )% | (1.3 | )% |
Net Portfolio Value Analysis. Net portfolio value (“NPV”) represents the market value of portfolio equity and is equal to the market value of assets minus the market value of liabilities, with adjustments made for off-balance sheet items. This analysis assesses the risk of loss in market-risk sensitive instruments in the event of a sudden and sustained 100 to 200 basis point increase or decrease in market interest rates with no effect given to any actions management might take to counter the effect of the interest rate movements. The following is a summary of the results of the report compiled by the Company’s outside consultant using data and assumptions management provided as of September 30, 2011 and 2010.
| | Estimated Change in Net Portfolio Value | |
| | 2011 | | 2010 | |
| | Amount
(in thousands) | | Percent | | Amount
(in thousands) | | Percent | |
Change in Market Interest Rates: | | | | | | | | | |
200 basis point increase | | $ | (1,347 | ) | (0.8 | )% | $ | 6,271 | | 3.8 | % |
Base case - no change | | $ | — | | — | | $ | — | | — | |
100 basis point decrease | | $ | (15,844 | ) | (9.8 | )% | $ | (581 | ) | (0.4 | )% |
The preceding table indicates that, at September 30, 2011, in the event of a 200 basis point increase in prevailing market interest rates, NPV would be expected to decrease by $1.3 million, or 0.8% of the base case scenario value of $161.8 million. In the event of a decrease in prevailing market rates of 100 basis points, NPV would be expected to decrease by $15.8 million, or 9.8%, of the base case scenario value. The projected decrease in NPV is within the Asset Liability Committee’s guidelines in a 200 basis point increasing or 100 basis point decreasing interest rate environment. However, management continually monitors signs of elevated risks and takes certain actions to limit these risks.
23
The following table presents the Company’s financial instruments that are sensitive to changes in interest rates, categorized by expected maturity, and the instruments’ estimated fair values and weighted average interest rates at September 30, 2011. Expected maturities use certain assumptions based on historical experience and other data available to management.
| | Weighted | | | | One Year | | After Three | | After Five | | | | Carrying | | Estimated | |
| | Average | | Within One | | to | | Years to Five | | Years to | | Beyond | | Value | | Fair | |
| | Rate | | Year | | Three Years | | Years | | Ten Years | | Ten Years | | Total | | Value | |
| | (Dollars in Thousands) | |
Interest-Sensitive Assets | | | | | | | | | | | | | | | | | |
| | | | | | | | | | | | | | | | | |
Loans receivable - net (1) | | 5.30 | % | $ | 601,368 | | $ | 168,938 | | $ | 118,099 | | $ | 58,445 | | $ | 74,423 | | $ | 1,021,273 | | $ | 1,075,459 | |
Mortgage loans held for sale - net (2) | | 4.00 | % | 100,719 | | — | | — | | — | | — | | 100,719 | | 103,286 | |
Debt securities - AFS | | 0.47 | % | 14,457 | | — | | — | | — | | — | | 14,457 | | 14,457 | |
Mortgage-backed securities - HTM | | 3.84 | % | 3,991 | | — | | 14 | | 687 | | 2,542 | | 7,234 | | 7,727 | |
Mortgage-backed securities - AFS | | 4.23 | % | — | | — | | 21 | | 1,797 | | 934 | | 2,752 | | 2,752 | |
FHLB stock | | 3.00 | % | 3,100 | | — | | — | | — | | — | | 3,100 | | 3,100 | |
Other | | 0.23 | % | 40,637 | | — | | — | | — | | — | | 40,637 | | 40,637 | |
Total interest-sensitive assets | | | | $ | 764,272 | | $ | 168,938 | | $ | 118,134 | | $ | 60,929 | | $ | 77,899 | | $ | 1,190,172 | | $ | 1,247,418 | |
| | | | | | | | | | | | | | | | | |
Interest-Sensitive Liabilities | | | | | | | | | | | | | | | | | |
| | | | | | | | | | | | | | | | | |
Savings accounts | | 0.14 | % | $ | 35,714 | | $ | — | | $ | — | | $ | — | | $ | — | | $ | 35,714 | | $ | 35,714 | |
Checking accounts (3) | | 0.28 | % | 328,275 | | — | | — | | — | | — | | 328,275 | | 328,275 | |
Money market accounts | | 0.33 | % | 183,874 | | — | | — | | — | | — | | 183,874 | | 183,874 | |
Certificate of deposit accounts | | 1.48 | % | 277,621 | | 144,239 | | 2,372 | | — | | — | | 424,232 | | 428,088 | |
FHLB advances | | 3.08 | % | — | | — | | 25,000 | | — | | 4,000 | | 29,000 | | 31,216 | |
Subordinated debentures | | 2.55 | % | — | | — | | — | | — | | 19,589 | | 19,589 | | 19,583 | |
Total interest-sensitive liabilities | | | | $ | 825,484 | | $ | 144,239 | | $ | 27,372 | | $ | — | | $ | 23,589 | | $ | 1,020,684 | | $ | 1,026,750 | |
| | | | | | | | | | | | | | | | | |
Off-Balance-Sheet Items | | | | | | | | | | | | | | | | | |
| | | | | | | | | | | | | | | | | |
Operating leases | | | | $ | 785 | | $ | 1,314 | | $ | 1,052 | | $ | 1,076 | | $ | — | | $ | 4,227 | | $ | 4,227 | |
Commitments to extend credit | | 4.61 | % | 111,725 | | — | | — | | — | | — | | — | | 114,104 | |
Unused lines of credit - residential | | | | 123,486 | | — | | — | | — | | — | | — | | 124,560 | |
Unused lines of credit - commercial | | | | 71,270 | | — | | — | | — | | — | | — | | 73,387 | |
Unused lines of credit - consumer | | | | 133 | | — | | — | | — | | — | | — | | 128 | |
(1) Includes non-accrual loans.
(2) Maturity reflects expected committed sales to investors.
(3) Excludes non-interest-bearing checking accounts of $150.4 million.
24
LIQUIDITY RISK
Liquidity risk arises from the possibility that the Company might not be able to satisfy current or future financial commitments, or may become unduly reliant on more costly alternative funding sources. The objective of liquidity risk management is to ensure that the cash flow requirements of the Bank’s depositors and borrowers, as well as the Company’s operating cash needs, are met. The Asset/Liability Committee meets regularly to consider the operating cash needs of the organization.
The Company primarily funds its assets with deposits from its retail and commercial customers. If the Bank or the Company require funds beyond their ability to generate them internally, the Bank has the ability to borrow funds from the FHLB and the Federal Reserve and, subject to regulatory restrictions discussed below, to raise certificates of deposit on a national level through broker relationships. Management chooses among these wholesale funding sources depending on their relative costs, the Company’s overall interest rate risk exposure and the Company’s overall borrowing capacity at the FHLB and the Federal Reserve. At September 30, 2011, the combined balance of borrowings from the FHLB and brokered deposits totaled $37.4 million, had a weighted-average interest rate of 3.57%, a weighted average maturity of approximately 41 months and represented 3% of total assets. At September 30, 2010, these combined balances totaled $189.4 million, had a weighted-average interest rate of 0.92%, a weighted average maturity of approximately10 months and represented 13% of total assets. Use of these funds has historically given the Company alternative sources to support its asset growth while avoiding, when necessary, aggressive deposit pricing strategies used from time to time by some of its competitors in its market. In addition, because approximately two-thirds of the Company’s assets are scheduled to mature or reprice within one year, the use of these wholesale funds has given management an alternative low-cost means to maximize net interest income and manage interest rate risk by providing the Company greater flexibility to control the interest rates and maturities of these funds, as compared to deposits. This increased flexibility has allowed the Company to better respond to changes in the interest rate environment and demand for its loan products, especially loans held for sale that are awaiting final settlement (generally within 30 to 60 days) with the Company’s investors. While the Company effectively utilized wholesale funding to support its asset growth in recent years, decreases in loans receivable and loans held for sale during the year ended September 30, 2011 allowed the Company to reduce its use of such wholesale funding from the high levels experienced in those recent years.
During July 2010, the Company agreed to comply with a request from its primary regulator at that time not to increase the aggregate level of national brokered certificates of deposit, CDARS time deposits and certain other similar reciprocal deposits above the level that existed at July 2, 2010, which was $178.5 million. The Company had already begun reducing the level of these types of deposits earlier in the fiscal year with funds received from the increased levels of core deposits. The aggregate balances of such deposits were $131.0 million and $150.1 million at September 30, 2011 and 2010, respectively. This restriction has not had a significant impact on the Company’s financial condition, results of operations or liquidity position since its implementation.
The borrowings from the FHLB are obtained under a blanket agreement, which assigns all investments in FHLB stock, qualifying first residential mortgage loans, residential loans held for sale and home equity loans with a 90% or less loan-to-value ratio as collateral to secure the amounts borrowed. Total borrowings from the FHLB are subject to limitations based upon a risk assessment of the Bank. At September 30, 2011, the Bank had approximately $206.6 million in additional borrowing authority under the arrangement with the FHLB in addition to the $29.0 million in advances outstanding at that date.
The Bank has the ability to borrow funds on a short-term basis under the Bank’s primary credit line at the Federal Reserve’s Discount Window. At September 30, 2011, the Bank had approximately $94.0 million in borrowing authority under this arrangement with no borrowings outstanding and had approximately $154.1 million of commercial loans pledged as collateral under this agreement.
At September 30, 2011, the Company had outstanding firm commitments to originate loans of $111.7 million, all of which were on a best-efforts basis and to fulfill commitments under unused lines of credit of $194.9 million. Certificates of deposit scheduled to mature in one year or less totaled $277.6 million. Based upon historical experience, management believes the majority of maturing retail certificates of deposit will remain with the Bank. However, if these deposits do not remain with the Bank, the Bank will need to rely on wholesale funding sources, which might only be available at higher interest rates.
25
The Company is a large originator of residential mortgage loans, with substantially all of these loans sold to the secondary residential mortgage investment community. Consequently, the primary source and use of cash in operations is to originate loans for sale, which used $1.43 billion in cash during the twelve months ended September 30, 2011 and provided proceeds of $1.59 billion from loan sales.
The primary use of cash from investing activities is the origination of loans receivable that are held in portfolio. Loans receivable held in portfolio, net increased $7.7 million for the year ended September 30, 2011 compared to a decrease of $37.9 million for the year ended September 30, 2010. Other significant uses of cash from investing activities included $62.6 million for the purchase of debt securities available for sale, $4.4 million for the purchase of FHLB stock, and $1.8 million for the purchase or improvement of premises and equipment. Sources of cash from investing activities included proceeds from maturities of debt securities available for sale totaling $56.0 million, proceeds from FHLB stock redemptions of $11.0 million, principal repayments on mortgage-backed securities totaling $8.9 million and proceeds from sale of real estate acquired in settlement of loans of $10.0 million.
The Company’s primary sources of cash from financing activities included a $7.3 million increase in deposits. Primary uses of cash from financing activities included a $152.0 million decrease in FHLB advances, a $2.2 million decrease in advance payments by borrowers for taxes and insurance, dividends paid on common stock of $4.2 million and dividends paid on preferred stock of $1.6 million.
The Company is a legal entity, separate and distinct from the Bank, which must provide its own liquidity to meet its operating needs. On January 16, 2009, as part of the U.S. Department of Treasury’s Capital Purchase Program, the Company issued 32,538 shares of Fixed Rate Cumulative Perpetual Preferred Stock and a warrant to purchase up to 778,421 shares of the Company’s common stock in exchange for $32.5 million in cash from the U.S. Department of Treasury. See Note 14 of Notes to the Consolidated Financial Statements. The Company contributed $20.0 million of the proceeds to the Bank in the form of additional paid-in capital, repaid a $7.6 million note payable to a correspondent bank and retained the remainder of the proceeds to fund the Company’s future cash needs. The Company’s ongoing liquidity needs primarily include funding its operating expenses, paying cash dividends to its common and preferred shareholders and paying interest and principal on outstanding debt. During the years ended September 30, 2011 and 2010, the Company paid cash dividends to its common and preferred shareholders totaling $5.8 million and $5.7 million, respectively, repaid no principal on outstanding debt and paid interest on outstanding debt totaling $506,000 and $515,000, respectively.
A large portion of the Company’s liquidity is obtained from the Bank in the form of dividends. Federal regulations impose limitations upon payment of capital distributions from the Bank to the Company. Under the regulations as currently applied to the Bank, the approval of the Office of the Comptroller of the Currency (“OCC”) and the non-objection of the Federal Reserve Bank are required prior to any capital distribution. To the extent that any such capital distributions are not approved by these regulators in future periods, the Company could find it necessary to reduce or eliminate the payment of common dividends to its shareholders. In addition, the Company could find it necessary to temporarily suspend the payment of dividends on its preferred stock and interest on its subordinated debentures. At September 30, 2011 and 2010, the Company had cash and cash equivalents totaling $119,000 and $109,000, respectively, and a demand loan extended to the Bank totaling $3.4 million and $1.9 million, respectively, that could be used to fulfill its liquidity needs.
DERIVATIVES, CONTRACTUAL OBLIGATIONS AND OFF-BALANCE-SHEET ARRANGEMENTS
The Company has various financial obligations, including obligations that may require future cash payments. The table below presents, as of September 30, 2011, significant fixed and determinable contractual obligations to third parties, excluding interest payable, by payment due date. Further discussion of each obligation is included in the notes to the consolidated financial statements.
| | | | Payments Due by Period | |
| | Total | | Less than 1
Year | | 1 to Less Than
3 Years | | 3 to 5 Years | | More than 5
years | |
| | (In thousands) | |
Time deposits | | $ | 424,232 | | $ | 277,621 | | $ | 144,239 | | $ | 2,372 | | $ | — | |
Advances from FHLB | | 29,000 | | — | | — | | 25,000 | | 4,000 | |
Subordinated debentures | | 19,589 | | — | | — | | — | | 19,589 | |
Operating lease obligations | | 4,227 | | 785 | | 1,314 | | 1,052 | | 1,076 | |
Total | | $ | 477,048 | | $ | 278,406 | | $ | 145,553 | | $ | 28,424 | | $ | 24,665 | |
26
In the normal course of operations, the Company engages in a variety of financial transactions that, in accordance with U.S. generally accepted accounting principles, are not recorded in its financial statements. These transactions involve, to varying degrees, elements of credit, interest rate and liquidity risk. Such transactions are used for general corporate purposes or to manage customers’ requests for funding. Corporate purpose transactions are used to help manage credit, interest rate, and liquidity risk or to optimize capital. Customer transactions are used to manage customers’ requests for funding.
STOCK PERFORMANCE
The following graph compares the cumulative total stockholder return on the Company’s common stock with the cumulative total return on the Nasdaq Index (U.S. companies) and with the SNL Bank and Thrift Index. The total return assumes reinvestment of all dividends. The graph assumes $100 was invested at the close of business on September 30, 2006.
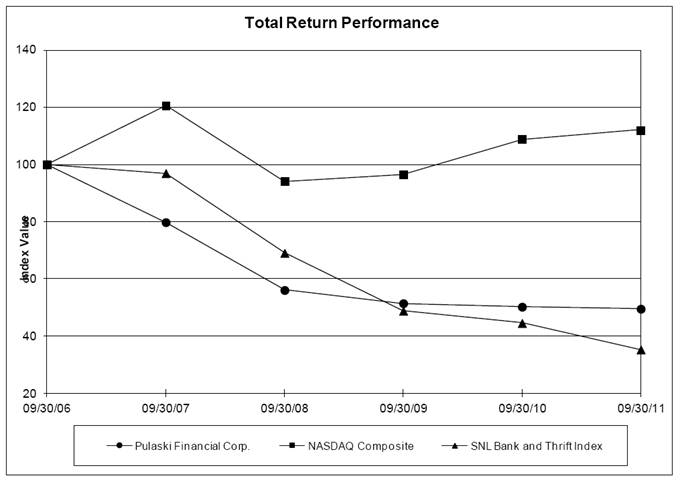
| | Year Ending | |
Index | | 09/30/06 | | 09/30/07 | | 09/30/08 | | 09/30/09 | | 09/30/10 | | 09/30/11 | |
Pulaski Financial Corp. | | 100.00 | | 79.78 | | 56.07 | | 51.45 | | 50.23 | | 49.53 | |
NASDAQ Composite | | 100.00 | | 120.52 | | 94.10 | | 96.49 | | 108.79 | | 112.05 | |
SNL Bank and Thrift Index | | 100.00 | | 96.91 | | 69.03 | | 48.80 | | 44.53 | | 35.29 | |
CAPITAL RESOURCES
The Company is not subject to any separate capital requirements from those of the Bank. The Bank is required to maintain specific minimum amounts of capital pursuant to Federal regulations. These minimum capital standards generally require the maintenance of regulatory capital sufficient to meet each of three tests, hereinafter described as the tangible capital requirement, the core capital requirement and risk-based capital requirement. The tangible capital requirement provides for minimum tangible capital (defined as stockholders’ equity less all intangible assets) equal to 1.5% of adjusted total assets.
27
The core capital requirement provides for minimum core capital (tangible capital plus certain forms of supervisory goodwill and other qualifying intangible assets) equal to 3.0% of adjusted assets. The risk-based capital requirement provides for the maintenance of core capital plus a portion of unallocated loss allowances equal to 8.0% of risk-weighted assets. In computing risk-weighted assets, the Bank multiplies the value of each asset on its balance sheet by a risk-weighting factor that is defined by federal regulations (e.g., one- to four-family conventional residential loans carry a risk-weighted factor of 50%). See Note 15 of Notes to the Consolidated Financial Statements for a summary of the Bank’s regulatory capital amounts and ratios at September 30, 2011 and 2010.
EFFECT OF INFLATION AND CHANGING PRICES
The consolidated financial statements and related financial data presented herein have been prepared in accordance with U.S. generally accepted accounting principles, which require the measurement of financial position and operating results in terms of historical dollars, without considering the change in the relative purchasing power of money over time due to inflation. The impact of inflation is reflected in the increased cost of the Company’s operations. Unlike most industrial companies, virtually all the assets and liabilities of a financial institution are monetary in nature. As a result, interest rates generally have a more significant impact on a financial institution’s performance than do general levels of inflation. Interest rates do not necessarily move in the same direction or to the same extent as the prices of goods and services.
IMPACT OF RECENTLY ISSUED ACCOUNTING STANDARDS
In February 2010, the Financial Accounting Standards Board (“FASB”) issued Accounting Standards Update (“ASU”) 2010-09, Amendments to Certain Recognition and Disclosure Requirements, as an amendment to ASC Topic 855. As a result of ASU 2010-09, SEC registrants will not disclose the date through which management evaluated subsequent events in financial statements. ASU 2010-09 was effective immediately for all financial statements that had not yet been issued or had not yet become available to be issued, or March 31, 2010 for the Company. The adoption of ASU 2010-09 is for disclosure purposes only and did not have any effect on the Company’s financial position or results of operations.
In June 2009, the FASB issued Statement of Financial Standards (“SFAS”) No. 166, Accounting for Transfers of Financial Assets, an Amendment of SFAS No. 140 — Accounting for Transfers and Servicing of Financial Assets and Extinguishments of Liabilities, which was subsequently incorporated into ASC Topic 860, Transfers and Servicing. SFAS No. 166 amends ASC Topic 860 and requires more information about transfers of financial assets, including securitization transactions and whether companies have continuing exposure to the risks related to transferred financial assets. It eliminates the concept of a “qualifying special-purpose entity,” changes the requirements for derecognizing financial assets and requires additional disclosures. SFAS No. 166 was effective for the annual period beginning after November 15, 2009 and for interim periods within the first annual reporting period, and was required be applied to transfers occurring on or after the effective date. The adoption of the provisions of this Topic did not have a material impact on the Company’s financial condition or results of operations.
In June 2009, the FASB issued SFAS No. 167, Amendments to FASB Interpretation No. 46(R). SFAS No. 167 amends FIN 46(R), Consolidation of Variable Interest Entities, which was subsequently incorporated into ASC Topic 810, Consolidation, to change how a company determines when an entity that is insufficiently capitalized or is not controlled through voting (or similar rights) should be consolidated, and requires additional disclosures about involvement with variable interest entities, any significant changes in risk exposure due to that involvement and how that involvement affects the company’s financial statements. The determination of whether a company is required to consolidate an entity is based on, among other things, an entity’s purpose and design and a company’s ability to direct the activities of the entity that most significantly impact the entity’s economic performance. The provisions of this Topic were effective for the annual period beginning after November 15, 2009 and for interim periods within the first annual reporting period. The adoption of the provisions of this Topic did not have a material impact on the Company’s financial condition or results of operations.
In June 2009, the FASB issued SFAS No. 168, The FASB Accounting Standards Codification TM and the Hierarchy of Generally Accepted Accounting Principles, a Replacement of SFAS No. 162 — The Hierarchy of Generally Accepted Accounting Principles, which was subsequently incorporated into ASC Topic 105, Generally Accepted Accounting Principles. This ASC establishes the source of authoritative Generally Accepted Accounting Principles (“GAAP”) recognized by the FASB to be applied by non-governmental entities. Rules and interpretive releases of the United States Securities and Exchange Commission (“SEC”) under authority of federal securities laws, are also sources of authoritative
28
GAAP for SEC registrants. This ASC superseded all then-existing non-SEC accounting and reporting standards. All other non-grandfathered, non-SEC accounting literature not included in the ASC became non-authoritative. ASC Topic 105 was effective for financial statements issued for interim and annual periods ending after September 15, 2009. The implementation of the ASC did not have a material impact on the Company’s financial condition or results of operations.
In January 2010, the FASB issued ASU No. 2010-06 which amends ASC Topic 820, Fair Value Measurements and Disclosures. This update provides more robust disclosures about (a) the different classes of assets and liabilities measured at fair value, (b) the valuation techniques and inputs used, (c) the activity in Level 3 fair value measurements, and (d) the transfers between Levels 1, 2, and 3. The ASU was effective for financial statements issued for interim and annual periods ending after December 15, 2009. The interim disclosures required by this update are reported in the notes to the Company’s consolidated financial statements.
In July 2010, the FASB issued ASU No. 2010-20, Receivables (ASC Topic 310): Disclosures about the Credit Quality of Financing Receivables and the Allowance for Credit Losses. This ASU requires expanded credit risk disclosures intended to provide investors with greater transparency regarding the allowance for credit losses and the credit quality of financing receivables. Under this ASU, companies are required to provide more information about the credit quality of their financing receivables in the disclosures to financial statements, such as aging information, credit quality indicators, changes in the allowance for credit losses, and the nature and extent of troubled debt restructurings and their effect on the allowance for credit losses. Both new and existing disclosures must be disaggregated by portfolio segment or class based on the level of disaggregation that management uses when assessing its allowance for credit losses and managing its credit exposure. The disclosures as of the end of a reporting period were effective for interim and annual periods ending on or after December 15, 2010. The disclosures about activity that occurs during a reporting period were effective for interim and annual reporting periods beginning on or after December 15, 2010. The adoption of the provisions of this Topic did not have a material impact on the Company’s financial condition or results of operations.
In April 2011, the FASB issued ASU No. 2011-02, A Creditor’s Determination of Whether a Restructuring is a Troubled Debt Restructuring. The provisions of ASU No. 2011-02 provide additional guidance related to determining whether a creditor has granted a concession, include factors and examples for creditors to consider in evaluating whether a restructuring results in a delay in payment that is insignificant, prohibits creditors from using the borrower’s effective rate test to evaluate whether a concession has been granted to the borrower, and add factors for creditors to use in determining whether a borrower is experiencing financial difficulties. A provision in ASU No. 2011-02 also ends the deferral of the additional disclosures about troubled debt restructurings as required by ASU No. 2010-20. The provisions of ASU No. 2011-02 were effective for the Company’s reporting period ending September 30, 2011 and were required to be applied retrospectively to the beginning of the annual period of adoption. The adoption of the ASU did not have a material impact on the Company’s financial condition or results of operations.
In September 2011, the FASB issued ASU No. 2011-08, Intangibles — Goodwill and Other (ASC Topic 350) — Testing of Goodwill for Impairment. This ASU simplifies how entities test goodwill for impairment. The amendments under this ASU permit an entity to first assess qualitative factors to determine whether it is more likely than not that the fair value of a reporting unit is less than its carrying amount as a basis for determining whether it is necessary to perform the two-step goodwill impairment test. The more-likely-than-not threshold is defined as having a likelihood of more than 50 percent. If an entity concludes that it is not more likely than not that the fair value of a reporting unit is less than its carrying amount, it would not be required to perform the two-step impairment test for that reporting unit. This ASU does not change the current guidance for testing other indefinite-lived intangible assets for impairment. The provisions of this ASU are effective for annual and interim goodwill impairment tests performed for fiscal years beginning after December 15, 2011. The adoption of this ASU is not expected to have a material impact on the Company’s consolidated financial condition or results of operations.
29
Management’s Report on
Internal Control over Financial Reporting
Our management is responsible for establishing and maintaining adequate internal control over financial reporting. Our internal control over financial reporting is a process designed to provide reasonable assurance regarding the reliability of our financial reporting and of the preparation of our consolidated financial statements for external purposes in accordance with U.S. generally accepted accounting principles.
A company’s internal control over financial reporting includes those policies and procedures that (1) pertain to the maintenance of records that, in reasonable detail, accurately and fairly reflect the transactions and dispositions of the assets of the company; (2) provide reasonable assurance that transactions are recorded as necessary to permit preparation of consolidated financial statements in accordance with generally accepted accounting principles, and that receipts and expenditures of the company are being made only in accordance with authorizations of management and directors of the company; and (3) provide reasonable assurance regarding prevention or timely detection of unauthorized acquisition, use, or disposition of the company’s assets that could have a material effect on the consolidated financial statements.
Because of its inherent limitations, internal control over financial reporting may not prevent or detect misstatements. Also, projections of any evaluation of effectiveness to future periods are subject to the risk that controls may become inadequate because of changes in conditions, or that the degree of compliance with the policies or procedures may deteriorate.
Our management assessed the effectiveness of our internal control over financial reporting, including controls over the preparation of the schedules equivalent to the basic financial statements in accordance with the Office of the Comptroller of Currency Instructions for Thrift Financial Reports, as of September 30, 2011, using the criteria established in Internal Control-Integrated Framework, issued by the Committee of Sponsoring Organizations of the Treadway Commission. Based on this assessment, management has concluded that, as of September 30, 2011, the Company’s internal control over financial reporting, including controls over the preparation of the schedules equivalent to the basic financial statements in accordance with the Office of the Comptroller of Currency Instructions for Thrift Financial Reports, was effective based on those criteria.
Our independent registered public accountants, KPMG LLP, have audited and issued a report on our internal control over financial reporting, including controls over the preparation of the schedules equivalent to the basic financial statements in accordance with the Office of the Comptroller of Currency Instructions for Thrift Financial Reports, which appears in this Annual Report.
30
Report of Independent Registered Public Accounting Firm
The Board of Directors and Stockholders
Pulaski Financial Corp.:
We have audited the accompanying consolidated balance sheets of Pulaski Financial Corp. and subsidiaries (the Company) as of September 30, 2011 and 2010, and the related consolidated statements of operations, stockholders’ equity and comprehensive income (loss), and cash flows for each of the years in the three-year period ended September 30, 2011. These consolidated financial statements are the responsibility of the Company’s management. Our responsibility is to express an opinion on these consolidated financial statements based on our audits.
We conducted our audits in accordance with the standards of the Public Company Accounting Oversight Board (United States). Those standards require that we plan and perform the audit to obtain reasonable assurance about whether the financial statements are free of material misstatement. An audit includes examining, on a test basis, evidence supporting the amounts and disclosures in the financial statements. An audit also includes assessing the accounting principles used and significant estimates made by management, as well as evaluating the overall financial statement presentation. We believe that our audits provide a reasonable basis for our opinion.
In our opinion, the consolidated financial statements referred to above present fairly, in all material respects, the financial position of Pulaski Financial Corp. and subsidiaries as of September 30, 2011 and 2010, and the results of their operations and their cash flows for each of the years in the three-year period ended September 30, 2011, in conformity with U.S. generally accepted accounting principles.
We also have audited, in accordance with the standards of the Public Company Accounting Oversight Board (United States), Pulaski Financial Corp.’s internal control over financial reporting as of September 30, 2011, based on criteria established in Internal Control — Integrated Framework, issued by the Committee of Sponsoring Organizations of the Treadway Commission, and our report dated December 16, 2011 expressed an unqualified opinion on the effectiveness of Pulaski Financial Corp.’s internal control over financial reporting.
/s/ KPMG LLP | |
| |
St. Louis, Missouri | |
December 16, 2011 | |
31
PULASKI FINANCIAL CORP. AND SUBSIDIARIES
CONSOLIDATED BALANCE SHEETS
SEPTEMBER 30, 2011 and 2010
| | 2011 | | 2010 | |
ASSETS | | | | | |
| | | | | |
Cash and amounts due from depository institutions | | $ | 16,433,765 | | $ | 11,641,550 | |
Federal funds sold and overnight interest-bearing deposits | | 40,637,241 | | 3,961,254 | |
Total cash and cash equivalents | | 57,071,006 | | 15,602,804 | |
Debt securities available for sale, at fair value | | 14,457,072 | | 8,001,092 | |
Mortgage-backed securities held to maturity, at amortized cost (fair value of $7,727,314 and $10,788,459 at September 30, 2011 and 2010, respectively) | | 7,234,139 | | 10,296,891 | |
Mortgage-backed securities available for sale, at fair value | | 2,751,871 | | 8,845,526 | |
Capital stock of Federal Home Loan Bank, at cost | | 3,100,400 | | 9,773,600 | |
Mortgage loans held for sale, at lower of cost or market | | 100,718,753 | | 253,578,202 | |
Loans receivable (net of allowance for loan losses of $25,713,622 and $26,975,717 at September 30, 2011 and 2010, respectively) | | 1,021,272,809 | | 1,046,273,232 | |
Real estate acquired in settlement of loans (net of allowance for losses of $2,515,800 and $1,651,100 at September 30, 2011 and 2010, respectively) | | 18,717,814 | | 14,900,312 | |
Premises and equipment, net | | 18,458,166 | | 18,764,098 | |
Goodwill | | 3,938,524 | | 3,938,524 | |
Core deposit intangible | | 79,435 | | 148,003 | |
Accrued interest receivable | | 3,852,790 | | 4,432,361 | |
Bank-owned life insurance | | 30,842,466 | | 29,770,828 | |
Deferred tax assets | | 12,772,637 | | 13,157,300 | |
Prepaid expenses, accounts receivable and other assets | | 13,940,754 | | 15,333,827 | |
| | | | | |
Total assets | | $ | 1,309,208,636 | | $ | 1,452,816,600 | |
| | | | | |
LIABILITIES AND STOCKHOLDERS’ EQUITY | | | | | |
| | | | | |
LIABILITIES: | | | | | |
Deposits | | $ | 1,122,524,913 | | $ | 1,115,203,120 | |
Advances from the Federal Home Loan Bank | | 29,000,000 | | 181,000,000 | |
Subordinated debentures | | 19,589,000 | | 19,589,000 | |
Advance payments by borrowers for taxes and insurance | | 4,945,918 | | 7,098,432 | |
Accrued interest payable | | 840,186 | | 945,374 | |
Other liabilities | | 12,138,433 | | 12,627,393 | |
Total liabilities | | 1,189,038,450 | | 1,336,463,319 | |
| | | | | |
STOCKHOLDERS’ EQUITY : | | | | | |
| | | | | |
Preferred stock - $0.01 par value per share, 1,000,000 shares authorized; 32,538 shares issued at September 30, 2011 and 2010, $1,000 per share liquidation value, net of discount | | 31,527,176 | | 31,088,060 | |
Common stock - $0.01 par value per share, 18,000,000 shares authorized; 13,068,618 shares issued at September 30, 2011 and 2010 | | 130,687 | | 130,687 | |
Treasury stock - at cost (2,588,340 and 2,753,799 shares at September 30, 2011 and 2010, respectively) | | (17,380,790 | ) | (18,064,582 | ) |
Additional paid-in capital from common stock | | 57,608,062 | | 56,702,495 | |
Accumulated other comprehensive income, net | | 310 | | 37,834 | |
Retained earnings | | 48,284,741 | | 46,458,787 | |
Total stockholders’ equity | | 120,170,186 | | 116,353,281 | |
| | | | | |
Total liabilities and stockholders’ equity | | $ | 1,309,208,636 | | $ | 1,452,816,600 | |
See accompanying notes to the consolidated financial statements.
32
PULASKI FINANCIAL CORP. AND SUBSIDIARIES
CONSOLIDATED STATEMENTS OF INCOME AND COMPREHENSIVE INCOME
YEARS ENDED SEPTEMBER 30, 2011, 2010 AND 2009
| | 2011 | | 2010 | | 2009 | |
INTEREST AND DIVIDEND INCOME: | | | | | | | |
Loans receivable | | $ | 53,836,937 | | $ | 57,689,759 | | $ | 60,481,030 | |
Mortgage loans held for sale | | 5,548,562 | | 6,259,177 | | 5,768,338 | |
Securities and other | | 867,174 | | 1,155,254 | | 1,573,931 | |
Total interest and dividend income | | 60,252,673 | | 65,104,190 | | 67,823,299 | |
INTEREST EXPENSE: | | | | | | | |
Deposits | | 11,374,452 | | 16,134,364 | | 21,515,584 | |
Advances from Federal Home Loan Bank | | 1,070,964 | | 1,742,237 | | 3,507,381 | |
Borrowings from the Federal Reserve Bank | | — | | 484 | | 319,548 | |
Subordinated debentures | | 505,889 | | 515,308 | | 759,492 | |
Note payable | | — | | — | | 113,354 | |
Total interest expense | | 12,951,305 | | 18,392,393 | | 26,215,359 | |
NET INTEREST INCOME | | 47,301,368 | | 46,711,797 | | 41,607,940 | |
PROVISION FOR LOAN LOSSES | | 14,800,000 | | 26,064,000 | | 23,030,685 | |
NET INTEREST INCOME AFTER PROVISION FOR LOAN LOSSES | | 32,501,368 | | 20,647,797 | | 18,577,255 | |
NON-INTEREST INCOME: | | | | | | | |
Mortgage revenues | | 5,670,484 | | 7,840,478 | | 12,684,367 | |
Retail banking fees | | 4,148,120 | | 3,777,468 | | 3,893,265 | |
Investment brokerage revenues | | 1,864,170 | | 1,797,876 | | 1,336,857 | |
Gain on sales of securities | | — | | — | | 302,714 | |
Bank-owned life insurance income | | 1,071,637 | | 1,092,149 | | 1,086,693 | |
Other | | 243,394 | | 332,507 | | 262,734 | |
Total non-interest income | | 12,997,805 | | 14,840,478 | | 19,566,630 | |
NON-INTEREST EXPENSE: | | | | | | | |
Salaries and employee benefits | | 15,021,505 | | 13,979,216 | | 14,270,156 | |
Occupancy, equipment and data processing expense | | 8,990,060 | | 8,288,918 | | 8,082,272 | |
Advertising | | 574,438 | | 566,111 | | 1,051,338 | |
Professional services | | 1,653,032 | | 1,747,584 | | 1,517,781 | |
FDIC deposit insurance premium expense | | 2,430,621 | | 1,980,105 | | 1,555,200 | |
FDIC special deposit insurance assessment | | — | | — | | 700,000 | |
Real estate foreclosure losses and expense, net | | 2,872,484 | | 2,810,765 | | 1,317,809 | |
Postage, document delivery and office supplies expense | | 898,470 | | 978,703 | | 982,254 | |
Other | | 1,843,979 | | 1,584,709 | | 1,960,368 | |
Total non-interest expense | | 34,284,589 | | 31,936,111 | | 31,437,178 | |
INCOME BEFORE INCOME TAXES | | 11,214,584 | | 3,552,164 | | 6,706,707 | |
INCOME TAX EXPENSE | | 3,149,807 | | 259,377 | | 1,629,745 | |
NET INCOME | | $ | 8,064,777 | | $ | 3,292,787 | | $ | 5,076,962 | |
OTHER COMPREHENSIVE INCOME: | | | | | | | |
Unrealized (loss) gain on investment and mortgage-backed securities available for sale (net of income taxes in 2011, 2010 and 2009 of $22,999, $94,962 and ($177,844), respectively) | | (37,524 | ) | (154,939 | ) | 290,167 | |
COMPREHENSIVE INCOME | | $ | 8,027,253 | | $ | 3,137,848 | | $ | 5,367,129 | |
Income available to common shares | | $ | 5,998,761 | | $ | 1,232,887 | | $ | 3,811,669 | |
Per-share amounts: | | | | | | | |
Basic earnings per common share | | $ | 0.57 | | $ | 0.12 | | $ | 0.37 | |
Weighted average common shares outstanding - basic | | 10,543,316 | | 10,380,822 | | 10,178,681 | |
| | | | | | | |
Diluted earnings per common share | | $ | 0.55 | | $ | 0.12 | | $ | 0.37 | |
Weighted average common shares outstanding - diluted | | 10,987,605 | | 10,626,919 | | 10,402,165 | |
See accompanying notes to the consolidated financial statements.
33
PULASKI FINANCIAL CORP. AND SUBSIDIARIES
CONSOLIDATED STATEMENTS OF STOCKHOLDERS’ EQUITY
YEARS ENDED SEPTEMBER 30, 2010 AND 2009
| | | | | | | | | | Accumulated | | | | | |
| | Preferred | | | | | | Additional | | Other | | | | | |
| | Stock, | | | | | | Paid-In | | Comprehensive | | | | | |
| | Net of | | Common | | Treasury | | Capital From | | Income | | Retained | | | |
| | Discount | | Stock | | Stock | | Common Stock | | (Loss), Net | | Earnings | | Total | |
| | | | | | | | | | | | | | | |
BALANCE, SEPTEMBER 30, 2008 | | $ | — | | $ | 130,687 | | $ | (19,050,498 | ) | $ | 51,987,198 | | $ | (97,394 | ) | $ | 49,390,513 | | $ | 82,360,506 | |
Comprehensive income: | | | | | | | | | | | | | | | |
Net income | | — | | — | | — | | — | | — | | 5,076,962 | | 5,076,962 | |
Change in unrealized gain (loss) on investment securities, net of tax | | — | | — | | — | | — | | 477,849 | | — | | 477,849 | |
Realized gain on sales of investment securities included in net income, net of tax | | — | | — | | — | | — | | (187,682 | ) | — | | (187,682 | ) |
Comprehensive income | | — | | — | | — | | — | | 290,167 | | 5,076,962 | | 5,367,129 | |
Preferred stock and common stock warrant issued | | 30,334,273 | | — | | — | | 2,167,495 | | — | | — | | 32,501,768 | |
Common stock dividends ($0.38 per share) | | — | | — | | — | | — | | — | | (3,922,623 | ) | (3,922,623 | ) |
Preferred stock dividends | | — | | — | | — | | — | | — | | (944,506 | ) | (944,506 | ) |
Accretion of discount on preferred stock | | 320,787 | | — | | — | | — | | — | | (320,787 | ) | — | |
Stock options exercised | | — | | — | | 97,238 | | 8,711 | | — | | — | | 105,949 | |
Stock option and award expense | | — | | — | | — | | 491,124 | | — | | — | | 491,124 | |
Common stock issued under dividend reinvestment plan (132,138 shares) | | — | | — | | 539,255 | | 246,414 | | — | | — | | 785,669 | |
Restricted common stock issued (24,327 shares) | | — | | — | | 99,278 | | (99,278 | ) | — | | — | | — | |
Common stock surrendered to satisfy tax withholding obligations of stock-based compensation (6,873 shares) | | — | | — | | (54,972 | ) | — | | — | | — | | (54,972 | ) |
Purchase of equity trust shares (77,084 shares) | | — | | — | | (441,753 | ) | — | | — | | — | | (441,753 | ) |
Distribution of equity trust shares (19,918 shares) | | — | | — | | 267,279 | | (267,279 | ) | — | | — | | — | |
Amortization of equity trust expense | | — | | — | | — | | 740,879 | | — | | — | | 740,879 | |
Tax benefit from release of equity shares | | — | | — | | — | | (41,315 | ) | — | | — | | (41,315 | ) |
Excess tax benefit from stock-based compensation | | — | | — | | — | | 13,515 | | — | | — | | 13,515 | |
BALANCE, SEPTEMBER 30, 2009 | | 30,655,060 | | 130,687 | | (18,544,173 | ) | 55,247,464 | | 192,773 | | 49,279,559 | | 116,961,370 | |
Comprehensive income: | | | | | | | | | | | | | | | |
Net income | | — | | — | | — | | — | | — | | 3,292,787 | | 3,292,787 | |
Change in unrealized gain (loss) on investment securities, net of tax | | — | | — | | — | | — | | (154,939 | ) | — | | (154,939 | ) |
Comprehensive income | | — | | — | | — | | — | | (154,939 | ) | 3,292,787 | | 3,137,848 | |
Preferred stock and common stock warrant issued | | — | | — | | — | | — | | — | | — | | — | |
Common stock dividends ($0.38 per share) | | — | | — | | — | | — | | — | | (4,053,659 | ) | (4,053,659 | ) |
Preferred stock dividends | | — | | — | | — | | — | | — | | (1,626,900 | ) | (1,626,900 | ) |
Accretion of discount on preferred stock | | 433,000 | | — | | — | | — | | — | | (433,000 | ) | — | |
Stock options exercised | | — | | — | | 297,504 | | (100,675 | ) | — | | — | | 196,829 | |
Stock option and award expense | | — | | — | | — | | 555,086 | | — | | — | | 555,086 | |
Common stock issued under dividend reinvestment plan (110,184 shares) | | — | | — | | 429,901 | | 277,132 | | — | | — | | 707,033 | |
Common stock issued under equity trust plan (228,761 shares) | | — | | — | | (548,699 | ) | 548,699 | | — | | — | | — | |
Restricted common stock issued (48,400 shares) | | — | | — | | 197,520 | | (197,520 | ) | — | | — | | — | |
Common stock surrendered to satisfy tax withholding obligations of stock-based compensation (11,655 shares) | | — | | — | | (78,374 | ) | — | | — | | — | | (78,374 | ) |
Purchase of equity trust shares (43,553 shares) | | — | | — | | (219,785 | ) | 38,233 | | — | | — | | (181,552 | ) |
Distribution of equity trust shares (33,742 shares) | | — | | — | | 401,524 | | (401,524 | ) | — | | — | | — | |
Amortization of equity trust expense | | — | | — | | — | | 800,434 | | — | | — | | 800,434 | |
Tax benefit from release of equity shares | | — | | — | | — | | (66,224 | ) | — | | — | | (66,224 | ) |
Excess tax benefit from stock-based compensation | | — | | — | | — | | 1,390 | | — | | — | | 1,390 | |
BALANCE, SEPTEMBER 30, 2010 | | $ | 31,088,060 | | $ | 130,687 | | $ | (18,064,582 | ) | $ | 56,702,495 | | $ | 37,834 | | $ | 46,458,787 | | $ | 116,353,281 | |
See accompanying notes to the consolidated financial statements.
34
PULASKI FINANCIAL CORP. AND SUBSIDIARIES
CONSOLIDATED STATEMENTS OF STOCKHOLDERS’ EQUITY
YEAR ENDED SEPTEMBER 30, 2011
| | | | | | | | | | Accumulated | | | | | |
| | Preferred | | | | | | Additional | | Other | | | | | |
| | Stock, | | | | | | Paid-In | | Comprehensive | | | | | |
| | Net of | | Common | | Treasury | | Capital From | | Income | | Retained | | | |
| | Discount | | Stock | | Stock | | Common Stock | | (Loss), Net | | Earnings | | Total | |
| | | | | | | | | | | | | | | |
BALANCE, SEPTEMBER 30, 2010 | | $ | 31,088,060 | | $ | 130,687 | | $ | (18,064,582 | ) | $ | 56,702,495 | | $ | 37,834 | | $ | 46,458,787 | | $ | 116,353,281 | |
Comprehensive Income: | | | | | | | | | | | | | | | |
Net income | | — | | — | | — | | — | | — | | 8,064,777 | | 8,064,777 | |
Change in unrealized gain (loss) on investment securities, net of tax | | — | | — | | — | | — | | (37,524 | ) | — | | (37,524 | ) |
Comprehensive income | | — | | — | | — | | — | | (37,524 | ) | 8,064,777 | | 8,027,253 | |
Common stock dividends ($0.38 per share) | | — | | — | | — | | (4,202 | ) | — | | (4,172,807 | ) | (4,177,009 | ) |
Preferred stock dividends | | — | | — | | — | | — | | — | | (1,626,900 | ) | (1,626,900 | ) |
Accretion of discount on preferred stock | | 439,116 | | — | | — | | — | | — | | (439,116 | ) | — | |
Stock options exercised | | — | | — | | 117,765 | | 76,190 | | — | | — | | 193,955 | |
Stock option and award expense | | — | | — | | — | | 590,457 | | — | | — | | 590,457 | |
Common stock issued under dividend reinvestment plan | | — | | — | | — | | (27,399 | ) | — | | — | | (27,399 | ) |
Common stock issued under employee compensation plans, net (56,681 shares) | | — | | — | | (116,499 | ) | 87,110 | | — | | — | | (29,389 | ) |
Purchase of equity trust shares from Treasury, net (43,955 shares) | | — | | — | | — | | 446,684 | | — | | — | | 446,684 | |
Distribution of equity trust shares (75,391 shares) | | — | | — | | 682,526 | | (682,526 | ) | — | | — | | — | |
Amortization of equity trust expense | | — | | — | | — | | 355,179 | | — | | — | | 355,179 | |
Tax cost from release of equity shares | | — | | — | | — | | (49,227 | ) | — | | — | | (49,227 | ) |
Excess tax benefit from stock-based compensation | | — | | — | | — | | 113,301 | | — | | — | | 113,301 | |
BALANCE, SEPTEMBER 30, 2011 | | $ | 31,527,176 | | $ | 130,687 | | $ | (17,380,790 | ) | $ | 57,608,062 | | $ | 310 | | $ | 48,284,741 | | $ | 120,170,186 | |
See accompanying notes to the consolidated financial statements.
35
PULASKI FINANCIAL CORP. AND SUBSIDIARIES
CONSOLIDATED STATEMENTS OF CASH FLOWS
YEARS ENDED SEPTEMBER 30, 2011, 2010 AND 2009
| | 2011 | | 2010 | | 2009 | |
| | | | | | | |
CASH FLOWS FROM OPERATING ACTIVITIES: | | | | | | | |
Net income | | $ | 8,064,777 | | $ | 3,292,787 | | $ | 5,076,962 | |
Adjustments to reconcile net income to net cash from operating activities: | | | | | | | |
Depreciation, amortization and accretion: | | | | | | | |
Premises and equipment | | 2,009,616 | | 1,855,879 | | 1,885,341 | |
Net deferred loan costs | | 2,083,309 | | 2,253,359 | | 2,678,732 | |
Debt and equity securities premiums and discounts, net | | 295,132 | | 148,461 | | 156,364 | |
Equity trust expense, net | | 355,179 | | 800,434 | | 740,879 | |
Stock option and award expense | | 590,457 | | 555,086 | | 491,124 | |
Provision for loan losses | | 14,800,000 | | 26,064,000 | | 23,030,685 | |
Provision for losses on real estate acquired in settlement of loans | | 2,118,500 | | 2,181,900 | | 758,602 | |
(Gains)/losses on sale of real estate acquired in settlement of loans | | (169,496 | ) | (300,683 | ) | 98,129 | |
Originations of mortgage loans held for sale | | (1,432,925,551 | ) | (1,809,489,481 | ) | (2,041,899,278 | ) |
Proceeds from sales of mortgage loans held for sale | | 1,591,452,812 | | 1,672,542,651 | | 2,016,612,091 | |
Gain on sale of loans held for sale | | (5,667,812 | ) | (7,501,651 | ) | (11,876,091 | ) |
Loss on sale of equity securities available for sale | | — | | — | | 97,141 | |
Gain on sale of debt securities available for sale | | — | | — | | (399,855 | ) |
Increase in cash value of bank-owned life insurance | | (1,071,637 | ) | (1,092,149 | ) | (1,086,693 | ) |
Decrease (increase) in deferred tax asset | | 384,663 | | (3,861,066 | ) | (1,233,593 | ) |
Excess tax benefit from stock-based compensation | | (113,301 | ) | (1,390 | ) | (13,515 | ) |
Tax expense for release of equity trust shares | | 49,227 | | 66,224 | | 41,315 | |
Increase (decrease) in accrued expenses | | 594,455 | | (736,607 | ) | 773,738 | |
(Increase) decrease in current income taxes payable | | (2,130,097 | ) | 15,771 | | 1,553,768 | |
Changes in other assets and liabilities | | 3,069,778 | | (1,559,899 | ) | (3,037,668 | ) |
Net adjustments | | 175,725,234 | | (118,059,161 | ) | (10,628,784 | ) |
Net cash provided by (used in) operating activities | | 183,790,011 | | (114,766,374 | ) | (5,551,822 | ) |
CASH FLOWS FROM INVESTING ACTIVITIES: | | | | | | | |
Proceeds from: | | | | | | | |
Maturities of time deposits in other banks | | — | | — | | 99,000 | |
Maturities of debt securities available for sale | | 56,000,000 | | 20,000,000 | | 6,000,000 | |
Sales of debt securities available for sale | | — | | — | | 56,049,239 | |
Sales of equity securities available for sale | | — | | — | | 280,419 | |
Principal payments on mortgage-backed securities | | 8,927,535 | | 8,624,939 | | 5,123,662 | |
Redemption of Federal Home Loan Bank stock | | 11,035,100 | | 12,990,100 | | 4,571,500 | |
Sales of real estate acquired in settlement of loans receivable | | 10,035,572 | | 11,295,944 | | 7,535,450 | |
Sales of equipment | | 72,671 | | 34,811 | | 88,360 | |
Purchases of: | | | | | | | |
Debt securities available for sale | | (62,582,763 | ) | (26,004,472 | ) | (63,706,985 | ) |
Mortgage-backed securities available for sale | | — | | — | | (7,003,443 | ) |
Federal Home Loan Bank stock | | (4,361,900 | ) | (11,113,900 | ) | (5,325,200 | ) |
Premises and equipment | | (1,776,355 | ) | (1,692,787 | ) | (1,082,276 | ) |
Net (increase) decrease in loans receivable | | (7,684,964 | ) | 37,881,390 | | (82,395,730 | ) |
Cash paid for equity in joint venture | | — | | (12,500 | ) | — | |
Net cash provided by (used in) investing activities | | $ | 9,664,896 | | $ | 52,003,525 | | $ | (79,766,004 | ) |
36
PULASKI FINANCIAL CORP. AND SUBSIDIARIES
CONSOLIDATED STATEMENTS OF CASH FLOWS, CONTINUED
YEARS ENDED SEPTEMBER 30, 2011, 2010 AND 2009
| | 2011 | | 2010 | | 2009 | |
| | | | | | | |
CASH FLOWS FROM FINANCING ACTIVITIES: | | | | | | | |
Net increase (decrease) in deposits | | $ | 7,321,793 | | $ | (76,426,119 | ) | $ | 276,317,874 | |
(Repayment of) proceeds from Federal Home Loan Bank advances, net | | (152,000,000 | ) | 120,000,000 | | (149,600,000 | ) |
Repayment of Federal Reserve Bank borrowings, net | | — | | — | | (40,000,000 | ) |
Payment on notes payable | | — | | — | | (7,640,000 | ) |
Net decrease in due to other banks | | — | | — | | (14,377,831 | ) |
Net (decrease) increase in advance payments by borrowers for taxes and insurance | | (2,152,514 | ) | 2,442,565 | | 988,853 | |
Proceeds from cash received in dividend reinvestment plan | | — | | 707,033 | | 785,669 | |
Proceeds from issuance of preferred stock and common stock warrants | | — | | — | | 32,501,768 | |
Proceeds from stock options exercised | | 193,955 | | 196,829 | | 105,949 | |
Purchase of equity trust shares from Treasury, net | | 446,684 | | — | | — | |
Purchase of equity trust shares, net | | — | | (181,552 | ) | (441,753 | ) |
Excess tax benefit from stock-based compensation | | 113,301 | | 1,390 | | 13,515 | |
Tax expense for release of equity trust shares | | (49,227 | ) | (66,224 | ) | (41,315 | ) |
Dividends paid on common stock | | (4,177,009 | ) | (4,053,659 | ) | (3,922,623 | ) |
Dividends paid on preferred stock | | (1,626,900 | ) | (1,626,900 | ) | (944,506 | ) |
Common stock issued under employee compensation plan | | 99,998 | | — | | — | |
Common stock purchased dividend reinvestment plan | | (27,399 | ) | — | | — | |
Common stock surrendered to satisfy tax withholding obligations of stock-based compensation | | (129,387 | ) | (78,374 | ) | (54,972 | ) |
| | | | | | | |
Net cash (used in) provided by financing activities | | (151,986,705 | ) | 40,914,989 | | 93,690,628 | |
| | | | | | | |
NET INCREASE/(DECREASE) IN CASH AND CASH EQUIVALENTS | | 41,468,202 | | (21,847,860 | ) | 8,372,802 | |
| | | | | | | |
CASH AND CASH EQUIVALENTS AT BEGINNING OF YEAR | | 15,602,804 | | 37,450,664 | | 29,077,862 | |
| | | | | | | |
CASH AND CASH EQUIVALENTS AT END OF YEAR | | $ | 57,071,006 | | $ | 15,602,804 | | $ | 37,450,664 | |
| | | | | | | |
SUPPLEMENTAL DISCLOSURES OF CASH FLOW INFORMATION: | | | | | | | |
Cash paid during the year for: | | | | | | | |
Interest on deposits | | $ | 11,477,166 | | $ | 16,227,448 | | $ | 21,955,907 | |
Interest on advances from FHLB | | 1,070,964 | | 1,738,241 | | 3,531,530 | |
Interest on other borrowings | | — | | 484 | | 351,603 | |
Interest on subordinated debentures | | 527,685 | | 535,993 | | 780,141 | |
Interest on note payable | | — | | — | | 114,323 | |
Cash paid during the year for interest | | 13,075,815 | | 18,502,166 | | 26,733,504 | |
Income taxes, net | | 4,808,167 | | 3,517,009 | | 1,449,507 | |
| | | | | | | |
NON-CASH INVESTING ACTIVITIES: | | | | | | | |
Real estate acquired in settlement of loans receivable | | 15,802,078 | | 19,622,863 | | 13,327,985 | |
See accompanying notes to the consolidated financial statements.
37
PULASKI FINANCIAL CORP. AND SUBSIDIARIES
NOTES TO THE CONSOLIDATED FINANCIAL STATEMENTS
YEARS ENDED SEPTEMBER 30, 2011, 2010 AND 2009
1. SUMMARY OF SIGNIFICANT ACCOUNTING POLICIES
Pulaski Financial Corp. (the “Company”) is the holding company for Pulaski Bank (the “Bank”). The Company’s primary assets are its investment in the Bank and cash. The Company also maintains two special-purpose subsidiary trusts that issue preferred securities. Management of the Company and the Bank are substantially similar and the Company neither owns nor leases any property, but instead uses the premises, equipment and furniture of the Bank. Accordingly, the information in the consolidated financial statements relates primarily to the Bank.
The Company, through the Bank, operates in a single business segment, which is a community-oriented financial institution providing traditional financial services through the operation of thirteen full-service bank locations in the St. Louis metropolitan area and six loan production offices in the St. Louis and Kansas City metropolitan areas and Wichita, Kansas. The Bank is engaged primarily in the business of attracting deposits from the general public and using these and other funds to originate a variety of residential, commercial and consumer loans within the Bank’s lending market areas. The Bank is an approved lender/servicer for the Federal Housing Administration (“FHA”) and the Veterans Administration (“VA”), as well as for the Missouri Housing Development Commission (a government agency established to provide home-buying opportunities for low-income first-time homebuyers).
The accounting and reporting policies and practices of the Company and its subsidiaries conform to U.S. generally accepted accounting principles and to prevailing practices within the banking industry. A summary of the Company’s significant accounting policies follows.
Principles of Consolidation - The consolidated financial statements include the accounts of Pulaski Financial Corp. and its wholly-owned subsidiary, Pulaski Bank, and its wholly-owned subsidiaries, Pulaski Service Corporation and Priority Property Holdings, LLC. All significant intercompany transactions have been eliminated in consolidation.
Use of Estimates - The preparation of these consolidated financial statements in conformity with U.S. generally accepted accounting principles requires management to make estimates and assumptions that affect the reported amounts of assets and liabilities and disclosure of contingent assets and liabilities at the date of the financial statements, and that affect the reported amounts of revenues and expenses during the reporting periods. Actual results could differ from those estimates. The amount of the allowance for loan losses is a significant estimate reported within the consolidated financial statements.
Cash and Cash Equivalents - For purposes of reporting cash flows, cash and cash equivalents include cash and amounts due from depository institutions, cash in transit, cash in the process of collection, federal funds sold, and overnight deposits at the Federal Home Loan Bank of Des Moines (“Federal Home Loan Bank” or “FHLB”) and Federal Reserve Bank of St. Louis (“Federal Reserve”). Generally, federal funds sold mature within one day.
Securities and Mortgage-Backed Securities Available for Sale - Securities and mortgage-backed securities available for sale are recorded at their fair values, adjusted for amortization of premiums and accretion of discounts, which are recognized as adjustments to interest income over the life of the securities using the level-yield method. Refer to Note 20, Fair Value Measurements, for additional information regarding how fair values are determined. Unrealized gains or losses on securities and mortgage-backed securities available for sale are included in a separate component of stockholders’ equity, net of deferred income taxes. Gains or losses on the disposition of securities and mortgage-backed securities available for sale are recognized using the specific -identification method. Estimated fair values of securities and mortgage-backed securities available for sale are
38
based on quoted market prices when available. If quoted market prices are not available, fair values are estimated using quoted market prices for similar instruments.
Securities and Mortgage-Backed Securities Held to Maturity - Securities and mortgage-backed securities held to maturity are stated at cost, adjusted for amortization of premiums and accretion of discounts, since the Company has both the ability and intent to hold the securities to maturity. Premium amortization and discount accretion are recognized as adjustments to interest income over the life of the securities using the level-yield method.
Other-Than-Temporary Impairment of Debt Securities - When determining whether a debt security is other-than-temporarily impaired, management assesses whether (a) it has the intent to sell the security and (b) it is more likely than not that it will be required to sell the security prior to its anticipated recovery. In instances when a determination is made that an other-than-temporary impairment exists but management does not intend to sell the debt security and it is not more likely than not that it will be required to sell the debt security prior to its anticipated repayment or maturity, the other-than-temporary impairment is separated into (a) the amount of the total other-than-temporary impairment related to a decrease in cash flows expected to be collected from the debt security (the credit loss) and (b) the amount of the total other-than-temporary impairment related to all other factors. The amount of the total other-than-temporary impairment related to the credit loss is recognized in earnings. The amount of the total other-than-temporary impairment related to all other factors is recognized in other comprehensive income.
Capital Stock of the Federal Home Loan Bank - Capital stock of the Federal Home Loan Bank of Des Moines is required for membership in the FHLB and is carried at cost. The Bank must maintain a specified level of investment in FHLB stock based upon the amount of its outstanding FHLB borrowings. The stock of the FHLB is viewed as a long-term asset and its value is based upon the ultimate recoverability of the par value. In determining the recoverability of this investment, the Company considered the structure of the entire FHLB system, which enables the regulator of the FHLBs to reallocate debt among the members, so each individual FHLB has a potential obligation to repay the consolidated obligations issued by other FHLB members. In addition, regulatory changes during 2008 established a new regulator for the FHLB system that continues to oversee changes to management, management practices and balance sheet management at the FHLB. Finally, the liquidity position of the FHLB was strengthened with the support of the U.S. Treasury, which established a lending facility designed to provide secured funding on an as-needed basis to government-sponsored enterprises, such as the FHLB. The Company continues to monitor this investment for recoverability, but as of September 30, 2011, believed that it would ultimately recover the par value of the FHLB stock.
Mortgage Loans Held for Sale — Mortgage loans held for sale consist of loans that management does not intend to hold until maturity and are reflected at the lower of cost or fair value. Such loans are generally committed to be sold to investors on a best-efforts basis with servicing released. Accordingly, fair values for such loans are based on commitment prices. Gains or losses on loan sales are recognized at the time of sale and are determined by the difference between net sales proceeds and the principal balance of the loans sold, adjusted for net deferred loan fees or costs. Loan origination and commitment fees, net of certain direct loan origination costs, are deferred as an adjustment to the carrying value of the loan until it is sold.
Loans Receivable - Loans receivable are stated at the principal amounts outstanding adjusted for premiums, discounts, deferred loan costs, loans in process and the allowance for loan losses. Loan origination and commitment fees on originated loans, net of certain direct loan origination costs, are deferred and amortized to interest income using the level-yield method over the estimated lives of the related loans. Interest on loans is accrued based upon the principal amounts outstanding. Refer to Note 5, Loans Receivable and Allowance for Losses, for summaries of the Company’s accounting policies regarding impaired loans and the related recognition of interest income, troubled debt restructurings and the allowance for loan losses.
Real Estate Acquired in Settlement of Loans - Real estate acquired as a result of foreclosure or by deed-in-lieu of foreclosure is initially recorded at the lower of its cost, which is the unpaid principal balance of the related loan plus foreclosure costs, or fair value less estimated selling costs. Fair value is generally determined through
39
a new appraisal or market analysis. Any write-down to fair value at the time the property is acquired is recorded as a charge-off to the allowance for loan losses. Any decline in the fair value of the property subsequent to acquisition is recorded as a charge to non-interest expense. Refer to Note 20, Fair Value Measurements, for additional information regarding how fair values are determined.
Derivative Financial Instruments - The Company originates and purchases derivative financial instruments, including interest rate swaps, interest rate lock commitments and forward contracts to sell mortgage-backed securities. These instruments have certain interest rate risk characteristics that change in value based upon changes in the capital markets.
Interest Rate Swaps: The Company periodically uses derivative financial instruments (primarily interest rate swaps) to assist in its interest rate risk management. All derivatives are measured and reported at fair value on the Company’s consolidated balance sheets as either an asset or a liability. For derivatives that are designated and qualify as a fair value hedge, the gain or loss on the derivative, as well as the offsetting gain or loss on the hedged item attributable to the hedged risk, are reported as other assets or other liabilities, as appropriate, in the consolidated balance sheet. For all hedging relationships, derivative gains and losses that are not effective in hedging the changes in fair value of the hedged item are recognized immediately in current earnings during the period of the change. Similarly, the changes in the fair value of derivatives that do not qualify for hedge accounting are also reported in non-interest income when they occur.
The net cash settlements on derivatives that qualify for hedge accounting are recorded in interest income or interest expense, based on the item being hedged. The net cash settlements on derivatives that do not qualify for hedge accounting are reported in non-interest income.
At the inception of the hedge and quarterly thereafter, a formal assessment is performed to determine whether changes in the fair values of the derivatives have been highly effective in offsetting the changes in the fair values of the hedged item and whether they are expected to be highly effective in the future. The Company formally documents all relationships between hedging instruments and hedged items, as well as its risk-management objective and strategy for undertaking the hedge. This process includes identification of the hedging instrument, hedged item, risk being hedged and the method for assessing effectiveness and measuring ineffectiveness. In addition, on a quarterly basis, the Company assesses whether the derivative used in the hedging transaction is highly effective in offsetting changes in fair value of the hedged item, and measures and records any ineffectiveness as a credit or charge to earnings. The Company discontinues hedge accounting prospectively when it is determined that the derivative is or will no longer be effective in offsetting changes in the fair value of the hedged item, the derivative expires, is sold or terminated, or management determines that designation of the derivative as a hedging instrument is no longer appropriate.
The estimates of fair values of the Company’s derivatives and related liabilities are calculated by an independent third party using proprietary valuation models. The fair values produced by these valuation models are, in part, theoretical and reflect assumptions, which must be made in using the valuation models. Small changes in assumptions could result in significant changes in valuation. The risks inherent in the determination of the fair value of a derivative may result in income statement volatility.
The Company periodically uses derivatives to modify the repricing characteristics of certain assets and liabilities so that changes in interest rates do not have a significant adverse effect on net interest income and cash flows and to better match the repricing profile of its interest-bearing assets and liabilities. As a result of interest rate fluctuations, certain interest-sensitive assets and liabilities will gain or lose market value. In an effective fair value hedging strategy, the effect of this change in value will generally be offset by a corresponding change in value of the derivatives linked to the hedged assets and liabilities.
Interest Rate Lock Commitments: Commitments to originate loans (interest rate lock commitments), which primarily consist of commitments to originate fixed-rate residential mortgage loans, are recorded at fair value.
40
Changes in the fair value of interest rate lock commitments are recognized in non-interest income on a quarterly basis.
Forward Commitments to Sell Mortgage-Backed Securities: Forward commitments to sell mortgage-backed securities are recorded at fair value. Changes in the fair value of forward contracts to sell mortgage-backed securities are recognized in non-interest income on a quarterly basis.
Premises and Equipment - Premises and equipment are stated at cost, less accumulated depreciation. Depreciation charged to operations is primarily computed utilizing the straight-line method over the estimated useful lives of the related assets. Estimated lives range from three to forty years for buildings and improvements and three to ten years for furniture and equipment. Maintenance and repairs are charged to expense when incurred. Major renewals and improvements are capitalized. Gains and losses on dispositions are credited or charged to earnings as incurred.
Goodwill - Goodwill represents the amount of acquisition cost over the fair value of net assets acquired in the purchase of another financial institution. The Company reviews goodwill for impairment at least annually or more frequently if events or changes in circumstances indicate the carrying value of the asset might be impaired. Impairment is determined by comparing the implied fair value of the reporting unit goodwill with the carrying amount of that goodwill. If the carrying amount of the reporting unit goodwill exceeds the implied fair value of that goodwill, an impairment loss is recognized in an amount equal to that excess. Any such adjustments are reflected in the results of operations in the periods in which they become known. After a goodwill impairment loss is recognized, the adjusted carrying amount of goodwill becomes its new accounting basis. No such impairment losses were recognized during the three years ended September 30, 2011.
Intangible Assets - Intangible assets include core deposit premiums related to the purchase of other financial institutions or branch locations. Core deposit premiums are amortized using the level-yield method. The Company reviews intangible assets for impairment periodically to determine whether there have been any events or circumstances that indicate the recorded amount is not recoverable from projected undiscounted net operating cash flows. If the projected undiscounted net operating cash flows are less than the carrying amount, an impairment loss is recognized to reduce the carrying amount to fair value, and when appropriate, the amortization period is also reduced. Any such adjustments are reflected in the results of operations in the periods in which they become known. No such impairment losses were recognized during the three years ended September 30, 2011.
Stock-Based Compensation - The Company maintains a number of stock-based incentive programs, which are discussed in more detail in Note 16. All stock-based compensation is recognized as an expense in the financial statements based on the fair value of the award.
Income Taxes — Current income tax expense approximates taxes to be paid or refunded for the current period. Deferred income tax expense is computed using the balance sheet method. Under this method, the net deferred tax asset or liability is based on the tax effects of the differences between the book and tax bases of assets and liabilities, and recognizes enacted changes in tax rates and laws in the period in which they occur. Deferred income tax expense results from changes in deferred tax assets and liabilities between periods. Deferred tax assets are recognized subject to management’s judgment that realization is more likely than not. A tax position that meets the “more likely than not” recognition threshold is measured to determine the amount of benefit to recognize. The tax position is measured at the largest amount of benefit that is greater than 50% likely of being realized upon settlement. Interest and penalties are recognized as a component of income tax expense.
Reclassifications - Certain amounts included in the 2010 and 2009 consolidated financial statements have been reclassified to conform to the 2011 presentation.
41
2. EARNINGS PER SHARE
Basic earnings per share is computed using the weighted average number of common shares outstanding. The dilutive effect of potential securities is included in diluted earnings per share. The computations of basic and diluted earnings per share are presented in the following table.
| | Years Ended September 30, | |
| | 2011 | | 2010 | | 2009 | |
| | | | | | | |
Net income | | $ | 8,064,777 | | $ | 3,292,787 | | $ | 5,076,962 | |
| | | | | | | |
Less: | | | | | | | |
Preferred dividends declared | | (1,626,900 | ) | (1,626,900 | ) | (944,506 | ) |
Accretion of discount on preferred stock | | (439,116 | ) | (433,000 | ) | (320,787 | ) |
Income available for common shares | | $ | 5,998,761 | | $ | 1,232,887 | | $ | 3,811,669 | |
| | | | | | | |
Weighted average common shares outstanding - basic | | 10,543,316 | | 10,380,822 | | 10,178,681 | |
Effect of dilutive securities: | | | | | | | |
Treasury stock held in equity trust - unvested shares | | 301,544 | | 154,789 | | 95,490 | |
Equivalent shares - employee stock options and awards | | 41,259 | | 33,818 | | 56,122 | |
Equivalent shares - common stock warrant | | 101,486 | | 57,490 | | 71,872 | |
Weighted average common shares outstanding - diluted | | 10,987,605 | | 10,626,919 | | 10,402,165 | |
| | | | | | | |
Earnings per share: | | | | | | | |
Basic | | $ | 0.57 | | $ | 0.12 | | $ | 0.37 | |
Diluted | | 0.55 | | 0.12 | | 0.37 | |
Under the treasury stock method, outstanding stock options are dilutive when the average market price of the Company’s common stock, when combined with the effect of any unamortized compensation expense, exceeds the option price during a period. Proceeds from the assumed exercise of dilutive options along with the related tax benefit are assumed to be used to repurchase common shares at the average market price of such stock during the period. Similarly, outstanding warrants are dilutive when the average market price of the Company’s common stock exceeds the exercise price during a period. Proceeds from the assumed exercise of dilutive warrants are assumed to be used to repurchase common shares at the average market price of such stock during the period.
Options to purchase common shares totaling 666,790, 691,080, and 697,866 were excluded from the respective computations of diluted earnings per share during the years ended September 30, 2011, 2010 and 2009 respectively, because the exercise price of the options, when combined with the effect of the unamortized compensation expense, were greater than the average market price of the common shares and were considered anti-dilutive.
42
3. DEBT SECURITIES
The amortized cost and estimated fair value of debt securities available for sale at September 30, 2011 and 2010 are summarized as follows:
| | | | Gross | | Gross | | Estimated | |
| | Amortized | | Unrealized | | Unrealized | | Fair | |
| | Cost | | Gains | | Losses | | Value | |
September 30, 2011: | | | | | | | | | |
Debt obligations of government- sponsored entities | | $ | 14,456,776 | | $ | 3,245 | | $ | (2,949 | ) | $ | 14,457,072 | |
Weighted average yield at the end of the year | | 0.47 | % | | | | | | |
| | | | | | | | | |
September 30, 2010: | | | | | | | | | |
Debt obligations of government- sponsored entities | | $ | 8,000,836 | | $ | 706 | | $ | (450 | ) | $ | 8,001,092 | |
Weighted average yield at the end of the year | | 0.25 | % | | | | | | |
As of September 30, 2011 and 2010, the Company did not have any debt securities available for sale that were in a continuous loss position for more than 12 months.
The amortized cost and fair values of available-for-sale debt securities at September 30, 2011, by contractual maturity, are shown below.
| | Amortized | | Fair | |
| | Cost | | Value | |
Term to Maturity: | | | | | |
One year or less | | $ | 11,428,995 | | $ | 11,428,672 | |
Over one through five years | | 3,027,781 | | 3,028,400 | |
| | $ | 14,456,776 | | $ | 14,457,072 | |
Debt securities with carrying values totaling approximately $14.5 million at September 30, 2011 were pledged to secure deposits of public entities, trust funds, and for other purposes as required by law.
Proceeds from the sale of available-for-sale securities totaled $56.3 million for the year end September 30, 2009. Gross gains and gross losses totaling $458,000 and $156,000, respectively, were realized on these sales during the year ended September 30, 2009. There were no such sales during the years September 30, 2011 and 2010.
43
4. MORTGAGE-BACKED SECURITIES
Mortgage-backed securities held to maturity and available for sale at September 30, 2011 and 2010 are summarized as follows:
| | September 30, 2011 | |
| | | | Gross | | Gross | | | |
| | Amortized | | Unrealized | | Unrealized | | Fair | |
| | Cost | | Gains | | Losses | | Value | |
HELD TO MATURITY: | | | | | | | | | |
Mortgage-backed securities: | | | | | | | | | |
Freddie Mac | | $ | 12 | | $ | — | | $ | (1 | ) | $ | 11 | |
Ginnie Mae | | 122,417 | | 18,738 | | — | | 141,155 | |
Fannie Mae | | 7,104,972 | | 474,378 | | — | | 7,579,350 | |
Total | | 7,227,401 | | 493,116 | | (1 | ) | 7,720,516 | |
| | | | | | | | | |
Collateralized mortgage obligations: | | | | | | | | | |
Freddie Mac | | 6,738 | | 60 | | — | | 6,798 | |
Total | | 6,738 | | 60 | | — | | 6,798 | |
| | | | | | | | | |
Total held to maturity | | $ | 7,234,139 | | $ | 493,176 | | $ | (1 | ) | $ | 7,727,314 | |
| | | | | | | | | |
Weighted average yield at end of year | | 3.84 | % | | | | | | |
| | | | | | | | | |
AVAILABLE FOR SALE: | | | | | | | | | |
Mortgage-backed securities: | | | | | | | | | |
Ginnie Mae | | $ | 339,350 | | $ | 38,820 | | $ | — | | $ | 378,170 | |
Total | | 339,350 | | 38,820 | | — | | 378,170 | |
| | | | | | | | | |
Collateralized mortgage obligations: | | | | | | | | | |
Freddie Mac | | 21,396 | | — | | (38 | ) | 21,358 | |
Ginnie Mae | | 764,669 | | — | | (11,515 | ) | 753,154 | |
Fannie Mae | | 1,626,250 | | — | | (27,061 | ) | 1,599,189 | |
| | | | | | | | | |
Total | | 2,412,315 | | — | | (38,614 | ) | 2,373,701 | |
| | | | | | | | | |
Total available for sale | | $ | 2,751,665 | | $ | 38,820 | | $ | (38,614 | ) | $ | 2,751,871 | |
| | | | | | | | | |
Weighted average yield at end of year | | 4.23 | % | | | | | | |
44
| | September 30, 2010 | |
| | | | Gross | | Gross | | | |
| | Amortized | | Unrealized | | Unrealized | | Fair | |
| | Cost | | Gains | | Losses | | Value | |
HELD TO MATURITY: | | | | | | | | | |
Mortgage-backed securities: | | | | | | | | | |
Freddie Mac | | $ | 24 | | $ | — | | $ | — | | $ | 24 | |
Ginnie Mae | | 160,044 | | 13,944 | | — | | 173,988 | |
Fannie Mae | | 10,128,927 | | 477,620 | | — | | 10,606,547 | |
Total | | 10,288,995 | | 491,564 | | — | | 10,780,559 | |
| | | | | | | | | |
Collateralized mortgage obligations: | | | | | | | | | |
Freddie Mac | | 7,896 | | 4 | | — | | 7,900 | |
Total | | 7,896 | | 4 | | — | | 7,900 | |
| | | | | | | | | |
Total held to maturity | | $ | 10,296,891 | | $ | 491,568 | | $ | — | | $ | 10,788,459 | |
| | | | | | | | | |
Weighted average yield at end of year | | 4.02 | % | | | | | | |
| | | | | | | | | |
AVAILABLE FOR SALE: | | | | | | | | | |
Mortgage-backed securities: | | | | | | | | | |
Ginnie Mae | | $ | 433,843 | | $ | 37,163 | | $ | — | | $ | 471,006 | |
Fannie Mae | | 27,433 | | 40 | | — | | 27,473 | |
Total | | 461,276 | | 37,203 | | — | | 498,479 | |
| | | | | | | | | |
Collateralized mortgage obligations: | | | | | | | | | |
Freddie Mac | | 794,329 | | 13,610 | | — | | 807,939 | |
Ginnie Mae | | 3,479,613 | | — | | (2,353 | ) | 3,477,260 | |
Fannie Mae | | 4,049,540 | | 12,308 | | — | | 4,061,848 | |
| | | | | | | | | |
Total | | 8,323,482 | | 25,918 | | (2,353 | ) | 8,347,047 | |
| | | | | | | | | |
Total available for sale | | $ | 8,784,758 | | $ | 63,121 | | $ | (2,353 | ) | $ | 8,845,526 | |
| | | | | | | | | |
Weighted average yield at end of year | | 4.16 | % | | | | | | |
There were no proceeds from sales of available-for-sale mortgage-backed securities during the years ended September 30, 2011, 2010 or 2009.
As of September 30, 2011 and 2010, the Company did not have any mortgage-backed securities held to maturity or available for sale that were in a continuous loss position for more than 12 months.
The amortized cost and estimated fair values of held-to-maturity and available-for-sale mortgage-backed securities at September 30, 2011, by contractual maturity, are shown below.
45
| | Held to Maturity | | Available for Sale | |
| | Amortized | | Fair | | Amortized | | Fair | |
| | Cost | | Value | | Cost | | Value | |
Term to Maturity: | | | | | | | | | |
One year or less | | $ | 12 | | $ | 11 | | $ | — | | $ | — | |
Over one through five years | | 14,203 | | 16,410 | | 21,396 | | 21,358 | |
Over five through ten years | | 710,131 | | 760,441 | | 1,796,777 | | 1,779,756 | |
Over ten years | | 6,509,793 | | 6,950,452 | | 933,492 | | 950,757 | |
Tota1 | | $ | 7,234,139 | | $ | 7,727,314 | | $ | 2,751,665 | | $ | 2,751,871 | |
Actual maturities of mortgage-backed securities may differ from scheduled maturities depending on the repayment characteristics and experience of the underlying financial instruments.
Mortgage-backed securities with carrying values totaling approximately $10.0 million at September 30, 2011 were pledged to secure deposits of public entities, trust funds, and for other purposes as required by law.
5. LOANS RECEIVABLE AND ALLOWANCE FOR LOAN LOSSES
Loans receivable at September 30, 2011 and 2010 are summarized as follows:
| | 2011 | | 2010 | |
Single-family residential: | | | | | |
Residential first mortgage | | $ | 242,091,310 | | $ | 243,648,954 | |
Residential second mortgage | | 51,535,399 | | 60,281,107 | |
Home equity lines of credit | | 176,324,206 | | 201,922,359 | |
Commercial: | | | | | |
Commercial and multi-family real estate | | 316,210,346 | | 299,960,103 | |
Land acquisition and development | | 51,497,056 | | 74,461,741 | |
Real estate construction and development: | | 22,330,981 | | 31,071,102 | |
Commercial and industrial | | 180,821,164 | | 155,622,170 | |
| | | | | |
Consumer and installment | | 3,116,742 | | 3,512,266 | |
| | 1,043,927,204 | | 1,070,479,802 | |
Add (less): | | | | | |
Deferred loan costs | | 3,625,440 | | 3,884,483 | |
Loans in process | | (566,213 | ) | (1,115,336 | ) |
Allowance for loan losses | | (25,713,622 | ) | (26,975,717 | ) |
Total | | $ | 1,021,272,809 | | $ | 1,046,273,232 | |
Weighted average rate at end of year | | 5.30 | % | 5.34 | % |
The Bank has made loans to officers and directors in the ordinary course of business on substantially the same terms and conditions, including interest rates and collateral, as those prevailing for comparable transactions with other customers and did not, in the opinion of management, involve more than normal credit risk at the time of origination. However, subsequent to the date of origination, the Bank classified $11.1 million of loans secured by commercial real estate, that were made directly to entities controlled by one of the Bank’s directors, as “substandard” because of the borrower’s weakening cash flow position. In addition, the Bank classified as substandard, $5.0 million of related loans that were made to another of the Bank’s unaffiliated customers who, in turn, advanced the proceeds to the same entities controlled by the Bank director noted above and that was secured by the same collateral. Refer to the discussion of credit quality below for a description of the substandard classification. Management determined that such loans should continue to be classified as “substandard” at September 30, 2011, but determined they were not impaired and remained on accrual status.
46
Changes in loans to senior officers and directors for the years ended September 30, 2011 and 2010 are summarized as follows:
Balance, September 30, 2009 | | $ | 9,659,597 | |
Additions | | 4,325,555 | |
Repayments and reclassifications | | (1,627,425 | ) |
Balance, September 30, 2010 | | 12,357,727 | |
Additions | | 1,740,531 | |
Repayments and reclassifications | | (1,469,633 | ) |
Balance, September 30, 2011 | | $ | 12,628,625 | |
Home equity lines of credit to senior officers and directors totaled $1,046,000, of which $502,000 had been disbursed as of September 30, 2011.
At September 30, 2011, 2010 and 2009, the Bank was servicing loans for others totaling approximately $14.0 million, $18.6 million and $22.3 million, respectively. Servicing loans for others generally consists of collecting mortgage payments, maintaining escrow accounts, disbursing payments to investors and foreclosure processing. Loan servicing income is recorded on the accrual basis and includes servicing fees received from investors and certain charges collected from borrowers.
Allowance for Loan Losses
The Company maintains an allowance for loan losses to absorb probable losses in the Company’s loan portfolio. Loan charge-offs are charged against and recoveries are credited to the allowance. Provisions for loan losses are charged to income and credited to the allowance in an amount necessary to maintain an appropriate allowance given the risks identified in the portfolio. The allowance is comprised of specific allowances on impaired loans (assessed for loans that have known credit weaknesses) and pooled or general allowances based on assigned risk ratings and historical loan loss experience for each loan type. The allowance is based upon management’s quarterly estimates of probable losses inherent in the loan portfolio.
The Company charges off all or a portion of a loan when circumstances indicate that a loss is probable and there is no longer a reasonable expectation that a change in such circumstances will result in the collection of the full amount of the loan. Management considers many factors before charging off a loan. While the delinquency status of the loan is a primary factor, other key factors are considered and the Company does not charge off loans based solely on a predetermined length of delinquency. The other factors considered include the overall financial condition of the borrower, the progress of management’s collection efforts and the value of the underlying collateral. In general, a specific reserve is recorded in lieu of a charge-off on an impaired loan when management believes that the borrower still has the ability to bring the loan current or can provide additional collateral. Also, to enhance tracking of payment performance and facilitate billing and collection efforts, specific reserves are generally established in lieu of partial charge-offs on single-family residential real estate loans. Once collection efforts have failed, all or a portion of the loan is generally charged off, as appropriate. For purposes of determining the allowance for loan losses, all charge-offs and changes in the level of specific reserves are included in the determination of historical loss rates for each pool of loans with similar risk characteristics, as described below. During the years ended September 30, 2011 and 2010, charge-offs of non-performing and impaired loans totaled $16.5 million and $20.5 million, respectively, including partial charge-offs of $4.3 million and $1.3 million, respectively. At September 30, 2011 and 2010, the remaining principal balance of non-performing and impaired loans for which the Company previously recorded partial charge-offs totaled $317,000 and $597,000, respectively.
For purposes of determining the allowance for loan losses, the Company has segmented its loan portfolio into the following pools (or segments) that have similar risk characteristics: residential loans, commercial loans and consumer loans. Loans within these segments are further divided into subsegments, or classes, based on the associated risks within these subsegments. Residential loans are divided into three classes, including single-family first mortgage loans,
47
single-family second mortgage loans and home equity lines of credit. Commercial loans are divided into four classes, including land acquisition and development loans, real estate construction and development loans, commercial and multi-family real estate loans, and commercial and industrial loans. Consumer loans are not subsegmented because of the small balance in this segment.
The following is a summary of the significant risk characteristics for each segment of loans:
Residential mortgage loans are secured by one- to four-family residential properties with loan-to-value ratios at the time of origination generally equal to 80% or less. Such loans with loan-to-value ratios of greater than 80% at the time of origination generally require private mortgage insurance. Second mortgage loans and home equity lines of credit generally involve greater credit risk than first mortgage loans because they are secured by mortgages that are subordinate to the first mortgage on the property. If the borrower is forced into foreclosure, the Company will receive no proceeds from the sale of the property until the first mortgage has been completely repaid. Prior to 2008, the Company offered second mortgage loans that exceeded 80% combined loan-to-value ratios, which were priced with enhanced yields. The Company continues to offer second mortgage loans up to 80% of the collateral values on a limited basis to credit-worthy borrowers. However, the current underwriting guidelines are more stringent due to the current adverse economic environment.
Commercial loans represent loans to varying types of businesses, including municipalities, school districts and nonprofit organizations, to support working capital, operational needs and term financing of equipment. Repayment of such loans is generally provided through operating cash flows of the business. Commercial and multi-family real estate loans include loans secured by real estate occupied by the borrower for ongoing operations, non-owner occupied real estate leased to one or more tenants and greater-than-four family apartment buildings. Land acquisition and development loans are made to borrowers for the purpose of infrastructure improvements to vacant land to create finished marketable residential and commercial lots or land. Most land development loans are originated with the intention that the loans will be paid through the sale of developed lots or land by the developers generally within twelve months of the completion date. Real estate construction and development loans include secured loans for the construction of residential properties by real estate professionals and, to a lesser extent, individuals, and business properties that often convert to a commercial real estate loan at the completion of the construction period. Commercial and industrial loans include loans made to support working capital, operational needs and term financing of equipment and are generally secured by equipment, inventory, accounts receivable and personal guarantees of the owner. Repayment of such loans is generally provided through operating cash flows of the business, with the liquidation of collateral as a secondary repayment source.
Consumer loans include primarily loans secured by savings accounts and automobiles. Savings account loans are fully secured by restricted deposit accounts held at the Bank. Automobile loans include loans secured by new and pre-owned automobiles.
In determining the allowance and the related provision for loan losses, the Company establishes valuation allowances based upon probable losses identified during the review of impaired loans. These estimates are based upon a number of objective factors, such as payment history, financial condition of the borrower and discounted collateral exposure. For further information, see the discussion of impaired loans below. In addition, all loans that are not evaluated individually for impairment and any individually evaluated loans determined not to be impaired are segmented into groups based on similar risk characteristics as described above. The Company’s methodology includes factors that allow management to adjust its estimates of losses based on the most recent information available. Such risk factors are generally reviewed and updated quarterly, as appropriate. Historical loss rates for each risk group, which are updated quarterly, are quantified using all recorded loan charge-offs, changes in specific allowances on loans and real estate acquired through foreclosure and any gains and losses on the final disposition of real estate acquired through or in lieu of foreclosure. These historical loss rates for each risk group are used as the starting point to determine allowance provisions. Such rates are then adjusted to reflect actual changes and anticipated changes in national and local economic conditions and developments, the volume and severity of internally classified loans, loan concentrations,
48
assessment of trends in collateral values, and changes in lending policies and procedures, including underwriting standards and collections, charge-off and recovery practices.
In addition, various regulatory agencies, as an integral part of their examination process, periodically review the allowance for loan losses. Such agencies may require the Company to modify its allowance for loan losses based on their judgment about information available to them at the time of their examination.
The following table summarizes the activity in the allowance for loan losses for the years ended September 30, 2011, 2010 and 2009:
| | 2011 | | 2010 | | 2009 | |
| | | | | | | |
Balance, beginning of year | | $ | 26,975,717 | | $ | 20,579,170 | | $ | 12,761,532 | |
Provision charged to expense | | 14,800,000 | | 26,064,000 | | 23,030,685 | |
Charge-offs: | | | | | | | |
Residential real estate first mortgage | | 4,519,629 | | 3,773,665 | | 3,808,695 | |
Residential real estate second mortgage | | 2,094,004 | | 2,099,401 | | 1,433,970 | |
Home equity lines of credit | | 3,002,230 | | 4,164,730 | | 2,723,661 | |
Commercial & multi-family real estate | | 1,545,367 | | 4,323,493 | | 68,626 | |
Land acquisition & development | | 4,382,462 | | 1,144,690 | | 4,231,118 | |
Real estate construction & development | | 49,900 | | 2,254,473 | | 2,424,848 | |
Commercial & industrial | | 773,848 | | 2,539,604 | | 532,842 | |
Consumer and other | | 100,551 | | 174,425 | | 160,533 | |
Total charge-offs | | 16,467,991 | | 20,474,481 | | 15,384,293 | |
Recoveries | | | | | | | |
Residential real estate first mortgage | | 66,500 | | 383,573 | | 46,519 | |
Residential real estate second mortgage | | 117,374 | | 75,569 | | 2,634 | |
Home equity lines of credit | | 153,868 | | 22,843 | | 70,250 | |
Commercial & multi-family real estate | | 10,950 | | 87,928 | | 32,283 | |
Land acquisition & development | | 2,415 | | 5,000 | | — | |
Real estate construction & development | | 1,293 | | — | | — | |
Commercial & industrial | | 44,883 | | 223,432 | | 2,500 | |
Consumer and other | | 8,613 | | 8,683 | | 17,060 | |
Total recoveries | | 405,896 | | 807,028 | | 171,246 | |
Net charge-offs | | 16,062,095 | | 19,667,453 | | 15,213,047 | |
Balance, end of year | | $ | 25,713,622 | | $ | 26,975,717 | | $ | 20,579,170 | |
49
The following table summarizes, by loan portfolio segment, the changes in the allowance for loan losses for the year ended September 30, 2011 and information regarding the balance in the allowance and the recorded investment in loans by impairment method at September 30, 2011.
| | Residential | | | | | | | | | |
| | Real Estate | | Commercial | | Consumer | | Unallocated | | Total | |
Activity in allowance for loan losses: | | | | | | | | | | | |
Balance, beginning of period | | $ | 11,192,096 | | $ | 15,533,915 | | $ | 149,578 | | $ | 100,128 | | $ | 26,975,717 | |
Provision charged to expense | | 14,928,471 | | (585,847 | ) | 386,641 | | 70,735 | | 14,800,000 | |
Charge offs | | (9,615,863 | ) | (6,751,577 | ) | (100,551 | ) | — | | (16,467,991 | ) |
Recoveries | | 337,742 | | 59,541 | | 8,613 | | — | | 405,896 | |
Balance, end of period | | $ | 16,842,446 | | $ | 8,256,032 | | $ | 444,281 | | $ | 170,863 | | $ | 25,713,622 | |
| | | | | | | | | | | |
Allowance balance at end of period based on: | | | | | | | | | | | |
Loans individually evaluated for impairment | | $ | 6,823,235 | | $ | 1,761,301 | | $ | 391,497 | | $ | — | | $ | 8,976,033 | |
Loans collectively evaluated for impairment | | 10,019,211 | | 6,494,731 | | 52,784 | | 170,863 | | 16,737,589 | |
Loans acquired with deteriorated credit quality | | — | | — | | — | | — | | — | |
Total balance, end of period | | $ | 16,842,446 | | $ | 8,256,032 | | $ | 444,281 | | $ | 170,863 | | $ | 25,713,622 | |
| | | | | | | | | | | |
Recorded investment in loans receivable at end of period: | | | | | | | | | | | |
Total loans receivable | | $ | 472,312,786 | | $ | 571,549,810 | | $ | 3,123,835 | | | | $ | 1,046,986,431 | |
Loans receivable individually evaluated for impairment | | 40,123,496 | | 12,956,783 | | 469,468 | | | | 53,549,747 | |
Loans receivable collectively evaluated for impairment | | 432,189,290 | | 558,593,027 | | 2,654,367 | | | | 993,436,684 | |
Loans receivable acquired with deteriorated credit quality | | — | | — | | — | | | | — | |
Impaired Loans
A loan is considered to be impaired when, based on current information and events, management determines that the Company will be unable to collect all amounts due according to the loan contract, including scheduled interest payments. When a loan is identified as impaired, the amount of impairment loss is measured based on either the present value of expected future cash flows, discounted at the loan’s effective interest rate, or for collateral-dependent loans, observable market prices or the current fair value of the collateral. If the amount of impairment loss is measured based on the present value of expected future cash flows, the entire change in present value is recorded in the provision for loan losses. If the fair value of the collateral is used to measure impairment of a collateral-dependent loan and repayment or satisfaction of the loan is dependent on the sale of the collateral, the fair value of the collateral is adjusted to consider estimated costs to sell. However, if repayment or satisfaction of the loan is dependent only on the operation, rather than the sale of the collateral, the measurement of impairment does not incorporate estimated costs to sell the collateral. If the value of the impaired loan is determined to be less than the recorded investment in the loan (net of previous charge-offs, deferred loan fees or costs and unamortized premium or discount), an impairment charge is recognized through a provision for loan losses. The following table summarizes the principal balance of impaired loans at September 30, 2011 and 2010 by the impairment method used.
| | September 30, | | September 30, | |
| | 2011 | | 2010 | |
| | (In Thousands) | |
Fair value of collateral method | | $ | 33,542 | | $ | 39,713 | |
Present value of cash flows method | | 19,839 | | 19,849 | |
Total impaired loans | | $ | 53,381 | | $ | 59,562 | |
Loans considered for individual impairment analysis include loans that are past due, loans that have been placed on non-accrual status, troubled debt restructurings, loans with internally assigned credit risk ratings that indicate an elevated level of risk, or loans that management has knowledge of or concerns about the borrower’s ability to pay under the contractual terms of the note. Residential loans to be evaluated for impairment are generally identified through a review of loan delinquency reports, internally-developed risk classification
50
reports, and discussions with the Bank’s loan collectors. Commercial loans evaluated for impairment are generally identified through a review of loan delinquency reports, internally-developed risk classification reports, discussions with loan officers, discussions with borrowers, periodic individual loan reviews and local media reports indicating problems with a particular project or borrower. Commercial loans are individually reviewed and assigned a credit risk rating periodically by the internal loan committee. See discussion of credit quality below.
The following is a summary of impaired loans and other related information as of September 30, 2011. The recorded investments and unpaid principal balances have been reduced by all partial charge-offs of the related loans to the allowance for loan losses. The recorded investment of certain loan classes exceeds the unpaid principal balance of such classes at September 30, 2011 as the result of the deferral and capitalization of certain direct loan origination costs, net of any origination fees collected, under ASC 310-20-30. All impaired loans at September 30, 2011 were on non-accrual status.
| | | | | | | | Year Ended | |
| | At September 30, 2011 | | September 30, 2011 | |
| | | | Unpaid | | | | Average | | Interest | |
| | Recorded | | Principal | | Related | | Recorded | | Income | |
| | Investment | | Balance | | Allowance | | Investment | | Recognized | |
| | at End of | | at End of | | at End of | | During | | During | |
| | Period | | Period | | Period | | Period | | Period | |
With no related allowance recorded: | | | | | | | | | | | |
Residential real estate first mortgage | | $ | 15,617,508 | | $ | 15,548,383 | | $ | — | | $ | 20,289,448 | | $ | 420,013 | |
Residential real estate second mortgage | | 1,714,029 | | 1,709,488 | | — | | 2,272,999 | | 81,122 | |
Home equity lines of credit | | 2,055,369 | | 2,055,369 | | — | | 2,128,477 | | 107,246 | |
Land acquisition and development | | 64,856 | | 64,856 | | — | | 2,675,169 | | 962 | |
Real estate construction & development | | 1,745,879 | | 1,745,275 | | — | | 2,824,643 | | 13,366 | |
Commercial & multi-family real estate | | 5,324,044 | | 5,320,630 | | — | | 4,826,283 | | 199,065 | |
Commercial & industrial | | 467,448 | | 467,604 | | — | | 535,836 | | 64,682 | |
Consumer and other | | 11,770 | | 11,754 | | — | | 19,314 | | 22,192 | |
Total | | $ | 27,000,903 | | $ | 26,923,359 | | $ | — | | | | | |
| | | | | | | | | | | |
With an allowance recorded: | | | | | | | | | | | |
Residential real estate first mortgage | | $ | 14,673,518 | | $ | 14,605,368 | | $ | 3,175,977 | | $ | 12,500,659 | | $ | 641,798 | |
Residential real estate second mortgage | | 1,787,617 | | 1,780,640 | | 1,133,592 | | 1,408,422 | | 68,077 | |
Home equity lines of credit | | 4,275,455 | | 4,275,455 | | 2,513,666 | | 3,307,957 | | 56,386 | |
Land acquisition and development | | 285,353 | | 285,254 | | 84,754 | | 2,216,196 | | 5,159 | |
Real estate construction & development | | 699,392 | | 697,968 | | 157,783 | | 435,306 | | 5,644 | |
Commercial & multi-family real estate | | 3,647,191 | | 3,638,111 | | 1,229,855 | | 4,928,413 | | 242,713 | |
Commercial & industrial | | 722,620 | | 719,457 | | 288,909 | | 1,039,663 | | 29,661 | |
Consumer and other | | 457,698 | | 455,350 | | 391,497 | | 413,568 | | 2,024 | |
Total | | $ | 26,548,844 | | $ | 26,457,603 | | $ | 8,976,033 | | | | | |
| | | | | | | | | | | |
Total: | | | | | | | | | | | |
Residential real estate first mortgage | | $ | 30,291,026 | | $ | 30,153,751 | | $ | 3,175,977 | | $ | 32,790,107 | | $ | 1,061,811 | |
Residential real estate second mortgage | | 3,501,646 | | 3,490,128 | | 1,133,592 | | 3,681,421 | | 149,199 | |
Home equity lines of credit | | 6,330,824 | | 6,330,824 | | 2,513,666 | | 5,436,434 | | 163,632 | |
Land acquisition and development | | 350,209 | | 350,110 | | 84,754 | | 4,891,365 | | 6,121 | |
Real estate construction & development | | 2,445,271 | | 2,443,243 | | 157,783 | | 3,259,949 | | 19,010 | |
Commercial & multi-family real estate | | 8,971,235 | | 8,958,741 | | 1,229,855 | | 9,754,696 | | 441,778 | |
Commercial & industrial | | 1,190,068 | | 1,187,061 | | 288,909 | | 1,575,499 | | 94,343 | |
Consumer and other | | 469,468 | | 467,104 | | 391,497 | | 432,882 | | 24,216 | |
Total | | $ | 53,549,747 | | $ | 53,380,962 | | $ | 8,976,033 | | | | | |
51
The following is a summary of impaired loans at September 30, 2010:
| | 2010 | |
Balance of impaired loans with specific allowance | | $ | 26,123,763 | |
Balance of impaired loans with no specific allowance | | 33,438,372 | |
Total impaired loans | | $ | 59,562,135 | |
| | | |
Specific loan loss allowance on impaired loans | | $ | 8,375,959 | |
The average balance of impaired loans during the years ended September 30, 2010 and 2009 was $62.3 million and $37.8 million. Interest income recognized on impaired loans during the years ended September 30, 2010 and 2009 was $2.6 million and $2.3 million. All impaired loans at September 30, 2010 were on non-accrual status.
Delinquent and Non-Accrual Loans
The delinquency status of loans is determined based on the contractual terms of the notes. Borrowers are generally classified as delinquent once payments become 30 days or more past due. The Company’s policy is to discontinue the accrual of interest income on any loan when, in the opinion of management, the ultimate collectibility of interest or principal is no longer probable. Management considers many factors before placing a loan on non-accrual, including the delinquency status of the loan, the overall financial condition of the borrower, the progress of management’s collection efforts and the value of the underlying collateral. Previously accrued but unpaid interest is charged to current income at the time a loan is placed on non-accrual status. Subsequent collections of cash may be applied as reductions to the principal balance, interest in arrears, or recorded as income depending on management’s assessment of the ultimate collectibility of the loan. Non-accrual loans are returned to accrual status when, in the opinion of management, the financial position of the borrower indicates that the timely collectibility of interest and principal is probable and the borrower demonstrates the ability to pay under the terms of the note through a sustained period of repayment performance, which is generally six months. Prior to returning a loan to accrual status, the loan is individually reviewed. Many factors are considered prior to returning a loan to accrual status, including a positive change in the borrower’s financial situation or the Company’s collateral position that, together with the sustained period of repayment performance, result in the likelihood of a loss that is no longer probable.
The following is a summary of the recorded investment in loans receivable by class that were 30 days or more past due at September 30, 2011:
| | | | | | | | | | | | | | 90 Days | | | |
| | | | | | 90 Days | | | | | | Total | | or More | | | |
| | 30 to 59 Days | | 60 to 89 Days | | or More | | Total | | | | Loans | | And Still | | | |
| | Past Due | | Past Due | | Past Due | | Past Due | | Current | | Receivable | | Accruing | | Nonaccrual | |
Residential real estate first mortgage | | $ | 5,358,948 | | $ | 2,882,199 | | $ | 11,264,959 | | $ | 19,506,106 | | $ | 223,662,221 | | $ | 243,168,327 | | $ | — | | $ | 30,291,026 | |
Residential real estate second mortgage | | 794,911 | | 155,772 | | 820,556 | | 1,771,238 | | 49,986,363 | | 51,757,601 | | — | | 3,501,646 | |
Home equity lines of credit | | 2,960,623 | | 633,473 | | 3,948,135 | | 7,542,230 | | 169,844,628 | | 177,386,858 | | — | | 6,330,824 | |
Land acquisition and development | | 314,856 | | — | | 285,254 | | 600,110 | | 51,042,361 | | 51,642,471 | | — | | 350,209 | |
Real estate construction & development | | — | | — | | 904,773 | | 904,773 | | 21,387,494 | | 22,292,267 | | — | | 2,445,271 | |
Commercial & multi-family real estate | | 6,798,151 | | 3,469,293 | | 2,374,682 | | 12,642,126 | | 303,716,170 | | 316,358,296 | | — | | 8,971,235 | |
Commercial & industrial | | 396,634 | | — | | 271,829 | | 668,463 | | 180,588,313 | | 181,256,776 | | — | | 1,090,068 | |
Consumer and other | | 58,025 | | 74,252 | | 248,949 | | 381,228 | | 2,742,607 | | 3,123,835 | | — | | 469,468 | |
Total | | $ | 16,682,148 | | $ | 7,214,989 | | $ | 20,119,137 | | $ | 44,016,274 | | $ | 1,002,970,157 | | $ | 1,046,986,431 | | $ | — | | $ | 53,449,747 | |
Credit Quality
The credit quality of the Company’s residential and consumer loans is primarily monitored on the basis of aging and delinquency, as summarized in the table above. The credit quality of the Company’s commercial loans is primarily monitored using an internal rating system reflecting management’s risk assessment based on an analysis of several factors including the borrower’s financial condition, the financial condition of the underlying business, cash flows of the underlying collateral and the delinquency status of the loan. The internal system assigns one of the following five risk gradings. The “pass” category consists of a range of loan sub-grades that reflect various levels of acceptable risk. Movement of risk through the various sub-grade levels in the “pass” category is monitored for early identification of
52
credit deterioration. The “special mention” rating is considered a “watch” rating rather than an “adverse” rating and is assigned to loans where the borrower exhibits negative financial trends due to borrower specific or systemic conditions that, if left uncorrected, threaten the borrower’s capacity to meet its debt obligations. The borrower is believed to have sufficient financial flexibility to react to and resolve its negative financial situation. This is a transitional grade that is closely monitored for improvement or deterioration. The “substandard” rating is assigned to loans where the borrower exhibits well-defined weaknesses that jeopardize its continued performance and are of a severity that the distinct possibility of default exists. The “doubtful” rating is assigned to loans that have the weaknesses of substandard assets with the additional characteristic that the weaknesses make collection or liquidation in full, on the basis of currently existing facts, conditions and values, questionable resulting in a high probability of loss. An asset classified as “loss” is considered uncollectible and of such little value that charge-off is generally warranted. In limited circumstances, the Company might establish a specific allowance on assets classified as loss if a charge off is not yet warranted because circumstances are changing and the exact amount of the loss cannot be determined.
The following is a summary of the recorded investment of loan risk ratings by class at September 30, 2011.
| | | | Special | | | | | | | |
| | Pass | | Mention | | Substandard | | Doubtful | | Loss | |
Residential real estate first mortgage | | $ | 203,690,460 | | $ | 2,390,396 | | $ | 36,571,024 | | $ | 516,447 | | $ | — | |
Residential real estate second mortgage | | 47,604,902 | | 101,212 | | 3,932,222 | | 119,265 | | — | |
Home equity lines of credit | | 169,988,030 | | 99,267 | | 6,000,449 | | 1,299,112 | | — | |
Land acquisition and development | | 48,284,733 | | — | | 3,357,738 | | — | | — | |
Real estate construction & development | | 19,717,698 | | — | | 2,574,569 | | — | | — | |
Commercial & multi-family real estate | | 264,896,753 | | 12,549,086 | | 38,707,248 | | 205,209 | | — | |
Commercial & industrial | | 162,411,843 | | 10,499,378 | | 8,044,643 | | 300,912 | | — | |
Consumer and other | | 2,654,369 | | — | | 290,168 | | 179,298 | | — | |
Total | | 919,248,788 | | 25,639,339 | | 99,478,061 | | 2,620,243 | | — | |
Less related specific allowance | | — | | — | | (7,565,115 | ) | (1,410,918 | ) | | |
Total net of allowance | | $ | 919,248,788 | | $ | 25,639,339 | | $ | 91,912,946 | | $ | 1,209,325 | | $ | — | |
Troubled Debt Restructurings
A loan is classified as a troubled debt restructuring if the Company, for economic or legal reasons related to the borrower’s financial difficulties, grants a concession to the borrower that it would not otherwise consider. Such concessions related to residential mortgage and consumer loans usually include a modification of loan terms, such as a reduction of the rate to below-market terms, adding past-due interest to the loan balance or extending the maturity date. Such concessions related to commercial loans usually include a modification of loan terms, such as a reduction of the rate to below-market terms, adding past-due interest to the loan balance or extending the maturity date, and, to a much lesser extent, a partial forgiveness of debt. In addition, because of their short term nature, a commercial loan could be classified as a troubled debt restructuring if the loan matures, the borrower is considered troubled and the scheduled renewal rate on the loan is determined to be less than a risk-adjusted market interest rate on a similar credit. A loan classified as a troubled debt restructuring will generally retain such classification until the loan is paid in full. However, a restructured loan that is in compliance with its modified terms and yields a market rate of interest at the time of restructuring is removed from the troubled debt restructuring classification once the borrower demonstrates the ability to pay under the terms of the restructured note through a sustained period of repayment performance, which is generally one year. Interest income on restructured loans is accrued at the reduced rate and the loan is returned to performing status once the borrower demonstrates the ability to pay under the terms of the restructured note through a sustained period of repayment performance, which is generally six months.
Accruing loans that were restructured within the years ended September 30, 2011, 2010 and 2009 and restructured loans that defaulted during the years ended September 30, 2011, 2010 and 2009 are presented within the table below. The Company considers a loan to have defaulted when it becomes 90 or more days delinquent under the modified terms, has been transferred to non-accrual status, has been charged off or has been acquired through or in lieu of foreclosure.
53
| | Total Restructured During | | Defaulted During | |
| | Year Ended September 30, | | Year Ended September 30, | |
| | 2011 | | 2010 | | 2009 | | 2011 | | 2010 | | 2009 | |
Residential mortgage loans | | $ | 11,916,113 | | $ | 18,686,051 | | $ | 22,330,745 | | $ | 12,931,213 | | $ | 3,121,377 | | $ | 995,587 | |
Commercial loans | | 7,806,257 | | 5,130,463 | | 8,953,328 | | 650,959 | | 7,926,935 | | — | |
Consumer loans | | — | | — | | — | | — | | — | | — | |
Total | | $ | 19,722,370 | | $ | 23,816,514 | | $ | 31,284,073 | | $ | 13,582,172 | | $ | 11,048,312 | | $ | 995,587 | |
The amount of additional funds committed to borrowers (undisbursed) who were included in troubled debt restructured status at September 30, 2011 and 2010 was $134,000 and $134,000, respectively.
The financial impact of troubled debt restructurings can include loss of interest due to reductions in interest rates and partial or total forgiveness of accrued interest and increases in the provision for losses. The gross amount of interest that would have been recognized under the original terms of renegotiated loans was $3.1 million for the year ended September 30, 2011. The actual amount of interest income recognized under the restructured terms totaled $2.9 million for the year ended September 30, 2011. Provisions for losses related to restructured loans totaled $6.1 million during the year ended September 30, 2011.
Included in impaired loans at September 30, 2011 and 2010 were $38.3 million and $33.1 million, respectively, of loans that were modified and are classified as troubled debt restructurings because of the borrowers’ financial difficulties. The restructured terms of the loans generally included a reduction of the interest rates and the addition of past due interest to the principal balance of the loans, or the scheduled renewal rates of the loans at maturity were determined to be less than risk-adjusted market interests rate on similar credits. At September 30, 2011, $24.5 million, or 63.8%, of these loans were performing as agreed under the modified terms of the loans compared with $24.7 million, or 74.7%, at September 30, 2010. Excluded from non-performing assets at September 30, 2011 and 2010 were $12.1 million and $9.9 million, respectively, of loans that were modified in troubled debt restructurings but were no longer classified as non-performing because of the borrowers’ favorable performance histories. Specific loan loss allowances related to troubled debt restructurings at September 30, 2011 and 2010 were $4.2 million and $1.5 million, respectively.
6. REAL ESTATE ACQUIRED IN SETTLEMENT OF LOANS
Real estate acquired in settlement of loans at September 30, 2011 and 2010 is summarized as follows:
| | 2011 | | 2010 | |
| | | | | |
Residential real estate | | $ | 3,231,813 | | $ | 3,857,898 | |
Commercial real estate | | 18,001,801 | | 12,693,514 | |
| | 21,233,614 | | 16,551,412 | |
Less allowance for losses | | (2,515,800 | ) | (1,651,100 | ) |
Total | | $ | 18,717,814 | | $ | 14,900,312 | |
Activity in the allowance for losses on real estate acquired in settlement of loans for the years ended
September 30, 2011, 2010 and 2009 is summarized as follows:
54
| | 2011 | | 2010 | | 2009 | |
| | | | | | | |
Balance, beginning of year | | $ | 1,651,100 | | $ | 274,076 | | $ | 417,773 | |
Provision charged to non-interest expense | | 2,118,500 | | 2,181,900 | | 758,602 | |
Charge-offs | | (1,253,800 | ) | (804,876 | ) | (902,299 | ) |
Balance, end of year | | $ | 2,515,800 | | $ | 1,651,100 | | $ | 274,076 | |
7. PREMISES AND EQUIPMENT
Premises and equipment at September 30, 2011 and 2010 are summarized as follows:
| | 2011 | | 2010 | |
| | | | | |
Land | | $ | 5,609,693 | | $ | 5,609,693 | |
Office buildings and improvements | | 15,737,264 | | 15,426,039 | |
Furniture and equipment | | 11,451,292 | | 11,547,579 | |
| | 32,798,249 | | 32,583,311 | |
Less accumulated depreciation | | (14,340,083 | ) | (13,819,213 | ) |
| | | | | |
Total | | $ | 18,458,166 | | $ | 18,764,098 | |
Depreciation expense on premises and equipment totaled $2.0 million, $1.9 million and $1.9 million for the years ended September 30, 2011, 2010 and 2009, respectively.
Certain facilities of the Company are leased under various operating leases. Amounts paid for rent expense for the fiscal years ended September 30, 2011, 2010 and 2009 were approximately $849,000, $690,000 and $689,000, respectively. At September 30, 2011, future minimum rental commitments under non-cancelable leases are as follows:
Due in years ending September 30, | | | |
2012 | | $ | 784,772 | |
2013 | | 766,375 | |
2014 | | 547,482 | |
2015 | | 505,821 | |
2016 | | 546,346 | |
Thereafter | | 1,076,536 | |
Total | | $ | 4,227,332 | |
55
8. DEPOSITS
Deposits at September 30, 2011 and 2010 are summarized as follows:
| | 2011 | | 2010 | |
| | | | Weighted | | | | Weighted | |
| | | | Average | | | | Average | |
| | | | Interest | | | | Interest | |
| | Amount | | Rate | | Amount | | Rate | |
Transaction accounts: | | | | | | | | | |
Non-interest-bearing checking | | $ | 150,430,677 | | — | % | $ | 149,186,009 | | — | % |
Interest-bearing checking | | 328,274,827 | | 0.28 | | 345,012,929 | | 0.90 | |
Savings accounts | | 35,713,661 | | 0.14 | | 30,296,199 | | 0.18 | |
Money market | | 183,873,574 | | 0.33 | | 189,851,005 | | 0.52 | |
| | | | | | | | | |
Total transaction accounts | | 698,292,739 | | 0.22 | | 714,346,142 | | 0.58 | |
| | | | | | | | | |
Certificates of deposit: | | | | | | | | | |
0.00% to 0.99% | | 142,890,688 | | 0.48 | | 119,274,303 | | 0.61 | |
1.00% to 1.99% | | 203,692,301 | | 1.53 | | 95,540,118 | | 1.56 | |
2.00% to 2.99% | | 27,191,874 | | 2.46 | | 89,282,166 | | 2.70 | |
3.00% to 3.99% | | 40,107,262 | | 3.20 | | 80,637,382 | | 3.35 | |
4.00% to 4.99% | | 1,864,014 | | 4.22 | | 7,581,100 | | 4.14 | |
5.00% to 5.99% | | 8,486,035 | | 5.23 | | 8,541,909 | | 5.23 | |
| | | | | | | | | |
Total certificates of deposit | | 424,232,174 | | 1.48 | | 400,856,978 | | 2.02 | |
| | | | | | | | | |
Total | | $ | 1,122,524,913 | | 0.70 | % | $ | 1,115,203,120 | | 1.09 | % |
The aggregate amounts of certificates of deposit with a minimum principal amount of $100,000 were $226.2 million and $218.8 million at September 30, 2011 and 2010, respectively. Certificates of deposit at September 30, 2011 and 2010 include time deposits obtained from national brokers totaling $8.4 million with weighted-average interest rates of 5.23%.
56
At September 30, 2011, the scheduled maturities of certificates of deposit were as follows:
Maturing within: | | | |
Three months ending: | | | |
December 31, 2011 | | $ | 121,695,708 | |
March 31, 2012 | | 65,593,350 | |
June 30, 2012 | | 41,680,920 | |
September 30, 2012 | | 48,651,408 | |
Year ending: | | | |
September 30, 2013 | | 128,721,920 | |
September 30, 2014 | | 15,516,792 | |
September 30, 2015 | | 832,616 | |
September 30, 2016 | | 1,539,460 | |
Thereafter | | — | |
Total | | $ | 424,232,174 | |
A summary of interest expense on deposits for the years ended September 30, 2011, 2010 and 2009 is as follows:
| | 2011 | | 2010 | | 2009 | |
| | | | | | | |
Interest-bearing checking | | $ | 2,563,968 | | $ | 3,667,002 | | $ | 3,504,122 | |
Savings | | 58,269 | | 59,133 | | 55,804 | |
Money market | | 1,342,532 | | 2,146,037 | | 1,676,266 | |
Certificates of deposit | | 7,409,683 | | 10,262,192 | | 16,279,392 | |
| | | | | | | |
Total | | $ | 11,374,452 | | $ | 16,134,364 | | $ | 21,515,584 | |
9. ADVANCES FROM THE FEDERAL HOME LOAN BANK
Advances from the Federal Home Loan Bank of Des Moines at September 30, 2011 and 2010 are summarized as follows:
| | 2011 | | 2010 | |
| | | | Weighted | | | | Weighted | |
| | | | Average | | | | Average | |
| | | | Interest | | | | Interest | |
| | Amount | | Rate | | Amount | | Rate | |
Maturing within the year ending September 30, | | | | | | | | | |
2010 (Overnight) | | $ | — | | — | % | $ | 152,000,000 | | 0.27 | % |
2015 | | 25,000,000 | | 2.70 | | 25,000,000 | | 2.70 | |
Thereafter | | 4,000,000 | | 5.48 | | 4,000,000 | | 5.48 | |
Total | | $ | 29,000,000 | | 3.08 | % | $ | 181,000,000 | | 0.72 | % |
The average balances of advances from the Federal Home Loan Bank were $81.4 million and $96.9 million, respectively, and the maximum month-end balances were $257.5 million and $181.0 million, respectively, for the years ended September 30, 2011 and 2010. The average rates paid during the years ended September 30, 2011 and 2010 were 1.32% and 1.80%, respectively.
The Bank has the ability to borrow funds from the Federal Home Loan Bank equal to 35% of the Bank’s total assets under a blanket agreement that assigns all investments in Federal Home Loan Bank stock as well as qualifying first mortgage loans as collateral to secure the amounts borrowed. In addition to the $29.0 million in advances outstanding at September 30, 2011, the Bank had approximately $206.6 million in additional borrowing capacity available to it
57
under this arrangement. The assets underlying the Federal Home Loan Bank borrowings are under the Bank’s physical control.
10. BORROWINGS FROM THE FEDERAL RESERVE BANK
Borrowings from the Federal Reserve Bank represent short-term borrowings from the discount window at the Federal Reserve Bank of St. Louis and are typically extended for periods of 28 days or less. There were no such borrowings outstanding during the year ended September 30, 2011 or at September 30, 2010.. The average balance of these borrowings was $82,000 and the maximum month-end balance was $4.7 million for the year ended September 30, 2010. The average rate paid during the year ended September 30, 2010 was 0.59%.
The Bank has the ability to borrow funds from the Federal Reserve under an agreement that assigns certain qualifying loans as collateral to secure the amounts borrowed. At September 30, 2011, $154.1 million of commercial loans were assigned under this arrangement. The assets underlying these borrowings are under the Bank’s physical control. As of September 30, 2011, the Bank had approximately $94.0 million in additional borrowing capacity available to it under this arrangement.
11. SUBORDINATED DEBENTURES
On March 30, 2004, Pulaski Financial Statutory Trust I (“Trust I”), a Connecticut statutory trust, issued $9.0 million of adjustable-rate preferred securities. The proceeds from this issuance, along with the Company’s $279,000 capital contribution for Trust I’s common securities, were used to acquire $9.3 million aggregate principal amount of the Company’s floating rate junior subordinated deferrable interest debentures due in 2034, which constitute the sole asset of Trust I. The interest rate on the debentures and the capital securities at September 30, 2011 was 3.05% and is adjustable quarterly at 2.70% over the three-month LIBOR.
The stated maturity of the Trust I debenture is June 17, 2034. In addition, the Trust I debentures are subject to redemption at par at the option of the Company, subject to prior regulatory approval, in whole or in part on any interest payment date.
On December 15, 2004, Pulaski Financial Statutory Trust II (“Trust II”), a Delaware statutory trust, issued $10.0 million of adjustable-rate preferred securities. The proceeds from this issuance, along with the Company’s $310,000 capital contribution for Trust II’s common securities, were used to acquire $10.3 million of the Company’s floating rate junior subordinated deferrable interest debentures due in 2034, which constitute the sole asset of Trust II. The interest rate on the debentures and the capital securities at September 30, 2011 was 2.21% and is adjustable quarterly at 1.86% over the three-month LIBOR.
The stated maturity of the debentures held by Trust II is December 15, 2034. In addition, the Trust II debentures are subject to redemption at par at the option of the Company, subject to prior regulatory approval, in whole or in part on any interest payment date.
12. LIABILITY FOR LOANS SOLD
The Company records an estimated liability for amounts potentially due to the Company’s loan investors under contractual obligations related to residential mortgage loans originated for sale that were previously sold and became delinquent or defaulted. Under standard representations and warranties and early payment default clauses in the Company’s mortgage sale agreements, the Company may be required to repurchase mortgage loans sold to investors or reimburse the investors for credit losses incurred on loans (collectively “repurchase”) in the event of borrower default within a defined period after origination (generally 90 days), or in the event of breaches of contractual representations or warranties made at the time of sale that are not remedied within a defined period after the Company receives notice of such breaches (generally 90 days). The Company establishes a mortgage repurchase liability related to these events that reflect management’s estimate of losses on loans for which the Company could have a repurchase obligation based on a combination of factors. Such factors incorporate the volume of loans sold in previous periods, default expectations, historical investor repurchase demand and appeals success rates (where the
58
investor rescinds the demand based on a cure of the defect or acknowledges that the loan satisfies the investor’s applicable representations and warranties), and estimated loss severity.
The principal balance of loans sold that remain subject to recourse provisions related to early payment default clauses totaled approximately $266 million and $367 million at September 30, 2011 and 2010, respectively. Because the Company does not service the loans that it sells to its investors, the Company is generally unable to track the outstanding balances or delinquency status of a large portion of such loans that may be subject to repurchase under the representations and warranties clauses in the Company’s mortgage sale agreements. The following is a summary of the principal balance of mortgage loan repurchase demands on loans previously sold that were received and resolved during the years ended September 30, 2011 and 2010:
| | 2011 | | 2010 | |
Received during period | | $ | 16,700,000 | | $ | 12,797,000 | |
Resolved during period | | 15,061,000 | | 6,629,000 | |
Unresolved at end of period | | 8,655,000 | | 7,016,000 | |
| | | | | | | |
The following is a summary of the changes in the mortgage loan repurchase reserve during the years ended September 30, 2011 and 2010:
| | 2011 | | 2010 | |
Balance at beginning of period | | $ | 470,983 | | $ | 250,337 | |
Provisions charged to expense | | 1,650,406 | | 654,543 | |
Amounts paid to resolve demands | | (864,243 | ) | (433,897 | ) |
Balance at end of period | | $ | 1,257,146 | | $ | 470,983 | |
The mortgage repurchase reserve of $1.3 million at September 30, 2011 represents the Company’s best estimate of the probable loss that the Company will incur for various early default provisions and contractual representations and warranties associated with the sales of mortgage loans. Because the level of mortgage loan repurchase losses depends upon economic factors, investor demand strategies and other external conditions that may change over the life of the underlying loans, the level of the liability for mortgage loan repurchase losses is difficult to estimate and requires considerable management judgment. In addition, the Company does not service the loans that it sells to investors and is unable to track the remaining unpaid balances after sale. As a result, there may be a range of possible losses in excess of the estimated liability that cannot be estimated. Management maintains regular contact with the Company’s investors to monitor and address their repurchase demand practices and concerns.
13. INCOME TAXES
Income tax expense for the years ended September 30, 2011, 2010 and 2009 is summarized as follows:
| | 2011 | | 2010 | | 2009 | |
Current expense: | | | | | | | |
Federal | | $ | 2,387,642 | | $ | 4,102,344 | | $ | 2,631,738 | |
State | | 377,500 | | 18,100 | | 231,600 | |
Deferred expense (benefit) | | 384,665 | | (3,861,067 | ) | (1,233,593 | ) |
Total | | $ | 3,149,807 | | $ | 259,377 | | $ | 1,629,745 | |
Income tax expense for the years ended September 30, 2011, 2010 and 2009 differs from that computed at the federal statutory rate of 34% as follows:
59
| | 2011 | | 2010 | | 2009 | |
| | Amount | | % | | Amount | | % | | Amount | | % | |
Tax at statutory federal income tax rate | | $ | 3,812,959 | | 34.0 | % | $ | 1,207,736 | | 34.0 | % | $ | 2,280,280 | | 34.0 | % |
Non-taxable income from bank-owned life insurance | | (364,357 | ) | (3.3 | ) | (371,331 | ) | (10.4 | ) | (369,476 | ) | (5.5 | ) |
Non-taxable interest and dividends | | (487,417 | ) | (4.3 | ) | (440,263 | ) | (12.4 | ) | (305,539 | ) | (4.6 | ) |
State taxes, net of federal benefit | | 249,150 | | 2.2 | | 11,946 | | 0.3 | | 152,856 | | 2.3 | |
Other, net | | (60,528 | ) | (0.5 | ) | (148,711 | ) | (4.2 | ) | (128,376 | ) | (1.9 | ) |
Total | | $ | 3,149,807 | | 28.1 | % | $ | 259,377 | | 7.3 | % | $ | 1,629,745 | | 24.3 | % |
The components of deferred tax assets and liabilities are as follows:
| | 2011 | | 2010 | |
Deferred tax assets: | | | | | |
Allowance for loan losses | | $ | 10,661,185 | | $ | 10,824,802 | |
Restricted stock awards | | 341,262 | | 85,944 | |
Non-accrual interest | | 328,138 | | — | |
Deferred compensation | | 1,894,867 | | 1,912,158 | |
Equity investments | | 129,692 | | 122,666 | |
Other | | 402,482 | | 740,945 | |
Total deferred tax assets | | 13,757,626 | | 13,686,515 | |
| | | | | |
Deferred tax liabilities: | | | | | |
FHLB stock dividends | | 152,311 | | 152,311 | |
Core deposit intangible | | 30,185 | | 56,241 | |
Premises and equipment | | 777,827 | | 266,015 | |
Unrealized losses on securities available for sale | | 190 | | 23,188 | |
Other | | 24,477 | | 31,460 | |
Total deferred tax liabilities | | 984,990 | | 529,215 | |
| | | | | |
Net deferred tax assets | | $ | 12,772,636 | | $ | 13,157,300 | |
At September 30, 2011, the Company had $137,000 of unrecognized tax benefits, $129,000 of which would affect the effective tax rate if recognized. The Company recognizes interest related to uncertain tax positions in income tax expense and classifies such interest and penalties in the liability for unrecognized tax benefits. As of September 30, 2011, the Company had approximately $8,000 accrued for the payment of interest and penalties. The tax years ended September 30, 2008 through 2011 remain open to examination by the taxing jurisdictions to which the Company is subject.
The aggregate changes in the balance of gross unrecognized tax benefits, which excludes interest and penalties, for the year ended September 30, 2011 are as follows:
60
Balance at September 30, 2010 | | $ | 129,000 | |
Increases related to tax positions taken during a prior period | | — | |
Decreases related to tax positions taken during a prior period | | — | |
Increases related to tax positions taken during the current period | | — | |
Decreases related to tax positions taken during the current period | | — | |
Decreases related to settlements with taxing authorities | | — | |
Decreases related to the expiration of the statute of limitations | | — | |
Balance at September 30, 2011 | | $ | 129,000 | |
Retained earnings at September 30, 2011 included earnings of approximately $4.1 million representing tax bad debt deductions, net of actual bad debts and bad debt recoveries, for which no provision for federal income taxes has been made. If these amounts are used for any purpose other than to absorb loan losses, they will be subject to federal income taxes at the then prevailing corporate rate.
A valuation allowance should be provided on deferred tax assets when it is more likely than not that some portion of the assets will not be realized. The Company has not established a valuation allowance at September 30, 2011 or 2010 because management believes that all criteria for recognition have been met, including the existence of a history of taxes paid or qualifying tax planning strategies that are sufficient to support the realization of deferred tax assets.
14. STOCKHOLDERS’ EQUITY
On January 16, 2009, as part of the U.S. Department of Treasury’s Capital Purchase Program, the Company issued 32,538 shares of Fixed Rate Cumulative Perpetual Preferred Stock, Series A, $1,000 per share liquidation preference, and a warrant to purchase up to 778,421 shares of the Company’s common stock for a period of ten years at an exercise price of $6.27 per share in exchange for $32.5 million in cash from the U.S. Department of Treasury. The proceeds, net of issuance costs consisting primarily of legal fees, were allocated between the preferred stock and the warrant on a pro rata basis, based upon the estimated market values of the preferred stock and the warrants. As a result, $2.2 million of the proceeds were allocated to the warrant, which increased additional paid-in capital from common stock. The amount allocated to the warrant is considered a discount on the preferred stock and will be amortized using the level yield method over a five-year period through a charge to retained earnings. Such amortization will not reduce net income, but will reduce income available for common shares.
The fair value of the preferred stock was estimated on the date of issuance by computing the present value of expected future cash flows using a risk-adjusted rate of return for similar securities of 12%. The fair value of the warrant was estimated on the date of grant using the Black-Scholes option pricing model assuming a risk-free interest rate of 4.30%, expected volatility of 35.53% and a dividend yield of 4.50%.
The preferred stock pays cumulative dividends of 5% per year for the first five years and 9% per year thereafter. The Company may, at its option, redeem the preferred stock at its liquidation preference plus accrued and unpaid dividends. The securities purchase agreement between the Company and the U.S. Treasury limits, for three years, the rate of dividend payments on the Company’s common stock to the amount of its last quarterly cash dividend prior to participation in the program of $0.095 per share unless an increase is approved by the Treasury, limits the Company’s ability to repurchase its common stock for three years, and subjects the Company to certain executive compensation limitations included in the Emergency Economic Stabilization Act of 2008, as amended by the American Recovery and Reinvestment Act of 2009.
The Company paid quarterly cash dividends on common stock of $0.095 per share for each of the quarters in the years ended September 30, 2011 and 2010.
61
15. REGULATORY CAPITAL REQUIREMENTS
The Company is not subject to any separate capital requirements from those of the Bank. The Bank is subject to various regulatory capital requirements administered by the federal banking agencies. Failure to meet minimum capital requirements can initiate certain mandatory and possibly additional discretionary actions by regulators which, if undertaken, could have a direct material effect on the Company’s financial statements. Under capital adequacy guidelines and the regulatory framework for prompt corrective action, the Bank must meet specific capital guidelines that involve quantitative measures of the Bank’s assets, liabilities, and certain off-balance-sheet items as calculated under regulatory accounting practices. The Bank’s capital amounts and classification are also subject to qualitative judgments by the regulators about components, risk weightings, and other factors.
Quantitative measures that have been established by regulation to ensure capital adequacy require the Bank to maintain minimum capital amounts and ratios (set forth in the table below). Under such regulations, the Bank is required to maintain minimum ratios of tangible capital of 1.5%, core capital of 4.0% and total risk-based capital of 8.0%. The Bank is also subject to prompt corrective action capital requirement regulations set forth by federal regulations. As defined in the regulations, the Bank is required to maintain minimum total and Tier I capital to risk-weighted assets and Tier I capital to average assets. The Bank met all capital adequacy requirements to which it was subject at September 30, 2011.
As of September 30, 2011, the most recent notification from the Bank’s primary regulator, Office of the Comptroller of the Currency (“OCC”), categorized the Bank as “well capitalized” under the regulatory framework for prompt corrective action. To be categorized as “well capitalized,” the Bank must maintain minimum total risk-based, Tier I risk-based and Tier I leverage ratios as set forth in the following table. There are no conditions or events since that notification that management believes have changed the Bank’s category.
62
| | | | | | | | | | To be Categorized as | |
| | | | | | | | | | “Well Capitalized” | |
| | | | | | | | | | under Prompt | |
| | | | | | For Capital | | Corrective Action | |
| | Actual | | Adequacy Purposes | | Provisions | |
| | Amount | | Ratio | | Amount | | Ratio | | Amount | | Ratio | |
| | | | | | (Dollars in thousands) | | | | | |
As of September 30, 2011: | | | | | | | | | | | | | |
Tangible capital (to total assets) | | $ | 132,729 | | 10.18 | % | $ | 19,563 | | 1.50 | % | N/A | | N/A | |
Total risk-based capital (to risk- weighted assets) | | 146,214 | | 13.59 | % | 86,046 | | 8.00 | % | $ | 107,558 | | 10.00 | % |
Tier I risk-based capital (to risk- weighted assets) | | 132,729 | | 12.34 | % | N/A | | N/A | | 64,535 | | 6.00 | % |
Tier I leverage capital (to average assets) | | 132,729 | | 10.18 | % | 52,169 | | 4.00 | % | 65,211 | | 5.00 | % |
| | | | | | | | | | | | | |
As of September 30, 2010: | | | | | | | | | | | | | |
Tangible capital (to total assets) | | $ | 130,571 | | 9.02 | % | $ | 21,725 | | 1.50 | % | N/A | | N/A | |
Total risk-based capital (to risk- weighted assets) | | 145,282 | | 12.39 | % | 93,838 | | 8.00 | % | $ | 117,298 | | 10.00 | % |
Tier I risk-based capital (to risk- weighted assets) | | 130,571 | | 11.13 | % | N/A | | N/A | | 70,379 | | 6.00 | % |
Tier I leverage capital (to average assets) | | 130,571 | | 9.02 | % | 57,933 | | 4.00 | % | 72,416 | | 5.00 | % |
A reconciliation of the Bank’s Tier I stockholders’ equity and regulatory risk-based capital at September 30, 2011 follows:
| | (in thousands) | |
Tier I stockholders’ equity | | $ | 136,799 | |
Deduct: | | | |
Intangible assets | | (4,018 | ) |
Disallowed servicing rights | | (52 | ) |
Add: | | | |
Unrealized gains on available-for-sale securities | | — | |
Tangible capital | | 132,729 | |
Add: | | | |
General valuation allowances | | 13,485 | |
Total risk-based capital | | $ | 146,214 | |
The Bank is prohibited from paying cash dividends if the effect thereof would be to reduce the regulatory capital of the Bank below the amount required for the liquidation account that the Bank established in connection with the consummation of the conversion from the mutual holding company structure on December 2, 1998. In addition, federal regulations, as currently applied to the Bank, impose limitations upon payment of capital distributions to the Company. Under the regulations, the prior approval of the OCC and the non-objection of the Company’s primary regulator, the Federal Reserve Bank, are required prior to any capital distribution. To the extent that any such capital distributions are not approved by the regulatory agencies in future periods, the Company could find it necessary to reduce or eliminate the payment of common dividends to its shareholders. In addition, the Company could find it necessary to temporarily suspend the payment of dividends on its preferred stock and interest on its subordinated debentures.
63
16. EMPLOYEE BENEFITS
The Company maintains shareholder-approved, stock-based incentive plans, which permit the granting of options to purchase common stock of the Company and awards of restricted shares of common stock. All employees, non-employee directors and consultants of the Company and its affiliates are eligible to receive awards under the plans. The plans authorize the granting of awards in the form of options intended to qualify as incentive stock options under Section 422 of the Internal Revenue Code, options that do not so qualify (non-statutory stock options) and granting of restricted shares of common stock. Stock option awards are generally granted with an exercise price equal to the market value of the Company’s shares at the date of grant and generally vest over a period of three to five years. Generally, option and share awards provide for accelerated vesting if there is a change in control (as defined in the plans). As a participant in the U.S. Department of Treasury’s Capital Purchase Program, certain employees are prohibited from receiving golden parachute payments while the Company has any outstanding funds related to the program. Under the Treasury’s guidelines, golden parachute payments are defined to include any payment due to a change in control of the Company, which includes the acceleration of vesting in stock-based incentive plans due to the departure or change in control. Accordingly, the affected employees have signed agreements to forfeit the right to accelerated vesting while any funds related to the Treasury’s program are outstanding. The exercise period for all stock options generally may not exceed 10 years from the date of grant. Shares used to satisfy stock awards and stock option exercises are generally issued from treasury stock. At September 30, 2011, the Company had 415,770 reserved but unissued shares that can be awarded in the form of stock options or restricted share awards.
Restricted Stock Awards - A summary of activity in the Company’s restricted stock awards as of and for the years ended September 30, 2011, 2010 and 2009 is as follows:
| | 2011 | | 2010 | | 2009 | |
| | | | Weighted | | | | Weighted | | | | Weighted | |
| | | | Average | | | | Average | | | | Average | |
| | | | Grant-Date | | | | Grant-Date | | | | Grant-Date | |
| | Number | | Fair Value | | Number | | Fair Value | | Number | | Fair Value | |
Nonvested at beginning of year | | 67,219 | | $ | 6.45 | | 24,477 | | $ | 4.88 | | 667 | | $ | 13.20 | |
Granted | | 67,248 | | 7.49 | | 49,012 | | 7.37 | | 24,327 | | 4.83 | |
Vested | | (12,996 | ) | 7.43 | | (5,658 | ) | 7.52 | | (517 | ) | 13.26 | |
Forfeited | | (6,393 | ) | 7.43 | | (612 | ) | 7.37 | | — | | — | |
Nonvested at end of year | | 115,078 | | $ | 6.89 | | 67,219 | | $ | 6.45 | | 24,477 | | $ | 4.88 | |
64
Stock Option Awards - A summary of activity in the Company’s stock option program as of and for the years ended September 30, 2011, 2010 and 2009 is as follows:
| | 2011 | | 2010 | | 2009 | |
| | | | | | | | Weighted | | | | | | | | | |
| | | | Weighted | | | | Average | | | | Weighted | | | | Weighted | |
| | | | Average | | Aggregate | | Remaining | | | | Average | | | | Average | |
| | | | Exercise | | Intrinsic | | Contractual | | | | Exercise | | | | Exercise | |
| | Number | | Price | | Value | | Life (years) | | Number | | Price | | Number | | Price | |
Outstanding at beginning of year | | 849,840 | | $ | 10.40 | | | | | | 930,306 | | $ | 9.82 | | 788,233 | | $ | 10.38 | |
Granted | | — | | — | | | | | | 16,000 | | 7.19 | | 201,100 | | 7.27 | |
Exercised | | (33,397 | ) | 5.81 | | | | | | (72,900 | ) | 2.70 | | (23,827 | ) | 4.45 | |
Forfeited | | (56,759 | ) | 10.96 | | | | | | (23,566 | ) | 9.23 | | (35,200 | ) | 11.53 | |
Outstanding at end of year | | 759,684 | | $ | 10.56 | | $ | 78,113 | | 5.2 | | 849,840 | | $ | 10.40 | | 930,306 | | $ | 9.82 | |
| | | | | | | | | | | | | | | | | |
Exercisable at end of year | | 604,387 | | $ | 10.65 | | $ | 73,872 | | 4.7 | | 558,093 | | $ | 10.50 | | 487,868 | | $ | 9.28 | |
The weighted-average fair value per share of options granted during the years ended September 30, 2010 and 2009 was $1.80 and $1.82, respectively. There were no options granted during the year ended September 30, 2011. Cash received from stock options exercised totaled $194,000, $197,000 and $161,000 during the years ended September 30, 2011, 2010 and 2009, respectively. The total intrinsic value of stock options exercised totaled $51,000, $298,000 and $669,000 during the years ended September 30, 2011, 2010 and 2009, respectively. Executive officers and directors exercised 19,522 options during the year ended September 30, 2011.
The following is a summary of the options outstanding at September 30, 2011:
| | | | | Outstanding | | Exercisable | |
| | | | | | | Weighted Average | | Weighted | | | | Weighted | |
Range of | | | | Remaining | | Average | | | | Average | |
Exercise Prices | | Number | | Contractual Life (yrs) | | Exercise Price | | Number | | Exercise Price | |
$5.13 | | - | $5.90 | | 54,075 | | 3.75 | | $ | 5.48 | | 51,074 | | $ | 5.48 | |
6.12 | | - | 6.69 | | 94,414 | | 5.53 | | 6.38 | | 78,314 | | 6.34 | |
7.00 | | - | 7.70 | | 108,500 | | 7.78 | | 7.64 | | 76,671 | | 7.67 | |
8.36 | | - | 9.76 | | 63,500 | | 5.78 | | 9.29 | | 51,333 | | 9.34 | |
10.01 | | - | 11.94 | | 158,357 | | 5.80 | | 11.12 | | 110,057 | | 11.13 | |
12.07 | | - | 13.77 | | 185,000 | | 3.76 | | 12.95 | | 144,600 | | 12.98 | |
13.99 | | - | 18.70 | | 95,838 | | 4.82 | | 16.13 | | 92,338 | | 16.17 | |
$5.13 | | - | $18.70 | | 759,684 | | 5.15 | | $ | 10.56 | | 604,387 | | $ | 10.65 | |
65
A summary of total stock-based compensation expense for the years ended September 30, 2011, 2010 and 2009 follows:
| | 2011 | | 2010 | | 2009 | |
Total expense: | | | | | | | |
Pre-tax | | $ | 590,458 | | $ | 555,086 | | $ | 491,000 | |
After-tax | | 366,084 | | 344,153 | | 304,500 | |
Earnings per share: | | | | | | | |
Basic | | $ | 0.03 | | $ | 0.03 | | $ | 0.03 | |
Diluted | | 0.03 | | 0.03 | | 0.03 | |
As of September 30, 2011, the total unrecognized compensation expense related to non-vested stock options and restricted stock awards was approximately $247,000 and $320,000, respectively, and the related weighted average period over which it is expected to be recognized is approximately 1.1 and 1.3 years, respectively.
There were no stock options granted during the twelve-month period ended September 30, 2011. The fair value of stock options granted in 2010 and 2009 was estimated on the date of grant using the Black-Scholes option pricing model with the following average assumptions:
| | 2010 | | 2009 | |
| | | | | |
Risk-free interest rate | | 2.53 | % | 4.30 | % |
Expected volatility | | 36.39 | % | 35.53 | % |
Expected life in years | | 5.6 | | 5.4 | |
Dividend yield | | 4.30 | % | 4.50 | % |
Expected forfeiture rate | | 3.32 | % | 3.37 | % |
Equity Trust Plan - The Company maintains an Equity Trust Plan for the benefit of key loan officers and sales staff. The plan is designed to recruit and retain top-performing loan officers and other key revenue-producing employees who are instrumental to the Company’s success. The plan allows the recipients to defer a percentage of commissions earned into a rabbi trust for the benefit of the participants. The assets of the trust are limited to shares of Company common stock and cash. Awards generally vest over a period of three to five years, and the participants will forgo any accrued but unvested benefits if they voluntarily leave the Company. At September 30, 2011, 59,124 shares had been purchased on behalf of the participants at an average price of $7.35. Shares distributed to participants during the fiscal year were 75,391 with a market value at the time of distribution totaling $683,000, and 13,499 shares were withheld by the Company in order for the distribution recipients to meet their tax obligations. Vested shares in the plan are treated as issued and outstanding when computing basic and diluted earnings per share, whereas unvested shares are treated as issued and outstanding only when computing diluted earnings per share.
KSOP — Effective September 1, 2008, the Bank merged its 401(k) savings plan and its employee stock ownership plan into the Pulaski Bank Savings and Ownership Plan (the “KSOP”) to provide greater investment alternatives to plan participants and to reduce administrative expenses. Prior to January 1, 2010, the Bank matched 75% of each participant’s contribution up to a maximum of 5% of salary. The Bank temporarily suspended its 401(k) employer matching contribution during calendar year 2010. Effective January 1, 2011, the Bank resumed its matching contribution in an amount equal to 5% of each participant’s contribution up to a maximum of 50% of salary. The Bank’s contributions to this plan were $295,000, $148,000 and $658,000 for the years ended September 30, 2011, 2010 and 2009, respectively.
Supplemental Retirement Agreement - In January 1998, the Bank entered into a supplemental retirement benefit agreement with its chief executive officer in conjunction with his retirement from the Company at that time. Under the terms of the agreement, the former chief executive officer is entitled to receive $2,473 monthly, for a period of 15 years commencing upon his retirement. The net present value of these payments is reflected in other liabilities and
66
totaled $33,000, $59,000 and $83,000 at September 30, 2011, 2010 and 2009, respectively. Compensation expense under this agreement totaled approximately $3,700, $6,000 and $7,000 for the years ended September 30, 2011, 2010 and 2009, respectively.
Employment Agreement - The Company and the Bank maintain an employment agreement with its current CEO (“CEO”). The initial term of the agreement was three years. Commencing on the first anniversary of the effective date of May 1, 2008, the term of the agreement decreased to two years. Under the agreement, the Bank pays the CEO a base salary, which is reviewed at least annually and may be increased at the discretion of the Board of Directors. In addition, the CEO received a stock option grant on the effective date covering 100,000 shares of the Company’s common stock at an exercise price of $12.84 per share, which vests ratably over a period of five years. The CEO is also entitled to receive health and welfare benefits provided to other Company and Bank employees. Additionally, the agreement provides for severance payments and continued medical coverage for 24 months if employment is terminated following a change in control or upon an event of termination as defined in the agreement. In the event of a change in control and subsequent termination of employment, the CEO will receive a lump-sum payment equal to two times his average annual compensation computed using his base pay rate at the date of termination plus any bonus or incentive compensation earned by him in the prior fiscal year. The lump-sum payment will include an amount for any required excise tax due under the Internal Revenue Code of 1986. The agreement also prohibits the CEO from soliciting the services of any of the Company’s employees, and from competing with the Company, for a period of two years after termination. As a participant in the U.S. Department of Treasury’s Capital Purchase Program, certain employees are prohibited from receiving golden parachute payments while the preferred stock issued pursuant to the Capital Purchase Program remains outstanding. Under the Treasury’s guidelines, golden parachute payments are defined to include any payment due to a change in control of the Company or an event of the employee’s termination. Accordingly, the CEO has signed an agreement to forfeit the right to receive the lump-sum separation payment under this agreement while the preferred stock issued pursuant to the Capital Purchase Program remains outstanding.
17. COMMITMENTS AND CONTINGENCIES
The Company engages in commitments to originate loans in the ordinary course of business to meet customer financing needs. Such commitments are generally made following the Company’s usual underwriting guidelines, represent off-balance sheet financial instruments and do not present more than a normal amount of risk. The following table summarizes the notional amount of these commitments at September 30, 2011 and 2010.
| | September 30, | |
| | 2011 | | 2010 | |
| | (In Thousands) | |
Commitments to originate residential first and second mortgage loans | | $ | 70,545 | | $ | 80,944 | |
Commitments to originate commercial mortgage loans | | 21,744 | | 22,901 | |
Commitments to originate non-mortgage loans | | 19,436 | | 11,378 | |
Unused lines of credit | | 194,886 | | 206,451 | |
| | | | | | | |
The Company is a defendant in legal actions arising from normal business activities. Management, after consultation with counsel, believes that the resolution of these actions will not have any material adverse effect on the Company’s consolidated financial statements.
18. DERIVATIVES
The Company originates and purchases derivative financial instruments, including interest rate lock commitments, forward contracts to sell mortgage-backed securities and interest rate swaps. Derivative financial instruments originated by the Company consist of interest rate lock commitments to originate residential loans. At September 30,
67
2011, the Company had issued $111.7 million of unexpired interest rate lock commitments to loan customers compared to $115.2 million of unexpired commitments at September 30, 2010. The Company typically economically hedges interest rate lock commitments by obtaining a corresponding best-efforts lock commitment with an investor to sell the loan at an agreed-upon price.
Interest Rate Swaps - The Company entered into two $14 million notional value interest-rate swap contracts during 2008 totaling $28 million notional value. These contracts supported a $14 million, variable-rate, commercial loan relationship and were used to allow the commercial loan customer to pay a fixed interest rate to the Company, while the Company, in turn, charged the customer a floating interest rate on the loan. Under the terms of the swap contract between the Company and the loan customer, the customer pays the Company a fixed interest rate of 6.58%, while the Company pays the customer a variable interest rate of one-month LIBOR plus 2.30%. Under the terms of a similar but separate swap contract between the Company and a major securities broker, the Company pays the broker a fixed interest rate of 6.58%, while the broker pays the Company a variable interest rate of one-month LIBOR plus 2.30%. The two contracts have identical terms except for the interest rates and are scheduled to mature on May 15, 2015. While these two swap derivatives generally work together as an interest-rate hedge, the Company has not designated them for hedge treatment. Consequently, both derivatives are marked to fair value through either a charge or credit to current earnings.
The fair values of these contracts recorded in the consolidated balance sheets are summarized as follows:
| | September 30, | |
| | 2011 | | 2010 | |
Fair value recorded in other assets | | $ | 1,676,000 | | $ | 1,860,000 | |
Fair value recorded in other liabilities | | 1,676,000 | | 1,860,000 | |
| | | | | | | |
The gross gains and losses on these contracts recorded in non-interest expense in the consolidated statements of income and comprehensive income for the years ended September 30, 2011 and 2010 are summarized as follows:
| | September 30, | |
| | 2011 | | 2010 | |
| | | | | |
Gross gains on derivative financial assets | | $ | 183,000 | | $ | (690,000 | ) |
Gross losses on derivative financial liabilities | | (183,000 | ) | 690,000 | |
Net gain or loss | | $ | — | | $ | — | |
19. FINANCIAL INSTRUMENTS WITH OFF-BALANCE-SHEET RISK AND CONCENTRATIONS OF CREDIT RISK
The Company is a party to financial instruments with off-balance-sheet risk in the normal course of business to meet the financing needs of its customers by issuing commitments to extend credit. Such commitments are agreements to lend to a customer provided there is no violation of any condition established in the contract. These commitments generally have fixed expiration dates or other termination clauses and may require the borrower to pay a fee. The Company evaluates each customer’s creditworthiness on a case-by-case basis.
At September 30, 2011, the Company had firm commitments to originate loans of approximately $111.7 million, of which $68.2 million were committed to be sold. Of the remaining $43.5 million, $480,000 were in the process of being committed and $43.1 million were commercial loans originated for portfolio. At September 30, 2010, the Company had firm commitments to originate loans of approximately $115.2 million, of which $70.8 million were committed to be sold. Of the remaining $44.4 million, $5.9 million were in the process of being committed and $38.0 million were commercial loans originated for portfolio. Additionally, the Company had outstanding
68
commitments to borrowers under unused equity lines of credit, commercial lines of credit and consumer lines of credit totaling $123.5 million, $71.3 million and $133,000, respectively, at September 30, 2011 compared to $145.2 million, $61.3 million and $32,000, respectively, at September 30, 2010.
At September 30, 2011 and 2010, the Company had loans receivable held for sale totaling $100.7 million and $253.6 million, respectively, substantially all of which were under firm commitments to be sold on a best-efforts basis. Any unrealized loss on these commitment obligations is considered in conjunction with the Company’s lower of cost or market valuation of its loans held for sale.
Standby letters of credit are conditional commitments issued by the Company to guarantee the performance of a customer to a third party. These standby letters of credit are primarily issued for a fee to support contractual obligations of the Company’s customers. The credit risk involved with issuing letters of credit is essentially the same as the risk involved in extending loans to customers. At September 30, 2011, the Company had 48 letters of credit totaling approximately $4.8 million due to expire no later than July 2019 compared to 54 letters of credit totaling approximately $8.7 million due to expire no later than July 2019 at September 30, 2010.
20. FAIR VALUE MEASUREMENTS
The Company follows the provisions of Accounting Standards Codification (“ASC”) Topic 820, Fair Value Measurements and Disclosures, which defines fair value, establishes a framework for measuring fair value in generally accepted accounting principles, and expands disclosures about fair value measurements. Fair value is defined as the exchange price that would be received for an asset or paid to transfer a liability (an exit price) in the principal or most advantageous market for the asset or liability in an orderly transaction between market participants on the measurement date. A fair value measurement should reflect all of the assumptions that market participants would use in pricing the asset or liability, including assumptions about the risk inherent in a particular valuation technique, the effect of a restriction on the sale or use of an asset, and the risk of non-performance.
A three-level hierarchy for valuation techniques is used to measure financial assets and financial liabilities at fair value. This hierarchy is based on whether the valuation inputs are observable or unobservable. Financial instrument valuations are considered Level 1 when they are based on quoted prices in active markets for identical assets or liabilities. Level 2 financial instrument valuations use quoted prices for similar assets or liabilities, quoted prices in markets that are not active, or other inputs that are observable or can be corroborated by observable market data. Financial instrument valuations are considered Level 3 when they are determined using pricing models, discounted cash flow methodologies or similar techniques and at least one significant model assumption or input is unobservable, and when determination of the fair value requires significant management judgment or estimation. ASC Topic 820 also provides guidance on determining fair value when the volume and level of activity for the asset or liability has significantly decreased and on identifying circumstances when a transaction may not be considered orderly.
The Company records securities available for sale and derivative financial instruments at their fair values on a recurring basis. Additionally, the Company records other assets at their fair values on a nonrecurring basis, such as mortgage loans held for sale, impaired loans and real estate acquired in settlement of loans. These nonrecurring fair value adjustments typically involve application of lower-of-cost-or-market accounting or impairment write-downs of individual assets. The following is a general description of the methods used to value such assets.
Mortgage-Backed Securities Held to Maturity. The fair values of mortgage-backed securities held to maturity are generally based on quoted market prices or market prices for similar assets.
Debt and Mortgage-Backed Securities Available for Sale. The fair values of debt and mortgage-backed securities available for sale are generally based on quoted market prices or market prices for similar assets.
Interest Rate Swap Assets and Liabilities. The fair values are based on quoted market prices by an independent valuation service.
69
Mortgage Loans Held for Sale. The fair values of mortgage loans held for sale are generally based on commitment sales prices obtained from the Company’s investors.
Impaired Loans. The fair values of impaired loans are generally based on market prices for similar assets determined through independent appraisals (Level 2 valuations) or discounted values of independent appraisals or brokers’ opinions of value (Level 3 valuations). Since substantially all of the Company’s loans receivable that are secured by real estate are within the St. Louis metropolitan area, management is able to closely monitor the trend in real estate values in this area. Residential real estate loans are generally inspected when they become 45 to 60 days delinquent or when communications with the borrower indicate that a potential problem exists. New appraisals are generally obtained for impaired residential real estate loans if an inspection indicates the possibility of a significant decline in fair value. If a new appraisal is determined not to be necessary, management may obtain a broker’s opinion of value or apply a discount to the existing appraised value based on the age of such appraisal and the overall trend in real estate values in the market area since the date of such appraisal. Similarly, the Company maintains close contact with its commercial borrowers whose loans are determined to be impaired and new appraisals are obtained when management believes there has been a significant change in fair value. Factors that management considers when determining whether there has been a significant change in fair value for commercial real estate secured loans generally include overall market value trends in the surrounding areas and changes in factors that impact the properties’ cash flows such as rental rates and occupancy levels that differ materially from the most current appraisals. The significance of such events is determined on a loan-by-loan basis based on the circumstances surrounding each of such loans. If a new appraisal is determined not to be necessary, management may apply a discount to the existing appraised value based the age of such appraisal and on the overall trend in real estate values in the market area since the date of such appraisal, or other factors that affect the value of the property, such as rental rates and occupancy levels.
Real Estate Acquired in Settlement of Loans consists of loan collateral that has been repossessed through foreclosure or obtained by deed in lieu of foreclosure. This collateral is comprised of commercial and residential real estate. Such assets are recorded as held for sale initially at the lower of the loan balance or fair value of the collateral less estimated selling costs. If the loan balance exceeds the fair value of the collateral less estimated selling costs at the time of foreclosure, the difference is recorded as a charge to the allowance for loan losses. During the years ended September 30, 2011 and 2010, charge-offs to the allowance for loan losses at the time of foreclosure totaled $4.6 million and $4.8 million, respectively, which represented 23% and 20% of the principal balance of loans that became subject to foreclosure during such periods, respectively. The Company generally does not record partial charge-offs on loans secured by residential real estate, but rather provides for declines in fair value in the allowance for loan losses. See Note 5 - Loans Receivable and the Allowance for Loan Losses for a discussion of the impact of this practice on the determination of the allowance for loan losses. The large amount of charge-offs at the time of foreclosure compared with the principal balance of such loans reflects the declines in fair values of the underlying real estate since the dates of loan origination. Fair values are generally determined through external appraisals and assessment of property values by the Company’s internal staff. New appraisals are obtained at the time of foreclosure and are reviewed periodically to determine whether they should be updated based on changing market conditions. Appraisals are prepared by state-licensed appraisers and represent the appraisers’ opinions of value based on comparable sales and other data that is considered by the appraisers to be the most appropriate information at the time of the appraisal. Management believes such appraisals are the best source of valuation at the time of foreclosure and represent the properties’ best estimates of value at that time. Subsequent to foreclosure, valuations are updated periodically, and the assets may be written down to reflect a new cost basis. For residential real estate properties, adjustments to valuations subsequent to foreclosure that are not based on new appraised values are generally made once the sales listing prices of the properties (which are generally based on brokers’ opinions of value) fall below the most current appraised values. In general, listing prices on all residential real estate properties are reviewed weekly after considering input from the listing brokers and any potential offers to purchase the properties. For commercial properties, adjustments to valuations subsequent to foreclosure that are not based on new appraised values are generally made once the sales listing prices of the properties (which are generally based on brokers’ opinions of value) fall below the most current appraised values or changes in other factors, such as occupancy levels and rental rates, indicate a decline in fair value. In general, listing prices on all commercial real estate properties are reviewed at least every 30 days after
70
considering input from the listing brokers, other market activity and any potential offers to purchase the properties. The Company’s frequent review of listing prices and market conditions subsequent to the receipt of an appraisal helps to ensure that the Company captures declines in the fair value of real estate acquired through foreclosure in the appropriate period. Because many of these inputs are not observable, the measurements are classified as Level 3.
Intangible Assets and Goodwill are reviewed annually in the fourth fiscal quarter and/or when circumstances or other events indicate that impairment may have occurred. Because of the decline in the market value of the Company’s common stock during the years ended September 30, 2011 and 2010, the Company reviewed goodwill for impairment quarterly during fiscal 2011 and 2010 in addition to its annual reviews at September 30, 2011 and 2010. No impairment losses were recognized during the years ended September 30, 2011 or 2010.
Assets and liabilities that were recorded at fair value on a recurring basis at September 30, 2011 and 2010 and the level of inputs used to determine their fair values are summarized below:
| | Carrying Value at September 30, 2011 | |
| | | | Fair Value Measurements Using | |
| | Total | | Level 1 | | Level 2 | | Level 3 | |
| | (In thousands) | |
Assets: | | | | | | | | | |
Debt securities available for sale | | $ | 14,457 | | $ | — | | $ | 14,457 | | $ | — | |
Mortgage-backed securities available for sale | | 2,752 | | — | | 2,752 | | — | |
Interest-rate swap | | 1,676 | | — | | 1,676 | | — | |
Total assets | | $ | 18,885 | | $ | — | | $ | 18,885 | | $ | — | |
Liabilities: | | | | | | | | | |
Interest-rate swap | | $ | 1,676 | | $ | — | | $ | 1,676 | | $ | — | |
Total liabilities | | $ | 1,676 | | $ | — | | $ | 1,676 | | $ | — | |
| | Carrying Value at September 30, 2010 | |
| | | | Fair Value Measurements Using | |
| | Total | | Level 1 | | Level 2 | | Level 3 | |
| | (In thousands) | |
Assets: | | | | | | | | | |
Debt securities available for sale | | $ | 8,001 | | $ | — | | $ | 8,001 | | $ | — | |
Mortgage-backed securities available for sale | | 8,846 | | — | | 8,846 | | — | |
Interest-rate swap | | 1,860 | | — | | 1,860 | | — | |
Total assets | | $ | 18,707 | | $ | — | | $ | 18,707 | | $ | — | |
Liabilities: | | | | | | | | | |
Interest-rate swap | | $ | 1,860 | | $ | — | | $ | 1,860 | | $ | — | |
Total liabilities | | $ | 1,860 | | $ | — | | $ | 1,860 | | $ | — | |
71
Assets that were recorded at fair value on a non-recurring basis at September 30, 2011 and 2010 and the level of inputs used to determine their fair values are summarized below:
| | | | | | | | | | Total Losses | |
| | | | | | | | | | Recognized in | |
| | Carrying Value at September 30, 2011 | | the Year Ended | |
| | | | Fair Value Measurements Using | | September 30, | |
| | Total | | Level 1 | | Level 2 | | Level 3 | | 2011 | |
| | (In thousands) | |
Assets: | | | | | | | | | | | |
Mortgage loans held for sale | | $ | — | | $ | — | | $ | — | | $ | — | | $ | 598 | |
Impaired loans, net | | 17,481 | | — | | 3,643 | | 13,838 | | 3,210 | |
Real estate acquired in settlement of loans | | 18,718 | | — | | — | | 18,718 | | 7,538 | |
Total assets | | $ | 36,199 | | $ | — | | $ | 3,643 | | $ | 32,556 | | $ | 11,346 | |
| | | | | | | | | | Total Losses | |
| | | | | | | | | | Recognized in | |
| | Carrying Value at September 30, 2010 | | the Year Ended | |
| | | | Fair Value Measurements Using | | September 30, | |
| | Total | | Level 1 | | Level 2 | | Level 3 | | 2010 | |
| | (In thousands) | |
Assets: | | | | | | | | | | | |
Mortgage loans held for sale | | $ | 113 | | $ | — | | $ | 113 | | $ | — | | $ | — | |
Impaired loans, net | | 17,748 | | — | | 10,826 | | 6,922 | | 4,335 | |
Real estate acquired in settlement of loans | | 14,900 | | — | | — | | 14,900 | | 8,373 | |
Total assets | | $ | 32,761 | | $ | — | | $ | 10,939 | | $ | 21,822 | | $ | 12,708 | |
21. DISCLOSURES ABOUT FAIR VALUES OF FINANCIAL INSTRUMENTS
Fair values of financial instruments have been estimated by the Company using available market information and appropriate valuation methodologies, including those described in Note 20. However, considerable judgment is necessarily required to interpret market data used to develop the estimates of fair value. Accordingly, the estimates presented herein are not necessarily indicative of the amounts the Company might realize in a current market exchange. The use of different market assumptions and/or estimation methodologies could have a material effect on the estimated fair value amounts.
The fair value estimates presented herein are based on pertinent information available to management as of September 30, 2011 and 2010. Although management is not aware of any factors that would significantly affect the estimated fair value amounts, such amounts have not been comprehensively revalued for purposes of these financial statements since that date. Therefore, current estimates of fair value may differ significantly from the amounts presented herein.
72
Carrying values and estimated fair values at September 30, 2011 and 2010 are summarized as follows:
| | | | Estimated | | | | Estimated | |
| | Carrying | | Fair | | Carrying | | Fair | |
| | Value | | Value | | Value | | Value | |
| | (In Thousands) | |
ASSETS: | | | | | | | | | |
Cash and cash equivalents | | $ | 57,071 | | $ | 57,071 | | $ | 15,603 | | $ | 15,603 | |
Debt securities - AFS | | 14,457 | | 14,457 | | 8,001 | | 8,001 | |
Capital stock of FHLB | | 3,100 | | 3,100 | | 9,774 | | 9,774 | |
Mortgage-backed securities - HTM | | 7,234 | | 7,727 | | 10,297 | | 10,788 | |
Mortgage-backed securities - AFS | | 2,752 | | 2,752 | | 8,846 | | 8,846 | |
Mortgage loans held for sale | | 100,719 | | 103,286 | | 253,578 | | 258,414 | |
Loans receivable | | 1,021,273 | | 1,075,459 | | 1,046,273 | | 1,094,190 | |
Accrued interest receivable | | 3,853 | | 3,853 | | 4,432 | | 4,432 | |
Interest-rate swap assets | | 1,676 | | 1,676 | | 1,860 | | 1,860 | |
| | | | | | | | | |
LIABILITIES: | | | | | | | | | |
Deposits transaction accounts | | 698,293 | | 698,293 | | 714,346 | | 714,346 | |
Certificates of deposit | | 424,232 | | 428,088 | | 400,857 | | 406,095 | |
Advances from the FHLB | | 29,000 | | 31,216 | | 181,000 | | 183,139 | |
Subordinated debentures | | 19,589 | | 19,583 | | 19,589 | | 19,583 | |
Accrued interest payable | | 840 | | 840 | | 945 | | 945 | |
Interest-rate swap liabilities | | 1,676 | | 1,676 | | 1,860 | | 1,860 | |
| | | | | | | | | | | | | |
In addition to the methods described in Note 20 above, the following methods and assumptions were used to estimate the fair value of the financial instruments:
Cash and Cash Equivalents - The carrying amount approximates fair value.
Capital Stock of the Federal Home Loan Bank - The carrying amount represents redemption value, which approximates fair value.
Loans Receivable - The fair value of loans receivable is estimated based on present values using applicable risk-adjusted spreads to the U. S. Treasury curve to approximate current interest rates applicable to each category of such financial instruments. No adjustment was made to the interest rates for changes in credit risk of performing loans where there are no known credit concerns. Management segregates loans into appropriate risk categories. Management believes that the risk factor embedded in the interest rates along with the allowance for loan losses applicable to the performing loan portfolio results in a fair valuation of such loans. The fair values of impaired loans are generally based on market prices for similar assets determined through independent appraisals or discounted values of independent appraisals and brokers’ opinions of value. This method of valuation does not incorporate the exit price concept of valuation prescribed by Accounting Standards Codification Topic 820, Fair Value Measurements and Disclosures. Rather, it was used a practical expedient as permitted under the topic.
Accrued Interest Receivable - The carrying value approximates fair value.
Deposits - The estimated fair value of demand deposits and savings accounts is the amount payable on demand at the reporting date. The estimated fair value of fixed-maturity certificates of deposit is estimated by discounting the future cash flows of existing deposits using rates currently available on advances from the Federal Home Loan Bank having similar characteristics.
Advances from Federal Home Loan Bank - The estimated fair value of advances from Federal Home Loan Bank is determined by discounting the future cash flows of existing advances using rates currently available on advances from Federal Home Loan Bank having similar characteristics.
73
Subordinated Debentures - The estimated fair values of subordinated debentures are determined by discounting the estimated future cash flows using rates currently available on debentures having similar characteristics.
Accrued Interest Payable - The carrying value approximates fair value.
Off-Balance-Sheet Items - The estimated fair value of commitments to originate or purchase loans is based on the fees currently charged to enter into similar agreements. The aggregate value of these fees is not material. Such commitments are summarized in Note 17, Commitments and Contingencies.
22. IMPACT OF RECENTLY ISSUED ACCOUNTING STANDARDS
In February 2010, the Financial Accounting Standards Board (“FASB”) issued Accounting Standards Update (“ASU”) 2010-09, Amendments to Certain Recognition and Disclosure Requirements, as an amendment to ASC Topic 855. As a result of ASU 2010-09, SEC registrants will not disclose the date through which management evaluated subsequent events in financial statements. ASU 2010-09 was effective immediately for all financial statements that had not yet been issued or had not yet become available to be issued, or March 31, 2010 for the Company. The adoption of ASU 2010-09 is for disclosure purposes only and did not have any effect on the Company’s financial position or results of operations.
In June 2009, the FASB issued Statement of Financial Standards (“SFAS”) No. 166, Accounting for Transfers of Financial Assets, an Amendment of SFAS No. 140 — Accounting for Transfers and Servicing of Financial Assets and Extinguishments of Liabilities, which was subsequently incorporated into ASC Topic 860, Transfers and Servicing. SFAS No. 166 amends ASC Topic 860 and requires more information about transfers of financial assets, including securitization transactions and whether companies have continuing exposure to the risks related to transferred financial assets. It eliminates the concept of a “qualifying special-purpose entity,” changes the requirements for derecognizing financial assets and requires additional disclosures. SFAS No. 166 was effective for the annual period beginning after November 15, 2009 and for interim periods within the first annual reporting period, and was required be applied to transfers occurring on or after the effective date. The adoption of the provisions of this Topic did not have a material impact on the Company’s financial condition or results of operations.
In June 2009, the FASB issued SFAS No. 167, Amendments to FASB Interpretation No. 46(R). SFAS No. 167 amends FIN 46(R), Consolidation of Variable Interest Entities, which was subsequently incorporated into ASC Topic 810, Consolidation, to change how a company determines when an entity that is insufficiently capitalized or is not controlled through voting (or similar rights) should be consolidated, and requires additional disclosures about involvement with variable interest entities, any significant changes in risk exposure due to that involvement and how that involvement affects the company’s financial statements. The determination of whether a company is required to consolidate an entity is based on, among other things, an entity’s purpose and design and a company’s ability to direct the activities of the entity that most significantly impact the entity’s economic performance. The provisions of this Topic were effective for the annual period beginning after November 15, 2009 and for interim periods within the first annual reporting period. The adoption of the provisions of this Topic did not have a material impact on the Company’s financial condition or results of operations.
In June 2009, the FASB issued SFAS No. 168, The FASB Accounting Standards Codification TM and the Hierarchy of Generally Accepted Accounting Principles, a Replacement of SFAS No. 162 — The Hierarchy of Generally Accepted Accounting Principles, which was subsequently incorporated into ASC Topic 105, Generally Accepted Accounting Principles. This ASC establishes the source of authoritative Generally Accepted Accounting Principles (“GAAP”) recognized by the FASB to be applied by non-governmental entities. Rules and interpretive releases of the United States Securities and Exchange Commission (“SEC”) under authority of federal securities laws, are also sources of authoritative GAAP for SEC registrants. This ASC superseded all then-existing non-SEC accounting and reporting standards. All other non-grandfathered, non-SEC accounting literature not included in the ASC became non-authoritative. ASC Topic 105 was effective for financial statements issued for interim and annual periods ending after September 15, 2009. The implementation of the ASC did not have a material impact on the Company’s financial condition or results of operations.
74
In January 2010, the FASB issued ASU No. 2010-06 which amends ASC Topic 820, Fair Value Measurements and Disclosures. This update provides more robust disclosures about (a) the different classes of assets and liabilities measured at fair value, (b) the valuation techniques and inputs used, (c) the activity in Level 3 fair value measurements, and (d) the transfers between Levels 1, 2, and 3. The ASU was effective for financial statements issued for interim and annual periods ending after December 15, 2009. The interim disclosures required by this update are reported in the notes to the Company’s consolidated financial statements.
In July 2010, the FASB issued ASU No. 2010-20, Receivables (ASC Topic 310): Disclosures about the Credit Quality of Financing Receivables and the Allowance for Credit Losses. This ASU requires expanded credit risk disclosures intended to provide investors with greater transparency regarding the allowance for credit losses and the credit quality of financing receivables. Under this ASU, companies are required to provide more information about the credit quality of their financing receivables in the disclosures to financial statements, such as aging information, credit quality indicators, changes in the allowance for credit losses, and the nature and extent of troubled debt restructurings and their effect on the allowance for credit losses. Both new and existing disclosures must be disaggregated by portfolio segment or class based on the level of disaggregation that management uses when assessing its allowance for credit losses and managing its credit exposure. The disclosures as of the end of a reporting period were effective for interim and annual periods ending on or after December 15, 2010. The disclosures about activity that occurs during a reporting period were effective for interim and annual reporting periods beginning on or after December 15, 2010. The adoption of the provisions of this Topic did not have a material impact on the Company’s financial condition or results of operations.
In April 2011, the FASB issued ASU No. 2011-02, A Creditor’s Determination of Whether a Restructuring is a Troubled Debt Restructuring. The provisions of ASU No. 2011-02 provide additional guidance related to determining whether a creditor has granted a concession, include factors and examples for creditors to consider in evaluating whether a restructuring results in a delay in payment that is insignificant, prohibits creditors from using the borrower’s effective rate test to evaluate whether a concession has been granted to the borrower, and add factors for creditors to use in determining whether a borrower is experiencing financial difficulties. A provision in ASU No. 2011-02 also ends the deferral of the additional disclosures about troubled debt restructurings as required by ASU No. 2010-20. The provisions of ASU No. 2011-02 were effective for the Company’s reporting period ending September 30, 2011 and were required to be applied retrospectively to the beginning of the annual period of adoption. The adoption of the ASU did not have a material impact on the Company’s financial condition or results of operations.
In September 2011, the FASB issued ASU No. 2011-08, Intangibles — Goodwill and Other (ASC Topic 350) — Testing of Goodwill for Impairment. This ASU simplifies how entities test goodwill for impairment. The amendments under this ASU permit an entity to first assess qualitative factors to determine whether it is more likely than not that the fair value of a reporting unit is less than its carrying amount as a basis for determining whether it is necessary to perform the two-step goodwill impairment test. The more-likely-than-not threshold is defined as having a likelihood of more than 50 percent. If an entity concludes that it is not more likely than not that the fair value of a reporting unit is less than its carrying amount, it would not be required to perform the two-step impairment test for that reporting unit. This ASU does not change the current guidance for testing other indefinite-lived intangible assets for impairment. The provisions of this ASU are effective for annual and interim goodwill impairment tests performed for fiscal years beginning after December 15, 2011. The adoption of this ASU is not expected to have a material impact on the Company’s consolidated financial condition or results of operations.
75
23. SELECTED QUARTERLY FINANCIAL DATA (UNAUDITED)
The results of operations by quarter for 2011 and 2010 were as follows:
| | First | | Second | | Third | | Fourth | |
Year Ended September 30, 2011 | | Quarter | | Quarter | | Quarter | | Quarter | |
| | | | | | | | | |
Interest income | | $ | 17,124,421 | | $ | 14,817,644 | | $ | 14,174,594 | | $ | 14,136,014 | |
Interest expense | | 3,708,226 | | 3,331,453 | | 3,096,072 | | 2,815,554 | |
| | | | | | | | | |
Net interest income | | 13,416,195 | | 11,486,191 | | 11,078,522 | | 11,320,460 | |
Provision for loan losses | | 4,300,000 | | 3,500,000 | | 4,000,000 | | 3,000,000 | |
| | | | | | | | | |
Net interest income after loan loss provision | | 9,116,195 | | 7,986,191 | | 7,078,522 | | 8,320,460 | |
| | | | | | | | | |
Non-interest income | | 3,648,171 | | 2,690,864 | | 3,073,936 | | 3,584,834 | |
Non-interest expense | | 8,301,074 | | 9,208,052 | | 7,885,855 | | 8,889,608 | |
| | | | | | | | | |
Income before taxes | | 4,463,292 | | 1,469,003 | | 2,266,603 | | 3,015,686 | |
Income tax expense | | 1,345,940 | | 402,313 | | 566,349 | | 835,205 | |
| | | | | | | | | |
Net income | | $ | 3,117,352 | | $ | 1,066,690 | | $ | 1,700,254 | | $ | 2,180,481 | |
| | | | | | | | | |
Income available to common shares | | $ | 2,601,425 | | $ | 550,379 | | $ | 1,183,558 | | $ | 1,663,399 | |
| | | | | | | | | |
Earnings per common share - basic | | $ | 0.25 | | $ | 0.05 | | $ | 0.11 | | $ | 0.16 | |
Earnings per common share - diluted | | $ | 0.24 | | $ | 0.05 | | $ | 0.11 | | $ | 0.15 | |
| | | | | | | | | |
Weighted average common shares outstanding - basic | | 10,507,158 | | 10,532,730 | | 10,558,910 | | 10,574,405 | |
Weighted average common shares outstanding - diluted | | 10,925,023 | | 10,986,206 | | 11,009,935 | | 10,962,188 | |
| | First | | Second | | Third | | Fourth | |
Year Ended September 30, 2010 | | Quarter | | Quarter | | Quarter | | Quarter | |
| | | | | | | | | |
Interest income | | $ | 16,837,055 | | $ | 16,050,620 | | $ | 15,917,855 | | $ | 16,298,660 | |
Interest expense | | 5,311,566 | | 4,968,670 | | 4,220,269 | | 3,891,888 | |
| | | | | | | | | |
Net interest income | | 11,525,489 | | 11,081,950 | | 11,697,586 | | 12,406,772 | |
Provision for loan losses | | 6,074,000 | | 11,240,000 | | 4,500,000 | | 4,250,000 | |
| | | | | | | | | |
Net interest income (loss) after loan loss provision | | 5,451,489 | | (158,050 | ) | 7,197,586 | | 8,156,772 | |
| | | | | | | | | |
Non-interest income | | 4,447,467 | | 3,387,367 | | 3,731,478 | | 3,274,166 | |
Non-interest expense | | 8,182,400 | | 8,420,874 | | 7,342,217 | | 7,990,620 | |
| | | | | | | | | |
Income (loss) before taxes | | 1,716,556 | | (5,191,557 | ) | 3,586,847 | | 3,440,318 | |
Income tax expense (benefit) | | 466,121 | | (869,669 | ) | 409,693 | | 253,232 | |
| | | | | | | | | |
Net income (loss) | | $ | 1,250,435 | | $ | (4,321,888 | ) | $ | 3,177,154 | | $ | 3,187,086 | |
| | | | | | | | | |
Income (loss) available to common shares | | $ | 736,029 | | $ | (4,836,673 | ) | $ | 2,661,990 | | $ | 2,671,541 | |
| | | | | | | | | |
Earnings (loss) per common share - basic | | $ | 0.07 | | $ | (0.47 | ) | $ | 0.26 | | $ | 0.26 | |
Earnings (loss) per common share - diluted | | $ | 0.07 | | $ | (0.47 | ) | $ | 0.25 | | $ | 0.27 | |
| | | | | | | | | |
Weighted average common shares outstanding - basic | | 10,274,066 | | 10,364,565 | | 10,418,153 | | 10,466,557 | |
Weighted average common shares outstanding - diluted | | 10,483,880 | | 10,364,565 | | 10,622,155 | | 10,807,056 | |
76
24. CONDENSED PARENT-COMPANY-ONLY FINANCIAL STATEMENTS.
The following table presents the condensed parent-company-only balance sheets as of September 30, 2011 and 2010, and the condensed parent-company-only statements of income and cash flows of the Company for the years ended September 30, 2011, 2010 and 2009:
Condensed Balance Sheets
| | 2011 | | 2010 | | | |
| | | | | | | |
ASSETS: | | | | | | | |
Cash and cash equivalents | | $ | 119,182 | | $ | 109,083 | | | |
Investment in Bank | | 136,799,101 | | 134,762,057 | | | |
Intercompany loan to Bank | | 3,350,000 | | 1,900,000 | | | |
Other assets | | 1,866,536 | | 1,757,055 | | | |
| | | | | | | |
Total assets | | $ | 142,134,819 | | $ | 138,528,195 | | | |
| | | | | | | |
LIABILITIES: | | | | | | | |
Subordinated debentures | | $ | 19,589,000 | | $ | 19,589,000 | | | |
Dividends payable | | 1,043,740 | | 1,029,567 | | | |
Other liabilities | | 1,331,893 | | 1,556,347 | | | |
| | | | | | | |
Total liabilities | | 21,964,633 | | 22,174,914 | | | |
| | | | | | | |
STOCKHOLDER’S EQUITY | | 120,170,186 | | 116,353,281 | | | |
| | | | | | | |
Total liabilities and stockholder’s equity | | $ | 142,134,819 | | $ | 138,528,195 | | | |
Condensed Statements of Income
| | 2011 | | 2010 | | 2009 | |
| | | | | | | |
Interest income | | $ | 69,129 | | $ | 45,849 | | $ | 152,223 | |
Interest expense | | 505,889 | | 515,307 | | 872,846 | |
| | | | | | | |
Net interest expense | | (436,760 | ) | (469,458 | ) | (720,623 | ) |
| | | | | | | |
Non-interest income | | 1,112,099 | | 1,104,379 | | 892,022 | |
Non-interest expense | | 688,955 | | 551,600 | | 1,201,803 | |
| | | | | | | |
(Loss) income before income taxes and equity in earnings of Bank | | (13,616 | ) | 83,321 | | (1,030,404 | ) |
| | | | | | | |
Income tax (benefit) expense | | (3,824 | ) | 6,084 | | (374,800 | ) |
| | | | | | | |
Net income (loss) before equity in earnings of Bank | | (9,792 | ) | 77,237 | | (655,604 | ) |
| | | | | | | |
Equity in earnings of Bank | | 8,074,569 | | 3,215,550 | | 5,732,566 | |
| | | | | | | |
Net income | | $ | 8,064,777 | | $ | 3,292,787 | | $ | 5,076,962 | |
| | | | | | | |
Income available to common shares | | $ | 5,998,761 | | $ | 1,232,887 | | $ | 3,811,669 | |
77
Condensed Statements of Cash Flows
| | 2011 | | 2010 | | 2009 | |
| | | | | | | |
CASH FLOWS FROM OPERATING ACTIVITIES: | | | | | | | |
Net income | | $ | 8,064,777 | | $ | 3,292,787 | | $ | 5,076,962 | |
Adjustments to reconcile net income to net cash from operating activities: | | | | | | | |
Equity in earnings of Bank | | (8,074,569 | ) | (3,215,550 | ) | (5,732,566 | ) |
Net change in other assets and liabilities | | (319,761 | ) | 1,293,313 | | (290,999 | ) |
Realized loss on sale of investments | | — | | — | | 155,500 | |
| | | | | | | |
Net cash (used in) provided by operating activities | | (329,553 | ) | 1,370,550 | | (791,103 | ) |
| | | | | | | |
CASH FLOWS FROM INVESTING ACTIVITIES: | | | | | | | |
Cash paid for investment in joint venture | | — | | (12,500 | ) | — | |
Dividends received from Bank | | 6,000,000 | | 1,500,000 | | — | |
Capital contribution to Bank | | — | | — | | (20,000,000 | ) |
(Increase) decrease in intercompany loan | | (1,450,000 | ) | 900,000 | | (800,000 | ) |
Principal payments on mortgage-backed securities | | — | | — | | 2,026 | |
| | | | | | | |
Net cash provided by (used in) investing activities | | 4,550,000 | | 2,387,500 | | (20,797,974 | ) |
| | | | | | | |
CASH FLOWS FROM FINANCING ACTIVITIES: | | | | | | | |
Payment of note payable | | — | | — | | (7,640,000 | ) |
Equity trust shares purchased, net | | — | | (181,552 | ) | (441,753 | ) |
Equity trust shares purchased from Treasury, net | | 446,684 | | — | | — | |
Proceeds from stock options exercised | | 193,955 | | 196,829 | | 105,949 | |
Proceeds received from Bank for stock-based compensation | | 1,009,710 | | 1,290,686 | | 1,204,203 | |
Proceeds from cash received in dividend reinvestment plan | | — | | 707,033 | | 785,669 | |
Proceeds from issuance of preferred stock and common stock warrants | | — | | — | | 32,501,768 | |
Dividends paid on common stock | | (4,177,009 | ) | (4,053,659 | ) | (3,922,623 | ) |
Dividends paid on preferred stock | | (1,626,900 | ) | (1,626,900 | ) | (944,506 | ) |
Common stock issued under employee compensation plan | | 99,998 | | — | | — | |
Common stock purchased under dividend reinvestment plan | | (27,399 | ) | — | | — | |
Common stock surrendered to satisfy tax withholding obligations of stock-based compensation | | (129,387 | ) | (78,374 | ) | (54,972 | ) |
| | | | | | | |
Net cash (used in) provided by financing activities | | (4,210,348 | ) | (3,745,937 | ) | 21,593,735 | |
| | | | | | | |
NET INCREASE IN CASH AND CASH EQUIVALENTS | | 10,099 | | 12,113 | | 4,658 | |
| | | | | | | |
CASH AND CASH EQUIVALENTS AT BEGINNING OF YEAR | | 109,083 | | 96,970 | | 92,312 | |
| | | | | | | |
CASH AND CASH EQUIVALENTS AT END OF YEAR | | $ | 119,182 | | $ | 109,083 | | $ | 96,970 | |
* * * * *
78
COMMON STOCK INFORMATION
The common stock of the Company is listed on the NASDAQ Global Select Market under the symbol “PULB.” As of December 7, 2011, there were approximately 3,102 stockholders of record of the Company, including brokers or other nominees.
The following table sets forth market price and dividend information for the Company’s common stock for fiscal years 2011 and 2010.
| | | | | | Dividend | |
| | High | | Low | | Per Share | |
Fiscal 2011 | | | | | | | |
| | | | | | | |
First Quarter | | $ | 7.72 | | $ | 6.75 | | $ | 0.095 | |
| | | | | | | |
Second Quarter | | $ | 7.64 | | $ | 7.16 | | $ | 0.095 | |
| | | | | | | |
Third Quarter | | $ | 7.63 | | $ | 7.00 | | $ | 0.095 | |
| | | | | | | |
Fourth Quarter | | $ | 7.48 | | $ | 6.32 | | $ | 0.095 | |
| | | | | | | |
Fiscal 2010 | | | | | | | |
| | | | | | | |
First Quarter | | $ | 8.01 | | $ | 6.09 | | $ | 0.095 | |
| | | | | | | |
Second Quarter | | $ | 6.85 | | $ | 6.17 | | $ | 0.095 | |
| | | | | | | |
Third Quarter | | $ | 8.00 | | $ | 5.86 | | $ | 0.095 | |
| | | | | | | |
Fourth Quarter | | $ | 7.00 | | $ | 6.25 | | $ | 0.095 | |
79
DIRECTORS AND OFFICERS
Directors of Pulaski Financial Corp. | | Senior Officers of Pulaski Bank |
| | |
Stanley J. Bradshaw | | Gary W. Douglass |
Chairman of the Board | | Chairman of the Board and Chief Executive Officer |
Principal, Bradshaw Capital Management | | |
| | W. Thomas Reeves |
Lee S. Wielansky | | President |
Chairman and Chief Executive Officer of Midland | | |
Development Group, Inc. | | Paul J. Milano |
| | Chief Financial Officer, Secretary and Treasurer |
William M. Corrigan, Jr. | | |
Partner, Armstrong Teasdale LLP | | Brian J. Björkman |
| | President, Commercial Lending |
Gary W. Douglass | | |
President and Chief Executive Officer | | Brian C. Boyles |
| | President, Mortgage Lending Division |
Leon A. Felman | | |
Investor in Financial Institutions | | Cheri G. Bliefernich |
| | Executive Vice President, Banking Operations |
Michael R. Hogan | | |
Retired Chief Administrative Officer and Chief | | Michael J. Benney |
Financial Officer of Sigma-Aldrich Corporation | | Senior Vice President, Chief Information Officer |
| | |
Timothy K. Reeves | | Judy E. Cromer |
President and Owner of Keenan Properties of St. Louis | | Senior Vice President, Mortgage Lending Operations |
| | |
Steven C. Roberts | | Denise K. DeRousse |
President of the Roberts Companies | | Senior Vice President, Retail Banking Operations |
| | |
Sharon A. Tucker | | Paul D. Grosse |
President of Tucker Consultants | | Regional President, Commercial Lending |
| | |
Senior Officers of Pulaski Financial Corp. | | Rita M. Kuster |
| | Senior Vice President, Commercial Lending |
Gary W. Douglass | | |
President and Chief Executive Officer | | Wallace D. Niedringhaus |
| | Senior Vice President, Investment Brokerage |
Paul J. Milano | | |
Chief Financial Officer, Secretary and Treasurer | | W. Bruce Phelps |
| | Senior Vice President, Controller |
W. Bruce Phelps | | |
Senior Vice President, Controller | | James W. Sullivan |
| | Senior Vice President, Internal Management |
| | Reporting |
80
CORPORATE INFORMATION
Corporate Headquarters
12300 Olive Boulevard
St. Louis, Missouri 63141
314.878.2210
www.pulaskibankstl.com
Independent Auditors
KPMG LLP
St. Louis, Missouri
General Counsel
King, Krehbiel, & Hellmich, LLC
St. Louis, Missouri
Armstrong Teasdale LLP
St. Louis, Missouri
Special Securities Counsel
Kilpatrick Townsend & Stockton LLP
Washington, D.C.
Stock Transfer Agent
Registrar and Transfer Company
Cranford, New Jersey
800.866.1340
www.rtco.com
ANNUAL MEETING
The annual meeting of the stockholders will be held Wednesday, February 1, 2012 at 2:00 p.m., Central Time, at the St. Louis Marriott West, 660 Maryville Centre Drive, St. Louis, Missouri, 63141.
81