Exhibit 13.1
Annual Report to Stockholders
BUSINESSOFTHE COMPANY
We are a diversified, community-based, financial institution holding company headquartered in St. Louis, Missouri. We conduct operations primarily through Pulaski Bank, a federally chartered savings bank. Pulaski Bank provides an array of financial products and services for businesses and retail customers primarily through its seven full-service offices in the St. Louis metropolitan area and its lending operations in the Kansas City metropolitan area.
We have grown our assets, deposits and profits internally by building our residential lending operation, by opening de novo branches, and by hiring experienced bankers with existing customer relationships in our market. Although we intend to expand primarily through internal growth, we will continue to explore opportunities to expand through acquisitions of other banks and bank branches. Our goal is to continue to enhance our franchise value and earnings through controlled growth in our banking operations, while maintaining the community-oriented customer service that has characterized our success to date.
- 1 -
SELECTED CONSOLIDATED FINANCIAL INFORMATION
| | | | | | | | | | | | | | | |
| | | At or For the Years Ended September 30,
|
| | | 2005
| | 2004
| | 2003
| | 2002
| | 2001
|
| | | (In thousands, except per share amounts) |
FINANCIAL CONDITION DATA | | | | | | | | | | | | | | | |
Total assets | | $ | 789,861 | | $ | 637,886 | | $ | 401,403 | | $ | 369,247 | | $ | 288,784 |
Loans receivable, net | | | 633,195 | | | 510,584 | | | 276,894 | | | 227,581 | | | 204,115 |
Loans receivable held for sale | | | 64,335 | | | 49,152 | | | 61,124 | | | 97,174 | | | 38,087 |
Debt and equity securities | | | 10,228 | | | 12,986 | | | 6,432 | | | 4,877 | | | 5,962 |
Capital stock of Federal Home Loan Bank | | | 8,462 | | | 7,538 | | | 3,880 | | | 5,840 | | | 3,960 |
Mortgage-backed securities | | | 4,833 | | | 6,574 | | | 8,862 | | | 7,482 | | | 11,305 |
Assets held for sale | | | 1,017 | | | — | | | — | | | — | | | — |
Cash and cash equivalents | | | 25,688 | | | 20,296 | | | 18,656 | | | 11,177 | | | 13,048 |
Deposits | | | 496,171 | | | 406,799 | | | 313,607 | | | 201,270 | | | 189,710 |
Deposit liabilities held for sale | | | 25,375 | | | — | | | — | | | — | | | — |
Advances from Federal Home Loan Bank | | | 171,000 | | | 154,600 | | | 31,500 | | | 116,800 | | | 55,000 |
Subordinated debentures | | | 19,589 | | | 9,279 | | | — | | | — | | | — |
Stockholders’ equity | | | 48,246 | | | 40,974 | | | 36,383 | | | 32,554 | | | 31,007 |
| | | | | |
OPERATING DATA | | | | | | | | | | | | | | | |
Interest income | | $ | 37,792 | | $ | 23,811 | | $ | 21,426 | | $ | 18,341 | | $ | 20,356 |
Interest expense | | | 16,690 | | | 7,806 | | | 7,739 | | | 8,150 | | | 11,453 |
| | |
|
| |
|
| |
|
| |
|
| |
|
|
Net interest income | | | 21,102 | | | 16,005 | | | 13,687 | | | 10,191 | | | 8,903 |
Provision for loan losses | | | 1,635 | | | 1,934 | | | 1,487 | | | 1,011 | | | 752 |
| | |
|
| |
|
| |
|
| |
|
| |
|
|
Net interest income after provision for loan losses | | | 19,467 | | | 14,071 | | | 12,200 | | | 9,180 | | | 8,151 |
Non-interest income | | | 10,944 | | | 8,981 | | | 11,405 | | | 7,077 | | | 5,564 |
Non-interest expense | | | 18,514 | | | 13,715 | | | 13,977 | | | 9,653 | | | 8,802 |
| | |
|
| |
|
| |
|
| |
|
| |
|
|
Income before income taxes | | | 11,897 | | | 9,337 | | | 9,628 | | | 6,604 | | | 4,913 |
Income taxes | | | 4,418 | | | 3,485 | | | 3,860 | | | 2,418 | | | 1,767 |
| | |
|
| |
|
| |
|
| |
|
| |
|
|
Net income | | $ | 7,479 | | $ | 5,852 | | $ | 5,768 | | $ | 4,186 | | $ | 3,146 |
| | |
|
| |
|
| |
|
| |
|
| |
|
|
COMMON SHARE DATA | | | | | | | | | | | | | | | |
Basic net income per share | | $ | 0.94 | | $ | 0.75 | | $ | 0.74 | | $ | 0.52 | | $ | 0.37 |
Diluted net income per share | | $ | 0.85 | | $ | 0.67 | | $ | 0.67 | | $ | 0.49 | | $ | 0.36 |
Dividends declared per share | | $ | 0.28 | | $ | 0.20 | | $ | 0.14 | | $ | 0.06 | | $ | 0.09 |
Book value per share | | $ | 5.72 | | $ | 4.98 | | $ | 4.47 | | $ | 3.94 | | $ | 3.61 |
Weighted average shares-basic | | | 7,926 | | | 7,758 | | | 7,843 | | | 8,064 | | | 8,599 |
Weighted average shares-diluted | | | 8,828 | | | 8,695 | | | 8,578 | | | 8,528 | | | 8,863 |
Shares outstanding-end of period | | | 8,439 | | | 7,823 | | | 7,758 | | | 7,954 | | | 8,298 |
- 2 -
| | | | | | | | | | | | | | | |
| | | At or For the Year Ended September 30,
| |
| | | 2005
| | | 2004
| | | 2003
| | | 2002
| | | 2001
| |
KEY OPERATING RATIOS | | | | | | | | | | | | | | | |
Return on average assets | | 1.05 | % | | 1.18 | % | | 1.38 | % | | 1.38 | % | | 1.12 | % |
Return on average equity | | 16.55 | | | 15.31 | | | 16.35 | | | 13.24 | | | 10.05 | |
Average equity to average assets | | 6.37 | | | 7.68 | | | 8.43 | | | 10.44 | | | 11.12 | |
Interest rate spread | | 3.05 | | | 3.37 | | | 3.30 | | | 3.40 | | | 2.68 | |
Net interest margin | | 3.19 | | | 3.47 | | | 3.47 | | | 3.66 | | | 3.26 | |
Efficiency ratio | | 57.77 | | | 56.56 | | | 55.87 | | | 55.99 | | | 63.20 | |
Dividend payout ratio | | 32.94 | | | 29.70 | | | 20.79 | | | 22.45 | | | 26.17 | |
Non-interest expense to average assets | | 2.61 | | | 2.76 | | | 3.34 | | | 3.19 | | | 3.12 | |
Average interest-earning assets to average interest-bearing liabilities | | 105.19 | | | 106.17 | | | 108.95 | | | 108.64 | | | 113.77 | |
Allowance for loan losses to total loans at end of period | | 0.97 | | | 0.99 | | | 1.13 | | | 0.78 | | | 0.76 | |
Allowance for loan losses to nonperforming loans | | 113.51 | | | 130.64 | | | 91.31 | | | 101.89 | | | 69.30 | |
Net charge-offs to average outstanding loans during the period | | 0.04 | | | 0.05 | | | 0.05 | | | 0.12 | | | 0.12 | |
Nonperforming assets to total assets | | 0.85 | | | 0.84 | | | 1.07 | | | 0.68 | | | 0.92 | |
OTHER DATA | | | | | | | | | | | | | | | |
Number of: | | | | | | | | | | | | | | | |
Real estate loans outstanding | | 4,059 | | | 3,619 | | | 2,651 | | | 2,954 | | | 2,723 | |
Consumer loans (includes home equity loans) | | 9,520 | | | 8,318 | | | 6,336 | | | 4,295 | | | 3,203 | |
Deposit accounts | | 33,010 | | | 30,390 | | | 29,344 | | | 23,977 | | | 23,733 | |
Number full-time equivalent employees | | 327 | | | 258 | | | 239 | | | 160 | | | 126 | |
Full service offices | | 8 | | | 7 | | | 7 | | | 5 | | | 5 | |
CAPITAL RATIOS (1) | | | | | | | | | | | | | | | |
Tangible capital | | 8.60 | | | 8.14 | | | 8.18 | | | 7.28 | | | 9.50 | |
Core capital | | 8.60 | | | 8.14 | | | 8.18 | | | 7.28 | | | 9.71 | |
Total risk-based capital | | 10.85 | | | 11.46 | | | 11.73 | | | 12.63 | | | 12.78 | |
| (1) | Capital ratios are for Pulaski Bank. |
- 3 -
MANAGEMENT’S DISCUSSIONAND ANALYSISOF
FINANCIAL CONDITIONAND RESULTSOF OPERATIONS
GENERAL
Management’s discussion and analysis of financial condition and results of operations is intended to assist in understanding our financial condition and results of operations. The information contained in this section should be read in conjunction with the consolidated financial statements and accompanying notes contained elsewhere in this annual report.
This report may contain certain "forward-looking statements" within the meaning of the federal securities laws, which are made in good faith pursuant to the “safe harbor” provisions of the Private Securities Litigation Reform Act of 1995. These statements are not historical facts, rather they are statements based on management’s current expectations regarding our business strategies, intended results and future performance. Forward-looking statements are generally preceded by terms such as “expects,” “believes,” “anticipates,” “intends” and similar expressions.
Management's ability to predict results or the effect of future plans or strategies is inherently uncertain. Factors that could affect actual results include interest rate trends, the general economic climate in the market area in which we operate, as well as nationwide, our ability to control costs and expenses, competitive products and pricing offered by competitors, loan delinquency rates and changes in federal and state legislation and regulation. These factors should be considered in evaluating the forward-looking statements and undue reliance should not be placed on such statements. We assume no obligation to update any forward-looking statements.
During the preparation of the September 30, 2005 consolidated financial statements, a weakness in our documentation of certain hedging relationships was uncovered. It was determined that the previously reported quarterly results for December 31, 2004, March 31, 2005 and June 30, 2005 required restatement. For additional information regarding this restatement, see Note 23 to the Consolidated Financial Statements.
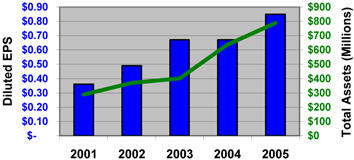
Summary of Performance
From September 30, 2001 to September 30, 2005, we have achieved strong growth. Specifically, we have:
| | • | | increased our net income from $3.1 million to $7.5 million; |
| | • | | increased our earnings per share (diluted) from $0.36 to $0.85; |
| | • | | increased our total assets from $288.8 million to $789.9 million; |
| | • | | increased our total deposits from $189.7 million to $521.5 million; and |
| | • | | expanded our St. Louis bank branch network from five locations to seven locations. |
- 4 -
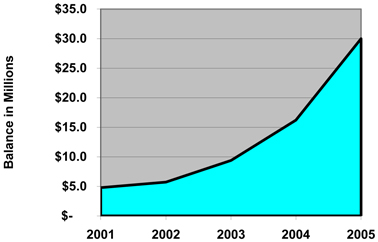
Diluted EPS - Total Assets
A major driver of our growth has been our residential mortgage business, which generates significant income through loan sales and which provides a source for portfolio loans. Residential mortgage loan originations totaled $1.2 billion for the year ended September 30, 2005 and $1.1 billion for the year ended September 30, 2004. These loans were primarily originated for sale and fueled our mortgage revenue, which totaled $5.4 million for the year ended September 30, 2005 and $4.6 million for the year ended September 30, 2004. At September 30, 2005, we employed 55 residential lenders. In June 2005, we acquired a 50% interest in a joint venture with one of Kansas City’s largest real estate firms, which will provide an additional source of originations.
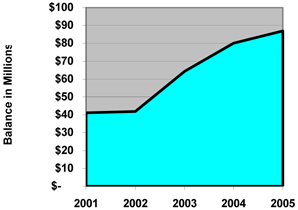
Net Interest Income - Loans Receivable
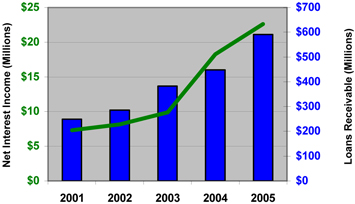
In the last two years, our earnings have become less dependent on sources of non-interest income as our loan portfolio has expanded, resulting in higher interest income and ultimately higher net interest income. Net interest income increased $5.1 million to $21.1 million for the year ended September 30, 2005 compared to $16.0 million for the year ended September 30, 2004 and $13.7 million for the year ended September 30, 2003. Our loan portfolio has increased 128.7% over the last two years, from $276.9 million at September 30, 2003 to $510.6 million at September 30, 2004 to $633.2 million at September 30, 2005, primarily due to growth in the commercial loan portfolio. At September 30, 2003, we had a commercial loan portfolio of $16.4 million and were principally a residential lender, with 92% of our portfolio consisting of residential or home equity loans. At the end of fiscal 2003, we hired several commercial lenders to expand and diversify our loan portfolio. Over the past two years, the commercial lending division has been a significant contributor to our growth, with $74.0 million of new loan growth in fiscal year 2005 and $88.8 million of new loan growth in fiscal year 2004. The commercial division’s loan portfolio totaled $179.3 million at September 30, 2005.
- 5 -
We continue to overcome deposit challenges primarily through growth of core deposit accounts. For the year, deposits increased $114.7 million to $521.5 million from $406.8 million at September 30, 2004, including $25.4 million of deposits that will be transferred in connection with the pending sale of our Kansas City branch. Demand deposit accounts, including money market accounts and passbooks, increased $15.4 million during the year while commercial transaction accounts increased $19.0 million to $35.4 million at September 2005 from $16.4 million in September 30, 2004. Over the last year, our non-interest bearing checking account balances increased 85% to $30.0 million due primarily to the growth in commercial relationships. In an effort to become less reliant on wholesale funds, we have focused greater efforts on attracting commercial accounts and on expanding our branch network. During the year, the Company supplemented its core deposit growth with the addition of $37.0 million of additional brokered deposits with $118.9 million at September 30, 2005 compared to $81.9 million at September 30, 2004. We currently have seven bank locations in St. Louis and are planning to increase our bank locations to 12 over the next five years, including the two bank locations in the recently announced Central West End acquisition.
During the year, our efficiency remained strong despite a significant growth in expenses related to entering new lines of business with the title and bond divisions and expanding our audit and compliance divisions in response to the Sarbanes-Oxley Act of 2002. Our efficiency ratio in fiscal 2005 was 57.77% compared to 56.56% in fiscal 2004 and 55.87% in fiscal 2003. The efficiency ratio is a metric that we use to measure our operating efficiency and is determined by dividing the annual non-interest expense by net interest income plus non-interest income, excluding gains from sales of securities.
Recent Developments
Kansas City Branch Sale. On October 7, 2005, we entered into a purchase and assumption agreement pursuant to which we will sell our Kansas City, Missouri branch office to UMB Bank. We expect the transaction to close during the first calendar quarter of 2006. As of September 30, 2005, the deposits to be assumed by UMB Bank totaled approximately $25.4 million. No loans will be transferred in connection with the branch sale. We expect to recognize a gain of approximately $2.8 million in connection with the transaction. Although we are selling our retail branch in Kansas City, Missouri, we remain committed to supporting and growing our loan production office in Overland Park, Kansas and to the joint venture that we established in June 2005 with a large Kansas City-area real estate firm. We determined that our loan origination efforts could continue to be successful without a retail banking presence in Kansas City and that our capital could be put to more effective use by focusing on expansion within our core retail and commercial banking market—the St. Louis metropolitan area.
Acquisition of CWE Bancorp. On October 25, 2005, we entered into an Agreement and Plan of Merger with CWE Bancorp, Inc., pursuant to which we will acquire CWE Bancorp and its wholly owned subsidiary, Central West End Bank, a Federal Savings Bank. Central West End Bank operates two full-service banking offices in St. Louis, Missouri. At September 30, 2005, CWE Bancorp had total assets of $46.2 million, deposits of $40.6 million and stockholders’ equity of $4.5 million. Under the terms of the merger agreement, stockholders of CWE Bancorp will be entitled to elect to receive, in exchange for each share of CWE common stock held, either $8.25 cash or 0.4853 shares of our common stock. The merger consideration is subject to adjustment in connection with the disposition by CWE Bancorp of certain fixed-rate loans as well as several other agreed upon market adjustments at closing. We estimate that we will issue approximately 214,000 shares of our common stock in the transaction and that the total value of the proposed transaction will be $7.6 million. We expect to complete the merger in the first calendar quarter of 2006, pending CWE Bancorp stockholder approval, regulatory approval, and other customary conditions of closing.
CRITICAL ACCOUNTING POLICIES
We have established various accounting policies that govern the application of U.S. generally accepted accounting principles in the preparation of our financial statements. Our significant accounting policies are described in the footnotes to the consolidated financial statements that appear in this report. Certain accounting
- 6 -
policies involve significant judgments and assumptions by management that have a material impact on the carrying value of certain assets and liabilities. Management considers such accounting policies to be critical accounting policies. The judgments and assumptions used by management are based on historical experience and other factors, which are believed to be reasonable under the circumstances. Because of the nature of the judgments and assumptions made by management, actual results could differ from these judgments and estimates that could have a material impact on the carrying values of assets and liabilities and our results of operations.
We consider the following to be our critical accounting policies: allowance for loan losses and derivative instruments. Determining the amount of the allowance for loan losses involves a high degree of judgment. Refer to Note 1 to our consolidated financial statements, “Accounting Policies,” for a detailed description of our estimation processes and methodology related to the allowance for loan losses.
We employ derivative financial instruments to assist in our management of interest rate sensitivity by modifying the repricing, maturity and option characteristics of certain assets and liabilities. The judgments and assumptions that are most critical to the application of this critical accounting policy are those affecting the estimation of fair value. Fair value is based on quoted market prices. Refer to note 1 to our Consolidated Financial Statements, “Accounting Policies,” for a detailed description of our estimation processes and methodology related to the fair value of derivative financial instruments.
Business Strategy
We have a community banking strategy that emphasizes high-quality responsive, and personalized service to our customers. Due to the consolidation of financial institutions in our market, we believe there is a significant opportunity for a community-focused bank to provide a full range of financial services to small and middle-market commercial and retail customers. By offering quicker decision making in the delivery of banking products and services, offering customized products where appropriate, and providing customer access to our senior managers, we distinguish ourselves from larger, regional banks operating in our market areas, while our larger capital base and product mix enable us to compete effectively against smaller banks. As a result, we believe we have a substantial opportunity to attract experienced management, loan officers and banking customers. We believe this will provide us a competitive advantage as we continue to expand into attractive, high growth markets around the St. Louis metropolitan area through the establishment of de novo bank branch offices, acquisitions of community banks and bank branches, and organic expansion where possible by growing our existing branches in their respective communities.
Our strategy centers around our continued development into a full-service, community-oriented bank and the expansion of our physical footprint to more adequately cover the large geography of the St. Louis metropolitan area. Our efforts to grow assets and earnings are dependant upon the successful growth in each of our five core products: residential, commercial and home equity loans and checking and money market accounts. These five products provide the primary source of our operating income and are the focus of our growth in the balance sheet. We believe the marketplace to be more competitive than ever and that to achieve sustained growth these products must be delivered with both superior and efficient customer care. Driving these relationships are seasoned residential and commercial lenders in our two market areas.
Residential Loans. We have 83 years of experience in residential lending and, as of September 30, 2005, employed 55 residential loan officers in St. Louis and Kansas City. We have become a leading mortgage originator in these two markets, originating $1.2 billion in residential loans during the year ended September 30, 2005, as compared to $1.1 billion for the year ended September 30, 2004 and $1.6 billion for the year ended September 30, 2003. Originations increased in fiscal 2005 primarily as a result of the increased size of the commissioned residential lending staff.
- 7 -
Mortgage Revenue to Sales
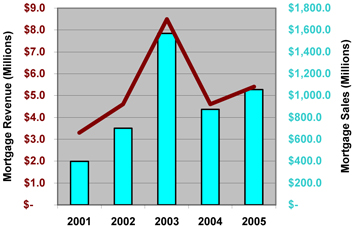
The majority of loans originated in the mortgage division are one- to four-family residential loans, which we sell to investors on a servicing-released basis. Residential mortgage loans sold to investors on a servicing-released basis are our largest source of non-interest income and are the primary component of mortgage revenue. For the year ended September 30, 2005, we sold $1.1 billion of residential loans to investors and had mortgage revenue of $5.4 million, compared to $872.3 million in loans sold and $4.6 million in revenue for the year ended September 30, 2004. The average balance of mortgage loans held for sale for the year ended September 30, 2005 was $50.8 million compared to $50.9 million for the year ended September 30, 2004. The flattening of the yield curve continues to negatively impact our spread on loans held for sale. Our margin on loans held for sale has steadily declined with the compressing yield curve from more than 400 basis points to 171 basis points in the quarter ended September 30, 2005. The consolidated net interest margin declined twenty-eight basis points from 3.47% at September 30, 2004 to 3.19% for the year ended September 30, 2005 primarily because of the narrowing margin on the held-for-sale portfolio. We fund loans held for sale with overnight and short-term advances because the loans are typically sold within 30 days of origination. Following a string of rate hikes by the Federal Reserve, our short-term borrowing costs have increased approximately 275 basis points since May 2004, while the average yield on the loans held for sale portfolio increased just 29 basis points from 5.17% at September 30, 2004 to 5.46% during the fiscal year ended September 30, 2005.
Qualifying residential mortgage loans that do not meet the standards for sale in the secondary market are retained in our portfolio and priced on a risk/reward basis. Residential loan balances increased $22.0 million to $289.4 million at September 30, 2005 from $267.4 million at September 30, 2004. The residential retained portfolio consists primarily of 3-year ARM loans that generally do not conform to investor criteria. These loans are underwritten using an internal credit-scoring model, which assesses credit risk and assigns one of five risk-based ratings to the loan. At September 30, 2005, we had approximately $17.1 million in the highest risk category.
During the year ended September 30, 2005, we sold $9.1 million of second mortgage residential loans from portfolio. Each pool was sold as we sought to reduce our concentration in second mortgage residential loans that have combined loan-to-values greater than 90%. We realized gains of $224,000 on the loan pool sales ($140,000 after tax). At September 30, 2005, we had $87.9 million of residential first and second mortgage loans that exceeded 90% loan-to-value.
Commercial Real Estate and Commercial and Industrial Loans. Since fiscal year 2004, we have made the expansion of our commercial division an important priority. As of September 30, 2005, this division had a staff of 14, including five loan officers. In the commercial division, commercial real estate and commercial and
- 8 -
industrial loans increased $74.0 million to $179.3 million at September 30, 2005 compared to $105.3 million at September 30, 2004. During the year, the commercial division contributed 59.1% of the growth in the Company’s retained loan portfolio. At September 30, 2005, the commercial division’s loan portfolio consisted of $104.1 million of commercial real estate loans, $26.3 million of commercial and industrial loans, $29.4 million of residential mortgage loans, $18.5 million in construction and development loans and $975,000 in equity lines. The weighted average rate on the commercial division’s loan portfolio was 6.67% at September 30, 2005, compared to 5.41% at September 30, 2004.
Commercial Division Loan Balances

The development of commercial relationships is also enhancing our ability to generate non-interest bearing checking account balances. At September 30, 2005, we had commercial checking and money market accounts of $35.3 million, which represented growth of $19.0 million in core business deposits. At September 30, 2005 the commercial division had $20.9 million in non-interest bearing deposits compared to $9.1 million at September 30, 2004.
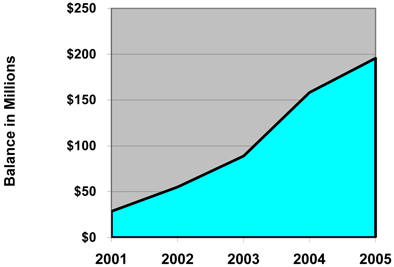
Home Equity Lines of Credit. The home equity lines of credit portfolio has grown consistently since fiscal 2001, although continued increases to prime rates have slowed the growth of this product in the latter part of the year as fewer customers are choosing prime-based equity lines with the origination of their first mortgages. Home equity loans consist primarily of revolving lines of credit secured by residential real estate. Equity line balances increased $37.3 million to $195.6 million at September 30, 2005 from $158.3 million at September 30, 2004. The weighted average rate on home equity loans was 7.05% at September 30, 2005 compared to 5.21% at September 30, 2004. Home equity lines of credit are typically approved for qualified borrowers in conjunction with first mortgage loan applications. The large volume of mortgage loans originated in recent years has provided many opportunities to cross-sell this product to customers, which has resulted in consistent strong growth. As a revolving line of credit, we originate the loans as a prime-based asset with low interest rate risk characteristics and attractive yields, lending stability to our net interest margin.
Because home equity lines of credit are generally subordinated to first mortgage loans, the risk of loss increases when the combined loan-to-value ratio increases in relation to the value of the property. Loan balances that exceed 90% of property values are generally insured for loss through mortgage insurance up to 90% of the value of the property.
- 9 -
Home Equity Loans
Checking Accounts. Checking accounts are the cornerstone relationship product in retail banking and the most valuable source of low cost deposits. Our “Totally Free Checking” account not only supports the lowest cost source of liquidity, but also generates important fee income through fees and service charges. The balance of checking accounts increased $9.4 million, or 18.6% during the year ended September 30, 2005 to $60.9 million from $51.5 million at September 30, 2004. The growth in checking account balances was fueled by growth in commercial checking accounts from the expanded commercial division. At September 30, 2005, the weighted average cost of interest-bearing checking accounts was 0.16%.
Retail banking revenue was $2.5 million for the year ended September 30, 2005 compared to $2.4 million for the year ended September 30, 2004. Our marketing focuses much of its resources on cross-selling checking accounts and developing new checking account relationships. We have established a consistent formula for growing fee income from “Free Checking” and have seen revenues increase from $1.3 million in fiscal 2001 to $2.5 million in fiscal 2005, primarily through an increase in clearing and honoring checks for customers who did not have sufficient funds in their checking account to allow the check to clear (“checking account overdrafts”). A fee is charged for every overdraft check. Credit risk can and does arise during the process of honoring overdraft checks. Retail banking fees are generated principally by honoring or rejecting these checks. Historic trends indicate most customers will eventually honor the overdraft checks; however, declines in market conditions could result in higher credit risk.
- 10 -
Non-Interest Bearing Checking Accounts
Money Market Deposits. Our strategic focus includes growing money market deposits as a second core liability product. The balance of money market accounts increased $7.2 million to $87.2 million at September 30, 2005 from $80.0 million at September 30, 2004. We are in our fifth year of pursuing money market accounts as a core product and in our fourth year of a successful marketing campaign, “the Big Bertha Money Market Account”. The product carries interest rate characteristics similar to our home equity loans and is an ideal source of funds for the growth of our line of credit portfolio. Money market accounts are generally less interest rate sensitive and more stable than CD balances. Competition for money market accounts increased during the third quarter of fiscal 2005, as several banks made aggressive marketing efforts to expand their share of this market. We stayed disciplined in our pricing and experienced slower growth toward the end of the year. At September 30, 2005, money market deposits had a weighted average cost of 2.37% compared to the weighted average coupon on the home equity loan portfolio of 7.05%, yielding a net spread of 4.68%. At September 30, 2004, money market deposits had a weighted average cost of 1.42% compared to the weighted average coupon on the home equity loan portfolio of 5.21%, yielding a net spread of 3.79% on these two products.
Money Market Balances
- 11 -
Comparison of Operating Results from 2005 and 2004
Overview
Fiscal year 2005 was another successful year as the Company grew diluted earnings per share 26.9% to $0.85 from $0.67 on net income of $7.5 million for the year ended September 30, 2005, compared to $5.9 million for the year ended September 30, 2004. The Company also increased assets 23.8% to $789.9 million at September 30, 2005 from $637.9 million at September 30, 2004.
Net income increased $1.6 million to $7.5 million primarily on the growth of net interest income. Net interest income expanded $5.1 million to $21.1 million for the year ended September 30, 2005 compared to $16.0 million for the year ended September 30, 2004 due primarily to growth in the loan portfolio, which increased 24.0% to $633.2 million at September 30, 2005 from $510.6 million at September 30, 2004, and was offset by growth in interest bearing liabililities. Commercial lending drove approximately 60% of the growth in the retained loan portfolio during the year ended September 30, 2005, while increases in home equity loans and residential loans accounted for 40%.
Non-interest income grew primarily from growth in the mortgage division. In fiscal year 2005, the Company had a strong mortgage-lending year originating $1.6 billion in loans. As a top lender in St. Louis and Kansas City, the Company generated mortgage revenue of $5.4 million for the year ended September 30, 2005, compared to $4.6 million for the year ended September 30, 2004.
The loan portfolio grew $122.6 million, or 24.0%, during fiscal year 2005 to $633.2 million and $233.7 million, or 84.4%, in fiscal year 2004.
- 12 -
Portfolio Mix at 9/30/2005

Portfolio Mix at 9/30/2001

The above charts show changes in the loan portfolio over the last four years. The loan portfolio in 2005 was $633.2 million compared to $204.1 million in 2001.
For the year, loan growth slightly outpaced deposit growth. For the year, deposits increased $114.7 million to $521.5 million, including $25.4 million of deposits that will be transferred in connection with the pending sale of our Kansas City branch. Demand deposit accounts, including money market and passbooks, increased $15.4 million during the year while commercial transaction accounts increased $15.9 million to $35.4 million. Over the last year, our non-interest-bearing checking account balances increased 85% to $30.0 million due primarily to the growth in commercial relationships. At September 30, 2005, the weighted average cost of interest-bearing checking accounts was 0.16% and totaled $31.0 million. During the year, the growth in the loan portfolio was primarily funded by growth in CD deposits. At September 30, 2005, CD balances totaled $341.0 million. Brokered deposits made up approximately 34.9%, or $118.9 million, of the CD balances at September 30, 2005. Brokered CD balances were $81.9 million at September 30, 2004.
During the year, our efficiency ratio remained strong despite significant growth in expenses related to entering new lines of business with the title and bond divisions and expanding our audit and compliance divisions in accordance with the Sarbanes-Oxley Act of 2002. Our efficiency ratio in fiscal 2005 was 57.77% compared to 56.56% in fiscal 2004.
- 13 -
Average Balance Sheet
The following table sets forth information regarding average balances of assets and liabilities as well as the total dollar amounts of interest income from average interest -earning assets and interest expense on average interest-bearing liabilities, resultant yields, interest rate spread, net interest margin, and ratio of average interest-earning assets to average interest-bearing liabilities for the periods indicated.
| | | | | | | | | | | | | | | | | | | | | | | | | | | | | | |
| | | Years Ended September 30,
| |
| | | 2005
| | | 2004
| | | 2003
| |
| | | Average Balance
| | Interest and Dividends
| | | Yield/ Cost
| | | Average Balance
| | Interest and Dividends
| | | Yield/ Cost
| | | Average Balance
| | Interest and Dividends
| | | Yield/ Cost
| |
| | | (Dollars in thousands) | |
Interest-earning assets: | | | | | | | | | | | | | | | | | | | | | | | | | | | | | | |
Loans receivable | | $ | 584,134 | | $ | 34,156 | | | 5.85 | % | | $ | 387,670 | | $ | 20,454 | | | 5.28 | % | | $ | 250,002 | | $ | 14,676 | | | 5.87 | % |
Loans held for sale | | | 50,815 | | | 2,774 | | | 5.46 | % | | | 50,947 | | | 2,635 | | | 5.17 | % | | | 125,327 | | | 5,945 | | | 4.74 | % |
Debt securities | | | 7,200 | | | 202 | | | 2.80 | % | | | 3,891 | | | 169 | | | 4.34 | % | | | 3,021 | | | 177 | | | 5.86 | % |
FHLB stock | | | 5,704 | | | 222 | | | 3.89 | % | | | 5,073 | | | 107 | | | 2.11 | % | | | 7,031 | | | 211 | | | 3.00 | % |
Mortgage-backed securities | | | 8,373 | | | 274 | | | 3.27 | % | | | 7,749 | | | 390 | | | 5.04 | % | | | 5,651 | | | 387 | | | 6.85 | % |
Other (including fed funds) | | | 5,184 | | | 165 | | | 3.19 | % | | | 5,254 | | | 56 | | | 1.07 | % | | | 2,913 | | | 29 | | | 1.00 | % |
| | |
|
| |
|
|
| | | | |
|
| |
|
|
| | | | |
|
| |
|
|
| | | |
Total interest-earning assets | | | 661,410 | | | 37,793 | | | 5.71 | % | | | 460,584 | | | 23,811 | | | 5.16 | % | | | 393,945 | | | 21,425 | | | 5.44 | % |
| | | | | | | | | |
Non-interest-earning assets | | | 48,537 | | | | | | | | | | 36,995 | | | | | | | | | | 24,547 | | | | | | | |
| | |
|
| | | | | | | | |
|
| | | | | | | | |
|
| | | | | | | |
Total assets | | $ | 709,947 | | | | | | | | | $ | 497,579 | | | | | | | | | $ | 418,492 | | | | | | | |
| | |
|
| | | | | | | | |
|
| | | | | | | | |
|
| | | | | | | |
Interest-bearing liabilities: | | | | | | | | | | | | | | | | | | | | | | | | | | | | | | |
Interest- bearing deposits | | $ | 444,517 | | $ | 10,182 | | | 2.29 | % | | $ | 332,025 | | $ | 5,197 | | | 1.57 | % | | $ | 239,190 | | $ | 4,425 | | | 1.85 | % |
FHLB advances | | | 163,071 | | | 5,414 | | | 3.32 | % | | | 96,023 | | | 2,350 | | | 2.45 | % | | | 122,084 | | | 3,303 | | | 2.71 | % |
Note payable | | | 3,701 | | | 176 | | | 4.75 | % | | | 2,372 | | | 76 | | | 3.20 | % | | | 312 | | | 10 | | | 3.21 | % |
Subordinated debt | | | 17,471 | | | 919 | | | 5.26 | % | | | 4,689 | | | 183 | | | 3.90 | % | | | — | | | — | | | — | |
| | |
|
| |
|
|
| | | | |
|
| |
|
|
| | | | |
|
| |
|
|
| | | |
Total interest-bearing liabilities | | | 628,760 | | | 16,691 | | | 2.66 | % | | | 435,109 | | | 7,806 | | | 1.79 | % | | | 361,586 | | | 7,738 | | | 2.14 | % |
| | | | | |
|
|
| | | | | | | | | | | | | | | | | | | | | | | |
Non-interest-bearing liabilities: | | | | | | | | | | | | | | | | | | | | | | | | | | | | | | |
Non-interest-bearing deposits | | | 21,264 | | | | | | | | | | 12,145 | | | | | | | | | | 7,158 | | | | | | | |
Other non-interest-bearing liabilities | | | 14,727 | | | | | | | | | | 12,108 | | | | | | | | | | 14,461 | | | | | | | |
| | |
|
| | | | | | | | |
|
| | | | | | | | |
|
| | | | | | | |
Total non-interest-bearing liabilities | | | 35,991 | | | | | | | | | | 24,253 | | | | | | | | | | 21,619 | | | | | | | |
Stockholders’ equity | | | 45,196 | | | | | | | | | | 38,217 | | | | | | | | | | 35,287 | | | | | | | |
| | |
|
| | | | | | | | |
|
| | | | | | | | |
|
| | | | | | | |
Total liabilities and stockholders’ equity | | $ | 709,947 | | | | | | | | | $ | 497,579 | | | | | | | | | $ | 418,492 | | | | | | | |
| | |
|
| | | | | | | | |
|
| | | | | | | | |
|
| | | | | | | |
Net interest income | | | | | $ | 21,102 | | | | | | | | | $ | 16,005 | | | | | | | | | $ | 13,687 | | | | |
| | | | | |
|
|
| | | | | | | |
|
|
| | | | | | | |
|
|
| | | |
Interest rate spread (2) | | | | | | | | | 3.05 | % | | | | | | | | | 3.37 | % | | | | | | | | | 3.30 | % |
Net interest margin (3) | | | | | | | | | 3.19 | % | | | | | | | | | 3.47 | % | | | | | | | | | 3.47 | % |
Ratio of average interest-earning assets to average interest-bearing liabilities | | | | | | 105.19 | % | | | | | | | | | 106.17 | % | | | | | | | | | 108.95 | % | | | |
| | | | | |
|
|
| | | | | | | |
|
|
| | | | | | | |
|
|
| | | |
| (1) | Includes non-accrual loans with an average balance of $ 1,075,000, $366,000 and $371,000 for the fiscal years ended September 30, 2005, 2004 and 2003, respectively. |
| (2) | Yield on interest-earning assets less cost of interest-bearing liabilities. |
| (3) | Net interest income divided by average interest-earning assets. |
- 14 -
Net Interest Income
Net interest income is the difference between interest income on earning assets, such as loans and securities, and the interest expense on liabilities used to fund those assets, including interest bearing deposits, FHLB advances and other borrowings. The amount of net interest income is affected by both changes in the level of interest rates and the amount and composition of earning assets and interest earning liabilities. Net interest income increased $5.1 million to $21.1 million for fiscal 2005 compared to $16.0 million for fiscal 2004. The increase was due to a 43.6% increase in the average balance of interest earning assets, which increased $200.8 million to $661.4 million for fiscal year 2005, compared to $460.6 million for fiscal year 2004. The net interest margin declined 28 bps to 3.19% in fiscal 2005 from 3.47% in fiscal 2004. The net interest margin declined during the year primarily from the continued narrowing spread on loans held for sale as well as higher costs on funds from the Federal Home Loan Bank and higher deposit costs. During the year, our net interest margin was negatively impacted 28 basis points from the spread on this portfolio and the cost of one-week advances from the FHLB narrowed. By the fourth quarter of fiscal year 2005 the spread on this portfolio had dropped to 1.71% from what had been over 400 basis points at the end of fiscal year 2004.
Interest income increased $14.0 million to $37.8 million for fiscal 2005 compared to $23.8 million for fiscal 2004. During the year, the average balance of loans increased $196.3 million to $634.9 million for fiscal 2005. The yield on interest earning assets increased from 5.16% for the year ended September 30, 2004 to 5.71% at September 30, 2005. Due to the growth of prime-based home equity and commercial loans, our assets remain sensitive to changes in interest rates, with 65% of assets set to reprice within 12 months of September 30, 2005.
Interest expense increased $8.9 million to $16.7 million for fiscal 2005 compared to $7.8 million for fiscal 2004. Interest expense grew due to both changes in cost and average balance. The cost of interest-bearing liabilities increased from 1.79% for fiscal year 2004 to 2.66% for the fiscal year ended 2005 as market rates increased in response to increases in the federal funds rate. The rise in costs relate to both higher costs of borrowings from the FHLB as well as higher costs on core deposit and brokered funds. The average balance of interest-bearing liabilities also increased $192.0 million in fiscal year 2005 to $628.8 million primarily due to increases in demand deposit balances (checking, passbook and money market account balances). Our liabilities also remain sensitive to changes in interest rates, with 67% of liabilities set to reprice within 12 months at September 30, 2005.
ADDITIONAL DISCUSSIONON FINANCIAL CONDITION
Cash and cash equivalents increased $5.4 million to $25.7 million at September 30, 2005 from $20.3 million at September 30, 2004. Cash balances included overnight and fed funds investments of $9.1 million at September 30, 2005. Cash balances typically accumulate from proceeds from the sale of loans. These funds are generally used to retire short-term borrowings and to fund loan growth.
Debt securities available for sale declined $9.2 million during the year from $9.2 million at September 30, 2004. During the year, several investments matured and were not replaced with new securities.
Debt securities held to maturity increased $6.0 million during the year to $6.0 million at September 30, 2005. Purchases of debt securities were made in order to provide sufficient collateral for certain deposit relationships.
Federal Home Loan Bank (of Des Moines) stock increased approximately $1.0 million to $8.5 million at September 30, 2005 from $7.5 million at September 30, 2004. Customers of the FHLB are required to hold 5% of the advances borrowed in stock. Consequently, $8.5 million of stock was required on the $171.0 million of advances from the FHLB.
Loans held for sale increased $15.1 million to $64.3 million at September 30, 2005 from $49.2 million at September 30, 2004. These balances represent loans closed in the name of the Bank, but which are committed in advance of closing to be sold to investors. Since these loans are pre-sold at a pre-determined price on a best efforts basis, we are not subject to changes in the future value to be received upon delivery of these loans to investors as a result of changes in interest rates. We generally receive proceeds from the sale of these loans to investors within 30 days of loan closing and benefit from interest income while awaiting sales delivery.
- 15 -
Real estate acquired in settlement of loans declined $314,000 to $754,000 at September 30, 2005 from $1.1 million at September 30, 2004. The real estate owned at year-end consists of several residential properties. The properties have been written down to net realizable value to allow for selling costs and no further losses are expected on the disposal of these properties.
Premises and equipment increased $3.0 million to $13.7 million from $10.7 million at September 30, 2004. Premises and equipment increased during the year as we opened a new branch location in Chesterfield Valley, Missouri, purchased raw land in Florissant for a future location, added building improvements to our home office and financial center and invested in equipment and furniture for additional new employees hired during the year.
Bank-owned life insurance (“BOLI”) increased $4.0 million to $15.6 million at September 30, 2005 from $11.6 million at September 30, 2004. The increase was attributable to the purchase of an additional policy of $3.5 million, combined with an increase in the policies’ cash surrender value of approximately $600,000 during the year. The increase in cash surrender value is treated as other income and is tax-exempt. In the event the cash-surrender values of the policies were liquidated, the gains would retroactively be taxed. The BOLI policies were purchased to offset escalating costs of employee benefits.
At September 30, 2005, the Company hadother assets of $7.8 million compared to $4.9 million at September 30, 2004, which consists primarily of a deferred tax asset of $4.2 million and $3.6 million of other miscellaneous receivables and prepaid expenses.
Federal Home Loan Bank (of Des Moines) advancesincreased $16.4 million to $171.0 million at September 30, 2005 compared to $154.6 million at September 30, 2004. The growth in borrowings was due to more rapid growth in loans and other assets than growth in deposits and equity. At September 30, 2005, $101.0 million of the advances matured in one week or less and were used to fund loans held for sale and other prime-based loans.
Subordinated debentures were issued for $10.3 million during the year ending September 30, 2005. The Company issued $10.3 million of subordinated debentures to support the Bank’s regulatory capital levels, which had declined due to rapid asset growth. At September 30, 2005, subordinated debentures totaled $19.6 million compared to $9.3 million at September 30, 2004.
Due to other banks decreased to $13.6 million at September 30, 2005 compared to $14.5 million at September 30, 2004. Due to other banks represents un-remitted payments for bank and cashier checks issued on September 30, 2005, and the increase represents an increase in check activity on the final day of the fiscal year end. In the normal course of business, settlement for amounts due to other banks is made the following business day.
Total stockholders’ equity increased $7.2 million to $48.2 million at September 30, 2005 from $41.0 million at September 30, 2004. The increase was due primarily to growth in retained earnings, which was driven by net income of $7.5 million. Stockholders’ equity also increased $533,000 from tax benefits on stock options and restricted stock awards, $974,000 from the exercise of stock options, $762,000 on shares released from the employee stock ownership plan, and $90,000 from restricted shares. During the 2005 fiscal year, we repurchased 13,717 shares at an average cost of $13.87 for a total of $190,194. In addition, we paid regular dividends of $2.3 million and had a comprehensive loss of $42,000 that reduced stockholders’ equity. Treasury stock – equity trust increased $1.1 million due to stock purchases for the plan. We maintain an equity trust plan for the benefit of a select group of top-performing loan officers and other key staff outside of senior management. The shares purchased for the trust have no net impact on equity as the trustee purchased the shares from the open market using deferred commissions and other earnings, and are reflected as both an increase to treasury shares and an increase to additional paid-in capital. The shares continue to be reflected as outstanding for earnings per share calculations.
NON-PERFORMING ASSETSAND DELINQUENCIES
Total non-performing assets increased $1.5 million from $5.3 million at September 30, 2004 to $6.8 million at September 30, 2005. The increase in non-performing assets was due primarily to an increase in past-due residential real estate loans, which increased $1.0 million during the year. At September 30, 2005, we had $4.9 million in non-performing residential assets, including $754,000 of real estate acquired in settlement of loans, compared to $3.9 million in non-performing residential assets, including $1.1 million of real estate acquired in
- 16 -
settlement of loans at September 30, 2004. In the Midwest region of the United States, residential properties have not experienced unusually high price appreciation over the last ten years and therefore have not experienced any significant price declines during down housing markets. In an economic environment that resulted in declining residential values, we would be at increased risk of credit losses from non-performing loans.
Non-performing home equity loans increased $337,000 during the year. At September 30, 2005, we had a balance of $618,000 of non-performing home equity loans, or 0.32% of the home equity loan portfolio, and had $10,000 in charge-offs during the year ended September 30, 2005. At September 30, 2004, we had $281,000 in non-performing home equity balances, or 0.18% of the home equity portfolio.
At September 30, 2005, we had one substandard commercial loan, which was a residential construction loan to a commercial borrower in the amount of $456,000.
PROVISIONFOR LOAN LOSSES
The provision for loan losses totaled $1.6 million for the year ended September 30, 2005 compared to $1.9 million for the year ended September 30, 2004. The decrease in the provision for loan losses during the year was due primarily to smaller increases in commercial, home equity and residential loans, compared to the previous period. For the year ended September 30, 2005, we had net loan losses of $44,000 from residential real estate loans compared to $67,000 for the year ended September 30, 2004 and $15,000 during the year ended September 30, 2003. We have no charge-off history with our commercial loan portfolio, although a $1.5 million non-performing commercial loan was sold in September for no gain.
ALLOWANCEFOR LOAN LOSSES
The allowance for loan losses increased $1.2 million to $6.8 million at September 30, 2005 from $5.6 million at September 30, 2004. The increase in the allowance for loan loss was due primarily to an increase in the balance of loans in our performing risk rating categories of our allowance for loan loss methodology. The performing retained loan portfolio increased approximately $120 million and we typically reserve between 40 and 125 basis points on performing loans depending on management’s assessment of risk on the loans. The allowance as a percentage of non-performing loans decreased from 130.64% at September 30, 2004 to 113.51% at September 30, 2005, while the allowance as a percentage of total loans decreased slightly from 0.99% at September 30, 2004 to 0.97% at September 30, 2005. Loans that were 90 days or more past due and still accruing interest were $5.8 million and $3.7 million at September 30, 2005 and 2004, respectively. The increase was due to a rise in the number of non-performing residential first mortgages and second mortgage home equity loans.
DISCUSSIONOF OTHER NON-INTEREST INCOME
Title Division Results. Our title division, which began operations in June 2004, was established to capture sales opportunities from the mortgage and commercial divisions’ lending activities. The title division’s primary activities include researching and issuing title policies on mortgage and commercial loans. The division had operating profits for the year ended September 30, 2005 of $298,000 on revenue of $795,000, compared to a net operating loss of $75,000 in the first three months the business unit was in operation in fiscal 2004. The operating loss in 2004 was due primarily to startup costs. Driving earnings during fiscal 2005 were 2,707 title orders compared to 383 during fiscal 2004. At September 30, 2005, the division had cash balances of $397,000 and escrow liabilities of $122,000.
Investment Division Results. The investment division is a newly formed business unit that began operations in the first quarter of fiscal year 2005. The investment division’s activities consist primarily of brokering bonds to other community banks, municipalities and high net worth individuals. Due to the flattening yield curve, many of the division’s regular buyers of bonds are choosing not to invest in bonds until the rate environment improves. During the year, we had an operating loss of $197,000 on revenues of $668,000. The division had operating expenses of $865,000, which consist primarily of compensation expense.
- 17 -
Insurance commissionsdecreased $127,000 to $207,000 for the year ended September 30, 2005 from $334,000 for the year ended September 30, 2004. Insurance commissions stem primarily from revenue received for brokering annuity sales to insurance companies. In 2004, we had several large sales that bolstered 2004 insurance commission revenue.
Gain on sale of securities There were no sale of securities for the fiscal year-ended September 30, 2005, compared with $736,000 during fiscal 2004. The prior year gain was due to the sale of certain equity securities.
Other income increased $301,000 to $1.1 million for the year ended September 30, 2005 from $799,000 for the year ended September 30, 2004. Other income consists primarily of fee income from correspondent banks and changes in value of bank-owned life insurance policies (“BOLI”). Correspondent bank revenues rose due to increased crediting rates on changes in the interest rate environment and the BOLI revenue grew due to an additional policy purchase during fiscal year 2005.
DISCUSSIONOF OTHER NON-INTEREST EXPENSE
Salaries and employee benefitsexpense increased $2.7 million to $9.2 million for the year ended September 30, 2005 from $6.5 million for the year ended September 30, 2004. Compensation expense increased due to the addition of 60 new employees in fiscal year 2005. The staff growth resulted from the addition of employees to the investment, title, and commercial divisions as well as audit and accounting staff relating to Sarbanes-Oxley Act compliance.
Occupancy and equipmentexpense increased $545,000 to $4.2 million for the year ended September 30, 2005 from $3.6 million for the year ended September 30, 2004. The increase in expense was due primarily to the addition in fiscal 2005 of the Chesterfield bank location and renovation of our main office location.
Loss on derivative instruments increased $320,000 during the year to $320,000 at September 30, 2005 from $0 for the year ended September 30, 2004. As discussed in Note 23 to the consolidated financial statements, we restated our results for the quarters ended December 31, 2004, March 31, 2005 and June 30, 2005.
Other expenses increased $765,000 to $2.9 million during fiscal 2005 from $2.2 million in fiscal 2004. The increase was largely due to increase in our staff and the addition of a new office, as well as newly introduced Sarbanes-Oxley Act procedures, increases in stationery costs, underwriting costs, document delivery expenses, and ATM/check losses.
INCOME TAXES
The provision for income taxes increased from $3.5 million for the year ended September 30, 2004 to $4.4 million for the year ended September 30, 2005 due to increase in net income for the fiscal year 2005. The effective tax rate for fiscal 2005 declined from 37.3% in fiscal year 2004 to 37.1% in fiscal year 2005.
RESULTSOF OPERATIONS FORTHE YEARS ENDED SEPTEMBER 30, 2004AND 2003
OverviewFiscal year ended September 30, 2004 was a highly successful year as we increased assets 58.9% to $637.9 million from $401.4 million at September 30, 2003. This increase consisted primarily of portfolio loans, which increased 84.4% to $510.6 million at September 30, 2004 from $276.9 million at September 30, 2003.
Net income increased $84,000 to $5.9 million for the year ended September 30, 2004, compared to $5.8 million for the year ended September 30, 2003. While we established record earnings in fiscal 2004 due to increased net interest income, we had to overcome a significant hurdle due to a 46% decline in mortgage revenue, which fell to $4.6 million during the year ended September 30, 2004 from $8.5 million during the year ended September 30,
- 18 -
2003. In fiscal 2003, we had our best mortgage-lending year in history, originating and selling nearly $1.6 billion in mortgage loans in St. Louis and Kansas City.
In the fourth quarter of fiscal 2003, the strong mortgage-banking environment collapsed due to increases in interest rates. To overcome the lost revenue from the mortgage banking division, we determined to transition beyond our history as a small local thrift that specialized in mortgage lending into a growth-oriented community bank. We reformed our strategic plan to expand our commercial banking presence through recruitment and human talent acquisition and to continue expanding our retail and mortgage banking operations. At the end of fiscal 2003, we hired three experienced commercial loan officers. The commercial loan department increased its loan portfolio to more than $105.0 million at September 30, 2004 from a balance of $16.4 million at September 30, 2003 and took in more than $32 million in commercial deposits. In addition to expanding the commercial portfolio, the residential and home equity divisions continued to sell and expand their retained portfolios resulting in a net $233.7 million increase in the retained loan portfolio.
During the year ended September 30, 2004, our efficiency ratio remained strong despite the decline in the mortgage banking division. Our efficiency ratio in fiscal 2004 was 56.56% compared to 55.87% in fiscal 2003.
Net Interest Income Net interest income increased $2.3 million to $16.0 million for fiscal 2004 compared to $13.7 million for fiscal 2003. The increase was primarily due to growth in the average balance of interest earning assets, which increased $68.1 million to $462.0 million for fiscal 2004, compared to $393.9 million for fiscal 2003. The net interest margin was unchanged at 3.47% in fiscal 2004 compared to fiscal 2003.
Interest income increased $2.4 million to $23.8 million for fiscal 2004 compared to $21.4 million for fiscal 2003. During the year, the average balance of loans increased $63.3 million to $438.6 million for fiscal 2004. The average balance of loans receivable increased $137.7 million during the year, but the impact of this growth was offset by the decline in average balance of loans held for sale, which declined $74.4 million to $50.9 million for the year ended September 30, 2004. Loans held for sale declined due to the overall decline in the mortgage banking industry. The yield on interest earning assets declined from 5.44% to 5.16% due to the growth of prime-based home equity and commercial loans that have lower weighted average yields but have a rate that adjusts monthly.
Interest expense increased $67,000 to $7.8 million during fiscal 2004 compared to $7.7 million for fiscal 2003. Interest expense was largely unchanged despite a $73.5 million increase in the average balance of interest bearing liabilities. Cost of interest bearing liabilities declined primarily due to a decline in the average rate paid on interest bearing liabilities, which dropped from 2.14% during fiscal 2003 to 1.79% for fiscal 2004. Increases in demand deposit balances (checking, passbook and money market account balances) and declining rates on CDs and FHLB advances lowered the weighted average cost of interest bearing liabilities. The average balance of demand deposit accounts increased $32.9 million to $165.2 million during fiscal 2004, with a weighted average cost of 0.81%. The weighted average cost of CDs and FHLB advances declined from 2.17% and 2.71% in fiscal 2003, respectively to 1.83% and 2.45% in fiscal 2004, respectively. The average rate paid on CDs and FHLB advances both declined due to the general declining rate environment of fiscal 2003, which resulted in a sustained low rate environment in fiscal 2004. In addition, we benefited from early retirement of $10.0 million of long-term debt during fiscal 2003 that lowered interest expense in fiscal 2004.
Provision for Loan LossesThe provision for loan losses totaled $1.9 million for the year ended September 30, 2004, compared to $1.5 million for the year ended September 30, 2003. The increase in the provision for loan losses during the year was due primarily to the higher balance of commercial loans, home equity lines of credit and lower credit residential loans, which carry a higher level of risk than the portfolio that existed at September 30, 2003.
- 19 -
Non-Interest Income Mortgage revenue fell to $4.6 million during the year ended September 30, 2004 from $8.5 million during the year ended September 30, 2003. In fiscal 2003, we had our best mortgage-lending year in history, originating and selling nearly $1.6 billion in mortgage loans in St. Louis and Kansas City.
Retail banking revenue increased $509,000 to $2.4 million for the year ended September 30, 2004 compared to $1.9 million for the year ended September 30, 2003. Growth in retail banking revenues stemmed from fees associated with the continued growth of the “Free-Checking” program through marketing, sales and customer service.
Insurance commissions increased $134,000 to $334,000 for the year ended September 30, 2004 from $200,000 for the year ended September 30, 2003. Insurance commissions stem primarily from revenue received for brokering annuity sales to insurance companies. In 2004, we bolstered our sales efforts.
The title division, which began generating revenues in the fourth quarter of 2004, generated $134,000 in fees for the year ended September 30, 2004. During its brief operations in fiscal 2004, the division’s sales consisted primarily of selling policies to our residential mortgage borrowers in connection with the origination of their residential mortgage loans.
Gain on sale of securities increased $662,000 to $736,000 during fiscal 2004 compared to $74,000 during fiscal 2003. The increase in the gain was due to the decision to sell certain equity securities during the first two quarters of fiscal 2004.
Other income increased $71,000 to $799,000 for the year ended September 30, 2004 from $728,000 for the year ended September 30, 2003. Other income consists primarily of fee income from correspondent banks, and return from changes in value of the BOLI.
Non-Interest ExpenseSalaries and employee benefits expense declined $407,000 to $6.5 million during the year ended September 30, 2004 from $6.9 million during the year ended September 30, 2003. While we added employee costs for the growth in the commercial, title, home equity and retail banking divisions, the costs associated with the residential mortgage division declined. Salaries expense during fiscal 2003 was elevated due to management’s decision to accelerate the release of 41,918 shares of stock under the employee stock ownership plan, which resulted in approximately $513,000 of additional expense during the year ended September 30, 2003.
Occupancy and equipment expense increased $718,000 to $3.6 million for the year ended September 30, 2004 from $2.9 million for the year ended September 30, 2003. The increase in expense was due primarily to the fiscal 2003 mid-year additions of two bank locations and one 26,000 square foot office location adjacent to the main bank to house the residential mortgage division.
Other and early debt extinguishment expense declined $702,000 to $2.2 million during fiscal 2004 from $2.9 million in fiscal 2003. The decline was largely due to one time expense taken in 2003 for prepayment penalties on FHLB advances, which totaled $613,000.
Income Taxes The provision for income taxes decreased from $3.9 million for the year ended September 30, 2003 to $3.5 million for the year ended September 30, 2004 due to a lower effective tax rate in fiscal 2004 of 37.3% compared to 40.1% in fiscal 2003. The decreased tax expense resulted from permanent tax differences from shares released from the ESOP. When shares are released from the ESOP, there is a permanent difference on the share release. We have booked expense at the fair-market value of the shares released but get taxable expense deductions equivalent to historic cost of the shares. There were more shares released to participants of the plan in fiscal 2003 than in fiscal 2004.
- 20 -
Additional Discussion on Financial Condition at September 30, 2004 and 2003
For the year, loan growth outpaced deposit growth. Total deposits increased $93.2 million to $406.8 million at September 30, 2004 from $313.6 million at September 30, 2003. Demand deposit accounts, including checking, money market and passbook accounts, increased $32.9 million to $165.2 million. Demand deposit accounts at a weighted average cost of 0.81% at September 30, 2004 represent the lowest cost-funding source for the Bank. Time deposit balances also increased $60.2 million and totaled $241.6 million at September 30, 2004. At September 30, 2004, we had $52.1 million in deposits through brokered issued certificates of deposit.
Federal Home Loan Bank advances increased $123.1 million to $154.6 million at September 30, 2004 from $31.5 million at September 30, 2003, which were primarily used to support loan growth.
Cash and cash equivalents increased $1.6 million to $20.3 million at September 30, 2004 from $18.7 million at September 30, 2003. Cash balances included overnight and fed funds investments of $4.1 million at September 30, 2004, which are funds that typically accumulate from sold loan proceeds wired from investors.
Debt securities available for sale increased $7.1 million during the year to $9.2 million at September 30, 2004 from $2.1 million at September 30, 2003. During the year, we purchased an $8.0 million investment to be used for collateral to be pledged against institutional deposits.
Federal Home Loan Bank (of Des Moines) stock increased $3.6 million to $7.5 million at September 30, 2004 from $3.9 million at September 30, 2003. Customers of the FHLB are required to hold 5% of the advances borrowed in stock. Consequently, $7.5 million of stock was required on the $154.6 million of advances from the FHLB.
Loans held for sale declined $11.9 million to $49.2 million at September 30, 2004 from $61.1 million at September 30, 2003. These balances represent loans closed in the name of the Bank, but which are committed in advance of closing to be sold to investors.
BOLI increased $4.0 million to $11.6 million at September 30, 2004 from $7.6 million at September 30, 2003. The increase was attributed to the purchase of an additional policy of $3.5 million, combined with an increase in the policies’ cash surrender value of $447,000 during the year.
At September 30, 2004, we had other assets of $4.9 million, which consist primarily of a deferred tax asset of $3.3 million and $1.1 million of other miscellaneous receivables and prepaid expenses.
During the year ended September 30, 2004, we borrowed $4.0 million from a correspondent bank for operating needs of the holding company. At September 30, 2004, we had $3.8 million in other borrowed money. In addition, we issued $9.3 million of subordinated debt in fiscal 2004 to support the Bank’s regulatory capital levels, which had declined due to the rapid asset growth. At September 30, 2004, subordinated debentures totaled $9.3 million compared to none at September 30, 2003.
Total shareholders’ equity increased $4.6 million to $41.0 million at September 30, 2004 from $36.4 million at September 30, 2003. The increase was due primarily to growth in retained earnings, which was driven by net income of $5.9 million. Shareholders’ equity also increased $991,000 from tax benefits on equity-based compensation plans, $808,000 from the exercise of stock options, $421,000 on shares released from the employee stock ownership plan, and $199,000 from amortization of restricted stock awards. During the 2004 fiscal year, we repurchased 91,988 shares at an average cost of $17.03 for a total of $1.6 million. In addition, we paid regular dividends of $1.6 million and had a comprehensive loss of $464,000 that reduced shareholders’ equity. Treasury stock – equity trust increased $608,000 due to stock purchases for an equity compensation plan.
MARKET RISK ANALYSIS
Market risk is the risk of loss arising from adverse changes in the fair value of financial instruments or other assets due to changes in interest rates, currency exchange rates, or equity prices. Interest rate risk is our primary
- 21 -
market risk and results from timing differences in the repricing of assets and liabilities, changes in relationship between rate indices, and the potential exercise of explicit or embedded options will be realized.
NPV Analysis: NPV represents the market value of portfolio equity and is equal to the market value of assets minus the market value of liabilities, with adjustments made for off-balance sheet items. This analysis assesses the risk of loss in market risk sensitive instruments in the event of a sudden and sustained 100 to 300 basis point increase or decrease in market interest rates with no effect given to any steps that management might take to counter the effect of that interest rate movement. Using data compiled by the OTS, we receive a report, which measures interest rate risk by modeling the change in NPV, over a variety of interest rate scenarios.
| | | | | | | | |
Change in Interest Rates
| | 2005 Estimated Change in Net Portfolio Value (in thousands)
| | | 2004 Estimated Change in Net Portfolio Value (in thousands)
| |
300 basis point rise | | $ | (4,639 | ) | | $ | (8,506 | ) |
200 basis point rise | | | (1,925 | ) | | | (4,111 | ) |
100 basis point rise | | | (252 | ) | | | (1,171 | ) |
Base scenario | | | — | | | | — | |
100 basis point decline | | | (822 | ) | | | (953 | ) |
200 basis point decline | | | (3,196 | ) | | | N/A | |
The preceding table indicates that at September 30, 2005, in the event of an increase in prevailing market interest rates of 200 basis points, NPV would be expected to decline by $1.9 million, which equals 2.08% of static net portfolio valuation of $92.5 million. In the event of a sudden and sustained decrease in prevailing market interest rates, NPV would be expected to also decrease. In the event of a decrease in prevailing market rates of 200 basis points, NPV would be expected to decline by $3.2 million, which equals 3.46% of static net portfolio valuation.
- 22 -
The following table presents the Company’s financial instruments that are sensitive to changes in interest rates, categorized by expected maturity, and the instruments’ estimated fair values at September 30, 2005. Expected maturities use certain assumptions based on historical experience and other data available to management.
| | | | | | | | | | | | | | | | | | | | | | | | | | |
| | | Weighted Average Rate
| | | Within One Year
| | One Year to Three Years
| | | | After Three Years to Five Years
| | After Five Years to Ten Years
| | Beyond Ten
Years
| | Carrying Value Total
| | Estimated Fair Value
|
| | | (Dollars in Thousands) |
Interest Sensitive Assets | | |
Loans receivable - net (1) | | 6.59 | % | | $ | 382,840 | | $ | 118,299 | | | | $ | 62,433 | | $ | 36,546 | | $ | 33,077 | | $ | 633,195 | | $ | 630,904 |
Loans held for sale - net (2) | | 5.78 | % | | | 64,335 | | | — | | | | | — | | | — | | | — | | | 64,335 | | | 65,442 |
Debt securities - HTM | | 3.56 | % | | | 1,983 | | | 3,993 | | | | | — | | | — | | | — | | | 5,976 | | | 5,922 |
Mortgage-backed securities - HTM | | 8.12 | % | | | 158 | | | 12 | | | | | 32 | | | 2 | | | 446 | | | 650 | | | 699 |
Mortgage-backed securities - AFS | | 4.40 | % | | | — | | | 112 | | | | | 101 | | | 3,380 | | | 589 | | | 4,182 | | | 4,182 |
FHLB stock | | 1.40 | % | | | 8,462 | | | — | | | | | — | | | — | | | — | | | 8,462 | | | 8,462 |
Other (including fed funds) | | 3.80 | % | | | 9,130 | | | — | | | | | — | | | — | | | — | | | 9,130 | | | 9,130 |
| | | | | |
|
| |
|
| | | |
|
| |
|
| |
|
| |
|
| |
|
|
Total interest sensitive assets | | | | | $ | 466,908 | | $ | 122,416 | | | | $ | 62,566 | | $ | 39,928 | | $ | 34,112 | | $ | 725,930 | | $ | 724,741 |
| | | | | |
|
| |
|
| | | |
|
| |
|
| |
|
| |
|
| |
|
|
Interest Sensitive Liabilities | | | | | | | | | | | | | | | | | | | | | | | | | | |
Savings accounts | | 0.35 | % | | $ | 32,364 | | $ | — | | | | $ | — | | $ | — | | $ | — | | $ | 32,364 | | $ | 32,364 |
Demand deposit accounts (3) | | 0.16 | % | | | 30,962 | | | — | | — | | | — | | | — | | | — | | | 30,962 | | | 30,962 |
Money market accounts | | 2.37 | % | | | 87,172 | | | — | | — | | | — | | | — | | | — | | | 87,172 | | | 87,172 |
Certificate of deposit accounts (4) | | 3.35 | % | | | 189,569 | | | 68,483 | | | | | 43,065 | | | 39,892 | | | | | | 341,009 | | | 341,009 |
FHLB advances | | 3.93 | % | | | 126,000 | | | 25,900 | | | | | 19,100 | | | — | | | — | | | 171,000 | | | 169,622 |
Note payable | | 5.75 | % | | | 255 | | | 3,320 | | | | | — | | | — | | | — | | | 3,575 | | | 3,575 |
Subordinated debentures | | 5.90 | % | | | — | | | — | | | | | — | | | — | | | 19,589 | | | 19,589 | | | 19,589 |
| | | | | |
|
| |
|
| | | |
|
| |
|
| |
|
| |
|
| |
|
|
Total interest sensitive liabilities | | | | | $ | 466,322 | | $ | 97,703 | | | | $ | 62,165 | | $ | 39,892 | | $ | 19,589 | | $ | 685,671 | | $ | 684,293 |
| | | | | |
|
| |
|
| | | |
|
| |
|
| |
|
| |
|
| |
|
|
Off Balance Sheet Items | | | | | | | | | | | | | | | | | | | | | | | | | | |
Operating leases | | | | | $ | 290 | | $ | 442 | | | | $ | 14 | | $ | — | | $ | — | | $ | 746 | | $ | 746 |
| | | | | |
|
| |
|
| | | |
|
| |
|
| |
|
| |
|
| |
|
|
Commitments to extend credit | | 7.02 | % | | $ | 147,087 | | | | | | | | | | | | | | | | | | | | |
Unused lines of credit - residential | | | | | | 217,858 | | | | | | | | | | | | | | | | | | | | |
Unused lines of credit - commercial | | | | | | 14,077 | | | | | | | | | | | | | | | | | | | | |
| (1) | Includes non-accrual loans. |
| (2) | Maturity reflects expected contracted sales to investors. |
| (3) | Excludes non-interest bearing checking accounts of $30.0 million. |
| (4) | $80 million of the CDs in the three and five year categories are fixed rate maturities, but the interest rates are swapped for LIBOR 30 day rates. |
- 23 -
LIQUIDITY RISK
Liquidity risk arises from the possibility that we may not be able to satisfy current or future financial commitments, or may become unduly reliant on alternative funding sources. The objective of liquidity risk management is to ensure that the cash flow requirements of our depositors and borrowers, as well as our operating cash needs, are met. The Asset/Liability management committee meets regularly to consider the operating needs of the organization. Projected cash flows are prepared for a rolling 180 day period, with significant shortfalls in core deposit products examined and wholesale funding decisions made. Funds are available from a number of sources, including core deposits, Federal Home Loan Bank advances, brokered funds, other borrowings and portfolio loan sales.
We maintain adequate levels of liquidity to ensure the availability of funds to satisfy loan commitments and deposit withdrawals. At September 30, 2005, we had outstanding firm commitments to originate loans of $147.1 million, to sell loans on a best-efforts basis of $150.0 million and to fulfill commitments under unused lines of credit of $231.9 million. At the same time, certificates of deposit scheduled to mature in one year or less totaled $189.6 million. Based upon historical experience, management believes the majority of maturing certificates of deposit will remain with the Bank.
We require funds beyond our ability to generate them internally and we have the ability to borrow funds from the FHLB equal to 35% of its total assets subject to collateral verification. Under a blanket agreement, we assign all investments in FHLB stock, all qualifying first residential mortgage loans and all loans held for sale as collateral to secure the amounts borrowed. At September 30, 2005, we had $104.5 million available under the above-mentioned borrowing arrangement after advances of $171.0 million from the FHLB. We have an additional $12.0 million in unused liquidity through a line of credit with a correspondent bank. In addition, as long as the Bank maintains a “well capitalized” position, the Bank can issue deposits through a nationally brokered market. Broker deposits offer the advantage of large blocks of liquidity at a lower cost.
Our principal sources of funds are customer deposits, proceeds from loan sales and loan repayments, FHLB borrowings and maturity and principal payment of securities.
Operating activities used a net $2.3 million in cash liquidity, stemming primarily from net loans originated for sale including gains on sale which totaled $15.4 million for the year ended September 30, 2005.
Our primary investing activity is retaining loans. For the year ended September 30, 2005, cash used in investing activities included $138.9 million net increase in retained loans, $4.9 million in purchases of premises and equipment, $16.1 million in purchases of securities and FHLB stock, which was offset by $18.0 million from sale and maturity of securities and $1.6 million principal payments on mortgage-backed securities. Also, $3.5 million was used to purchase bank-owned life insurance policies.
At the holding company level, we paid dividends to stockholders of $2.3 million and repurchased common stock of approximately $190,000. The sources of funding for the holding company included dividends from the Bank and dividends and capital gains from equity securities. The main sources of cash from financing activities included $114.7 million from increase in deposits, $16.4 million proceeds from FHLB advances, and $10.3 million proceeds from issuance of subordinated debentures.
- 24 -
DERIVATIVES,CONTRACTUALOBLIGATIONSANDOFF-BALANCESHEETARRANGEMENTS
The following table presents certain contractual obligations as of September 30, 2005.
| | | | | | | | | | | | | | | |
| | | | | Payments due by period
|
| | | Total
| | Less than 1 Year
| | 1-3 Years
| | 3-5 Years
| | More than 5 years
|
Time deposits | | $ | 341,009 | | $ | 189,569 | | $ | 68,483 | | $ | 43,065 | | $ | 39,892 |
Advances from FHLB | | | 171,000 | | | 116,000 | | | 25,900 | | | 29,100 | | | — |
Note payable | | | 3,575 | | | 255 | | | 3,320 | | | | | | — |
Subordinated debentures | | | 19,589 | | | — | | | — | | | | | | 19,589 |
Operating lease obligations | | | 746 | | | 290 | | | 442 | | | 14 | | | — |
| | |
|
| |
|
| |
|
| |
|
| |
|
|
Total | | $ | 535,919 | | $ | 306,114 | | $ | 98,145 | | $ | 72,179 | | $ | 59,481 |
| | |
|
| |
|
| |
|
| |
|
| |
|
|
The Company has various financial obligations, including obligations that may require future cash payments. The above table presents, as of September 30, 2005, significant fixed and determinable contractual obligations to third parties by payment date. Further discussion of each obligation is included in the referenced notes to the consolidated financial statements.
In the normal course of operations, we engage in a variety of financial transactions that, in accordance with generally accepted accounting principles, are not recorded in our financial statements. These transactions involve, to varying degrees, elements of credit, interest rate and liquidity risk. Such transactions are used for general corporate purposes or to manage customers’ requests for funding. Corporate purpose transactions are used to help manage credit, interest rate, and liquidity risk or to optimize capital. Customer transactions are used to manage customers’ requests for funding.
Certain derivative instruments that we use for asset/liability management are recognized as either assets or liabilities on the balance sheet and measured at fair value. Beginning in November 2004, we entered into various interest rate swaps to hedge the interest rate risk inherent in some of our brokered CDs. At September 30, 2005, we had fixed-rate CDs totaling $80 million for which we had entered into structured interest rate swaps as part of a hedging program. Since inception of the hedging program, we have applied the “short-cut” method of fair value hedge accounting under Financial Accounting Standards (FAS) 133 to account for the swaps. In November 2005, in conjunction with KPMG LLP, our independent registered public accounting firm, we determined that these swaps do not qualify for the short-cut method because the related broker fee is considered to have caused the swap not to have zero value at inception (which is required under FAS 133 to qualify for the short-cut method). We entered into the transactions to better match the interest rate characteristics of its commercial and other prime adjusting loans. Economically, these transactions are satisfying their intended results. We reported a loss on derivative instruments for the year ended September 30, 2005 in the consolidated statements of income and comprehensive income of $320,000. The loss of $320,000 is comprised of the decrease in fair value of our interest rate swaps of $635,000, offset by the positive net settlements between our interest rate swaps and brokered certificates of deposit of $315,000. The losses incurred in the current period are expected to be recovered in future periods as the derivatives mature.
As discussed in Note 23 to the consolidated financial statements, we restated our results for the quarters ended December 31, 2004, March 31, 2005 and June 30, 2005 as a result of this issue.
CAPITAL RESOURCES
Pulaski Financial is not subject to any separate regulatory capital requirements. The Bank is required to maintain specific minimum amounts of capital pursuant to OTS regulations. The OTS minimum capital standards generally require the maintenance of regulatory capital sufficient to meet each of three tests, hereinafter described as the tangible capital requirement, the core capital requirement and risk-based capital requirement. The tangible capital requirement provides
- 25 -
for minimum tangible capital (defined as stockholders’ equity less all intangible assets) equal to 1.5% of adjusted total assets. The core capital requirement provides for minimum core capital (tangible capital plus certain forms of supervisory goodwill and other qualifying intangible assets) equal to 3.0% of adjusted assets. The risk-based capital requirement provides for the maintenance of core capital plus a portion of unallocated loss allowances equal to 8.0% of risk-weighted assets. In computing risk-weighted assets, the Bank multiplies the value of each asset on its balance sheet by a defined risk-weighting factor (e.g., one-to four-family conventional residential loans carry a risk-weighted factor of 50%).
At September 30, 2005, the Bank’s tangible capital totaled $67.7 million, or 8.60% of adjusted total assets, which exceeded the minimum 1.5% requirement by $55.9 million, or 7.10%. The Bank’s risk-based capital at that date totaled $74.3 million, or 10.85% of risk-weighted assets, which is $19.5 million, or 2.85% above the 8.0% fully phased-in requirement. The Bank’s core capital at that date totaled $67.7 million or 8.60% of average assets, which exceeded the minimum 4% requirement by $36.2 million or 4.60%.
EFFECTOF INFLATIONAND CHANGING PRICES
The consolidated financial statements and related financial data presented herein have been prepared in accordance with U.S. generally accepted accounting principles, which require the measurement of financial position and operating results in terms of historical dollars, without considering the change in the relative purchasing power of money over time due to inflation. The impact of inflation is reflected in the increased cost of our operations. Unlike most industrial companies, virtually all the assets and liabilities of a financial institution are monetary in nature. As a result, interest rates generally have a more significant impact on a financial institution’s performance than do general levels of inflation. Interest rates do not necessarily move in the same direction or to the same extent as the prices of goods and services.
- 26 -
RATE VOLUME ANALYSIS
The following table sets forth the effects of changing rates and volumes on net interest income for the periods indicated. Information is provided with respect to (i) effects on interest income attributable to changes in volume (changes in volume multiplied by prior rate); (ii) effects on interest income attributable to changes in rate (changes in rate multiplied by prior volume); (iii) changes in rate/volume (change in rate multiplied by change in volume); and (iv) the net change (the sum of the prior columns).
| | | | | | | | | | | | | | | | | | | | | | | | | | | | | | | | | | | | | | | | | | | | | | | | |
| | | 2005 Compared to 2004 Increase (Decrease) Due to
| | | 2004 Compared to 2003 Increase (Decrease) Due to
| | | 2000 Compared to 1999 Increase (Decrease) Due to
| |
| | | Rate
| | | Volume
| | | Rate/ Volume
| | | Net
| | | Rate
| | | Volume
| | | Rate/ Volume
| | | Net
| | | Rate
| | | Volume
| | | Rate/ Volume
| | | Net
| |
| | | (In thousands) | |
Interest-earning assets: | | | | | | | | | | | | | | | | | | | | | | | | | | | | | | | | | | | | | | | | | | | | | | | | |
Loans receivable | | $ | 2,214 | | | $ | 10,366 | | | $ | 1,122 | | | $ | 13,702 | | | $ | (1,486 | ) | | $ | 8,082 | | | $ | (818 | ) | | $ | 5,778 | | | $ | 247 | | | $ | 2,366 | | | $ | 46 | | | $ | 2,659 | |
Loans held for sale | | | 146 | | | | (7 | ) | | | — | | | | 139 | | | | 537 | | | | (3,528 | ) | | | (319 | ) | | $ | (3,310 | ) | | | | | | | | | | | | | | | | |
Debt securities | | | (21 | ) | | | 62 | | | | (8 | ) | | | 33 | | | | (80 | ) | | | 132 | | | | (60 | ) | | | (8 | ) | | | 113 | | | | (296 | ) | | | (35 | ) | | | (218 | ) |
Mortgage-backed securities | | | (18 | ) | | | (103 | ) | | | 4 | | | | (117 | ) | | | (103 | ) | | | 144 | | | | (38 | ) | | | 3 | | | | (12 | ) | | | 818 | | | | (10 | ) | | | 796 | |
FHLB stock | | | 27 | | | | 70 | | | | 18 | | | | 115 | | | | (62 | ) | | | (59 | ) | | | 17 | | | | (104 | ) | | | | | | | | | | | | | | | | |
Other (including fed funds) | | | 111 | | | | (1 | ) | | | (1 | ) | | | 109 | | | | 2 | | | | 23 | | | | 2 | | | | 27 | | | | 172 | | | | (274 | ) | | | (82 | ) | | | (184 | ) |
| | |
|
|
| |
|
|
| |
|
|
| |
|
|
| |
|
|
| |
|
|
| |
|
|
| |
|
|
| |
|
|
| |
|
|
| |
|
|
| |
|
|
|
Total net change in income on interest-earning assets | | | 2,459 | | | | 10,387 | | | | 1,135 | | | | 13,981 | | | | (1,192 | ) | | | 4,794 | | | | (1,216 | ) | | | 2,386 | | | | 520 | | | | 2,614 | | | | (81 | ) | | | 3,053 | |
Interest-bearing liabilities: | | | | | | | | | | | | | | | | | | | | | | | | | | | | | | | | | | | | | | | | | | | | | | | | |
Interest-bearing deposits | | | 2,408 | | | | 1,761 | | | | 815 | | | | 4,984 | | | | (681 | ) | | | 1,717 | | | | (264 | ) | | | 772 | | | | (210 | ) | | | 48 | | | | (2 | ) | | | (164 | ) |
FHLB advances | | | 838 | | | | 1,640 | | | | 586 | | | | 3,064 | | | | (316 | ) | | | (705 | ) | | | 68 | | | | (953 | ) | | | 59 | | | | 2,086 | | | | 199 | | | | 2,344 | |
Note payable | | | 36 | | | | 43 | | | | 21 | | | | 100 | | | | — | | | | 66 | | | | — | | | | 66 | | | | | | | | | | | | | | | | | |
Subordinated debt | | | 63 | | | | 499 | | | | 174 | | | | 736 | | | | — | | | | — | | | | 183 | | | | 183 | | | | | | | | | | | | | | | | | |
| | |
|
|
| |
|
|
| |
|
|
| |
|
|
| |
|
|
| |
|
|
| |
|
|
| |
|
|
| |
|
|
| |
|
|
| |
|
|
| |
|
|
|
Total net change in expense on interest-bearing liabilities | | | 3,345 | | | | 3,943 | | | | 1,596 | | | | 8,884 | | | | (997 | ) | | | 1,078 | | | | (13 | ) | | | 68 | | | | (151 | ) | | | 2,134 | | | | 197 | | | | 2,180 | |
| | |
|
|
| |
|
|
| |
|
|
| |
|
|
| |
|
|
| |
|
|
| |
|
|
| |
|
|
| |
|
|
| |
|
|
| |
|
|
| |
|
|
|
Net change in net interest income | | $ | (886 | ) | | $ | 6,444 | | | $ | (461 | ) | | $ | 5,097 | | | $ | (195 | ) | | $ | 3,716 | | | $ | (1,203 | ) | | $ | 2,318 | | | $ | 671 | | | $ | 480 | | | $ | (278 | ) | | $ | 873 | |
| | |
|
|
| |
|
|
| |
|
|
| |
|
|
| |
|
|
| |
|
|
| |
|
|
| |
|
|
| |
|
|
| |
|
|
| |
|
|
| |
|
|
|
- 27 -
Management’s Report on
Internal Control Over Financial Reporting
Our management is responsible for establishing and maintaining adequate internal control over financial reporting. Our internal control over financial reporting is a process designed to provide reasonable assurance regarding the reliability of its financial reporting and of the preparation of its consolidated financial statements for external purposes in accordance with U.S. generally accepted accounting principles.
A company’s internal control over financial reporting includes those policies and procedures that (1) pertain to the maintenance of records that, in reasonable detail, accurately and fairly reflect the transactions and dispositions of the assets of the company; (2) provide reasonable assurance that transactions are recorded as necessary to permit preparation of consolidated financial statements in accordance with generally accepted accounting principles, and that receipts and expenditures of the company are being made only in accordance with authorizations of management and directors of the company; and (3) provide reasonable assurance regarding prevention or timely detection of unauthorized acquisition, use, or disposition of the company’s assets that could have a material effect on the consolidated financial statements.
Because of its inherent limitations, internal control over financial reporting may not prevent or detect misstatements. Also, projections of any evaluation of effectiveness to future periods are subject to the risk that controls may become inadequate because of changes in conditions, or that the degree of compliance with the policies or procedures may deteriorate.
A material weakness is a control deficiency, or combination of control deficiencies, that results in there being more than a remote likelihood that a material misstatement of the annual or interim financial statements will not be prevented or detected.
Our management assessed the effectiveness of our internal control over financial reporting as of September 30, 2005, using the criteria established in Internal Control-Integrated Framework, issued by the Committee of Sponsoring Organizations of the Treadway Commission (“COSO”). Based on this assessment, management has concluded that, as of September 30, 2005, the Company’s internal control over financial reporting was not effective due to the existence of the material weakness described below:
| | • | | We had ineffective policies and procedures relating to the accounting for certain derivative financial instruments under Financial Accounting Standards (“FAS”) No. 133, “Accounting For Derivative Instruments and Hedging Activities.” Specifically, our policies and procedures did not provide for sufficient testing and verification of the criteria for the “short-cut” method to ensure proper application of the provisions of FAS No. 133 at inception for certain derivative financial instruments. This material weakness has resulted in the restatement of our financial statements for the first three quarters of 2005. |
Our independent registered public accountants, KPMG LLP, have audited and issued a report on managements’ assessment of our internal control over financial reporting, which appears in this Annual Report.
- 28 -
Report of Independent Registered Public Accounting Firm
The Board of Directors and Stockholders
Pulaski Financial Corp.:
We have audited the accompanying consolidated balance sheets of Pulaski Financial Corp. and subsidiaries (the Company) as of September 30, 2005 and 2004, and the related consolidated statements of income and comprehensive income, stockholders’ equity, and cash flows for each of the years in the three-year period ended September 30, 2005. These consolidated financial statements are the responsibility of the Company’s management. Our responsibility is to express an opinion on these consolidated financial statements based on our audits.
We conducted our audits in accordance with the standards of the Public Company Accounting Oversight Board (United States). Those standards require that we plan and perform the audit to obtain reasonable assurance about whether the financial statements are free of material misstatement. An audit includes examining, on a test basis, evidence supporting the amounts and disclosures in the financial statements. An audit also includes assessing the accounting principles used and significant estimates made by management, as well as evaluating the overall financial statement presentation. We believe that our audits provide a reasonable basis for our opinion.
In our opinion, the consolidated financial statements referred to above present fairly, in all material respects, the financial position of Pulaski Financial Corp. and subsidiaries as of September 30, 2005 and 2004, and the results of their operations and their cash flows for each of the years in the three-year period ended September 30, 2005, in conformity with U.S. generally accepted accounting principles.
We also have audited, in accordance with the standards of the Public Company Accounting Oversight Board (United States), the effectiveness of Pulaski Financial Corp.’s internal control over financial reporting as of September 30, 2005, based on criteria established in Internal Control—Integrated Framework issued by the Committee of Sponsoring Organizations of the Treadway Commission, and our report dated December 9, 2005 expressed an unqualified opinion on management’s assessment of, and an adverse opinion on the effective operation of internal control over financial reporting.
/s/ KPMG LLP
St. Louis, Missouri
December 9, 2005
- 29 -
Report of Independent Registered Public Accounting Firm
The Board of Directors and Stockholders
Pulaski Financial Corp.:
We have audited management's assessment, included in the accompanyingManagement’s Report on Internal Control Over Financial Reporting, that Pulaski Financial Corp. (the Company) did not maintain effective internal control over financial reporting as of September 30, 2005, because the Company had ineffective policies and procedures relating to the accounting for certain derivative financial instruments under Statement of Financial Accounting Standards No. 133,Accounting for Derivative Instruments and Hedging Activities(SFAS 133), based on criteria established inInternal Control—Integrated Framework issued by the Committee of Sponsoring Organizations of the Treadway Commission (COSO). The Company’s management is responsible for maintaining effective internal control over financial reporting and for its assessment of the effectiveness of internal control over financial reporting. Our responsibility is to express an opinion on management’s assessment and an opinion on the effectiveness of the Company’s internal control over financial reporting based on our audit.
We conducted our audit in accordance with the standards of the Public Company Accounting Oversight Board (United States). Those standards require that we plan and perform the audit to obtain reasonable assurance about whether effective internal control over financial reporting was maintained in all material respects. Our audit included obtaining an understanding of internal control over financial reporting, evaluating management’s assessment, testing and evaluating the design and operating effectiveness of internal control, and performing such other procedures as we considered necessary in the circumstances. We believe that our audit provides a reasonable basis for our opinion.
A company’s internal control over financial reporting is a process designed to provide reasonable assurance regarding the reliability of financial reporting and the preparation of financial statements for external purposes in accordance with generally accepted accounting principles. A company’s internal control over financial reporting includes those policies and procedures that (1) pertain to the maintenance of records that, in reasonable detail, accurately and fairly reflect the transactions and dispositions of the assets of the company; (2) provide reasonable assurance that transactions are recorded as necessary to permit preparation of financial statements in accordance with generally accepted accounting principles, and that receipts and expenditures of the company are being made only in accordance with authorizations of management and directors of the company; and (3) provide reasonable assurance regarding prevention or timely detection of unauthorized acquisition, use, or disposition of the company’s assets that could have a material effect on the financial statements.
Because of its inherent limitations, internal control over financial reporting may not prevent or detect misstatements. Also, projections of any evaluation of effectiveness to future periods are subject to the risk that controls may become inadequate because of changes in conditions, or that the degree of compliance with the policies or procedures may deteriorate.
A material weakness is a control deficiency, or combination of control deficiencies, that results in more than a remote likelihood that a material misstatement of the annual or interim financial statements will not be prevented or detected. The following material weakness has been identified and included in management’s assessment: The Company had ineffective policies and procedures relating to the accounting for certain derivative financial instruments under SFAS 133. Specifically, the Company’s policies and procedures did not provide for sufficient testing and verification of the criteria for the “short-cut” method to ensure proper application of the provisions of SFAS 133 at inception for certain derivative
- 30 -
financial instruments. This resulted in the restatement of the Company’s consolidated financial statements for the first three quarters of 2005.
We also have audited, in accordance with the standards of the Public Company Accounting Oversight Board (United States), the consolidated balance sheets of the Company as of September 30, 2005 and 2004, and the related consolidated statements of income and comprehensive income, stockholders’ equity, and cash flows for each of the years in the three-year period ended September 30, 2005. The aforementioned material weakness was considered in determining the nature, timing, and extent of audit tests applied in our audit of the 2005 consolidated financial statements, and this report does not affect our report dated December 9, 2005, which expressed an unqualified opinion on those consolidated financial statements.
In our opinion, management’s assessment that the Company did not maintain effective internal control over financial reporting as of September 30, 2005, is fairly stated, in all material respects, based on criteria established inInternal Control—Integrated Framework issued by COSO. Also, in our opinion, because of the effect of the material weakness described above on the achievement of the objectives of the control criteria, the Company has not maintained effective internal control over financial reporting as of September 30, 2005, based on criteria established inInternal Control—Integrated Framework issued by COSO.
/s/ KPMG LLP
St. Louis, Missouri
December 9, 2005
- 31 -
PULASKI FINANCIAL CORP. AND SUBSIDIARIES
CONSOLIDATED BALANCE SHEETS
SEPTEMBER 30, 2005 and 2004
| | | | | | | | |
| | | 2005
| | | 2004
| |
ASSETS | | | | | | | | |
Cash and amounts due from depository institutions | | $ | 16,558,213 | | | $ | 16,182,443 | |
Federal funds sold and overnight deposits | | | 9,130,273 | | | | 4,113,668 | |
| | |
|
|
| |
|
|
|
Total cash and cash equivalents | | | 25,688,486 | | | | 20,296,111 | |
Debt securities available for sale, at fair value | | | — | | | | 9,224,376 | |
Equity securities available for sale, at fair value | | | 4,251,844 | | | | 3,761,732 | |
Debt securities held to maturity, at amortized cost (fair value of $5,922,136 at September 30, 2005) | | | 5,976,550 | | | | — | |
Mortgage-backed securities held to maturity, at amortized cost (fair value of $699,453 and $943,658 at September 30, 2005 and 2004, respectively) | | | 650,321 | | | | 864,423 | |
Mortgage-backed securities available for sale, at fair value | | | 4,182,371 | | | | 5,709,985 | |
Capital stock of Federal Home Loan Bank - at cost | | | 8,462,400 | | | | 7,537,600 | |
Loans receivable held for sale, at lower of cost or market | | | 64,334,775 | | | | 49,151,789 | |
Loans receivable (net of allowance for loan losses of $6,805,958 and $5,579,132 at September 30, 2005 and 2004, respectively) | | | 633,195,325 | | | | 510,584,236 | |
Real estate acquired in settlement of loans (net of allowance for losses of $64,833 and $47,816 at September 30, 2005 and 2004, respectively) | | | 754,196 | | | | 1,067,881 | |
Premises and equipment, net | | | 13,659,637 | | | | 10,701,279 | |
Assets held for sale | | | 1,017,347 | | | | — | |
Accrued interest receivable | | | 4,272,078 | | | | 2,538,953 | |
Bank owned life insurance | | | 15,646,949 | | | | 11,553,961 | |
Other assets | | | 7,768,959 | | | | 4,894,025 | |
| | |
|
|
| |
|
|
|
TOTAL ASSETS | | $ | 789,861,238 | | | $ | 637,886,351 | |
| | |
|
|
| |
|
|
|
LIABILITIES AND STOCKHOLDERS’ EQUITY | | | | | | | | |
LIABILITIES: | | | | | | | | |
Deposits | | $ | 496,171,066 | | | $ | 406,798,593 | |
Deposit liabilities held for sale | | | 25,375,086 | | | | — | |
Advances from Federal Home Loan Bank | | | 171,000,000 | | | | 154,600,000 | |
Note payable | | | 3,575,000 | | | | 3,830,000 | |
Subordinated debentures | | | 19,589,000 | | | | 9,279,000 | |
Advance payments by borrowers for taxes and insurance | | | 2,739,693 | | | | 2,624,699 | |
Accrued interest payable | | | 1,028,021 | | | | 504,722 | |
Due to other banks | | | 13,635,612 | | | | 14,463,691 | |
Other liabilities | | | 8,501,296 | | | | 4,812,075 | |
| | |
|
|
| |
|
|
|
Total liabilities | | | 741,614,774 | | | | 596,912,780 | |
| | |
|
|
| |
|
|
|
STOCKHOLDERS’ EQUITY : | | | | | | | | |
Preferred stock - $.01 par value per share, 1,000,000 shares authorized; none issued | | | — | | | | — | |
Common stock - $.01 par value per share, 18,000,000 shares authorized; 11,918,655 shares issued at September 30, 2005 and 2004, respectively | | | 119,187 | | | | 119,187 | |
Treasury stock - at cost (3,479,455 and 3,691,178 shares at September 30, 2005 and 2004, respectively) | | | (17,229,150 | ) | | | (17,869,317 | ) |
Treasury stock - Equity Trust (429,321 and 348,900 shares at September 30, 2005 and 2004, respectively) | | | (3,896,503 | ) | | | (2,842,407 | ) |
Additional paid-in capital | | | 31,287,248 | | | | 28,934,972 | |
Unearned restricted shares | | | (81,350 | ) | | | (131,075 | ) |
Unearned ESOP shares (55,133 unreleased shares at September 30, 2004) | | | — | | | | (183,773 | ) |
Accumulated other comprehensive (loss) income | | | (23,129 | ) | | | 18,807 | |
Retained earnings | | | 38,070,161 | | | | 32,927,177 | |
| | |
|
|
| |
|
|
|
Total stockholders’ equity | | | 48,246,464 | | | | 40,973,571 | |
| | |
|
|
| |
|
|
|
TOTAL LIABILITIES AND STOCKHOLDERS’ EQUITY | | $ | 789,861,238 | | | $ | 637,886,351 | |
| | |
|
|
| |
|
|
|
See accompanying notes to the consolidated financial statements.
- 32 -
PULASKI FINANCIAL CORP. AND SUBSIDIARIES
CONSOLIDATED STATEMENTS OF INCOME AND COMPREHENSIVE INCOME
YEARS ENDED SEPTEMBER 30, 2005, 2004 AND 2003
| | | | | | | | | | | |
| | | 2005
| | | 2004
| | | 2003
|
INTEREST AND DIVIDEND INCOME: | | | | | | | | | | | |
Loans receivable | | $ | 36,929,615 | | | $ | 23,088,826 | | | $ | 20,621,499 |
Securities | | | 201,789 | | | | 168,929 | | | | 176,620 |
FHLB stock | | | 221,709 | | | | 106,791 | | | | 210,957 |
Mortgage-backed securities | | | 273,584 | | | | 390,345 | | | | 387,344 |
Other | | | 165,308 | | | | 55,941 | | | | 29,453 |
| | |
|
|
| |
|
|
| |
|
|
Total interest income | | | 37,792,005 | | | | 23,810,832 | | | | 21,425,873 |
| | |
|
|
| |
|
|
| |
|
|
INTEREST EXPENSE: | | | | | | | | | | | |
Deposits | | | 10,181,720 | | | | 5,197,389 | | | | 4,424,819 |
Advances from Federal Home Loan Bank | | | 5,413,691 | | | | 2,349,413 | | | | 3,303,472 |
Note payable | | | 175,749 | | | | 75,903 | | | | 10,333 |
Subordinated debentures | | | 919,331 | | | | 183,300 | | | | — |
| | |
|
|
| |
|
|
| |
|
|
Total interest expense | | | 16,690,491 | | | | 7,806,005 | | | | 7,738,624 |
| | |
|
|
| |
|
|
| |
|
|
NET INTEREST INCOME | | | 21,101,514 | | | | 16,004,827 | | | | 13,687,249 |
PROVISION FOR LOAN LOSSES | | | 1,634,651 | | | | 1,934,098 | | | | 1,487,431 |
| | |
|
|
| |
|
|
| |
|
|
NET INTEREST INCOME AFTER PROVISION FOR LOAN LOSSES | | | 19,466,863 | | | | 14,070,729 | | | | 12,199,818 |
| | |
|
|
| |
|
|
| |
|
|
NON-INTEREST INCOME: | | | | | | | | | | | |
Retail banking fees | | | 2,467,011 | | | | 2,388,725 | | | | 1,879,636 |
Mortgage revenues | | | 5,446,512 | | | | 4,584,207 | | | | 8,523,681 |
Gain on sale of second mortgage loans | | | 223,892 | | | | 4,798 | | | | — |
Title policy revenues | | | 794,786 | | | | 134,246 | | | | — |
Investment broker revenues | | | 667,633 | | | | | | | | — |
Insurance commissions | | | 207,282 | | | | 334,330 | | | | 200,280 |
Gain on sales of securities available for sale | | | — | | | | 736,083 | | | | 73,819 |
Other | | | 1,137,451 | | | | 798,578 | | | | 727,756 |
| | |
|
|
| |
|
|
| |
|
|
Total non-interest income | | | 10,944,567 | | | | 8,980,967 | | | | 11,405,172 |
| | |
|
|
| |
|
|
| |
|
|
NON-INTEREST EXPENSE: | | | | | | | | | | | |
Salaries and employee benefits | | | 9,238,993 | | | | 6,474,868 | | | | 6,881,414 |
Occupancy, equipment and data processing expense | | | 4,179,910 | | | | 3,635,067 | | | | 2,917,109 |
Advertising | | | 845,185 | | | | 719,626 | | | | 582,301 |
Professional services | | | 1,009,765 | | | | 729,830 | | | | 738,844 |
Loss on derivative instruments | | | 320,312 | | | | — | | | | — |
Early debt extinguishment expense | | | — | | | | — | | | | 612,504 |
Other | | | 2,920,268 | | | | 2,155,066 | | | | 2,244,966 |
| | |
|
|
| |
|
|
| |
|
|
Total non-interest expense | | | 18,514,433 | | | | 13,714,457 | | | | 13,977,138 |
| | |
|
|
| |
|
|
| |
|
|
INCOME BEFORE INCOME TAXES | | | 11,896,997 | | | | 9,337,239 | | | | 9,627,852 |
INCOME TAXES | | | 4,418,099 | | | | 3,485,584 | | | | 3,859,751 |
| | |
|
|
| |
|
|
| |
|
|
NET INCOME | | $ | 7,478,898 | | | $ | 5,851,655 | | | $ | 5,768,101 |
| | |
|
|
| |
|
|
| |
|
|
OTHER COMPREHENSIVE INCOME - Unrealized (loss) gain on securities available-for-sale (net of income taxes in 2005, 2004 and 2003 of $25,703, $302,823 and $38,758, respectively) | | | (41,936 | ) | | | (494,080 | ) | | | 63,236 |
| | |
|
|
| |
|
|
| |
|
|
COMPREHENSIVE INCOME | | $ | 7,436,962 | | | $ | 5,357,575 | | | $ | 5,831,337 |
| | |
|
|
| |
|
|
| |
|
|
Per share amounts: | | | | | | | | | | | |
Basic earnings per share | | $ | 0.94 | | | $ | 0.75 | | | $ | 0.73 |
Basic weighted average common shares outstanding | | | 7,925,674 | | | | 7,758,069 | | | | 7,853,100 |
Diluted earnings per share | | $ | 0.85 | | | $ | 0.67 | | | $ | 0.67 |
Diluted weighted average common shares outstanding | | | 8,828,224 | | | | 8,695,004 | | | | 8,577,918 |
See accompanying notes to the consolidated financial statements.
- 33 -
PULASKI FINANCIAL CORP. AND SUBSIDIARIES
CONSOLIDATED STATEMENTS OF STOCKHOLDERS’ EQUITY
YEARS ENDED SEPTEMBER 30, 2005, 2004 AND 2003
| | | | | | | | | | | | | | | | | | | | | | | | | | | | | | | |
| | | Common
Stock
| | Treasury Stock
| | | Additional
Paid-In
Capital
| | | Unearned
Restricted
Plan Shares
| | | Unearned
ESOP
Shares
| | | Accumulated
Other
Comprehensive
Income (loss)
| | | Retained
Earnings
| | | Total
| |
BALANCE, SEPTEMBER 30, 2002 | | | 119,187 | | | (15,974,493 | ) | | | 25,000,890 | | | | (416,493 | ) | | | (664,893 | ) | | | 449,651 | | | | 24,040,291 | | | | 32,554,140 | |
Comprehensive income: | | | | | | | | | | | | | | | | | | | | | | | | | | | | | | | |
Net income | | | | | | | | | | | | | | | | | | | | | | | | | | 5,768,101 | | | | 5,768,101 | |
Unrealized gain on investment securities, net of tax | | | | | | | | | | | | | | | | | | | | | | 107,520 | | | | | | | | 107,520 | |
Less: reclassification adjustment for realized gain on sale of investment securities included in net income, net of tax | | | | | | | | | | | | | | | | | | | | | | (44,284 | ) | | | | | | | (44,284 | ) |
| | | | | | | | | | | | | | | | | | | | | | | | | | | | | |
|
|
|
Total comprehensive income | | | | | | | | | | | | | | | | | | | | | | | | | | | | | | 5,831,337 | |
| | | | | | | | | | | | | | | | | | | | | | | | | | | | | |
|
|
|
Dividends ($.14 per share) | | | | | | | | | | | | | | | | | | | | | | | | | | (1,113,577 | ) | | | (1,113,577 | ) |
Stock options exercised | | | | | | 764,582 | | | | (133,322 | ) | | | | | | | | | | | | | | | | | | | 631,260 | |
Stock repurchase (328,317 shares) | | | | | | (2,745,366 | ) | | | | | | | | | | | | | | | | | | | | | | | (2,745,366 | ) |
Equity trust shares purchased | | | | | | (1,422,260 | ) | | | 1,422,260 | | | | | | | | | | | | | | | | | | | | — | |
Release of ESOP shares | | | | | | | | | | 511,365 | | | | | | | | 364,740 | | | | | | | | | | | | 876,105 | |
Net restricted shares issued | | | | | | 35,232 | | | | 44,723 | | | | (79,955 | ) | | | | | | | | | | | | | | | — | |
Tax benefit for non-qualified stock options and restricted shares awards | | | | | | | | | | 173,269 | | | | | | | | | | | | | | | | | | | | 173,269 | |
| | | | | | | | | | | | | | | | | | | | | | | | | | | | | | | | |
Amortization of restricted shares | | | | | | | | | | | | | | 175,693 | | | | | | | | | | | | | | | | 175,693 | |
| | |
|
| |
|
|
| |
|
|
| |
|
|
| |
|
|
| |
|
|
| |
|
|
| |
|
|
|
BALANCE, SEPTEMBER 30, 2003 | | $ | 119,187 | | $ | (19,342,305 | ) | | $ | 27,019,185 | | | $ | (320,755 | ) | | $ | (300,153 | ) | | $ | 512,887 | | | $ | 28,694,815 | | | $ | 36,382,861 | |
| | |
|
| |
|
|
| |
|
|
| |
|
|
| |
|
|
| |
|
|
| |
|
|
| |
|
|
|
Comprehensive income: | | | | | | | | | | | | | | | | | | | | | | | | | | | | | | | |
Net income | | | | | | | | | | | | | | | | | | | | | | | | | | 5,851,655 | | | | 5,851,655 | |
Unrealized loss on investment securities, net of tax | | | | | | | | | | | | | | | | | | | | | | (30,347 | ) | | | | | | | (30,347 | ) |
Less: reclassification adjustment for realized gain on sale of investment securities included in net income, net of tax | | | | | | | | | | | | | | | | | | | | | | (463,733 | ) | | | | | | | (463,733 | ) |
| | | | | | | | | | | | | | | | | | | | | | | | | | | | | |
|
|
|
Total comprehensive income | | | | | | | | | | | | | | | | | | | | | | | | | | | | | | 5,357,575 | |
| | | | | | | | | | | | | | | | | | | | | | | | | | | | | |
|
|
|
Dividends ($.20 per share) | | | | | | | | | | | | | | | | | | | | | | | | | | (1,619,293 | ) | | | (1,619,293 | ) |
Stock options exercised | | | | | | 802,568 | | | | 5,315 | | | | | | | | | | | | | | | | | | | | 807,883 | |
Stock repurchase (137,982 shares) | | | | | | (1,566,798 | ) | | | | | | | | | | | | | | | | | | | | | | | (1,566,798 | ) |
Equity trust shares purchased | | | | | | (607,951 | ) | | | 607,951 | | | | | | | | | | | | | | | | | | | | — | |
Release of ESOP shares | | | | | | | | | | 304,993 | | | | | | | | 116,380 | | | | | | | | | | | | 421,373 | |
Net restricted shares issued | | | | | | 2,762 | | | | 6,738 | | | | (9,500 | ) | | | | | | | | | | | | | | | — | |
Tax benefit for non-qualified stock options and restricted shares awards | | | | | | | | | | 990,790 | | | | | | | | | | | | | | | | | | | | 990,790 | |
Amortization of restricted shares | | | | | | | | | | | | | | | | | | | | | | | | | | | | | | | |
Plan shares | | | | | | | | | | | | | | 199,180 | | | | | | | | | | | | | | | | 199,180 | |
| | |
|
| |
|
|
| |
|
|
| |
|
|
| |
|
|
| |
|
|
| |
|
|
| |
|
|
|
BALANCE, SEPTEMBER 30, 2004 | | $ | 119,187 | | $ | (20,711,724 | ) | | $ | 28,934,972 | | | $ | (131,075 | ) | | $ | (183,773 | ) | | $ | 18,807 | | | $ | 32,927,177 | | | $ | 40,973,571 | |
| | |
|
| |
|
|
| |
|
|
| |
|
|
| |
|
|
| |
|
|
| |
|
|
| |
|
|
|
Comprehensive income: | | | | | | | | | | | | | | | | | | | | | | | | | | | | | | | |
Net income | | | | | | | | | | | | | | | | | | | | | | | | | | 7,478,898 | | | | 7,478,898 | |
Unrealized loss on investment securities, net of tax | | | | | | | | | | | | | | | | | | | | | | (41,936 | ) | | | | | | | (41,936 | ) |
Less: reclassification adjustment for realized gain on sale of investment securities included in net income, net of tax | | | | | | | | | | | | | | | | | | | | | | — | | | | | | | | 0 | |
| | | | | | | | | | | | | | | | | | | | | | | | | | | | | |
|
|
|
Total comprehensive income | | | | | | | | | | | | | | | | | | | | | | | | | | | | | | 7,436,962 | |
| | | | | | | | | | | | | | | | | | | | | | | | | | | | | |
|
|
|
Dividends ($.28 per share) | | | | | | | | | | | | | | | | | | | | | | | | | | (2,335,914 | ) | | | (2,335,914 | ) |
Stock options exercised | | | | | | 819,420 | | | | 154,613 | | | | | | | | | | | | | | | | | | | | 974,033 | |
Non-cash compensation expense for stock option grants | | | | | | | | | | 3,923 | | | | | | | | | | | | | | | | | | | | 3,923 | |
Stock repurchase (13,717 shares) | | | | | | (190,194 | ) | | | | | | | | | | | | | | | | | | | | | | | (190,194 | ) |
Equity trust shares purchased | | | | | | (1,054,095 | ) | | | 1,054,095 | | | | | | | | | | | | | | | | | | | | — | |
Release of ESOP shares | | | | | | | | | | 577,969 | | | | | | | | 183,773 | | | | | | | | | | | | 761,742 | |
Net restricted shares issued | | | | | | 10,940 | | | | 28,969 | | | | (39,909 | ) | | | | | | | | | | | | | | | — | |
Tax benefit for non-qualified stock options and restricted shares awards | | | | | | | | | | 532,707 | | | | | | | | | | | | | | | | | | | | 532,707 | |
Amortization of restricted shares | | | | | | | | | | | | | | 89,634 | | | | | | | | | | | | | | | | 89,634 | |
| | |
|
| |
|
|
| |
|
|
| |
|
|
| |
|
|
| |
|
|
| |
|
|
| |
|
|
|
BALANCE, SEPTEMBER 30, 2005 | | $ | 119,187 | | $ | (21,125,653 | ) | | $ | 31,287,248 | | | $ | (81,350 | ) | | $ | — | | | $ | (23,129 | ) | | $ | 38,070,161 | | | $ | 48,246,464 | |
| | |
|
| |
|
|
| |
|
|
| |
|
|
| |
|
|
| |
|
|
| |
|
|
| |
|
|
|
See accompanying notes to the consolidated financial statements.
- 34 -
PULASKI FINANCIAL CORP. AND SUBSIDIARIES
CONSOLIDATED STATEMENTS OF CASH FLOWS
YEARS ENDED SEPTEMBER 30, 2005, 2004 AND 2003
| | | | | | | | | | | | |
| | | 2005
| | | 2004
| | | 2003
| |
CASH FLOWS FROM OPERATING ACTIVITIES: | | | | | | | | | | | | |
Net income | | $ | 7,478,898 | | | $ | 5,851,655 | | | $ | 5,768,101 | |
Adjustments to reconcile net income to net cash from operating activities: | | | | | | | | | | | | |
Depreciation, amortization and accretion: | | | | | | | | | | | | |
Premises and equipment | | | 1,254,327 | | | | 1,143,064 | | | | 975,092 | |
Net deferred loan costs | | | 2,460,670 | | | | 1,380,390 | | | | 719,793 | |
Debt issuance costs | | | 135,621 | | | | — | | | | — | |
Restricted stock awards | | | 89,634 | | | | 199,180 | | | | 175,693 | |
Tax benefit on non-qualified stock options and restricted share awards | | | 532,707 | | | | 990,790 | | | | 173,269 | |
Non-cash compensation expense for stock option grants | | | 3,923 | | | | — | | | | — | |
ESOP shares committed to be released | | | 761,742 | | | | 421,373 | | | | 876,105 | |
Deferred taxes | | | (1,216,599 | ) | | | (614,302 | ) | | | (1,216,983 | ) |
Provision for loan losses | | | 1,634,651 | | | | 1,934,098 | | | | 1,487,431 | |
Provision for losses on real estate acquired in settlement of loans | | | 126,422 | | | | 69,264 | | | | 48,768 | |
Losses (gains) on sale of real estate acquired in settlement of loans | | | 37,505 | | | | 48,881 | | | | (30,208 | ) |
Originations of loans receivable for sale to correspondent lenders | | | (1,059,106,580 | ) | | | (859,606,253 | ) | | | (1,531,213,293 | ) |
Proceeds from sales of loans to correspondent lenders | | | 1,048,600,196 | | | | 875,404,981 | | | | 1,575,375,163 | |
Gain on sale of loans held for sale | | | (4,676,602 | ) | | | (3,826,079 | ) | | | (8,112,163 | ) |
Gain on sales of second mortgage loans | | | (223,892 | ) | | | (4,798 | ) | | | — | |
Gain on sale of securities-AFS | | | — | | | | (736,083 | ) | | | (73,819 | ) |
Loss on derivative instruments | | | 320,312 | | | | — | | | | — | |
Increase in cash value of bank-owned life insurance policies | | | (592,988 | ) | | | (447,372 | ) | | | (302,109 | ) |
Changes in other assets and liabilities | | | 80,998 | | | | (1,837,504 | ) | | | 3,266,050 | |
| | |
|
|
| |
|
|
| |
|
|
|
Net adjustments | | | (9,777,953 | ) | | | 14,519,630 | | | | 42,148,789 | |
| | |
|
|
| |
|
|
| |
|
|
|
Net cash (used in) provided by operating activities | | | (2,299,055 | ) | | | 20,371,285 | | | | 47,916,890 | |
| | |
|
|
| |
|
|
| |
|
|
|
CASH FLOWS FROM INVESTING ACTIVITIES: | | | | | | | | | | | | |
Cash received from branch acquisition, net of cash and cash equivalents received | | $ | — | | | $ | — | | | $ | 29,400,105 | |
Proceeds from sales of debt securities-AFS | | | — | | | | 2,163,232 | | | | 552,209 | |
Proceeds from maturities of debt securities-AFS | | | 9,250,000 | | | | 750,000 | | | | 750,000 | |
Proceeds from maturities of debt securities-HTM | | | 2,015,000 | | | | — | | | | — | |
Proceeds from redemption of FHLB stock | | | 6,714,600 | | | | 7,268,800 | | | | 5,061,000 | |
Purchases of bank-owned life insurance policies | | | (3,500,000 | ) | | | (3,500,000 | ) | | | (2,000,000 | ) |
Purchases of debt securities-AFS | | | (488,479 | ) | | | (9,411,460 | ) | | | (2,473,301 | ) |
Purchases of debt securities-HTM | | | (7,972,308 | ) | | | — | | | | — | |
Purchases of FHLB stock | | | (7,639,400 | ) | | | (10,926,900 | ) | | | (3,100,500 | ) |
Purchases of mortgage-backed securities | | | — | | | | — | | | | (5,000,000 | ) |
Principal payments received on mortgage-backed securities | | | 1,645,701 | | | | 2,190,205 | | | | 3,536,926 | |
Proceeds from sale of retained loans | | | 10,916,496 | | | | 2,482,248 | | | | — | |
Net increase in loans | | | (138,886,480 | ) | | | (240,969,803 | ) | | | (52,098,249 | ) |
Proceeds from sales of real estate acquired in settlement of loans receivable | | | 1,619,100 | | | | 317,500 | | | | 451,000 | |
Proceeds from disposal of equipment | | | 94,472 | | | | — | | | | — | |
Purchases of premises and equipment | | | (4,880,861 | ) | | | (1,500,003 | ) | | | (4,896,549 | ) |
Cash paid for 50% interest in joint venture | | | (133,810 | ) | | | — | | | | — | |
| | |
|
|
| |
|
|
| |
|
|
|
Net cash used in investing activities | | | (131,245,969 | ) | | | (251,136,181 | ) | | | (29,817,359 | ) |
| | |
|
|
| |
|
|
| |
|
|
|
See accompanying notes to the consolidated financial statements
- 35 -
PULASKI FINANCIAL CORP. AND SUBSIDIARIES
CONSOLIDATED STATEMENTS OF CASH FLOWS
YEARS ENDED SEPTEMBER 30, 2005, 2004 AND 2003
| | | | | | | | | | | | |
| | | 2005
| | | 2004
| | | 2003
| |
CASH FLOWS FROM FINANCING ACTIVITIES: | | | | | | | | | | | | |
Net increase in deposits | | $ | 114,747,559 | | | $ | 93,191,966 | | | $ | 81,790,923 | |
Proceeds from Federal Home Loan Bank advances, net | | | 16,400,000 | | | | 123,100,000 | | | | (85,300,000 | ) |
Proceeds from note payable | | | — | | | | 4,000,000 | | | | — | |
Payment on note payable | | | (255,000 | ) | | | (170,000 | ) | | | — | |
Proceeds from issuance of subordinated debentures | | | 10,310,000 | | | | 9,279,000 | | | | — | |
Net (decrease) increase in due to other banks | | | (828,079 | ) | | | 3,486,074 | | | | (1,571,264 | ) |
Net increase (decrease) in advance payments by borrowers for taxes and insurance | | | 114,994 | | | | 166,529 | | | | (622,302 | ) |
Treasury stock issued under stock option plan | | | 974,033 | | | | 807,883 | | | | 631,260 | |
Dividends paid on common stock | | | (2,335,914 | ) | | | (1,619,293 | ) | | | (1,073,863 | ) |
Stock repurchase | | | (190,194 | ) | | | (1,566,798 | ) | | | (2,745,366 | ) |
| | |
|
|
| |
|
|
| |
|
|
|
Net cash provided by (used in) financing activities | | | 138,937,399 | | | | 230,675,361 | | | | (8,890,612 | ) |
| | |
|
|
| |
|
|
| |
|
|
|
NET INCREASE (DECREASE) IN CASH AND CASH EQUIVALENTS | | | 5,392,375 | | | | (89,535 | ) | | | 9,208,918 | |
CASH AND CASH EQUIVALENTS AT BEGINNING OF YEAR | | | 20,296,111 | | | | 20,385,646 | | | | 11,176,728 | |
| | |
|
|
| |
|
|
| |
|
|
|
CASH AND CASH EQUIVALENTS AT END OF YEAR | | $ | 25,688,486 | | | $ | 20,296,111 | | | $ | 20,385,646 | |
| | |
|
|
| |
|
|
| |
|
|
|
SUPPLEMENTAL DISCLOSURES OF CASH FLOW INFORMATION: | | | | | | | | | | | | |
Cash paid during the year for: | | | | | | | | | | | | |
Interest on deposits | | $ | 9,658,421 | | | $ | 4,962,744 | | | $ | 4,345,245 | |
Interest on advances from Federal Home Loan Bank | | | 5,413,691 | | | | 2,349,413 | | | | 3,303,472 | |
Interest on subordinated debentures | | | 919,331 | | | | 183,300 | | | | — | |
Interest on note payable | | | 175,749 | | | | 75,903 | | | | 10,333 | |
Early debt extinguishment expense | | | — | | | | — | | | | 612,504 | |
| | |
|
|
| |
|
|
| |
|
|
|
Cash paid during year for: interest | | | 16,167,192 | | | | 7,571,360 | | | | 8,271,554 | |
Income taxes, net | | | 4,692,461 | | | | 4,185,879 | | | | 3,319,600 | |
NON-CASH INVESTING ACTIVITIES: | | | | | | | | | | | | |
Real estate acquired in settlement of loans receivable | | | 1,469,342 | | | | 1,468,305 | | | | 504,781 | |
See accompanying notes to the consolidated financial statements.
- 36 -
PULASKI FINANCIAL CORP. AND SUBSIDIARIES
NOTES TO THE CONSOLIDATED FINANCIAL STATEMENTS
YEARS ENDED SEPTEMBER 30, 2005, 2004 AND 2003
| 1. | SUMMARY OF SIGNIFICANT ACCOUNTING POLICIES |
Pulaski Financial Corp. (the “Company”) is the holding company for Pulaski Bank (the “Bank”). The Company has no significant assets, other than the outstanding shares of the Bank, and cash and equity investments in other financial institutions. The Company also maintains two special purpose subsidiaries that issued trust preferred securities. Management of the Company and the Bank are substantially similar and the Company neither owns nor leases any property, but instead uses the premises, equipment and furniture of the Bank. Accordingly, the information in the consolidated financial statements relates primarily to the Bank.
The Company, through the Bank, operates in a single business segment, that of a community-oriented financial institution providing traditional financial services through the operation of eight full-service bank locations in the St. Louis and Kansas City metropolitan areas. The Bank is engaged primarily in the business of attracting deposits from the general public and using these and other funds to originate a variety of consumer and commercial loans within the Bank’s lending market area. The Bank is an approved lender/servicer for the Federal Housing Administration (“FHA”) and the Veterans Administration (“VA”), as well as for the Missouri Housing Development Commission (a government agency established to provide home buying opportunities for low income first time home buyers).
The accounting and reporting policies and practices of the Company and subsidiaries conform to U.S. generally accepted accounting principles and to prevailing practices within the banking industry. A summary of the Company’s significant accounting policies follows:
Principles of Consolidation - The consolidated financial statements include the accounts of Pulaski Financial Corp. and its wholly owned subsidiary, Pulaski Bank, and its wholly owned subsidiary and Pulaski Service Corporation. All significant intercompany transactions have been eliminated in consolidation.
Use of Estimates - The preparation of these consolidated financial statements in conformity with U.S. generally accepted accounting principles requires management to make estimates and assumptions that affect the reported amounts of assets and liabilities and disclosure of contingent assets and liabilities at the date of the financial statements, and that affect the reported amounts of revenues and expenses during the reporting periods. Actual results could differ from those estimates. The allowance for loan losses and fair values of financial instruments are significant estimates reported within the consolidated financial statements.
Cash and Cash Equivalents - For purposes of reporting cash flows, cash and cash equivalents include cash and amounts due from depository institutions, cash in transit, cash in the process of collection, federal funds sold, and overnight deposits at the Federal Home Loan Bank. Generally, federal funds are sold for a one-day period.
Securities and Mortgage-Backed Securities Available-for-Sale - Securities and mortgage-backed securities available-for-sale are recorded at their current fair value, adjusted for amortization of premiums and discounts, which are recognized as adjustments to interest income over the life of the securities using the level-yield method. Unrealized gains or losses on securities and mortgage-backed securities available-for-sale are included in a separate component of stockholders’ equity, net of deferred income taxes. Gains or losses on the disposition of securities and mortgage-backed securities available-for-sale are recognized using the specific identification method. Estimated fair values of securities and mortgage-backed securities available-for-sale are based on quoted market prices when available. If quoted market prices are not available, fair values are estimated using quoted market prices for similar instruments.
- 37 -
To the extent management determines a decline in value in a security or mortgage-backed security available-for-sale to be other than temporary, the Bank will adjust the carrying value and include such expense in the consolidated statements of income and comprehensive income.
Securities and Mortgage-Backed Securities Held-to-Maturity - Securities and mortgage-backed securities held-to-maturity are stated at cost, adjusted for amortization of premiums and discounts, which are recognized as adjustments to interest income over the life of the securities using the level-yield method.
To the extent management determines a decline in value in a security or mortgage-backed security held-to-maturity to be other than temporary, the Company will adjust the carrying value and include such expense in the consolidated statements of income and comprehensive income.
Capital Stock of the Federal Home Loan Bank - Capital stock of the FHLB is carried at cost. Dividends received on such stock are reflected as interest and dividend income in the consolidated statements of income and comprehensive income.
Loans Receivable Held-for-Sale - Loans receivable held-for-sale consist of loans that management does not intend to hold until maturity and are reflected at the lower of cost or market. Such loans are generally covered by investor commitments and sold servicing released on a best efforts basis. Accordingly, market values for such loans are based on commitment prices. Gains or losses on loan sales are recognized at the time of sale and are determined by the difference between net sales proceeds and the principal balance of the loans sold, adjusted for net deferred loan fees. Loan origination and commitment fees, net of certain direct loan origination costs, are deferred until the sale of the loan.
Loans Receivable - Loans receivable are stated at the principal amounts outstanding adjusted for premiums, discounts, deferred loan costs, loans in process and the allowance for loan losses. Premiums and discounts are amortized and accreted using the level-yield method. Interest on loans is accrued based upon the principal amounts outstanding. The Bank’s policy is to discontinue the accrual of interest income on any loan when, in the opinion of management, there is reasonable doubt as to the timely collectibility of interest or principal. When a loan is placed on non-accrual status, previously accrued but unpaid interest is reversed against current income. Subsequent collections of cash may be applied as reductions to the principal balance, interest in arrears, or recorded as income depending on management’s assessment of the ultimate collectibility of the loan. Non-accrual loans are returned to accrual status when, in the opinion of management, the financial position of the borrower indicates there is no longer any reasonable doubt as to the timely collectibility of interest or principal.
Loan origination and commitment fees, net of certain direct loan origination costs, are deferred and amortized to interest income using the level-yield method.
Allowance for Loan Losses - The Bank maintains an allowance for loan losses to absorb probable losses in the Bank’s loan portfolio. Loan losses are charged and recoveries are credited to the allowance. Provisions for loan losses are charged to the allowance in an amount necessary to maintain an appropriate allowance given risks identified in the portfolio. The allowance is based upon quarterly management estimates of expected losses inherent in the loan portfolio. Management estimates are determined through a method of quantifying certain risks in the portfolio that are affected primarily by changes in the nature and volume of the portfolio combined with an analysis of past-due and classified loans, but can also be affected by the following factors: changes in lending policies and procedures, including underwriting standards and collection, charge-off and recovery practices, changes in national and local economic conditions and developments, assessment of collateral values by obtaining independent appraisals, and changes in the experience, ability, and depth of lending management staff.
- 38 -
The following assessments are performed quarterly in accordance with the Bank’s allowance for loan losses methodology:
Homogeneous residential mortgage loans are given one of five standard risk ratings at the time of origination. The risk ratings are assigned through the use of a credit scoring model, which assesses credit risk determinants from the borrower’s credit history, the loan-to-value, the affordability ratios or other personal history. Five-year historical loss rates and industry data for each credit rating is used to determine the appropriate allocation percentage for each loan grade. Commercial real estate, consumer and home equity loans are assigned standard risk weightings that determine the allocation percentage.
When commercial real estate loans are over 30 days delinquent or residential, consumer and home equity loans are over 90 days past due, they are evaluated individually for impairment. Additionally, loans that demonstrate credit weaknesses that may impact the borrower’s ability to repay or the value of the collateral are also reviewed individually for impairment. The Company considers a loan to be impaired when management believes it will be unable to collect all principal and interest due according to the contractual terms of the loan. If a loan is impaired, the Company records a loss valuation equal to the excess of the loan’s carrying value over the present value of estimated future cash flows or the fair value of collateral if the loan is collateral dependent.
The allowance for loan losses includes an unallocated allowance to provide for conditions that cannot be directly measured in the Company’s methodology. This unallocated allowance provides for the Company’s exposure to inherent but undetected losses in the portfolio.
The Company’s methodology includes factors that allow the Company to adjust its estimates of losses based on the most recent information available. Historical loss rates used to determine allowance provisions are adjusted to reflect the impact of current conditions, including actual collection and charge-off experience. In addition, various regulatory agencies, as an integral part of their examination process, periodically review the allowance for loan losses. Such agencies may require the Bank to modify its allowance for loan losses based on their judgment about information available to them at the time of their examination.
Derivative Instruments - The Company originates and purchases derivative instruments in the form of interest rate swaps, interest rate lock commitments and forward contracts to sell mortgage-backed securities. These instruments have certain interest rate risk characteristics that change in value based upon changes in the capital markets.
Interest Rate Swaps: Interest rate swap agreements are accounted for at fair value. Changes in the fair value of the swap agreements are recognized in loss on derivative instruments. All changes in fair value are measured on a quarterly basis. The swap agreements are accounted for on an accrual basis with the net interest differential being recognized as loss on derivative instruments.
Interest Rate Lock Commitments: Commitments to originate loans (interest rate lock commitments), which primarily consist of commitments to originate fixed-rate residential mortgage loans, are recorded at fair value. Changes in the fair value of interest rate lock commitments are recognized in non-interest income on a quarterly basis.
Forward Contracts to Sell Mortgage-Backed Securities:Forward commitments to sell mortgage-backed securities are recorded at fair value. Changes in the fair value of forward contracts to sell mortgage-backed securities are recognized in non-interest income on a quarterly basis.
Stock Split - All common share amounts, earnings per share and dividends per share amounts for the 2004 and 2003 fiscal years have been restated to reflect the three-for-two split of the Company’s common stock on July 18, 2005 and the two-for-one split of the Company’s common stock on July 22, 2003.
Premises and Equipment - Premises and equipment are stated at cost, less accumulated depreciation. Depreciation charged to operations is primarily computed utilizing the straight-line method over the estimated useful lives of the related assets. Estimated lives range from 3 to 40 years for buildings and improvements and
- 39 -
5 to l0 years for furniture and equipment. Maintenance repairs are charged to expense. Major renewals and improvements are capitalized. Gains and losses on dispositions are credited or charged to earnings as incurred.
Intangible Assets - The Company reviews intangible assets for impairment whenever events or changes in circumstances indicate the carrying value of underlying assets may not be recoverable. The Company measures recoverability based upon the future cash flows expected to result from the use of the underlying asset and its eventual disposition. If the sum of the expected future cash flows (undiscounted and without interest charges) is less than the carrying value of the underlying asset, the Company recognizes an impairment loss. The impairment loss recognized represents the amount by which the carrying value of the underlying asset exceeds the fair value of the underlying asset. As such adjustments become necessary; they are reflected in the results of operations in the periods in which they become known.
Employee Stock Ownership Plan - The Bank has an Employee Stock Ownership Plan (ESOP). Shares are allocated on an annual basis to ESOP participants in an amount that is the equivalent to the ratio of each participant’s salary to that of the total payroll for each year ended December 31. The unallocated shares are released to participants on a quarterly basis at a rate of 11,638 shares as the Bank repays the outstanding loan to the Company. The Bank occasionally prepays a portion of the loan which results in a release of additional shares above and beyond the 11,638 shares released quarterly. As shares are released, compensation expense is recognized equal to the fair value of the shares. The shares held by the ESOP are recorded on the balance sheet as unearned ESOP shares, which is a contra equity account. The Company credits unearned ESOP shares as the shares are committed to be released based on the cost of the shares to the ESOP. The difference between the fair value of the shares committed to be released and the cost of those shares to the ESOP is charged or credited to additional paid-in capital. For earnings per share computations, ESOP shares that have been committed to be released are considered outstanding, while ESOP shares that have not been committed to be released are not considered outstanding.
Stock Options - The Company applies the intrinsic-value-based method of accounting prescribed by Accounting Principles Board (“APB”) Opinion No. 25 -Accounting for Stock Issued to Employees, and related interpretations including FASB Interpretation No. 44 -Accounting for Certain Transactions Involving Stock Compensation, an interpretation of APB Opinion No. 25, to account for its fixed-plan stock options. Under this method, compensation expense is recorded on the date of grant only if the current market price of the underlying stock exceeded the exercise price. SFAS No. 123 -Accounting for Stock-Based Compensation - established accounting and disclosure requirements using a fair-value-based method of accounting for stock-based employee compensation plans. As allowed by SFAS No.123, the Company has elected to continue to apply the intrinsic-value-based method of accounting described above, and has adopted only the disclosure requirements of SFAS No. 148-Accounting for Stock-Based Compensation – Transition and Disclosure, an Amendment of FASB Statement No. 123.
- 40 -
The following table shows pro forma compensation expense, net income and earnings per share as if the Company had applied the fair value recognition provisions of SFAS No. 123.
| | | | | | | | | | | | |
| | | Year Ended September 30,
| |
| | | 2005
| | | 2004
| | | 2003
| |
Net income: | | | | | | | | | | | | |
As reported | | $ | 7,478,898 | | | $ | 5,851,655 | | | $ | 5,768,101 | |
Add: total employee stock-based compensation expense-included in reported net income-net of tax effect | | | 535,516 | | | | 384,743 | | | | 652,120 | |
Deduct: Total stock-based employee compensation expense, determined under fair value method for all awards- net of tax effect | | | (695,244 | ) | | | (526,112 | ) | | | (807,874 | ) |
| | |
|
|
| |
|
|
| |
|
|
|
Pro forma net income | | $ | 7,319,170 | | | $ | 5,710,286 | | | $ | 5,612,347 | |
| | |
|
|
| |
|
|
| |
|
|
|
Basic earnings per share: | | | | | | | | | | | | |
As reported | | $ | 0.94 | | | $ | 0.75 | | | $ | 0.74 | |
Pro forma | | | 0.92 | | | | 0.74 | | | | 0.71 | |
Diluted earnings per share: | | | | | | | | | | | | |
As reported | | | 0.85 | | | | 0.67 | | | | 0.67 | |
Pro forma | | | 0.83 | | | | 0.66 | | | | 0.65 | |
For purposes of computing the pro forma effects of stock option grants under the fair value accounting method, the fair value of each stock option grant was estimated on the date of the grant using the Black-Scholes option-pricing model. The following assumptions for fiscal 2005, 2004 and 2003 were used for the grants:
| | | | | | | | | |
| | | 2005
| | | 2004
| | | 2003
| |
Risk free interest rate | | 3.65 | % | | 3.35 | % | | 3.00 | % |
Expected volatility | | 25.61 | % | | 24.35 | % | | 24.35 | % |
Expected life | | 5 years | | | 5 years | | | 5 years | |
Dividend yield | | 1.91 | % | | 1.72 | % | | 1.77 | % |
Income Taxes - Deferred income taxes are determined using an asset or liability approach that requires the recognition of deferred tax assets or liabilities based upon temporary differences in the tax basis of an asset or liability and its related financial statement balance. The deferred tax asset or liability is calculated using the enacted tax rates expected to apply in the period in which the deferred asset or liability is expected to be settled or realized.
Revenue Recognition - Interest income, checking account transaction fees, insurance commissions, automated teller and debit card transaction fees, and other ancillary income related to the Bank’s deposits and lending activities are accrued as earned.
Reclassifications - Certain amounts included in the 2004 and 2003 consolidated financial statements have been reclassified to conform to the 2005 presentation.
- 41 -
Securities held to maturity at September 30, 2005 and available for sale at September 30, 2005 and 2004 are summarized as follows:
| | | | | | | | | | | | | | |
| | | 2005
|
Held-to-Maturity
| | Amortized
Cost
| | | Gross
Unrealized
Gains
| | Gross
Unrealized
Losses
| | | Estimated
Fair Value
|
U.S. Government and Agency debt obligations | | $ | 5,976,550 | | | $ | — | | $ | (54,414 | ) | | $ | 5,922,136 |
| | |
|
|
| |
|
| |
|
|
| |
|
|
Weighted average rate at end of period | | | 3.56 | % | | | | | | | | | | |
| | |
|
|
| | | | | | | | | | |
| |
| | | 2005
|
Available-for-Sale
| | Amortized
Cost
| | | Gross
Unrealized
Gains
| | Gross
Unrealized
Losses
| | | Estimated
Fair Value
|
Equity securities | | $ | 4,245,026 | | | $ | 114,338 | | $ | (107,520 | ) | | $ | 4,251,844 |
| | |
|
|
| |
|
| |
|
|
| |
|
|
Total | | $ | 4,245,026 | | | $ | 114,338 | | $ | (107,520 | ) | | $ | 4,251,844 |
| | |
|
|
| |
|
| |
|
|
| |
|
|
- 42 -
| | | | | | | | | | | | | | |
| | | 2004
|
Available-for-Sale
| | Amortized
Cost
| | | Gross
Unrealized
Gains
| | Gross
Unrealized
Losses
| | | Estimated
Fair Value
|
U.S. Government and Agency debt obligations | | $ | 9,248,182 | | | $ | 10,183 | | $ | (33,989 | ) | | $ | 9,224,376 |
Equity securities | | | 3,756,547 | | | | 56,074 | | | (50,889 | ) | | | 3,761,732 |
| | |
|
|
| |
|
| |
|
|
| |
|
|
Total | | $ | 13,004,729 | | | $ | 66,257 | | $ | (84,878 | ) | | $ | 12,986,108 |
| | |
|
|
| |
|
| |
|
|
| |
|
|
Weighted average rate at end of period | | | 2.36 | % | | | | | | | | | | |
| | |
|
|
| | | | | | | | | | |
Provided below is a summary of securities available-for-sale and held-to-maturity that were in an unrealized loss position at September 30, 2005. Approximately 53.1% of the total unrealized loss was comprised of securities in a continuous loss position for less than twelve months, which consisted of U. S. government and agency securities with estimated maturities or repricings of less than five years and four equity securities. Approximately 46.9% of the total unrealized loss was comprised of securities in a continuous loss position for 12 months or more, which consisted of one equity security. The Company has the ability and intent to hold the U.S. government and agency securities until such time as the value recovers or the securities mature. Further, the Company believes the deterioration in value of the U.S. government and agency securities is attributable to changes in market interest rates and not the credit quality of the issuer. The equity securities primarily represent an investment in a qualified investment fund. The unrealized loss is not deemed to be an other than temporary loss and there is no intention to dispose of the investment. The Company has the ability to hold this investment until the value recovers.
| | | | | | | | | | | | | | | | | | |
| | | Securities Available-for-Sale and Held-to-Maturity
|
| | | Less than 12 months
| | 12 months or more
| | Total
|
| | | Estimated
Fair Value
| | Unrealized
Losses
| | Estimated
Fair Value
| | Unrealized
Losses
| | Estimated
Fair Value
| | Unrealized
Losses
|
U.S. government and agency securities | | $ | 5,922,136 | | $ | 54,414 | | $ | — | | $ | — | | $ | 5,922,136 | | $ | 54,414 |
Equity securities | | | 466,135 | | | 31,614 | | | 2,143,358 | | | 75,905 | | | 2,609,493 | | | 107,520 |
| | |
|
| |
|
| |
|
| |
|
| |
|
| |
|
|
Total | | $ | 6,388,271 | | $ | 86,028 | | $ | 2,143,358 | | $ | 75,905 | | $ | 8,531,629 | | $ | 161,934 |
| | |
|
| |
|
| |
|
| |
|
| |
|
| |
|
|
Proceeds from sales of available-for-sale securities were $0, $2.2 million and $552,209, for the years ended September 30, 2005, 2004 and 2003, respectively. Gross gains of $0, $736,083 and $75,540 were realized on these sales during the years ended September 30, 2005, 2004 and 2003, respectively. Gross losses of $0, $0, and $1,721 were realized on these sales during the years ended September 30, 2005, 2004 and 2003, respectively.
- 43 -
The amortized cost and estimated fair values of held-to-maturity debt securities at September 30, 2005 by contractual maturity are shown below.
| | | | | | |
Term to Maturity
| | Amortized
Cost
| | Estimated
Fair Value
|
One year or less | | $ | 1,983,436 | | $ | 1,981,091 |
One year through five years | | | 3,993,114 | | | 3,941,045 |
| | |
|
| |
|
|
Total | | $ | 5,976,550 | | $ | 5,922,136 |
| | |
|
| |
|
|
Expected maturities may differ from contractual maturities depending on the repayment characteristics and experience of the underlying financial instruments, on which borrowers have the right to call or prepay certain obligations sometimes without penalties.
Securities with a carrying value of approximately $5.9 million and $755,000, at September 30, 2005 and 2004, respectively, were pledged in conjunction with deposits of public, trust funds, and for other purposes as required by law.
| 3. | MORTGAGE-BACKED SECURITIES |
Mortgage-backed securities held to maturity and available-for-sale at September 30, 2005 and 2004 are summarized as follows:
| | | | | | | | | | | | | |
| | | 2005
|
Held-to-Maturity
| | Amortized
Cost
| | | Gross
Unrealized
Gains
| | Gross
Unrealized
Losses
| | Estimated
Fair Value
|
Mortgage-backed securities | | $ | 583,002 | | | $ | 49,097 | | $ | — | | $ | 632,099 |
Collateralized mortgage obligations | | | 67,319 | | | | 35 | | | — | | | 67,354 |
| | |
|
|
| |
|
| |
|
| |
|
|
Total | | $ | 650,321 | | | $ | 49,132 | | $ | — | | $ | 699,453 |
| | |
|
|
| |
|
| |
|
| |
|
|
Weighted average rate at end of period | | | 8.12 | % | | | | | | | | | |
| | |
|
|
| | | | | | | | | |
- 44 -
| | | | | | | | | | | | | | |
| | | 2004
|
Held-to-Maturity
| | Amortized
Cost
| | | Gross
Unrealized
Gains
| | Gross
Unrealized
Losses
| | | Estimated
Fair Value
|
Mortgage-backed securities | | $ | 783,731 | | | $ | 79,578 | | $ | — | | | $ | 863,309 |
Collateralized mortgage obligations | | | 80,692 | | | | — | | | (343 | ) | | | 80,349 |
| | |
|
|
| |
|
| |
|
|
| |
|
|
Total | | $ | 864,423 | | | $ | 79,578 | | $ | (343 | ) | | $ | 943,658 |
| | |
|
|
| |
|
| |
|
|
| |
|
|
Weighted average rate at end of period | | | 8.07 | % | | | | | | | | | | |
| | |
|
|
| |
|
| |
|
|
| |
|
|
| |
| | | 2005
|
| | | | |
Available-for-Sale
| | Amortized
Cost
| | | Gross
Unrealized
Gains
| | Gross
Unrealized
Losses
| | | Estimated
Fair Value
|
Mortgage-backed securities | | $ | 4,226,495 | | | $ | 37,508 | | $ | (81,632 | ) | | $ | 4,182,371 |
| | |
|
|
| |
|
| |
|
|
| |
|
|
Weighted average rate at end of period | | | 4.40 | % | | | | | | | | | | |
| | |
|
|
| | | | | | | | | | |
| |
| | | 2004
|
Available-for-Sale
| | Amortized
Cost
| | | Gross
Unrealized
Gains
| | Gross
Unrealized
Losses
| | | Estimated
Fair Value
|
Mortgage-backed securities | | $ | 5,661,029 | | | $ | 82,980 | | $ | (34,024 | ) | | $ | 5,709,985 |
| | |
|
|
| |
|
| |
|
|
| |
|
|
Weighted average rate at end of period | | | 4.54 | % | | | | | | | | | | |
| | |
|
|
| | | | | | | | | | |
There were no sales of available-for-sale mortgage-backed securities during the years ended September 30, 2005, 2004 or 2003, respectively.
Provided below is a summary of mortgage-backed securities available for-sale which were in an unrealized loss position at September 30, 2005. All of the total unrealized loss was comprised of a security in a continuous loss position for 12 months or more with an estimated maturity of approximately five years. The contractual cash flow of this security is guaranteed by Fannie Mae. The Company has the ability and intent to hold security until such time as the value recovers or the security matures. Further, the Company believes the deterioration in value is attributable to changes in market interest rates and not credit quality of the issuer.
- 45 -
| | | | | | | | | | | | | | | | | | |
| | | Mortgage-backed Securities Available-for-Sale
|
| | | Less than 12 months
| | 12 months or more
| | Total
|
| | | Estimated
Fair Value
| | Unrealized
Losses
| | Estimated
Fair Value
| | Unrealized
Losses
| | Estimated
Fair Value
| | Unrealized
Losses
|
Mortgage-backed securities | | $ | — | | $ | — | | $ | 3,379,926 | | $ | 81,632 | | $ | 3,379,926 | | $ | 81,632 |
| | |
|
| |
|
| |
|
| |
|
| |
|
| |
|
|
Total | | $ | — | | $ | — | | $ | 3,379,926 | | $ | 81,632 | | $ | 3,379,926 | | $ | 81,632 |
| | |
|
| |
|
| |
|
| |
|
| |
|
| |
|
|
The amortized cost and estimated market value of held to maturity and available-for-sale mortgage-backed securities at September 30, 2005, by contractual maturity, are shown below.
| | | | | | | | | | | | |
| | | Held to Maturity
| | Available-for-Sale
|
| | | Amortized
Cost
| | Estimated
Fair Value
| | Amortized
Cost
| | Estimated
Fair Value
|
Term to Maturity | | | | | | | | | | | | |
One year or less | | $ | 427 | | $ | 432 | | $ | — | | $ | — |
One year through five years | | | 44,630 | | | 47,166 | | | 206,335 | | | 213,212 |
Five years through ten years | | | 1,867 | | | 2,066 | | | 3,461,535 | | | 3,379,903 |
Ten years or more | | | 603,397 | | | 649,789 | | | 558,625 | | | 589,256 |
| | |
|
| |
|
| |
|
| |
|
|
Total | | $ | 650,321 | | $ | 699,453 | | $ | 4,226,495 | | $ | 4,182,371 |
| | |
|
| |
|
| |
|
| |
|
|
Actual maturities of mortgage-backed securities may differ from scheduled maturities depending on the repayment characteristics and experience of the underlying financial instruments, on which borrowers have the right to call or prepay certain obligations sometimes without penalties.
Mortgage-backed securities with a carrying value of approximately $1.1 million and $5.9 million at September 30, 2005 and 2004, respectively, were pledged in conjunction with deposits of public trust funds, and for other purposes as required by law.
- 46 -
Loans receivable at September 30, 2005 and 2004 are summarized as follows:
| | | | | | | | |
| | | 2005
| | | 2004
| |
Real estate mortgage: | | | | | | | | |
One to four family residential | | $ | 255,729,099 | | | $ | 242,658,698 | |
Multi-family residential | | | 13,994,329 | | | | 8,923,309 | |
Commercial real estate | | | 104,700,624 | | | | 54,668,997 | |
| | |
|
|
| |
|
|
|
Real estate construction and development: | | | | | | | | |
Residential | | | 33,651,527 | | | | 24,755,824 | |
Multi-family | | | 1,789,997 | | | | 1,493,597 | |
Commercial | | | 9,580,258 | | | | 8,191,473 | |
| | |
|
|
| |
|
|
|
Commercial and industrial | | | 26,305,952 | | | | 16,786,832 | |
| | |
Equity lines | | | 195,646,918 | | | | 158,462,196 | |
Consumer and installment | | | 3,514,166 | | | | 3,685,550 | |
| | |
|
|
| |
|
|
|
| | | | 644,912,870 | | | | 519,626,476 | |
Add (less): | | | | | | | | |
Deferred loan costs | | | 3,931,366 | | | | 3,152,456 | |
Loans-in-process | | | (8,842,953 | ) | | | (6,615,565 | ) |
Allowance for loan losses | | | (6,805,958 | ) | | | (5,579,131 | ) |
| | |
|
|
| |
|
|
|
Total | | $ | 633,195,325 | | | $ | 510,584,236 | |
| | |
|
|
| |
|
|
|
Weighted average rate at end of period | | | 6.59 | % | | | 5.67 | % |
| | |
|
|
| |
|
|
|
The Bank has made loans to officers and directors. Such loans were made in the ordinary course of business on substantially the same terms and conditions, including interest rates and collateral, as those prevailing at the same time for comparable transactions with other customers and did not, in the opinion of management, involve more than normal credit risk.
Changes in loans to officers and directors for the years ended September 30, 2005 and 2004 are summarized as follows:
| | | | |
Balance, September 30, 2003 | | $ | 345,214 | |
Additions | | | 324,065 | |
Repayments and reclassifications | | | (257,099 | ) |
| | |
|
|
|
Balance, September 30, 2004 | | | 412,180 | |
Additions | | | 785,895 | |
Repayments and reclassifications | | | (962,087 | ) |
| | |
|
|
|
Balance, September 30, 2005 | | $ | 235,988 | |
| | |
|
|
|
- 47 -
Home equity lines of credit to officers and directors totaled $769,800 of which $235,988 had been used as of September 30, 2005.
At September 30, 2005, 2004 and 2003, the Bank was servicing loans for others amounting to approximately $6.9 million, $11.9 million and $12.8 million, respectively. Servicing loans for others generally consists of collecting mortgage payments, maintaining escrow accounts, disbursing payments to investors and foreclosure processing. Loan servicing income is recorded on the accrual basis and includes servicing fees from investors and certain charges collected from borrowers.
| 5. | ALLOWANCE FOR LOAN LOSSES |
The following table represents activity in the allowance for loan losses for the years ended September 30, 2005, 2004 and 2003 follows:
| | | | | | | | | | | | |
| | | 2005
| | | 2004
| | | 2003
| |
Balance, beginning of year | | $ | 5,579,132 | | | $ | 3,866,000 | | | $ | 2,553,004 | |
Provision charged to expense | | | 1,634,651 | | | | 1,934,098 | | | | 1,487,431 | |
Charge-offs | | | (257,062 | ) | | | (234,416 | ) | | | (185,838 | ) |
Sale of second mortgage loans | | | (160,075 | ) | | | — | | | | — | |
Recoveries | | | 9,312 | | | | 13,450 | | | | 11,403 | |
| | |
|
|
| |
|
|
| |
|
|
|
Balance, end of year | | $ | 6,805,958 | | | $ | 5,579,132 | | | $ | 3,866,000 | |
| | |
|
|
| |
|
|
| |
|
|
|
- 48 -
A summary of impaired loans at September 30, 2005, 2004 and 2003 is as follows:
| | | | | | | | | |
| | | 2005
| | 2004
| | 2003
|
Non-accrual loans | | $ | 166,137 | | $ | 528,687 | | $ | 465,512 |
Impaired loans continuing to accrue interest | | | 5,829,935 | | | 3,742,038 | | | 3,768,317 |
| | |
|
| |
|
| |
|
|
Total impaired loans | | $ | 5,996,072 | | $ | 4,270,725 | | $ | 4,233,829 |
| | |
|
| |
|
| |
|
|
Interest income recognized on non-accrual loans was approximately $2,900, $13,000 and $27,000 during 2005, 2004 and 2003, respectively. The difference between interest that would have been recognized under the original terms of non-accrual and renegotiated loans and interest actually recognized on such loans was $8,000, $16,000 and $42,000 during 2005, 2004 and 2003, respectively. Impaired loans continuing to accrue interest are loans that are more than 90 days past due; however, the loans are well secured and remain in process of collection.
| | | | | | | | | |
| | | 2005
| | 2004
| | 2003
|
Allowance for losses on specific impaired loans | | $ | 957,866 | | $ | 677,175 | | $ | 778,345 |
Impaired loans with no related allowance for loan losses | | | — | | | — | | | — |
Average balance of impaired loans during the year | | | 5,830,750 | | | 3,922,500 | | | 3,437,000 |
- 49 -
| 6. | REAL ESTATE ACQUIRED IN SETTLEMENT OF LOANS |
Real estate acquired in settlement of loans at September 30, 2005 and 2004 is summarized as follows:
| | | | | | | | |
| | | 2005
| | | 2004
| |
Acquired in settlement of loans | | $ | 819,029 | | | $ | 1,115,697 | |
Allowance for losses | | | (64,833 | ) | | | (47,816 | ) |
| | |
|
|
| |
|
|
|
Total | | $ | 754,196 | | | $ | 1,067,881 | |
| | |
|
|
| |
|
|
|
Activity in the allowance for losses on real estate acquired in settlement of loans for the years ended September 30, 2005, 2004 and 2003 is summarized as follows:
| | | | | | | | | | | | |
| | | 2005
| | | 2004
| | | 2003
| |
Balance, beginning of year | | $ | 47,816 | | | $ | 2,651 | | | $ | — | |
Provision charged to expense | | | 126,422 | | | | 69,264 | | | | 48,768 | |
Charge-offs | | | (109,405 | ) | | | (24,099 | ) | | | (46,117 | ) |
| | |
|
|
| |
|
|
| |
|
|
|
Balance, end of year | | $ | 64,833 | | | $ | 47,816 | | | $ | 2,651 | |
| | |
|
|
| |
|
|
| |
|
|
|
Premises and equipment at September 30, 2005 and 2004 are summarized as follows:
| | | | | | | | |
| | | 2005
| | | 2004
| |
Land | | $ | 2,516,653 | | | $ | 2,377,803 | |
Office buildings and improvements | | | 11,116,282 | | | | 8,691,996 | |
Furniture and equipment | | | 6,256,086 | | | | 5,166,720 | |
| | |
|
|
| |
|
|
|
| | | | 19,889,021 | | | | 16,236,519 | |
Less accumulated depreciation | | | (6,229,384 | ) | | | (5,535,240 | ) |
| | |
|
|
| |
|
|
|
Total | | $ | 13,659,637 | | | $ | 10,701,279 | |
| | |
|
|
| |
|
|
|
Depreciation expense on premises and equipment totaled $1,254,327, $1,143,064, and $975,092 for the years ended September 30, 2005, 2004, and 2003 respectively.
- 50 -
Certain facilities of the Bank are leased under various operating leases. Amounts paid for rent expense for the fiscal years ending September 30, 2005, 2004 and 2003 were approximately $287,000, $265,000 and $193,000, respectively. Future minimum rental commitments under non-cancelable leases are as follows:
| | | |
Years ended September 30,
| | |
2006 | | | 289,784 |
2007 | | | 274,523 |
2008 | | | 167,241 |
2009 | | | 13,954 |
| | |
|
|
Total | | $ | 745,502 |
| | |
|
|
Rental income is mainly from the Company’s office building at Pulaski Center Drive in Creve Coeur. Rental income received for the years ending September 30, 2005, 2004 and 2003 was $146,270, $261,211, and $117,187 respectively.
| 8. | ASSETS AND LIABILITIES HELD FOR SALE |
On October 7, 2005, the Bank entered into a contract to sell its branch in Kansas City, Missouri. Refer to Note 25 for further information. As a result of this agreement, the Company has separately classified the assets held for sale, and the related deposit liabilities as of September 30, 2005 as follows:
| | | |
Property, furniture, and equipment, net | | $ | 573,704 |
Other assets | | | 443,643 |
| | |
|
|
Total assets held for sale | | $ | 1,017,347 |
| | |
|
|
Demand deposit accounts | | $ | 9,482,619 |
Certificates of deposit | | | 15,892,467 |
| | |
|
|
Total deposit liabilities held for sale | | $ | 25,375,086 |
| | |
|
|
- 51 -
Deposits at September 30, 2005 and 2004 are summarized as follows:
| | | | | | | | | | | | |
| | | 2005
| | | 2004
| |
| | | Amount
| | Weighted
Average
Interest
Rate
| | | Amount
| | Weighted
Average
Interest
Rate
| |
Transaction accounts: | | | | | | | | | | | | |
Non-interest-bearing checking | | $ | 30,038,740 | | — | % | | $ | 16,207,039 | | — | % |
Interest-bearing checking | | | 30,961,581 | | 0.16 | | | | 35,243,493 | | 0.21 | |
Passbook savings accounts | | | 32,364,194 | | 0.35 | | | | 33,702,472 | | 0.35 | |
Money market | | | 87,172,497 | | 2.37 | | | | 80,005,702 | | 1.42 | |
| | |
|
| | | | |
|
| | | |
Total transaction accounts | | | 180,537,012 | | 1.24 | | | | 165,158,706 | | 0.81 | |
| | |
|
| | | | |
|
| | | |
Certificates of deposit: | | | | | | | | | | | | |
0.00% to 0.99% | | | 2,987,772 | | 0.77 | | | | 23,392,022 | | 0.70 | |
1.00% to 1.99% | | | 18,011,043 | | 1.58 | | | | 117,762,143 | | 1.54 | |
2.00% to 2.99% | | | 54,362,706 | | 2.60 | | | | 60,548,712 | | 2.43 | |
3.00% to 3.99% | | | 242,013,546 | | 3.59 | | | | 27,325,147 | | 3.33 | |
4.00% to 4.99% | | | 22,608,622 | | 4.30 | | | | 10,911,308 | | 4.62 | |
5.00% to 5.99% | | | 992,535 | | 5.13 | | | | 1,576,818 | | 5.27 | |
6.00% to 6.99% | | | 32,916 | | 6.50 | | | | — | | — | |
7.00% to 7.99% | | | — | | — | | | | 123,737 | | 7.02 | |
| | |
|
| | | | |
|
| | | |
Total certificates of deposit | | | 341,009,140 | | 3.35 | | | | 241,639,887 | | 2.05 | |
| | |
|
| | | | |
|
| | | |
Sub-total | | | 521,546,152 | | 2.59 | % | | | 406,798,593 | | 1.54 | % |
Less: deposit liabilties held for sale | | | 25,375,086 | | | | | | — | | | |
| | |
|
| | | | |
|
| | | |
Total | | $ | 496,171,066 | | | | | $ | 406,798,593 | | | |
| | |
|
| | | | |
|
| | | |
The aggregate amount of certificates of deposit with a minimum principal amount of $100,000 was $164.1 million and $103.2 million at September 30, 2005 and 2004, respectively. Of the $164.1 million, $1.8 million relates to deposit liabilities held for sale.
- 52 -
At September 30, 2005, the scheduled maturities of certificates of deposit were as follows:
| | | | | | |
| | | Amount
| | Weighted
Average
Interest
Rate
| |
Mature within fiscal year: | | | | | | |
2006 | | $ | 189,569,016 | | 3.05 | |
2007 | | | 53,900,237 | | 3.66 | |
2008 | | | 14,582,761 | | 3.59 | |
2009 | | | 11,415,350 | | 3.75 | |
2010 | | | 31,649,330 | | 3.80 | |
Thereafter | | | 39,892,446 | | 3.80 | |
| | |
|
| | | |
Total | | $ | 341,009,140 | | 3.35 | % |
| | |
|
| | | |
A summary of interest expense on deposits for the years ended September 30, 2005, 2004 and 2003 is as follows:
| | | | | | | | | |
| | | 2005
| | 2004
| | 2003
|
Interest-bearing checking | | $ | 129,503 | | $ | 61,505 | | $ | 56,086 |
Passbook savings | | | 1,668,182 | | | 120,918 | | | 207,835 |
Money market | | | 116,699 | | | 939,264 | | | 712,432 |
Certificates of deposit | | | 8,267,336 | | | 4,075,702 | | | 3,448,466 |
| | |
|
| |
|
| |
|
|
Total | | $ | 10,181,720 | | $ | 5,197,389 | | $ | 4,424,819 |
| | |
|
| |
|
| |
|
|
- 53 -
| 10. | ADVANCES FROM FEDERAL HOME LOAN BANK |
Advances from the FHLB at September 30, 2005 and 2004 are summarized as follows:
| | | | | | | | | | | | |
| | | 2005
| | | 2004
| |
Maturing Within Fiscal Year Ending September 30,
| | Amount
| | Weighted
Average
Interest
Rate
| | | Amount
| | Weighted
Average
Interest
Rate
| |
2005 | | $ | — | | — | | | $ | 111,000,000 | | 1.86 | |
2006 | | | 116,000,000 | | 3.65 | | | | 15,000,000 | | 2.60 | |
2007 | | | 11,000,000 | | 3.55 | | | | — | | — | |
2008 | | | 14,900,000 | | 3.82 | | | | — | | — | |
2009 ($10 million callable in FY 2006 and thereafter) | | | 12,100,000 | | 5.60 | | | | 12,100,000 | | 5.60 | |
2010 ($5 million callable in FY 2006 and thereafter) | | | 7,000,000 | | 5.54 | | | | 4,500,000 | | 6.21 | |
2011 (callable in FY 2006 and thereafter) | | | 10,000,000 | | 4.51 | | | | 10,000,000 | | 4.51 | |
2012 | | | — | | — | | | | 2,000,000 | | 2.23 | |
| | |
|
| | | | |
|
| | | |
Total | | $ | 171,000,000 | | 3.93 | % | | $ | 154,600,000 | | 2.53 | % |
| | |
|
| | | | |
|
| | | |
The average balance of advances from Federal Home Loan Bank was $163.1 million and $96.0 million, respectively, and the maximum month-end balance of advances from Federal Home Loan Bank was $189.6 million and $160.5 million, respectively, for the years ended September 30, 2005 and 2004. The average rates paid on advances from Federal Home Loan Bank during the years ended September 30, 2005 and 2004 were 3.32% and 2.45%, respectively. The assets underlying the FHLB borrowings are under Pulaski Bank’s physical control.
The Bank has the ability to borrow funds from the FHLB equal to 35% of the Bank’s total assets under a blanket agreement which assigns all investments in FHLB stock as well as qualifying first mortgage loans as collateral to secure the amounts borrowed. At September 30, 2005, the Bank had approximately $104.5 million in borrowing capacity available to it under the above-mentioned borrowing arrangement.
| 11. | SUBORDINATED DEBENTURES |
On March 30, 2004, Pulaski Financial Statutory Trust I (“Trust I”), a Connecticut statutory trust, issued $9.0 million of adjustable-rate preferred securities. The proceeds from this issuance, along with the Company’s $279,000 capital contribution for Trust I’s common securities, were used to acquire $9.3 million aggregate principal amount of the Company’s floating rate junior subordinated deferrable interest debentures due 2034 which constitute the sole asset of Trust I. The interest rate on the debentures and the capital securities is variable and adjustable quarterly at 2.70% over the three-month LIBOR, with an initial rate of 3.81%. The rate as of September 30, 2005 was 6.59%.
The stated maturity of the Trust I debenture is June 17, 2034. In addition, the Trust I debentures are subject to redemption at par at the option of the Company, subject to prior regulatory approval, in whole or in part on any interest payment date on or after June 17, 2009.
On December 15, 2004, Pulaski Financial Statutory Trust II (“Trust II”), a Delaware statutory trust, issued $10.0 million of adjustable-rate preferred securities. The proceeds from this issuance, along with the Company’s $310,000 capital contribution for Trust II’s common securities, were used to acquire $10.3 million of the
- 54 -
Company’s floating rate junior subordinated deferrable interest debentures due 2034, which constitute the sole asset of Trust II. The interest rate on the debentures and the capital securities is variable and adjustable quarterly at 1.86% over the three-month LIBOR, with an initial rate of 4.31%. The rate as of September 30, 2005 was 5.73%.
The stated maturity of the debentures held by Trust II is December 15, 2034. In addition, the Trust II debentures are subject to redemption at par at the option of the Company, subject to prior regulatory approval, in whole or in part on any interest payment date on or after December 15, 2009.
The note payable is a three-year variable-rate obligation of the Company. The interest rate is set at the correspondent bank’s prime rate less 1%, or 5.75% at September 30, 2005. Interest is payable beginning June 30, 2005 and each quarter thereafter. Principal is payable in installments of $85,000 each, beginning March 31, 2006, and on the same date of each third month thereafter, plus a final payment equal to all unpaid principal on May 20, 2007, the maturity date. The note payable is secured by 1,000 shares of Bank common stock. At September 30, 2005 and 2004 there were outstanding borrowings of $3.6 million and $3.8 million, respectively.
The credit agreement requires the Company to comply with various covenants. At September 30, 2005 and 2004, the Company was in compliance with the covenants or they had been waived.
- 55 -
A summary of future note payable payments at September 30, 2005 is as follows:
| | | |
Years ended September 30,
| | |
2006 | | | 255,000 |
2007 | | | 3,320,000 |
| | |
|
|
Total | | $ | 3,575,000 |
| | |
|
|
Income tax expense for the years ended September 30, 2005, 2004 and 2003 is summarized as follows:
| | | | | | | | | | | | |
| | | 2005
| | | 2004
| | | 2003
| |
Current: | | | | | | | | | | | | |
Federal | | $ | 5,085,200 | | | $ | 3,552,748 | | | $ | 4,549,797 | |
State | | | 549,498 | | | | 547,138 | | | | 526,937 | |
Deferred | | | (1,216,599 | ) | | | (614,302 | ) | | | (1,216,983 | ) |
| | |
|
|
| |
|
|
| |
|
|
|
Total | | $ | 4,418,099 | | | $ | 3,485,584 | | | $ | 3,859,751 | |
| | |
|
|
| |
|
|
| |
|
|
|
Income tax expense for the years ended September 30, 2005, 2004 and 2003 differs from that computed at the federal statutory rate of 34 % as follows:
| | | | | | | | | | | | | | | | | | | | |
| | | 2005
| | | 2004
| | | 2003
| |
| | | Amount
| | | %
| | | Amount
| | | %
| | | Amount
| | %
| |
Tax at statutory federal income tax rate | | $ | 4,044,979 | | | 34.0 | % | | $ | 3,174,661 | | | 34.0 | % | | $ | 3,273,469 | | 34.0 | % |
Increase (decrease) resulting from: | | | | | | | | | | | | | | | | | | | | |
ESOP adjustment | | | 196,510 | | | 1.7 | | | | 103,701 | | | 1.1 | | | | 173,864 | | 1.8 | |
State taxes, net of federal benefit | | | 362,669 | | | 3.0 | | | | 361,111 | | | 3.9 | | | | 347,778 | | 3.6 | |
Other | | | (186,059 | ) | | (1.6 | ) | | | (153,889 | ) | | (1.7 | ) | | | 64,640 | | 0.7 | |
| | |
|
|
| |
|
| |
|
|
| |
|
| |
|
| |
|
|
Total | | $ | 4,418,099 | | | 37.1 | % | | $ | 3,485,584 | | | 37.3 | % | | $ | 3,859,751 | | 40.1 | % |
| | |
|
|
| |
|
| |
|
|
| |
|
| |
|
| |
|
|
- 56 -
The components of deferred tax assets and liabilities, which are included in other assets in the consolidated balance sheets, at September 30, 2005 and 2004, are as follows:
| | | | | | | |
| | | 2005
| | 2004
| |
Deferred tax assets: | | | | | | | |
Allowance for loan losses | | $ | 2,482,231 | | $ | 1,990,029 | |
Restricted stock awards | | | 14,215 | | | 46,175 | |
Deferred compensation | | | 1,494,040 | | | 1,110,392 | |
Unrealized gains (losses) on securities available-for-sale | | | 14,176 | | | (11,527 | ) |
Loss on derivative instruments | | | 285,764 | | | — | |
Other | | | 147,403 | | | 115,631 | |
| | |
|
| |
|
|
|
Total deferred tax assets | | | 4,437,829 | | | 3,250,700 | |
Deferred tax liabilities: | | | | | | | |
FHLB stock dividends | | | 134,007 | | | 134,007 | |
Premises and equipment | | | 48,457 | | | 113,218 | |
Other | | | 20,891 | | | 11,303 | |
| | |
|
| |
|
|
|
Total deferred tax liabilities | | | 203,355 | | | 258,528 | |
| | |
|
| |
|
|
|
Net deferred tax assets | | $ | 4,234,474 | | $ | 2,992,172 | |
| | |
|
| |
|
|
|
Retained earnings at September 30, 2005 included earnings of approximately $4.1 million representing tax bad debt deductions, net of actual bad debts and bad debt recoveries, for which no provision for federal income taxes has been made. If these amounts are used for any purpose other than to absorb loan losses, they will be subject to federal income taxes at the then prevailing corporate rate.
A valuation allowance would be provided on deferred tax assets when it is more likely than not that some portion of the assets will not be realized. The Company has not established a valuation allowance at September 30, 2005 or 2004, due to management’s belief that all criteria for recognition have been met, including the existence of a history of taxes paid sufficient to support the realization of deferred tax assets.
During fiscal 2005, the Company paid quarterly cash dividends on common stock of $0.08 per share on October 24, 2005 and July 18, 2005 and $0.06 per share on April 18, 2005 and January 17, 2005. During fiscal 2004, the Company paid quarterly cash dividends on common stock of $0.06 per share on October 18, 2004 and July 19, 2004 and $0.04 per share on April 19, 2004 and January 19, 2004.
During fiscal 2005, the Company repurchased 13,717 shares of its own stock with a total value of $190,000 at the time of repurchase. The Company has repurchased a total of 2,005,026 shares of its own stock with a total value of $11.5 million since becoming a public company in December 1998.
| 15. | REGULATORY CAPITAL REQUIREMENTS |
The Bank is subject to various regulatory capital requirements administered by the federal banking agencies. Failure to meet minimum capital requirements can initiate certain mandatory and possibly additional discretionary actions by regulators that, if undertaken, could have a direct material effect on the Company’s financial statements. Under capital adequacy guidelines and the regulatory framework for prompt corrective action, the Bank must meet specific capital guidelines that involve quantitative measures of the Bank’s assets, liabilities, and certain off-balance-sheet items as calculated under regulatory accounting practices. The Bank’s capital amounts and classification are also subject to qualitative judgments by the regulators about components, risk weightings, and other factors.
- 57 -
Quantitative measures that have been established by regulation to ensure capital adequacy require the Bank to maintain minimum capital amounts and ratios (set forth in the table below). The Bank’s primary regulatory agency, the Office of Thrift Supervision (the “OTS”), requires that the Bank maintain minimum ratios of tangible capital (as defined in the regulations) of 1.5%, core capital (as defined) of 3% and total risk-based capital (as defined) of 8%. The Bank is also subject to prompt corrective action capital requirement regulations set forth by the OTS. The OTS requires the Bank to maintain minimum of total and Tier I capital (as defined in the regulations) to risk-weighted assets (as defined), and of Tier I capital to average assets (as defined). Management believes, as of September 30, 2005, that the Bank meets all capital adequacy requirements to which it is subject.
As of September 30, 2005 and 2004, the most recent notification from the OTS categorized the Bank as “well capitalized” under the regulatory framework for prompt corrective action. To be categorized as “well capitalized” the Bank must maintain minimum total risk-based, Tier I risk-based, Tier I leverage ratios as set forth in the table. There are no conditions or events since that notification that management believes have changed the Bank’s category.
| | | | | | | | | | | | | | | | | | |
| | | Actual
| | | For Capital
Adequacy Purposes
| | | To be Categorized as
“Well Capitalized”
Under Prompt
Corrective Action
Provisions
| |
| | | Amount
| | Ratio
| | | Amount
| | Ratio
| | | Amount
| | Ratio
| |
| | | (Dollars in thousands) | |
As of September 30, 2005 | | | | | | | | | | | | | | | | | | |
Tangible capital (to total assets) | | $ | 67,663 | | 8.60 | % | | $ | 11,796 | | 1.50 | % | | | N/A | | N/A | |
Total risk-based capital (to risk- weighted assets) | | | 74,280 | | 10.85 | % | | | 54,751 | | 8.00 | % | | $ | 68,439 | | 10.00 | % |
Tier I risk-based capital (to risk- weighted assets) | | | 67,663 | | 9.89 | % | | | 34,219 | | 5.00 | % | | | 41,063 | | 6.00 | % |
Tier I leverage capital (to average assets) | | | 67,663 | | 8.60 | % | | | 31,455 | | 4.00 | % | | | 39,319 | | 5.00 | % |
As of September 30, 2004 | | | | | | | | | | | | | | | | | | |
Tangible capital (to total assets) | | $ | 51,680 | | 8.14 | % | | $ | 9,524 | | 1.50 | % | | | N/A | | N/A | |
Total risk-based capital (to risk- weighted assets) | | | 57,102 | | 11.46 | % | | | 39,850 | | 8.00 | % | | $ | 49,813 | | 10.00 | % |
Tier I risk-based capital (to risk- weighted assets) | | | 51,680 | | 10.37 | % | | | 24,906 | | 5.00 | % | | | 29,888 | | 6.00 | % |
Tier I leverage capital (to average assets) | | | 51,680 | | 8.14 | % | | | 25,397 | | 4.00 | % | | | 31,746 | | 5.00 | % |
- 58 -
A reconciliation at September 30, 2005 of the Bank’s stockholders’ equity and regulatory risk-based capital follows:
| | | | |
| | | (Dollars in thousands)
| |
Tier I stockholders’ equity | | $ | 68,075 | |
Deduct: | | | | |
Other intangible assets | | | (444 | ) |
Disallowed servicing rights | | | (44 | ) |
Add: | | | | |
Unrealized gains on available for sale securities | | | 76 | |
| | |
|
|
|
Tangible capital | | | 67,663 | |
Add: | | | | |
Equity investments to be deducted | | | (104 | ) |
General valuation allowances | | | 6,721 | |
| | |
|
|
|
Total risk-based capital | | $ | 74,280 | |
| | |
|
|
|
The Bank is prohibited from paying cash dividends if the effect thereof would be to reduce the regulatory capital of the Bank below the amount required for the liquidation account that the Bank established in connection with the consummation of the conversion from the mutual holding company structure on December 2, 1998.
On January 21, 2000, shareholders approved an equity incentive plan under which the Company could award up to 349,140 shares of restricted stock. As of September 30, 2005, 332,592 shares awarded under the plan had vested, 16,548 shares awarded under the plan remained subject to restriction and none were available for grant. All restricted share awards are satisfied through the issuance of treasury stock. The unearned restricted share award balance is reflected in stockholders’ equity and amortizes to compensation expense over the vesting period. During fiscal year 2005, 3,720 restricted shares were awarded. Compensation expense related to vesting of restricted shares was $89,634, $199,180 and $175,693 during the years ended September 30, 2005, 2004 and 2003, respectively.
The Bank entered into a Supplemental Retirement Benefit agreement with its former chief executive officer. Under the terms of the agreement, the former officer is entitled to receive $2,473 monthly, for a period of 15 years commencing upon his retirement, which began in January 1998. The net present value of these payments is reflected in other liabilities and totaled $163,099, $179,675, and $195,058 at September 30, 2005, 2004 and 2003, respectively. Compensation expense under this agreement totaled $13,099, $14,300, and $15,400 for the years ended September 30, 2005, 2004 and 2003, respectively.
The Company and the Bank each maintain a three-year employment agreement with the CEO. Under the agreement, the Bank pays the CEO a base salary. The CEO’S base salary is reviewed at least annually, and may be increased at the discretion of the Board of Directors. The CEO is also entitled to receive health and welfare benefits provided to other Company and Bank employees. Additionally, the agreement provides for severance payments if employment is terminated following a change in control or upon an event of termination as defined in the agreement. In the event of a change in control and subsequent termination of employment, the CEO will receive a lump sum payment equal to 2.99 times his average annual compensation paid during the five years immediately preceding the change in control.
- 59 -
During the year ended September 30, 2002, the Company created an Equity Trust Plan (the “Trust”) for the benefit of key loan officers and sales staff. The Trust is a plan designed to recruit and retain top-performing loan officers that are instrumental to the Company’s success. Currently, none of the Company’s executive officers participate in the Trust. The Trust allows the recipients to defer a percentage of commissions earned, which is partially matched by the Company and paid into an independent trust for the benefit of the loan officers. The assets of the Trust are limited to the purchase of Company shares in the open market. In exchange for the opportunity to defer income, the participants are required to sign a four-year or five-year contract prohibiting them from competing against the Company in the Company’s market area. Should the participants voluntarily leave the Company, they forgo any accrued benefits. At September 30, 2005, 429,321 shares had been purchased on behalf of the Trust at an average price of $9.08. For purposes of earnings per share, the shares in the Trust are treated as issued and outstanding, thus no dilution is experienced through the purchase or vesting of shares. Expense related to the Trust of $1.0 million, $507,952 and $1.4 million for the years ended September 30, 2005, 2004 and 2003, respectively, is treated as loan officer commission expense, and deferred according to SFAS 91. Since the majority of loans originated are sold on a servicing released basis resulting in mortgage revenues, most of the deferred expense is realized as a reduction of mortgage revenue.
At September 30, 2005, the Company had awarded 862,217 options under the Company’s stock option plans. At September 30, 2005, the Company had 32,144 reserved but un-issued options. At September 30, 2005, the recipients of the awards had 478,128 options vested and exercisable at an average exercise price of $4.70. The average exercise price of the ending balance of 862,217 options was $6.87 at September 30, 2005. Included in this balance were 143,248 options granted in fiscal 2005 with an average exercise price of $13.35. Officers and directors exercised 222,467 options during the year ended September 30, 2005. In order for awardees to meet tax obligations, 4,775 shares were returned to treasury. The average option exercise price for options exercised in 2005 was $4.38.
A summary of the status of the Company’s stock option plans for the years ended September 30, is as follows:
| | | | | | | | | | | | | | | | | | |
| | | 2005
| | 2004
| | 2003
|
| | | Options
| | | Weighted Average
Exercise Price
| | Options
| | | Weighted Average
Exercise Price
| | Options
| | | Weighted Average
Exercise Price
|
Outstanding-beginning of year | | 948,186 | | | | 5.33 | | 1,095,174 | | | | 4.55 | | 1,264,806 | | | | 4.17 |
Granted | | 143,248 | | | | 13.35 | | 89,874 | | | | 11.91 | | 53,100 | | | | 8.63 |
Exercised | | (222,467 | ) | | | 4.38 | | (219,364 | ) | | | 3.68 | | (218,232 | ) | | | 3.19 |
Forfeited | | (6,750 | ) | | | 11.30 | | (17,498 | ) | | | 9.80 | | (4,500 | ) | | | 5.55 |
| | |
|
| |
|
| |
|
| |
|
| |
|
| |
|
|
Outstanding-end of year | | 862,217 | | | | 6.87 | | 948,186 | | | | 5.33 | | 1,095,174 | | | | 4.55 |
| | |
|
| |
|
| |
|
| |
|
| |
|
| |
|
|
Exercisable at end of year | | 478,128 | | | | 4.70 | | 509,430 | | | | 4.15 | | 507,333 | | | | 3.64 |
| | |
|
| |
|
| |
|
| |
|
| |
|
| |
|
|
Weighted average fair value of options granted during the year | | — | | | $ | 3.17 | | — | | | $ | 2.57 | | — | | | $ | 2.52 |
- 60 -
The following is a summary of the options outstanding at September 30, 2005:
| | | | | | | | | | | | |
Range of Exercise Prices
| | Number of
Options
Outstanding
| | Weighted Average
Remaining
Contractual Life
| | Weighted Average
Exercise Price
| | Number of
Exercisable
Options
| | Weighted
Average
Exercise
Price
|
$2.70 - $2.70 | | 157,608 | | 4.31 | | $ | 2.70 | | 157,608 | | $ | 2.70 |
3.33 - 4.73 | | 128,678 | | 5.76 | | | 4.36 | | 104,678 | | | 4.32 |
5.13 - 5.13 | | 13,500 | | 6.05 | | | 5.13 | | 7,500 | | | 5.13 |
5.55 - 5.55 | | 228,698 | | 6.30 | | | 5.55 | | 127,823 | | | 5.55 |
6.10 - 6.75 | | 88,914 | | 6.91 | | | 6.20 | | 51,849 | | | 6.18 |
7.58 - 12.99 | | 116,196 | | 8.43 | | | 11.33 | | 27,995 | | | 10.42 |
13.00 - 13.44 | | 89,450 | | 9.23 | | | 13.22 | | 675 | | | 13.15 |
13.47 - 13.77 | | 27,173 | | 9.26 | | | 13.57 | | — | | | — |
14.00 - 14.00 | | 8,250 | | 9.41 | | | 14.00 | | — | | | — |
16.54 - 16.54 | | 3,750 | | 9.69 | | | 16.54 | | — | | | — |
| | |
| |
| |
|
| |
| |
|
|
$2.70 $16.54 | | 862,217 | | 6.64 | | $ | 6.87 | | 478,128 | | $ | 4.70 |
The Bank maintains a 401(k) savings plan for eligible employees. In 2005, 2004 and 2003, the Bank matched 50% of each participant’s contribution up to a maximum of 4% of salary. The Bank’s contributions to this plan were $220,019, $170,120 and $144,900 for the years ended September 30, 2005, 2004 and 2003, respectively.
The Bank maintains a tax-qualified stock ownership plan known as the Pulaski Bank Employee Stock Ownership Plan (the “ESOP”) for all eligible employees. In 1998, 698,280 shares were purchased by the ESOP at $3.33 a share through a loan from the Company. As the loan is repaid, shares are released from collateral and allocated to each participant in an amount that is equivalent to the ratio of each participant’s salary to that of the total payroll for each year ended December 31. At September 30, 2005, the shares held by the ESOP had been fully released but will not be allocated until December 2005. Compensation expense is recognized equal to the average fair market value of the shares as shares are released out of the unallocated general ESOP trust account and into employee accounts. Compensation expense under the ESOP plan was $761,742, $421,373 and $876,105 for the years ended September 30, 2005, 2004 and 2003, respectively. At September 30, 2005 and 2004, the status of the ESOP shares was as follows:
| | | | |
| | | 2005
| | 2004
|
Allocated shares | | 587,853 | | 567,393 |
Unallocated shares | | 28,491 | | 55,133 |
| | |
| |
|
Total ESOP shares | | 616,344 | | 622,526 |
| | |
| |
|
- 61 -
| 17. | RECONCILIATION OF BASIC EARNINGS PER SHARE TO DILUTED EARNINGS PER SHARE |
Basic earnings per share is computed using the weighted average number of common shares outstanding. The dilutive effect of potential common shares outstanding is included in diluted earnings per share. The computations of basic and diluted earnings per share are presented in the following table.
| | | | | | | | | |
| | | Years Ended September 30,
|
| | | 2005
| | 2004
| | 2003
|
Net income | | $ | 7,478,898 | | $ | 5,851,655 | | $ | 5,768,101 |
| | |
|
| |
|
| |
|
|
Weighted average shares outstanding - basic | | | 7,925,674 | | | 7,758,069 | | | 7,843,129 |
Effect of dilutive securities: | | | | | | | | | |
Treasury stock-equity trust | | | 403,633 | | | 337,965 | | | 229,441 |
Employee stock options | | | 498,917 | | | 598,970 | | | 505,348 |
| | |
|
| |
|
| |
|
|
Weighted average shares outstanding - diluted | | | 8,828,224 | | | 8,695,004 | | | 8,577,918 |
| | |
|
| |
|
| |
|
|
Earnings per share: | | | | | | | | | |
Basic | | $ | 0.94 | | $ | 0.75 | | $ | 0.74 |
Diluted | | | 0.85 | | | 0.67 | | | 0.67 |
Basic earnings per share was restated from $0.72 to $0.75 for the year ended September 30, 2004 and from $0.71 to $0.74 for the year ended September 30, 2003, to reflect equity trust shares in treasury stock as not outstanding for the calculation of basic earnings per share.
The Company is a defendant in legal actions arising from normal business activities. Management, after consultation with general counsel, believes that the resolution of these actions will not have any material adverse effect on the Company’s consolidated financial statements.
The Company employs derivative financial instruments to assist in its management of interest rate sensitivity by modifying the repricing, maturity and option characteristics of certain assets and liabilities.
The Company utilizes derivative financial instruments to assist in its management of interest rate sensitivity of certain mortgage assets. Derivative financial instruments issued by the Company consist of interest rate lock commitments to originate residential loans. Commitments to originate loans consist primarily of residential real estate loans. At September 30, 2005 the Company had issued $147.1 million of unexpired interest rate lock commitments to mortgage loan customers compared to $109.3 million of unexpired commitments at September 30, 2004.
The Company typically economically hedges these derivative commitments through one of two means – either by obtaining a corresponding best-efforts lock commitment with an investor to sell the loan at an agreed upon price, or by forward selling mortgage-backed securities. The forward sale of mortgage-backed securities is a means of matching a corresponding derivative asset with similar characteristics as the bank-issued commitment but changes directly opposite in fair value from market movements. Loans hedged through forward sales of mortgaged-backed securities are sold individually or in pools on a mandatory delivery basis to investors, whereas the best efforts sales are locked on a loan-by-loan basis shortly after issuing the rate lock
- 62 -
commitments to customers. The Company had outstanding forward sales commitments of mortgage-backed securities of $15.0 million in notional value at September 30, 2005 and $15.0 million at September 30, 2004. At September 30, 2005, this hedge was matched against $11.5 million of interest rate lock commitments that were to be sold through the mandatory delivery of loan pool sales compared to $16.9 million of interest rate lock commitments at September 30, 2004.
The carrying value of the interest rate lock commitments included in the consolidated balance sheets was ($83,800) and $49,957 at September 30, 2005 and 2004, respectively. The carrying value of the forward sales commitments included in the consolidated balance sheets was $104,250 and ($44,675) at September 30, 2005 and 2004, respectively.
The Company entered into interest rate swap agreements related to hedge a number of its brokered certificates of deposit in order to convert the fixed rates on the brokered CDs into variable LIBOR rates. The effect of the swap agreement is that the counterparty pays the fixed rate to the Company while the Company pays the LIBOR rate to the counterparty. The maturity date, notional amounts, interest rates paid and received and fair value of the Company’s interest rate swap agreements as of September 30, 2005 were as follows:
| | | | | | | | | | | | | |
Maturity
Date
| | Notional Amount
| | Interest Rate Paid
| | | Interest Rate Received
| | | Estimated Fair
Value
| |
| 10/20/2008 | | $ | 10,000,000 | | 3.57 | % | | 4.30 | % | | $ | (115,467 | ) |
| 11/19/2009 | | | 10,000,000 | | 3.57 | % | | 3.00 | % | | | (179,100 | ) |
| 11/23/2009 | | | 10,000,000 | | 3.58 | % | | 3.00 | % | | | (159,009 | ) |
| 11/26/2010 | | | 10,000,000 | | 3.62 | % | | 4.13 | % | | | (325,857 | ) |
| 11/26/2010 | | | 5,000,000 | | 3.61 | % | | 4.13 | % | | | (161,147 | ) |
| 11/26/2010 | | | 5,000,000 | | 3.60 | % | | 4.13 | % | | | (159,370 | ) |
| 1/24/2010 | | | 10,000,000 | | 3.58 | % | | 3.00 | % | | | (166,723 | ) |
| 1/28/2011 | | | 10,000,000 | | 3.63 | % | | 4.30 | % | | | (271,769 | ) |
| 2/25/2011 | | | 5,000,000 | | 3.60 | % | | 4.80 | % | | | (63,823 | ) |
| 9/14/2012 | | | 5,000,000 | | 3.71 | % | | 4.25 | % | | | (84,908 | ) |
| | |
|
| | | | | | | |
|
|
|
| Total | | $ | 80,000,000 | | | | | | | | $ | (1,687,173 | ) |
| | |
|
| | | | | | | |
|
|
|
| 20. | FINANCIAL INSTRUMENTS WITH OFF-BALANCE SHEET RISK AND CONCENTRATIONS OF CREDIT RISK |
The Bank is a party to financial instruments with off-balance sheet risk in the normal course of business to meet the financing needs of its customers in the way of commitments to extend credit. Commitments to extend credit are agreements to lend to a customer as long as there is no violation of any condition established in the contract. Commitments generally have fixed expiration dates or other termination clauses and may require payment of a fee. The Bank evaluates each customer’s creditworthiness on a case-by-case basis.
At September 30, 2005, the Bank had firm commitments to originate loans of approximately $147.1 million of which $87.9 million were committed to be sold. Of the remaining $59.2 million to be retained, $20.7 million were at fixed rates. At September 30, 2004, the Bank had firm commitments to originate loans of approximately $109.3 million of which $58.7 million were committed to be sold. Of the remaining $50.6
- 63 -
million to be retained, $14.0 million were at fixed rates. Additionally, the Bank had outstanding commitments to lend to borrowers under unused equity lines of credit of $231.9 million and $184.9 million at September 30, 2005 and 2004, respectively.
At September 30, 2005 and 2004, the Bank had firm commitments to sell loans on a best-efforts basis of $150.0 million and $108.3 million, respectively, which includes $65.2 million and $49.1 million, respectively, recorded in the financial statements as loans held-for-sale. Any unrealized loss on these commitment obligations is considered in conjunction with the Bank’s lower of cost or market valuation on its loans receivable held-for-sale.
Standby letters of credit are conditional commitments issued by the Bank to guarantee the performance of a customer to a third party. These standby letters of credit are primarily issued to support contractual obligations of the Bank’s customers. The credit risk involved in issuing letters of credit is essentially the same as the risk involved in extending loans to customers. At September 30, 2005, the Bank had nine letters of credit totaling approximately $264,000 due to expire no later than April 2008 compared to seven letters of credit totaling approximately $214,000 due to expire no later than March 2006 at September 30, 2004.
Substantially all of the Bank’s loans are to borrowers located in St. Louis, Kansas City and the surrounding Missouri counties.
- 64 -
| 21. | FAIR VALUE OF FINANCIAL INSTRUMENTS |
Estimated fair value amounts of financial instruments have been determined by the Company using available market information and appropriate valuation methodologies. However, considerable judgment is necessarily required to interpret market data to develop the estimates of fair value. Accordingly, the estimates presented herein are not necessarily indicative of the amounts the Company could realize in a current market exchange. The use of different market assumptions and/or estimation methodologies may have a material effect on the estimated fair value amounts.
- 65 -
Carrying values and estimated fair values at September 30, 2005 and 2004 are summarized as follows:
| | | | | | | | | | | | |
| | | 2005
| | 2004
|
| | | Carrying
Value
| | Estimated
Fair
Value
| | Carrying
Value
| | Estimated
Fair
Value
|
ASSETS: | | | | | | | | | | | | |
Cash and cash equivalents | | $ | 25,688,000 | | $ | 25,688,000 | | $ | 19,581,000 | | $ | 19,581,000 |
Debt securities-AFS | | | — | | | — | | | 9,224,000 | | | 9,224,000 |
Equity securities-AFS | | | 4,252,000 | | | 4,252,000 | | | 3,762,000 | | | 3,762,000 |
Debt securities-HTM | | | 5,977,000 | | | 5,922,000 | | | — | | | — |
Capital Stock of FHLB | | | 8,462,000 | | | 8,462,000 | | | 7,538,000 | | | 7,538,000 |
Mortgage-backed securities-HTM | | | 650,000 | | | 699,000 | | | 864,000 | | | 944,000 |
Mortgage-backed securities-AFS | | | 4,182,000 | | | 4,182,000 | | | 5,710,000 | | | 5,710,000 |
Assets held for sale | | | 1,017,000 | | | 1,017,000 | | | — | | | — |
Loans: | | | | | | | | | | | | |
Loans receivable held for sale | | | 64,335,000 | | | 65,442,000 | | | 49,152,000 | | | 49,973,000 |
Loans receivable | | | 633,195,000 | | | 630,904,000 | | | 510,584,000 | | | 515,582,000 |
Accrued interest receivable | | | 4,272,000 | | | 4,272,000 | | | 2,539,000 | | | 2,539,000 |
LIABILITIES: | | | | | | | | | | | | |
Deposits | | | 496,171,000 | | | 496,171,000 | | | 406,799,000 | | | 406,799,000 |
Deposit liabilities held for sale | | | 25,375,000 | | | 22,076,000 | | | — | | | — |
Advances from FHLB | | | 171,000,000 | | | 169,622,000 | | | 154,600,000 | | | 154,953,000 |
Note payable | | | 3,575,000 | | | 3,575,000 | | | 3,830,000 | | | 3,830,000 |
Derivative liabilities | | | 1,687,000 | | | 1,687,000 | | | — | | | — |
Subordinated debentures | | | 19,589,000 | | | 19,589,000 | | | 9,279,000 | | | 9,279,000 |
Accrued interest payable | | | 1,028,000 | | | 1,028,000 | | | 505,000 | | | 505,000 |
Due to other banks | | | 13,636,000 | | | 13,636,000 | | | 14,464,000 | | | 14,464,000 |
| | |
| | | 2005
| | 2004
|
| | | Contract
or
Notional
Amount
| | Estimated
Fair
Value
| | Contract
or
Notional
Amount
| | Estimated
Fair
Value
|
Off-balance sheet financial instruments: | | | | | | | | | | | | |
Commitments to originate and purchase first and second mortgage loans | | $ | 141,133,000 | | $ | — | | $ | 99,515,000 | | $ | — |
Commitments to originate non-mortgage loans | | | 5,954,000 | | | — | | | 9,816,000 | | | — |
Lines of Credit: | | | | | | | | | | | | |
Unused Lines of Credit | | | 231,935,000 | | | — | | | 184,946,000 | | | — |
The following methods and assumptions were used to estimate the fair value of the financial instruments:
Cash and Cash Equivalents - The carrying amount approximates fair value.
Securities and Mortgage-backed Securities - Estimated fair values of securities and mortgage-backed securities are based on quoted market prices and prices obtained from independent pricing services. If quoted market prices are not available, fair values are estimated using quoted market prices for similar instruments.
Equity securities– Estimated fair value comprised of stock market price for publicly quoted stocks, and broker-provided market value for Community Reinvestment Act Fund.
- 66 -
Capital Stock of the Federal Home Loan Bank - The carrying amount approximates fair value.
Assets and Liabilities Held-for-Sale- The fair value is based on the contractual premium in the signed definitive agreement dated October 7, 2005.
Loans Receivable Held-for-Sale - The estimated fair value of loans held-for-sale is determined based upon recent historic sales premiums.
Loans Receivable - The fair value of loans receivable is estimated based on present values using applicable risk-adjusted spreads to the U. S. Treasury curve to approximate current interest rates applicable to each category of such financial instruments. No adjustment was made to the interest rates for changes in credit of performing loans for there are no known credit concerns. Management segregates loans in appropriate risk categories. Management believes that the risk factor embedded in the interest rates along with the allowance for loan losses applicable to the performing loan portfolio results in a fair valuation of such loans.
Accrued Interest Receivable- The carrying value approximates fair value.
Deposits - The estimated fair value of demand deposits and savings accounts is the amount payable on demand at the reporting date. The estimated fair value of fixed-maturity certificates of deposit is estimated by discounting the future cash flows of existing advances using rates currently available on advances from Federal Home Loan Bank having similar characteristics.
Derivative Assets and Liabilities - The fair value is based on quoted market prices by the counter-party.
Advances from Federal Home Loan Bank - The estimated fair value of advances from Federal Home Loan Bank is determined by discounting the future cash flows of existing advances using rates currently available on advances from Federal Home Loan Bank having similar characteristics.
Note Payable - The carrying value approximates fair value as it is a variable rate obligation.
Due to Other Banks - The carrying value approximates fair value.
Subordinated Debentures - The carrying value approximates fair value due to the variable pricing of the debt, which is based upon the 90 day LIBOR rate.
Accrued Interest Payable - The carrying value approximates fair value.
Off-Balance Sheet Items - The estimated fair value of commitments to originate or purchase loans is based on the fees currently charged to enter into similar agreements and the difference between current levels of interest rates and the committed rates. The Company believes such commitments have been made on terms which are competitive in the markets in which it operates; however, no premium or discount is offered thereon and accordingly, the Company has not assigned a value to such instruments for purposes of this disclosure.
The fair value estimates presented herein are based on pertinent information available to management as of September 30, 2005 and 2004. Although management is not aware of any factors that would significantly affect the estimated fair value amounts, such amounts have not been comprehensively revalued for purposes of these financial statements since that date. Therefore, current estimates of fair value may differ significantly from the amounts presented herein.
- 67 -
| 22. | IMPACT OF RECENTLY ISSUED ACCOUNTING STANDARDS |
In November 2003, the Emerging Issues Task Force, or EITF, reached a consensus on certain disclosure requirements under EITF Issue No 03-1, The Meaning of Other-Than-Temporary Impairment and Its Application to Certain Investments. The new disclosure requirements apply to investment in debt and marketable equity securities that are accounted for under SFAS No. 115, Accounting for Certain Investments in Debt and Equity Securities, and SFAS No. 124, Accounting for Certain Investments Held by Not-for-Profit Organizations. Effective for fiscal years ending after December 15, 2003, companies are required to disclose information about debt or marketable equity securities with market values below carrying values. We previously adopted the disclosure requirements of EITF Issue No. 03-1. In March 2004, the EITF came to a consensus regarding EITF 03-1. Securities in scope are those subject to SFAS 115 and SFAS 124. The EITF adopted a three-step model that requires management to determine if impairment exists, decide whether it is other than temporary, and record other-than-temporary losses in earnings. In September 2004, the Financial Accounting Standards Board, or FASB, approved issuing a Staff Position to delay the requirement to record impairment losses under EITF 03-1, but broadened the scope to include additional types of securities. As proposed, the delay would have applied only to those debt securities described in paragraph 16 of EITF 03-1, the Consensus that provides guidance for determining whether an investment’s impairment is other than temporary and should be recognized in income. On June 29, 2005, the FASB directed the EITF to issue EITF Issue 03-1-a, Implementation Guidance for the Application of Paragraph 16 of EITF Issue No. 03-1, as final. On November 3, 2005, the FASB issued FASB Staff Position, or FSP, FAS 115-1 and FAS 124-1, The Meaning of Other-Than-Temporary Impairment and Its Application to Certain Investments. The FSP addresses determining when an investment is considered impaired and whether that impairment is other than temporary, and measuring an impairment loss. The FSP also addresses the accounting after an entity recognizes an other-than-temporary impairment, and requires certain disclosures about unrealized losses that the entity did not recognize as other-than-temporary impairments. The FSP is effective for reporting periods beginning after December 15, 2005. We are currently evaluating the requirements of FSP FAS 115-1 and FAS 124-1 and do not expect them to have a material effect on our financial condition or results of operations.
In December 2003, the Accounting Standards Executive Committee, or AcSEC, issued SOP 03-3, Accounting for Certain Loans or Debt Securities Acquired in a Transfer, effective for loans acquired in fiscal years beginning after December 15, 2004. The scope of SOP 03-3 applies to problem loans that have been acquired, either individually in a portfolio, or in an acquisition. These loans must have evidence of credit deterioration and the purchaser must not expect to collect contractual cash flows. SOP 03-3 updates Practice Bulletin No. 6, Amortization of Discounts on Certain Acquired Loans, for more recently issued literature, including FASB Statements No. 114, Accounting by Creditors for Impairment of a Loan; No. 115, Accounting for Certain Investments in Debt and Equity Securities; and No. 140, Accounting for Transfers and Servicing of Financial Assets and Extinguishments of Liabilities. Additionally, it addresses FASB Statement No. 91, Accounting for Nonrefundable Fees and Costs Associated with Originating or Acquiring Loans and Initial Direct Costs of Leases, which requires that discounts be recognized as an adjustment of yield over a loan's life. SOP 03-3 states that an institution may no longer display discounts on purchased loans within the scope of SOP 03-3 on the balance sheet and may not carry over the allowance for loan losses. For those loans within the scope of SOP 03-3, this statement clarifies that a buyer cannot carry over the seller's allowance for loan losses for the acquisition of loans with credit deterioration. Loans acquired with evidence of deterioration in credit quality since origination will need to be accounted for under a new method using an income recognition model. This prohibition also applies to purchases of problem loans not included in a purchase business combination, which would include syndicated loans purchased in the secondary market and
- 68 -
loans acquired in portfolio sales. The implementation of SOP 03-3 on October 1, 2005, is not expected to have any material effect on our financial condition or results of operation.
In December 2004, the Financial Accounting Standards Board issued Statement of Financial Accounting Standards No 123 (Revised 2004), Share-Based Payment. This Statement addresses the accounting for transactions in which an entity exchanges its equity instruments for goods or services. The Statement eliminates the ability to account for share-based compensation transactions using APB Opinion No. 25, Accounting for Stock Issued to Employees, and generally requires instead that such transactions be accounted for using a fair-value-based method. For public entities, the cost of employee services received in exchange for an award of equity instruments, such as stock options, will be measured based on the grant-date fair value of those instruments, and that cost will be recognized over the period during which as employee is required to provide service in exchange for the award (usually the vesting period). This Statement is effective for the Company beginning on October 1, 2005. The implementation of SFAS No.123R is not expected to have any material effect on the Company’s financial condition or results of operations.
In May 2005, the FASB issued SFAS No. 154 -Accounting Changes and Error Corrections. SFAS No. 154, a replacement of APB Opinion No. 20- Accounting Changes and FASB Statement No. 3 - Reporting Accounting Changes in Interim Financial Statements. SFAS No. 154 requires retrospective application for voluntary changes in accounting principles unless it is impracticable to do so. SFAS No. 154 is effective for accounting changes and corrections of errors in fiscal years beginning after December 15, 2005. Early application is permitted for accounting changes and corrections of errors during fiscal years beginning after June 1, 2005. We are currently evaluating the requirements of SFAS No. 154 and do not expect it to have a material effect on our financial condition or results of operations.
In July 2005, the FASB issued an exposure draft titled Accounting for Uncertain Tax Positions, an Interpretation of SFAS No. 109 - Accounting for Income Taxes. This exposure draft addresses accounting for tax uncertainties that arise when a position that an entity takes on its tax return may be different from the position that the taxing authority may take, and provides guidance about the accounting for tax benefits associated with uncertain tax positions, classification of a liability recognized for those tax positions, and interim reporting considerations. The proposed interpretation is not expected to be issued until the first quarter of 2006, at which time the FASB will decide on a revised effective date and transition period. We are currently evaluating the requirements of the exposure draft to determine the impact on our financial condition and results of operations.
- 69 -
| 23. | SELECTED QUARTERLY FINANCIAL DATA (UNAUDITED) |
In November 2004, the Company had entered into certain interest rate swap agreements to hedge the interest rate risk inherent in certain of its brokered certificates of deposit. These hedging relationships did not meet the criteria for the “short-cut” method of fair value hedge accounting in SFAS No. 133,Accounting for Derivative Instruments and Hedging Activities(“SFAS No. 133”).
Because the Company did not qualify for the “short-cut” method of hedge accounting on these swap agreements, the amounts previously recorded as an adjustment to the hedged item, brokered certificates of deposit, was recognized as a loss on derivative financial instruments in the consolidated statements of income and comprehensive income for the year ended September 30, 2005.
In addition, the net cash settlements under the interest rate swaps that were originally reported in interest expense have been reclassified to loss on derivative instruments. Finally, the broker placement fees on the certificates of deposit have been recorded as an asset and are being amortized on a straight-line basis to the maturity of the certificates of deposit.
The Company has restated its consolidated financial statements to reflect these changes for the quarters ended December 31, 2004, March 31, 2005 and June 30, 2005, and has reflected the impact of these adjustments on the previously reported quarterly results below.
The Company has also restated basic earnings per share for the quarterly periods in fiscal 2004 and the quarters ended December 31, 2004, March 31, 2005 and June 30, 2005 to reflect equity trust shares in treasury stock as not outstanding for the calculation of basic earnings per share.
- 70 -
| | | | | | | | | |
| | | 2005
As Restated
|
| | | First
Quarter
| | Second
Quarter
| | Third
Quarter
|
Interest income | | $ | 8,206 | | $ | 8,755 | | $ | 9,769 |
Interest expense | | | 3,183 | | | 3,555 | | | 4,504 |
Net interest income | | | 5,023 | | | 5,200 | | | 5,265 |
Provision for loan losses | | | 349 | | | 118 | | | 529 |
Net interest income after loan loss provision | | | 4,673 | | | 5,082 | | | 4,735 |
Non-interest income | | | 2,345 | | | 2,585 | | | 2,821 |
Non-interest expense | | | 3,944 | | | 5,169 | | | 3,762 |
Income before taxes | | | 3,075 | | | 2,498 | | | 3,795 |
Income taxes | | | 1,183 | | | 915 | | | 1,395 |
Net income | | | 1,892 | | | 1,583 | | | 2,400 |
Earnings per share - basic | | | 0.24 | | | 0.20 | | | 0.30 |
Earnings per share - diluted | | | 0.22 | | | 0.18 | | | 0.27 |
Weighted average shares outstanding - basic | | | 7,824 | | | 7,934 | | | 7,960 |
Weighted average shares outstanding - diluted | | | 8,736 | | | 8,814 | | | 8,875 |
| | | | | | | | | | | | |
| | | 2005
As Reported
|
| | | First
Quarter
| | Second
Quarter
| | Third
Quarter
| | Fourth
Quarter
|
Interest income | | $ | 8,206 | | $ | 8,755 | | $ | 9,769 | | $ | 11,062 |
Interest expense | | | 3,120 | | | 3,387 | | | 4,340 | | | 5,448 |
Net interest income | | | 5,086 | | | 5,368 | | | 5,429 | | | 5,614 |
Provision for loan losses | | | 349 | | | 118 | | | 529 | | | 639 |
Net interest income after loan loss provision | | | 4,737 | | | 5,251 | | | 4,900 | | | 4,976 |
Non-interest income | | | 2,345 | | | 2,585 | | | 2,821 | | | 3,192 |
Non-interest expense | | | 3,980 | | | 4,664 | | | 4,636 | | | 5,638 |
Income before taxes | | | 3,103 | | | 3,172 | | | 3,085 | | | 2,529 |
Income taxes | | | 1,193 | | | 1,165 | | | 1,132 | | | 925 |
Net income | | | 1,910 | | | 2,007 | | | 1,953 | | | 1,604 |
Earnings per share - basic | | | 0.23 | | | 0.24 | | | 0.23 | | | 0.20 |
Earnings per share - diluted | | | 0.21 | | | 0.23 | | | 0.22 | | | 0.18 |
Weighted average shares outstanding - basic | | | 8,199 | | | 8,334 | | | 8,370 | | | 7,985 |
Weighted average shares outstanding - diluted | | | 8,736 | | | 8,814 | | | 8,875 | | | 8,889 |
- 71 -
The results of operations by quarter for 2004 were as follows:
| | | | | | | | | | | | |
| | | First
Quarter
| | Second
Quarter
| | Third
Quarter
| | Fourth
Quarter
|
September 30, 2004 | | | | | | | | | | | | |
Interest income | | $ | 5,093,597 | | $ | 5,177,388 | | $ | 6,306,407 | | $ | 7,250,460 |
Interest expense | | | 1,625,525 | | | 1,642,957 | | | 2,073,292 | | | 2,464,231 |
Net interest income | | | 3,468,072 | | | 3,534,431 | | | 4,233,115 | | | 4,786,229 |
Provision for loan losses | | | 263,515 | | | 316,260 | | | 649,965 | | | 704,358 |
Net interest income after loan loss provision | | | 3,204,557 | | | 3,218,171 | | | 3,583,150 | | | 4,081,871 |
Non-interest income | | | 2,205,510 | | | 2,173,068 | | | 2,282,204 | | | 2,303,219 |
Non-interest expense | | | 3,169,556 | | | 3,144,255 | | | 3,525,235 | | | 3,875,411 |
Income before taxes | | | 2,240,511 | | | 2,246,984 | | | 2,340,119 | | | 2,509,679 |
Income taxes | | | 836,507 | | | 818,986 | | | 882,985 | | | 947,106 |
Net income | | | 1,404,004 | | | 1,427,998 | | | 1,457,134 | | | 1,562,573 |
Earnings per share - basic as revised | | | 0.18 | | | 0.18 | | | 0.19 | | | 0.20 |
Earnings per share - diluted | | | 0.16 | | | 0.17 | | | 0.17 | | | 0.18 |
Weighted average shares outstanding - basic as revised | | | 7,729,773 | | | 7,730,513 | | | 7,761,912 | | | 7,810,080 |
Weighted average shares outstanding - diluted | | | 8,666,153 | | | 8,735,520 | | | 8,686,767 | | | 8,691,923 |
Earnings per share - basic as previously reported | | | 0.17 | | | 0.18 | | | 0.18 | | | 0.19 |
Weighted average shares outstanding-basic as previously reported | | | 8,055,141 | | | 8,064,611 | | | 8,105,162 | | | 8,158,980 |
- 72 -
| 24. | CONDENSED PARENT COMPANY ONLY FINANCIAL STATEMENTS. |
The following table presents the condensed balance sheets as of September 30, 2005 and 2004, and the condensed statements of income and cash flows of the Company for the years ended September 30, 2005, 2004 and 2003:
| | | | | | |
| | | 2005
| | 2004
|
Condensed Balance Sheets | | | | | | |
ASSETS: | | | | | | |
Cash and cash equivalents | | $ | 175,105 | | $ | 385,546 |
Investment in Bank | | | 68,075,077 | | | 52,193,426 |
Investments and mortgage-backed securities | | | 2,209,789 | | | 1,813,738 |
Intercompany loan | | | 1,225,000 | | | — |
Other assets | | | 474,085 | | | 223,098 |
| | |
|
| |
|
|
TOTAL ASSETS | | $ | 72,159,056 | | $ | 54,615,808 |
| | |
|
| |
|
|
LIABILITIES: | | | | | | |
Note payable | | $ | 3,575,000 | | $ | 3,830,000 |
Subordinated debentures | | | 19,589,000 | | | 9,279,000 |
Dividends payable | | | 675,133 | | | 493,649 |
Other liabilities | | | 73,459 | | | 39,588 |
| | |
|
| |
|
|
TOTAL LIABILITIES | | | 23,912,592 | | | 13,642,237 |
| | |
|
| |
|
|
STOCKHOLDERS’ EQUITY | | | 48,246,464 | | | 40,973,571 |
| | |
|
| |
|
|
TOTAL LIABILITIES & STOCKHOLDERS’ EQUITY | | $ | 72,159,056 | | $ | 54,615,808 |
| | |
|
| |
|
|
| | | | | | | | | | | | |
| | | 2005
| | | 2004
| | | 2003
| |
Condensed Statements of Income | | | | | | | | | | | | |
INTEREST INCOME | | $ | 84,079 | | | $ | 53,598 | | | $ | 107,217 | |
INTEREST EXPENSE | | | 1,100,708 | | | | 259,203 | | | | 10,333 | |
| | |
|
|
| |
|
|
| |
|
|
|
NET INTEREST INCOME | | | (1,016,629 | ) | | | (205,605 | ) | | | 96,884 | |
NON-INTEREST INCOME | | | 105,974 | | | | 761,530 | | | | 135,423 | |
NON-INTEREST EXPENSE | | | 465,229 | | | | 328,675 | | | | 337,548 | |
| | |
|
|
| |
|
|
| |
|
|
|
(Loss) income before income taxes and equity in earnings of Bank | | | (1,375,884 | ) | | | 227,250 | | | | (105,241 | ) |
INCOME TAX (BENEFIT) PROVISION | | | (524,418 | ) | | | 86,284 | | | | (39,531 | ) |
| | |
|
|
| |
|
|
| |
|
|
|
Net (loss) income before equity in earnings of Bank | | | (851,466 | ) | | | 140,966 | | | | (65,710 | ) |
EQUITY IN EARNINGS OF BANK | | | 8,330,364 | | | | 5,710,689 | | | | 5,833,811 | |
| | |
|
|
| |
|
|
| |
|
|
|
NET INCOME | | $ | 7,478,898 | | | $ | 5,851,655 | | | $ | 5,768,101 | |
| | |
|
|
| |
|
|
| |
|
|
|
- 73 -
| | | | | | | | | | | | |
| | | 2005
| | | 2004
| | | 2003
| |
Condensed Statements of Cash Flows | | | | | | | | | | | | |
CASH FLOWS FROM OPERATING ACTIVITIES: | | | | | | | | | | | | |
Net income | | $ | 7,478,898 | | | $ | 5,851,655 | | | $ | 5,768,101 | |
Adjustments to reconcile net income to net cash from operating activities: | | | | | | | | | | | | |
Equity in earnings of Bank | | | (8,330,364 | ) | | | (5,710,689 | ) | | | (5,833,811 | ) |
Net change in other assets and liabilities | | | 87,482 | | | | (4,973 | ) | | | 1,205,452 | |
Realized gain on sale of investments | | | — | | | | (736,083 | ) | | | (73,819 | ) |
| | |
|
|
| |
|
|
| |
|
|
|
Net cash (used in) provided by operating activities | | | (763,984 | ) | | | (600,090 | ) | | | 1,065,923 | |
| | |
|
|
| |
|
|
| |
|
|
|
CASH FLOWS FROM INVESTING ACTIVITIES: | | | | | | | | | | | | |
Cash paid for 50% interest in joint venture | | | (133,810 | ) | | | — | | | | — | |
Dividends received from Bank | | | 2,500,000 | | | | — | | | | — | |
Capital contribution to subsidiary | | | (9,000,000 | ) | | | (12,000,000 | ) | | | — | |
(Increase) decrease in intercompany loan | | | (1,225,000 | ) | | | 500,000 | | | | 1,500,000 | |
Purchases of investments | | | (410,000 | ) | | | (1,323,230 | ) | | | (473,301 | ) |
Proceeds from sales of investments | | | — | | | | 2,163,231 | | | | 552,209 | |
Principal payments on mortgage-backed securities | | | 42,098 | | | | 99,817 | | | | 301,322 | |
| | |
|
|
| |
|
|
| |
|
|
|
Net cash (used in) provided by investing activities | | | (8,226,712 | ) | | | (10,560,182 | ) | | | 1,880,230 | |
| | |
|
|
| |
|
|
| |
|
|
|
CASH FLOWS FROM FINANCING ACTIVITIES: | | | | | | | | | | | | |
Proceeds from note payable | | | — | | | | 4,000,000 | | | | — | |
Proceeds from issuance of subordinated debentures | | | 10,310,000 | | | | 9,279,000 | | | | — | |
Payment of note payable | | | (255,000 | ) | | | (170,000 | ) | | | — | |
Payments received from loan to ESOP | | | 183,773 | | | | 116,380 | | | | 364,740 | |
Payment from subsidiary related to restricted shares | | | 89,634 | | | | 199,180 | | | | 175,693 | |
Stock options exercised | | | 974,033 | | | | 807,883 | | | | 631,260 | |
Non-cash compensation expense for stock option grants | | | 3,923 | | | | — | | | | — | |
Stock repurchase | | | (190,194 | ) | | | (1,566,798 | ) | | | (2,745,366 | ) |
Dividends paid on common stock | | | (2,335,914 | ) | | | (1,619,293 | ) | | | (1,073,863 | ) |
| | |
|
|
| |
|
|
| |
|
|
|
Net cash provided by (used in) financing activities | | | 8,780,255 | | | | 11,046,352 | | | | (2,647,536 | ) |
| | |
|
|
| |
|
|
| |
|
|
|
NET (DECREASE) INCREASE IN CASH AND CASH EQUIVALENTS | | | (210,441 | ) | | | (113,920 | ) | | | 298,617 | |
CASH AND CASH EQUIVALENTS AT BEGINNING OF YEAR | | | 385,546 | | | | 499,466 | | | | 200,849 | |
| | |
|
|
| |
|
|
| |
|
|
|
CASH AND CASH EQUIVALENTS AT END OF YEAR | | $ | 175,105 | | | $ | 385,546 | | | $ | 499,466 | |
| | |
|
|
| |
|
|
| |
|
|
|
* * * * *
- 74 -
Acquisition of CWE Bancorp. On October 25, 2005, the Company entered into an Agreement and Plan of Merger with CWE Bancorp, Inc. pursuant to which the Company will acquire CWE Bancorp and its wholly owned subsidiary, Central West End Bank, A Federal Saving Bank. Central West End Bank operates two full-service banking offices in St. Louis, Missouri. At September 30, 2005, CWE Bancorp had total assets of $46.2 million, deposits of $40.6 million and stockholders’ equity of $4.5 million. The Company will issue approximately 214,000 shares of its common stock and pay approximately $3.6 million in cash to the stockholders of CWE Bancorp subject to possible adjustments. The transaction is expected to be completed in the first calendar quarter of 2006, pending approval by the stockholders of CWE Bancorp, regulatory approval and other customary conditions of closing.
Kansas City Branch Sale. On October 7, 2005, the Bank entered into a purchase and assumption agreement pursuant to which it will sell its Kansas City, Missouri branch office to UMB Bank. The transaction is expected to close during the first calendar quarter of 2006. As of September 30, 2005, the deposits to be assumed by UMB Bank totaled approximately $25.4 million. No loans will be transferred in connection with the branch sale. The Company expects to recognize a gain of approximately $2.8 million in connection with the transaction.
- 75 -
COMMON STOCK INFORMATION
The common stock of the Company is listed on the National Market under the symbol “PULB.” As of December 5, 2005, there were approximately 2,568 stockholders of record of the Company, including brokers or other nominees.
The following table sets forth market price and dividend information for the Company’s common stock for fiscal year 2005 and 2004. Stock prices and dividends per share for the 2004 fiscal year have been restated to reflect the three-for-two split of the Company’s common stock on July 18, 2005.
| | | | | | | | | |
Fiscal 2005
| | High
| | Low
| | Dividend
|
First Quarter | | $ | 13.80 | | $ | 11.23 | | $ | .06/per share |
Second Quarter | | $ | 14.23 | | $ | 12.50 | | $ | .06/per share |
Third Quarter | | $ | 18.67 | | $ | 12.67 | | $ | .08/per share |
Fourth Quarter | | $ | 18.74 | | $ | 16.03 | | $ | .08/per share |
| | | |
Fiscal 2004
| | High
| | Low
| | Dividend
|
First Quarter | | $ | 11.33 | | $ | 9.77 | | $ | .04/per share |
Second Quarter | | $ | 13.63 | | $ | 11.09 | | $ | .04/per share |
Third Quarter | | $ | 12.67 | | $ | 9.60 | | $ | .06/per share |
Fourth Quarter | | $ | 13.05 | | $ | 11.32 | | $ | .06/per share |
- 76 -
DIRECTORSAND OFFICERS
Directors
William A. Donius
Chairman and Chief Executive Officer
E. Douglas Britt
Retired Thrift Executive
William M. Corrigan, Jr.
Partner, Armstrong, Teasdale LLP
Robert A. Ebel
Chairman of the Board of Universal Printing Co.
Leon A. Felman
Managing Partner of Felman Family Partnership LP
Timothy K. Reeves
President of Keenan Properties of St. Louis
Christopher K. Reichert
Executive Vice President
Lee S. Wielansky
Chairman and Chief Executive Officer of Midland Development Group, Inc.
Emeritus Directors
Walter A. Donius
Chairman Emeritus and Retired Thrift Executive
Thomas F. Hack
Retired Thrift Executive
Edward J. Howenstein
Retired Dentist
Officers
William A. Donius
Chairman and Chief Executive Officer
Ramsey K. Hamadi
Chief Financial Officer
Christopher K. Reichert
Executive Vice President
- 77 -
CORPORATE INFORMATION
Corporate Headquarters
12300 Olive Boulevard
St. Louis, Missouri
Independent Auditors
KPMG LLP
St. Louis, Missouri
General Counsel
Kappel, Neill and Wolff LLC
St. Louis, Missouri
Armstrong, Teasdale LLP
St. Louis, Missouri
Special Securities Counsel
Muldoon Murphy & Aggugia LLP
Washington, D.C.
Stock Transfer Agent
Registrar and Transfer Company
Cranford, New Jersey
Investor Relations
The Investor Relations Company
Des Plaines, Illinois
ANNUAL MEETING
The annual meeting of the stockholders will be held Thursday, January 26, 2006 at 2:00 p.m., Central Time, at The St. Louis Art Museum (rear entrance), 1 Fine Arts Boulevard, Forest Park, St. Louis, Missouri.
- 78 -