Exhibit 13.1
| | |
| | Pulaski Financial Corp. |
| | 2007 Annual Report |
BUSINESSOFTHE COMPANY
We are a diversified, community-based, financial institution holding company headquartered in St. Louis, Missouri. We conduct operations primarily through Pulaski Bank, a federally chartered savings bank. Pulaski Bank provides an array of financial products and services for businesses and consumers primarily through its twelve full-service offices in the St. Louis metropolitan area and three loan production offices in Kansas City and the Illinois portion of the St. Louis metroplex.
We have grown our assets and deposits internally by building our residential and commercial lending operations, by opening de novo branches, and by hiring experienced bankers with existing customer relationships in our market. Although we intend to expand primarily through internal growth, we may also make strategic acquisitions. During 2006, we purchased another financial institution and we will continue to explore such opportunities to expand through acquisitions of other banks and bank branches. We recently opened our twelfth full-service bank location in the St. Louis metropolitan area in October 2007. Our goal is to continue to deliver value to our shareholders and to enhance our franchise value and earnings through controlled growth in our banking operations, while maintaining the personal, community-oriented customer service that has characterized our success to date.
- 1 -
SELECTED CONSOLIDATED FINANCIAL INFORMATION
| | | | | | | | | | | | | | | |
| | | At or For the Years Ended September 30, |
| | | 2007 | | 2006 | | 2005 | | 2004 | | 2003 |
| | | (In thousands, except per share amounts) |
FINANCIAL CONDITION DATA | | | | | | | | | | | | | | | |
Total assets | | $ | 1,131,465 | | $ | 962,467 | | $ | 789,861 | | $ | 637,886 | | $ | 401,403 |
Loans receivable, net | | | 949,826 | | | 785,199 | | | 633,195 | | | 510,584 | | | 276,894 |
Loans receivable held for sale | | | 58,536 | | | 60,452 | | | 64,335 | | | 49,152 | | | 61,124 |
Debt and equity securities | | | 16,988 | | | 17,449 | | | 10,228 | | | 12,986 | | | 6,432 |
Capital stock of Federal Home Loan Bank | | | 8,306 | | | 9,524 | | | 8,462 | | | 7,538 | | | 3,880 |
Mortgage-backed securities | | | 3,027 | | | 3,631 | | | 4,833 | | | 6,574 | | | 8,862 |
Assets held for sale | | | — | | | — | | | 1,017 | | | — | | | — |
Cash and cash equivalents | | | 23,675 | | | 22,123 | | | 25,688 | | | 20,296 | | | 18,656 |
Deposits | | | 835,489 | | | 655,577 | | | 496,171 | | | 406,799 | | | 313,607 |
Deposit liabilities held for sale | | | — | | | — | | | 25,375 | | | — | | | — |
Advances from Federal Home Loan Bank | | | 158,400 | | | 172,800 | | | 171,000 | | | 154,600 | | | 31,500 |
Subordinated debentures | | | 19,589 | | | 19,589 | | | 19,589 | | | 9,279 | | | — |
Stockholders’ equity | | | 80,804 | | | 75,827 | | | 48,246 | | | 40,974 | | | 36,383 |
OPERATING DATA | | | | | | | | | | | | | | | |
Interest income | | $ | 70,811 | | $ | 53,843 | | $ | 37,792 | | $ | 23,832 | | $ | 21,426 |
Interest expense | | | 41,834 | | | 29,027 | | | 16,732 | | | 7,806 | | | 7,739 |
| | | | | | | | | | | | | | | |
Net interest income | | | 28,977 | | | 24,816 | | | 21,060 | | | 16,026 | | | 13,687 |
Provision for loan losses | | | 3,855 | | | 1,501 | | | 1,635 | | | 1,934 | | | 1,487 |
| | | | | | | | | | | | | | | |
Net interest income after provision for loan losses | | | 25,122 | | | 23,315 | | | 19,425 | | | 14,092 | | | 12,200 |
Non-interest income | | | 12,811 | | | 13,549 | | | 10,878 | | | 8,960 | | | 11,405 |
Non-interest expense | | | 24,449 | | | 21,601 | | | 18,406 | | | 13,715 | | | 13,977 |
| | | | | | | | | | | | | | | |
Income before income taxes | | | 13,484 | | | 15,263 | | | 11,897 | | | 9,337 | | | 9,628 |
Income taxes | | | 4,501 | | | 5,425 | | | 4,418 | | | 3,485 | | | 3,860 |
| | | | | | | | | | | | | | | |
Net income | | $ | 8,983 | | $ | 9,838 | | $ | 7,479 | | $ | 5,852 | | $ | 5,768 |
| | | | | | | | | | | | | | | |
COMMON SHARE DATA(1) | | | | | | | | | | | | | | | |
Basic earnings per share | | $ | 0.92 | | $ | 1.07 | | $ | 0.94 | | $ | 0.75 | | $ | 0.74 |
Diluted earnings per share | | $ | 0.88 | | $ | 1.01 | | $ | 0.85 | | $ | 0.67 | | $ | 0.67 |
Dividends declared per share | | $ | 0.35 | | $ | 0.33 | | $ | 0.28 | | $ | 0.20 | | $ | 0.14 |
Book value per share | | $ | 8.13 | | $ | 7.62 | | $ | 5.72 | | $ | 4.98 | | $ | 4.47 |
Weighted average shares - basic | | | 9,814 | | | 9,206 | | | 7,926 | | | 7,758 | | | 7,843 |
Weighted average shares - diluted | | | 10,256 | | | 9,718 | | | 8,828 | | | 8,695 | | | 8,578 |
Shares outstanding-end of period | | | 9,935 | | | 9,946 | | | 8,439 | | | 8,227 | | | 8,146 |
(1) | Reflects a three-for-two stock split in July 2005 and a two-for-one stock split in July 2003. |
- 2 -
| | | | | | | | | | | | | | | |
| | | At or For the Year Ended September 30, | |
| | | 2007 | | | 2006 | | | 2005 | | | 2004 | | | 2003 | |
KEY OPERATING RATIOS | | | | | | | | | | | | | | | |
Return on average assets | | 0.85 | % | | 1.14 | % | | 1.06 | % | | 1.18 | % | | 1.38 | % |
Return on average equity | | 11.07 | | | 14.98 | | | 16.37 | | | 15.31 | | | 16.35 | |
Average equity to average assets | | 7.70 | | | 7.62 | | | 6.45 | | | 7.68 | | | 8.43 | |
Interest rate spread | | 2.63 | | | 2.87 | | | 3.04 | | | 3.38 | | | 3.30 | |
Net interest margin | | 2.97 | | | 3.12 | | | 3.18 | | | 3.48 | | | 3.47 | |
Efficiency ratio | | 60.30 | | | 59.85 | | | 56.67 | | | 56.56 | | | 55.87 | |
Dividend payout ratio | | 39.20 | | | 32.67 | | | 32.94 | | | 29.70 | | | 20.79 | |
Non-interest expense to average assets | | 2.38 | | | 2.48 | | | 2.56 | | | 2.76 | | | 3.34 | |
Average interest-earning assets to average interest-bearing liabilities | | 107.79 | | | 106.96 | | | 105.59 | | | 105.85 | | | 108.95 | |
Allowance for loan losses to total loans at end of period | | 1.02 | | | 0.92 | | | 0.95 | | | 0.99 | | | 1.13 | |
Allowance for loan losses to nonperforming loans | | 99.44 | | | 115.89 | | | 112.07 | | | 130.64 | | | 91.31 | |
Net charge-offs to average outstanding loans during the period | | 0.13 | | | 0.09 | | | 0.06 | | | 0.05 | | | 0.05 | |
Nonperforming assets to total assets | | 1.20 | | | 0.99 | | | 0.86 | | | 0.84 | | | 1.07 | |
OTHER DATA | | | | | | | | | | | | | | | |
Number of: | | | | | | | | | | | | | | | |
Real estate loans outstanding | | 6,149 | | | 5,609 | | | 4,059 | | | 3,619 | | | 2,651 | |
Consumer loans (includes home equity loans) | | 10,062 | | | 9,821 | | | 9,520 | | | 8,318 | | | 6,336 | |
Deposit accounts | | 40,307 | | | 36,443 | | | 33,010 | | | 30,390 | | | 29,344 | |
Number full-time equivalent employees | | 421 | | | 361 | | | 327 | | | 258 | | | 239 | |
Full service offices(1) | | 11 | | | 9 | | | 8 | | | 7 | | | 7 | |
CAPITAL RATIOS(2) | | | | | | | | | | | | | | | |
Tangible capital | | 8.79 | % | | 9.30 | % | | 8.60 | % | | 8.14 | % | | 8.18 | % |
Core capital | | 8.79 | | | 9.30 | | | 8.60 | | | 8.14 | | | 8.18 | |
Total risk-based capital | | 11.18 | | | 11.99 | | | 10.85 | | | 11.46 | | | 11.73 | |
(1) | Pulaski Bank opened its twelfth full-service office in Clayton, Missouri in October 2007. |
(2) | Capital ratios are for Pulaski Bank. |
- 3 -
MANAGEMENT’S DISCUSSIONAND ANALYSISOF
FINANCIAL CONDITIONAND RESULTSOF OPERATIONS
GENERAL
Management’s discussion and analysis of financial condition and results of operations is intended to assist in understanding our financial condition and results of operations. The information contained in this section should be read in conjunction with the consolidated financial statements and accompanying notes contained elsewhere in this annual report.
This report may contain certain “forward-looking statements” within the meaning of the federal securities laws, which are made in good faith pursuant to the “safe harbor” provisions of the Private Securities Litigation Reform Act of 1995. These statements are not historical facts; rather, they are statements based on management’s current expectations regarding our business strategies, intended results and future performance. Forward-looking statements are generally preceded by terms such as “expects,” “believes,” “anticipates,” “intends” and similar expressions.
Management’s ability to predict results or the effect of future plans or strategies is inherently uncertain. Factors that could affect actual results include interest-rate trends, the general economic climate in the market area in which we operate, as well as nationwide, our ability to control costs and expenses, competitive products and pricing offered by competitors, loan delinquency rates, demand for loans and deposits, changes in the quality or composition of our loan portfolio, changes in accounting principles and changes in federal and state legislation and regulation. Additional factors that may affect our results are discussed in the section titled “Risk Factors” in our annual report on Form 10-K and in other reports filed with the Securities and Exchange Commission. These factors should be considered in evaluating the forward-looking statements and undue reliance should not be placed on such statements. We assume no obligation to update any forward-looking statements.
PULASKI’S EVOLUTIONINTOA ST. LOUIS-BASED COMMUNITY BANK
Since its founding in 1922 as a mutual thrift serving the Polish community of St. Louis, Pulaski Bank (the “Bank”) has grown into a full-service community bank, with twelve bank locations in metropolitan St. Louis, catering to both individuals and businesses and has become one of the largest residential lenders in St. Louis and Kansas City. William A. Donius, grandson of the Bank’s principal founder, Michael Burdzy, assumed the role of Chairman and CEO in 1997 with a vision of growth and fiscal responsibility. Shortly thereafter, in 1998, Pulaski Financial Corp. (the “Company”) was formed as the holding company of the Bank to access capital through a public common stock offering. At that time, the Bank’s total assets were approximately $200 million. The initial offering raised $26 million in new capital, which doubled the Bank’s existing capital and provided an opportunity for expansion.
The board and management established a strategic plan to become a high-performing, $1 billion to $2 billion community bank by the year 2010. Under the plan, internal growth would be generated by building the Company’s residential and commercial lending operations, by opening de novo branches in key areas of the Company’s market and by hiring experienced bankers with existing in-market customer relationships. Growth could also come, to a much lesser extent, through strategic acquisitions. Crucial to this plan was growth in five key products: commercial, residential and home equity loans and checking and money market deposit accounts.
- 4 -
The Company reached a significant milestone during fiscal 2007 when total assets exceeded $1 billion. During the five years ended September 30, 2007, total assets grew at an average rate of 31%, totaling $1.1 billion at September 30, 2007. The Company also saw strong earnings growth during this five-year period, with an average return on equity of 14.8% and an increase in diluted earnings per share of 31%. The Company continues to experience strong organic growth and expects to reach $1.5 billion in total assets by the year 2010.
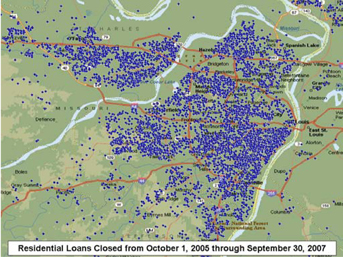
Today, Pulaski Bank has more than 85 residential and commercial lenders who are lending in every community and touching nearly every neighborhood in St. Louis and Kansas City. In the last two fiscal years, the Bank originated more than 24,000 residential mortgage and home equity loans, totaling nearly $2.2 billion in the St. Louis metropolitan area, and originated another $970.4 million in the Kansas City metropolitan area, making it one of the largest residential lenders in each of these two markets. The Company has also supported local businesses with $648.3 million of commercial loan originations during fiscal 2006 and 2007.

Growth in core deposits, consisting of checking and money market accounts, is critical to support profitable asset growth and is the Company’s top strategic objective. The Company’s approach to attracting deposits involves three key components: provide excellence in customer service, offer customers best-in-class products, and provide customers with convenient banking locations. This approach resulted in $185.4 million of growth in core deposits since September 30, 2003. This strategy has also enabled the Company to increase its share of the $51.5 billion St. Louis deposit market from 0.65% at September 30, 2003 to 1.66% at September 30, 2007.

Supporting the strong asset and deposit growth are the Company’s commercial banking operations, which began in 2003. The Company has been successful in hiring some of the top commercial bankers in St. Louis and, primarily as a result of commercial relationships, checking account balances have grown 226% from $35.2 million at September 30, 2003 to $114.8 million at September 30, 2007. In addition, commercial loans have accounted for 56% of the Company’s loan portfolio growth since 2003.
- 5 -
Growth in commercial banking relationships is essential for the Company’s continued growth in the St. Louis market and the Company’s prospects will be enhanced by its increased presence in the St. Louis business community. As a thrift, Pulaski historically focused on banking locations which served retail customers. While developing the Company’s strategic plan, management determined it was essential to enhance the convenience of the Company’s bank locations in the St. Louis commercial districts. At September 30, 2003, the Bank had seven full-service locations, with only the main location in Creve Coeur positioned to serve small- to medium-sized business customers. Since 2005, the Bank has opened or acquired six new full-service locations, including the Clayton, Missouri office in October 2007, all of which are convenient to the metropolitan St. Louis commercial and financial centers. Since September 2003, the Company has nearly doubled its investment in premises and equipment, totaling $20.4 million at September 30, 2007 compared to $10.3 million at September 30, 2003.
De novo bank locations typically operate at a loss for a period after startup, reducing earnings. However, the new locations have proven successful in growing deposits from the start, with 83% of the Company’s $267.7 million of non-brokered deposit growth during the three years ended September 30, 2007 occurring in the bank locations located in the St. Louis “Central Corridor.” This expanded footprint in key commercial areas of metropolitan St. Louis has poised the Company to achieve its growth expectations.
ST. LOUIS DEMOGRAPHICS
St. Louis MSA Banks & Thrifts
| | | | | | | | | | | | |
Rank | | Company Name | | Charter | | Number of
Branches | | June 2007
Deposits | | Pct of
Total | |
1 | | U.S. Bank | | Bank | | 115 | | $ | 8,179,802 | | 15.89 | % |
2 | | Bank of America | | Bank | | 61 | | | 6,651,269 | | 12.92 | % |
3 | | Commerce Bank | | Bank | | 53 | | | 3,925,253 | | 7.62 | % |
4 | | Regions Bank | | Bank | | 73 | | | 2,879,168 | | 5.59 | % |
5 | | Southwest Bank | | Bank | | 19 | | | 3,804,720 | | 5.45 | % |
6 | | First Banks, Inc. | | Bank | | 57 | | | 2,254,163 | | 4.38 | % |
7 | | National City Bank | | Bank | | 61 | | | 1,935,465 | | 3.76 | % |
8 | | Enterprise Bank & Trust | | Bank | | 4 | | | 1,033,470 | | 2.01 | % |
9 | | Bank of Edwardsville | | Bank | | 16 | | | 914,049 | | 1.78 | % |
10 | | UMB Bank | | Bank | | 25 | | | 884,623 | | 1.72 | % |
11 | | First National Bank | | Bank | | 12 | | | 878,506 | | 1.71 | % |
12 | | Pulaski Bank | | Thrift | | 10 | | | 852,475 | | 1.66 | % |
13 | | Reliance Bank | | Bank | | 18 | | | 754,046 | | 1.46 | % |
14 | | Heartland Bank | | Thrift | | 12 | | | 703,476 | | 1.37 | % |
| | Institutions Ranked 15 - 140 | | | | 384 | | | 16,834,372 | | 32.20 | % |
Source: FDIC | | Total | | 920 | | $ | 52,484,857 | | 100 | % |
St. Louis is the eighteenth largest metropolitan area in the United States, with a population of 2.8 million and an average household income of $48,716, which is 5% higher than the national average. Ranked according to total deposits as reported by the FDIC, Pulaski Bank is the twelfth largest bank in the St. Louis metropolitan area and, with only 1.66% of the area’s $51.5 billion in deposits, has significant growth potential. The St. Louis economy is stable and diverse with its largest sector, healthcare, employing 20% of the workforce, and manufacturing employing 11% of the workforce.
The St. Louis market has experienced heavy consolidation in the banking sector during the last ten years, with more than $94 billion in deposits acquired by regional and national banks. While this activity has generated significant opportunities for Pulaski, it has also promoted an environment of rapid growth in market competition among smaller community banks.
St. Louis MSA Mergers and Acquisitions
| | | | | | | | | |
| | | Announcement
Date | | Acquiror | | Target | | Assets ($000s) |
1 | | 12/21/05 | | Marshall & Ilsley Corp. | | Trustcorp Financial Corp. | | $ | 705,359 |
2 | | 12/21/05 | | National City Corp. | | Forbes First Financial Corp. | | | 505,229 |
3 | | 10/25/05 | | Pulaski Financial Corp. | | CWE Bancorp, Inc. | | | 45,458 |
4 | | 04/09/04 | | National City Corp. | | Allegiant Bancorp Inc. | | | 2,458,878 |
5 | | 10/01/02 | | Marshall & Ilsley Corp. | | Mississippi Valley Bancshares | | | 2,042,192 |
6 | | 09/28/01 | | Allegiant Bancorp Inc. | | Southside Bancshares Corp. | | | 737,427 |
7 | | 03/01/01 | | Commerce Bancshares Inc. | | Breckenridge Bancshares Co. | | | 255,186 |
8 | | 11/15/00 | | Allegiant Bancorp Inc. | | Equality Bancorp Inc. | | | 323,335 |
9 | | 09/22/00 | | G.A.C. Inc. | | Gateway NB of St. Louis | | | 33,873 |
10 | | 05/10/00 | | Maries County Bancorp., Inc. | | Tritten Bancshares, Inc. | | | 44,705 |
11 | | 09/20/99 | | Firstar Corp. | | Mercantile Bancorp. | | | 35,578,819 |
12 | | 01/04/99 | | Liberty Bancshares Inc. | | Sac River Valley Bank | | | 99,917 |
13 | | 09/10/98 | | First Illinois Bancorp, Inc. | | Duchesne Bank | | | 107,152 |
14 | | 07/01/98 | | Union Planters Corp. | | Magna Group Inc. | | | 7,074,969 |
15 | | 06/30/98 | | Southside Bancshares Corp. | | Public Srvc. Bk, A Fed Svgs Bk | | | 70,482 |
16 | | 08/29/97 | | Allegiant Bancorp Inc. | | Reliance Financial Inc. | | | 31,705 |
17 | | 07/01/97 | | Trustcorp Inc. | | Missouri State B&TC | | | 88,866 |
18 | | 04/25/97 | | Mercantile Bancorp. | | Mark Twain Bancshares Inc. | | | 3,147,933 |
19 | | 01/07/97 | | NationsBank Corp. | | Boatman’s Bancshares Inc. | | | 40,682,558 |
Source: SNL Securities, LC | | TOTAL | | $ | 94,034,043 |
In the last three years, 25 de novo banks have entered the St. Louis market. During this same period, total deposits in banks smaller than Pulaski Bank increased $5.2 billion to $18.3 billion at June 30, 2007 from $13.1 billion at June 30, 2004. Locally-based community banks, like Pulaski, have gained market share by recruiting experienced bankers who have been displaced by mergers with larger, out-of-area banks. These bankers have generally developed strong relationships with customers who are willing to follow them to another financial institution. In addition, St. Louisans strongly favor doing business with companies that are locally-managed, creating opportunities for Pulaski.
- 6 -
EXECUTIONOFTHE STRATEGIC PLAN PRODUCED STRONG GROWTHIN KEY INDICATORS
Net income declined 8.7% in fiscal 2007 compared to 2006 primarily due to a $2.4 million increase in the provision for loan losses in 2007 and the absence of a $2.5 million gain on the sale of the Company’s only full-service Kansas City bank location that was included in the Company’s results of operations in 2006. SeeComparison of Operating Results from 2007 and 2006. However, execution of the Company’s strategic plan has produced strong, consistent performance in many of its key indicators, such as growth in net interest income, total assets, loans and deposits, thereby positioning the Company for improved earnings in future periods. Specifically, from 2003 to 2007, we have:

| | • | | Increased our net interest income from $13.7 million to $29.0 million, representing a 21% compound annual growth rate (“CAGR”). |
| | • | | Increased our total assets from $401.4 million to $1.1 billion, representing a 29% CAGR. |
| | • | | Increased our total loan portfolio from $276.9 million to $949.8 million, representing a 36% CAGR. |
| | • | | Increased our total deposits from $313.6 million to $835.5 million, representing a 28% CAGR. |
| | • | | Reduced our ratio of non-interest expense to average assets from 3.34% to 2.38%. |
| | • | | Expanded the number of residential and commercial loan officers from 18 to more than 85. |
| | • | | Expanded our St. Louis bank network from seven to eleven full-service locations. We opened our twelfth full-service location in October 2007. |
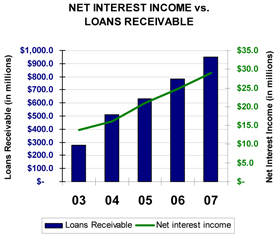
Over the last several years, the Company’s earnings have become progressively less dependent on non-interest income sources as the loan portfolio has expanded, resulting in higher interest income and ultimately higher net interest income. Net interest income increased to $29.0 million for the year ended September 30, 2007 compared to $13.7 million for the year ended September 30, 2003. Driven by growth in our commercial and residential portfolios, loans receivable increased 243% over the last four years, from $276.9 million at September 30, 2003 to $949.8 million at September 30, 2007.
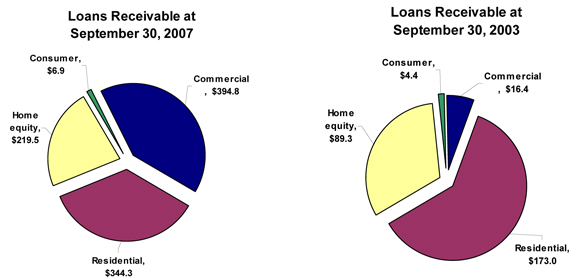
At September 30, 2003, we were principally a residential lender, with 94% of our portfolio consisting of residential and home equity loans. We identified the need to both expand net interest income and to diversify our loan portfolio. We made the decision to begin lending to small- and medium-sized businesses. We spent a year building the infrastructure to accomplish this goal, which included adding people, policies, procedures and products. Late in 2003, we hired several commercial lenders to help us grow the loan portfolio. Over the past four years, the commercial lending division has been a significant contributor to our growth, with $129.0 million of net loan growth in fiscal 2007 and $378.3 million since September 30, 2003. The commercial loan portfolio totaled $394.8 million at September 30, 2007 compared to $16.4 million at September 30, 2003.
- 7 -
We continue to grow our core deposit accounts. Total deposits increased to $835.5 million at September 30, 2007 from $313.6 million at September 30, 2003. Core deposit accounts, including checking and money market accounts, increased to $317.7 million at September 30, 2007 compared to $132.2 million at September 30, 2003. Commercial transaction accounts increased from $0 at September 30, 2003 to $113.5 million at September 30, 2007. Non-interest-bearing checking accounts increased 507% since September 30, 2003 to $57.0 million at September 30, 2007 and money market accounts increased 170% during the same period to $173.9 million at September 30, 2007. The increases stem primarily from growth in commercial relationships, expanded products and a marketing campaign focused on increasing customer relationships.
BUSINESS STRATEGYAND PRODUCTS
Our community banking strategy emphasizes high-quality, responsive, and personalized customer service. The consolidation of financial institutions in our market has created larger banks, which are perceived by many customers as impersonal or unresponsive. We believe there is a significant opportunity for a community-focused bank to provide a full range of financial services to retail customers and small- and middle-market businesses. By offering quicker decision making in the delivery of banking products and services, by offering customized products where appropriate, and by providing our customers access to our senior decision makers, we distinguish ourselves from the larger regional banks operating in our market areas. Conversely, our larger capital base and product mix enable us to compete effectively against smaller banks with limited services and capabilities. As a result, we believe we have a substantial opportunity to attract both experienced management and loan officers as well as new banking customers. We believe this opportunity will give us a competitive advantage as we continue our expansion into attractive, high-growth markets in the St. Louis metropolitan area through new banking centers, potential acquisitions of community banks and bank branches, and growth of our existing banking centers.
Our strategy centers around our continued development into a full-service, community-oriented bank. We have expanded our physical footprint to more adequately serve the key business centers of the St. Louis metropolitan area. Our efforts to grow assets and earnings are dependent upon the successful growth in each of our five core products: commercial, residential and home equity loans and checking and money market deposit accounts. These five products provide the primary source of our operating income and are the
- 8 -
focus of growth in our balance sheet. We believe the marketplace is more competitive than ever and, to achieve sustained growth, these products must be delivered with superior and efficient customer service. Driving these relationships are seasoned professionals.

Commercial Loans. In the past four years, the Bank expanded its focus to include commercial lending. During this time, approximately 56% of the growth in the Bank’s loan portfolio has come from commercial lending. In 2003, the Bank had just two employees dedicated to commercial banking. Today, the commercial division has 30 employees, many of whom have brought us new business from their existing customer relationships. In the last year, commercial real estate and commercial and industrial loans increased $129.0 million to $394.8 million at September 30, 2007 compared to $265.7 million at September 30, 2006. At September 30, 2007, the commercial loan portfolio consisted of $254.6 million of commercial real estate loans, $77.6 million of commercial and industrial loans and $62.6 million of construction and development loans.
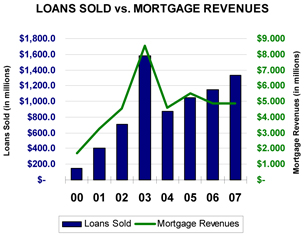
Residential Loans. Pulaski Bank is a conforming, residential mortgage lender who originates loans directly through commission-based sales staff in the St. Louis and Kansas City metropolitan areas. We do not engage in sub-prime lending and have no sub-prime assets in our loan or investment portfolios. We have become a leading mortgage originator in these two markets, originating $1.5 billion, $1.3 billion and $1.2 billion in residential loans during the years ended September 30, 2007, 2006 and 2005, respectively. Originations increased each year, primarily as a result of the expansion of our commissioned residential lending staff. Pulaski’s growth in production was in contrast to the industry as a whole, which declined in both 2006 and 2007.
The majority of loans originated in the residential division are one- to four-family residential loans, which we sell to investors on a servicing-released basis, generating mortgage revenue, which is our largest source of non-interest income. For the year ended September 30, 2007, we sold $1.3 billion of residential loans to investors, which generated mortgage revenues totaling $4.8 million, compared to $1.1 billion of loans sold and $4.9 million in revenues for the year ended September 30, 2006. The decline in mortgage revenues was primarily due to the overall decline in industry-wide mortgage production, which created a highly competitive environment and resulted in lower fees and sales margins throughout the industry.
Qualifying residential mortgage loans that do not meet the standards for sale in the secondary market are retained in our portfolio and priced on a risk/reward basis. Such loans meet our internal underwriting guidelines, which prohibit a combination of low FICO scores and high loan-to-value ratios. These loans are not considered sub-prime. Residential loans retained in our portfolio increased $25.2 million to $344.3 million at September 30, 2007 from $319.1 million at September 30, 2006. The residential retained portfolio consists primarily of three-year adjustable-rate loans and second mortgage loans that generally do not conform to investor criteria. These loans are underwritten using an internal credit-scoring model, which assesses credit risk and assigns one of five risk-based ratings to the loan at the time of inception.
- 9 -
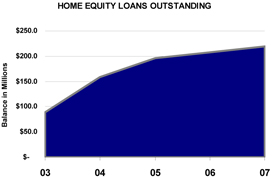
Home Equity Lines of Credit. Home equity lines of credit balances totaled $219.5 million at September 30, 2007 compared to $207.2 million at September 30, 2006. Growth in this prime-adjusting portfolio has slowed significantly as consumers have reduced the amount of their outstanding borrowings in reaction to the increase in market interest rates. Home equity loans consist primarily of revolving lines of credit secured by residential real estate. Home equity lines of credit are typically offered to only the most credit-worthy borrowers and are generally approved in conjunction with their first mortgage loan applications. The large volume of mortgage loans originated in recent years has provided many opportunities to cross-sell this product to customers and has resulted in growth in new balances. However, principal repayments have also risen resulting in slower growth during the past two years. These loans represent prime-based assets with low interest-rate risk characteristics and attractive yields, lending stability to our net interest margin. The weighted-average interest rate on home equity lines of credit was 7.76% at September 30, 2007 compared to 8.27% at September 30, 2006. The decline in the average interest rate was primarily due to the 50 basis point drop in the prime rate during September 2007.
Because home equity lines of credit are generally subordinated to first mortgage loans, the risk of loss increases when the combined loan-to-value ratio increases. Loan balances that exceed 90% of property values are generally insured for loss through mortgage insurance up to 90% of the value of the property.
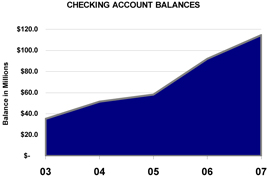
Checking Accounts. Checking accounts represent the cornerstone product in a customer relationship and are the Bank’s most valuable source of low-cost deposits. Checking account balances not only provide the lowest-cost funding source, but also generate valuable fee income through service charges. Due primarily to growth in commercial accounts, the balance of checking accounts increased $22.5 million during the year to $114.8 million at September 30, 2007 from $92.3 million at September 30, 2006. The increase included $18.2 million of growth in non-interest bearing checking account balances.

Retail banking fees increased 13% to $3.4 million for the year ended September 30, 2007 compared to $3.0 million for the year ended September 30, 2006. Our marketing campaign focused on cross-selling checking accounts to all customers and developing new checking account relationships. We have seen retail banking fees increase from $1.9 million in fiscal 2003 to $3.4 million in fiscal 2007, primarily through an increase in the volume of checks honored for customers who have overdrawn their checking accounts. Historic trends indicate the majority of customers will eventually honor the overdraft checks; consequently, annual charge-offs have averaged under 4% of total retail banking fees.
- 10 -
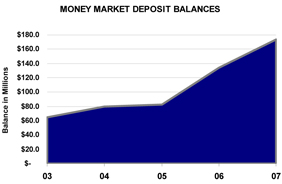
Money Market Deposits. Our strategic focus also includes growing money market deposits, which we consider another core deposit product. The balance of money market accounts increased $39.6 million, or 29.4%, to $173.9 million at September 30, 2007 from $134.4 million at September 30, 2006. The money market product carries an adjustable interest rate that makes it an ideal funding source for our prime-adjusting commercial and home equity loans. Competition for money market accounts remains intense, but the accounts are generally less interest-rate sensitive and more stable than certificates of deposit. At September 30, 2007, money market deposits had a weighted average cost of 4.05% compared to 4.12% at September 30, 2006.
CRITICAL ACCOUNTING POLICIES
We have established various accounting policies that govern the application of U.S generally accepted accounting principles in the preparation of our financial statements. Our significant accounting policies are described in the footnotes to the consolidated financial statements that appear in this report. Certain accounting policies involve significant judgments and assumptions by management that have a material impact on the carrying value of certain assets and liabilities. We consider the following to be our critical accounting policies: accounting for the allowance for loan losses and derivative financial instruments. The judgments and assumptions used by management are based on historical experience and other factors, which are believed to be reasonable under the circumstances. Because of the nature of the judgments and assumptions made by management, actual results could differ from these judgments and estimates that could have a material impact on the carrying values of assets and liabilities and our results of operations.
We maintain an allowance for loan losses to absorb probable losses in our loan portfolio. Determining the amount of the allowance involves a high degree of judgment. The balance in the allowance is based upon management’s quarterly estimates of expected losses inherent in the loan portfolio. Management’s estimates are determined by quantifying certain risks in the portfolio that are affected primarily by changes in the composition and volume of the portfolio combined with an analysis of past-due and adversely classified loans These estimates can also be affected by the following factors: changes in lending policies and procedures, including underwriting standards and collection; charge-off and recovery practices; changes in national and local economic conditions and developments; assessment of collateral values by obtaining independent appraisals; and changes in the experience, ability, and depth of lending management staff. Refer to note 1 to our Consolidated Financial Statements, “Summary of Significant Accounting Policies,” for a detailed description of our risk assessment process.
We employ derivative financial instruments to help us manage interest rate sensitivity by modifying the repricing, maturity and option characteristics of certain assets and liabilities. The judgments and assumptions that are most critical to the application of this critical accounting policy are those affecting the estimation of fair value. Fair value is based on quoted market prices. Refer to note 1 to our Consolidated Financial Statements, “Summary of Significant Accounting Policies,” for a detailed description of our estimation processes and methodology related to the fair value of derivative financial instruments.
- 11 -
AVERAGE BALANCE SHEETS
The following table sets forth information regarding average balances of assets and liabilities as well as the total dollar amounts of interest income from average interest-earning assets and interest expense on average interest-bearing liabilities, resultant yields, interest rate spread, net interest margin, and ratio of average interest-earning assets to average interest-bearing liabilities for the periods indicated.
| | | | | | | | | | | | | | | | | | | | | | | | | | | | | | |
| | | Years Ended September 30, | |
| | | 2007 | | | 2006 | | | 2005 | |
| | | Average
Balance | | | Interest
and
Dividends | | Yield/
Cost | | | Average
Balance | | | Interest
and
Dividends | | Yield/
Cost | | | Average
Balance | | | Interest
and
Dividends | | Yield/
Cost | |
| | | (Dollars in thousands) | |
Interest-earning assets: | | | | | | | | | | | | | | | | | | | | | | | | | | | | | | |
Loans receivable (1) | | $ | 878,057 | | | $ | 65,220 | | 7.43 | % | | $ | 716,045 | | | $ | 49,592 | | 6.93 | % | | $ | 584,134 | | | $ | 34,155 | | 5.85 | % |
Loans receivable held for sale | | | 64,415 | | | | 3,992 | | 6.20 | % | | | 48,518 | | | | 3,000 | | 6.18 | % | | | 50,815 | | | | 2,774 | | 5.46 | % |
Debt securities | | | 15,357 | | | | 767 | | 4.99 | % | | | 11,878 | | | | 489 | | 4.12 | % | | | 7,200 | | | | 202 | | 2.80 | % |
Mortgage-backed securities | | | 3,334 | | | | 158 | | 4.74 | % | | | 4,243 | | | | 202 | | 4.77 | % | | | 5,704 | | | | 274 | | 4.80 | % |
FHLB stock | | | 9,109 | | | | 442 | | 4.85 | % | | | 8,788 | | | | 327 | | 3.72 | % | | | 8,373 | | | | 222 | | 2.65 | % |
Other | | | 4,522 | | | | 232 | | 5.15 | % | | | 6,053 | | | | 233 | | 3.85 | % | | | 6,008 | | | | 165 | | 2.75 | % |
| | | | | | | | | | | | | | | | | | | | | | | | | | | | | | |
Total interest-earning assets | | | 974,794 | | | | 70,811 | | 7.26 | % | | | 795,525 | | | | 53,843 | | 6.77 | % | | | 662,234 | | | | 37,792 | | 5.71 | % |
| | | | | | | | | | | | | | | | | | | | | | | | | | | | | | |
Non-interest-earning assets | | | 78,454 | | | | | | | | | | 66,511 | | | | | | | | | | 45,908 | | | | | | | |
| | | | | | | | | | | | | | | | | | | | | | | | | | | | | | |
Total assets | | $ | 1,053,248 | | | | | | | | | $ | 862,036 | | | | | | | | | $ | 708,142 | | | | | | | |
| | | | | | | | | | | | | | | | | | | | | | | | | | | | | | |
Interest-bearing liabilities: | | | | | | | | | | | | | | | | | | | | | | | | | | | | | | |
Interest-bearing deposits | | $ | 713,051 | | | $ | 31,337 | | 4.39 | % | | $ | 552,626 | | | $ | 19,625 | | 3.55 | % | | $ | 442,927 | | | $ | 10,223 | | 2.31 | % |
FHLB advances | | | 168,476 | | | | 8,755 | | 5.20 | % | | | 168,067 | | | | 7,777 | | 4.63 | % | | | 163,071 | | | | 5,414 | | 3.32 | % |
Note payable | | | 3,192 | | | | 226 | | 7.08 | % | | | 3,510 | | | | 236 | | 6.71 | % | | | 3,701 | | | | 176 | | 4.75 | % |
Subordinated debentures | | | 19,589 | | | | 1,516 | | 7.74 | % | | | 19,589 | | | | 1,389 | | 7.09 | % | | | 17,471 | | | | 919 | | 5.26 | % |
| | | | | | | | | | | | | | | | | | | | | | | | | | | | | | |
Total interest-bearing liabilities | | | 904,308 | | | | 41,834 | | 4.63 | % | | | 743,792 | | | | 29,027 | | 3.90 | % | | | 627,170 | | | | 16,732 | | 2.67 | % |
| | | | | | | | | | | | | | | | | | | | | | | | | | | | | | |
Non-interest-bearing liabilities: | | | | | | | | | | | | | | | | | | | | | | | | | | | | | | |
Non-interest-bearing deposits | | | 47,605 | | | | | | | | | | 31,365 | | | | | | | | | | 21,256 | | | | | | | |
Other non-interest-bearing liabilities | | | 20,197 | | | | | | | | | | 21,204 | | | | | | | | | | 14,039 | | | | | | | |
| | | | | | | | | | | | | | | | | | | | | | | | | | | | | | |
Total non-interest-bearing liabilities | | | 67,802 | | | | | | | | | | 52,569 | | | | | | | | | | 35,295 | | | | | | | |
| | | | | | | | | | | | | | | | | | | | | | | | | | | | | | |
Stockholders’ equity | | | 81,138 | | | | | | | | | | 65,675 | | | | | | | | | | 45,677 | | | | | | | |
| | | | | | | | | | | | | | | | | | | | | | | | | | | | | | |
Total liabilities and stockholders’ equity | | $ | 1,053,248 | | | | | | | | | $ | 862,036 | | | | | | | | | $ | 708,142 | | | | | | | |
| | | | | | | | | | | | | | | | | | | | | | | | | | | | | | |
Net interest income | | | | | | $ | 28,977 | | | | | | | | | $ | 24,816 | | | | | | | | | $ | 21,060 | | | |
| | | | | | | | | | | | | | | | | | | | | | | | | | | | | | |
Interest rate spread (2) | | | | | | | | | 2.63 | % | | | | | | | | | 2.87 | % | | | | | | | | | 3.04 | % |
Net interest margin (3) | | | | | | | | | 2.97 | % | | | | | | | | | 3.12 | % | | | | | | | | | 3.18 | % |
Ratio of average interest-earning assets to average interest-bearing liabilities | | | 107.79 | % | | | | | | | | | 106.96 | % | | | | | | | | | 105.59 | % | | | | | | |
| | | | | | | | | | | | | | | | | | | | | | | | | | | | | | |
| (1) | Includes non-accrual loans with an average balance of $2.5 million, $1.8 million and $1.1 million for the fiscal years ended September 30, 2007, 2006 and 2005, respectively. |
| (2) | Yield on interest-earning assets less cost of interest-bearing liabilities. |
| (3) | Net interest income divided by average interest-earning assets. |
- 12 -
RATE VOLUME ANALYSIS
The following table allocates the period-to-period changes in the Company’s various categories of interest income and expense between changes due to changes in volume (calculated by multiplying the change in average volumes of the related interest-earning asset or interest-bearing liability category by the prior year’s rate) and changes due to changes in rate (change in rate multiplied by the prior year’s volume). Changes due to changes in rate/volume (changes in rate multiplied by changes in volume) have been allocated proportionately between changes in volume and changes in rate.
| | | | | | | | | | | | | | | | | | | | | | | | |
| | | 2007 Compared to 2006 Increase (Decrease) Due to | | | 2006 Compared to 2005
Increase (Decrease) Due to | |
| | | Rate | | | Volume | | | Net | | | Rate | | | Volume | | | Net | |
| | | (In thousands) | |
Interest-earning assets: | | | | | | | | | | | | | | | | | | | | | | | | |
Loans receivable | | $ | 3,903 | | | $ | 11,725 | | | $ | 15,628 | | | $ | 7,024 | | | $ | 8,413 | | | $ | 15,437 | |
Loans receivable held for sale | | | 10 | | | | 982 | | | | 992 | | | | 354 | | | | (128 | ) | | | 226 | |
Debt securities | | | 116 | | | | 162 | | | | 278 | | | | 121 | | | | 166 | | | | 287 | |
Mortgage-backed securities | | | (1 | ) | | | (43 | ) | | | (44 | ) | | | (2 | ) | | | (70 | ) | | | (72 | ) |
FHLB stock | | | 103 | | | | 12 | | | | 115 | | | | 94 | | | | 11 | | | | 105 | |
Other | | | 67 | | | | (68 | ) | | | (1 | ) | | | 67 | | | | 1 | | | | 68 | |
| | | | | | | | | | | | | | | | | | | | | | | | |
Total net change in income on interest-earning assets | | | 4,198 | | | | 12,770 | | | | 16,968 | | | | 7,658 | | | | 8,393 | | | | 16,051 | |
| | | | | | | | | | | | | | | | | | | | | | | | |
Interest-bearing liabilities: | | | | | | | | | | | | | | | | | | | | | | | | |
Interest-bearing deposits | | | 4,979 | | | | 6,733 | | | | 11,712 | | | | 6,120 | | | | 3,282 | | | | 9,402 | |
FHLB advances | | | 959 | | | | 19 | | | | 978 | | | | 2,193 | | | | 170 | | | | 2,363 | |
Note payable | | | 12 | | | | (22 | ) | | | (10 | ) | | | 69 | | | | (9 | ) | | | 60 | |
Subordinated debentures | | | 127 | | | | — | | | | 127 | | | | 349 | | | | 121 | | | | 470 | |
| | | | | | | | | | | | | | | | | | | | | | | | |
Total net change in expense on interest-bearing liabilities | | | 6,077 | | | | 6,730 | | | | 12,807 | | | | 8,731 | | | | 3,564 | | | | 12,295 | |
| | | | | | | | | | | | | | | | | | | | | | | | |
Net change in net interest income | | $ | (1,879 | ) | | $ | 6,040 | | | $ | 4,161 | | | $ | (1,073 | ) | | $ | 4,829 | | | $ | 3,756 | |
| | | | | | | | | | | | | | | | | | | | | | | | |
- 13 -
COMPARISONOF OPERATING RESULTSFROM 2007AND 2006
OVERVIEW
Net income for the year ended September 30, 2007 declined 8.7% to $9.0 million, or $0.88 per diluted share, compared to $9.8 million, or $1.01 per diluted share, for the year ended September 30, 2006. Results for 2006 included a $2.5 million gain on the sale of the Company’s only full-service bank location in Kansas City, resulting in an after-tax gain of approximately $1.5 million, or $0.16 per diluted share. In addition, fiscal 2007 earnings were negatively impacted by a $3.9 million provision for loan losses, which was a $2.4 million increase compared to the previous year. Return on average assets and return on average equity were 0.85% and 11.07%, respectively, during 2007 compared to 1.14% and 14.98%, respectively, during 2006.
NET INTEREST INCOME
Net interest income is the difference between interest income on interest-earning assets, such as loans and securities, and the interest expense on interest-bearing liabilities used to fund those assets, including deposits, Federal Home Loan Bank (“FHLB”) advances and other borrowings. The amount of net interest income is affected by both changes in the level of interest rates and the amount and composition of interest-earning assets and interest-bearing liabilities.
Net interest income increased $4.2 million to $29.0 million in fiscal 2007 compared to $24.8 million in fiscal 2006 due to an increase in net interest-earning assets partially offset by a decline in the net interest margin. The average balance of interest-earning assets increased $179.3 million to $974.8 million during fiscal 2007, compared to $795.5 million for fiscal 2006 due primarily to loan growth. The net interest margin declined 15 basis points to 2.97% in fiscal 2007 from 3.12% in fiscal 2006, resulting primarily from the higher cost of time deposits and wholesale borrowings used to fund the growth in the loan portfolio. During the year ended September 30, 2007, the average cost of deposits increased 84 basis points to 4.39% compared to a 50 basis point increase in the yield on loans to 7.43%. The net interest margin was also negatively impacted during 2007 by the narrowing spreads on loans held for sale. The average yield on such loans increased 2 basis points during fiscal 2007 to 6.20% while the average rate on borrowings from the FHLB used to fund these loans increased 57 basis points to 5.20%.
Interest income increased $17.0 million to $70.8 million for fiscal 2007 compared to $53.8 million for fiscal 2006. Interest income increased primarily due to a rise in the average balance of loans receivable, which increased $162.0 million to $878.1 million for fiscal 2007, combined with an increase in the average yield on loans to 7.43% in fiscal 2007 from 6.93% in fiscal 2006 due to higher market interest rates. Loans receivable grew $164.6 million, or 21.0%, during fiscal 2007 to $949.8 million at September 30, 2007. Commercial loans, which generally carry higher interest rates than residential mortgage loans, fueled 77.1% of the growth in the retained loan portfolio during the year ended September 30, 2007, with the remaining growth coming from residential, home equity and consumer loans. Interest income was also positively impacted by a $15.9 million increase in the average balance of loans held for sale during fiscal 2007.
Interest expense increased $12.8 million to $41.8 million for fiscal 2007 compared to $29.0 million for fiscal 2006 due to changes in both the cost and average balance of interest-bearing liabilities. The average cost of interest-bearing liabilities increased from 3.90% for fiscal year 2006 to 4.63% for the fiscal year 2007 as market interest rates increased in response to increased market competition.
Interest expense on deposits increased $11.7 million to $31.3 million for the year ended September 30, 2007 compared to $19.6 million for the year ended September 30, 2006. The average balance of interest-bearing deposits increased $160.4 million during fiscal 2007 to $713.1 million at September 30, 2007. The average cost of deposits increased to 4.39% in fiscal 2007 from 3.55% in 2006 primarily as the result of rising market interest rates. The Bank realized strong, well-balanced growth in money market, checking account and certificate of deposit products from both commercial and retail depositors. SeeBusiness Strategy and Products. Brokered deposits increased $71.9 million during the year from $118.5 million at September 30, 2006 to $190.4 million at September 30, 2007. The deposit growth was used primarily to support loan growth.
- 14 -
Interest expense on FHLB borrowings increased $978,000 to $8.8 million for the year ended September 30, 2007 compared to $7.8 million for the year ended September 30, 2006 almost entirely as the result of the market-driven increase in the average cost to 5.20% during 2007 from 4.63% during 2006. The Company typically relies on wholesale funds for incremental liquidity due to the Bank’s relatively high loan-to-deposit ratio of 115.6%.
ALLOWANCEFOR LOAN LOSSESAND PROVISION FOR LOSSESON LOANS
The allowance for loan losses was $10.4 million at September 30, 2007, or 1.02% of total loans and 99.44% of non-performing loans, compared to $7.8 million at September 30, 2006, or 0.92% of total loans and 115.89% of non-performing loans. The increased allowance was generally attributable to growth in the Company’s commercial loan portfolio and an increase in non-performing loans. See Note 1 to the Consolidated Financial Statements for a description of management’s methodology and Note 6 for a summary of activity in the allowance for loan losses.
The provision for loan losses for the year ended September 30, 2007 was $3.9 million compared to $1.5 million for the same period a year ago. The significant increase in the provision for loan losses was due to significant growth in the loan portfolio, especially in commercial loans which carry a higher risk of default, and also to increased charge-offs and an increase in the level of non-performing loans.
Net charge-offs for the year ended September 30, 2007 totaled $1.3 million, or 0.13% of average loans, compared to $772,000, or 0.09% of average loans, for the same period a year ago. Net charge-offs in 2007 included $714,000 in charge-offs on single-family residential mortgage loans and $279,000 in charge-offs on home equity loans. Management adheres to specific loan underwriting guidelines focusing primarily on residential and commercial real estate and home equity loans secured by one-to four-family and commercial properties and, as the result, while charge-offs in 2007 have increased significantly, the Company’s five-year average annual charge-off experience has been low, totaling only $565,000 or 0.06% of average loans. The Company was historically a lender of only 1-4 family conforming residential loans. Today, the Company has expanded its loan portfolio to include higher-risk home equity, commercial and construction loans. Because the Company’s loan portfolio is typically collateralized by real estate, losses occur more frequently when property values are declining and borrowers are losing equity in the underlying collateral. Recent declines in residential real estate values in the Company’s market areas, as well as nationally, contributed to the increased charge-offs during 2007.
Management believes that the amount maintained in the allowance for loan losses will be adequate to absorb probable losses inherent in the loan portfolio. Although management believes that it uses the best information available to make such determinations, future adjustments to the allowance for loan losses may be necessary and results of operations could be significantly and adversely affected if circumstances differ substantially from the assumptions used in making the determinations. While management believes it has established the allowance for loan losses in accordance with U.S. generally accepted accounting principles, there can be no assurance that the Bank’s regulators, in reviewing the Bank’s loan portfolio, will not request the Bank to significantly increase its allowance for loan losses. In addition, because future events affecting borrowers and collateral cannot be predicted with certainty, there can be no assurance that the existing allowance for loan losses is adequate or that a substantial increase will not be necessary should the quality of any loans deteriorate as a result of the factors discussed above. Any material increase in the allowance for loan losses will adversely affect the Company’s financial condition and results of operations.
- 15 -
NON-PERFORMING ASSETS
Non-performing assets at September 30, 2007 and September 30, 2006 are summarized as follows:
| | | | | | | | |
| | | September 30,
2007 | | | September 30,
2006 | |
| | | (Dollars in thousands) | |
Non-accrual loans: | | | | | | | | |
Residential real estate | | $ | 2,082 | | | $ | 794 | |
Commercial | | | 3,708 | | | | — | |
Home equity | | | 554 | | | | 119 | |
Other | | | 105 | | | | 27 | |
| | | | | | | | |
Total non-accrual loans | | | 6,449 | | | | 940 | |
| | | | | | | | |
Accruing loans past due 90 days or more: | | | | | | | | |
Residential real estate | | | 2,564 | | | | 3,984 | |
Commercial | | | 44 | | | | 125 | |
Home equity | | | 1,064 | | | | 1,456 | |
Other | | | 150 | | | | 21 | |
| | | | | | | | |
Total accruing loans past due 90 days or more | | | 3,822 | | | | 5,586 | |
| | | | | | | | |
Restructured loans | | | 209 | | | | 220 | |
| | | | | | | | |
Total non-performing loans | | | 10,480 | | | | 6,746 | |
Real estate acquired in settlement of loans | | | 3,090 | | | | 2,764 | |
Other nonperforming assets | | | 43 | | | | 43 | |
| | | | | | | | |
Total non-performing assets | | $ | 13,613 | | | $ | 9,553 | |
| | | | | | | | |
Ratio of non-performing loans to total loans | | | 1.03 | % | | | 0.79 | % |
Ratio of non-performing assets to total assets | | | 1.20 | % | | | 0.99 | % |
Ratio of allowance for loan losses to nonperforming loans | | | 99.44 | % | | | 115.89 | % |
Total non-performing assets increased from $9.6 million at September 30, 2006 to $13.6 million at September 30, 2007. Non-accrual loans increased from $940,000 to $6.4 million during the year, primarily as the result of increases in non-accrual residential real estate and commercial loans. Non-accrual residential real estate loans at September 30, 2007 totaled $2.1 million. During the year, management determined that a number of past due loans previously classified as accruing should be reclassified as non-accrual based on recent changes in real estate market conditions that could affect the Company’s ability to collect the amounts due on these loans. Non-accrual commercial loans at September 30, 2007 consisted of five loans secured by commercial real estate totaling $3.7 million at September 30, 2007, including a $2.6 million loan secured by an office building in St. Louis County, Missouri. Management performed a detailed review of the loan during the quarter ended June 30, 2007 and believes the loan is adequately collateralized.
Accruing loans greater than 90 days past due decreased from $5.6 million at September 30, 2006 to $3.8 million at September 30, 2007, primarily as the result of a $1.8 million decrease in loans secured by residential real estate and home equity loans. Loans are placed on non-accrual status when, in the opinion of management, there is reasonable doubt as to the collectibility of interest or principal. Management considers many factors before placing a loan on non-accrual, including the overall financial condition of the borrower, the progress of management’s collection efforts and the value of the underlying collateral.
Real estate acquired in settlement of loans totaled $3.1 million at September 30, 2007 and included 23 one- to four-family residential properties. Management performed detailed reviews of these properties and believes they are properly valued at September 30, 2007. Real estate foreclosure expense and losses, net increased $254,000 to $482,000 for the year ended September 30, 2007 compared to $228,000 for the year ended September 30, 2006. The increase was the result of increased foreclosure activity combined with softening real estate market values during fiscal 2007.
- 16 -
In addition to the nonperforming assets disclosed above, management was closely monitoring five loans secured by commercial real estate totaling $1.3 million at September 30, 2007 that were considered potential problems because of the borrowers’ weakening credit conditions. These loans were past due less than 90 days and were still accruing interest.
NON-INTEREST INCOME
Total non-interest income decreased $738,000 to $12.8 million for the year ended September 30, 2007 compared to $13.5 million for the year ended September 30, 2006. In February 2006, the Bank sold its Kansas City banking location, resulting in a $2.5 million gain. Excluding this gain, non-interest income increased $1.7 million, primarily as the result of increases in appraisal division revenues and retail banking fees. SeeBusiness Strategy and Products for a discussion of retail banking fees.
Appraisal revenuesincreased $835,000 from $186,000 in fiscal 2006 to $1.0 million in fiscal 2007. The Company established an appraisal division in July 2006 to cross-sell appraisal services to its mortgage loan customers. The increased revenues during 2007 reflect a full year of operations and an increase in the number of staff appraisers hired in late fiscal 2006.
Title policy revenues totaled $844,000 for the year ended September 30, 2007 compared to $742,000 in fiscal 2006. The title division, which began operations in June 2004, was established to capture sales opportunities from the mortgage and commercial divisions’ lending activities. The title division’s primary activities include researching and issuing title policies on mortgage and commercial loans. The increase in revenues during 2007 was the result of the increase in loan activity.
Investment broker revenues totaled $663,000 for the year ended September 30, 2007 compared to $598,000 in fiscal 2006. The investment division’s activities consist primarily of brokering bonds to other community banks, municipalities and high net worth individuals. The volatile interest rate market has greatly impacted the division’s ability to sell bonds.
Insurance commissionsdecreased to $38,000 for the year ended September 30, 2007 compared to $216,000 for the year ended September 30, 2006. Insurance commissions stem primarily from revenue received for brokering annuity sales for insurance companies. Since these products often compete directly with the Company’s deposit products, these activities were significantly scaled back during fiscal 2007.
Bank-owned life insurance incomeincreased $169,000 to $1.0 million for the year ended September 30, 2007 from $847,000 for the year ended September 30, 2006, primarily as the result of a full year of income earned in 2007 on $6.5 million of additional policies purchased during February and March of 2006.
Other income increased $106,000 to $697,000 for the year ended September 30, 2007 from $591,000 for the year ended September 30, 2006. The increase resulted primarily from increased fee income from checks drawn on our correspondent bank’s checking account, receipt of a litigation settlement totaling $53,000, net of expenses, and increased rental income collected from tenants in one of the Bank’s office buildings.
NON-INTEREST EXPENSE
Total non-interest expense increased $2.8 million, or 13.2%, to $24.4 million for the year ended September 30, 2007 compared to $21.6 million for the year ended September 30, 2006. The ratio of non-interest expense to average assets decreased to 2.38% for fiscal 2007 compared to 2.48% for fiscal 2006 primarily as the result of cost-effective growth in average assets.
Salaries and employee benefits expense increased $1.9 million, or 18.5%, to $12.4 million for the year ended September 30, 2007 from $10.4 million for the year ended September 30, 2006 as the result of additional employees hired to staff the new bank locations and to support increased loan activity. The number of full-time equivalent employees increased from 361 at September 30, 2006 to 421 at September 30, 2007.
- 17 -
Occupancy and equipmentexpense increased $677,000 to $5.8 million for the year ended September 30, 2007 from $5.1 million for the year ended September 30, 2006. The increase in expense was due primarily to the addition of the Richmond Heights location which opened in January 2007.
Advertising expense increased $300,000 to $1.4 million for the year ended September 30, 2007 compared to $1.1 million for the year ended September 30, 2006. The increase resulted from higher television and newspaper advertising during 2007 as we increased our marketing efforts related to the new bank locations and new products.
Gain on derivative instruments increased $781,000 during the year to $586,000 for the year ended September 30, 2007 compared to a loss of $194,000 for the year ended September 30, 2006. During the first quarter of fiscal year 2006, changes in the estimated fair values of these derivatives were recognized as charges or credits to earnings, as appropriate, during the periods in which the changes occurred. Effective January 1, 2006, the Company began using long-haul, fair-value, hedge accounting. The increased gain in 2007 was the result of a shorter duration on the derivative instruments at September 30, 2007 compared to September 30, 2006.
Data processing termination expensetotaled $220,000 for the year ended September 30, 2007 due to the write-off of capitalized expenses related to the termination of a contract to convert the Company’s core data processing system. There was no such expense in the prior fiscal year.
Charitable contributionsdecreased $250,000 during the year to $123,000 for the year ended September 30, 2007 compared to $373,000 for the year ended September 30, 2006 due primarily to the non-recurrence of a $250,000 charitable contribution to a St. Louis community-based not-for-profit organization in February 2006.
Other non-interest expense increased $347,000, or 18%, to $2.3 million for the year ended September 30, 2007 compared to $1.9 million for the year ended September 30, 2006. The increase was primarily due to a $156,000 increase in telephone expense and a $106,000 increase in expense from the amortization of the core deposit premium. Telephone expense increased as the result of new systems required to support the new bank locations. The core deposit premium relates to the deposits acquired in connection with the acquisition of Central West End Bank in March 2006. Fiscal 2007 includes a full year of amortization expense while fiscal 2006 included only the six months following the acquisition.
INCOME TAXES
The provision for income taxes decreased from $5.4 million for the year ended September 30, 2006 to $4.5 million for the year ended September 30, 2007. The effective tax rate was 33.4% in 2007 compared to 35.5% in 2006. The lower effective tax rate in 2007 was primarily the result of an increase in BOLI income, which is non-taxable.
FINANCIAL CONDITION
Cash and cash equivalents increased $1.6 million to $23.7 million at September 30, 2007 from $22.1 million at September 30, 2006. Cash balances included overnight investments in federal funds of $3.2 million at September 30, 2007 compared to $3.0 million at September 30, 2006. These funds are generally used to fund the Company’s daily liquidity needs. The primary sources of cash are increases in deposits and borrowings from the FHLB.
Debt securities held to maturity decreased $6.9 million during the year to $6.0 million at September 30, 2007 from $12.9 million at September 30, 2006 whiledebt securities available for sale increased $7.0 million during fiscal 2007. Debt securities are generally held to provide sufficient collateral for certain large deposit relationships. During 2007, maturing debt securities held to maturity were replaced with debt securities held for sale.
- 18 -
Federal Home Loan Bank (of Des Moines) stock decreased approximately $1.2 million to $8.3 million at September 30, 2007 from $9.5 million at September 30, 2006, in response to the decrease in borrowings. The Bank is generally required to hold stock equal to 5% of its total FHLB borrowings.
Loans held for sale declined $1.9 million to $58.5 million at September 30, 2007 from $60.5 million at September 30, 2006. These balances represent loans closed in the name of the Bank, which are committed in advance of closing to be sold to investors. Since these loans are pre-sold, primarily at a pre-determined price on a best-efforts basis, they are not subject to changes in value as a result of changes in market interest rates. We typically receive proceeds from the sale of these loans to investors within 30 days of loan closing and benefit from interest income while awaiting sales delivery.
Premises and equipment increased $2.2 million to $20.4 million at September 30, 2007 from $18.2 million at September 30, 2006 mainly due to the expenditures for the new bank locations.
Bank-owned life insurance increased $1.0 million to $25.0 million at September 30, 2007 from $24.0 million at September 30, 2006. The increase was attributable to appreciation of the cash surrender values of existing policies. Increases in cash surrender values are treated as other income and are tax-exempt. If the cash surrender values of the policies are liquidated, the gains would retroactively be taxed.
Other assets increased $3.0 million to $6.4 million at September 30, 2007 from $3.4 million at September 30, 2006 mainly due to a $2 million investment in the St. Louis Equity Fund during fiscal 2007 and a $990,000 increase in accounts receivable from another financial institution which settled on the following day.
Federal Home Loan Bank (of Des Moines) advancesdecreased $14.4 million to $158.4 million at September 30, 2007 compared to $172.8 million at September 30, 2006. The decrease in borrowings was due to the strong growth in deposits of $179.9 million, which primarily funded the growth in loans of $164.6 million.
Due to other banks decreased $4.6 million to $17.5 million at September 30, 2007 from $22.1 million at September 30, 2006. Due to other banks represents unremitted payments for bank and cashier checks issued by the Bank. The decrease represents a decrease in check activity on the final day of the fiscal year end. In the normal course of business, settlement for amounts due to other banks is made on the following business day.
Total stockholders’ equity increased $5.0 million to $80.8 million at September 30, 2007 from $75.8 million at September 30, 2006. The increase was due primarily to growth in retained earnings driven by net income of $9.0 million, partially offset by regular cash dividends paid of $3.5 million, the repurchase of 97,337 shares of the Company’s common stock at a total cost of $1.4 million and the purchase of 88,188 shares of the Company’s common stock to fund the equity trust plan at a cost of $1.2 million.
COMPARISONOF OPERATING RESULTSFROM 2006AND 2005
OVERVIEW
Net income for the year ended September 30, 2006 increased 32% to $9.8 million, or $1.01 per diluted share, compared to $7.5 million, or $0.85 per diluted share, for the year ended September 30, 2005. In February 2006, the Company benefited from a $2.5 million gain on the sale of a branch location, resulting in an after-tax gain of approximately $1.5 million, or $0.16 per diluted share. Diluted earnings per share for the year ended September 30, 2006 were reduced due to a 1.2 million increase in the number of shares outstanding resulting from stock issued in a secondary public offering in February 2006 and 210,732 shares issued to acquire CWE Bancorp, Inc. on March 31, 2006. Return on average assets and return on average equity were 1.14% and 14.98%, respectively, during 2006 compared to 1.06% and 16.37%, respectively, during 2005.
The Company completed the purchase of CWE Bancorp, Inc., and its wholly-owned subsidiary, Central West End Bank (“CWE”), on March 31, 2006. The aggregate purchase price was $7.3 million, including $3.6 million of cash and 210,732 shares of the Company’s common stock. The purchase added two full- service banking locations in the Central West End neighborhood of St. Louis with deposits totaling $41.4 million and total assets of $50.3 million. The Company’s total assets at September 30, 2006 were $962.5 million compared to $789.9 million at September 30, 2005.
- 19 -
NET INTEREST INCOME
Net interest income increased $3.8 million to $24.8 million in fiscal 2006 compared to $21.1 million in fiscal 2005 due to an increase in net interest-earning assets partially offset by a decline in the net interest margin. The average balance of interest-earning assets increased $133.3 million to $795.5 million during fiscal year 2006, compared to $662.2 million for fiscal year 2005 due primarily to loan growth. The net interest margin declined 6 basis points to 3.12% in fiscal 2006 from 3.18% in fiscal 2005, resulting primarily from rising market interest rates which increased the cost of deposits at a faster rate than the rise in the yield on loans. During the year ended September 30, 2006, the average cost of deposits increased 124 basis points to 3.55% compared to a 108 basis point increase in the yield on loans to 6.93%. The net interest margin was also negatively impacted during 2006 by the narrowing spreads on loans held for sale. The average yield on such loans increased 72 basis points for the year to 6.18% in fiscal 2006 compared to 5.46% in fiscal 2005. Loans held for sale are typically funded by borrowings from the FHLB, the cost of which increased sequentially in conjunction with the federal funds rate increases from 3.32% in fiscal 2005 to 4.63% in fiscal 2006.
Interest income increased $16.1 million to $53.8 million for fiscal 2006 compared to $37.8 million for fiscal 2005. Interest income increased primarily due to a rise in the average balance of loans receivable, which increased $131.9 million to $716.0 million for fiscal 2006, combined with an increase in the average yield on loans to 6.93% in fiscal 2006 from 5.85% in fiscal 2005 due to higher market interest rates. Loans receivable grew $152.0 million, or 24.0%, during fiscal 2006 to $785.2 million at September 30, 2006. Commercial lending fueled 56% of the growth in the retained loan portfolio during the year ended September 30, 2006, with the remaining growth coming from residential, home equity and consumer loans.
Excluding loans receivable, the average balance of other interest earning assets increased $1.4 million for fiscal 2006 and had a minimal impact on changes in net interest income.
Interest expense increased $12.3 million to $29.0 million for fiscal 2006 compared to $16.7 million for fiscal 2005 due to changes in both the cost and average balance of interest-bearing liabilities. The average cost of interest-bearing liabilities increased from 2.67% for fiscal year 2005 to 3.90% for the fiscal year 2006 as market interest rates increased in response to rising federal funds rates and increased market competition.
For the year ended September 30, 2006, total deposits increased $159.4 million to $655.6 million, including $41.4 million in deposits acquired through the purchase of Central West End Bank. The average cost of deposits increased to 3.55% in fiscal 2006 from 2.31% in 2005 primarily as the result of rising market interest rates. In addition to the deposits acquired in the Central West End Bank purchase, the Bank saw strong, well-balanced growth in money market, checking account and certificate of deposit products from both commercial and retail depositors. At September 30, 2006, the weighted average cost of interest-bearing checking accounts was 1.66% and totaled $53.4 million. Brokered deposits declined $356,000 during the year from $118.9 million at September 30, 2005 to $118.5 million at September 30, 2006. The deposit growth was used primarily to support loan growth.
Interest expense on FHLB borrowings increased $2.4 million to $7.8 million for the year ended September 30, 2006 compared to $5.4 million for the year ended September 30, 2005 almost entirely as the result of the market-driven increase in the average cost to 4.63% during 2006 from 3.32% during 2005.
- 20 -
ALLOWANCEFOR LOAN LOSSESAND PROVISION FOR LOSSESON LOANS
The balance of the allowance for loan losses increased $1.0 million to $7.8 million at September 30, 2006 from $6.8 million at September 30, 2005, due primarily to growth in the retained loan portfolio, which increased from $633.2 million at September 30, 2005 to $785.2 million at September 30, 2006. The allowance as a percentage of non-performing loans changed from 112.07% at September 30, 2005 to 115.89% at September 30, 2006.
The provision for loan losses totaled $1.5 million for the year ended September 30, 2006 compared to $1.6 million for the year ended September 30, 2005. The change in the provision for loan losses was affected by increased charge-offs and non-performing assets during the year and a shift in the risk profile of the loan portfolio. For the year ended September 30, 2006, the Bank’s charge-offs totaled 9 basis points of the average balance of loans, or $782,000, compared to 6 basis points of average loans, or $417,000, during the year ended September 30, 2005. The increase in charge-offs was primarily due to the sale of $6.6 million of non-performing loans during 2006, resulting in charge-offs of $378,000.
The risk profile of the Bank’s loan portfolio also shifted during the year. The balance of home equity lines of credit increased from $195.6 million at September 30, 2005 to $207.2 million at September 30, 2006, representing 30% of loans receivable at September 30, 2006 compared to 26% at September 30, 2005. However, within the home equity loan portfolio, the balance of high loan-to-value home equity loans declined from $112.5 million at September 30, 2005 to $65.1 million at September 30, 2006, which resulted in management assigning reduced risk ratings on the remaining home equity loan portfolio and, therefore, a lower provision for losses during 2006. The decline in this higher-risk product was market-driven by consumers seeking lower interest rates on their prime-adjusting home equity loans as market interest rates increased. In fiscal 2006, we saw a general migration to fixed-rate, amortizing loan products and fewer cash-out refinancings using lines of credit. Other changes in the loan portfolio included an increase in the balance of commercial real estate and other commercial loans from $140.6 million at September 30, 2005 to $219.9 million at September 30, 2006, representing 28% of gross loans receivable at September 30, 2006 compared to 22% at September 30, 2005. In addition, the balance of permanent one-to-four family residential loans increased from $255.7 million at September 30, 2005 to $314.7 million at September 30, 2006, representing 39% of gross loans receivable at September 30, 2006 compared to 40% at September 30, 2005.
NON-PERFORMING ASSETSAND DELINQUENCIES
Total non-performing assets increased $3.1 million from $6.8 million at September 30, 2005 to $9.9 million at September 30, 2006, primarily due to a $2.0 million rise in real estate acquired in settlement of loans. Real estate acquired in settlement of loans increased from $754,000 at September 30, 2005 to $2.8 million at September 30, 2006. The increase was caused by the foreclosure on a $1.2 million loan secured by a commercial building, combined with several residential foreclosures. Total non-performing loans increased $1.1 million from $6.0 million at September 30, 2005 to $7.1 million at September 30, 2006 primarily as the result of an increase in non-performing home equity loans from $618,000 at September 30, 2005 to $1.6 million at September 30, 2006. The increase in non-performing home equity loans occurred primarily in the December 2005 and March 2006 quarters following changes in bankruptcy laws and rising market interest rates.
NON-INTEREST INCOME
Total non-interest income increased $2.6 million to $13.5 million for the year ended September 30, 2006 compared to $10.9 million for the year ended September 30, 2005. In February 2006, the Bank sold its Kansas City banking location, resulting in a $2.5 million gain. Excluding this gain, non-interest income increased $169,000, primarily as the result of an $870,000, or 15%, decrease in mortgage revenues caused by lower gross margins on sales of mortgage loans during the year. The decline in the gross margin was the result of the overall decline in industry mortgage production, which created a highly competitive lending environment and resulted in lower fees and gross sales margins throughout the industry. Retail banking fees increased 23% to $3.0 million for the year ended September 30, 2006 compared to $2.5 million in 2005 as the result of additional banking locations and a change in our overdraft policy, which began allowing point-of-purchase overdraft protection.
- 21 -
Title Division Results. Our title division, which began operations in June 2004, was established to capture sales opportunities from the mortgage and commercial divisions’ lending activities. The title division’s primary activities include researching and issuing title policies on mortgage and commercial loans. For the year ended September 30, 2006, the division’s revenues totaled $742,000 compared to $756,000 in 2005.
Investment Division Results. The investment division began operations in the first quarter of fiscal year 2005. For the year ended September 30, 2006, the division’s revenues totaled $598,000 compared to $668,000 in 2005. The flattening of the yield curve and the consistent rise in interest rates greatly impacted the division’s ability to sell bonds. Since July 2006, which was the inflection point in the rise of short-term interest rates, the division experienced increased sales activity resulting in small profits during August and September of 2006.
Appraisal Division Results.In July of 2006, the Bank hired three residential appraisers from the St. Louis community to help increase fee income by cross-selling appraisal services to the Bank’s mortgage loan customers. In the first quarter of operations, the division had revenues of $186,000, which were partially offset by compensation and other expenses of $121,000.
Insurance commissionsincreased slightly to $216,000 for the year ended September 30, 2006 compared to $207,000 for the year ended September 30, 2005. Insurance commissions stem primarily from revenue received for brokering annuity sales to insurance companies.
Bank-owned life insurance incomeincreased $250,000 to $847,000 for the year ended September 30, 2006 from $596,000 for the year ended September 30, 2005 due to additional policy purchases during fiscal year 2006.
Other income increased $140,000 to $591,000 for the year ended September 30, 2006 from $451,000 for the year ended September 30, 2005. Other income consists primarily of fee income from correspondent banks, which rose due to increased crediting rates resulting from changes in the interest rate environment.
NON-INTEREST EXPENSE
Salaries and employee benefitsexpense increased $1.2 million to $10.4 million for the year ended September 30, 2006 from $9.2 million for the year ended September 30, 2005 due to the addition of commercial staff and employees at the new branch locations. Compensation paid to salaried mortgage staff declined during the year as the number of employees fell 10% from 106 at September 30, 2005 to 95 at September 30, 2006. The increase in compensation expense was partially offset by an increase in direct compensation expense that was deferred on loans originated. The increased deferral resulted from the growth in mortgage and commercial loan originations during the year.
Occupancy and equipmentexpense increased $903,000 to $5.1 million for the year ended September 30, 2006 from $4.2 million for the year ended September 30, 2005. The increase in expense was due primarily to the addition of two facilities acquired in the purchase of Central West End Bank in March 2006, a full year of costs incurred at the Chesterfield bank location which opened late in fiscal 2005, and renovations to the Creve Coeur bank location and the Pulaski Financial building.
Advertising expense increased $279,000 during the year to $1.1 million for the year ended September 30, 2006 compared to $845,000 for the year ended September 30, 2005. The increase resulted from higher television and newspaper advertisement during the year as the Company increased marketing efforts related to the Central West End Bank locations and the successful “Big Bertha Bundle” money market campaign.
Professional services expenseincreased $227,000 during the year to $1.2 million for the year ended September 30, 2006 compared to $1.0 million for the year ended September 30, 2005 due to increased expenses associated with the development, implementation and testing of procedures necessary to comply with the requirements of the Sarbanes Oxley Act and legal and professional fees incurred in connection with the resolution of the issues surrounding the accounting for derivative financial instruments.
- 22 -
Postage, document delivery and office suppliesincreased $255,000 to $989,000 for the year ended September 30, 2006 compared to $734,000 for the year ended September 30, 2005 due to overall increased volume of loan and deposit business and the two banking locations acquired in the Central West End Bank purchase.
Loss on derivative instruments decreased $126,000 during the year to $194,000 at September 30, 2006 from $320,000 for the year ended September 30, 2005. During fiscal year 2005 and the first three months of fiscal year 2006, changes in the estimated fair values of these derivatives were recognized as charges or credits to earnings, as appropriate, during the periods in which the changes occurred. Effective January 1, 2006, the Company began using long-haul, fair-value, hedge accounting.
Real estate foreclosure expense and losses, netincreased $206,000 during the year to $228,000 for the year ended September 30, 2006 compared to $22,000 for the year ended September 30, 2005 due to increased foreclosure activity, which includes a commercial building and several residential properties.
Charitable contributionsincreased $259,000 during the year to $373,000 for the year ended September 30, 2006 compared to $114,000 for the year ended September 30, 2005 due primarily to a $250,000 charitable contribution to a St. Louis community-based not-for-profit organization.
INCOME TAXES
The provision for income taxes increased from $4.4 million for the year ended September 30, 2005 to $5.4 million for the year ended September 30, 2006. The effective tax rate was 35.5% in 2006 compared to 37.1% in 2005. The lower effective tax rate in 2006 was the result of an increase in BOLI income, which is non-taxable, and a decrease in compensation expense associated with the ESOP, which is non-deductible.
MARKET RISK ANALYSIS
Market risk is the risk of loss arising from adverse changes in the fair values of financial instruments or other assets caused by changes in interest rates, currency exchange rates, or equity prices. Interest rate risk is our primary market risk and results from timing differences in the repricing of assets and liabilities, changes in relationships between rate indices, and the potential exercise of explicit or embedded options. The Company uses several measurement tools provided by a national asset liability management consultant to help manage these risks. Management provides key assumptions to the consultants, which are used as inputs into the measurement tools. Following is a summary of two different tools management uses on a quarterly basis to monitor and manage interest rate risk. These reports are prepared using the Company’s financial data from the month prior to each quarter end; therefore, certain changes may have occurred since August 31, 2007. However, management believes any such changes are immaterial based on a review of changes in the composition of the Company’s financial statements and changes in market interest rates from August 31, 2007 to September 30, 2007.
Earnings Simulation Modeling. Net income is affected by changes in the level of interest rates, the shape of the yield curve and the general market pressures affecting current market interest rates at the time of simulation. Many interest rate indices do not move uniformly, creating certain disunities between them. For example, the spread between a thirty-day, prime-based asset and a thirty-day, FHLB advance may not be uniform over time. The earnings simulation model projects changes in net interest income caused by the effect of changes in interest rates on interest-earning assets and interest-bearing liabilities. Simulation results are measured as a percentage change in net interest income compared to the static-rate or “base case” scenario. The model considers increases and declines in asset and liability volumes using prepayment assumptions as well as rate changes. Rate changes are modeled gradually over a 12-month period, referred to as a “rate ramp.” The model projects only changes in interest income and expense and does not project changes in non-interest income, non-interest expense, provision for loan losses or the impact of changing tax rates. At August 31, 2007, net interest income simulation showed a negative 200 basis point change from the base case in a 200 basis point
- 23 -
ramped rising rate environment and a positive 180 basis point change from the base case in a 200 basis point ramped declining rate environment. The projected decrease in net interest income is within the Asset Liability Committee’s guidelines in a 200 basis point increasing or decreasing interest rate environment. However, management continually monitors signs of elevated risks and takes certain actions to limit these risks.
The following table summarizes the results of the Company’s income simulation model as of August 31, 2007 and 2006.
| | | | | | | | | | | | |
| | | Change in Net Interest Income | |
| | | 2007 | | | 2006 | |
Change in Market Interest Rates | | Year 1 | | | Year 2 | | | Year 1 | | | Year 2 | |
200 basis point ramped increase | | -2.0 | % | | -6.2 | % | | -0.5 | % | | -7.0 | % |
Base case - no change | | — | | | -1.6 | % | | — | | | -1.9 | % |
200 basis point ramped decrease | | 1.8 | % | | 0.9 | % | | 0.3 | % | | 0.9 | % |
Net Portfolio Value Analysis.Net portfolio value (“NPV”) represents the market value of portfolio equity and is equal to the market value of assets minus the market value of liabilities, with adjustments made for off-balance sheet items. This analysis assesses the risk of loss in market-risk sensitive instruments in the event of a sudden and sustained 100 to 200 basis point increase or decrease in market interest rates with no effect given to any actions management might take to counter the effect of that interest rate movement. The following is a summary of the results compiled by our outside consultant using data and assumptions we provided as of August 31, 2007 and 2006. Certain changes may have occurred since August 31, 2007. However, management believes any such changes are immaterial based on a review of changes in the composition of the Company’s financial statements and changes in market interest rates from August 31, 2007 to September 30, 2007.
| | | | | | | | | | | | | | |
| | | Estimated Change in NPV | |
| | | 2007 | | | 2006 | |
Change in Market Interest Rates | | Amount
(000s) | | | Percent | | | Amount
(000s) | | | Percent | |
200 basis point increase | | ($ | 6,451 | ) | | -6.3 | % | | ($ | 4,630 | ) | | -5.7 | % |
100 basis point increase | | ($ | 2,325 | ) | | -2.3 | % | | ($ | 1,568 | ) | | -1.9 | % |
Base case - no change | | $ | 0 | | | — | | | $ | 0 | | | — | |
100 basis point decrease | | $ | 785 | | | 0.8 | % | | ($ | 1,044 | ) | | -1.3 | % |
200 basis point decrease | | | ($560 | ) | | -0.6 | % | | ($ | 5,482 | ) | | -6.7 | % |
The preceding table indicates that, at August 31, 2007, in the event of a 200 basis point increase in prevailing market interest rates, NPV would be expected to decline by $6.5 million, or 6.3% of the base case scenario value of $101.7 million. In the event of a decrease in prevailing market rates of 200 basis points, NPV would be expected to decline by $560,000 or 0.6% of the base case scenario value. The projected decrease in NPV is within the Asset Liability Committee’s guidelines in a 200 basis point increasing or decreasing interest rate environment. However, management continually monitors signs of elevated risks and takes certain actions to limit these risks.
- 24 -
The following table presents the Company’s financial instruments that are sensitive to changes in interest rates, categorized by expected maturity, and the instruments’ estimated fair values and weighted average interest rates at September 30, 2007. Expected maturities use certain assumptions based on historical experience and other data available to management.
| | | | | | | | | | | | | | | | | | | | | | | | |
| | | | | | EXPECTED MATURITY | | | | |
| | | Weighted
Average
Rate | | | Within One
Year | | One Year
to Three
Years | | After Three
Years to
Five Years | | After Five
Years to
Ten Years | | Beyond
Ten Years | | Carrying
Value Total | | Estimated
Fair Value |
| | | (Dollars in Thousands) |
Interest Sensitive Assets | | |
Loans receivable - net (1) | | 7.44 | % | | $ | 517,815 | | $ | 150,366 | | $ | 109,838 | | $ | 128,812 | | $ | 42,995 | | $ | 949,826 | | $ | 943,357 |
Loans receivable held for sale - net (2) | | 6.55 | % | | | 58,536 | | | — | | | — | | | — | | | — | | | 58,536 | | | 59,449 |
Debt securities - HTM | | 5.26 | % | | | 5,980 | | | — | | | — | | | — | | | — | | | 5,980 | | | 5,979 |
Debt securities - AFS | | 4.76 | % | | | 4,988 | | | 2,055 | | | — | | | — | | | — | | | 7,043 | | | 7,043 |
Mortgage-backed securities - HTM | | 8.87 | % | | | 91 | | | 8 | | | 1 | | | 160 | | | 111 | | | 371 | | | 400 |
Mortgage-backed securities - AFS | | 4.25 | % | | | 17 | | | 2,316 | | | — | | | — | | | 322 | | | 2,655 | | | 2,655 |
FHLB stock | | 4.25 | % | | | 8,306 | | | — | | | — | | | — | | | — | | | 8,306 | | | 8,306 |
Other | | 4.87 | % | | | 3,237 | | | — | | | — | | | — | | | — | | | 3,237 | | | 3,237 |
| | | | | | | | | | | | | | | | | | | | | | | | |
Total interest sensitive assets | | | | | $ | 598,970 | | $ | 154,745 | | $ | 109,839 | | $ | 128,972 | | $ | 43,428 | | $ | 1,035,954 | | $ | 1,030,426 |
| | | | | | | | | | | | | | | | | | | | | | | | |
Interest Sensitive Liabilities | | | | | | | | | | | | | | | | | | | | | | | | |
Passbook savings accounts | | 0.29 | % | | $ | 28,909 | | $ | — | | $ | — | | $ | — | | $ | — | | $ | 28,909 | | $ | 28,909 |
Checking accounts (3) | | 1.79 | % | | | 57,816 | | | — | | | — | | | — | | | — | | | 57,816 | | | 57,816 |
Money market accounts | | 4.05 | % | | | 173,950 | | | — | | | — | | | — | | | — | | | 173,950 | | | 173,950 |
Certificate of deposit accounts (4) | | 5.06 | % | | | 360,189 | | | 63,306 | | | 45,016 | | | 34,586 | | | 14,712 | | | 517,809 | | | 517,809 |
FHLB advances | | 4.81 | % | | | 117,300 | | | 37,100 | | | — | | | — | | | 4,000 | | | 158,400 | | | 157,287 |
Note payable | | 6.50 | % | | | 340 | | | 2,640 | | | — | | | — | | | — | | | 2,980 | | | 2,980 |
Subordinated debentures | | 7.95 | % | | | — | | | — | | | — | | | — | | | 19,589 | | | 19,589 | | | 19,589 |
| | | | | | | | | | | | | | | | | | | | | | | | |
Total interest sensitive liabilities | | | | | $ | 738,504 | | $ | 103,046 | | $ | 45,016 | | $ | 34,586 | | $ | 38,301 | | $ | 959,453 | | $ | 958,340 |
| | | | | | | | | | | | | | | | | | | | | | | | |
Off-Balance Sheet Items | | | | | | | | | | | | | | | | | | | | | | | | |
Operating leases | | | | | $ | 435 | | $ | 435 | | $ | 222 | | $ | 412 | | $ | — | | $ | 1,504 | | $ | 1,504 |
Commitments to extend credit | | 8.05 | % | | | 144,653 | | | — | | | — | | | — | | | — | | | — | | | |
Unused lines of credit - residential | | | | | | 252,905 | | | — | | | — | | | — | | | — | | | — | | | |
Unused lines of credit - commercial | | | | | | 38,363 | | | — | | | — | | | — | | | — | | | — | | | |
| (1) | Includes non-accrual loans. |
| (2) | Maturity reflects expected committed sales to investors. |
| (3) | Excludes non-interest bearing checking accounts of $57.0 million. |
| (4) | $40 million and $39 million of certificates of deposit in the three- and five-year categories are fixed-rate maturities, however, the interest rates are swapped for LIBOR 30 day rates. |
- 25 -
LIQUIDITY RISK
Liquidity risk arises from the possibility that we may not be able to satisfy current or future financial commitments, or may become unduly reliant on alternative funding sources. The objective of liquidity risk management is to ensure that the cash flow requirements of our depositors and borrowers, as well as our operating cash needs, are met. The Asset/Liability Management Committee meets regularly to consider the operating needs of the organization. Projected cash flows are prepared for a rolling 180 day period, with significant shortfalls in core deposit products examined and wholesale funding decisions made. Funds are available from a number of sources, including retail deposits, Federal Home Loan Bank advances, brokered deposits, other borrowings and loan sales.
We maintain adequate levels of liquidity to ensure the availability of funds to satisfy loan commitments and deposit withdrawals. At September 30, 2007, we had outstanding firm commitments to originate loans of $144.7 million, to sell loans on a best-efforts basis of $129.4 million, to sell mortgage-backed securities of $19.0 million and to fulfill commitments under unused lines of credit of $291.0 million. At the same time, certificates of deposit scheduled to mature in one year or less totaled $360.2 million. Based upon historical experience, management believes the majority of maturing certificates of deposit will remain with the Bank.
We require funds beyond our ability to generate them internally and we have the ability to borrow funds from the FHLB equal to 35% of our total assets, subject to collateral verification. Under a blanket agreement, we assign all investments in FHLB stock, all qualifying first residential mortgage loans and all loans held for sale as collateral to secure the amounts borrowed. At September 30, 2007, we had $106.5 million available under the above-mentioned borrowing arrangement in addition to existing advances of $158.4 million. The Bank also had approximately $148.8 million of additional available borrowing capacity under a line of credit with the Federal Reserve Bank. We had an additional $20.0 million in unused liquidity through a line of credit with a correspondent bank. In addition, as long as the Bank maintains a “well capitalized” position, the Bank can issue deposits through a nationally brokered market. Broker deposits offer the advantage of large blocks of liquidity generally at a lower cost.
The Company is a large originator of residential mortgage loans (including home equity lines of credit), with more than 80% of these loans sold to the secondary residential mortgage investment community. Consequently, theprimary source and use of cash in operations is to originate loans for sale, which used $1.3 billion in cash during the twelve months ended September 30, 2007 and provided proceeds of $1.3 billion from loan sales. The Company realized $3.6 million of gains on sale of loans during fiscal 2007.
Theprimary use of cash from investing activities is the origination of loans that are held in portfolio. During the twelve months ended September 30, 2007, loan originations increased $13.5 million from $163.2 million for the year ended September 30, 2006 to $176.7 million for the year ended September 30, 2007. Other significant uses of cash from investing activities included $55.8 million for the purchase of debt securities, $11.6 million for the purchase of FHLB stock and $3.7 million for the purchase or improvement of premises and equipment. Sources of cash from investing activities included proceeds from the sale of debt securities available for sale totaling $5.9 million, proceeds from maturities of debt securities of $51.0 million, proceeds from FHLB stock redemptions of $12.9 million and proceeds from sale of real estate acquired in settlement of loans of $4.5 million.
Supporting the growth in the loan portfolio, the Company’s primary source of funds fromfinancing activities included a $179.9 million increase in deposits partially offset by net repayments of FHLB advances totaling $14.4 million, a net decrease in due to other banks of $4.6 million, and dividends paid on common stock of $3.5 million.
- 26 -
DERIVATIVES, CONTRACTUAL OBLIGATIONS AND OFF-BALANCE SHEET ARRANGEMENTS
The Company has various financial obligations, including obligations that may require future cash payments. The table below presents, as of September 30, 2007, significant fixed and determinable contractual obligations to third parties by payment due date. Further discussion of each obligation is included in the notes to the consolidated financial statements.
| | | | | | | | | | | | | | | |
| | | | | Payments due by period |
| | | Total | | Less than 1
Year | | 1-3 Years | | 3-5
Years | | More
than 5
years |
Time deposits | | $ | 517,809 | | $ | 360,188 | | $ | 108,324 | | $ | 49,297 | | $ | — |
Advances from FHLB | | | 158,400 | | | 117,300 | | | 37,100 | | | — | | | 4,000 |
Note payable | | | 2,980 | | | 2,980 | | | — | | | — | | | — |
Subordinated debentures | | | 19,589 | | | — | | | — | | | — | | | 19,589 |
Operating lease obligations | | | 1,504 | | | 435 | | | 435 | | | 222 | | | 412 |
| | | | | | | | | | | | | | | |
Total | | $ | 700,282 | | $ | 480,903 | | $ | 145,859 | | $ | 49,519 | | $ | 24,001 |
| | | | | | | | | | | | | | | |
In the normal course of operations, we engage in a variety of financial transactions that, in accordance with U. S. generally accepted accounting principles, are not recorded in our financial statements. These transactions involve, to varying degrees, elements of credit, interest rate and liquidity risk. Such transactions are used for general corporate purposes or to manage customers’ requests for funding. Corporate purpose transactions are used to help manage credit, interest rate, and liquidity risk or to optimize capital. Customer transactions are used to manage customers’ requests for funding. The Company entered into interest rate swap agreements during November 2004, which were designed to convert the fixed rates paid on certain brokered certificates of deposits into variable, LIBOR-based rates. See Note 19 to the consolidated financial statements for further discussion.
- 27 -
STOCK PERFORMANCE GRAPH
The following graph compares the cumulative total stockholder return on the Company’s common stock with the cumulative total return on the Nasdaq Index (U.S. Companies) and with the SNL Midwest Thrift Index. The total return assumes reinvestment of all dividends. The graph assumes $100 was invested at the close of business on September 30, 2002.

| | | | | | | | | | | | | | | | | | |
| | | At September 30, |
Index | | 2002 | | 2003 | | 2004 | | 2005 | | 2006 | | 2007 |
Pulaski Financial Corp. | | $ | 100.00 | | $ | 165.52 | | $ | 225.47 | | $ | 310.50 | | $ | 295.56 | | $ | 235.79 |
NASDAQ Composite | | | 100.00 | | | 152.46 | | | 161.84 | | | 183.58 | | | 192.69 | | | 230.49 |
SNL Midwest Thrift Index | | | 100.00 | | | 142.25 | | | 161.05 | | | 167.83 | | | 183.70 | | | 182.97 |
Source: SNL Financial LC, Charlottesville, VA | | | | | | | | | | | | | | | | | | |
CAPITAL RESOURCES
The Company is not subject to any separate capital requirements from those of the Bank. The Bank is required to maintain specific minimum amounts of capital pursuant to Office of Thrift Supervision regulations. These minimum capital standards generally require the maintenance of regulatory capital sufficient to meet each of three tests, hereinafter described as the tangible capital requirement, the core capital requirement and risk-based capital requirement. The tangible capital requirement provides for minimum tangible capital (defined as stockholders’ equity less all intangible assets) equal to 1.5% of adjusted total assets. The core capital requirement provides for minimum core capital (tangible capital plus certain forms of supervisory goodwill and other qualifying intangible assets) equal to 3.0% of adjusted assets. The risk-based capital requirement provides for the maintenance of core capital plus a portion of unallocated loss allowances equal to 8.0% of risk-weighted assets. In computing risk-weighted assets, the Bank multiplies the value of each asset on its balance sheet by a defined risk-weighting factor defined by federal regulations (e.g., one-to four-family conventional residential loans carry a risk-weighted factor of 50%). See note 15 to the consolidated financial statements for a summary of the Bank’s regulatory capital amounts and ratios at September 30, 2007 and 2006.
- 28 -
EFFECTOF INFLATIONAND CHANGING PRICES
The consolidated financial statements and related financial data presented herein have been prepared in accordance with U.S. generally accepted accounting principles, which require the measurement of financial position and operating results in terms of historical dollars, without considering the change in the relative purchasing power of money over time due to inflation. The impact of inflation is reflected in the increased cost of our operations. Unlike most industrial companies, virtually all the assets and liabilities of a financial institution are monetary in nature. As a result, interest rates generally have a more significant impact on a financial institution’s performance than do general levels of inflation. Interest rates do not necessarily move in the same direction or to the same extent as the prices of goods and services.
IMPACTOF RECENTLY ISSUED ACCOUNTING STANDARDS
In May 2005, the Financial Accounting Standards Board (“FASB”) issued Statement No. 154, “Accounting Changes and Error Corrections” (“SFAS No. 154”), a replacement of APB Opinion No. 20, “Accounting Changes,” and FASB Statement No. 3, “Reporting Accounting Changes in Interim Financial Statements.” SFAS No. 154 requires retrospective application for voluntary changes in accounting principles unless it is impracticable to do so. SFAS No. 154 was effective for the Company beginning October 1, 2006. The adoption of SFAS No.154 did not have a material effect on the Company’s financial condition or results of operations.
In February 2006, the FASB issued Statement No. 155, “Accounting for Certain Hybrid Financial Instruments” (“SFAS No. 155”), which amends FASB Statements No. 133 and 140. This Statement permits fair value re-measurement for any hybrid financial instrument containing an embedded derivative that would otherwise require bifurcation, and broadens a Qualified Special Purpose Entity’s (“QSPE”) permitted holdings to include passive derivative financial instruments that pertain to other derivative financial instruments. This statement was effective for the Company for all financial instruments acquired, issued or subject to a re-measurement event occurring on or after October 1, 2006. The adoption of SFAS No. 155 did not have a material effect on the Company’s financial condition or results of operations.
In March 2006, the FASB issued Statement No. 156, “Accounting for Servicing of Financial Assets, an Amendment of FASB Statement No. 140, Accounting for Transfers and Servicing of Financial Assets and Extinguishments of Liabilities” (“SFAS No. 156”), which requires that all separately recognized servicing assets and servicing liabilities be initially measured at fair value, if practicable, and permits the entities to elect either fair value measurement with changes in fair value reflected in earnings or the amortization and impairment requirements of Statement 140 for subsequent measurement. The subsequent measurement of separately recognized servicing assets and servicing liabilities at fair value eliminates the necessity for entities that manage the risks inherent in servicing assets and servicing liabilities with derivatives to qualify for hedge accounting treatment and eliminates the characterization of declines in fair value as impairments or direct write-downs. Statement No. 156 was effective for the Company beginning October 1, 2006. The adoption of SFAS No. 156 did not have a material effect on the Company’s financial condition or results of operations.
In September 2006, the FASB issued Statement No. 157, “Fair Value Measurements” (“SFAS No. 157”), which defines fair value, establishes a framework for measuring fair value in generally accepted accounting standards, and expands disclosures about fair value measurements. SFAS No. 157 is effective for financial statements issued for fiscal years beginning after November 15, 2007, and interim periods within those fiscal years. Management has evaluated the requirements of SFAS No. 157 and believes it will not have a material effect on the Company’s financial condition or results of operations.
In September 2006, the FASB issued Statement No. 158, “Employer’s Accounting for Defined Benefit Pension and Other Postretirement Plans” (“SFAS No. 158”), which requires balance sheet recognition of the funded status of pension and other postretirement benefits with the offset to accumulated other comprehensive income. Employers will recognize actuarial gains and
- 29 -
losses, prior service cost, and any remaining transition amounts when recognizing a plan’s funded status. SFAS No. 158 is effective for fiscal years ending after December 15, 2006. The adoption of SFAS No. 158 did not have a material effect on the Company’s financial condition or results of operations.
In February 2007, the FASB issued Statement No. 159, “The Fair Value Option for Financial Assets and Financial Liabilities—Including an amendment of FASB Statement No. 115” (“SFAS No. 159”). SFAS No. 159 provides companies with an option to report selected financial assets and liabilities at estimated fair value. Most of the provisions of SFAS No. 159 are elective; however, the amendment to SFAS No. 115, Accounting for Certain Investments in Debt and Equity Securities, applies to all entities that own trading and available-for-sale securities. The fair value option created by SFAS No. 159 permits an entity to measure eligible items at fair value as of specified election dates. The fair value option (a) may generally be applied instrument by instrument, (b) is irrevocable unless a new election date occurs, and (c) must be applied to the entire instrument and not to only a portion of the instrument. SFAS No. 159 is effective as of the beginning of an entity’s first fiscal year beginning after November 15, 2007. Early adoption is permitted as of the beginning of the previous fiscal year provided that the entity makes that choice in the first 120 days of the fiscal year, has not yet issued financial statements for any interim period of such year, and also elects to apply the provisions of SFAS No. 157. Management is currently evaluating the requirements of SFAS No. 159 to determine its impact on the Company’s financial condition and results of operations.
In June 2006, the FASB issued Interpretation No. 48, “Accounting for Uncertainty in Income Taxes,” an interpretation of SFAS No. 109, “Accounting for Income Taxes” (“Interpretation No. 48”), which clarifies the accounting for uncertainty in income taxes in financial statements and prescribes a recognition threshold and measurement attribute for financial statement recognition and measurement of a tax position taken or expected to be taken. It also provides guidance on derecognition, classification, interest and penalties, accounting in interim periods, disclosure and transition. Interpretation No. 48 was effective for fiscal years beginning after December 15, 2006. Management determined the adoption of Interpretation No. 48 will not have a material effect on the Company’s financial condition or results of operations.
In September 2006, the SEC Staff issued Staff Accounting Bulletin No. 108 (“SAB No. 108”), “Considering the Effects of Prior Year Misstatements when Quantifying Misstatements in Current Year Financial Statements,” which addresses how the effects of prior year uncorrected misstatements should be considered when quantifying misstatements in current year financial statements. SAB No. 108 requires registrants to quantify misstatements using both the balance sheet and income-statement approaches and to evaluate whether either approach results in quantifying an error that is material in light of relevant quantitative and qualitative factors. When the effect of initial adoption is determined to be material, SAB No. 108 allows registrants to record that effect as a cumulative effect adjustment to beginning retained earnings. The requirements are effective for the Company beginning October 1, 2006. The adoption of SAB No. 108 had no effect on the Company’s financial condition or results of operations.
In September 2006, the Emerging Issues Task Force Issue 06-4, “Accounting for Deferred Compensation and Postretirement Benefit Aspects of Endorsement Split-Dollar Life Insurance Arrangements,” was ratified. This EITF Issue addresses accounting for separate agreements which split life insurance policy benefits between an employer and employee. The Issue requires the employer to recognize a liability for future benefits payable to the employee under these agreements. The effects of applying this Issue must be recognized through either a change in accounting principle through an adjustment to equity or through the retrospective application to all prior periods. For calendar year companies, the Issue is effective beginning January 1, 2008. Early adoption is permitted as of January 1, 2007. Management has evaluated the requirements of the Issue and believes it will not have a material effect on the Company’s financial condition or results of operations.
- 30 -
Management’s Report on
Internal Control Over Financial Reporting
Our management is responsible for establishing and maintaining adequate internal control over financial reporting. Our internal control over financial reporting is a process designed to provide reasonable assurance regarding the reliability of our financial reporting and of the preparation of our consolidated financial statements for external purposes in accordance with U.S. generally accepted accounting principles.
A company’s internal control over financial reporting includes those policies and procedures that (1) pertain to the maintenance of records that, in reasonable detail, accurately and fairly reflect the transactions and dispositions of the assets of the company; (2) provide reasonable assurance that transactions are recorded as necessary to permit preparation of consolidated financial statements in accordance with generally accepted accounting principles, and that receipts and expenditures of the company are being made only in accordance with authorizations of management and directors of the company; and (3) provide reasonable assurance regarding prevention or timely detection of unauthorized acquisition, use, or disposition of the company’s assets that could have a material effect on the consolidated financial statements.
Because of its inherent limitations, internal control over financial reporting may not prevent or detect misstatements. Also, projections of any evaluation of effectiveness to future periods are subject to the risk that controls may become inadequate because of changes in conditions, or that the degree of compliance with the policies or procedures may deteriorate.
Our management assessed the effectiveness of our internal control over financial reporting as of September 30, 2007, using the criteria established in Internal Control-Integrated Framework, issued by the Committee of Sponsoring Organizations of the Treadway Commission (“COSO”). Based on this assessment, management has concluded that, as of September 30, 2007, the Company’s internal control over financial reporting was effective based on those criteria.
Our independent registered public accountants, KPMG LLP, have audited and issued a report on our internal control over financial reporting, which appears in this Annual Report.
- 31 -
Report of Independent Registered Public Accounting Firm
The Board of Directors and Stockholders
Pulaski Financial Corp.:
We have audited the accompanying consolidated balance sheets of Pulaski Financial Corp. and subsidiaries (the Company) as of September 30, 2007 and 2006, and the related consolidated statements of income and comprehensive income, stockholders’ equity, and cash flows for each of the years in the three-year period ended September 30, 2007. We also have audited the Company’s internal control over financial reporting as of September 30, 2007, based on criteria established inInternal Control – Integrated Framework issued by the Committee of Sponsoring Organizations of the Treadway Commission (COSO). The Company’s management is responsible for these consolidated financial statements, for maintaining effective internal control over financial reporting, and for its assessment of the effectiveness of internal control over financial reporting, included in the accompanying Management’s Report on Internal Control over Financial Reporting. Our responsibility is to express an opinion on these consolidated financial statements and an opinion on the Company’s internal control over financial reporting based on our audits.
We conducted our audits in accordance with the standards of the Public Company Accounting Oversight Board (United States). Those standards require that we plan and perform the audits to obtain reasonable assurance about whether the financial statements are free of material misstatement and whether effective internal control over financial reporting was maintained in all material respects. Our audits of the consolidated financial statements included examining, on a test basis, evidence supporting the amounts and disclosures in the financial statements, assessing the accounting principles used and significant estimates made by management, and evaluating the overall financial statement presentation. Our audit of internal control over financial reporting included obtaining an understanding of internal control over financial reporting, assessing the risk that a material weakness exists, and testing and evaluating the design and operating effectiveness of internal control based on the assessed risk. Our audits also included performing such other procedures as we considered necessary in the circumstances. We believe that our audits provide a reasonable basis for our opinion.
A company’s internal control over financial reporting is a process designed to provide reasonable assurance regarding the reliability of financial reporting and the preparation of financial statements for external purposes in accordance with U.S. generally accepted accounting principles. A company’s internal control over financial reporting includes those policies and procedures that (1) pertain to the maintenance of records that, in reasonable detail, accurately and fairly reflect the transactions and dispositions of the assets of the Company; (2) provide reasonable assurance that transactions are recorded as necessary to permit preparation of financial statements in accordance with U.S. generally accepted accounting principles, and that receipts and expenditures of the Company are being made only in accordance with authorizations of management and directors of the Company; and (3) provide reasonable assurance regarding prevention or timely detection of unauthorized acquisition, use, or disposition of the Company’s assets that could have a material effect on the financial statements.
Because of its inherent limitations, internal control over financial reporting may not prevent or detect misstatements. Also, projections of any evaluation of effectiveness to future periods are subject to the risk that controls may become inadequate because of changes in conditions, or that the degree of compliance with the policies or procedures may deteriorate.
In our opinion, the consolidated financial statements referred to above present fairly, in all material respects, the financial position of the Company as of September 30, 2007 and 2006, and the results of their operations and their cash flows for each of the years in the three-year period ended September 30, 2007, in conformity with U.S. generally accepted accounting principles. Also in our opinion, the Company maintained, in all material respects, effective internal control over financial reporting as of September 30, 2007, based on criteria established inInternal Control – Integrated Framework issued by the Committee of Sponsoring Organizations of the Treadway Commission.
- 32 -
As discussed in note 1 to the consolidated financial statements, the Company adopted Statement of Financial Accounting Standards No. 123(R),Share-Based Payment, on October 1, 2005.
/s/ KPMG LLP
St. Louis, Missouri
December 13, 2007
- 33 -
PULASKI FINANCIAL CORP. AND SUBSIDIARIES
CONSOLIDATED BALANCE SHEETS
SEPTEMBER 30, 2007 and 2006
| | | | | | | | |
| | | 2007 | | | 2006 | |
ASSETS | | | | | | | | |
Cash and amounts due from depository institutions | | $ | 20,438,008 | | | $ | 19,092,687 | |
Federal funds sold and overnight deposits | | | 3,236,735 | | | | 3,030,571 | |
| | | | | | | | |
Total cash and cash equivalents | | | 23,674,743 | | | | 22,123,258 | |
Interest-bearing time deposits in other banks | | | 99,000 | | | | 792,000 | |
Equity securities available for sale, at fair value | | | 3,964,629 | | | | 4,517,259 | |
Debt securities available for sale, at fair value | | | 7,043,172 | | | | — | |
Debt securities held to maturity, at amortized cost (fair value of $5,979,231 and $12,874,121 at September 30, 2007 and 2006, respectively) | | | 5,979,878 | | | | 12,932,036 | |
Mortgage-backed securities held to maturity, at amortized cost (fair value of $399,629 and $469,713 at September 30, 2007 and 2006, respectively) | | | 371,480 | | | | 441,266 | |
Mortgage-backed securities available for sale, at fair value | | | 2,655,202 | | | | 3,190,125 | |
Capital stock of Federal Home Loan Bank, at cost | | | 8,305,500 | | | | 9,524,300 | |
Loans receivable held for sale, at lower of cost or market | | | 58,536,280 | | | | 60,452,054 | |
Loans receivable (net of allowance for loan losses of $10,421,304 and $7,817,317 at September 30, 2007 and 2006, respectively) | | | 949,826,147 | | | | 785,199,024 | |
Real estate acquired in settlement of loans (net of allowance for losses of $74,035 and $26,350 at September 30, 2007 and 2006, respectively) | | | 3,089,656 | | | | 2,764,167 | |
Premises and equipment, net | | | 20,389,445 | | | | 18,165,840 | |
Goodwill | | | 3,938,524 | | | | 3,938,524 | |
Core deposit intangible | | | 500,668 | | | | 657,802 | |
Accrued interest receivable | | | 6,605,153 | | | | 5,532,177 | |
Bank-owned life insurance | | | 25,059,509 | | | | 24,043,698 | |
Deferred tax asset | | | 5,050,795 | | | | 4,801,276 | |
Other assets | | | 6,375,126 | | | | 3,392,322 | |
| | | | | | | | |
TOTAL ASSETS | | $ | 1,131,464,907 | | | $ | 962,467,128 | |
| | | | | | | | |
LIABILITIES AND STOCKHOLDERS’ EQUITY | | | | | | | | |
LIABILITIES: | | | | | | | | |
Deposits | | $ | 835,488,696 | | | $ | 655,576,578 | |
Advances from Federal Home Loan Bank | | | 158,400,000 | | | | 172,800,000 | |
Note payable | | | 2,980,000 | | | | 3,320,000 | |
Subordinated debentures | | | 19,589,000 | | | | 19,589,000 | |
Advance payments by borrowers for taxes and insurance | | | 2,957,793 | | | | 3,054,713 | |
Accrued interest payable | | | 2,530,722 | | | | 1,800,764 | |
Due to other banks | | | 17,484,741 | | | | 22,066,374 | |
Other liabilities | | | 11,229,464 | | | | 8,433,153 | |
| | | | | | | | |
Total liabilities | | | 1,050,660,416 | | | | 886,640,582 | |
| | | | | | | | |
STOCKHOLDERS’ EQUITY : | | | | | | | | |
Preferred stock - $.01 par value per share, 1,000,000 shares authorized; none issued | | | — | | | | — | |
Common stock - $.01 par value per share, 18,000,000 shares authorized; 13,068,618 shares issued at September 30, 2007 and 2006, respectively | | | 130,687 | | | | 130,687 | |
Treasury stock - at cost (3,133,228 and 3,122,275 shares at September 30, 2007 and 2006, respectively) | | | (17,040,449 | ) | | | (15,982,452 | ) |
Treasury stock - Equity Trust (230,225 and 255,053 shares at September 30, 2007 and 2006, respectively) | | | (3,030,198 | ) | | | (3,131,404 | ) |
Additional paid-in capital | | | 50,560,264 | | | | 50,067,003 | |
Accumulated other comprehensive loss, net | | | (66,283 | ) | | | (12,933 | ) |
Retained earnings | | | 50,250,470 | | | | 44,755,645 | |
| | | | | | | | |
Total stockholders’ equity | | | 80,804,491 | | | | 75,826,546 | |
| | | | | | | | |
TOTAL LIABILITIES AND STOCKHOLDERS’ EQUITY | | $ | 1,131,464,907 | | | $ | 962,467,128 | |
| | | | | | | | |
See accompanying notes to the consolidated financial statements.
- 34 -
PULASKI FINANCIAL CORP. AND SUBSIDIARIES
CONSOLIDATED STATEMENTS OF INCOME AND COMPREHENSIVE INCOME
YEARS ENDED SEPTEMBER 30, 2007, 2006 AND 2005
| | | | | | | | | | | | |
| | | 2007 | | | 2006 | | | 2005 | |
INTEREST AND DIVIDEND INCOME: | | | | | | | | | | | | |
Loans receivable | | $ | 69,212,344 | | | $ | 52,591,369 | | | $ | 36,929,615 | |
Securities | | | 766,620 | | | | 489,020 | | | | 201,789 | |
Mortgage-backed securities | | | 157,947 | | | | 202,196 | | | | 273,584 | |
FHLB stock | | | 441,599 | | | | 327,261 | | | | 221,709 | |
Other | | | 232,702 | | | | 233,080 | | | | 165,308 | |
| | | | | | | | | | | | |
Total interest income | | | 70,811,212 | | | | 53,842,926 | | | | 37,792,005 | |
| | | | | | | | | | | | |
INTEREST EXPENSE: | | | | | | | | | | | | |
Deposits | | | 31,337,497 | | | | 19,624,756 | | | | 10,223,448 | |
Advances from Federal Home Loan Bank | | | 8,755,206 | | | | 7,777,403 | | | | 5,413,691 | |
Note payable | | | 225,964 | | | | 235,483 | | | | 175,749 | |
Subordinated debentures | | | 1,515,214 | | | | 1,389,369 | | | | 919,331 | |
| | | | | | | | | | | | |
Total interest expense | | | 41,833,881 | | | | 29,027,011 | | | | 16,732,219 | |
| | | | | | | | | | | | |
NET INTEREST INCOME | | | 28,977,331 | | | | 24,815,915 | | | | 21,059,786 | |
PROVISION FOR LOAN LOSSES | | | 3,855,257 | | | | 1,501,375 | | | | 1,634,651 | |
| | | | | | | | | | | | |
NET INTEREST INCOME AFTER PROVISION FOR LOAN LOSSES | | | 25,122,074 | | | | 23,314,540 | | | | 19,425,135 | |
| | | | | | | | | | | | |
NON-INTEREST INCOME: | | | | | | | | | | | | |
Retail banking fees | | | 3,414,779 | | | | 3,033,494 | | | | 2,467,011 | |
Mortgage revenues | | | 4,844,663 | | | | 4,861,613 | | | | 5,507,958 | |
(Loss) gain on loan pool sales | | | — | | | | (122,299 | ) | | | 223,892 | |
Title policy revenues | | | 844,378 | | | | 741,654 | | | | 756,309 | |
Investment broker revenues | | | 662,566 | | | | 597,814 | | | | 667,633 | |
Appraisal revenues | | | 1,020,938 | | | | 185,700 | | | | — | |
Insurance commissions | | | 37,793 | | | | 216,279 | | | | 207,282 | |
Gain on sales of securities available for sale | | | 273,170 | | | | 123,188 | | | | — | |
Gain on sale of branch | | | — | | | | 2,473,853 | | | | — | |
Bank-owned life insurance income | | | 1,015,811 | | | | 846,718 | | | | 596,441 | |
Other | | | 696,597 | | | | 590,836 | | | | 451,003 | |
| | | | | | | | | | | | |
Total non-interest income | | | 12,810,695 | | | | 13,548,850 | | | | 10,877,529 | |
| | | | | | | | | | | | |
NON-INTEREST EXPENSE: | | | | | | | | | | | | |
Salaries and employee benefits | | | 12,374,727 | | | | 10,444,901 | | | | 9,238,993 | |
Occupancy, equipment and data processing expense | | | 5,760,423 | | | | 5,083,266 | | | | 4,179,910 | |
Advertising | | | 1,424,076 | | | | 1,124,269 | | | | 845,185 | |
Professional services | | | 1,352,862 | | | | 1,236,742 | | | | 1,009,765 | |
Postage, document delivery and office supplies expense | | | 1,023,901 | | | | 988,831 | | | | 733,653 | |
(Gain) loss on derivative instruments | | | (586,310 | ) | | | 194,330 | | | | 320,312 | |
Real estate foreclosure expense and losses, net | | | 481,707 | | | | 227,595 | | | | 21,952 | |
Data processing termination expense | | | 219,534 | | | | — | | | | — | |
Charitable contributions | | | 122,780 | | | | 372,728 | | | | 113,754 | |
Other | | | 2,275,137 | | | | 1,928,000 | | | | 1,942,143 | |
| | | | | | | | | | | | |
Total non-interest expense | | | 24,448,837 | | | | 21,600,662 | | | | 18,405,667 | |
| | | | | | | | | | | | |
INCOME BEFORE INCOME TAXES | | | 13,483,932 | | | | 15,262,728 | | | | 11,896,997 | |
INCOME TAXES | | | 4,501,293 | | | | 5,424,675 | | | | 4,418,099 | |
| | | | | | | | | | | | |
NET INCOME | | $ | 8,982,639 | | | $ | 9,838,053 | | | $ | 7,478,898 | |
| | | | | | | | | | | | |
OTHER COMPREHENSIVE INCOME - Unrealized gain (loss) on securities available-for-sale (net of income taxes in 2007, 2006 and 2005 of $29,357, $6,250 and $25,703, respectively) | | | (53,350 | ) | | | 10,196 | | | | (41,936 | ) |
| | | | | | | | | | | | |
COMPREHENSIVE INCOME | | $ | 8,929,289 | | | $ | 9,848,249 | | | $ | 7,436,962 | |
| | | | | | | | | | | | |
Per share amounts: | | | | | | | | | | | | |
Basic earnings per share | | $ | 0.92 | | | $ | 1.07 | | | $ | 0.94 | |
Basic weighted average common shares outstanding | | | 9,814,396 | | | | 9,205,525 | | | | 7,925,674 | |
Diluted earnings per share | | $ | 0.88 | | | $ | 1.01 | | | $ | 0.85 | |
Diluted weighted average common shares outstanding | | | 10,255,702 | | | | 9,717,733 | | | | 8,828,224 | |
See accompanying notes to the consolidated financial statements.
- 35 -
PULASKI FINANCIAL CORP. AND SUBSIDIARIES
CONSOLIDATED STATEMENTS OF STOCKHOLDERS’ EQUITY
YEARS ENDED SEPTEMBER 30, 2006 AND 2005
| | | | | | | | | | | | | | | | | | | | | | | | | | | |
| | | Common
Stock | | Treasury Stock | | | Additional
Paid-In
Capital | | | Unearned
ESOP
Shares | | | Accumulated
Other
Comprehensive
Income (Loss), Net | | | Retained
Earnings | | | Total | |
BALANCE, SEPTEMBER 30, 2004 | | $ | 119,187 | | $ | (20,711,724 | ) | | $ | 28,803,897 | | | $ | (183,773 | ) | | $ | 18,807 | | | $ | 32,927,177 | | | $ | 40,973,571 | |
Comprehensive income: | | | | | | | | | | | | | | | | | | | | | | | | | | | |
Net income | | | — | | | — | | | | — | | | | — | | | | | | | | 7,478,898 | | | | 7,478,898 | |
Unrealized loss on investment securities, net of tax | | | — | | | — | | | | — | | | | — | | | | (41,936 | ) | | | — | | | | (41,936 | ) |
| | | | | | | | | | | | | | | | | | | | | | | | | | | |
Total comprehensive income | | | — | | | — | | | | — | | | | — | | | | (41,936 | ) | | | 7,478,898 | | | | 7,436,962 | |
Dividends ($0.28 per share) | | | — | | | — | | | | — | | | | — | | | | — | | | | (2,335,914 | ) | | | (2,335,914 | ) |
Stock options exercised | | | — | | | 819,420 | | | | 154,613 | | | | — | | | | — | | | | — | | | | 974,033 | |
Non-cash compensation expense for stock option grants | | | — | | | — | | | | 3,923 | | | | — | | | | — | | | | — | | | | 3,923 | |
Stock repurchased (13,717 shares) | | | — | | | (190,194 | ) | | | — | | | | — | | | | — | | | | — | | | | (190,194 | ) |
Equity trust shares purchased | | | — | | | (1,054,095 | ) | | | 1,054,095 | | | | — | | | | — | | | | — | | | | — | |
Release of ESOP shares | | | — | | | — | | | | 577,969 | | | | 183,773 | | | | — | | | | — | | | | 761,742 | |
Net restricted shares issued | | | — | | | 10,940 | | | | (10,940 | ) | | | — | | | | — | | | | — | | | | — | |
Tax benefit for non-qualified stock options and restricted shares awards | | | — | | | — | | | | 532,707 | | | | — | | | | — | | | | — | | | | 532,707 | |
Amortization of restricted shares | | | — | | | — | | | | 89,634 | | | | — | | | | — | | | | — | | | | 89,634 | |
| | | | | | | | | | | | | | | | | | | | | | | | | | | |
BALANCE, SEPTEMBER 30, 2005 | | $ | 119,187 | | $ | (21,125,653 | ) | | $ | 31,205,898 | | | $ | — | | | $ | (23,129 | ) | | $ | 38,070,161 | | | $ | 48,246,464 | |
Comprehensive income: | | | | | | | | | | | | | | | | | | | | | | | | | | | |
Net income | | | — | | | — | | | | — | | | | — | | | | | | | | 9,838,053 | | | | 9,838,053 | |
Change in unrealized gain on investment securities, net of tax | | | — | | | — | | | | — | | | | — | | | | 89,652 | | | | — | | | | 89,652 | |
Less: reclassification adjustment for realized gain on sale of investment securities included in net income, net of tax | | | — | | | — | | | | — | | | | — | | | | (79,456 | ) | | | — | | | | (79,456 | ) |
| | | | | | | | | | | | | | | | | | | | | | | | | | | |
Total comprehensive income | | | — | | | — | | | | — | | | | — | | | | 10,196 | | | | 9,838,053 | | | | 9,848,249 | |
Common stock offering (1,150,000 shares) | | | 11,500 | | | | | | | 16,127,730 | | | | | | | | | | | | | | | | 16,139,230 | |
Dividends ($0.33 per share) | | | — | | | — | | | | — | | | | — | | | | — | | | | (3,152,569 | ) | | | (3,152,569 | ) |
Stock issued for acquisitions (210,732 shares) | | | — | | | 776,126 | | | | 2,915,899 | | | | — | | | | — | | | | — | | | | 3,692,025 | |
Stock issued for dividend reinvestment plan (17,152 shares) | | | — | | | 63,171 | | | | 213,411 | | | | — | | | | — | | | | — | | | | 276,582 | |
Stock options exercised | | | — | | | 497,545 | | | | 299,884 | | | | — | | | | — | | | | — | | | | 797,429 | |
Stock option and award expense | | | — | | | — | | | | 344,666 | | | | — | | | | — | | | | — | | | | 344,666 | |
Stock repurchased (5,296 shares) | | | — | | | (88,301 | ) | | | — | | | | — | | | | — | | | | — | | | | (88,301 | ) |
Equity trust shares purchased (122,538 shares) | | | — | | | (1,959,000 | ) | | | — | | | | — | | | | — | | | | — | | | | (1,959,000 | ) |
Release of equity trust shares | | | — | | | 2,724,098 | | | | (2,724,098 | ) | | | — | | | | — | | | | — | | | | — | |
Tax benefit for release of equity trust shares | | | — | | | — | | | | 800,000 | | | | — | | | | — | | | | — | | | | 800,000 | |
Amortization of equity trust expense | | | — | | | — | | | | 806,098 | | | | — | | | | — | | | | — | | | | 806,098 | |
Excess tax benefit from stock-based compensation | | | — | | | — | | | | 75,673 | | | | — | | | | — | | | | — | | | | 75,673 | |
Forfeiture of restricted shares | | | — | | | (1,842 | ) | | | 1,842 | | | | — | | | | — | | | | — | | | | — | |
| | | | | | | | | | | | | | | | | | | | | | | | | | | |
BALANCE, SEPTEMBER 30, 2006 | | $ | 130,687 | | $ | (19,113,856 | ) | | $ | 50,067,003 | | | $ | — | | | $ | (12,933 | ) | | $ | 44,755,645 | | | $ | 75,826,546 | |
| | | | | | | | | | | | | | | | | | | | | | | | | | | |
See accompanying notes to the consolidated financial statements.
- 36 -
PULASKI FINANCIAL CORP. AND SUBSIDIARIES
CONSOLIDATED STATEMENTS OF STOCKHOLDERS’ EQUITY
YEAR ENDED SEPTEMBER 30, 2007
| | | | | | | | | | | | | | | | | | | | | | | |
| | | Common
Stock | | Treasury Stock | | | Additional
Paid-In
Capital | | | Accumulated
Other
Comprehensive
Income (Loss), Net | | | Retained
Earnings | | | Total | |
BALANCE, SEPTEMBER 30, 2006 | | $ | 130,687 | | $ | (19,113,856 | ) | | $ | 50,067,003 | | | $ | (12,933 | ) | | $ | 44,755,645 | | | $ | 75,826,546 | |
Net income | | | — | | | — | | | | — | | | | | | | | 8,982,639 | | | | 8,982,639 | |
Change in unrealized loss on investment securities, net of tax | | | — | | | — | | | | — | | | | (82,707 | ) | | | — | | | | (82,707 | ) |
Less: reclassification adjustment for realized loss on sale of investment securities included in net income, net of tax | | | — | | | — | | | | — | | | | 29,357 | | | | — | | | | 29,357 | |
| | | | | | | | | | | | | | | | | | | | | | | |
Total comprehensive income | | | — | | | — | | | | — | | | | (66,283 | ) | | | 8,982,639 | | | | 8,929,289 | |
Dividends ($0.35 per share) | | | — | | | — | | | | — | | | | — | | | | (3,487,814 | ) | | | (3,487,814 | ) |
Stock issued for dividend reinvestment plan (25,817 shares) | | | — | | | 106,838 | | | | 286,223 | | | | — | | | | | | | | 393,061 | |
Stock options exercised | | | — | | | 250,710 | | | | 145,126 | | | | — | | | | — | | | | 395,836 | |
Stock option and award expense | | | — | | | — | | | | 307,128 | | | | — | | | | — | | | | 307,128 | |
Stock repurchased (97,337 shares) | | | — | | | (1,415,545 | ) | | | | | | | — | | | | — | | | | (1,415,545 | ) |
Equity trust shares purchased (88,188 shares) | | | — | | | (1,248,787 | ) | | | — | | | | — | | | | — | | | | (1,248,787 | ) |
Release of equity trust shares | | | — | | | 1,349,993 | | | | (1,349,993 | ) | | | — | | | | — | | | | — | |
Equity trust expense | | | — | | | — | | | | 876,344 | | | | — | | | | — | | | | 876,344 | |
Tax benefit for release of equity trust shares | | | | | | | | | | 150,824 | | | | | | | | | | | | 150,824 | |
Excess tax benefit from stock-based compensation | | | — | | | — | | | | 77,609 | | | | — | | | | — | | | | 77,609 | |
| | | | | | | | | | | | | | | | | | | | | | | |
BALANCE, SEPTEMBER 30, 2007 | | $ | 130,687 | | $ | (20,070,647 | ) | | $ | 50,560,264 | | | $ | (66,283 | ) | | $ | 50,250,470 | | | $ | 80,804,491 | |
| | | | | | | | | | | | | | | | | | | | | | | |
See accompanying notes to the consolidated financial statements.
- 37 -
PULASKI FINANCIAL CORP. AND SUBSIDIARIES
CONSOLIDATED STATEMENTS OF CASH FLOWS
YEARS ENDED SEPTEMBER 30, 2007, 2006 AND 2005
| | | | | | | | | | | | |
| | | 2007 | | | 2006 | | | 2005 | |
CASH FLOWS FROM OPERATING ACTIVITIES: | | | | | | | | | | | | |
Net income | | $ | 8,982,639 | | | $ | 9,838,053 | | | $ | 7,478,898 | |
Adjustments to reconcile net income to net cash from operating activities: | | | | | | | | | | | | |
Depreciation, amortization and accretion: | | | | | | | | | | | | |
Premises and equipment | | | 1,503,735 | | | | 1,362,318 | | | | 1,254,327 | |
Net deferred loan costs | | | 3,208,157 | | | | 2,967,165 | | | | 2,478,794 | |
Net amortization of debt and equity securities premiums/discounts | | | (589,462 | ) | | | (308,323 | ) | | | (18,124 | ) |
Broker fees financed under interest-rate swap agreements | | | 196,932 | | | | 196,932 | | | | 135,621 | |
Equity trust expense | | | 876,344 | | | | 806,098 | | | | 1,007,178 | |
Stock option and award expense | | | 307,128 | | | | 344,666 | | | | 93,557 | |
ESOP shares committed to be released | | | — | | | | — | | | | 761,742 | |
Deferred taxes | | | (249,519 | ) | | | (641,767 | ) | | | (1,216,599 | ) |
Provision for loan losses | | | 3,855,257 | | | | 1,501,375 | | | | 1,634,651 | |
Provision for losses on real estate acquired in settlement of loans | | | 115,535 | | | | 102,884 | | | | 126,422 | |
Losses on sale of real estate acquired in settlement of loans | | | 144,321 | | | | 91,762 | | | | 37,505 | |
Originations of loans receivable for sale to correspondent lenders | | | (1,329,923,226 | ) | | | (1,142,429,279 | ) | | | (1,059,106,580 | ) |
Proceeds from sales of loans to correspondent lenders | | | 1,335,480,589 | | | | 1,150,218,994 | | | | 1,048,600,196 | |
Gain on sale of loans held for sale | | | (3,641,589 | ) | | | (3,906,994 | ) | | | (4,676,602 | ) |
Loss (gain) on sale of loan pools | | | — | | | | 122,299 | | | | (223,892 | ) |
Gain on sale of securities-AFS | | | (273,170 | ) | | | (123,188 | ) | | | — | |
Gain on sale of branch, net of expenses | | | — | | | | (2,473,852 | ) | | | — | |
(Gain) loss on derivative instruments | | | (586,310 | ) | | | 194,330 | | | | 320,312 | |
Increase in cash value of bank-owned life insurance policies | | | (1,015,811 | ) | | | (845,105 | ) | | | (592,988 | ) |
Tax benefit for release of equity trust shares | | | (150,824 | ) | | | (800,000 | ) | | | — | |
Excess tax benefit from stock-based compensation | | | (77,609 | ) | | | (75,673 | ) | | | — | |
Tax benefit from non-qualified stock options and restricted stock awards | | | — | | | | — | | | | 532,707 | |
Changes in other assets and liabilities | | | 416,932 | | | | 709,565 | | | | 127,915 | |
| | | | | | | | | | | | |
Net adjustments | | | 9,597,410 | | | | 7,014,207 | | | | (8,723,858 | ) |
| | | | | | | | | | | | |
Net cash provided by (used in) operating activities | | | 18,580,049 | | | | 16,852,260 | | | | (1,244,960 | ) |
| | | | | | | | | | | | |
CASH FLOWS FROM INVESTING ACTIVITIES: | | | | | | | | | | | | |
Cash received from branch acquisition, net of cash and cash equivalents received | | $ | — | | | $ | 15,733,736 | | | $ | — | |
Cash paid on sale of branch | | | — | | | | (19,448,123 | ) | | | — | |
Proceeds from sales of debt securities-AFS | | | 5,938,598 | | | | 7,390,758 | | | | — | |
Proceeds from sales of mortgage-backed securities-AFS | | | — | | | | 779,618 | | | | — | |
Proceeds from maturities of time deposits | | | 693,000 | | | | 1,287,000 | | | | — | |
Proceeds from maturities of debt securities-AFS | | | — | | | | 450,000 | | | | 9,250,000 | |
Proceeds from maturities of debt securities-HTM | | | 51,000,000 | | | | 34,000,000 | | | | 2,015,000 | |
Proceeds from redemption of FHLB stock | | | 12,858,200 | | | | 12,313,500 | | | | 6,714,600 | |
Purchases of bank-owned life insurance policies | | | — | | | | (7,100,000 | ) | | | (3,500,000 | ) |
Purchases of debt securities-AFS | | | (12,321,729 | ) | | | (592,070 | ) | | | (488,479 | ) |
Purchases of debt securities-HTM | | | (43,465,822 | ) | | | (40,643,057 | ) | | | (7,972,308 | ) |
Purchases of FHLB stock | | | (11,639,400 | ) | | | (13,262,000 | ) | | | (7,639,400 | ) |
Principal payments received on mortgage-backed securities | | | 653,062 | | | | 1,162,551 | | | | 1,645,701 | |
Proceeds from sale of loan pools | | | — | | | | 13,862,739 | | | | 10,916,496 | |
Net increase in loans | | | (176,734,957 | ) | | | (163,119,464 | ) | | | (138,886,480 | ) |
Proceeds from sales of real estate acquired in settlement of loans receivable | | | 4,459,075 | | | | 2,423,215 | | | | 1,619,100 | |
Proceeds from disposal of equipment | | | 2,528 | | | | 26,641 | | | | 94,472 | |
Purchases of premises and equipment | | | (3,729,868 | ) | | | (4,260,358 | ) | | | (4,880,861 | ) |
Cash paid for investment in joint venture | | | (100,000 | ) | | | (67,620 | ) | | | (133,810 | ) |
| | | | | | | | | | | | |
Net cash used in investing activities | | $ | (172,387,313 | ) | | $ | (159,062,934 | ) | | $ | (131,245,969 | ) |
| | | | | | | | | | | | |
See accompanying notes to the consolidated financial statements.
- 38 -
PULASKI FINANCIAL CORP. AND SUBSIDIARIES
CONSOLIDATED STATEMENTS OF CASH FLOWS
YEARS ENDED SEPTEMBER 30, 2007, 2006 AND 2005
| | | | | | | | | | | | |
| | | 2007 | | | 2006 | | | 2005 | |
CASH FLOWS FROM FINANCING ACTIVITIES: | | | | | | | | | | | | |
Net increase in deposits | | $ | 179,912,118 | | | $ | 115,655,886 | | | $ | 114,747,559 | |
Proceeds from Federal Home Loan Bank advances, net | | | (14,400,000 | ) | | | 1,800,000 | | | | 16,400,000 | |
Payment on note payable | | | (340,000 | ) | | | (255,000 | ) | | | (255,000 | ) |
Proceeds from issuance of subordinated debentures | | | — | | | | — | | | | 10,310,000 | |
Net (decrease) increase in due to other banks | | | (4,581,633 | ) | | | 8,430,762 | | | | (828,079 | ) |
Net (decrease) increase in advance payments by borrowers for taxes and insurance | | | (96,920 | ) | | | 124,754 | | | | 114,994 | |
Proceeds from common stock offering | | | — | | | | 16,139,230 | | | | — | |
Proceeds from stock options exercised | | | 395,836 | | | | 797,429 | | | | 974,033 | |
Purchase of equity trust shares | | | (1,248,787 | ) | | | (1,959,000 | ) | | | (1,054,095 | ) |
Dividends paid on common stock | | | (3,487,814 | ) | | | (3,152,569 | ) | | | (2,335,914 | ) |
Tax benefit for release of equity trust shares | | | 150,824 | | | | 800,000 | | | | — | |
Excess tax benefit from stock-based compensation | | | 77,609 | | | | 75,673 | | | | — | |
Proceeds from cash received in dividend reinvestment plan | | | 393,061 | | | | 276,582 | | | | — | |
Common stock repurchased | | | (1,415,545 | ) | | | (88,301 | ) | | | (190,194 | ) |
| | | | | | | | | | | | |
Net cash provided by financing activities | | | 155,358,749 | | | | 138,645,446 | | | | 137,883,304 | |
| | | | | | | | | | | | |
NET INCREASE (DECREASE) IN CASH AND CASH EQUIVALENTS | | | 1,551,485 | | | | (3,565,228 | ) | | | 5,392,375 | |
CASH AND CASH EQUIVALENTS AT BEGINNING OF YEAR | | | 22,123,258 | | | | 25,688,486 | | | | 20,296,111 | |
| | | | | | | | | | | | |
CASH AND CASH EQUIVALENTS AT END OF YEAR | | $ | 23,674,743 | | | $ | 22,123,258 | | | $ | 25,688,486 | |
| | | | | | | | | | | | |
SUPPLEMENTAL DISCLOSURES OF CASH FLOW INFORMATION: | | | | | | | | | | | | |
Cash paid during the year for: | | | | | | | | | | | | |
Interest on deposits | | $ | 30,597,916 | | | $ | 18,980,468 | | | $ | 9,658,421 | |
Interest on advances from Federal Home Loan Bank | | | 8,763,871 | | | | 7,745,363 | | | | 5,387,059 | |
Interest on subordinated debentures | | | 1,516,169 | | | | 1,373,137 | | | | 890,697 | |
Interest on note payable | | | 225,967 | | | | 222,868 | | | | 170,512 | |
| | | | | | | | | | | | |
Cash paid during year for interest | | | 41,103,923 | | | | 28,321,836 | | | | 16,106,689 | |
Income taxes, net | | | 3,219,825 | | | | 6,707,644 | | | | 4,692,461 | |
NON-CASH INVESTING ACTIVITIES: | | | | | | | | | | | | |
Real estate acquired in settlement of loans receivable | | | 5,044,420 | | | | 4,627,832 | | | | 1,469,342 | |
See accompanying notes to the consolidated financial statements.
- 39 -
PULASKI FINANCIAL CORP. AND SUBSIDIARIES
NOTES TO THE CONSOLIDATED FINANCIAL STATEMENTS
YEARS ENDED SEPTEMBER 30, 2007, 2006 AND 2005
| 1. | SUMMARY OF SIGNIFICANT ACCOUNTING POLICIES |
Pulaski Financial Corp. (the “Company”) is the holding company for Pulaski Bank (the “Bank”). The Company’s primary assets are the outstanding shares of the Bank, cash, and equity investments in other financial institutions. The Company also maintains two special purpose subsidiaries that issue trust preferred securities. Management of the Company and the Bank are substantially similar and the Company neither owns nor leases any property, but instead uses the premises, equipment and furniture of the Bank. Accordingly, the information in the consolidated financial statements relates primarily to the Bank.
The Company, through the Bank, operates in a single business segment, which is a community-oriented financial institution providing traditional financial services through the operation of eleven full-service bank locations in the St. Louis metropolitan area at September 30, 2007 and three loan production offices in the Kansas City metropolitan area and the Illinois portion of the St. Louis metropolitan area. The Bank is engaged primarily in the business of attracting deposits from the general public and using these and other funds to originate a variety of residential, commercial and consumer loans within the Bank’s lending market areas. The Bank is an approved lender/servicer for the Federal Housing Administration (“FHA”) and the Veterans Administration (“VA”), as well as for the Missouri Housing Development Commission (a government agency established to provide home buying opportunities for low income first time home buyers).
The accounting and reporting policies and practices of the Company and its subsidiaries conform to U.S. generally accepted accounting principles and to prevailing practices within the banking industry. A summary of the Company’s significant accounting policies follows:
Principles of Consolidation - The consolidated financial statements include the accounts of Pulaski Financial Corp. and its wholly owned subsidiary, Pulaski Bank, and its wholly owned subsidiary, Pulaski Service Corporation. All significant intercompany transactions have been eliminated in consolidation.
Use of Estimates - The preparation of these consolidated financial statements in conformity with U.S. generally accepted accounting principles requires management to make estimates and assumptions that affect the reported amounts of assets and liabilities and disclosure of contingent assets and liabilities at the date of the financial statements, and that affect the reported amounts of revenues and expenses during the reporting periods. Actual results could differ from those estimates. The allowance for loan losses and fair values of financial instruments are significant estimates reported within the consolidated financial statements.
Cash and Cash Equivalents - For purposes of reporting cash flows, cash and cash equivalents include cash and amounts due from depository institutions, cash in transit, cash in the process of collection, federal funds sold, and overnight deposits at the Federal Home Loan Bank. Generally, federal funds sold mature in one-day periods.
Securities and Mortgage-Backed Securities Available for Sale - Securities and mortgage-backed securities available for sale are recorded at their current fair value, adjusted for amortization of premiums and accretion of discounts, which are recognized as adjustments to interest income over the life of the securities using the level-yield method. Unrealized gains or losses on securities and mortgage-backed securities available for sale are included in a separate component of stockholders’ equity, net of deferred income taxes. Gains or losses on the disposition of securities and mortgage-backed securities available for sale are recognized using the specific identification method. Estimated fair values of securities and mortgage-backed securities available for sale are based on quoted market prices when available. If quoted market prices are not available, fair values are estimated using quoted market prices for similar instruments.
- 40 -
To the extent management determines a decline in the value of a security or mortgage-backed security available for sale to be other than temporary, the Bank will adjust the carrying value and include such expense in the consolidated statements of income and comprehensive income during the period in which such decline occurs.
Securities and Mortgage-Backed Securities Held to Maturity - Securities and mortgage-backed securities held to maturity are stated at cost, adjusted for amortization of premiums and accretion of discounts, since the Company has both the ability and intent to hold the securities to maturity. Premium amortization and discount accretion are recognized as adjustments to interest income over the life of the securities using the level-yield method.
To the extent management determines a decline in the value of a security or mortgage-backed security held to maturity to be other than temporary, the Company will adjust the carrying value and include such expense in the consolidated statements of income and comprehensive income during the period in which such decline occurs.
Capital Stock of the Federal Home Loan Bank - Capital stock of the Federal Home Loan Bank (“FHLB”) of Des Moines is carried at cost. Dividends received on such stock are reflected as interest and dividend income in the consolidated statements of income and comprehensive income.
Loans Receivable Held-for-Sale - Loans receivable held-for-sale consist of loans that management does not intend to hold until maturity and are reflected at the lower of cost or market. Such loans are generally committed to be sold to investors on a best-efforts basis with servicing released. Accordingly, market values for such loans are based on commitment prices. Gains or losses on loan sales are recognized at the time of sale and are determined by the difference between net sales proceeds and the principal balance of the loans sold, adjusted for net deferred loan fees or costs. Loan origination and commitment fees, net of certain direct loan origination costs, are deferred until the sale of the loan.
Loans Receivable - Loans receivable are stated at the principal amounts outstanding adjusted for premiums, discounts, deferred loan costs, loans in process and the allowance for loan losses. Premiums and discounts on purchased loans are amortized or accreted to interest income using the level-yield method over the estimated lives of the related loans. Loan origination and commitment fees on originated loans, net of certain direct loan origination costs, are deferred and amortized to interest income using the level-yield method over the estimated lives of the related loans. Interest on loans is accrued based upon the principal amounts outstanding. The Bank’s policy is to discontinue the accrual of interest income on any loan when, in the opinion of management, there is reasonable doubt as to the timely collectibility of interest or principal. When a loan is placed on non-accrual status, previously accrued but unpaid interest is charged to current income. Subsequent collections of cash may be applied as reductions to the principal balance, interest in arrears, or recorded as income depending on management’s assessment of the ultimate collectibility of the loan. Non-accrual loans are returned to accrual status when, in the opinion of management, the financial position of the borrower indicates there is no longer any reasonable doubt as to the timely collectibility of interest or principal.
Allowance for Loan Losses-The Company maintains an allowance for loan losses to absorb probable losses in the Company’s loan portfolio. Loan losses are charged against and recoveries are credited to the allowance. Provisions for loan losses are charged to income and credited to the allowance in an amount necessary to maintain an appropriate allowance given risks identified in the portfolio. The allowance is based upon management’s quarterly estimates of probable losses inherent in the loan portfolio. Management’s estimates are determined through a method of quantifying certain risks in the portfolio that are affected primarily by changes in the nature and volume of the portfolio combined with an analysis of past-due and classified loans, and can also be affected by the following factors: changes in lending policies and procedures, including underwriting standards and collections, charge-off and recovery practices, changes in national and local economic conditions and developments, assessment of collateral values based on independent appraisals, and changes in the experience, ability, and depth of lending management staff.
- 41 -
The following assessments are performed quarterly in accordance with the Company’s allowance for loan losses methodology:
Homogeneous residential mortgage loans are given one of five standard risk ratings at the time of origination. The risk ratings are assigned through the use of a credit scoring model, which assesses credit risk determinants from the borrower’s credit history, the loan-to-value, debt-to-income ratios or other personal history. The Company’s five-year historical loss rates and industry data for each credit rating, adjusted as described below, are used to determine the appropriate allocation percentage for each loan grade. Commercial real estate, consumer and home equity loans are assigned standard risk weightings that determine the allocation percentage.
When commercial real estate loans are over 30 days delinquent or residential, consumer and home equity loans are over 90 days past due, they are evaluated individually for impairment. Additionally, loans that demonstrate credit weaknesses that may impact the borrower’s ability to repay or the value of the collateral are also reviewed individually for impairment. The Company considers a loan to be impaired when management believes it will be unable to collect all principal and interest due according to the contractual terms of the loan. If a loan is determined to be impaired, the Company establishes an allowance for loan losses equal to the excess of the loan’s carrying value over the present value of estimated future cash flows or the fair value of collateral if the loan is collateral dependent.
The Company’s methodology includes factors that allow the Company to adjust its estimates of losses based on the most recent information available. Historical loss rates used to determine allowance provisions are adjusted to reflect the impact of current conditions, including actual collection and charge-off experience. In addition, various regulatory agencies, as an integral part of their examination process, periodically review the allowance for loan losses. Such agencies may require the Company to modify its allowance for loan losses based on their judgment about information available to them at the time of their examination.
Derivative Financial Instruments- The Company originates and purchases derivative financial instruments, including interest rate swaps, interest rate lock commitments and forward contracts to sell mortgage-backed securities. These instruments have certain interest rate risk characteristics that change in value based upon changes in the capital markets.
Interest Rate Swaps: In the normal course of business, the Company uses derivative financial instruments (primarily interest rate swaps) to assist in its interest-rate risk management. In accordance with SFAS No. 133, all derivatives are measured and reported at fair value on the Company’s consolidated balance sheets as either an asset or a liability. For derivatives that are designated and qualify as a fair value hedge, the gain or loss on the derivative, as well as the offsetting loss or gain on the hedged item attributable to the hedged risk, are recognized in current earnings during the period of the change in the fair values. For all hedging relationships, derivative gains and losses that are not effective in hedging the changes in fair value of the hedged item are recognized immediately in current earnings during the period of the change. Similarly, the changes in the fair value of derivatives that do not qualify for hedge accounting under SFAS No. 133 are also reported in non-interest income when they occur.
The net cash settlements on derivatives that qualify for hedge accounting are recorded in interest income or interest expense, based on the item being hedged. The net cash settlements on derivatives that do not qualify for hedge accounting are reported in non-interest income.
At the inception of the hedge and quarterly thereafter, a formal assessment is performed to determine whether changes in the fair values of the derivatives have been highly effective in offsetting the changes in the fair values of the hedged item and whether they are expected to be highly effective in the future. The Company formally documents all relationships between hedging instruments and hedged items, as well as its risk-management objective and strategy for undertaking the hedge. This process includes identification of the hedging instrument, hedged item, risk being hedged and the method for assessing effectiveness and measuring ineffectiveness. In addition, on a quarterly basis, the Company assesses whether the derivative used in the hedging transaction is highly effective in offsetting changes in fair value of the hedged item, and measures and records any ineffectiveness as a credit or charge to earnings. The Company discontinues hedge accounting prospectively when it is determined that the derivative is or will no longer be effective in offsetting changes in the fair value of the hedged item, the derivative expires, is sold, or terminated, or management determines that designation of the derivative as a hedging instrument is no longer appropriate.
- 42 -
The estimates of fair values of the Company’s derivatives and related liabilities are calculated by an independent third party using proprietary valuation models. The fair values produced by these valuation models are, in part, theoretical and reflect assumptions which must be made in using the valuation models. Small changes in assumptions could result in significant changes in valuation. The risks inherent in the determination of the fair value of a derivative may result in income statement volatility.
The Company uses derivatives to modify the repricing characteristics of certain assets and liabilities so that changes in interest rates do not have a significant adverse effect on net interest income and cash flows and to better match the repricing profile of its interest-bearing assets and liabilities. As a result of interest rate fluctuations, certain interest-sensitive assets and liabilities will gain or lose market value. In an effective fair value hedging strategy, the effect of this change in value will generally be offset by a corresponding change in value on the derivatives linked to the hedged assets and liabilities.
Interest Rate Lock Commitments:Commitments to originate loans (interest rate lock commitments), which primarily consist of commitments to originate fixed-rate residential mortgage loans, are recorded at fair value. Changes in the fair value of interest rate lock commitments are recognized in non-interest income on a quarterly basis.
Forward Commitments to Sell Mortgage-Backed Securities:Forward commitments to sell mortgage-backed securities are recorded at fair value. Changes in the fair value of forward contracts to sell mortgage-backed securities are recognized in non-interest income on a quarterly basis.
Stock Split - All common share amounts, earnings per share and dividends per share amounts for fiscal 2005 have been restated to reflect the three-for-two split of the Company’s common stock on July 18, 2005.
Premises and Equipment - Premises and equipment are stated at cost, less accumulated depreciation. Depreciation charged to operations is primarily computed utilizing the straight-line method over the estimated useful lives of the related assets. Estimated lives range from 3 to 40 years for buildings and improvements and 5 to l0 years for furniture and equipment. Maintenance and repairs are charged to expense when incurred. Major renewals and improvements are capitalized. Gains and losses on dispositions are credited or charged to earnings as incurred.
Intangible Assets-Intangible assets include goodwill and core deposit premiums related to the purchase of other financial institutions or branch locations. Core deposit premiums are amortized using the level-yield method. The Company reviews intangible assets for impairment at least annually or more frequently if events or changes in circumstances indicate the carrying value of underlying assets may not be recoverable. The Company measures recoverability based upon estimated market values or the future cash flows expected to result from the use of the underlying asset and its eventual disposition. If the sum of the expected future cash flows (undiscounted and without interest charges) is less than the carrying value of the underlying asset, the Company recognizes an impairment loss. The impairment loss recognized represents the amount by which the carrying value of the underlying asset exceeds the fair value of the underlying asset. Any such adjustments are reflected in the results of operations in the periods in which they become known. No such impairment losses were recognized during any of the three years ended September 30, 2007.
Employee Stock Ownership Plan-The Bank maintains the Pulaski Bank Employee Stock Ownership Plan (“ESOP”). At September 30, 2005, the total amount of the ESOP loan had been repaid and all shares held by the ESOP had been committed to be released. The remaining unallocated shares at September 30, 2005 were allocated to participants’ accounts subsequent to December 31, 2005. Shares were allocated on an annual basis to ESOP participants in an amount equivalent to the ratio of each participant’s salary to that of the Bank’s total payroll expense for each year ended December 31. The unallocated shares were released to participants on a quarterly basis at a rate of 11,638 shares when the Bank repaid the outstanding loan to the Company. The Bank occasionally prepaid a portion of the loan which resulted in a release of additional shares. As shares were released, compensation expense was recognized equal to the fair value of the shares. The shares held by the ESOP were recorded on the balance sheet as unearned ESOP shares, which was a contra equity account. The Company credited unearned ESOP shares as the shares were committed to be released based on the cost of the shares to the ESOP. The difference between the fair value of the shares committed to be released and the cost of those shares to the ESOP was charged or credited to additional paid-in capital. For earnings per share computations, ESOP shares that had been committed to be released were considered outstanding, while ESOP shares that had not been committed to be released were not considered outstanding.
- 43 -
Stock-Based Compensation-The Company maintains a number of stock-based incentive programs, which are discussed in more detail in Note 16. Prior to fiscal 2006, the Company applied the intrinsic value-based method, as outlined in Accounting Principles Board Opinion No. 25, “Accounting for Stock Issued to Employees,” (“APB No. 25”) and related interpretations, in accounting for stock options granted under these programs. Under the intrinsic value-based method, no compensation expense was recognized if the exercise price of the Company’s employee stock options equaled the market price of the underlying stock on the date of the grant. Accordingly, prior to fiscal 2006, no compensation cost was recognized in the accompanying consolidated statements of income on stock options granted to employees, since all options granted under the Company’s share incentive programs had an exercise price equal to the market value of the underlying common stock on the date of the grant.
Effective October 1, 2005, the Company adopted SFAS No. 123R, “Share-Based Payment.” This statement replaced SFAS No. 123, “Accounting for Stock-Based Compensation,” and superseded APB No. 25. SFAS No. 123R requires that all stock-based compensation be recognized as an expense in the financial statements and that such cost be measured at the fair value of the award. This statement was adopted using the modified prospective method of application, which requires the Company to recognize compensation expense on a prospective basis. Therefore, prior period financial statements have not been restated. Under this method, in addition to reflecting compensation expense for new share-based awards, expense is also recognized to reflect the remaining service period of awards that had been included in pro forma disclosures in prior periods. SFAS No. 123R also requires that excess tax benefits related to stock option exercises be reflected as financing cash inflows instead of operating cash inflows.
Total stock-based compensation expense in 2007 was $307,000 ($197,000 after tax), or $0.03 for basic and diluted earnings per share. As of September 30, 2007, the total unrecognized compensation expense related to non-vested stock awards was approximately $755,000 and the related weighted average period over which it is expected to be recognized is approximately 2.79 years.
The following table illustrates the effect on net income and earnings per share as if SFAS No. 123R had been applied to all outstanding awards for the year ended September 30, 2005:
| | | | |
Net income: | | | | |
As reported | | $ | 7,478,898 | |
Add: Total employee stock-based compensation expense included in reported net income, net of tax effect | | | 535,516 | |
Deduct: Total stock-based employee compensation expense, determined under fair value method for all awards, net of tax effect | | | (695,244 | ) |
| | | | |
Pro forma net income | | $ | 7,319,170 | |
| | | | |
Basic earnings per share: | | | | |
As reported | | $ | 0.94 | |
Pro forma | | | 0.92 | |
Diluted earnings per share: | | | | |
As reported | | | 0.85 | |
Pro forma | | | 0.83 | |
- 44 -
The fair value of stock options granted in 2007, 2006 and 2005 was estimated on the date of grant using the Black-Scholes option pricing model with the following average assumptions:
| | | | | | | | | |
| | | 2007 | | | 2006 | | | 2005 | |
Risk free interest rate | | 4.56 | % | | 4.40 | % | | 3.65 | % |
Expected volatility | | 27.50 | % | | 27.93 | % | | 25.61 | % |
Expected life in years | | 5.7 | | | 6.0 | | | 5.0 | |
Dividend yield | | 2.13 | % | | 1.82 | % | | 1.91 | % |
Expected forfeiture rate | | 1.24 | % | | 1.50 | % | | — | |
Income Taxes - Deferred income taxes are determined using an asset or liability approach that requires the recognition of deferred tax assets or liabilities based upon temporary differences in the tax basis of an asset or liability and its related financial statement balance. The deferred tax asset or liability is calculated using the enacted tax rates expected to apply in the period in which the deferred asset or liability is expected to be settled or realized.
Reclassifications - Certain amounts included in the 2006 and 2005 consolidated financial statements have been reclassified to conform to the 2007 presentation.
On March 31, 2006, the Company acquired 100% of the outstanding common stock of CWE Bancorp, Inc., the holding company of Central West End Bank (“CWE”), St. Louis, Missouri. The Company’s results of operations do not reflect the operations of CWE Bancorp, Inc. for periods prior to March 31, 2006. The aggregate purchase price was $7.3 million, including $3.6 million of cash and 210,732 shares of common stock valued at $3.7 million. In addition to the $7.3 million, the Company paid $341,000 of cash to certain former employees and directors of CWE Bancorp in exchange for all of their outstanding options to purchase CWE Bancorp common stock. The Company recorded goodwill of $3.9 million and a core deposit intangible of $708,000. CWE had two branch locations with approximately $12.0 million in loans and $41.4 million in deposits at March 31, 2006.
The gross carrying amount of the core deposit intangible at September 30, 2007 and 2006 was $708,000 and the accumulated amortization at September 30, 2007 and 2006 was $208,000 and $51,000, respectively. The core deposit intangible amortization expense for the years ended September 30, 2007 and 2006 was $157,000 and $51,000 respectively. At September 30, 2007, the estimated core deposit intangible amortization expense for the next five years is as follows:
| | | |
Year ended September 30: | | |
2008 | | $ | 139,000 |
2009 | | | 118,000 |
2010 | | | 95,000 |
2011 | | | 69,000 |
2012 | | | 38,000 |
- 45 -
| 3. | DEBT AND EQUITY SECURITIES |
The amortized cost and estimated fair value of debt and equity securities held to maturity and available for sale at September 30, 2007 and 2006 are summarized as follows:
| | | | | | | | | | | | | | |
| | | September 30, 2007 |
| | | Amortized
Cost | | | Gross
Unrealized
Gains | | Gross
Unrealized
Losses | | | Estimated
Fair Value |
Held to Maturity: | | | | | | | | | | | | | | |
U.S. Government and Agency debt obligations | | $ | 5,979,878 | | | | — | | $ | (647 | ) | | $ | 5,979,231 |
| | | | | | | | | | | | | | |
Weighted average rate at end of period | | | 5.26 | % | | | | | | | | | | |
| | | | | | | | | | | | | | |
Available for Sale: | | | | | | | | | | | | | | |
Equity securities | | $ | 4,004,798 | | | $ | 74,272 | | $ | (114,441 | ) | | $ | 3,964,629 |
U.S. Government and Agency debt obligations | | | 7,049,392 | | | | — | | | (6,220 | ) | | | 7,043,172 |
| | | | | | | | | | | | | | |
Total | | $ | 11,054,190 | | | $ | 74,272 | | $ | (120,661 | ) | | $ | 11,007,801 |
| | | | | | | | | | | | | | |
Weighted average rate at end of period | | | 4.76 | % | | | | | | | | | | |
| | | | | | | | | | | | | | |
| | | | | | | | | | | | | | |
| | | September 30, 2006 |
| | | Amortized
Cost | | | Gross
Unrealized
Gains | | Gross
Unrealized
Losses | | | Estimated
Fair Value |
Held to Maturity: | | | | | | | | | | | | | | |
U.S. Government and Agency debt obligations | | $ | 12,932,036 | | | $ | — | | $ | (57,915 | ) | | $ | 12,874,121 |
| | | | | | | | | | | | | | |
Available for Sale: | | | | | | | | | | | | | | |
Equity securities | | $ | 4,427,418 | | | $ | 194,193 | | $ | (104,352 | ) | | $ | 4,517,259 |
| | | | | | | | | | | | | | |
Weighted average rate at end of period | | | 4.70 | % | | | | | | | | | | |
| | | | | | | | | | | | | | |
Provided below is a summary of securities available for sale and held to maturity that were in an unrealized loss position at September 30, 2007. The summary displays the length of time the securities were in a continuous loss position as of September 30, 2007. The Company has the ability and intent to hold the U.S. government and agency securities until such time as the value recovers or the securities mature. Further, the Company believes the deterioration in value of the U.S. government and agency securities is attributable to changes in market interest rates and not the credit quality of the issuer. The equity securities primarily represent an investment in a qualified investment fund. The unrealized loss is not deemed to be other-than-temporary and there is no intention to dispose of the investment. The Company has the ability to hold this investment until the value recovers.
- 46 -
| | | | | | | | | | | | | | | | | | | | | | | | |
| | | Length of Time in Continuous Unrealized Loss Position at September 30, 2007 | |
| | | Less than 12 months | | | 12 months or more | | | Total | |
| | | Estimated
Fair Value | | | Unrealized
Losses | | | Estimated
Fair Value | | | Unrealized
Losses | | | Estimated
Fair Value | | | Unrealized
Losses | |
Held to Maturity: | | | | | | | | | | | | | | | | | | | | | | | | |
U.S. Government and Agency debt obligations | | $ | 5,979,231 | | | $ | 647 | | | $ | — | | | $ | — | | | $ | 5,979,231 | | | $ | 647 | |
Available for Sale: | | | | | | | | | | | | | | | | | | | | | | | | |
Equity securities | | | — | | | | — | | | | 2,295,700 | | | | 114,441 | | | | 2,295,700 | | | | 114,441 | |
U.S. Government and Agency debt obligations | | | 7,043,172 | | | | 6,220 | | | | — | | | | — | | | | 7,043,172 | | | | 6,220 | |
| | | | | | | | | | | | | | | | | | | | | | | | |
Total | | $ | 13,022,403 | | | $ | 6,867 | | | $ | 2,295,700 | | | $ | 114,441 | | | $ | 15,318,103 | | | $ | 121,308 | |
| | | | | | | | | | | | | | | | | | | | | | | | |
Percent of total | | | 85.0 | % | | | 5.7 | % | | | 15.0 | % | | | 94.3 | % | | | 100.0 | % | | | 100.0 | % |
| | | | | | | | | | | | | | | | | | | | | | | | |
Proceeds from sales of available-for-sale securities were $5.9 million and $7.4 million for the years ended September 30, 2007 and 2006, respectively. There were no such sales during the year ended September 30, 2005. Gross gains of $273,000 and $127,000 were realized on these sales during the years ended September 30, 2007 and 2006, respectively. Gross losses of $4,000 were realized on these sales during the year ended September 30, 2006. There were no such losses during the year ended September 30, 2007.
Securities with a carrying value of approximately $13.0 million and $11.9 million, at September 30, 2007 and 2006, respectively, were pledged to secure deposits of public entities, trust funds, and for other purposes as required by law.
The amortized cost and estimated market values of held-to-maturity and available-for-sale debt securities at September 30, 2007, by contractual maturity, are shown below.
| | | | | | | | | | | | |
| | | Held to Maturity | | Available for Sale |
| | | Amortized
Cost | | Estimated
Fair Value | | Amortized
Cost | | Estimated
Fair Value |
Term to Maturity: | | | | | | | | | | | | |
One year or less | | $ | 5,979,878 | | $ | 5,979,231 | | $ | 4,987,838 | | $ | 4,987,838 |
Over one year through five years | | | — | | | — | | | 2,055,334 | | | 2,055,334 |
| | | | | | | | | | | | |
Tota1 | | $ | 5,979,878 | | $ | 5,979,231 | | $ | 7,043,172 | | $ | 7,043,172 |
| | | | | | | | | | | | |
- 47 -
| 4. | MORTGAGE-BACKED SECURITIES |
Mortgage-backed securities held to maturity and available for sale at September 30, 2007 and 2006 are summarized as follows:
| | | | | | | | | | | | | | |
| | | September 30, 2007 |
| | | Amortized
Cost | | | Gross
Unrealized
Gains | | Gross
Unrealized
Losses | | | Estimated
Fair Value |
Held to Maturity: | | | | | | | | | | | | | | |
Mortgage-backed securities | | $ | 338,708 | | | $ | 28,106 | | $ | — | | | $ | 366,814 |
Collateralized mortgage obligations | | | 32,772 | | | | 43 | | | — | | | | 32,815 |
| | | | | | | | | | | | | | |
Total | | $ | 371,480 | | | $ | 28,149 | | $ | — | | | $ | 399,629 |
| | | | | | | | | | | | | | |
Weighted average rate at end of period | | | 8.87 | % | | | | | | | | | | |
| | | | | | | | | | | | | | |
Available for Sale: | | | | | | | | | | | | | | |
Mortgage-backed securities | | $ | 2,712,379 | | | $ | 15,416 | | $ | (72,593 | ) | | $ | 2,655,202 |
| | | | | | | | | | | | | | |
Weighted average rate at end of period | | | 4.25 | % | | | | | | | | | | |
| | | | | | | | | | | | | | |
| | | | | | | | | | | | | | |
| | | September 30, 2006 |
| | | Amortized
Cost | | | Gross
Unrealized
Gains | | Gross
Unrealized
Losses | | | Estimated
Fair Value |
Held to Maturity: | | | | | | | | | | | | | | |
Mortgage-backed securities | | $ | 391,204 | | | $ | 28,426 | | $ | — | | | $ | 419,630 |
Collateralized mortgage obligations | | | 50,062 | | | | 21 | | | — | | | | 50,083 |
| | | | | | | | | | | | | | |
Total | | $ | 441,266 | | | $ | 28,447 | | $ | — | | | $ | 469,713 |
| | | | | | | | | | | | | | |
Weighted average rate at end of period | | | 8.54 | % | | | | | | | | | | |
| | | | | | | | | | | | | | |
Available for Sale: | | | | | | | | | | | | | | |
Mortgage-backed securities | | $ | 3,300,825 | | | $ | 14,653 | | $ | (125,353 | ) | | $ | 3,190,125 |
| | | | | | | | | | | | | | |
Weighted average rate at end of period | | | 4.31 | % | | | | | | | | | | |
| | | | | | | | | | | | | | |
Proceeds from sales of available-for-sale mortgage-backed securities were $780,000 for the year ended September 30, 2006. There were no such sales during the year ended September 30, 2007 or 2005.
Provided below is a summary of mortgage-backed securities available for sale which were in an unrealized loss position at September 30, 2007. The summary displays the length of time the securities were in a continuous loss position as of September 30, 2007. All of the total unrealized loss was comprised of a security in a continuous loss position for 12 months or more with an estimated maturity of approximately three years. The contractual cash flow of this security is guaranteed by Fannie Mae. The Company has the ability and intent to hold the security until such time as the value recovers or the security matures. Further, the Company believes the deterioration in value is attributable to changes in market interest rates and not the credit quality of the issuer.
- 48 -
| | | | | | | | | | | | | | | | | | |
| | | Length of Time in Continuous Unrealized Loss Position at September 30, 2007 |
| | | Less than 12 months | | 12 months or more | | Total |
| | | Estimated
Fair Value | | Unrealized
Losses | | Estimated
Fair Value | | Unrealized
Losses | | Estimated
Fair Value | | Unrealized
Losses |
Available for Sale: | | | | | | | | | | | | | | | | | | |
Mortgage-backed securities | | $ | 16,990 | | $ | 11 | | $ | 2,300,724 | | $ | 72,582 | | $ | 2,317,714 | | $ | 72,593 |
| | | | | | | | | | | | | | | | | | |
The amortized cost and estimated market values of held-to-maturity and available-for-sale mortgage-backed securities at September 30, 2007, by contractual maturity, are shown below.
| | | | | | | | | | | | |
| | | Held to Maturity | | Available for Sale |
| | | Amortized
Cost | | Estimated
Fair Value | | Amortized
Cost | | Estimated
Fair Value |
Term to Maturity: | | | | | | | | | | | | |
One year or less | | $ | 950 | | $ | 961 | | $ | 17,001 | | $ | 16,990 |
Over one through five years | | | 8,930 | | | 9,345 | | | 2,389,111 | | | 2,316,558 |
Over five through ten years | | | 192,041 | | | 202,373 | | | — | | | — |
Ten years or more | | | 169,559 | | | 186,950 | | | 306,267 | | | 321,654 |
| | | | | | | | | | | | |
Total | | $ | 371,480 | | $ | 399,629 | | $ | 2,712,379 | | $ | 2,655,202 |
| | | | | | | | | | | | |
Actual maturities of mortgage-backed securities may differ from scheduled maturities depending on the repayment characteristics and experience of the underlying financial instruments on which borrowers have the right to call or prepay certain obligations sometimes without penalties.
Mortgage-backed securities with a carrying value of approximately $402,000 and $515,000 at September 30, 2007 and 2006, respectively, were pledged to secure deposits of public entities, trust funds, and for other purposes as required by law.
- 49 -
Loans receivable at September 30, 2007 and 2006 are summarized as follows:
| | | | | | | | |
| | | 2007 | | | 2006 | |
Real estate mortgage: | | | | | | | | |
One to four family residential | | $ | 332,205,536 | | | $ | 314,746,084 | |
Multi-family residential | | | 30,219,199 | | | | 13,628,962 | |
Commercial real estate | | | 200,205,837 | | | | 150,528,577 | |
Real estate construction and development: | | | | | | | | |
Residential | | | 45,427,668 | | | | 31,984,589 | |
Multi-family | | | 13,899,603 | | | | 6,042,116 | |
Commercial | | | 39,594,005 | | | | 19,168,235 | |
Commercial and industrial | | | 77,641,815 | | | | 48,785,481 | |
Equity lines | | | 219,539,073 | | | | 207,152,688 | |
Consumer and installment | | | 6,918,612 | | | | 6,276,425 | |
| | | | | | | | |
| | | 965,651,348 | | | | 798,313,157 | |
Add (less): | | | | | | | | |
Deferred loan costs | | | 5,162,991 | | | | 4,879,507 | |
Loans-in-process | | | (10,566,888 | ) | | | (10,176,323 | ) |
Allowance for loan losses | | | (10,421,304 | ) | | | (7,817,317 | ) |
| | | | | | | | |
Total | | $ | 949,826,147 | | | $ | 785,199,024 | |
| | | | | | | | |
Weighted average rate at end of period | | | 7.44 | % | | | 7.50 | % |
| | | | | | | | |
The Bank has made loans to officers and directors in the ordinary course of business on substantially the same terms and conditions, including interest rates and collateral, as those prevailing for comparable transactions with other customers and did not, in the opinion of management, involve more than normal credit risk.
Changes in loans to senior officers and directors for the years ended September 30, 2007 and 2006 are summarized as follows:
| | | | |
Balance, September 30, 2005 | | $ | 220,989 | |
Additions | | | 469,667 | |
Repayments and reclassifications | | | (286,825 | ) |
| | | | |
Balance, September 30, 2006 | | | 403,831 | |
Additions | | | 1,477,841 | |
Repayments and reclassifications | | | (489,087 | ) |
| | | | |
Balance, September 30, 2007 | | $ | 1,392,585 | |
| | | | |
Home equity lines of credit to senior officers and directors totaled $752,000 of which $268,389 had been disbursed as of September 30, 2007. A standby letter of credit to a director in the amount of $2,000,000 was outstanding as of September 30, 2007.
At September 30, 2007, 2006 and 2005, the Bank was servicing loans for others amounting to approximately $17.6 million, $21.9 million and $16.4 million, respectively. Servicing loans for others generally consists of collecting mortgage payments, maintaining escrow accounts, disbursing payments to investors and foreclosure processing. Loan servicing income is recorded on the accrual basis and includes servicing fees received from investors and certain charges collected from borrowers.
- 50 -
| 6. | ALLOWANCE FOR LOAN LOSSES |
The following table represents activity in the allowance for loan losses for the years ended September 30, 2007, 2006 and 2005:
| | | | | | | | | | | | |
| | | 2007 | | | 2006 | | | 2005 | |
Balance, beginning of year | | $ | 7,817,317 | | | $ | 6,805,958 | | | $ | 5,579,132 | |
Provision charged to expense | | | 3,855,257 | | | | 1,501,375 | | | | 1,634,651 | |
Allowance of acquired institution | | | — | | | | 282,442 | | | | — | |
Charge-offs | | | (1,293,407 | ) | | | (782,487 | ) | | | (417,137 | ) |
Recoveries | | | 42,137 | | | | 10,029 | | | | 9,312 | |
| | | | | | | | | | | | |
Balance, end of year | | $ | 10,421,304 | | | $ | 7,817,317 | | | $ | 6,805,958 | |
| | | | | | | | | | | | |
A summary of impaired loans at September 30, 2007, 2006 and 2005 is summarized as follows:
| | | | | | | | | |
| | | 2007 | | 2006 | | 2005 |
Non-accrual loans | | $ | 6,448,834 | | $ | 939,863 | | $ | 166,137 |
Impaired loans continuing to accrue interest | | | 253,541 | | | 344,585 | | | 725,991 |
| | | | | | | | | |
Total impaired loans | | $ | 6,702,375 | | $ | 1,284,448 | | $ | 892,128 |
| | | | | | | | | |
Allowance for losses on specific impaired loans | | $ | 1,228,467 | | $ | 310,421 | | $ | 203,854 |
Impaired loans with no related allowance for loan losses | | | — | | | — | | | — |
The average balance of impaired loans during the years ended September 30, 2007, 2006 and 2005 was $4.0 million, $1.1 million and $710,000, respectively.
Interest income recognized on non-accrual loans was approximately $347,000, $69,000 and $3,000 for the years ended September 30, 2007, 2006 and 2005, respectively. The difference between interest that would have been recognized under the original terms of non-accrual and renegotiated loans and interest actually recognized on such loans was $286,000, $41,000 and $8,000 for 2007, 2006 and 2005, respectively. Impaired loans continuing to accrue interest are loans that are more than 90 days past due; however, the loans are well secured and remain in process of collection.
- 51 -
| 7. | REAL ESTATE ACQUIRED IN SETTLEMENT OF LOANS |
Real estate acquired in settlement of loans at September 30, 2007 and 2006 is summarized as follows:
| | | | | | | | |
| | | 2007 | | | 2006 | |
Real estate acquired in settlement of loans | | $ | 3,163,691 | | | $ | 2,790,517 | |
Less allowance for losses | | | (74,035 | ) | | | (26,350 | ) |
| | | | | | | | |
Total | | $ | 3,089,656 | | | $ | 2,764,167 | |
| | | | | | | | |
Activity in the allowance for losses on real estate acquired in settlement of loans for the years ended September 30, 2007, 2006 and 2005 is summarized as follows:
| | | | | | | | | | | | |
| | | 2007 | | | 2006 | | | 2005 | |
Balance, beginning of year | | $ | 26,350 | | | $ | 64,833 | | | $ | 47,816 | |
Provision charged to expense | | | 115,535 | | | | 102,884 | | | | 126,422 | |
Charge-offs | | | (67,850 | ) | | | (141,367 | ) | | | (109,405 | ) |
| | | | | | | | | | | | |
Balance, end of year | | $ | 74,035 | | | $ | 26,350 | | | $ | 64,833 | |
| | | | | | | | | | | | |
Premises and equipment at September 30, 2007 and 2006 are summarized as follows:
| | | | | | | | |
| | | 2007 | | | 2006 | |
Land | | $ | 5,228,180 | | | $ | 2,916,654 | |
Office buildings and improvements | | | 15,062,783 | | | | 14,998,840 | |
Furniture and equipment | | | 9,171,432 | | | | 7,825,012 | |
| | | | | | | | |
| | | 29,462,395 | | | | 25,740,506 | |
Less accumulated depreciation | | | (9,072,950 | ) | | | (7,574,666 | ) |
| | | | | | | | |
Total | | $ | 20,389,445 | | | $ | 18,165,840 | |
| | | | | | | | |
Depreciation expense on premises and equipment totaled $1.5 million, $1.4 million and $1.3 million for the years ended September 30, 2007, 2006, and 2005 respectively.
Certain facilities of the Bank are leased under various operating leases. Amounts paid for rent expense for the fiscal years ended September 30, 2007, 2006 and 2005 were approximately $428,000, $324,000 and $287,000, respectively. At September 30, 2007, future minimum rental commitments under non-cancelable leases are as follows:
| | | |
Due in years ended September 30, | | | |
2008 | | $ | 435,477 |
2009 | | | 268,818 |
2010 | | | 166,386 |
2011 | | | 148,347 |
2012 | | | 73,324 |
Thereafter | | | 411,389 |
| | | |
Total | | $ | 1,503,741 |
| | | |
Rental income received for the years ended September 30, 2007 and 2006 was mainly from the Company’s office building located at 415 DeBaliviere in St. Louis, Missouri and for the year ended September 30, 2005, from the office building located at One Pulaski Center Drive in Creve Coeur, Missouri. Rental income received for the years ending September 30, 2007, 2006 and 2005 was $84,000, $71,000, and $146,000 respectively.
- 52 -
Deposits at September 30, 2007 and 2006 are summarized as follows:
| | | | | | | | | | | | |
| | | 2007 | | | 2006 | |
| | | Amount | | Weighted
Average
Interest
Rate | | | Amount | | Weighted
Average
Interest
Rate | |
Transaction accounts: | | | | | | | | | | | | |
Non-interest-bearing checking | | $ | 57,004,801 | | — | % | | $ | 38,830,048 | | — | % |
Interest-bearing checking | | | 57,815,627 | | 1.79 | | | | 53,448,091 | | 1.66 | |
Passbook savings accounts | | | 28,908,862 | | 0.29 | | | | 31,895,237 | | 0.39 | |
Money market | | | 173,949,915 | | 4.05 | | | | 134,383,061 | | 4.12 | |
| | | | | | | | | | | | |
Total transaction accounts | | $ | 317,679,205 | | 2.57 | | | $ | 258,556,437 | | 2.53 | |
| | | | | | | | | | | | |
Certificates of deposit: | | | | | | | | | | | | |
0.00% to 0.99% | | | — | | — | | | | 251,475 | | 0.50 | |
1.00% to 1.99% | | | 2,536,477 | | 1.51 | | | | 3,925,472 | | 1.51 | |
2.00% to 2.99% | | | 3,804,761 | | 2.61 | | | | 17,564,622 | | 2.69 | |
3.00% to 3.99% | | | 39,393,317 | | 3.68 | | | | 33,718,295 | | 3.52 | |
4.00% to 4.99% | | | 31,676,984 | | 4.56 | | | | 91,632,046 | | 4.45 | |
5.00% to 5.99% | | | 439,990,518 | | 5.25 | | | | 249,557,958 | | 5.21 | |
10.00% to 10.99% | | | 407,434 | | 10.00 | | | | 370,273 | | 10.00 | |
| | | | | | | | | | | | |
Total certificates of deposit | | | 517,809,491 | | 5.06 | | | | 397,020,141 | | 4.74 | |
| | | | | | | | | | | | |
Total | | $ | 835,488,696 | | 4.11 | % | | $ | 655,576,578 | | 3.87 | % |
| | | | | | | | | | | | |
The aggregate amount of certificates of deposit with a minimum principal amount of $100,000 was $278.6 million and $189.6 million at September 30, 2007 and 2006, respectively.
At September 30, 2007, the scheduled maturities of certificates of deposit were as follows:
| | | |
Maturing within the year ending September 30, | | | |
2008 | | $ | 360,188,178 |
2009 | | | 63,306,964 |
2010 | | | 45,017,019 |
2011 | | | 34,585,946 |
2012 | | | 14,711,384 |
Thereafter | | | — |
| | | |
Total | | $ | 517,809,491 |
| | | |
- 53 -
A summary of interest expense on deposits for the years ended September 30, 2007, 2006 and 2005 is as follows:
| | | | | | | | | |
| | | 2007 | | 2006 | | 2005 |
Interest-bearing checking | | $ | 1,131,379 | | $ | 695,670 | | $ | 129,503 |
Passbook savings | | | 106,841 | | | 115,329 | | | 116,699 |
Money market | | | 6,575,821 | | | 3,117,420 | | | 1,668,182 |
Certificates of deposit | | | 23,523,456 | | | 15,696,337 | | | 8,309,064 |
| | | | | | | | | |
Total | | $ | 31,337,497 | | $ | 19,624,756 | | $ | 10,223,448 |
| | | | | | | | | |
| 10. | ADVANCES FROM FEDERAL HOME LOAN BANK |
Advances from the Federal Home Loan Bank of Des Moines at September 30, 2007 and 2006 are summarized as follows:
| | | | | | | | | | | | |
| | | 2007 | | | 2006 | |
Maturing within the year ending September 30, | | Amount | | Weighted
Average
Interest
Rate | | | Amount | | Weighted
Average
Interest
Rate | |
2007 | | $ | — | | — | % | | $ | 118,800,000 | | 5.17 | % |
2008 | | | 117,300,000 | | 4.62 | | | | 19,900,000 | | 4.04 | |
2009 ($10.0 million callable in FY 2007 and thereafter) | | | 30,100,000 | | 5.31 | | | | 27,100,000 | | 5.37 | |
2010 ($4.5 million callable in FY 2007 and thereafter) | | | 7,000,000 | | 5.54 | | | | 7,000,000 | | 5.54 | |
2011 | | | — | | — | | | | — | | — | |
Thereafter | | | 4,000,000 | | 5.48 | | | | — | | — | |
| | | | | | | | | | | | |
Total | | $ | 158,400,000 | | 4.81 | % | | $ | 172,800,000 | | 5.08 | % |
| | | | | | | | | | | | |
The average balances of advances from the Federal Home Loan Bank of Des Moines were $168.5 million and $168.1 million, respectively, and the maximum month-end balances of advances from the Federal Home Loan Bank were $203.5 million and $200.0 million, respectively, for the years ended September 30, 2007 and 2006. The average rates paid on advances from the Federal Home Loan Bank during the years ended September 30, 2007 and 2006 were 5.20% and 4.63%, respectively.
The Bank has the ability to borrow funds from the FHLB equal to 35% of the Bank’s total assets under a blanket agreement which assigns all investments in FHLB stock as well as qualifying first mortgage loans as collateral to secure the amounts borrowed. In addition to the $158.4 million in advances outstanding at September 30, 2007, the Bank had approximately $106.5 million in additional borrowing capacity available under this arrangement. The assets underlying the FHLB borrowings are under the Bank’s physical control.
| 11. | SUBORDINATED DEBENTURES |
On March 30, 2004, Pulaski Financial Statutory Trust I (“Trust I”), a Connecticut statutory trust, issued $9.0 million of adjustable-rate preferred securities. The proceeds from this issuance, along with the Company’s $279,000 capital contribution for Trust I’s common securities, were used to acquire $9.3 million aggregate principal amount of the Company’s floating rate junior subordinated deferrable interest debentures due 2034 which constitute the sole asset of Trust I. The interest rate on the debentures and the capital securities is variable and adjustable quarterly at 2.70% over the three-month LIBOR. The rate at September 30, 2007 was 8.39%.
- 54 -
The stated maturity of the Trust I debenture is June 17, 2034. In addition, the Trust I debentures are subject to redemption at par at the option of the Company, subject to prior regulatory approval, in whole or in part on any interest payment date on or after June 17, 2009.
On December 15, 2004, Pulaski Financial Statutory Trust II (“Trust II”), a Delaware statutory trust, issued $10.0 million of adjustable-rate preferred securities. The proceeds from this issuance, along with the Company’s $310,000 capital contribution for Trust II’s common securities, were used to acquire $10.3 million of the Company’s floating rate junior subordinated deferrable interest debentures due 2034, which constitute the sole asset of Trust II. The interest rate on the debentures and the capital securities is variable and adjustable quarterly at 1.86% over the three-month LIBOR. The rate at September 30, 2007 was 7.55%.
The stated maturity of the debentures held by Trust II is December 15, 2034. In addition, the Trust II debentures are subject to redemption at par at the option of the Company, subject to prior regulatory approval, in whole or in part on any interest payment date on or after December 15, 2009.
The note payable is a three-year, variable-rate obligation of the Company that is payable to a correspondent bank. The interest rate is set at the correspondent bank’s prime rate less 1.25%, or 6.50% at September 30, 2007 and is payable quarterly. Principal is payable quarterly in installments of $85,000 each plus a final payment equal to all unpaid principal on May 20, 2010, the maturity date. The note payable is secured by 1,000 shares of the Bank’s common stock. At September 30, 2007 and 2006, there were outstanding borrowings of $3.0 million and $3.3 million, respectively. The credit agreement requires the Company to comply with various covenants. At September 30, 2007, the Company was in compliance with all of the covenants.
Income tax expense for the years ended September 30, 2007, 2006 and 2005 is summarized as follows:
| | | | | | | | | | | | |
| | | 2007 | | | 2006 | | | 2005 | |
Current: | | | | | | | | | | | | |
Federal | | $ | 4,158,012 | | | $ | 5,343,626 | | | $ | 5,085,200 | |
State | | | 592,800 | | | | 722,816 | | | | 549,498 | |
Deferred | | | (249,519 | ) | | | (641,767 | ) | | | (1,216,599 | ) |
| | | | | | | | | | | | |
Total | | $ | 4,501,293 | | | $ | 5,424,675 | | | $ | 4,418,099 | |
| | | | | | | | | | | | |
- 55 -
Income tax expense for the years ended September 30, 2007, 2006 and 2005 differs from that computed at the federal statutory rate of 34% as follows:
| | | | | | | | | | | | | | | | | | | | | |
| | | 2007 | | | 2006 | | | 2005 | |
| | | Amount | | | % | | | Amount | | | % | | | Amount | | | % | |
Tax at statutory federal income tax rate | | $ | 4,584,537 | | | 34.0 | % | | $ | 5,189,328 | | | 34.0 | % | | $ | 4,044,979 | | | 34.0 | % |
Increase (decrease) resulting from: | | | | | | | | | | | | | | | | | | | | | |
Non-taxable income from bank-owned life insurance | | | (345,376 | ) | | (2.5 | ) | | | (287,884 | ) | | (1.9 | ) | | | (202,790 | ) | | (1.7 | ) |
ESOP adjustment | | | — | | | — | | | | — | | | — | | | | 196,510 | | | 1.7 | |
State taxes, net of federal benefit | | | 391,248 | | | 2.9 | | | | 477,058 | | | 3.1 | | | | 362,669 | | | 3.0 | |
Other | | | (129,116 | ) | | (1.0 | ) | | | 46,173 | | | 0.3 | | | | 16,731 | | | 0.1 | |
| | | | | | | | | | | | | | | | | | | | | |
Total | | $ | 4,501,293 | | | 33.4 | % | | $ | 5,424,675 | | | 35.5 | % | | $ | 4,418,099 | | | 37.1 | % |
| | | | | | | | | | | | | | | | | | | | | |
The components of deferred tax assets and liabilities are as follows:
| | | | | | |
| | | 2007 | | 2006 |
Deferred tax assets: | | | | | | |
Allowance for loan losses | | $ | 3,940,132 | | $ | 2,898,675 |
Restricted stock awards | | | 14,071 | | | 23,969 |
Deferred compensation | | | 1,474,127 | | | 2,225,899 |
FAS 123R restricted stock | | | 60,953 | | | — |
Unrealized gains on securities available-for-sale | | | 37,284 | | | 7,926 |
Loss on derivative instruments | | | 162,848 | | | 385,646 |
Other | | | 121,732 | | | 136,566 |
| | | | | | |
Total deferred tax assets | | | 5,811,147 | | | 5,678,681 |
| | | | | | |
Deferred tax liabilities: | | | | | | |
FHLB stock dividends | | | 152,311 | | | 152,311 |
Core deposit intangible | | | 190,254 | | | 275,020 |
Premises and equipment | | | 366,699 | | | 390,572 |
Other | | | 51,088 | | | 59,502 |
| | | | | | |
Total deferred tax liabilities | | | 760,352 | | | 877,405 |
| | | | | | |
Net deferred tax assets | | $ | 5,050,795 | | $ | 4,801,276 |
| | | | | | |
Retained earnings at September 30, 2007 included earnings of approximately $4.1 million representing tax bad debt deductions, net of actual bad debts and bad debt recoveries, for which no provision for federal income taxes has been made. If these amounts are used for any purpose other than to absorb loan losses, they will be subject to federal income taxes at the then prevailing corporate rate.
A valuation allowance should be provided on deferred tax assets when it is more likely than not that some portion of the assets will not be realized. The Company has not established a valuation allowance at September 30, 2007 or 2006 due to management’s belief that all criteria for recognition have been met, including the existence of a history of taxes paid that are sufficient to support the realization of deferred tax assets.
- 56 -
During fiscal 2007, the Company paid quarterly cash dividends on common stock of $0.09 per share on July 16, 2007 and $0.085 per share on April 16, 2007, January 22, 2007 and October 16, 2006. During fiscal 2006, the Company paid quarterly cash dividends on common stock of $0.085 per share on October 16, 2006 and July 17, 2006 and $0.08 per share on April 17, 2006 and January 17, 2006.
During fiscal 2007, the Company repurchased 97,337 of its common shares with a total value of $1.4 million, which are available for issuance upon exercise of stock options and repurchased 88,188 of its common shares with a total value of $1.2 million, which were deposited into the Company’s equity trust plan.
| 15. | REGULATORY CAPITAL REQUIREMENTS |
The Company is not subject to any separate capital requirements from those of the Bank. The Bank is subject to various regulatory capital requirements administered by the federal banking agencies. Failure to meet minimum capital requirements can initiate certain mandatory and possibly additional discretionary actions by regulators which, if undertaken, could have a direct material effect on the Company’s financial statements. Under capital adequacy guidelines and the regulatory framework for prompt corrective action, the Bank must meet specific capital guidelines that involve quantitative measures of the Bank’s assets, liabilities, and certain off-balance-sheet items as calculated under regulatory accounting practices. The Bank’s capital amounts and classification are also subject to qualitative judgments by the regulators about components, risk weightings, and other factors.
Quantitative measures that have been established by regulation to ensure capital adequacy require the Bank to maintain minimum capital amounts and ratios (set forth in the table below). The Bank’s primary regulatory agency, the Office of Thrift Supervision (“OTS”), requires that the Bank maintain minimum ratios, as defined in the regulations, of tangible capital of 1.5%, core capital of 4.0% and total risk-based capital of 8.0%. The Bank is also subject to prompt corrective action capital requirement regulations set forth by the OTS. As defined in the regulations, the OTS requires the Bank to maintain minimum total and Tier I capital to risk-weighted assets and Tier I capital to average assets. Management believes, as of September 30, 2007, that the Bank meets all capital adequacy requirements to which it is subject.
As of September 30, 2007, the most recent notification from the OTS categorized the Bank as “well capitalized” under the regulatory framework for prompt corrective action. To be categorized as “well capitalized,” the Bank must maintain minimum total risk-based, Tier I risk-based and Tier I leverage ratios as set forth in the following table. There are no conditions or events since that notification that management believes have changed the Bank’s category.
- 57 -
| | | | | | | | | | | | | | | | | | |
| | | Actual | | | For Capital
Adequacy
Purposes | | | To be Categorized as
“Well Capitalized”
Under Prompt
Corrective Action
Provisions | |
| | | Amount | | Ratio | | | Amount | | Ratio | | | Amount | | Ratio | |
| | | (Dollars in thousands) | |
As of September 30, 2007: | | | | | | | | | | | | | | | | | | |
Tangible capital (to total assets) | | $ | 98,974 | | 8.79 | % | | $ | 16,892 | | 1.50 | % | | | N/A | | N/A | |
Total risk-based capital (to risk- weighted assets) | | | 108,751 | | 11.18 | % | | | 77,790 | | 8.00 | % | | $ | 97,237 | | 10.00 | % |
Tier I risk-based capital (to risk- weighted assets) | | | 98,974 | | 10.18 | % | | | 48,618 | | 5.00 | % | | | 58,342 | | 6.00 | % |
Tier I leverage capital (to average assets) | | | 98,974 | | 8.79 | % | | | 45,045 | | 4.00 | % | | | 56,307 | | 5.00 | % |
As of September 30, 2006: | | | | | | | | | | | | | | | | | | |
Tangible capital (to total assets) | | $ | 88,954 | | 9.30 | % | | $ | 14,348 | | 1.50 | % | | | N/A | | N/A | |
Total risk-based capital (to risk- weighted assets) | | | 96,598 | | 11.99 | % | | | 64,463 | | 8.00 | % | | $ | 80,579 | | 10.00 | % |
Tier I risk-based capital (to risk- weighted assets) | | | 88,954 | | 11.04 | % | | | 40,289 | | 5.00 | % | | | 48,347 | | 6.00 | % |
Tier I leverage capital (to average assets) | | | 88,954 | | 9.30 | % | | | 38,261 | | 4.00 | % | | | 47,826 | | 5.00 | % |
A summary of the Bank’s stockholders’ equity and regulatory risk-based capital at September 30, 2007 follows:
| | | | |
| | | (in thousands) | |
Tier I stockholders’ equity | | $ | 103,407 | |
Deduct: | | | | |
Intangible assets | | | (4,439 | ) |
Disallowed servicing rights | | | (108 | ) |
Add: | | | | |
Unrealized gains on available for sale securities | | | 114 | |
| | | | |
Tangible capital | | | 98,974 | |
Add: | | | | |
General valuation allowances | | | 9,777 | |
| | | | |
Total risk-based capital | | $ | 108,751 | |
| | | | |
The Bank is prohibited from paying cash dividends if the effect thereof would be to reduce the regulatory capital of the Bank below the amount required for the liquidation account that the Bank established in connection with the consummation of the conversion from the mutual holding company structure on December 2, 1998.
- 58 -
The Company maintains shareholder-approved, stock-based incentive plans, which permit the granting of options to purchase common stock of the Company and awards of restricted shares of common stock. All employees, non-employee directors and consultants of the Company and its affiliates are eligible to receive awards under the plans. The plans authorize the granting of awards in the form of options intended to qualify as incentive stock options under Section 422 of the Internal Revenue Code, options that do not so qualify (non-statutory stock options) and granting of restricted shares of common stock. Stock awards are generally granted with an exercise price equal to the market value of the Company’s shares at the date of grant and generally vest over a period of three to five years. Generally, option and share awards provide for accelerated vesting if there is a change in control (as defined in the plans). On July 19, 2006, the Company granted stock option awards totaling 10,500 shares of its common stock to non-employee directors with exercise prices at a premium of 10% over the market value of the Company’s shares at the date of grant. These stock option awards were immediately vested on the date of grant and are exercisable for a period of five years from the date of grant. The exercise period for all stock options generally may not exceed 10 years from the date of grant. Shares used to satisfy stock awards and stock option exercises are generally issued from treasury stock. At September 30, 2007, the Company had 419,194 reserved but unissued shares that can be awarded in the form of stock options or restricted share awards.
Restricted Stock Awards-A summary of the Company’s restricted stock awards as of and for the years ended September 30, 2007, 2006 and 2005 is as follows:
| | | | | | | | | | | | | | | | | | |
| | | 2007 | | 2006 | | 2005 |
| | | Number | | | Weighted
Average
Grant-Date
Fair Value | | Number | | | Weighted
Average
Grant-Date
Fair Value | | Number | | | Weighted
Average
Grant-Date
Fair Value |
Nonvested at beginning of year | | 5,543 | | | $ | 9.85 | | 16,548 | | | $ | 6.89 | | 73,338 | | | $ | 3.46 |
Granted | | — | | | | — | | — | | | | — | | 3,720 | | | | 13.35 |
Vested | | (2,438 | ) | | | 9.39 | | (10,505 | ) | | | 4.99 | | (59,760 | ) | | | 3.00 |
Forfeited | | — | | | | — | | (500 | ) | | | 14.00 | | (750 | ) | | | 13.00 |
| | | | | | | | | | | | | | | | | | |
Nonvested at end of year | | 3,105 | | | $ | 10.21 | | 5,543 | | | $ | 9.85 | | 16,548 | | | | 6.89 |
| | | | | | | | | | | | | | | | | | |
Stock Option Awards-A summary of the Company’s stock option program as of and for the years ended September 30, 2007, 2006 and 2005 is as follows:
| | | | | | | | | | | | | | | | | | | | | | | |
| | | 2007 | | 2006 | | 2005 |
| | | Number | | | Weighted
Average
Exercise
Price | | Aggregate
Intrinsic
Value (in millions) | | Weighted
Average
Remaining
Contractual
Life (years) | | Number | | | Weighted
Average
Exercise
Price | | Number | | | Weighted
Average
Exercise
Price |
Outstanding- beginning of year | | 824,800 | | | $ | 8.23 | | | | | | | 862,217 | | | $ | 6.87 | | 948,186 | | | $ | 5.33 |
Granted | | 44,500 | | | | 15.20 | | | | | | | 109,000 | | | | 16.61 | | 143,248 | | | | 13.35 |
Exercised | | (60,567 | ) | | | 6.54 | | | | | | | (135,092 | ) | | | 5.90 | | (222,467 | ) | | | 4.38 |
Forfeited | | (28,725 | ) | | | 15.09 | | | | | | | (11,325 | ) | | | 12.70 | | (6,750 | ) | | | 11.30 |
| | | | | | | | | | | | | | | | | | | | | | | |
Outstanding-end of year | | 780,008 | | | | 8.51 | | $ | 3.9 | | 4.9 | | 824,800 | | | | 8.23 | | 862,217 | | | | 6.87 |
| | | | | | | | | | | | | | | | | | | | | | | |
Exercisable at end of year | | 573,486 | | | | 6.37 | | | 3.9 | | 3.9 | | 549,329 | | | | 5.57 | | 478,128 | | | | 4.70 |
| | | | | | | | | | | | | | | | | | | | | | | |
- 59 -
The weighted-average fair value per share of options granted during the years ended September 30, 2007, 2006 and 2005 was $4.15, $4.65, and $3.17, respectively. Cash received from stock options exercised totaled $396,000, $797,000 and $974,000 during the years ended September 30, 2007, 2006 and 2005, respectively. The total intrinsic value of stock options exercised totaled $566,000, $1.5 million and $2.0 million during the years ended September 30, 2007, 2006 and 2005, respectively. Senior officers and directors exercised 42,392 options during the year ended September 30, 2007. In order for awardees to meet tax obligations, 297 shares were withheld by the Company.
The following is a summary of the options outstanding at September 30, 2007:
| | | | | | | | | | | | |
| | | Outstanding | | Exercisable |
Range of
Exercise Prices | | Number | | Weighted Average
Remaining
Contractual Life (yrs) | | Weighted
Average
Exercise Price | | Number | | Weighted
Average
Exercise Price |
| $2.70 - $2.70 | | 139,948 | | 2.06 | | $ | 2.70 | | 139,948 | | $ | 2.70 |
| 3.33 - 4.73 | | 96,096 | | 3.19 | | | 4.38 | | 96,096 | | | 4.38 |
| 5.13 - 5.13 | | 13,500 | | 4.05 | | | 5.13 | | 13,500 | | | 5.13 |
| 5.55 - 5.55 | | 116,822 | | 3.83 | | | 5.55 | | 116,822 | | | 5.55 |
| 6.10 - 6.75 | | 84,414 | | 3.69 | | | 6.20 | | 82,914 | | | 6.19 |
| 7.58 - 12.99 | | 87,326 | | 6.38 | | | 11.12 | | 52,901 | | | 10.50 |
| 13.00 - 13.47 | | 84,757 | | 7.22 | | | 13.28 | | 32,478 | | | 13.29 |
| 13.49 - 15.97 | | 95,245 | | 8.12 | | | 15.10 | | 18,327 | | | 14.70 |
| 15.99 - 18.70 | | 61,700 | | 7.72 | | | 17.17 | | 20,300 | | | 17.75 |
Equity Trust Plan-The Company maintains an Equity Trust Plan for the benefit of key loan officers and sales staff. The plan is designed to recruit and retain top-performing loan officers and other key revenue-producing employees who are instrumental to the Company’s success. Currently, none of the Company’s executive officers participate in the plan. The plan allows the recipients to defer a percentage of commissions earned, which is partially matched by the Company and paid into a rabbi trust for the benefit of the participants. The assets of the trust are limited to the purchase of Company shares in the open market. In exchange for the opportunity to defer income, the participants are required to sign a four-year or five-year contract prohibiting them from competing against the Company in its market area. The participants will forgo any accrued benefits if they voluntarily leave the Company. At September 30, 2007, 230,225 shares had been purchased on behalf of the participants at an average price of $14.18. Shares distributed to participants during the fiscal year were 113,016, with a market value at the time of distribution totaling $1.8 million, and 31,749 shares were withheld by the Company in order for the awardees to meet their tax obligations. Vested shares in the plan are treated as issued and outstanding when computing basic and diluted earnings per share, whereas unvested shares are treated as issued and outstanding only when computing diluted earnings per share.
Employee Stock Ownership Plan-The Bank maintains a tax-qualified stock ownership plan for all eligible employees (“ESOP”). In 1998, 698,280 shares were purchased by the ESOP at $3.33 per share through a loan from the Company. As the loan was repaid, shares were released from collateral and allocated to each participant based on the pro rata amount of each participant’s salary to total salary for the calendar year. Compensation expense was recognized equal to the average fair market value of the shares as they were committed to be released out of the unallocated general ESOP trust account and into employee accounts. At September 30, 2005, the total amount of the ESOP loan had been repaid and all shares held by the ESOP had been committed to be released. The remaining 28,491 unallocated shares at September 30, 2005 were allocated to participants’ accounts subsequent to December 31, 2005. Compensation expense under the ESOP plan was $762,000 for the year ended September 30, 2005. There was no such expense during the years ended September 30, 2007 or 2006. There were 610,484, 611,500 and 616,344 shares of the Company’s common stock held in the plan at September 30, 2007, 2006 and 2005, respectively.
401(k) Savings Plan-The Bank maintains a 401(k) savings plan for eligible employees. In 2007, 2006 and 2005, the Bank matched 50 to 75% of each participant’s contribution up to a maximum of 4% of salary. The Bank’s contributions to this plan were $573,000, $349,000 and $220,000 for the years ended September 30, 2007, 2006 and 2005, respectively.
- 60 -
Supplemental Retirement Agreement-In January 1998, the Bank entered into a Supplemental Retirement Benefit agreement with its former chief executive officer. Under the terms of the agreement, the former officer is entitled to receive $2,473 monthly, for a period of 15 years commencing upon his retirement. The net present value of these payments is reflected in other liabilities and totaled $126,000, $145,000 and $163,000 at September 30, 2007, 2006 and 2005, respectively. Compensation expense under this agreement totaled $10,000, $12,000 and $13,000 for the years ended September 30, 2007, 2006 and 2005, respectively.
Employment Agreements - The Company and the Bank each maintain a three-year employment agreement with the CEO. Under the agreements, the Bank pays the CEO a base salary, which is reviewed at least annually and may be increased at the discretion of the Board of Directors. The CEO is also entitled to receive health and welfare benefits provided to other Company and Bank employees. Additionally, the agreements provide for severance payments if employment is terminated following a change in control or upon an event of termination as defined in the agreement. In the event of a change in control and subsequent termination of employment, the CEO will receive a lump sum payment equal to three times his average annual compensation paid during the five years immediately preceding the change in control.
| 17. | RECONCILIATION OF BASIC EARNINGS PER SHARE TO DILUTED EARNINGS PER SHARE |
Basic earnings per share is computed using the weighted average number of common shares outstanding. The dilutive effect of potential securities is included in diluted earnings per share. The computations of basic and diluted earnings per share are presented in the following table.
| | | | | | | | | |
| | | Years Ended September 30, |
| | | 2007 | | 2006 | | 2005 |
Net income | | $ | 8,982,639 | | $ | 9,838,053 | | $ | 7,478,898 |
| | | | | | | | | |
Weighted average shares outstanding - basic | | | 9,814,396 | | | 9,205,525 | | | 7,925,674 |
Effect of dilutive securities: | | | | | | | | | |
Treasury stock held in equity trust | | | 140,917 | | | 121,479 | | | 403,633 |
Employee stock options and awards | | | 300,389 | | | 390,729 | | | 498,917 |
| | | | | | | | | |
Weighted average shares outstanding - diluted | | | 10,255,702 | | | 9,717,733 | | | 8,828,224 |
| | | | | | | | | |
Earnings per share: | | | | | | | | | |
Basic | | $ | 0.92 | | $ | 1.07 | | $ | 0.94 |
Diluted | | | 0.88 | | | 1.01 | | | 0.85 |
Under the treasury stock method, outstanding stock options are dilutive when the average market price of the Company’s common stock, when combined with the effect of any unamortized compensation expense, exceeds the option price during a period. In addition, proceeds from the assumed exercise of dilutive options along with the related tax benefit are assumed to be used to repurchase common shares at the average market price of such stock during the period.
The following options to purchase shares during the fiscal years ended 2007, 2006 and 2005 were not included in the respective computations of diluted earnings per share because the exercise price of the options, when combined with the effect of the unamortized compensation expense, was greater than the average market price of the common shares and were considered anti-dilutive. As of September 30, 2007, these options expire in various periods through 2015.
- 61 -
| | | | | | |
| | | 2007 | | 2006 | | 2005 |
Number of option shares | | 142,201 | | 55,865 | | 140,217 |
Equivalent anti-dilutive shares | | 180,417 | | 68,438 | | 151,670 |
The Company is a defendant in legal actions arising from normal business activities. Management, after consultation with general counsel, believes that the resolution of these actions will not have any material adverse effect on the Company’s consolidated financial statements.
The Company originates and purchases derivative financial instruments, including interest rate lock commitments, forward contracts to sell mortgage-backed securities and interest rate swaps. Derivative financial instruments originated by the Company consist of interest rate lock commitments to originate residential loans. At September 30, 2007, the Company had issued $144.7 million of unexpired interest rate lock commitments to loan customers compared to $111.7 million of unexpired commitments at September 30, 2006.
The Company typically economically hedges interest rate lock commitments through one of two means – either by obtaining a corresponding best-efforts lock commitment with an investor to sell the loan at an agreed upon price, or by forward selling mortgage-backed securities. The forward sale of mortgage-backed securities is a means of matching a corresponding derivative asset that has characteristics similar to the bank-issued commitment but its fair value changes directly opposite to market movements. Loans hedged through forward sales of mortgaged-backed securities are sold individually or in pools on a mandatory delivery basis to investors; whereas, the best efforts sales are locked with investors on a loan-by-loan basis shortly after issuing the rate lock commitments to customers. The Company had outstanding forward sales commitments of mortgage-backed securities totaling $19.0 million and $15.0 million in notional value at September 30, 2007 and 2006. These hedges were matched against $15.3 million and $19.6 million of interest rate lock commitments at September 30, 2007 and 2006, respectively that were to be sold through the mandatory delivery of loan pool sales.
The carrying value of the interest-rate lock commitment liabilities included in the consolidated balance sheets was a credit balance totaling $125,000 at September 30, 2007 and a debit balance of $30,000 at September 30, 2006, respectively. The carrying value of the forward sales commitment assets included in the consolidated balance sheets was a credit balance of $25,000 at September 30, 2007 and a debit balance of $81,000 at September 30, 2006, respectively.
Interest Rate Swaps - The Company entered into interest rate swap agreements in November 2004 which were designed to convert the fixed rates paid on certain brokered certificates of deposit into variable, LIBOR-based rates. The swap agreements result in the counterparty paying a fixed rate to the Company while the Company pays a variable, LIBOR-based rate to the counterparty. During fiscal year 2005 and the first six months of fiscal year 2006, changes in the estimated fair values of these derivatives were recognized as charges or credits to earnings, as appropriate, during the periods in which the changes occurred. Effective January 1, 2006, the Company designated $80.0 million of interest rate swaps as fair value hedges of $80.0 million of the fixed-rate, brokered certificates of deposit under Statement of Financial Accounting Standards No. 133, “Accounting for Derivative Financial Instruments and Hedging Activities” (“SFAS No. 133”) using long-haul, fair-value, hedge accounting. At September 30, 2007, these fair value hedges were considered to be highly effective and any hedge ineffectiveness was deemed not material. The notional amounts of the liabilities being hedged were $80.0 million at September 30, 2007 and 2006, respectively. At September 30, 2007 and 2006, there were no swaps in a net settlement receivable position and swaps in a net settlement payable position totaled $864,000 and $2.0 million, respectively. The net amounts recognized on fair value hedges were a gain of $586,000 and a loss of $194,000 for the years ended September 30, 2007 and 2006, respectively.
- 62 -
The maturity date, notional amounts, interest rates paid and received, and fair value of the Company’s interest rate swap agreements as of September 30, 2007 and 2006 are presented in the table below:
| | | | | | | | | | | | | | | | | | | | | | | |
| | | | | September 30, 2007 | | | September 30, 2006 | |
Maturity Date | | Notional
Amount | | Interest
Rate
Paid | | | Interest
Rate
Received | | | Estimated
Fair Value | | | Interest
Rate
Paid | | | Interest
Rate
Received | | | Estimated
Fair Value | |
October 20, 2008 | | $ | 10,000,000 | | 5.50 | % | | 4.30 | % | | $ | (55,664 | ) | | 5.29 | % | | 4.30 | % | | $ | (154,030 | ) |
November 19, 2009 | | | 10,000,000 | | 5.52 | % | | 3.50 | % | | | (26,557 | ) | | 5.31 | % | | 3.50 | % | | | (207,594 | ) |
November 23, 2009 | | | 10,000,000 | | 5.46 | % | | 3.75 | % | | | (72,534 | ) | | 5.28 | % | | 3.75 | % | | | (215,582 | ) |
November 26, 2010 | | | 10,000,000 | | 5.49 | % | | 4.13 | % | | | (205,111 | ) | | 5.31 | % | | 4.13 | % | | | (364,738 | ) |
November 26, 2010 | | | 5,000,000 | | 5.48 | % | | 4.13 | % | | | (101,518 | ) | | 5.30 | % | | 4.13 | % | | | (180,829 | ) |
November 26, 2010 | | | 5,000,000 | | 5.47 | % | | 4.13 | % | | | (100,482 | ) | | 5.29 | % | | 4.13 | % | | | (179,290 | ) |
January 24, 2010 | | | 10,000,000 | | 5.44 | % | | 3.70 | % | | | (43,702 | ) | | 5.27 | % | | 3.70 | % | | | (320,976 | ) |
January 28, 2011 | | | 10,000,000 | | 5.47 | % | | 4.30 | % | | | (178,348 | ) | | 5.29 | % | | 4.30 | % | | | (187,926 | ) |
February 25, 2011 | | | 5,000,000 | | 5.47 | % | | 4.80 | % | | | (48,365 | ) | | 5.28 | % | | 4.80 | % | | | (96,280 | ) |
September 14, 2012 | | | 5,000,000 | | 5.58 | % | | 4.25 | % | | | (31,931 | ) | | 5.29 | % | | 4.25 | % | | | (98,417 | ) |
| | | | | | | | | | | | | | | | | | | | | | | |
Total | | $ | 80,000,000 | | | | | | | | $ | (864,212 | ) | | | | | | | | $ | (2,005,662 | ) |
| | | | | | | | | | | | | | | | | | | | | | | |
The gross amounts of interest paid to and received from the counterparty under the swap agreements and the related average interest rates during the years ended September 30, 2007 and 2006 are as follows:
| | | | | | | | |
| | | 2007 | | | 2006 | |
Interest paid (variable rate): | | | | | | | | |
Total amount (000s) | | $ | 4,298.4 | | | $ | 3,780.0 | |
Average interest rate | | | 5.37 | % | | | 4.72 | % |
Interest received (fixed rate): | | | | | | | | |
Total amount (000s) | | $ | 3,232.5 | | | $ | 3,072.4 | |
Average interest rate | | | 4.04 | % | | | 3.84 | % |
| 20. | FINANCIAL INSTRUMENTS WITH OFF-BALANCE SHEET RISK AND CONCENTRATIONS OF CREDIT RISK |
The Bank is a party to financial instruments with off-balance sheet risk in the normal course of business to meet the financing needs of its customers by issuing commitments to extend credit, which are agreements to lend to a customer provided there is no violation of any condition established in the contract. Commitments generally have fixed expiration dates or other termination clauses and may require the borrower to pay a fee. The Bank evaluates each customer’s creditworthiness on a case-by-case basis.
At September 30, 2007, the Bank had firm commitments to originate loans of approximately $144.7 million, of which $124.2 million were committed to be sold. Of the remaining $20.5 million to be retained, $249,000 were at fixed rates. At September 30, 2006, the Bank had firm commitments to originate loans of approximately $111.7 million of which $59.5 million were committed to be sold. Of the remaining $52.3 million to be retained, $4.1 million were at fixed rates. Additionally, the Bank had outstanding commitments to lend to borrowers under unused equity lines of credit totaling $291.0 million and $261.6 million at September 30, 2007 and 2006, respectively.
At September 30, 2007 and 2006, the Bank had loans receivable held for sale totaling $58.5 million and $60.5 million, respectively, substantially all of which were under firm commitments to be sold on a best-efforts basis. Any unrealized loss on these commitment obligations is considered in conjunction with the Bank’s lower of cost or market valuation on its loans held-for-sale.
Standby letters of credit are conditional commitments issued by the Bank to guarantee the performance of a customer to a third party. These standby letters of credit are primarily issued to support contractual obligations of the Bank’s customers. The credit risk involved with issuing letters of credit is essentially the same as the risk involved in extending loans to customers. At September 30, 2007, the Bank had 48 letters of credit totaling approximately $7.1 million due to expire no later than May 2011 compared to 32 letters of credit totaling approximately $6.4 million due to expire no later than April 2009 at September 30, 2006.
- 63 -
Substantially all of the Bank’s loans are to borrowers located in St. Louis, Kansas City and the surrounding Missouri counties.
| 21. | FAIR VALUE OF FINANCIAL INSTRUMENTS |
Estimated fair values of financial instruments have been estimated by the Company using available market information and appropriate valuation methodologies. However, considerable judgment is necessarily required to interpret market data used to develop the estimates of fair value. Accordingly, the estimates presented herein are not necessarily indicative of the amounts the Company might realize in a current market exchange. The use of different market assumptions and/or estimation methodologies could have a material effect on the estimated fair value amounts.
The fair value estimates presented herein are based on pertinent information available to management as of September 30, 2007 and 2006. Although management is not aware of any factors that would significantly affect the estimated fair value amounts, such amounts have not been comprehensively revalued for purposes of these financial statements since that date. Therefore, current estimates of fair value may differ significantly from the amounts presented herein.
Carrying values and estimated fair values at September 30, 2007 and 2006 are summarized as follows:
| | | | | | | | | | | | |
| | | 2007 | | 2006 |
| | | Carrying Value | | Estimated Fair Value | | Carrying Value | | Estimated Fair Value |
ASSETS: | | | | | | | | | | | | |
Cash and cash equivalents | | $ | 23,675,000 | | $ | 23,675,000 | | $ | 22,123,000 | | $ | 22,123,000 |
Debt securities - HTM | | | 5,980,000 | | | 5,979,000 | | | 12,932,000 | | | 12,874,000 |
Debt securities - AFS | | | 7,043,000 | | | 7,043,000 | | | — | | | — |
Equity securities - AFS | | | 3,965,000 | | | 3,965,000 | | | 4,517,000 | | | 4,517,000 |
Capital Stock of FHLB | | | 8,306,000 | | | 8,306,000 | | | 9,524,000 | | | 9,524,000 |
Mortgage-backed securities - HTM | | | 371,000 | | | 400,000 | | | 441,000 | | | 470,000 |
Mortgage-backed securities - AFS | | | 2,655,000 | | | 2,655,000 | | | 3,190,000 | | | 3,190,000 |
Loans receivable held for sale | | | 58,536,000 | | | 59,449,000 | | | 60,452,000 | | | 61,434,000 |
Loans receivable | | | 949,826,000 | | | 943,357,000 | | | 785,199,000 | | | 782,716,000 |
Accrued interest receivable | | | 6,605,000 | | | 6,605,000 | | | 5,532,000 | | | 5,532,000 |
LIABILITIES: | | | | | | | | | | | | |
Deposits | | | 835,489,000 | | | 835,489,000 | | | 655,577,000 | | | 655,577,000 |
Advances from the FHLB | | | 158,400,000 | | | 157,287,000 | | | 172,800,000 | | | 170,982,000 |
Note payable | | | 2,980,000 | | | 2,980,000 | | | 3,320,000 | | | 3,320,000 |
Derivative liabilities | | | 864,000 | | | 864,000 | | | 2,006,000 | | | 2,006,000 |
Subordinated debentures | | | 19,589,000 | | | 19,589,000 | | | 19,589,000 | | | 19,589,000 |
Accrued interest payable | | | 2,531,000 | | | 2,531,000 | | | 1,801,000 | | | 1,801,000 |
Due to other banks | | | 17,485,000 | | | 17,485,000 | | | 22,066,000 | | | 22,066,000 |
| | |
| | | 2007 | | 2006 |
| | | Contract or Notional
Amount | | Estimated Fair Value | | Contract or Notional
Amount | | Estimated Fair Value |
OFF BALANCE SHEET FINANCIAL INSTRUMENTS: | | | | | | | | | | | | |
Commitments to originate first and second mortgage loans | | $ | 112,911,000 | | $ | — | | $ | 111,380,000 | | $ | — |
Commitments to originate non-mortgage loans | | | 31,742,000 | | | — | | | 347,000 | | | — |
Unused Lines of Credit | | | 291,268,000 | | | — | | | 261,579,000 | | | — |
- 64 -
The following methods and assumptions were used to estimate the fair value of the financial instruments:
Cash and Cash Equivalents-The carrying amount approximates fair value.
Securities and Mortgage-backed Securities - Estimated fair values of securities and mortgage-backed securities are based on quoted market prices and prices obtained from independent pricing services. If quoted market prices are not available, fair values are estimated using quoted market prices for similar instruments.
Equity securities - Estimated fair values are based on stock market prices for publicly quoted stocks, and a broker-provided market value for the Community Reinvestment Act Fund.
Capital Stock of the Federal Home Loan Bank - The carrying amount approximates fair value.
Loans Receivable Held for Sale - The estimated fair value of loans held for sale is determined based upon recent historic sales premiums.
Loans Receivable - The fair value of loans receivable is estimated based on present values using applicable risk-adjusted spreads to the U. S. Treasury curve to approximate current interest rates applicable to each category of such financial instruments. No adjustment was made to the interest rates for changes in credit risk of performing loans where there are no known credit concerns. Management segregates loans in appropriate risk categories. Management believes that the risk factor embedded in the interest rates along with the allowance for loan losses applicable to the performing loan portfolio results in a fair valuation of such loans.
Accrued Interest Receivable- The carrying value approximates fair value.
Deposits - The estimated fair value of demand deposits and savings accounts is the amount payable on demand at the reporting date. The estimated fair value of fixed-maturity certificates of deposit is estimated by discounting the future cash flows of existing deposits using rates currently available on advances from the Federal Home Loan Bank having similar characteristics.
Derivative Liabilities - The fair value is based on quoted market prices by the counter-party.
Advances from Federal Home Loan Bank - The estimated fair value of advances from Federal Home Loan Bank is determined by discounting the future cash flows of existing advances using rates currently available on advances from Federal Home Loan Bank having similar characteristics.
Note Payable - The carrying value approximates fair value since it is a variable rate obligation.
Due to Other Banks - The carrying value approximates fair value since the amounts are generally settled in cash on the next business day.
Subordinated Debentures - The carrying value approximates fair value due to the variable pricing of the debt, which is based upon the 90 day LIBOR rate.
Accrued Interest Payable - The carrying value approximates fair value.
Off-Balance Sheet Items - The estimated fair value of commitments to originate or purchase loans is based on the fees currently charged to enter into similar agreements and the difference between current levels of interest rates and the committed rates. The Company believes such commitments have been made on terms which are competitive in the markets in which it operates; however, no premium or discount is offered thereon and accordingly, the Company has not assigned a value to such instruments for purposes of this disclosure.
- 65 -
| 22. | IMPACT OF RECENTLY ISSUED ACCOUNTING STANDARDS |
In May 2005, the Financial Accounting Standards Board (“FASB”) issued Statement No. 154, “Accounting Changes and Error Corrections” (“SFAS No. 154”), a replacement of APB Opinion No. 20, “Accounting Changes,” and FASB Statement No. 3, “Reporting Accounting Changes in Interim Financial Statements.” SFAS No. 154 requires retrospective application for voluntary changes in accounting principles unless it is impracticable to do so. SFAS No. 154 was effective for the Company beginning October 1, 2006. The adoption of SFAS No.154 did not have a material effect on the Company’s financial condition or results of operations.
In February 2006, the FASB issued Statement No. 155, “Accounting for Certain Hybrid Financial Instruments” (“SFAS No. 155”), which amends FASB Statements No. 133 and 140. This Statement permits fair value re-measurement for any hybrid financial instrument containing an embedded derivative that would otherwise require bifurcation, and broadens a Qualified Special Purpose Entity’s (“QSPE”) permitted holdings to include passive derivative financial instruments that pertain to other derivative financial instruments. This statement was effective for the Company for all financial instruments acquired, issued or subject to a re-measurement event occurring on or after October 1, 2006. The adoption of SFAS No. 155 did not have a material effect on the Company’s financial condition or results of operations.
In March 2006, the FASB issued Statement No. 156, “Accounting for Servicing of Financial Assets, an Amendment of FASB Statement No. 140, Accounting for Transfers and Servicing of Financial Assets and Extinguishments of Liabilities” (“SFAS No. 156”), which requires that all separately recognized servicing assets and servicing liabilities be initially measured at fair value, if practicable, and permits the entities to elect either fair value measurement with changes in fair value reflected in earnings or the amortization and impairment requirements of Statement 140 for subsequent measurement. The subsequent measurement of separately recognized servicing assets and servicing liabilities at fair value eliminates the necessity for entities that manage the risks inherent in servicing assets and servicing liabilities with derivatives to qualify for hedge accounting treatment and eliminates the characterization of declines in fair value as impairments or direct write-downs. Statement No. 156 was effective for the Company beginning October 1, 2006. The adoption of SFAS No. 156 did not have a material effect on the Company’s financial condition or results of operations.
In September 2006, the FASB issued Statement No. 157, “Fair Value Measurements” (“SFAS No. 157”), which defines fair value, establishes a framework for measuring fair value in generally accepted accounting standards, and expands disclosures about fair value measurements. SFAS No. 157 is effective for financial statements issued for fiscal years beginning after November 15, 2007, and interim periods within those fiscal years. Management has evaluated the requirements of SFAS No. 157 and believes it will not have a material effect on the Company’s financial condition or results of operations.
In September 2006, the FASB issued Statement No. 158, “Employer’s Accounting for Defined Benefit Pension and Other Postretirement Plans” (“SFAS No. 158”), which requires balance sheet recognition of the funded status of pension and other postretirement benefits with the offset to accumulated other comprehensive income. Employers will recognize actuarial gains and losses, prior service cost, and any remaining transition amounts when recognizing a plan’s funded status. SFAS No. 158 is effective for fiscal years ending after December 15, 2006. The adoption of SFAS No. 158 did not have a material effect on the Company’s financial condition or results of operations.
In February 2007, the FASB issued Statement No. 159, “The Fair Value Option for Financial Assets and Financial Liabilities—Including an amendment of FASB Statement No. 115” (“SFAS No. 159”). SFAS No. 159 provides companies with an option to report selected financial assets and liabilities at estimated fair value. Most of the provisions of SFAS No. 159 are elective; however, the amendment to SFAS No. 115, Accounting for Certain Investments in Debt and Equity Securities, applies to all entities that own trading and available-for-sale securities. The fair value option created by SFAS No. 159 permits an entity to measure eligible items at fair value as of specified election dates. The fair value option (a) may generally be applied instrument by instrument, (b) is irrevocable unless a new election date occurs, and (c) must be applied to the entire instrument and not to only a portion of the instrument. SFAS No. 159 is effective as of the beginning of an entity’s first fiscal year beginning after November 15, 2007. Early adoption is permitted as of the beginning of the previous fiscal year provided that the entity makes that choice in the first 120 days of the fiscal year, has not yet issued financial statements for any interim period of such year, and also elects to apply the provisions of SFAS No. 157. Management is currently evaluating the requirements of SFAS No. 159 to determine its impact on the Company’s financial condition and results of operations.
- 66 -
In June 2006, the FASB issued Interpretation No. 48, “Accounting for Uncertainty in Income Taxes,” an interpretation of SFAS No. 109, “Accounting for Income Taxes” (“Interpretation No. 48”), which clarifies the accounting for uncertainty in income taxes in financial statements and prescribes a recognition threshold and measurement attribute for financial statement recognition and measurement of a tax position taken or expected to be taken. It also provides guidance on derecognition, classification, interest and penalties, accounting in interim periods, disclosure and transition. Interpretation No. 48 was effective for fiscal years beginning after December 15, 2006. Management determined the adoption of Interpretation No. 48 will not have a material effect on the Company’s financial condition or results of operations.
In September 2006, the SEC Staff issued Staff Accounting Bulletin No. 108 (“SAB No. 108”), “Considering the Effects of Prior Year Misstatements when Quantifying Misstatements in Current Year Financial Statements,” which addresses how the effects of prior year uncorrected misstatements should be considered when quantifying misstatements in current year financial statements. SAB No. 108 requires registrants to quantify misstatements using both the balance sheet and income-statement approaches and to evaluate whether either approach results in quantifying an error that is material in light of relevant quantitative and qualitative factors. When the effect of initial adoption is determined to be material, SAB No. 108 allows registrants to record that effect as a cumulative effect adjustment to beginning retained earnings. The requirements are effective for the Company beginning October 1, 2006. The adoption of SAB No. 108 had no effect on the Company’s financial condition or results of operations.
In September 2006, the Emerging Issues Task Force Issue 06-4, “Accounting for Deferred Compensation and Postretirement Benefit Aspects of Endorsement Split-Dollar Life Insurance Arrangements,” was ratified. This EITF Issue addresses accounting for separate agreements which split life insurance policy benefits between an employer and employee. The Issue requires the employer to recognize a liability for future benefits payable to the employee under these agreements. The effects of applying this Issue must be recognized through either a change in accounting principle through an adjustment to equity or through the retrospective application to all prior periods. For calendar year companies, the Issue is effective beginning January 1, 2008. Early adoption is permitted as of January 1, 2007. Management has evaluated the requirements of the Issue and believes it will not have a material effect on the Company’s financial condition or results of operations.
- 67 -
| 23. | SELECTED QUARTERLY FINANCIAL DATA (UNAUDITED) |
The results of operations by quarter for 2007 and 2006 were as follows:
| | | | | | | | | | | | |
Year Ended September 30, 2007 | | First Quarter | | Second
Quarter | | Third Quarter | | Fourth
Quarter |
Interest income | | $ | 16,340,806 | | $ | 16,934,244 | | $ | 18,241,344 | | $ | 19,294,818 |
Interest expense | | | 9,468,773 | | | 9,981,138 | | | 11,000,847 | | | 11,383,123 |
| | | | | | | | | | | | |
Net interest income | | | 6,872,033 | | | 6,953,106 | | | 7,240,497 | | | 7,911,695 |
Provision for loan losses | | | 681,553 | | | 573,482 | | | 1,911,482 | | | 688,740 |
| | | | | | | | | | | | |
Net interest income after loan loss provision | | | 6,190,480 | | | 6,379,624 | | | 5,329,015 | | | 7,222,955 |
Non-interest income | | | 2,937,062 | | | 3,163,100 | | | 3,770,509 | | | 2,940,024 |
Non-interest expense | | | 5,327,087 | | | 6,318,671 | | | 6,141,344 | | | 6,661,735 |
| | | | | | | | | | | | |
Income before taxes | | | 3,800,455 | | | 3,224,053 | | | 2,958,180 | | | 3,501,244 |
Income taxes | | | 1,314,010 | | | 1,019,761 | | | 974,637 | | | 1,192,885 |
| | | | | | | | | | | | |
Net income | | $ | 2,486,445 | | $ | 2,204,292 | | $ | 1,983,543 | | $ | 2,308,359 |
| | | | | | | | | | | | |
Earnings per share - basic | | $ | 0.25 | | $ | 0.22 | | $ | 0.20 | | $ | 0.25 |
Earnings per share - diluted | | $ | 0.24 | | $ | 0.21 | | $ | 0.19 | | $ | 0.24 |
Weighted average shares outstanding - basic | | | 9,823,850 | | | 9,829,899 | | | 9,825,886 | | | 9,778,411 |
Weighted average shares outstanding - diluted | | | 10,269,066 | | | 10,265,321 | | | 10,266,592 | | | 10,222,156 |
| | | | |
Year Ended September 30, 2006 | | First Quarter | | Second
Quarter | | Third Quarter | | Fourth
Quarter |
Interest income | | $ | 11,789,988 | | $ | 12,140,842 | | $ | 14,258,822 | | $ | 15,653,274 |
Interest expense | | | 5,934,271 | | | 6,499,666 | | | 7,611,428 | | | 8,981,646 |
| | | | | | | | | | | | |
Net interest income | | | 5,855,717 | | | 5,641,176 | | | 6,647,394 | | | 6,671,628 |
Provision for loan losses | | | 406,621 | | | 452,750 | | | 291,664 | | | 350,340 |
| | | | | | | | | | | | |
Net interest income after loan loss provision | | | 5,449,096 | | | 5,188,426 | | | 6,355,730 | | | 6,321,288 |
Non-interest income | | | 2,451,218 | | | 4,916,824 | | | 3,001,349 | | | 3,179,459 |
Non-interest expense | | | 5,069,748 | | | 5,638,241 | | | 5,478,058 | | | 5,414,615 |
| | | | | | | | | | | | |
Income before taxes | | | 2,830,566 | | | 4,467,009 | | | 3,879,021 | | | 4,086,132 |
Income taxes | | | 983,486 | | | 1,571,625 | | | 1,401,140 | | | 1,468,424 |
| | | | | | | | | | | | |
Net income | | $ | 1,847,080 | | $ | 2,895,384 | | $ | 2,477,881 | | $ | 2,617,708 |
| | | | | | | | | | | | |
Earnings per share - basic | | $ | 0.22 | | $ | 0.32 | | $ | 0.26 | | $ | 0.27 |
Earnings per share - diluted | | $ | 0.21 | | $ | 0.30 | | $ | 0.24 | | $ | 0.26 |
Weighted average shares outstanding - basic | | | 8,302,664 | | | 8,977,678 | | | 9,755,591 | | | 9,787,193 |
Weighted average shares outstanding - diluted | | | 8,864,422 | | | 9,507,731 | | | 10,243,755 | | | 10,256,175 |
- 68 -
| 24. | CONDENSED PARENT COMPANY ONLY FINANCIAL STATEMENTS. |
The following table presents the condensed parent-company-only balance sheets as of September 30, 2007 and 2006, and the condensed parent-company-only statements of income and cash flows of the Company for the years ended September 30, 2007, 2006 and 2005:
| | | | | | |
Condensed Balance Sheets | | 2007 | | 2006 |
ASSETS: | | | | | | |
Cash and cash equivalents | | $ | 302,510 | | $ | 239,405 |
Investment in Bank | | | 103,407,450 | | | 93,541,965 |
Investments and mortgage-backed securities | | | 1,684,765 | | | 2,310,500 |
Intercompany loan | | | — | | | 3,375,000 |
Other assets | | | 392,365 | | | 1,256,675 |
| | | | | | |
Total assets | | $ | 105,787,090 | | $ | 100,723,545 |
| | | | | | |
LIABILITIES: | | | | | | |
Note payable | | $ | 2,980,000 | | $ | 3,320,000 |
Subordinated debentures | | | 19,589,000 | | | 19,589,000 |
Dividends payable | | | 894,694 | | | 845,440 |
Other liabilities | | | 1,518,905 | | | 1,142,559 |
| | | | | | |
Total liabilities | | | 24,982,599 | | | 24,896,999 |
Stockholders’ equity | | | 80,804,491 | | | 75,826,546 |
| | | | | | |
Total liabilities and stockholders’equity | | $ | 105,787,090 | | $ | 100,723,545 |
| | | | | | |
| | | | | | | | | | | | |
Condensed Statements of Income | | 2007 | | | 2006 | | | 2005 | |
Interest income | | $ | 207,364 | | | $ | 100,792 | | | $ | 84,079 | |
Interest expense | | | 1,741,136 | | | | 1,639,069 | | | | 1,100,708 | |
| | | | | | | | | | | | |
Net interest income | | | (1,533,772 | ) | | | (1,538,277 | ) | | | (1,016,629 | ) |
Non-interest income | | | 788,160 | | | | 464,102 | | | | 105,974 | |
Non-interest expense | | | 576,027 | | | | 569,313 | | | | 465,229 | |
| | | | | | | | | | | | |
Loss before income taxes and equity in earnings of Bank | | | (1,321,639 | ) | | | (1,643,488 | ) | | | (1,375,884 | ) |
Income tax benefit | | | (457,900 | ) | | | (575,561 | ) | | | (524,418 | ) |
| | | | | | | | | | | | |
Net loss before equity in earnings of Bank | | | (863,739 | ) | | | (1,067,927 | ) | | | (851,466 | ) |
Equity in earnings of Bank, net of tax | | | 9,846,378 | | | | 10,905,980 | | | | 8,330,364 | |
| | | | | | | | | | | | |
Net Income | | $ | 8,982,639 | | | $ | 9,838,053 | | | $ | 7,478,898 | |
| | | | | | | | | | | | |
- 69 -
| | | | | | | | | | | | |
Condensed Statements of Cash Flows | | 2007 | | | 2006 | | | 2005 | |
CASH FLOWS FROM OPERATING ACTIVITIES: | | | | | | | | | | | | |
Net income | | $ | 8,982,639 | | | $ | 9,838,053 | | | $ | 7,478,898 | |
Adjustments to reconcile net income to net cash from operating activities: | | | | | | | | | | | | |
Equity in earnings of Bank | | | (9,846,378 | ) | | | (10,905,980 | ) | | | (8,330,364 | ) |
Net change in other assets and liabilities | | | 1,436,715 | | | | 483,560 | | | | 87,482 | |
Realized gain on sale of investments | | | (143,720 | ) | | | (123,188 | ) | | | — | |
| | | | | | | | | | | | |
Net cash provided by (used in) operating activities | | | 429,256 | | | | (707,555 | ) | | | (763,984 | ) |
| | | | | | | | | | | | |
CASH FLOWS FROM INVESTING ACTIVITIES: | | | | | | | | | | | | |
Cash paid for investment in joint venture | | | (100,000 | ) | | | (67,620 | ) | | | (133,810 | ) |
Dividends received from Bank | | | — | | | | 4,000,000 | | | | 2,500,000 | |
Capital contribution to Bank | | | — | | | | (11,000,000 | ) | | | (9,000,000 | ) |
Decrease (increase) in intercompany loan | | | 3,375,000 | | | | (2,150,000 | ) | | | (1,225,000 | ) |
Purchases of investments | | | (150,000 | ) | | | (500,000 | ) | | | (410,000 | ) |
Proceeds from sales of investments | | | 772,648 | | | | 575,365 | | | | — | |
Principal payments on mortgage-backed securities | | | 27,545 | | | | 54,680 | | | | 42,098 | |
| | | | | | | | | | | | |
Net cash provided by (used in) investing activities | | | 3,925,193 | | | | (9,087,575 | ) | | | (8,226,712 | ) |
| | | | | | | | | | | | |
CASH FLOWS FROM FINANCING ACTIVITIES: | | | | | | | | | | | | |
Cash paid for acquired entities | | | — | | | | (3,925,378 | ) | | | — | |
Proceeds from issuance of subordinated debentures | | | — | | | | — | | | | 10,310,000 | |
Payment of note payable | | | (340,000 | ) | | | (255,000 | ) | | | (255,000 | ) |
Payments received from loan to ESOP | | | — | | | | — | | | | 183,773 | |
Proceeds from common stock offering | | | — | | | | 16,139,230 | | | | — | |
Equity trust shares purchased | | | (1,248,787 | ) | | | (1,959,000 | ) | | | — | |
Proceeds from stock options exercised | | | 395,836 | | | | 797,429 | | | | 974,033 | |
Proceeds received from Bank for stock-based compensation | | | 1,411,905 | | | | 2,026,437 | | | | 93,557 | |
Proceeds from cash received in dividend reinvestment plan | | | 393,061 | | | | 276,582 | | | | — | |
Stock repuchase | | | (1,415,545 | ) | | | (88,301 | ) | | | (190,194 | ) |
Dividends paid on common stock | | | (3,487,814 | ) | | | (3,152,569 | ) | | | (2,335,914 | ) |
| | | | | | | | | | | | |
Net cash (used in) provided by financing activities | | | (4,291,344 | ) | | | 9,859,430 | | | | 8,780,255 | |
| | | | | | | | | | | | |
NET INCREASE (DECREASE) IN CASH AND CASH EQUIVALENTS | | | 63,105 | | | | 64,300 | | | | (210,441 | ) |
CASH AND CASH EQUIVALENTS AT BEGINNING OF YEAR | | | 239,405 | | | | 175,105 | | | | 385,546 | |
| | | | | | | | | | | | |
CASH AND CASH EQUIVALENTS AT END OF YEAR | | $ | 302,510 | | | $ | 239,405 | | | $ | 175,105 | |
| | | | | | | | | | | | |
* * * * *
- 70 -
COMMON STOCK INFORMATION
The common stock of the Company is listed on the NASDAQ Global Select Market under the symbol “PULB.” As of December 17, 2007, there were approximately 3,040 stockholders of record of the Company, including brokers or other nominees.
The following table sets forth market price and dividend information for the Company’s common stock for fiscal years 2007 and 2006.
| | | | | | | | |
Fiscal 2007 | | High | | Low | | Dividend |
First Quarter | | $ | 16.75 | | $ | 15.23 | | $0.085 per share |
Second Quarter | | $ | 16.97 | | $ | 15.07 | | $0.085 per share |
Third Quarter | | $ | 16.04 | | $ | 14.24 | | $0.085 per share |
Fourth Quarter | | $ | 16.90 | | $ | 12.11 | | $0.090 per share |
| | | |
Fiscal 2006 | | High | | Low | | Dividend |
First Quarter | | $ | 18.20 | | $ | 16.82 | | $0.080 per share |
Second Quarter | | $ | 19.24 | | $ | 15.71 | | $0.080 per share |
Third Quarter | | $ | 17.20 | | $ | 15.05 | | $0.085 per share |
Fourth Quarter | | $ | 17.75 | | $ | 16.25 | | $0.085 per share |
- 71 -
Directors and Officers
| | |
| Directors | | Officers of Pulaski Bank |
| |
William A. Donius Chairman and Chief Executive Officer | | William A. Donius Chairman and Chief Executive Officer |
| |
Stanley J. Bradshaw Principal, Bradshaw Capital Management | | W. Thomas Reeves President |
| |
William M. Corrigan, Jr. Partner, Armstrong, Teasdale LLP | | Ramsey K. Hamadi Chief Financial Officer |
| |
Leon A. Felman Managing Partner of Felman Family Partnership LP | | Brian J. Björkman President -Commercial Lending |
| |
Michael R. Hogan Chief Administrative Officer and CFO of Sigma-Aldrich Corporation | | Paul D. Grosse Regional President |
| |
Timothy K. Reeves President and Owner of Keenan Properties of St. Louis | | Matthew A. Locke President-Mortgage Lending |
| |
Steven C. Roberts President of The Roberts Companies | | Cheri G. Bliefernich SVP-Retail Banking |
| |
Lee S. Wielansky Chairman and Chief Executive Officer of Midland Development Group, Inc. | | Rita M. Kuster SVP-Commercial Real Estate |
| |
Emeritus Director Thomas F. Hack Retired Thrift Executive | | Paul J. Milano Treasurer and Controller |
| |
| | Christopher A. Purcell SVP-Loan Operations |
| |
| | Lisa K. Simpson SVP-Director of Human Resources |
- 72 -
CORPORATE INFORMATION
Corporate Headquarters
12300 Olive Boulevard
St. Louis, Missouri
314.878.2210
www.pulaskibankstl.com
Independent Auditors
KPMG LLP
St. Louis, Missouri
General Counsel
Kappel, Neill and Wolff LLC
St. Louis, Missouri
Armstrong, Teasdale LLP
St. Louis, Missouri
Special Securities Counsel
Muldoon Murphy & Aguggia LLP
Washington, D.C.
Stock Transfer Agent
Registrar and Transfer Company
Cranford, New Jersey
800.866.1340
www.rtco.com
Investor Relations
The Investor Relations Company
Chicago, Illinois
312.245.2700
www.tirc.com
ANNUAL MEETING
The annual meeting of the stockholders will be held Thursday, February 7, 2008 at 2:00 p.m., Central Time, at The Crescent, 155 Carondelet Plaza, Clayton, Missouri.
- 73 -