
Amdocs Limited NASDAQ: DOX Shuky Sheffer President & CEO Fiscal Q4 2021 Earnings Presentation November 2, 2021 Tamar Rapaport-Dagim CFO & COO Exhibit 99.2
Disclaimer The information contained herein in this presentation or delivered or to be delivered to you during this presentation does not constitute an offer, expressed or implied, or a recommendation to do any transaction in Amdocs Limited securities or in any securities of its affiliates or subsidiaries. This presentation and the comments made by members of Amdocs management in conjunction with it include information that constitutes forward-looking statements made pursuant to the safe harbor provision of the Private Securities Litigation Reform Act of 1995, including statements about Amdocs’ growth and business results in future quarters. Although we believe the expectations reflected in such forward-looking statements are based upon reasonable assumptions, we can give no assurance that our expectations will be obtained or that any deviations will not be material. Such statements involve risks and uncertainties that may cause future results to differ from those anticipated. These risks include, but are not limited to, the effects of general economic conditions, the duration and severity of the COVID-19 pandemic, and its impact on the global economy, Amdocs’ ability to grow in the business markets that it serves, Amdocs’ ability to successfully integrate acquired businesses, adverse effects of market competition, rapid technological shifts that may render the Company's products and services obsolete, potential loss of a major customer, our ability to develop long-term relationships with our customers, and risks associated with operating businesses in the international market. Amdocs may elect to update these forward-looking statements at some point in the future; however, Amdocs specifically disclaims any obligation to do so. These and other risks are discussed at greater length in Amdocs’ filings with the Securities and Exchange Commission, including in our Annual Report on Form 20-F for the fiscal year ended September 30, 2020 filed on December 14, 2020 and our Form 6-K furnished for the first quarter of fiscal 2021 on February 16, 2021 and for the second quarter of fiscal 2021 on May 24, 2021 and for the third quarter of fiscal 2021 on August 16, 2021. This presentation includes non-GAAP financial measures, including non-GAAP operating margin, free cash flow, normalized free cash flow, revenue on a constant currency basis, non-GAAP net income and non-GAAP earnings per share. Free cash flow equals cash generated by operating activities less net capital expenditures and other. Normalized free cash flow, a measure of our operating performance, is further adjusted to exclude net capital expenditures related to the new campus development, payments for non-recurring and unusual charges (such as capital gains tax to be paid in relation to the divestiture of OpenMarket), and payments of acquisition related liabilities. These non-GAAP financial measures are not in accordance with, or an alternative for, generally accepted accounting principles and may be different from non-GAAP financial measures used by other companies. In addition, these non-GAAP financial measures are not based on any comprehensive set of accounting rules or principles. Amdocs believes that non-GAAP financial measures have limitations in that they do not reflect all of the amounts associated with Amdocs’ results of operations as determined in accordance with GAAP and that these measures should only be used to evaluate Amdocs’ results of operations in conjunction with the corresponding GAAP measures. Please refer to the appendix for a reconciliation of these metrics to the most comparable GAAP provision. This presentation also includes pro forma metrics which exclude the financial impact of OpenMarket (divested on December 31, 2020) from fiscal year 2021 and comparable fiscal year 2020, and the expected outlook for fiscal year 2022.

Today’s Speakers Shuky Sheffer President & Chief Executive Officer Tamar Rapaport-Dagim Chief Financial Officer & Chief Operating Officer
Earning call agenda 1 Strategic Overview & Business Performance Update Shuky Sheffer, President & Chief Executive Officer 1 2 Financial Review & FY2022 Outlook Tamar Rapaport-Dagim, Chief Financial Officer & Chief Operating Officer

Strategic Overview & Business Performance Update President & Chief Executive Officer Shuky Sheffer
CEO Strategy & Business Update 1 Q4 2021 Progress of strategic domains: executing against our key growth pillars 2 Looking ahead: sustain accelerated growth in FY2022 3 1 FY21: Inflection point for revenue growth
Thank you for a great FY2021 Thanks to our highly talented people and experienced leadership team Superb execution to meet our customers’ mission-critical requirements Continuous upskilling of our employees Give back to the communities in which we live and operate A pivotal year: executed on our strategy to drive accelerated revenue growth
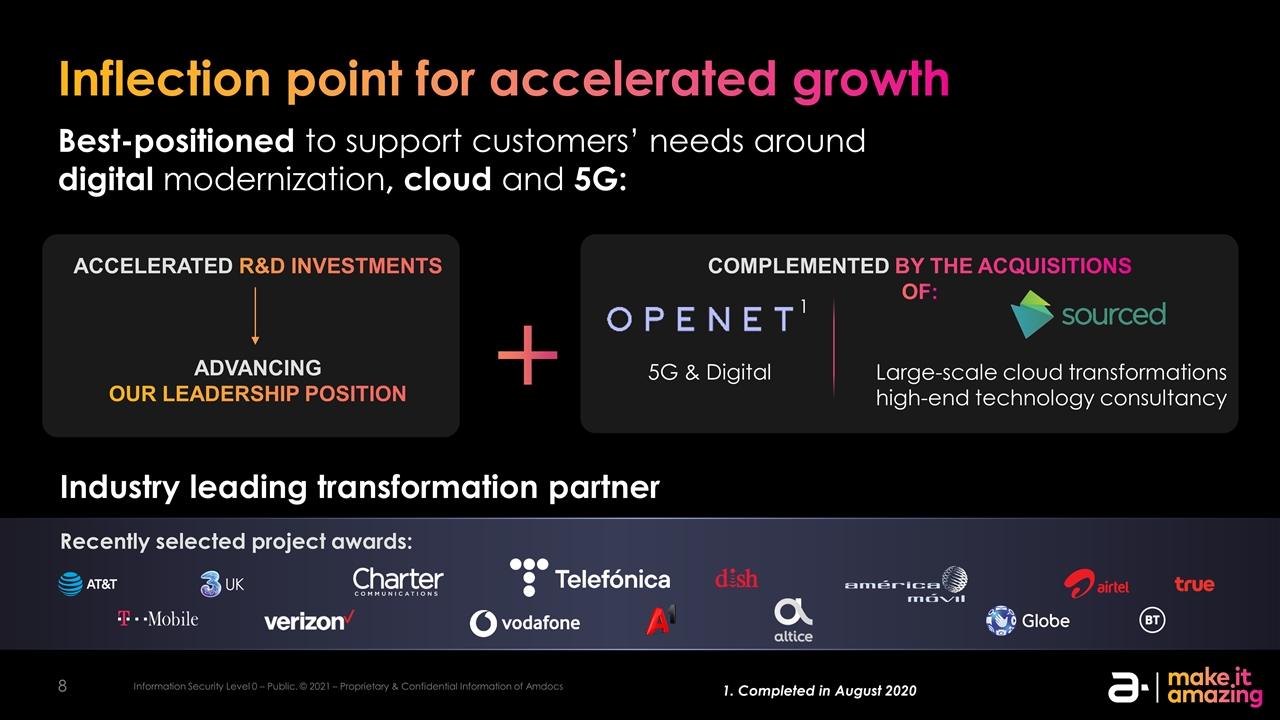
Inflection point for accelerated growth Best-positioned to support customers’ needs around digital modernization, cloud and 5G: 1. Completed in August 2020 UK VF: Germany, Romania, Czech Republic, Spain TEF: Movistar Perú , Movistar Chile Altice: USA American Movil: Claro Chile, Claro Puerto Rico, Claro, Brazil ACCELERATED R&D INVESTMENTS ADVANCING OUR LEADERSHIP POSITION Complemented by the acquisitions of: 5G & Digital Large-scale cloud transformations high-end technology consultancy 1 Recently selected project awards: Industry leading transformation partner
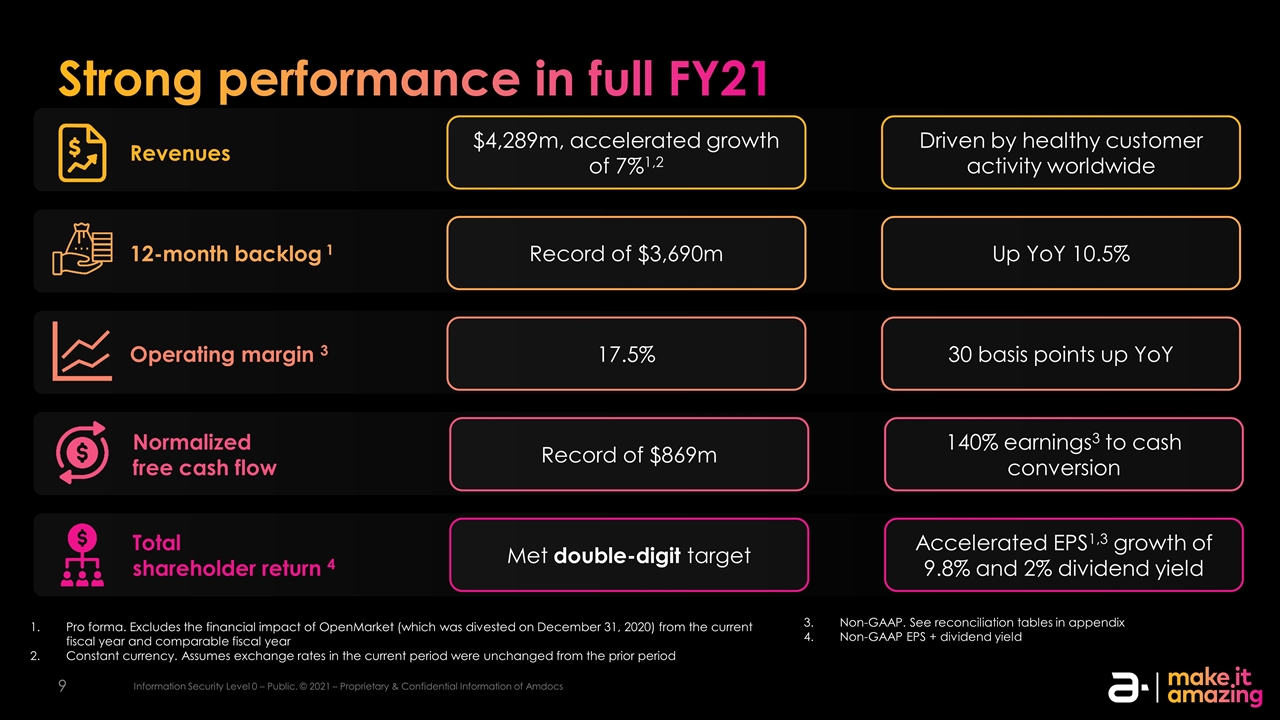
Strong performance in full FY21 Operating margin 3 17.5% 30 basis points up YoY Total shareholder return 4 Met double-digit target Accelerated EPS1,3 growth of 9.8% and 2% dividend yield Normalized free cash flow Record of $869m 140% earnings3 to cash conversion Revenues Record of $3,690m Up YoY 10.5% 12-month backlog 1 $4,289m, accelerated growth of 7%1,2 Driven by healthy customer activity worldwide Pro forma. Excludes the financial impact of OpenMarket (which was divested on December 31, 2020) from the current fiscal year and comparable fiscal year Constant currency. Assumes exchange rates in the current period were unchanged from the prior period Non-GAAP. See reconciliation tables in appendix Non-GAAP EPS + dividend yield
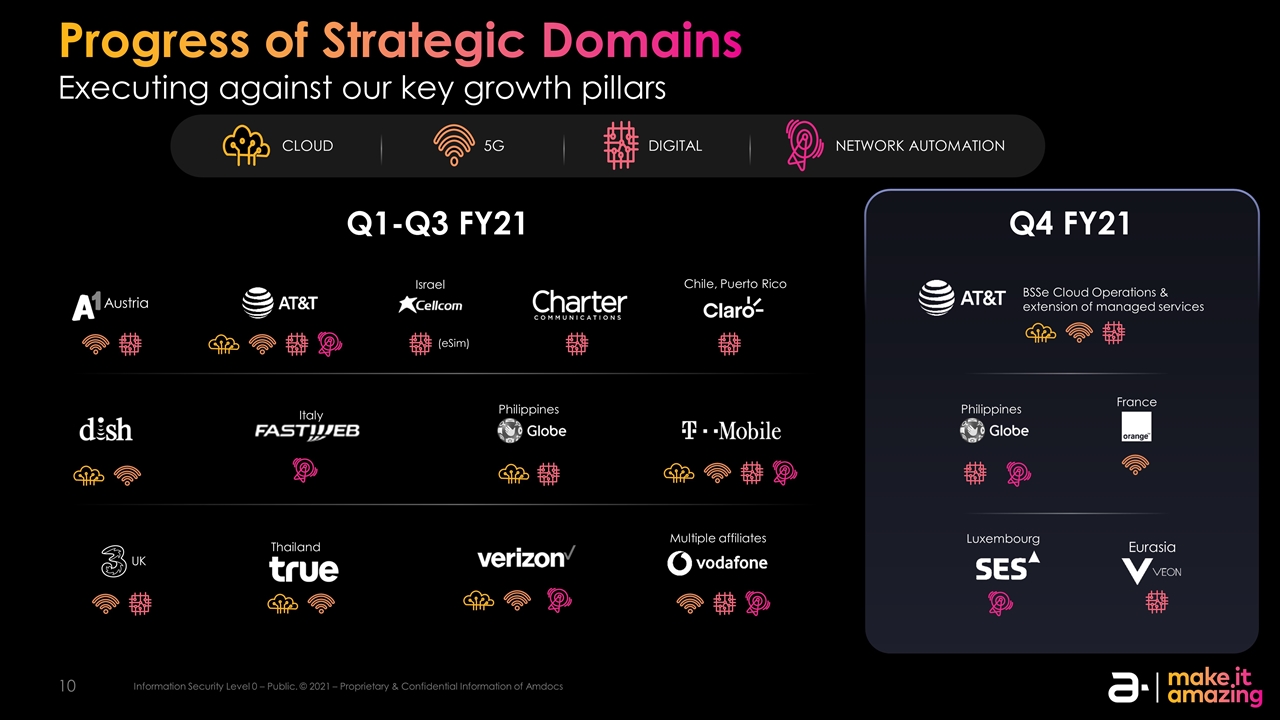
Progress of Strategic Domains Executing against our key growth pillars Q4 FY21 Q1-Q3 FY21 Austria Italy Chile, Puerto Rico Bsse key words – emphasize – ask from matt the script language – amir will add UK Multiple affiliates France DIGITAL NETWORK AUTOMATION 5G CLOUD Philippines BSSe Cloud Operations & extension of managed services Luxembourg Thailand Eurasia Philippines Israel (eSim)
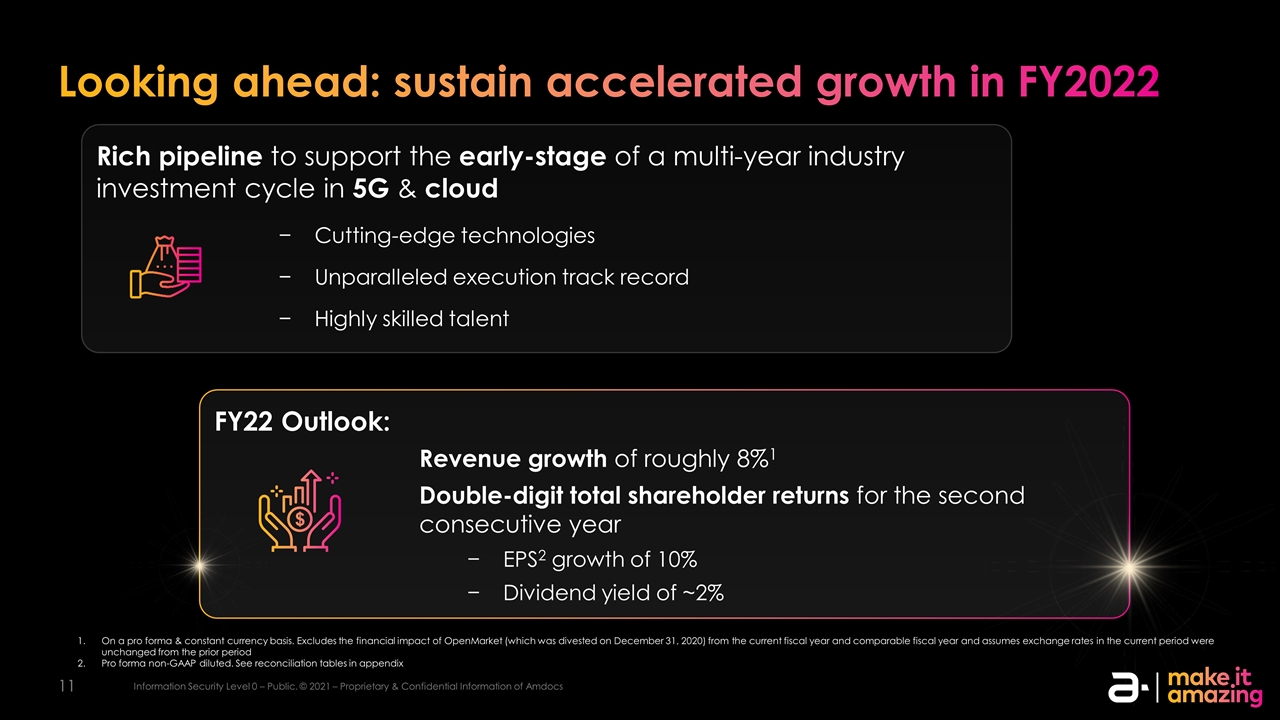
FY22 Outlook: Rich pipeline to support the early-stage of a multi-year industry investment cycle in 5G & cloud Looking ahead: sustain accelerated growth in FY2022 Revenue growth of roughly 8%1 Double-digit total shareholder returns for the second consecutive year EPS2 growth of 10% Dividend yield of ~2% Cutting-edge technologies Unparalleled execution track record Highly skilled talent On a pro forma & constant currency basis. Excludes the financial impact of OpenMarket (which was divested on December 31, 2020) from the current fiscal year and comparable fiscal year and assumes exchange rates in the current period were unchanged from the prior period Pro forma non-GAAP diluted. See reconciliation tables in appendix

Financial Update & FY2022 Outlook Chief Financial Officer & Chief Operating Officer Tamar Rapaport-Dagim
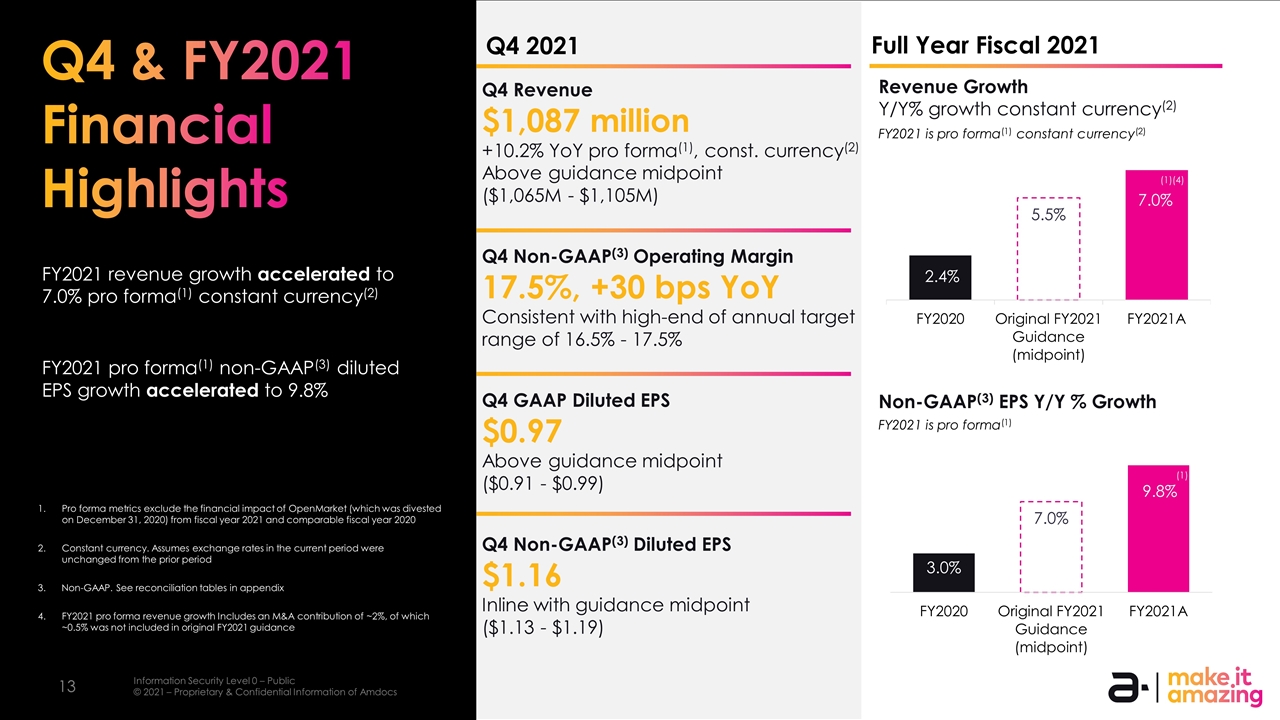
Q4 & FY2021 Financial Highlights Non-GAAP(3) EPS Y/Y % Growth Revenue Growth Y/Y% growth constant currency(2) Q4 2021 Full Year Fiscal 2021 FY2021 revenue growth accelerated to 7.0% pro forma(1) constant currency(2) FY2021 pro forma(1) non-GAAP(3) diluted EPS growth accelerated to 9.8% Pro forma metrics exclude the financial impact of OpenMarket (which was divested on December 31, 2020) from fiscal year 2021 and comparable fiscal year 2020 (1)(4) (1) FY2021 is pro forma(1) constant currency(2) FY2021 is pro forma(1) 3. Non-GAAP. See reconciliation tables in appendix FY2021 pro forma revenue growth Includes an M&A contribution of ~2%, of which ~0.5% was not included in original FY2021 guidance Q4 Revenue $1,087 million +10.2% YoY pro forma(1), const. currency(2) Above guidance midpoint ($1,065M - $1,105M) Q4 Non-GAAP(3) Operating Margin 17.5%, +30 bps YoY Consistent with high-end of annual target range of 16.5% - 17.5% Q4 GAAP Diluted EPS $0.97 Above guidance midpoint ($0.91 - $0.99) Q4 Non-GAAP(3) Diluted EPS $1.16 Inline with guidance midpoint ($1.13 - $1.19) Constant currency. Assumes exchange rates in the current period were unchanged from the prior period
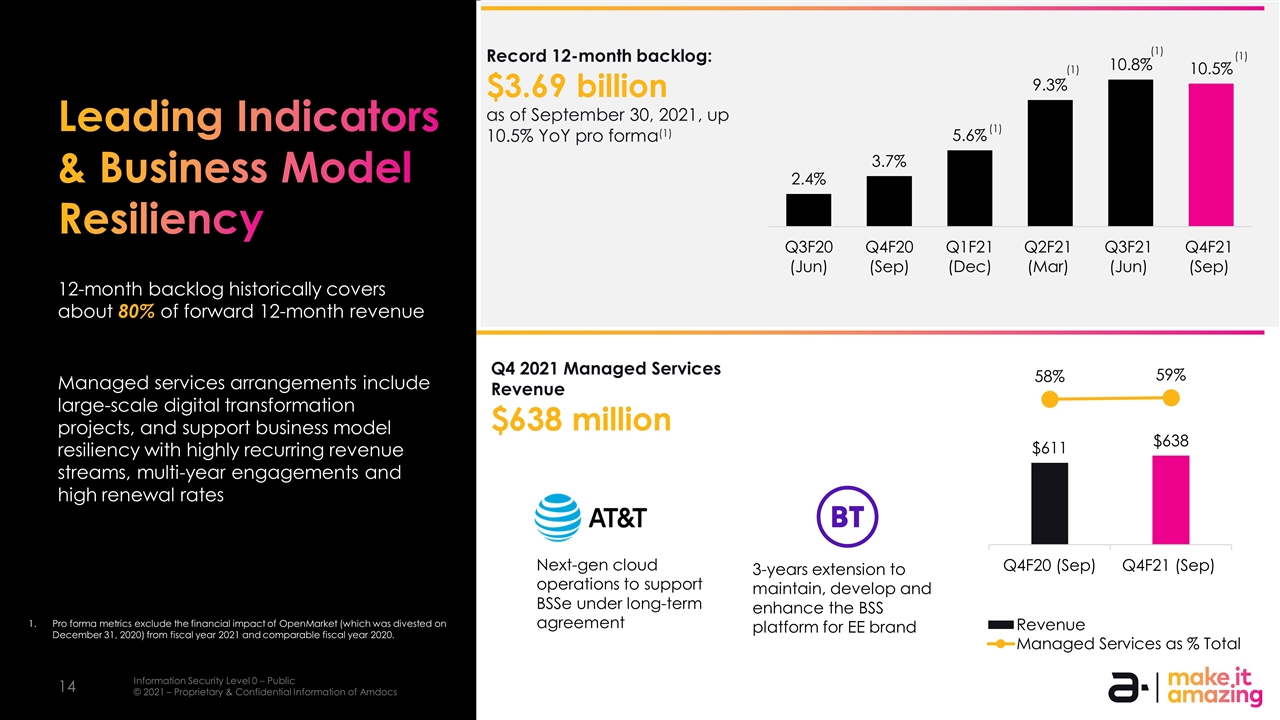
Leading Indicators & Business Model Resiliency 12-month backlog historically covers about 80% of forward 12-month revenue Managed services arrangements include large-scale digital transformation projects, and support business model resiliency with highly recurring revenue streams, multi-year engagements and high renewal rates Record 12-month backlog: $3.69 billion as of September 30, 2021, up 10.5% YoY pro forma(1) Q4 2021 Managed Services Revenue $638 million (1) (1) (1) (1) Next-gen cloud operations to support BSSe under long-term agreement 3-years extension to maintain, develop and enhance the BSS platform for EE brand Pro forma metrics exclude the financial impact of OpenMarket (which was divested on December 31, 2020) from fiscal year 2021 and comparable fiscal year 2020.

Balance Sheet & Cash Flow We remain comfortable with our balance sheet Ample liquidity to support ongoing business needs while retaining the capacity to fund future strategic growth investments Liquidity $1.5 billion FY2021 normalized free cash flow(2) $869 million Exceeded original guidance of $620M DSO’s 73 days -2 days YoY and -6 days QoQ DSO’s may fluctuate from quarter to quarter Deferred revenue > unbilled +$145 million Deferred revenue: -$12M QoQ Unbilled receivables: -$9M QoQ Items fluctuate from quarter to quarter in line with normal business activities. Ample liquidity including available $500M revolving credit facility Baa2 Moody’s BBB S&P Investment grade credit rating FY2021 Free cash flow(2) bridge $ Millions Credit Facility Cash $650M senior note, maturing June 2030 (1) Figures may mot sum due to rounding Non-GAAP. See reconciliation tables in appendix (3) Includes $40M tax payment on the divestiture of OpenMarket
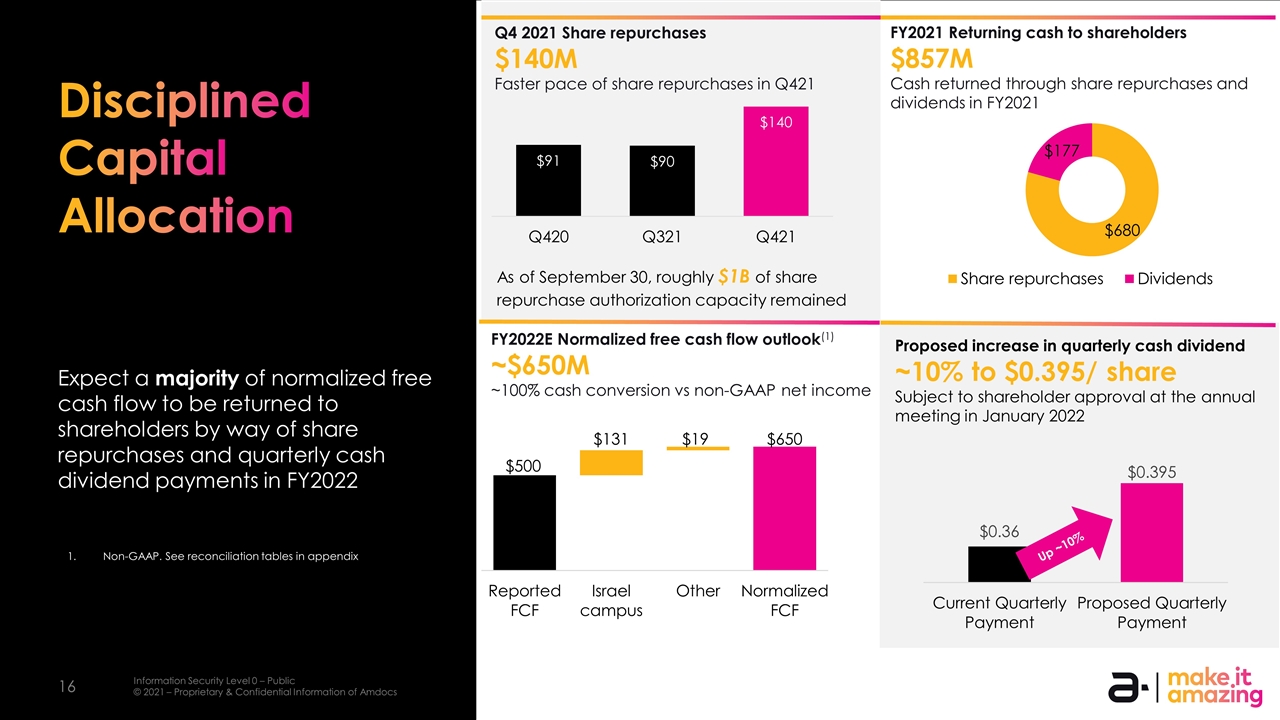
Disciplined Capital Allocation Expect a majority of normalized free cash flow to be returned to shareholders by way of share repurchases and quarterly cash dividend payments in FY2022 FY2021 Returning cash to shareholders $857M Cash returned through share repurchases and dividends in FY2021 FY2022E Normalized free cash flow outlook(1) ~$650M ~100% cash conversion vs non-GAAP net income Q4 2021 Share repurchases $140M Faster pace of share repurchases in Q421 Proposed increase in quarterly cash dividend ~10% to $0.395/ share Subject to shareholder approval at the annual meeting in January 2022 Up ~10% As of September 30, roughly $1B of share repurchase authorization capacity remained 1. Non-GAAP. See reconciliation tables in appendix
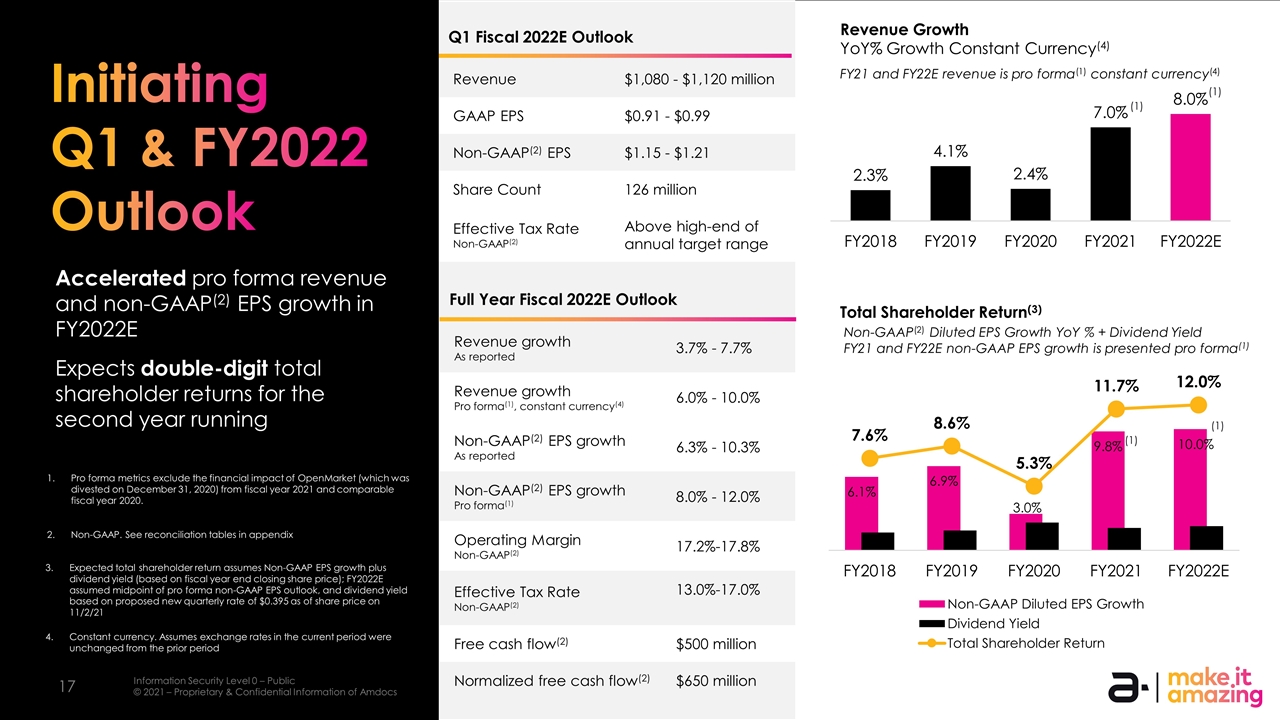
Initiating Q1 & FY2022 Outlook Accelerated pro forma revenue and non-GAAP(2) EPS growth in FY2022E Expects double-digit total shareholder returns for the second year running Total Shareholder Return(3) Non-GAAP(2) Diluted EPS Growth YoY % + Dividend Yield FY21 and FY22E non-GAAP EPS growth is presented pro forma(1) (1) (1) (1) (1) Q1 Fiscal 2022E Outlook Category Revenue $1,080 - $1,120 million GAAP EPS $0.91 - $0.99 Non-GAAP(2) EPS $1.15 - $1.21 Share Count 126 million Effective Tax Rate Non-GAAP(2) Above high-end of annual target range Full Year Fiscal 2022E Outlook Category Revenue growth As reported 3.7% - 7.7% Revenue growth Pro forma(1), constant currency(4) 6.0% - 10.0% Non-GAAP(2) EPS growth As reported 6.3% - 10.3% Non-GAAP(2) EPS growth Pro forma(1) 8.0% - 12.0% Operating Margin Non-GAAP(2) 17.2%-17.8% Effective Tax Rate Non-GAAP(2) 13.0%-17.0% Free cash flow(2) $500 million Normalized free cash flow(2) $650 million Pro forma metrics exclude the financial impact of OpenMarket (which was divested on December 31, 2020) from fiscal year 2021 and comparable fiscal year 2020. Expected total shareholder return assumes Non-GAAP EPS growth plus dividend yield (based on fiscal year end closing share price); FY2022E assumed midpoint of pro forma non-GAAP EPS outlook, and dividend yield based on proposed new quarterly rate of $0.395 as of share price on 11/2/21 Non-GAAP. See reconciliation tables in appendix Constant currency. Assumes exchange rates in the current period were unchanged from the prior period

Amdocs: Enter the Future FY2022 Analyst & Investor Business Update Please join Amdocs’ management for this virtual event, in which we will provide an overview of the strong foundation built over the last several years to position Amdocs for success in an increasingly digital world. Hear from Amdocs’ President & CEO Shuky Sheffer, CFO & COO Tamar Rapaport-Dagim, and Group President of Technology & Head of Strategy Anthony Goonetilleke who will discuss Amdocs’ strategic journey to accelerated growth and unique competitive advantages to capture the market opportunities ahead. November 5, 2021 | 9:30 am – 12:00 pm ET To access the live event, please visit https://investors.amdocs.com/ Materials and replay available at the same link

Q&A


Appendix Reconciliation Tables

Reconciliation Tables Since January 1, 2021, OpenMarket results are not included in the Consolidated Statements of Income given its divestiture. Tax payment related to capital gain from divesture of OpenMarket, which was completed on December 31, 2020. The amounts under "Purchase of property and equipment, net” include proceeds from sale of property and equipment of $328 and $194 for the Fiscal year ended September 30, 2021 and 2020, respectively.
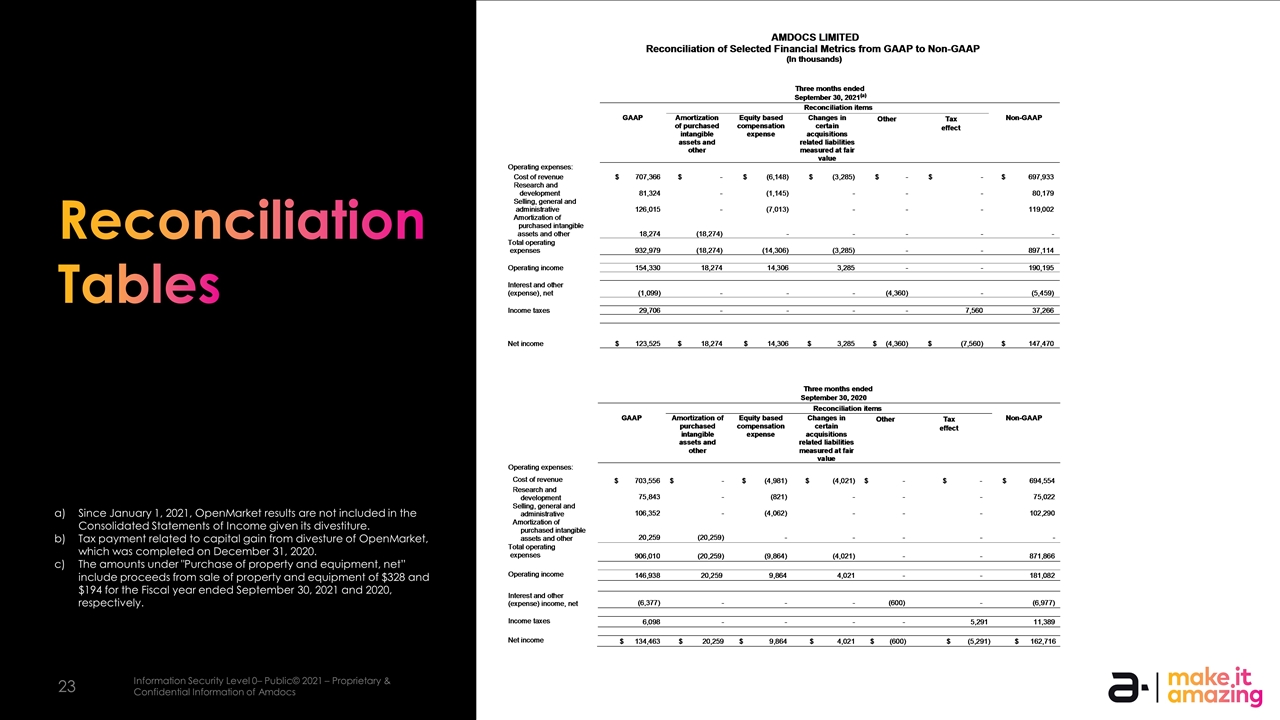
Reconciliation Tables Since January 1, 2021, OpenMarket results are not included in the Consolidated Statements of Income given its divestiture. Tax payment related to capital gain from divesture of OpenMarket, which was completed on December 31, 2020. The amounts under "Purchase of property and equipment, net” include proceeds from sale of property and equipment of $328 and $194 for the Fiscal year ended September 30, 2021 and 2020, respectively.
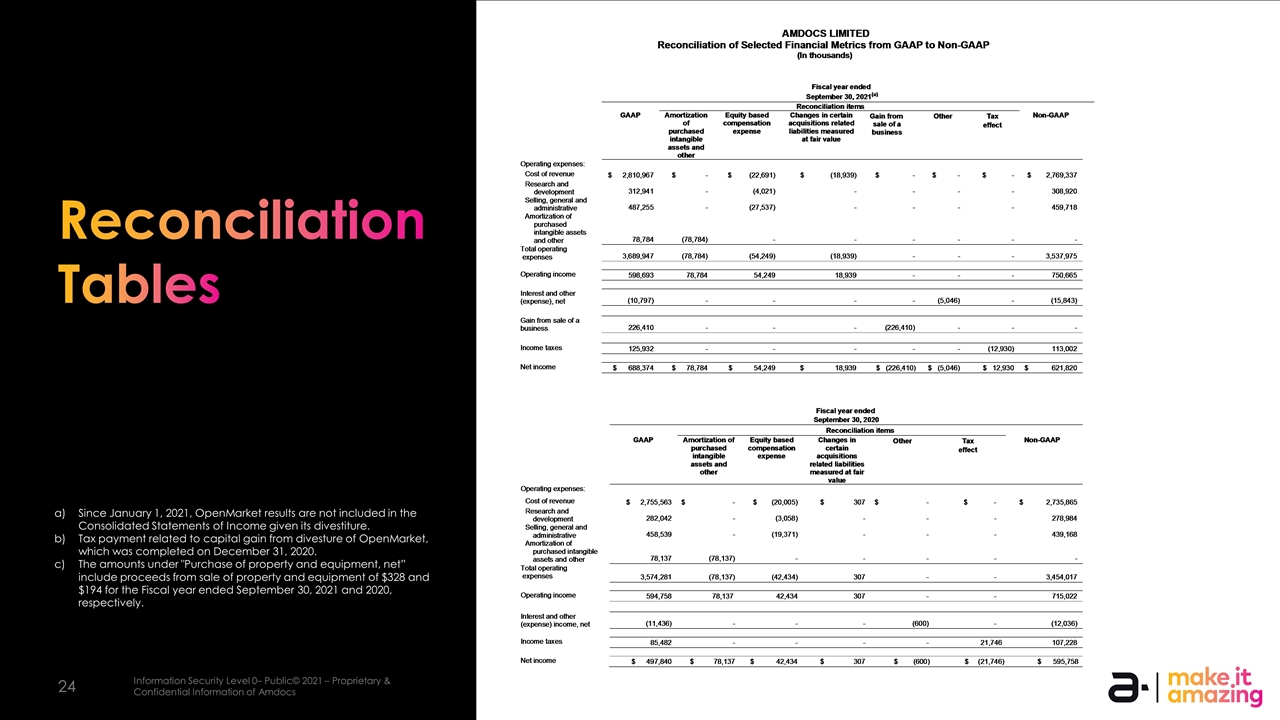
Reconciliation Tables Since January 1, 2021, OpenMarket results are not included in the Consolidated Statements of Income given its divestiture. Tax payment related to capital gain from divesture of OpenMarket, which was completed on December 31, 2020. The amounts under "Purchase of property and equipment, net” include proceeds from sale of property and equipment of $328 and $194 for the Fiscal year ended September 30, 2021 and 2020, respectively.


