
Amdocs Limited NASDAQ: DOX Fiscal Q3 2022 Earnings Presentation August 3, 2022 Tamar Rapaport-Dagim CFO & COO Shuky Sheffer President & CEO Exhibit 99.2
Disclaimer The information contained herein in this presentation or delivered or to be delivered to you during this presentation does not constitute an offer, expressed or implied, or a recommendation to do any transaction in Amdocs Limited securities or in any securities of its affiliates or subsidiaries. This presentation and the comments made by members of Amdocs management in conjunction with it include information that constitutes forward-looking statements made pursuant to the safe harbor provision of the Private Securities Litigation Reform Act of 1995, including statements about Amdocs’ growth and business results in future quarters. Although we believe the expectations reflected in such forward-looking statements are based upon reasonable assumptions, we can give no assurance that our expectations will be obtained or that any deviations will not be material. Such statements involve risks and uncertainties that may cause future results to differ from those anticipated. These risks include, but are not limited to, the effects of general economic conditions, prevailing level of macroeconomic, business and operational uncertainty, the duration and severity of the COVID-19 pandemic, and its impact on the global economy, Amdocs’ ability to grow in the business markets that it serves, Amdocs’ ability to successfully integrate acquired businesses, adverse effects of market competition, rapid technological shifts that may render the Company's products and services obsolete, potential loss of a major customer, our ability to develop long-term relationships with our customers, and risks associated with operating businesses in the international market. Amdocs may elect to update these forward-looking statements at some point in the future; however, Amdocs specifically disclaims any obligation to do so. These and other risks are discussed at greater length in Amdocs’ filings with the Securities and Exchange Commission, including in our Annual Report on Form 20-F for the fiscal year ended September 30, 2021 filed on December 9, 2021, and our Form 6-K furnished for the first quarter of fiscal 2022 on February 14, 2022 and for the second quarter of fiscal 2022 on May 24, 2022. This presentation includes non-GAAP financial measures, including non-GAAP operating margin, free cash flow, normalized free cash flow, revenue on a constant currency basis, non-GAAP net income and non-GAAP earnings per share. Free cash flow equals cash generated by operating activities less net capital expenditures and other. Normalized free cash flow, a measure of our operating performance, is further adjusted to exclude net capital expenditures related to the new campus development, payments for non-recurring and unusual charges (such as capital gains tax to be paid in relation to the divestiture of OpenMarket), and payments of acquisition related liabilities. These non-GAAP financial measures are not in accordance with, or an alternative for, generally accepted accounting principles and may be different from non-GAAP financial measures used by other companies. In addition, these non-GAAP financial measures are not based on any comprehensive set of accounting rules or principles. Amdocs believes that non-GAAP financial measures have limitations in that they do not reflect all of the amounts associated with Amdocs’ results of operations as determined in accordance with GAAP and that these measures should only be used to evaluate Amdocs’ results of operations in conjunction with the corresponding GAAP measures. Please refer to the appendix for a reconciliation of these metrics to the most comparable GAAP provision. This presentation also includes pro forma metrics which exclude the financial impact of OpenMarket (divested on December 31, 2020) from fiscal year 2021. Please also review the information contained in Amdocs’ press release dated August 3, 2022 with respect to earnings for fiscal Q3 2022. The press release contains additional information regarding Amdocs’ outlook for fiscal years 2022, 2023 and 2024 and certain non-GAAP metrics and their reconciliations.

Today’s Speakers Shuky Sheffer President & Chief Executive Officer Tamar Rapaport-Dagim Chief Financial Officer & Chief Operating Officer
Earnings call agenda 1 Strategy & Business Performance Update Shuky Sheffer, President & Chief Executive Officer 1 2 Financial Review & Outlook Tamar Rapaport-Dagim, Chief Financial Officer & Chief Operating Officer 3 Q&A
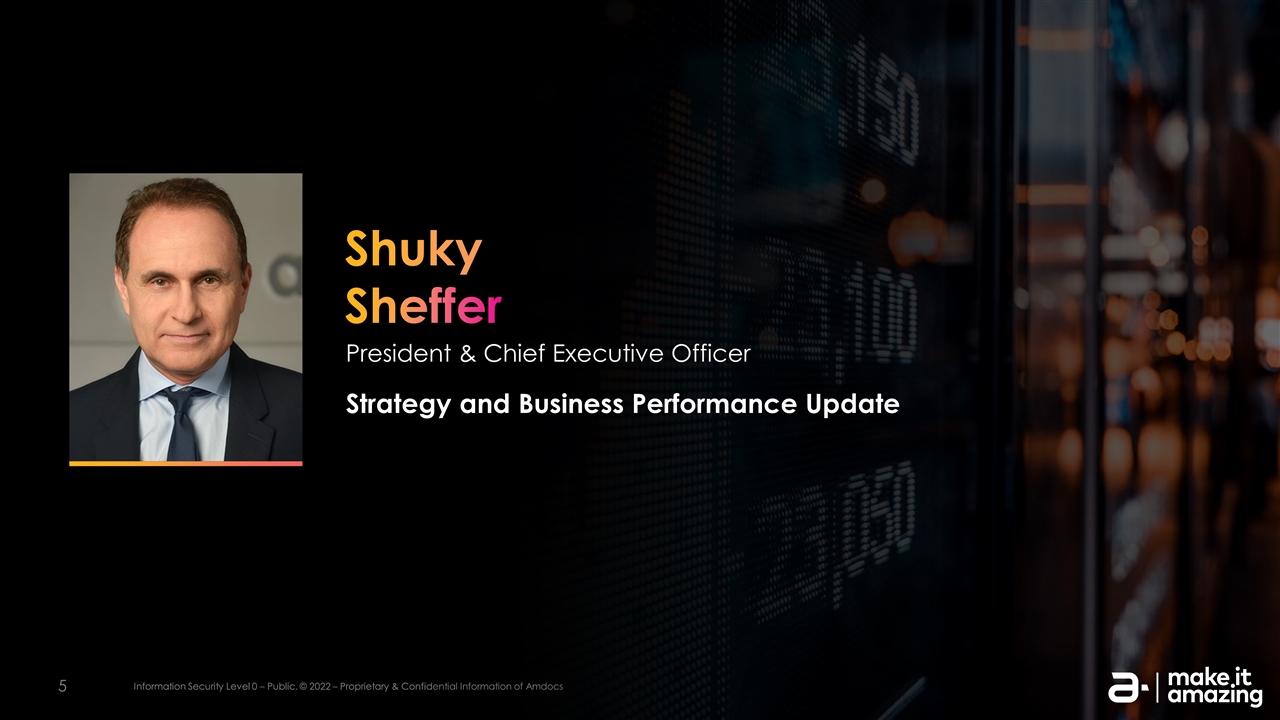
Strategy and Business Performance Update President & Chief Executive Officer Shuky Sheffer
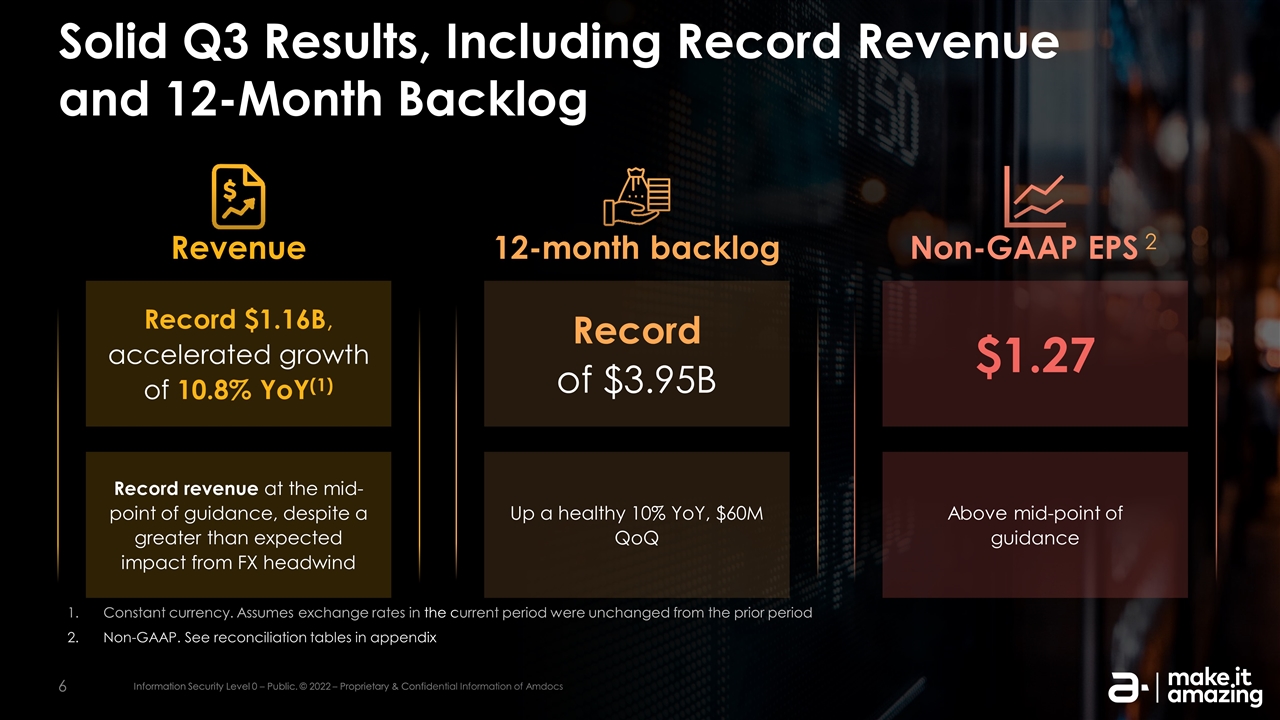
Solid Q3 Results, Including Record Revenue and 12-Month Backlog Constant currency. Assumes exchange rates in the current period were unchanged from the prior period Non-GAAP. See reconciliation tables in appendix $1.27 Above mid-point of guidance Up a healthy 10% YoY, $60M QoQ Record of $3.95B Record $1.16B, accelerated growth of 10.8% YoY(1) Record revenue at the mid-point of guidance, despite a greater than expected impact from FX headwind Revenue Non-GAAP EPS 2 12-month backlog
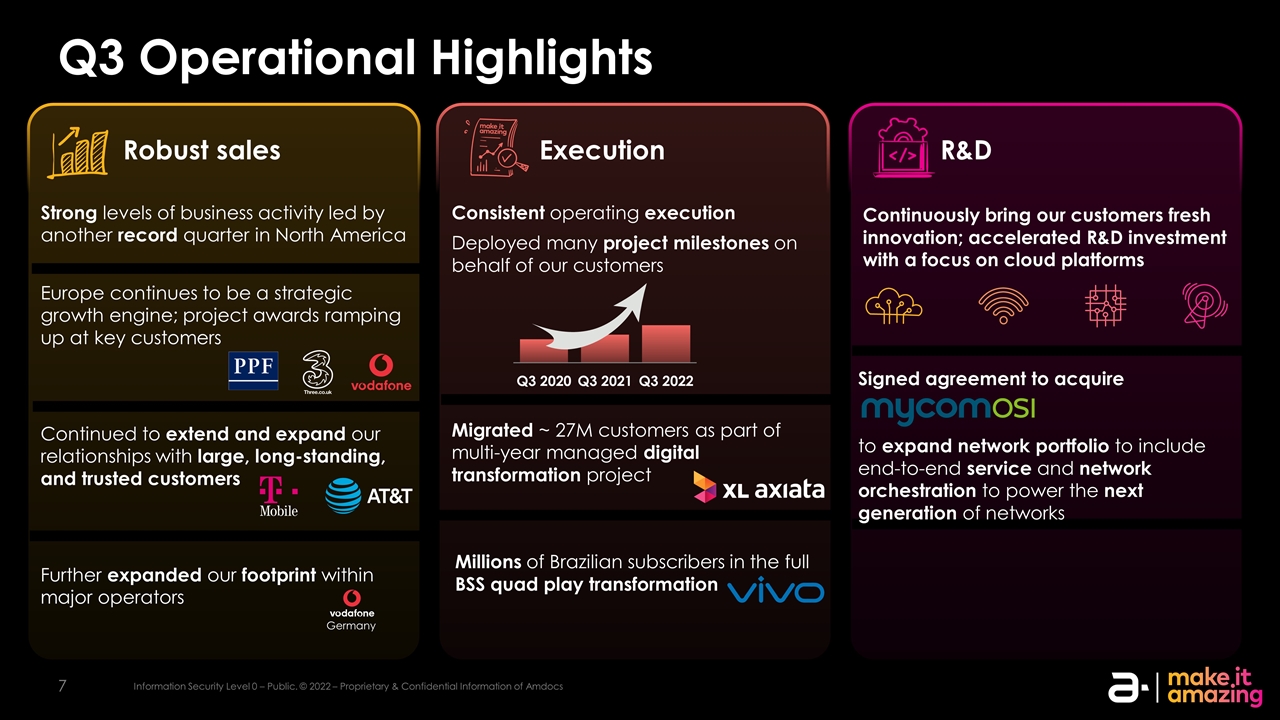
Robust sales Execution Q3 Operational Highlights R&D Continued to extend and expand our relationships with large, long-standing, and trusted customers Further expanded our footprint within major operators Strong levels of business activity led by another record quarter in North America Europe continues to be a strategic growth engine; project awards ramping up at key customers Consistent operating execution Deployed many project milestones on behalf of our customers Migrated ~ 27M customers as part of multi-year managed digital transformation project Millions of Brazilian subscribers in the full BSS quad play transformation Continuously bring our customers fresh innovation; accelerated R&D investment with a focus on cloud platforms Signed agreement to acquire to expand network portfolio to include end-to-end service and network orchestration to power the next generation of networks Germany
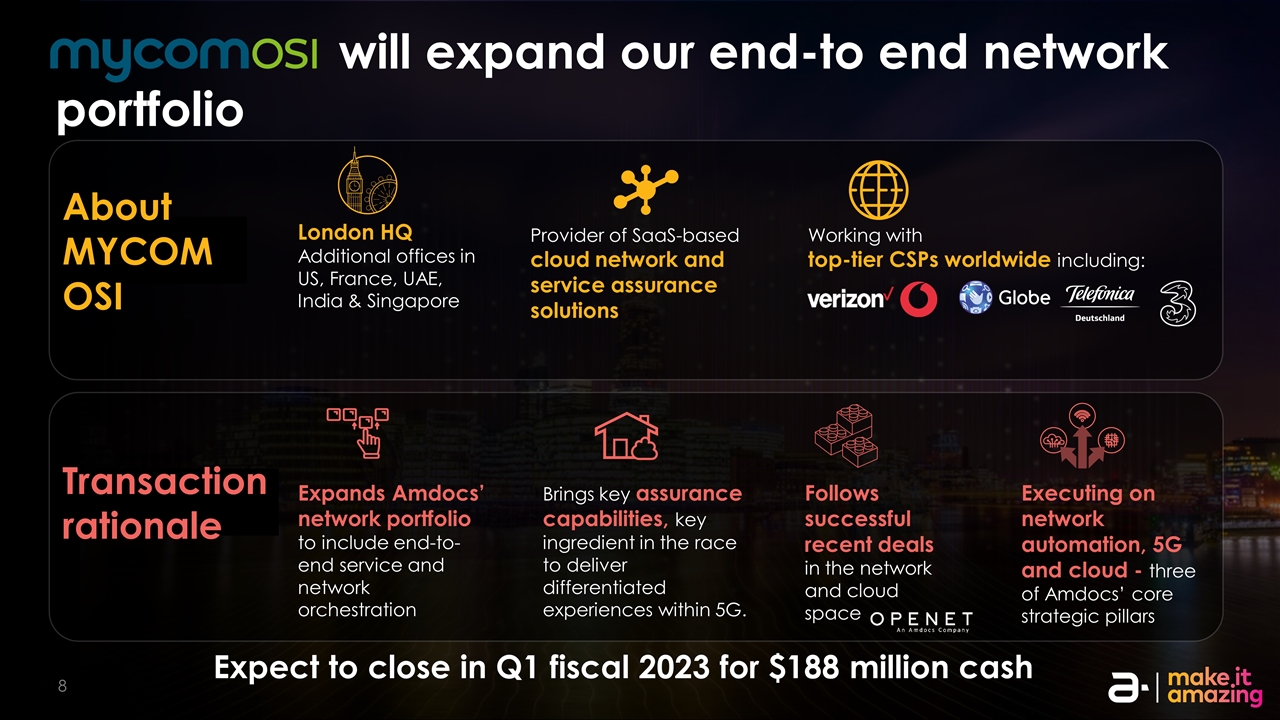
About MYCOM OSI Transaction rationale Provider of SaaS-based cloud network and service assurance solutions London HQ Additional offices in US, France, UAE, India & Singapore Expands Amdocs’ network portfolio to include end-to-end service and network orchestration Brings key assurance capabilities, key ingredient in the race to deliver differentiated experiences within 5G. Executing on network automation, 5G and cloud - three of Amdocs’ core strategic pillars Working with top-tier CSPs worldwide including: Follows successful recent deals in the network and cloud space Expect to close in Q1 fiscal 2023 for $188 million cash will expand our end-to end network portfolio
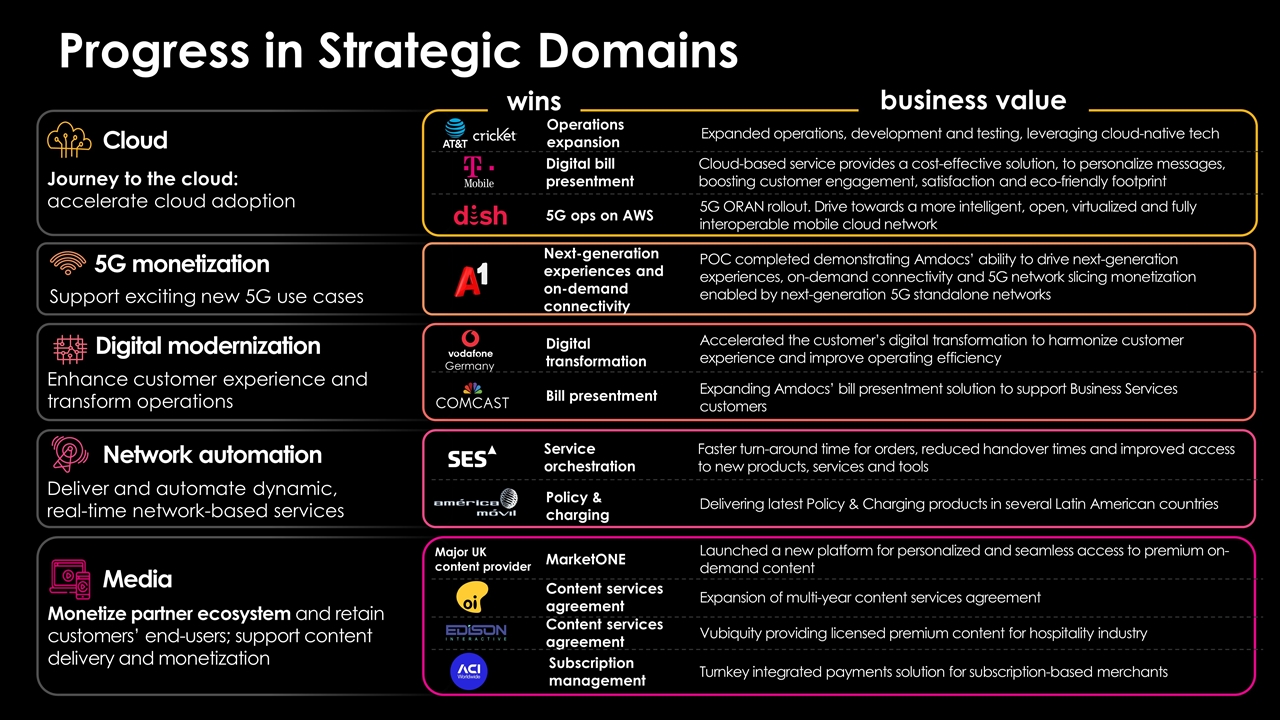
Progress in Strategic Domains Digital bill presentment 5G ops on AWS 5G ORAN rollout. Drive towards a more intelligent, open, virtualized and fully interoperable mobile cloud network Journey to the cloud: accelerate cloud adoption Cloud Cloud-based service provides a cost-effective solution, to personalize messages, boosting customer engagement, satisfaction and eco-friendly footprint Support exciting new 5G use cases 5G monetization Next-generation experiences and on-demand connectivity Digital transformation Enhance customer experience and transform operations Digital modernization POC completed demonstrating Amdocs’ ability to drive next-generation experiences, on-demand connectivity and 5G network slicing monetization enabled by next-generation 5G standalone networks Accelerated the customer’s digital transformation to harmonize customer experience and improve operating efficiency Launched a new platform for personalized and seamless access to premium on-demand content Monetize partner ecosystem and retain customers’ end-users; support content delivery and monetization Media Expansion of multi-year content services agreement Turnkey integrated payments solution for subscription-based merchants Service orchestration Faster turn-around time for orders, reduced handover times and improved access to new products, services and tools Deliver and automate dynamic, real-time network-based services Network automation Policy & charging Delivering latest Policy & Charging products in several Latin American countries Content services agreement Subscription management business value wins Bill presentment Expanding Amdocs’ bill presentment solution to support Business Services customers MarketONE Content services agreement Vubiquity providing licensed premium content for hospitality industry Major UK content provider Expanded operations, development and testing, leveraging cloud-native tech Operations expansion Germany
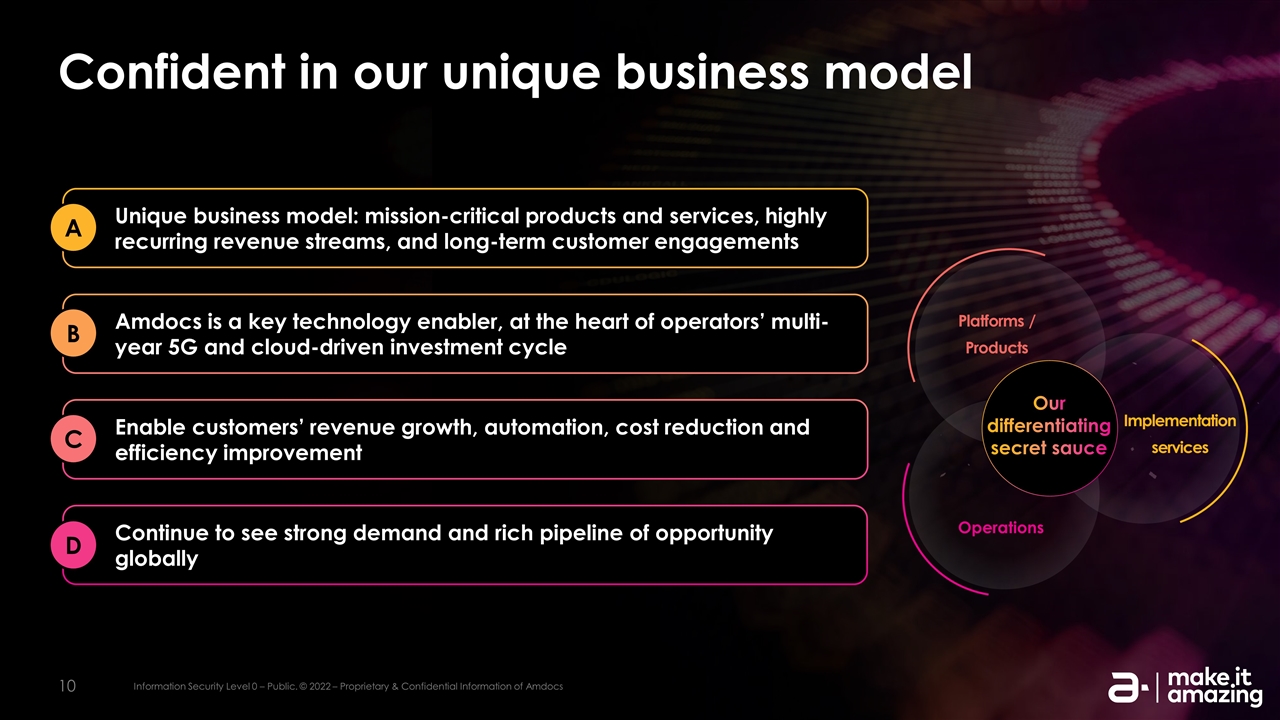
Confident in our unique business model Unique business model: mission-critical products and services, highly recurring revenue streams, and long-term customer engagements Amdocs is a key technology enabler, at the heart of operators’ multi-year 5G and cloud-driven investment cycle Enable customers’ revenue growth, automation, cost reduction and efficiency improvement Continue to see strong demand and rich pipeline of opportunity globally A B C D Operations Implementation services Platforms / Products Our differentiating secret sauce
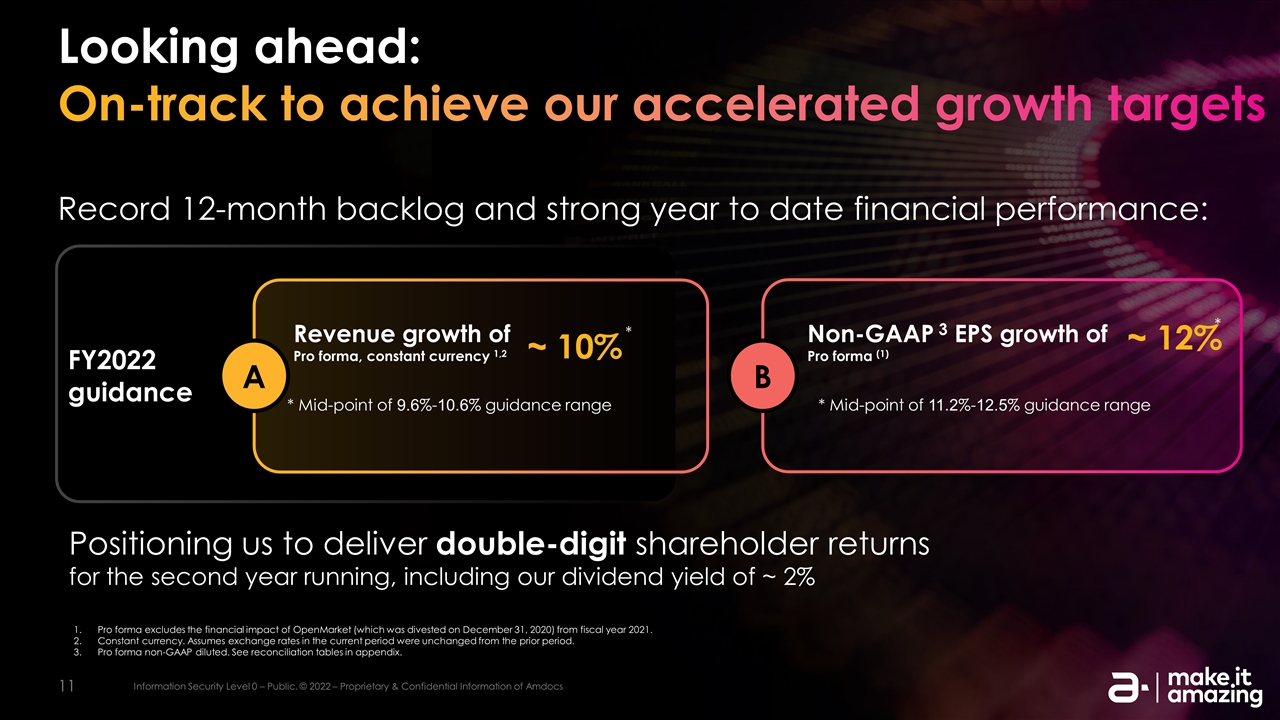
Looking ahead: On-track to achieve our accelerated growth targets Pro forma excludes the financial impact of OpenMarket (which was divested on December 31, 2020) from fiscal year 2021. Constant currency. Assumes exchange rates in the current period were unchanged from the prior period. Pro forma non-GAAP diluted. See reconciliation tables in appendix. Record 12-month backlog and strong year to date financial performance: Positioning us to deliver double-digit shareholder returns for the second year running, including our dividend yield of ~ 2% A B FY2022 guidance Revenue growth of Pro forma, constant currency 1,2 Non-GAAP 3 EPS growth of Pro forma (1) ~ 12% ~ 10% * * * Mid-point of 9.6%-10.6% guidance range * Mid-point of 11.2%-12.5% guidance range
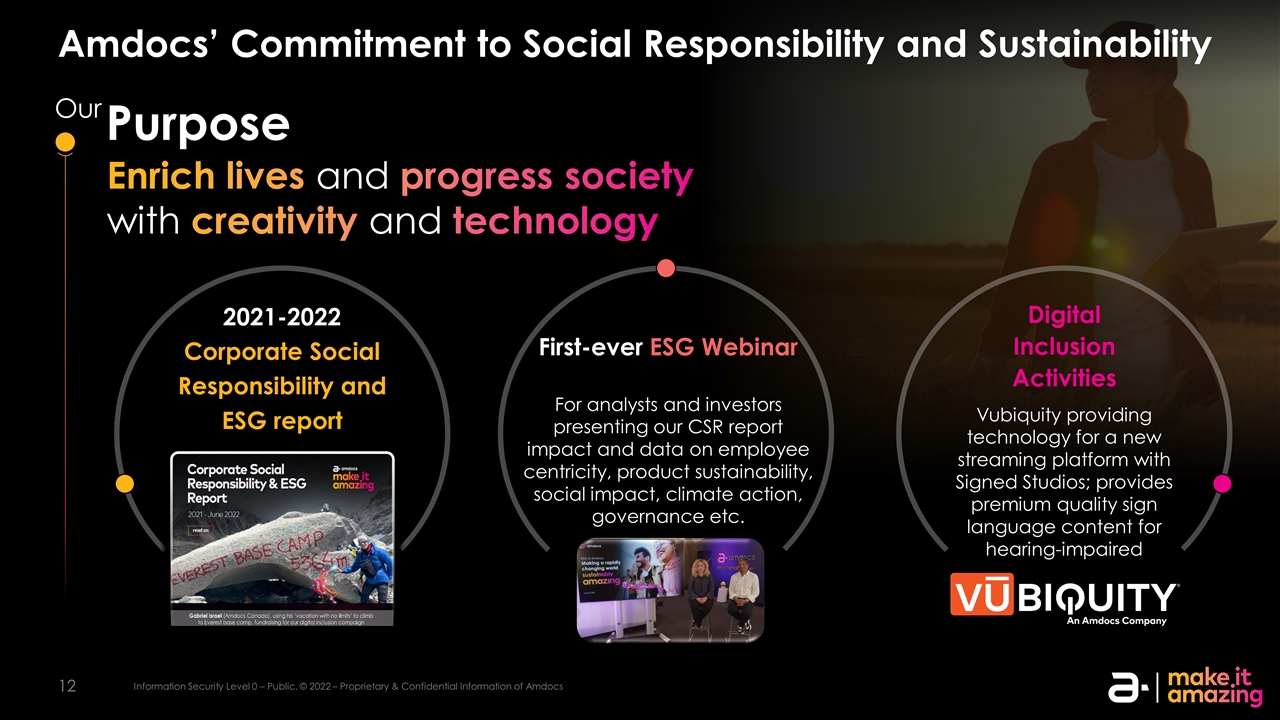
Enrich lives and progress society with creativity and technology Our Purpose Amdocs’ Commitment to Social Responsibility and Sustainability 2021-2022 Corporate Social Responsibility and ESG report Vubiquity providing technology for a new streaming platform with Signed Studios; provides premium quality sign language content for hearing-impaired First-ever ESG Webinar For analysts and investors presenting our CSR report impact and data on employee centricity, product sustainability, social impact, climate action, governance etc. Digital Inclusion Activities

I would like to acknowledge and thank all our customers, partners, shareholders, and communities for together working to create a better-connected world I want to especially thank our global and diverse base of incredibly talented employees for their devotion to turning the boldest ideas into reality
Financial Update & Outlook Chief Financial Officer & Chief Operating Officer Tamar Rapaport-Dagim
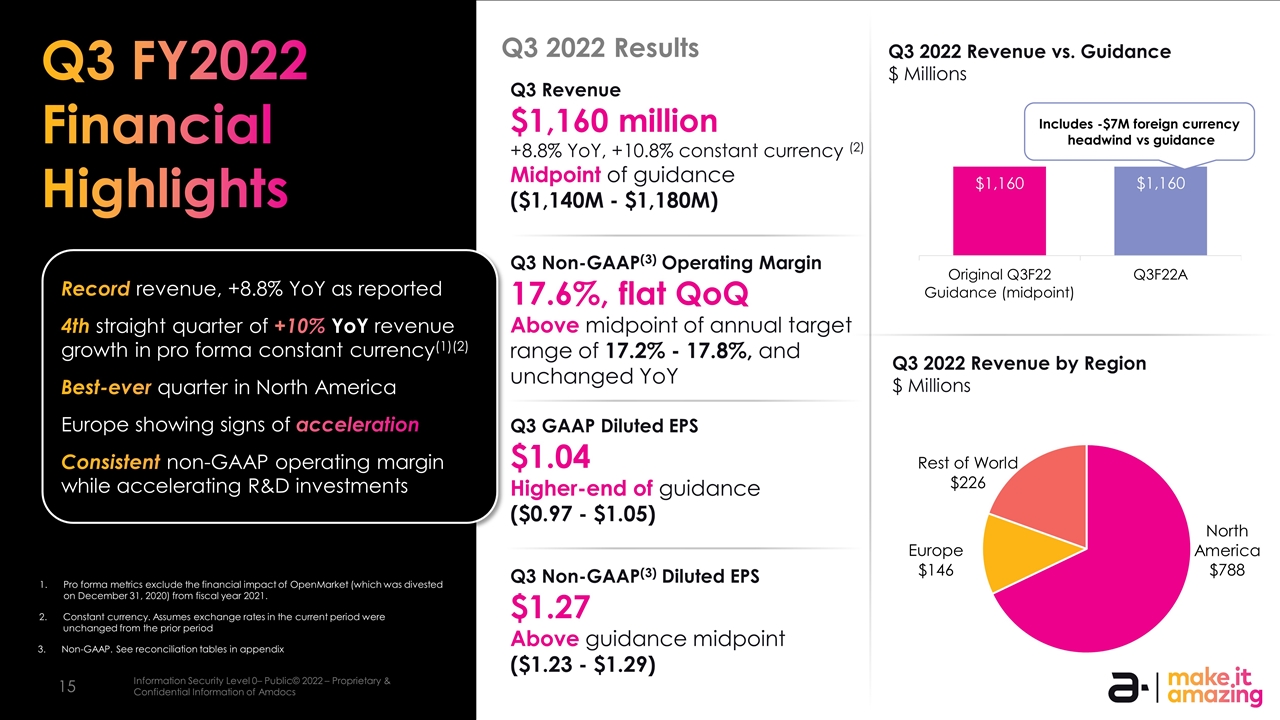
Q3 Revenue $1,160 million +8.8% YoY, +10.8% constant currency (2) Midpoint of guidance ($1,140M - $1,180M) Q3 Non-GAAP(3) Operating Margin 17.6%, flat QoQ Above midpoint of annual target range of 17.2% - 17.8%, and unchanged YoY Q3 GAAP Diluted EPS $1.04 Higher-end of guidance ($0.97 - $1.05) Q3 Non-GAAP(3) Diluted EPS $1.27 Above guidance midpoint ($1.23 - $1.29) Q3 FY2022 Financial Highlights Q3 2022 Revenue by Region $ Millions Q3 2022 Revenue vs. Guidance $ Millions Q3 2022 Results Pro forma metrics exclude the financial impact of OpenMarket (which was divested on December 31, 2020) from fiscal year 2021. 3. Non-GAAP. See reconciliation tables in appendix Constant currency. Assumes exchange rates in the current period were unchanged from the prior period Includes -$7M foreign currency headwind vs guidance Record revenue, +8.8% YoY as reported 4th straight quarter of +10% YoY revenue growth in pro forma constant currency(1)(2) Best-ever quarter in North America Europe showing signs of acceleration Consistent non-GAAP operating margin while accelerating R&D investments
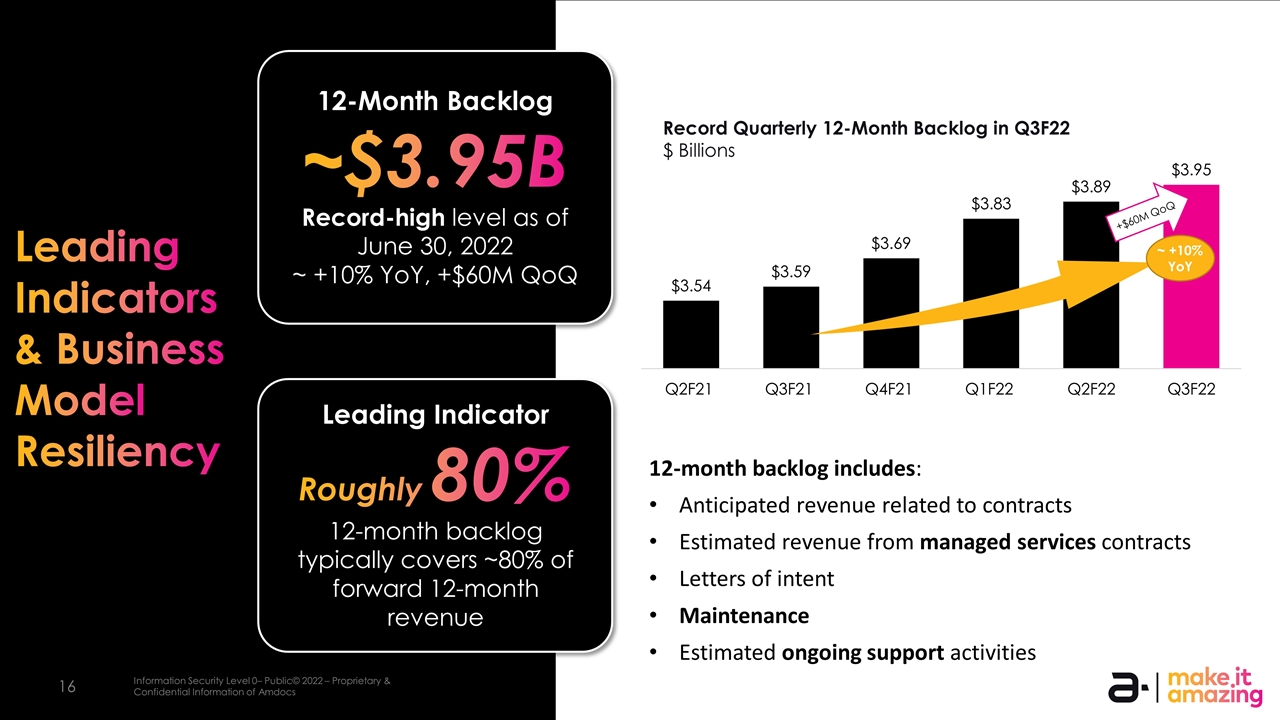
(1) (1) (1) 12-Month Backlog ~$3.95B Record-high level as of June 30, 2022 ~ +10% YoY, +$60M QoQ Leading Indicator Roughly 80% 12-month backlog typically covers ~80% of forward 12-month revenue 12-month backlog growth has accelerated year-over-year over the past several quarters (1) Record Quarterly 12-Month Backlog in Q3F22 $ Billions ~ +10% YoY +$60M QoQ Leading Indicators & Business Model Resiliency 12-month backlog includes: Anticipated revenue related to contracts Estimated revenue from managed services contracts Letters of intent Maintenance Estimated ongoing support activities
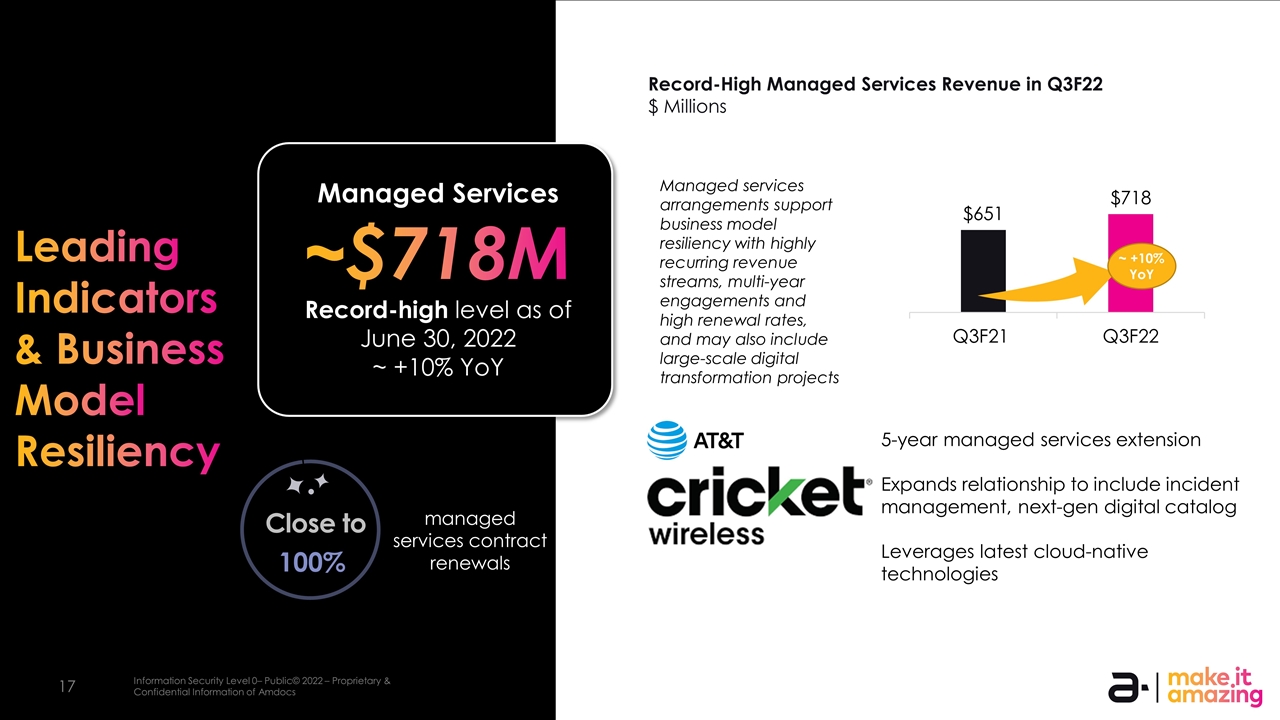
Managed Services ~$718M Record-high level as of June 30, 2022 ~ +10% YoY Record-High Managed Services Revenue in Q3F22 $ Millions Managed services arrangements support business model resiliency with highly recurring revenue streams, multi-year engagements and high renewal rates, and may also include large-scale digital transformation projects Leading Indicators & Business Model Resiliency 5-year managed services extension Expands relationship to include incident management, next-gen digital catalog Leverages latest cloud-native technologies ~ +10% YoY 100% Close to managed services contract renewals
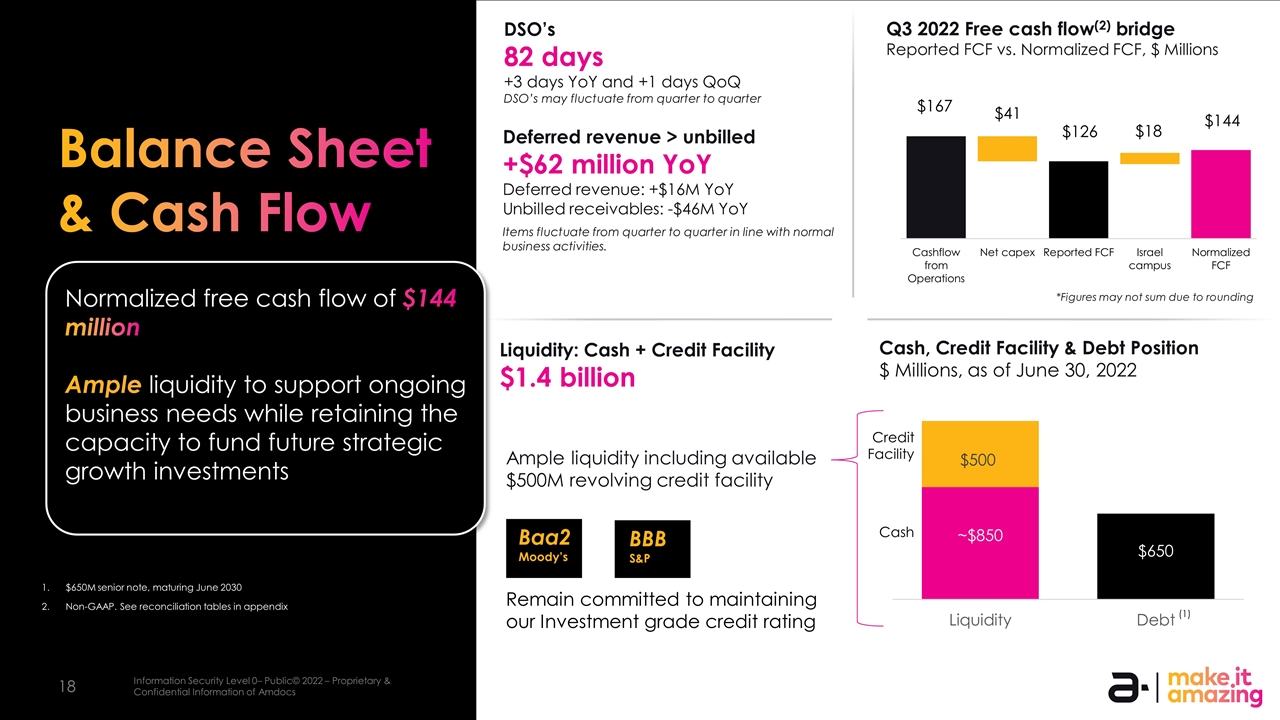
Balance Sheet & Cash Flow Liquidity: Cash + Credit Facility $1.4 billion DSO’s 82 days +3 days YoY and +1 days QoQ DSO’s may fluctuate from quarter to quarter Deferred revenue > unbilled +$62 million YoY Deferred revenue: +$16M YoY Unbilled receivables: -$46M YoY Items fluctuate from quarter to quarter in line with normal business activities. Ample liquidity including available $500M revolving credit facility Baa2 Moody’s Remain committed to maintaining our Investment grade credit rating Q3 2022 Free cash flow(2) bridge Reported FCF vs. Normalized FCF, $ Millions Credit Facility Cash $650M senior note, maturing June 2030 *Figures may not sum due to rounding Non-GAAP. See reconciliation tables in appendix BBB S&P Cash, Credit Facility & Debt Position $ Millions, as of June 30, 2022 (1) Normalized free cash flow of $144 million Ample liquidity to support ongoing business needs while retaining the capacity to fund future strategic growth investments
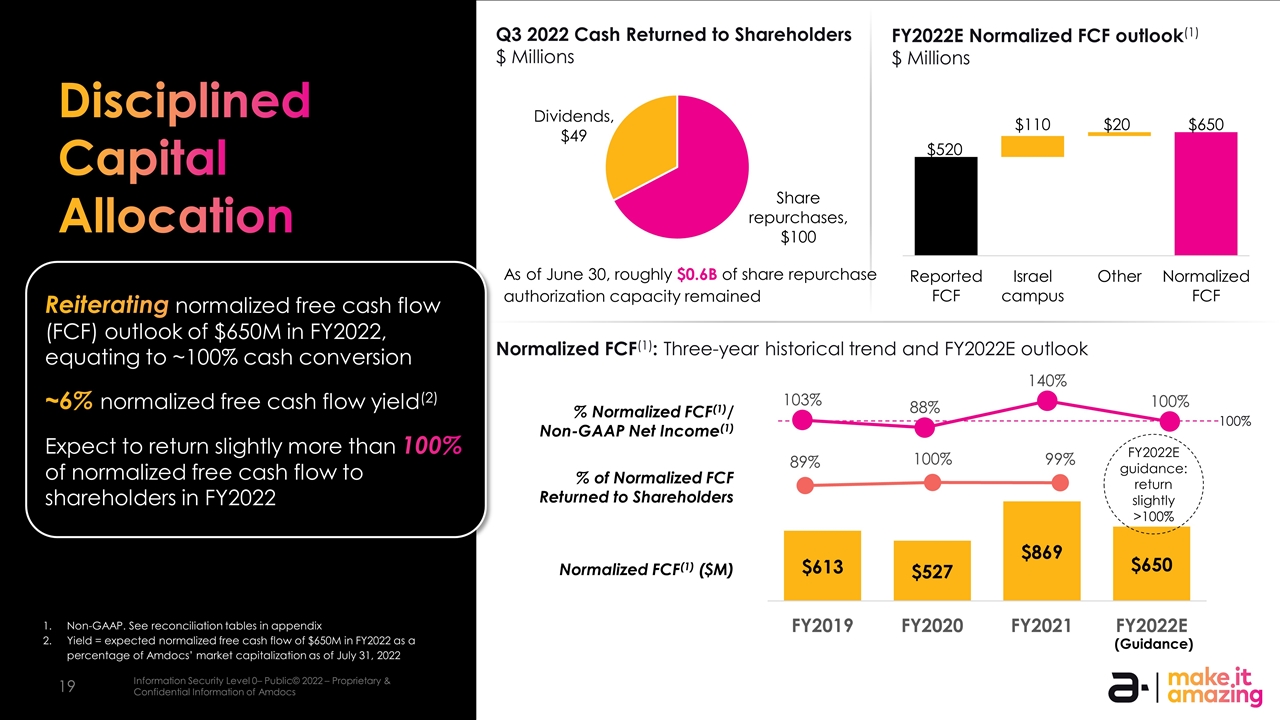
Disciplined Capital Allocation FY2022E Normalized FCF outlook(1) $ Millions Q3 2022 Cash Returned to Shareholders $ Millions As of June 30, roughly $0.6B of share repurchase authorization capacity remained Non-GAAP. See reconciliation tables in appendix Yield = expected normalized free cash flow of $650M in FY2022 as a percentage of Amdocs’ market capitalization as of July 31, 2022 % Normalized FCF(1)/ Non-GAAP Net Income(1) Normalized FCF(1) ($M) % of Normalized FCF Returned to Shareholders Normalized FCF(1): Three-year historical trend and FY2022E outlook (Guidance) FY2022E guidance: return slightly >100% 100% Reiterating normalized free cash flow (FCF) outlook of $650M in FY2022, equating to ~100% cash conversion ~6% normalized free cash flow yield(2) Expect to return slightly more than 100% of normalized free cash flow to shareholders in FY2022
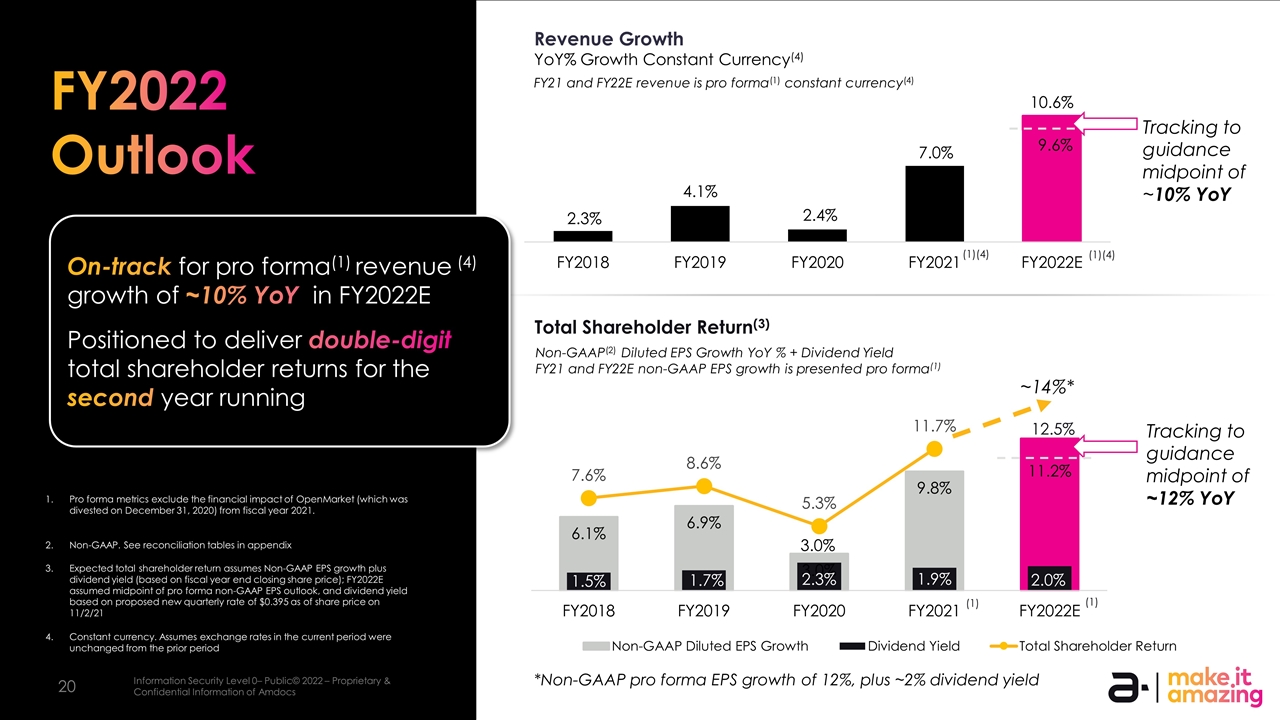
FY2022 Outlook Q2 Fiscal 2022E Outlook Category Revenue $x,xxx - $x,xxx million GAAP EPS $x.xx - $x.xx Non-GAAP(2) EPS $x.xx - $x.xx Share Count xxx million Effective Tax Rate Non-GAAP(2) XXXX high-end of annual target range Pro forma metrics exclude the financial impact of OpenMarket (which was divested on December 31, 2020) from fiscal year 2021. Expected total shareholder return assumes Non-GAAP EPS growth plus dividend yield (based on fiscal year end closing share price); FY2022E assumed midpoint of pro forma non-GAAP EPS outlook, and dividend yield based on proposed new quarterly rate of $0.395 as of share price on 11/2/21 Non-GAAP. See reconciliation tables in appendix Constant currency. Assumes exchange rates in the current period were unchanged from the prior period Total Shareholder Return(3) Non-GAAP(2) Diluted EPS Growth YoY % + Dividend Yield FY21 and FY22E non-GAAP EPS growth is presented pro forma(1) (1)(4) (1)(4) 12.5% (1) (1) Tracking to guidance midpoint of ~12% YoY ~14%* *Non-GAAP pro forma EPS growth of 12%, plus ~2% dividend yield 3.0% On-track for pro forma(1) revenue (4) growth of ~10% YoY in FY2022E Positioned to deliver double-digit total shareholder returns for the second year running

Q&A

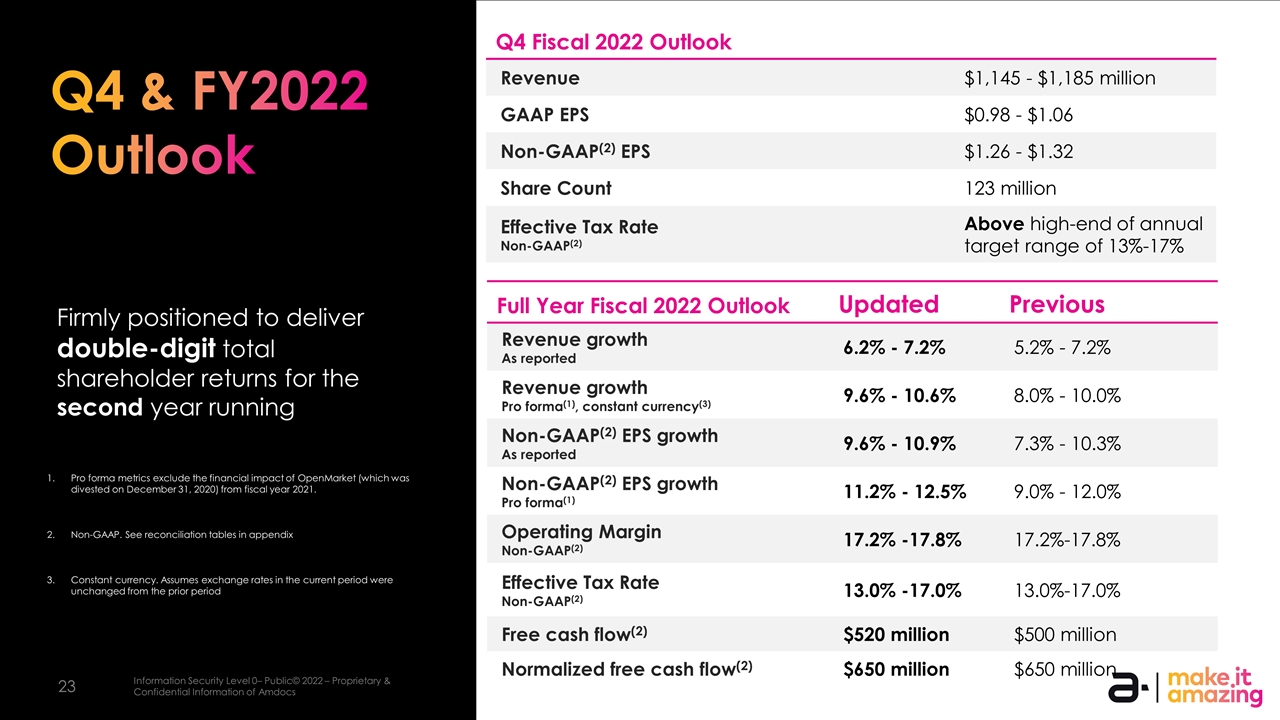
Q2 Fiscal 2022E Outlook Category Revenue $x,xxx - $x,xxx million GAAP EPS $x.xx - $x.xx Non-GAAP(2) EPS $x.xx - $x.xx Share Count xxx million Effective Tax Rate Non-GAAP(2) XXXX high-end of annual target range Pro forma metrics exclude the financial impact of OpenMarket (which was divested on December 31, 2020) from fiscal year 2021. Non-GAAP. See reconciliation tables in appendix Constant currency. Assumes exchange rates in the current period were unchanged from the prior period Q4 Fiscal 2022 Outlook Category Revenue $1,145 - $1,185 million GAAP EPS $0.98 - $1.06 Non-GAAP(2) EPS $1.26 - $1.32 Share Count 123 million Effective Tax Rate Non-GAAP(2) Above high-end of annual target range of 13%-17% Full Year Fiscal 2022 Outlook Updated Previous Revenue growth As reported 6.2% - 7.2% 5.2% - 7.2% Revenue growth Pro forma(1), constant currency(3) 9.6% - 10.6% 8.0% - 10.0% Non-GAAP(2) EPS growth As reported 9.6% - 10.9% 7.3% - 10.3% Non-GAAP(2) EPS growth Pro forma(1) 11.2% - 12.5% 9.0% - 12.0% Operating Margin Non-GAAP(2) 17.2% -17.8% 17.2%-17.8% Effective Tax Rate Non-GAAP(2) 13.0% -17.0% 13.0%-17.0% Free cash flow(2) $520 million $500 million Normalized free cash flow(2) $650 million $650 million Q4 & FY2022 Outlook Firmly positioned to deliver double-digit total shareholder returns for the second year running

Appendix Reconciliation Tables
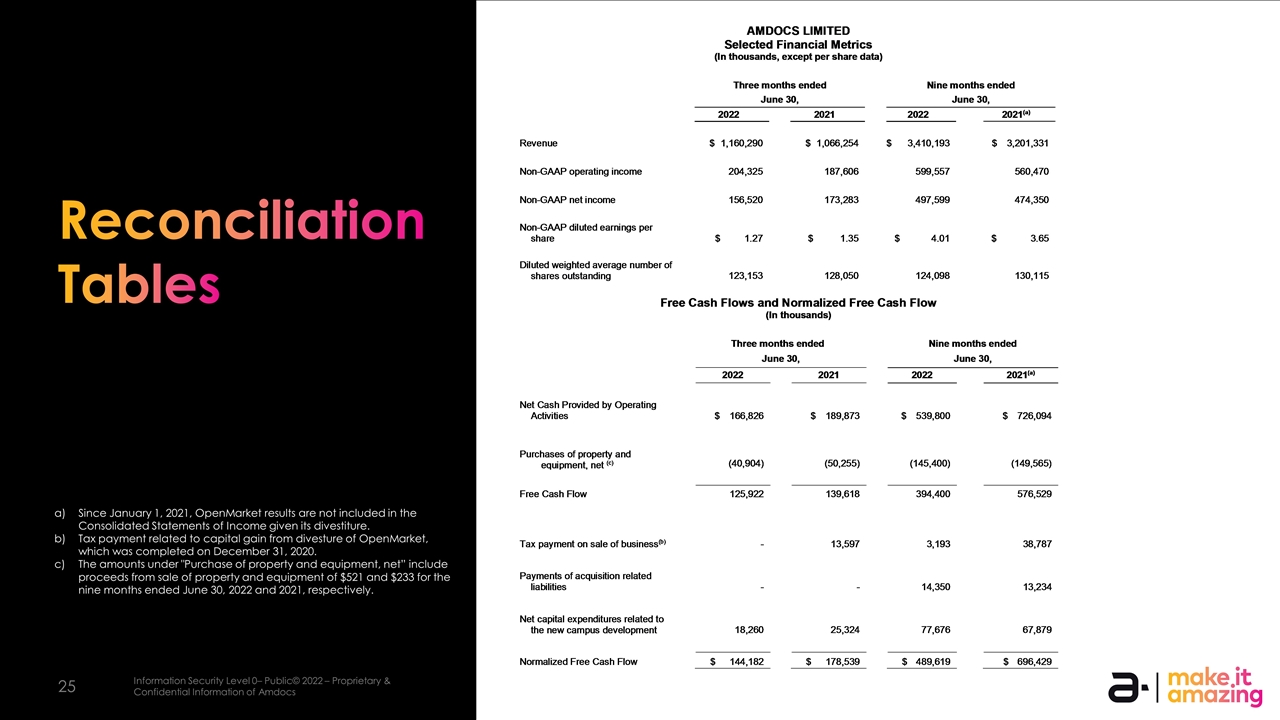
Reconciliation Tables Since January 1, 2021, OpenMarket results are not included in the Consolidated Statements of Income given its divestiture. Tax payment related to capital gain from divesture of OpenMarket, which was completed on December 31, 2020. The amounts under "Purchase of property and equipment, net” include proceeds from sale of property and equipment of $521 and $233 for the nine months ended June 30, 2022 and 2021, respectively.
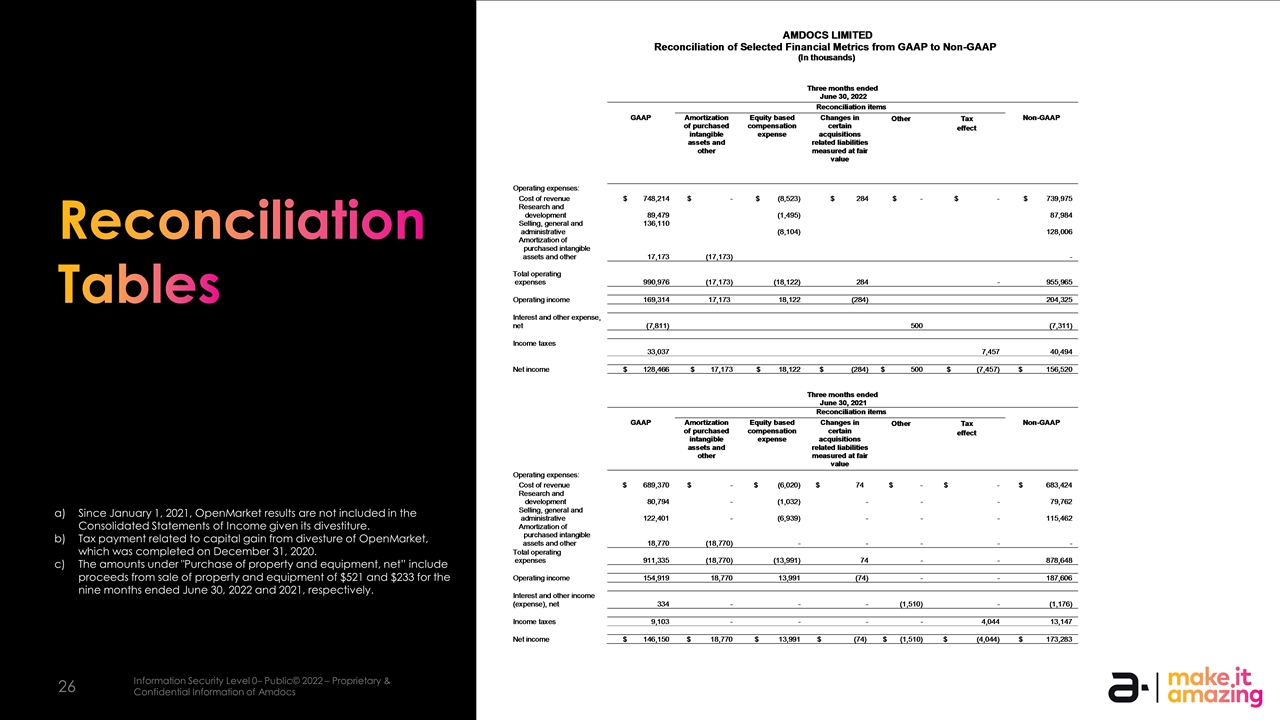
Reconciliation Tables Since January 1, 2021, OpenMarket results are not included in the Consolidated Statements of Income given its divestiture. Tax payment related to capital gain from divesture of OpenMarket, which was completed on December 31, 2020. The amounts under "Purchase of property and equipment, net” include proceeds from sale of property and equipment of $521 and $233 for the nine months ended June 30, 2022 and 2021, respectively.
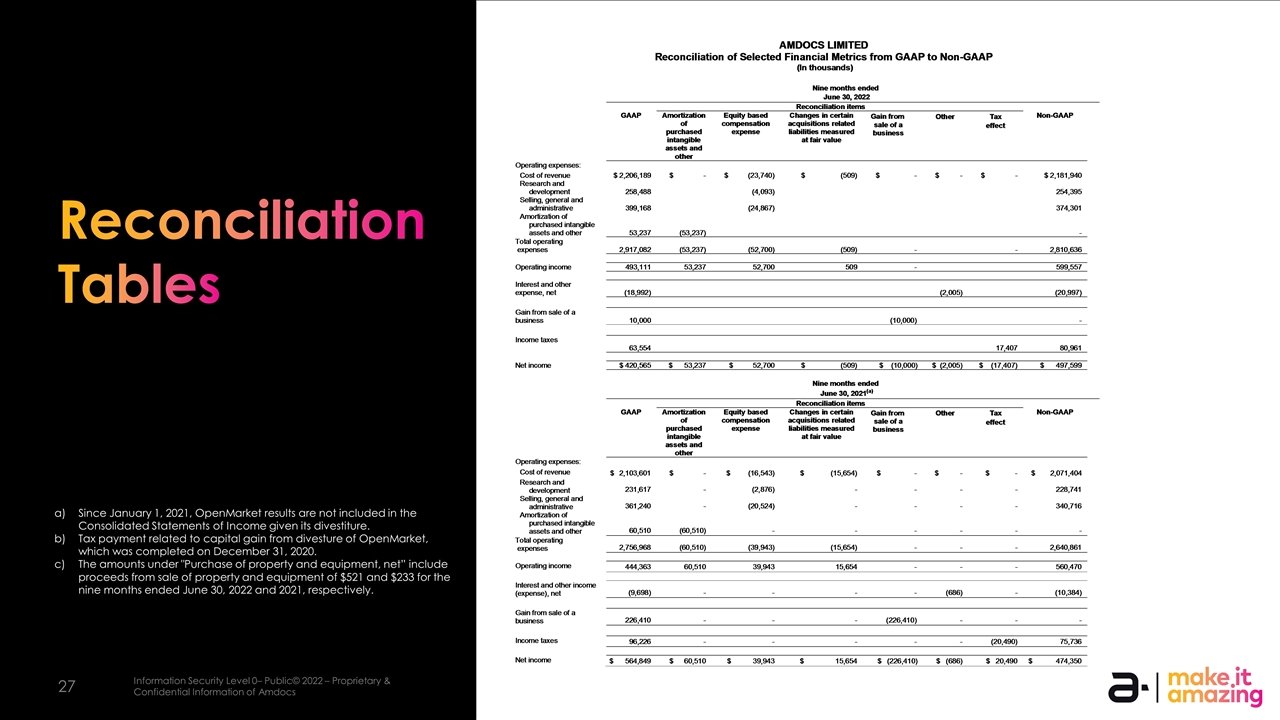
Reconciliation Tables Since January 1, 2021, OpenMarket results are not included in the Consolidated Statements of Income given its divestiture. Tax payment related to capital gain from divesture of OpenMarket, which was completed on December 31, 2020. The amounts under "Purchase of property and equipment, net” include proceeds from sale of property and equipment of $521 and $233 for the nine months ended June 30, 2022 and 2021, respectively.


