
Amdocs Limited NASDAQ: DOX Fiscal Q3 2023 Earnings Presentation August 2, 2023 Tamar Rapaport-Dagim CFO & COO Shuky Sheffer President & CEO Exhibit 99.2
Disclaimer The information contained herein in this presentation or delivered or to be delivered to you during this presentation does not constitute an offer, expressed or implied, or a recommendation to do any transaction in Amdocs Limited securities or in any securities of its affiliates or subsidiaries. This presentation and the comments made by members of Amdocs management in conjunction with it include information that constitutes forward-looking statements made pursuant to the safe harbor provision of the Private Securities Litigation Reform Act of 1995, including statements about Amdocs’ growth and business results in future quarters. Although we believe the expectations reflected in such forward-looking statements are based upon reasonable assumptions, we can give no assurance that our expectations will be obtained or that any deviations will not be material. Such statements involve risks and uncertainties that may cause future results to differ from those anticipated. These risks include, but are not limited to, the effects of general macro-economic conditions, prevailing level of macroeconomic, business and operational uncertainty, including as a result of geopolitical events or other global or regional events such as the COVID-19 pandemic, as well as the current inflationary environment, and the effects of these conditions on the company’s clients’ businesses and levels of business activity, Amdocs’ ability to grow in the business markets that it serves, Amdocs’ ability to successfully integrate acquired businesses, adverse effects of market competition, rapid technological shifts that may render the Company's products and services obsolete, potential loss of a major customer, our ability to develop long-term relationships with our customers, and risks associated with operating businesses in the international market. Amdocs may elect to update these forward-looking statements at some point in the future; however, Amdocs specifically disclaims any obligation to do so. These and other risks are discussed at greater length in Amdocs’ filings with the Securities and Exchange Commission, including in our Annual Report on Form 20-F for the fiscal year ended September 30, 2022 filed on December 13, 2022 and our Form 6-K furnished for the first quarter of fiscal 2023 on February 13, 2023 and for the second quarter of fiscal 2023 on May 22, 2023. This presentation includes non-GAAP financial measures, including non-GAAP operating margin, free cash flow, revenue on a constant currency basis, non-GAAP net income, non-GAAP net income attributable to Amdocs Limited, and non-GAAP earnings per share. Free cash flow equals cash generated by operating activities less net capital expenditures and other. While in prior years Amdocs used normalized free cash flow, a measure of our operating performance, is further adjusted to exclude net capital expenditures related to the new campus development, payments for non-recurring and unusual charges (such as capital gains tax to be paid in relation to the divestiture of OpenMarket), and payments of acquisition related liabilities, Amdocs is no longer reporting normalized free cash flow. Normalized free cash flow is not comparable to free cash flow. These non-GAAP financial measures are not in accordance with, or an alternative for, generally accepted accounting principles and may be different from non-GAAP financial measures used by other companies. In addition, these non-GAAP financial measures are not based on any comprehensive set of accounting rules or principles. Amdocs believes that non-GAAP financial measures have limitations in that they do not reflect all of the amounts associated with Amdocs’ results of operations as determined in accordance with GAAP and that these measures should only be used to evaluate Amdocs’ results of operations in conjunction with the corresponding GAAP measures. Please refer to the appendix for a reconciliation of these metrics to the most comparable GAAP provision. This presentation also includes pro forma metrics which exclude the financial impact of OpenMarket (divested on December 31, 2020) from fiscal year 2021. Please also review the information contained in Amdocs’ press release dated August 2, 2023 with respect to earnings for fiscal Q3 2023. The press release contains additional information regarding Amdocs’ outlook for fiscal year 2023 and certain non-GAAP metrics and their reconciliations.

Today’s Speakers Shuky Sheffer President & Chief Executive Officer Tamar Rapaport-Dagim Chief Financial Officer & Chief Operating Officer
Earnings call agenda Strategy & Business Performance Update Shuky Sheffer, President & Chief Executive Officer 1 2 Financial Review & Outlook Tamar Rapaport-Dagim, Chief Financial Officer & Chief Operating Officer 3 Q&A

Strategy and Business Performance Update President & Chief Executive Officer Shuky Sheffer
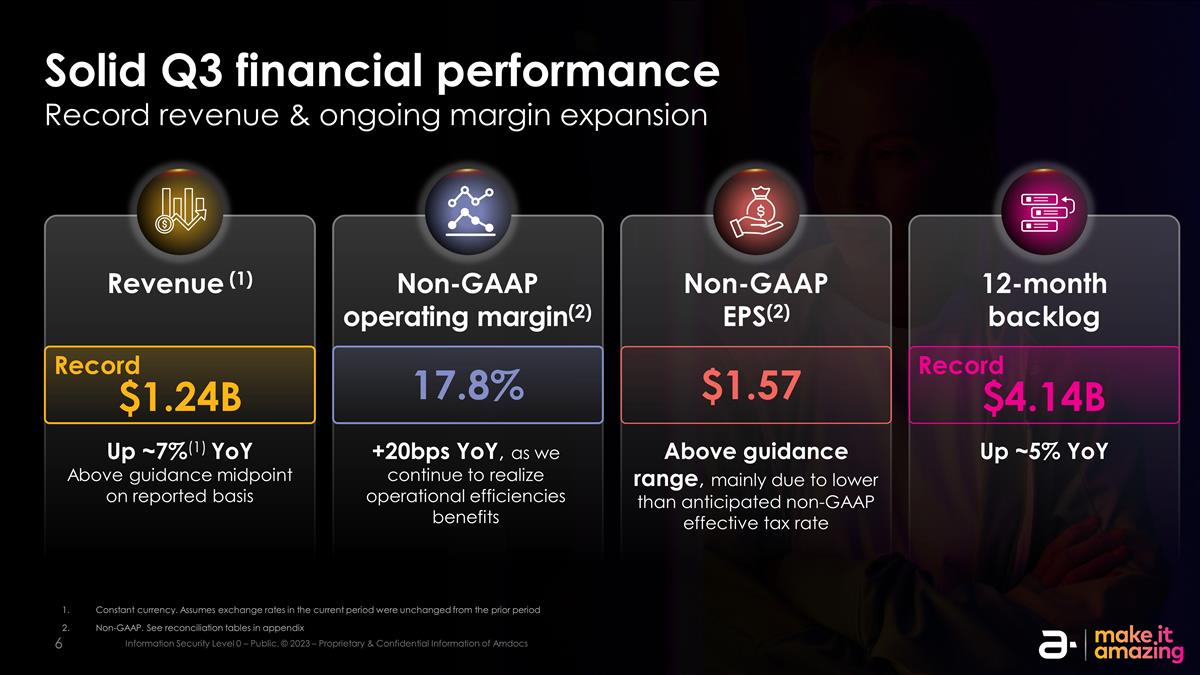
Solid Q3 financial performance Record revenue & ongoing margin expansion Revenue (1) Up ~7%(1) YoY Above guidance midpoint on reported basis Record Non-GAAP operating margin(2) +20bps YoY, as we continue to realize operational efficiencies benefits 17.8% Non-GAAP EPS(2) Above guidance range, mainly due to lower than anticipated non-GAAP effective tax rate 12-month backlog Up ~5% YoY Constant currency. Assumes exchange rates in the current period were unchanged from the prior period Non-GAAP. See reconciliation tables in appendix $1.24B $1.57 Record $4.14B
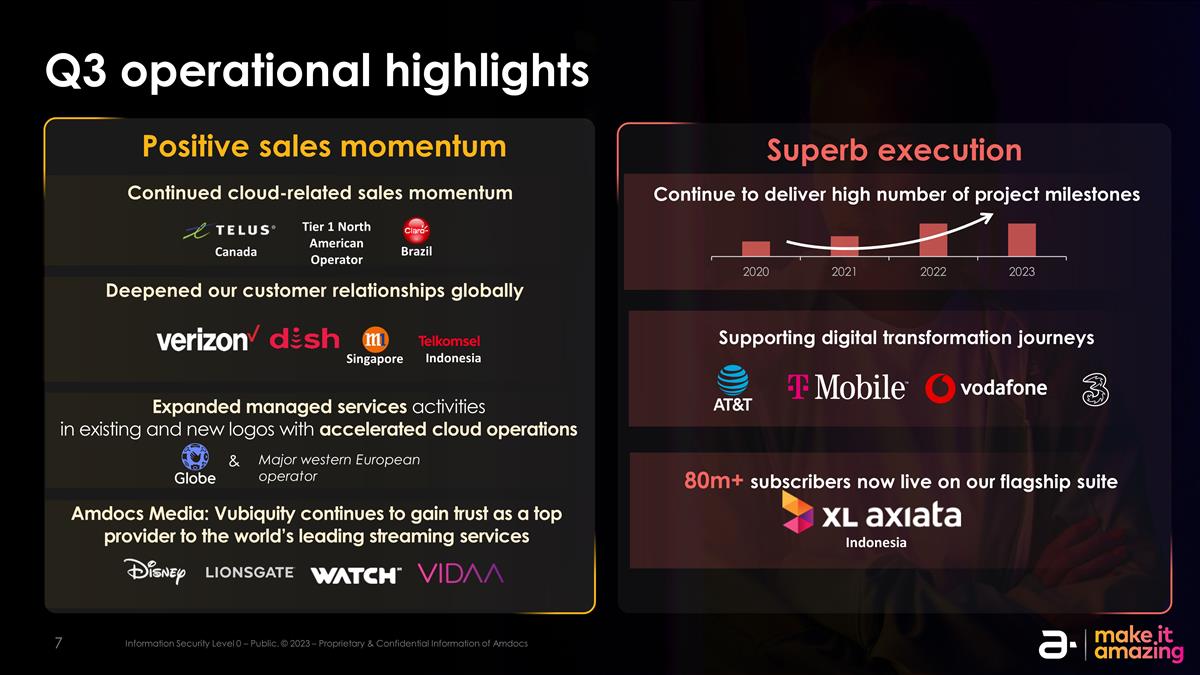
Q3 operational highlights Positive sales momentum Superb execution Continue to deliver high number of project milestones Continued cloud-related sales momentum Bell XL? Supporting digital transformation journeys 80m+ subscribers now live on our flagship suite What VF, should not be no name? Brazil Canada Indonesia Singapore Indonesia Expanded managed services activities in existing and new logos with accelerated cloud operations Amdocs Media: Vubiquity continues to gain trust as a top provider to the world’s leading streaming services Deepened our customer relationships globally Major western European operator & Tier 1 North American Operator

Generative AI is a company priority AI-powered products Software development life- cycle Efficiency Services innovation Corporate/ support functions Amdocs AmAIz Framework Announced our cutting-edge Gen AI framework Industry’s first enterprise-grade generative AI framework Carrier-grade architecture & telco-specific expertise Follows on strategic partnership with Microsoft Leveraging OpenAI, advanced open-source tech and LLMs For consumer & enterprise customers 80+ use cases in progress
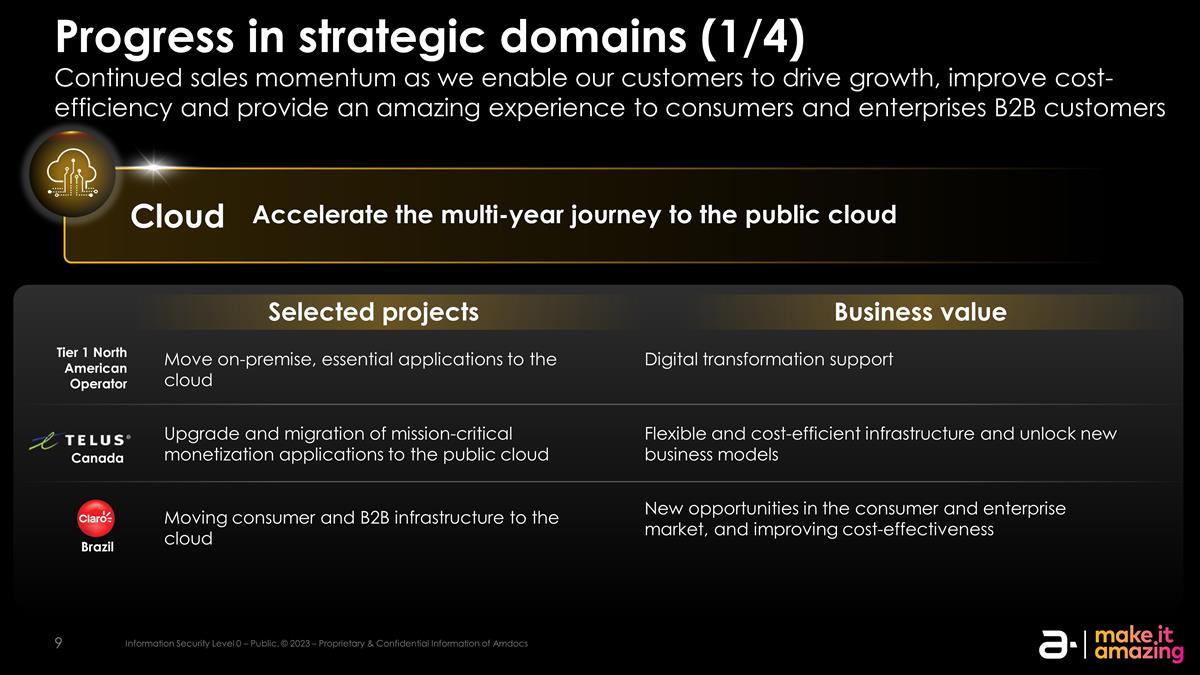
Progress in strategic domains (1/4) Continued sales momentum as we enable our customers to drive growth, improve cost-efficiency and provide an amazing experience to consumers and enterprises B2B customers Cloud Accelerate the multi-year journey to the public cloud Selected projects Business value Flexible and cost-efficient infrastructure and unlock new business models Upgrade and migration of mission-critical monetization applications to the public cloud Digital transformation support Move on-premise, essential applications to the cloud New opportunities in the consumer and enterprise market, and improving cost-effectiveness Moving consumer and B2B infrastructure to the cloud Brazil Tier 1 North American Operator Canada
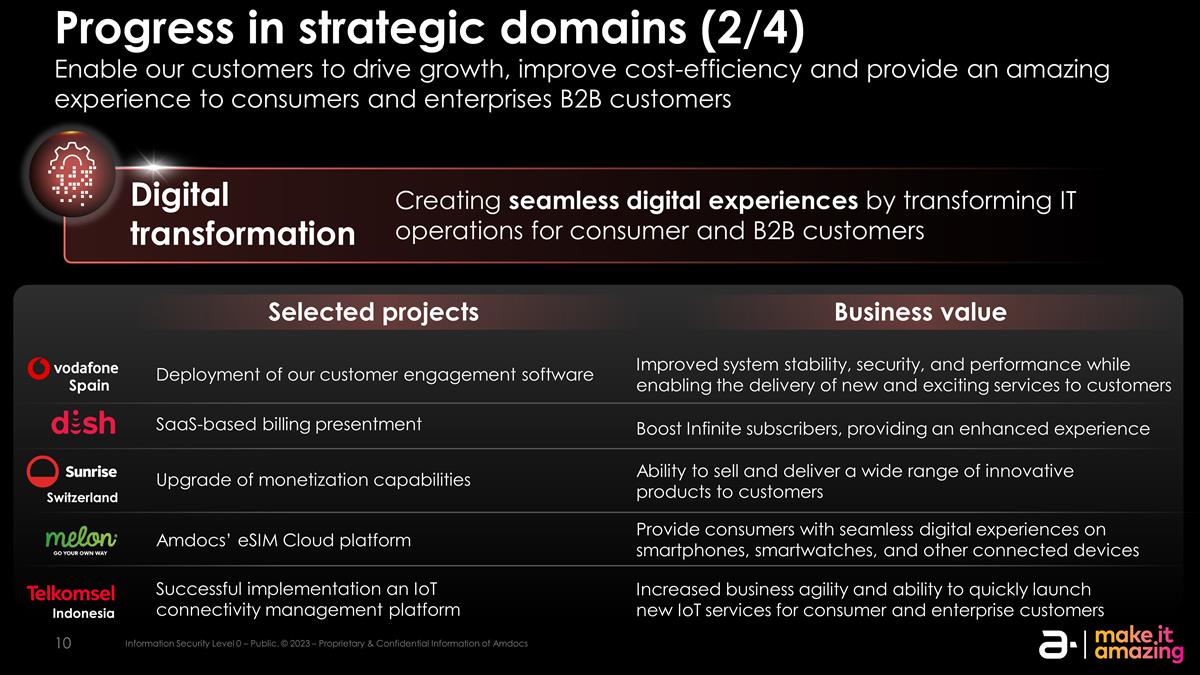
Progress in strategic domains (2/4) Enable our customers to drive growth, improve cost-efficiency and provide an amazing experience to consumers and enterprises B2B customers Spain Digital transformation Creating seamless digital experiences by transforming IT operations for consumer and B2B customers Selected projects Business value Improved system stability, security, and performance while enabling the delivery of new and exciting services to customers Deployment of our customer engagement software Ability to sell and deliver a wide range of innovative products to customers Upgrade of monetization capabilities Increased business agility and ability to quickly launch new IoT services for consumer and enterprise customers Successful implementation an IoT connectivity management platform Indonesia Switzerland SaaS-based billing presentment Boost Infinite subscribers, providing an enhanced experience Provide consumers with seamless digital experiences on smartphones, smartwatches, and other connected devices Amdocs’ eSIM Cloud platform
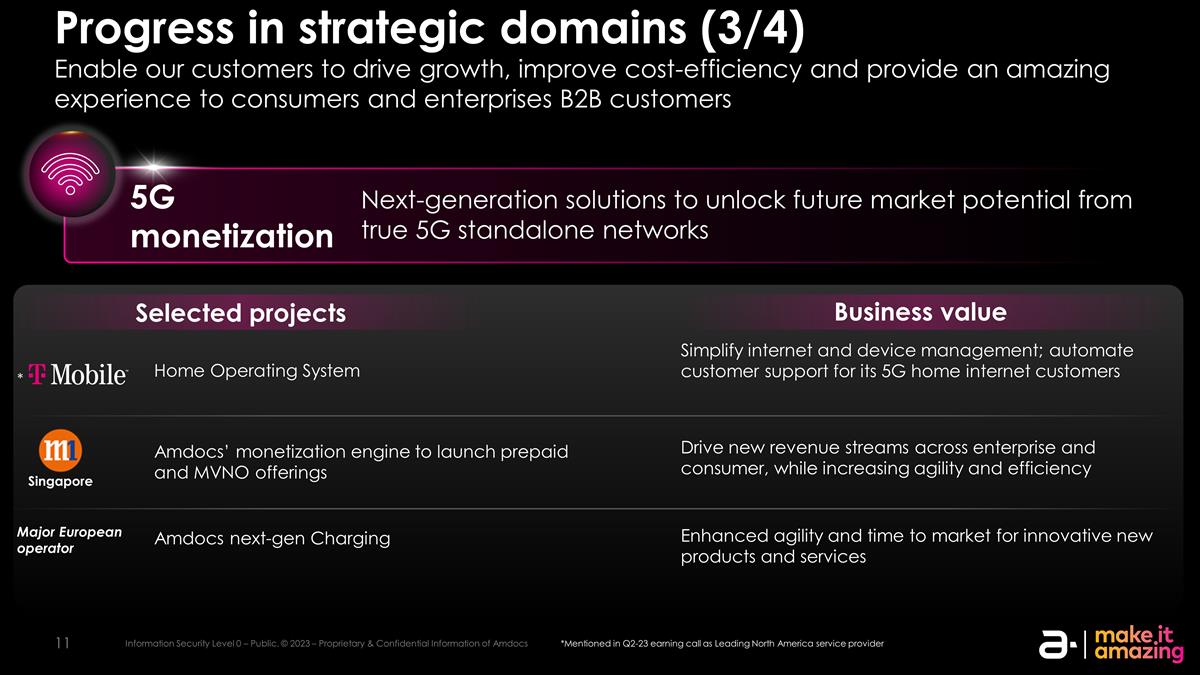
Progress in strategic domains (3/4) Enable our customers to drive growth, improve cost-efficiency and provide an amazing experience to consumers and enterprises B2B customers Selected projects Business value Simplify internet and device management; automate customer support for its 5G home internet customers Home Operating System Drive new revenue streams across enterprise and consumer, while increasing agility and efficiency Amdocs’ monetization engine to launch prepaid and MVNO offerings Enhanced agility and time to market for innovative new products and services Amdocs next-gen Charging Next-generation solutions to unlock future market potential from true 5G standalone networks 5G monetization *Mentioned in Q2-23 earning call as Leading North America service provider Singapore * Major European operator
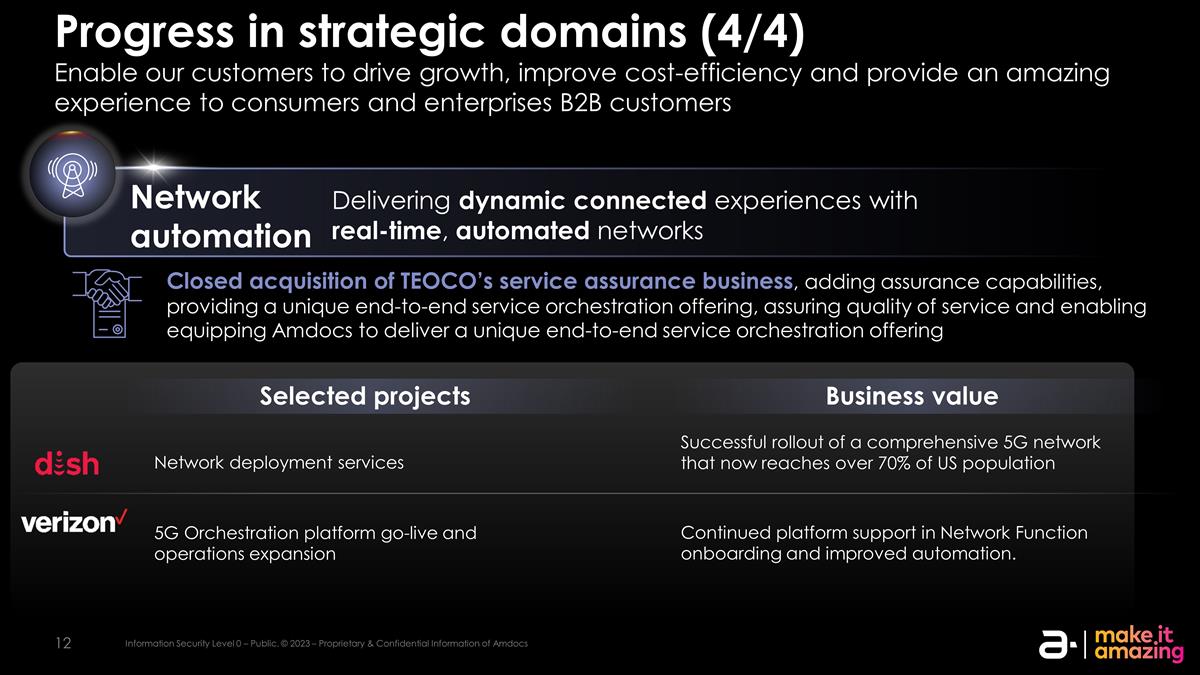
Progress in strategic domains (4/4) Enable our customers to drive growth, improve cost-efficiency and provide an amazing experience to consumers and enterprises B2B customers Selected projects Business value Successful rollout of a comprehensive 5G network that now reaches over 70% of US population Network deployment services Continued platform support in Network Function onboarding and improved automation. 5G Orchestration platform go-live and operations expansion Delivering dynamic connected experiences with real-time, automated networks Network automation Closed acquisition of TEOCO’s service assurance business, adding assurance capabilities, providing a unique end-to-end service orchestration offering, assuring quality of service and enabling equipping Amdocs to deliver a unique end-to-end service orchestration offering
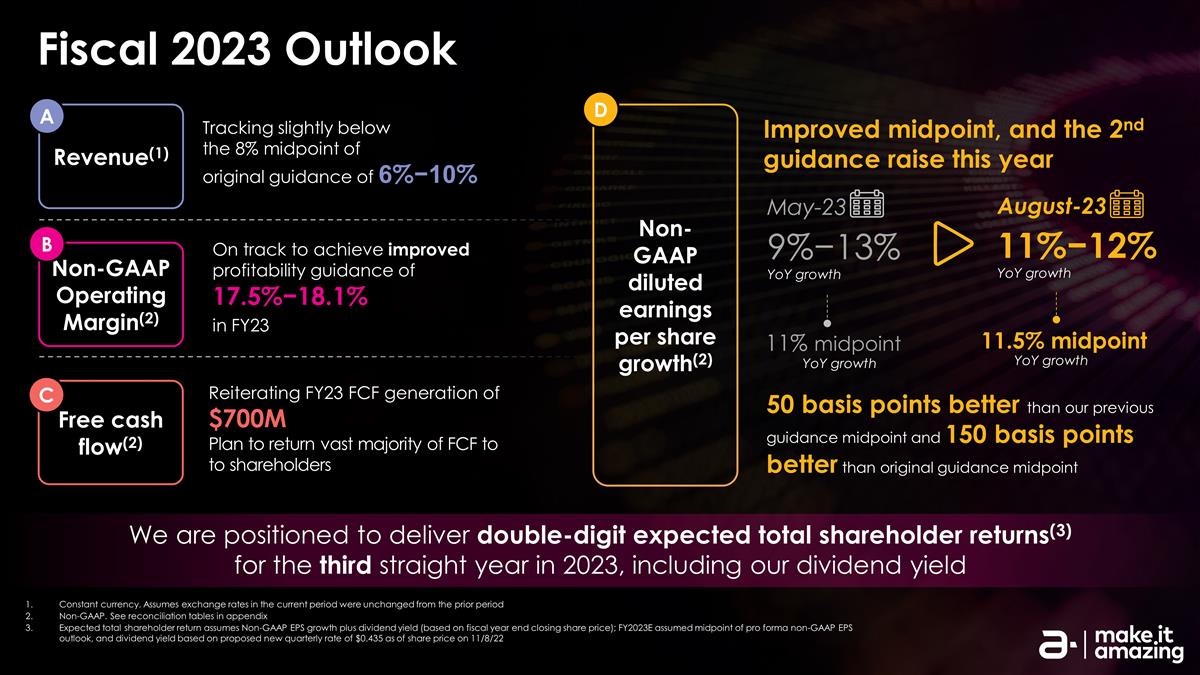
Improved midpoint, and the 2nd guidance raise this year May-23 9%−13% YoY growth Fiscal 2023 Outlook We are positioned to deliver double-digit expected total shareholder returns(3) for the third straight year in 2023, including our dividend yield Constant currency. Assumes exchange rates in the current period were unchanged from the prior period Non-GAAP. See reconciliation tables in appendix Expected total shareholder return assumes Non-GAAP EPS growth plus dividend yield (based on fiscal year end closing share price); FY2023E assumed midpoint of pro forma non-GAAP EPS outlook, and dividend yield based on proposed new quarterly rate of $0.435 as of share price on 11/8/22 August-23 11%−12% YoY growth 11.5% midpoint 11% midpoint Non-GAAP Operating Margin(2) Free cash flow(2) Revenue(1) B A C Non-GAAP diluted earnings per share growth(2) D Tracking slightly below the 8% midpoint of original guidance of 6%−10% On track to achieve improved profitability guidance of 17.5%−18.1% in FY23 Reiterating FY23 FCF generation of $700M Plan to return vast majority of FCF to to shareholders YoY growth YoY growth 50 basis points better than our previous guidance midpoint and 150 basis points better than original guidance midpoint
Financial Update & Outlook Chief Financial Officer & Chief Operating Officer Tamar Rapaport-Dagim
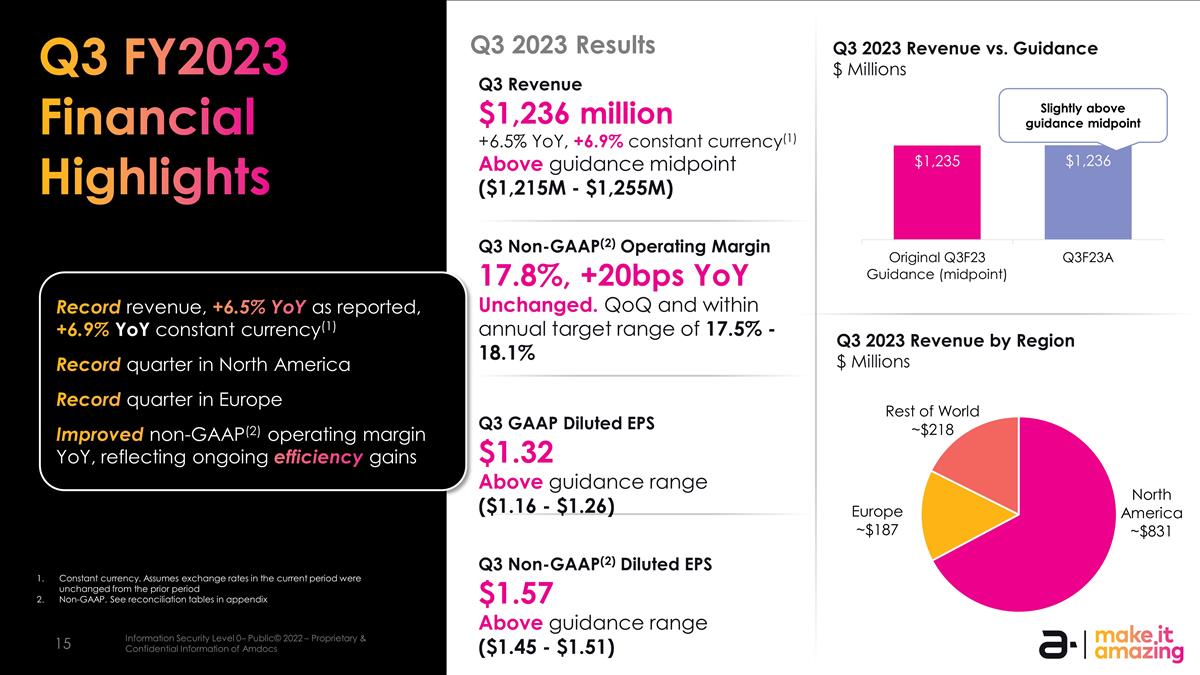
Q3 Revenue $1,236 million +6.5% YoY, +6.9% constant currency(1) Above guidance midpoint ($1,215M - $1,255M) Q3 Non-GAAP(2) Operating Margin 17.8%, +20bps YoY Unchanged. QoQ and within annual target range of 17.5% - 18.1% Q3 GAAP Diluted EPS $1.32 Above guidance range ($1.16 - $1.26) Q3 Non-GAAP(2) Diluted EPS $1.57 Above guidance range ($1.45 - $1.51) Q3 FY2023 Financial Highlights Q3 2023 Revenue by Region $ Millions Q3 2023 Revenue vs. Guidance $ Millions Q3 2023 Results Constant currency. Assumes exchange rates in the current period were unchanged from the prior period Non-GAAP. See reconciliation tables in appendix Slightly above guidance midpoint Record revenue, +6.5% YoY as reported, +6.9% YoY constant currency(1) Record quarter in North America Record quarter in Europe Improved non-GAAP(2) operating margin YoY, reflecting ongoing efficiency gains
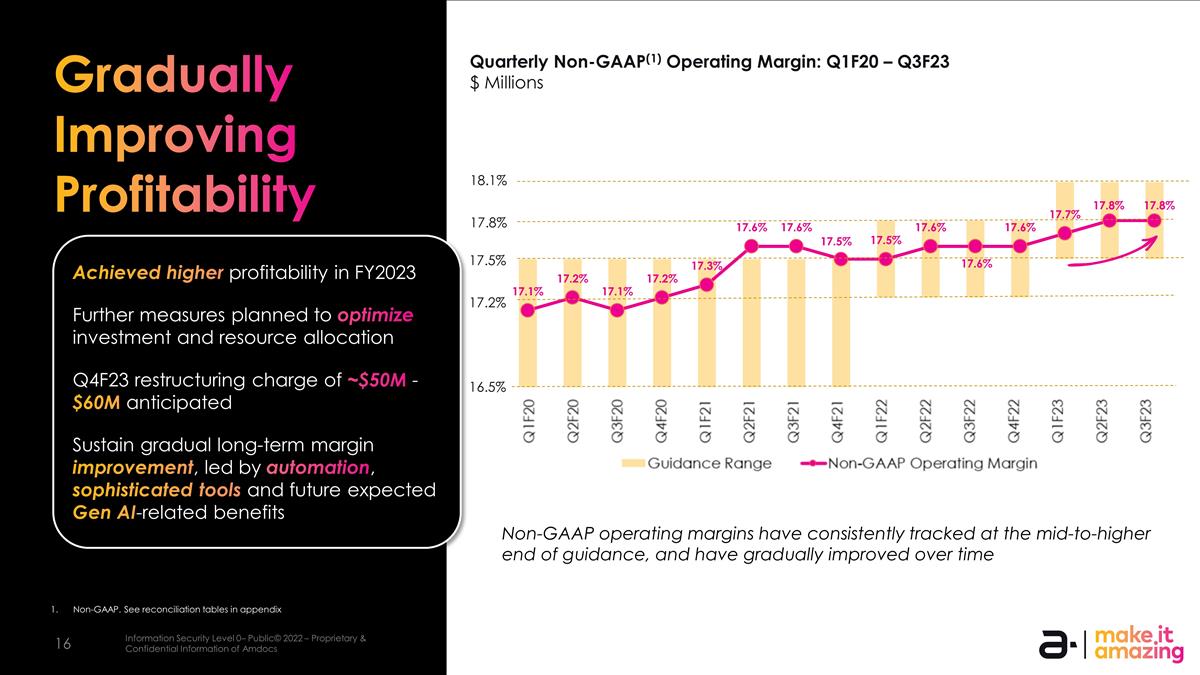
Gradually Improving Profitability Quarterly Non-GAAP(1) Operating Margin: Q1F20 – Q3F23 $ Millions 16.5% 17.2% 17.5% 17.8% 18.1% Achieved higher profitability in FY2023 Further measures planned to optimize investment and resource allocation Q4F23 restructuring charge of ~$50M - $60M anticipated Sustain gradual long-term margin improvement, led by automation, sophisticated tools and future expected Gen AI-related benefits Non-GAAP operating margins have consistently tracked at the mid-to-higher end of guidance, and have gradually improved over time Non-GAAP. See reconciliation tables in appendix
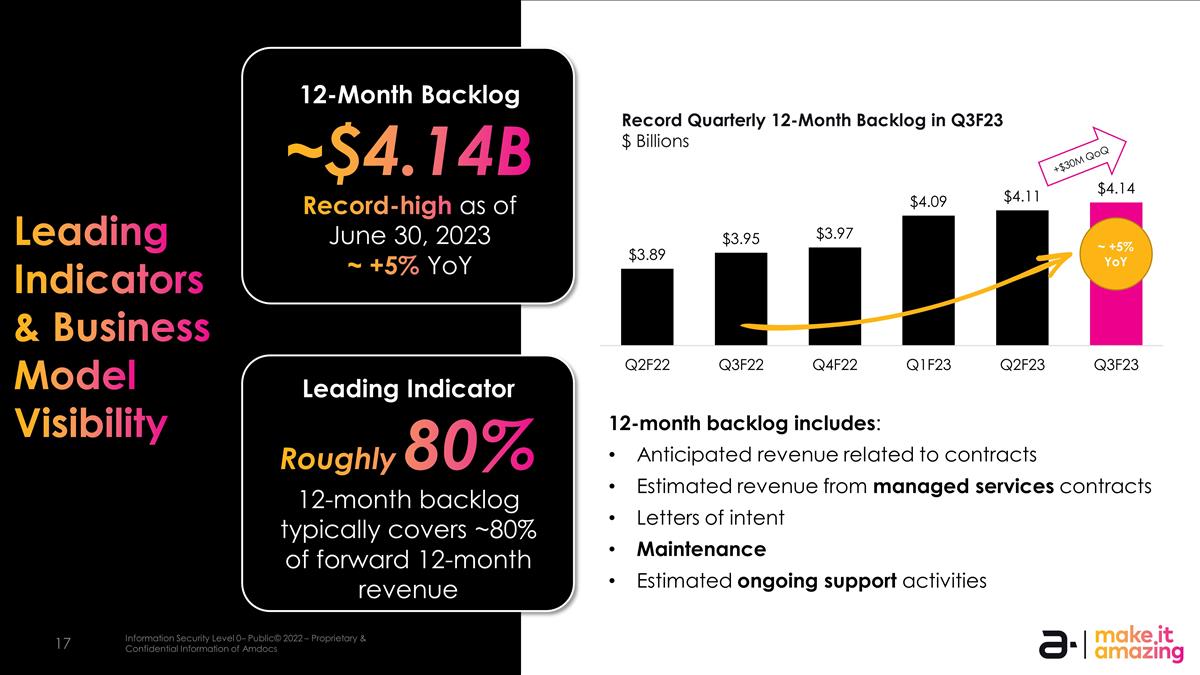
(1) (1) (1) 12-Month Backlog ~$4.14B Record-high as of June 30, 2023 ~ +5% YoY Leading Indicator Roughly 80% 12-month backlog typically covers ~80% of forward 12-month revenue 12-month backlog growth has accelerated year-over-year over the past several quarters (1) Record Quarterly 12-Month Backlog in Q3F23 $ Billions ~ +5% YoY +$30M QoQ Leading Indicators & Business Model Visibility 12-month backlog includes: Anticipated revenue related to contracts Estimated revenue from managed services contracts Letters of intent Maintenance Estimated ongoing support activities
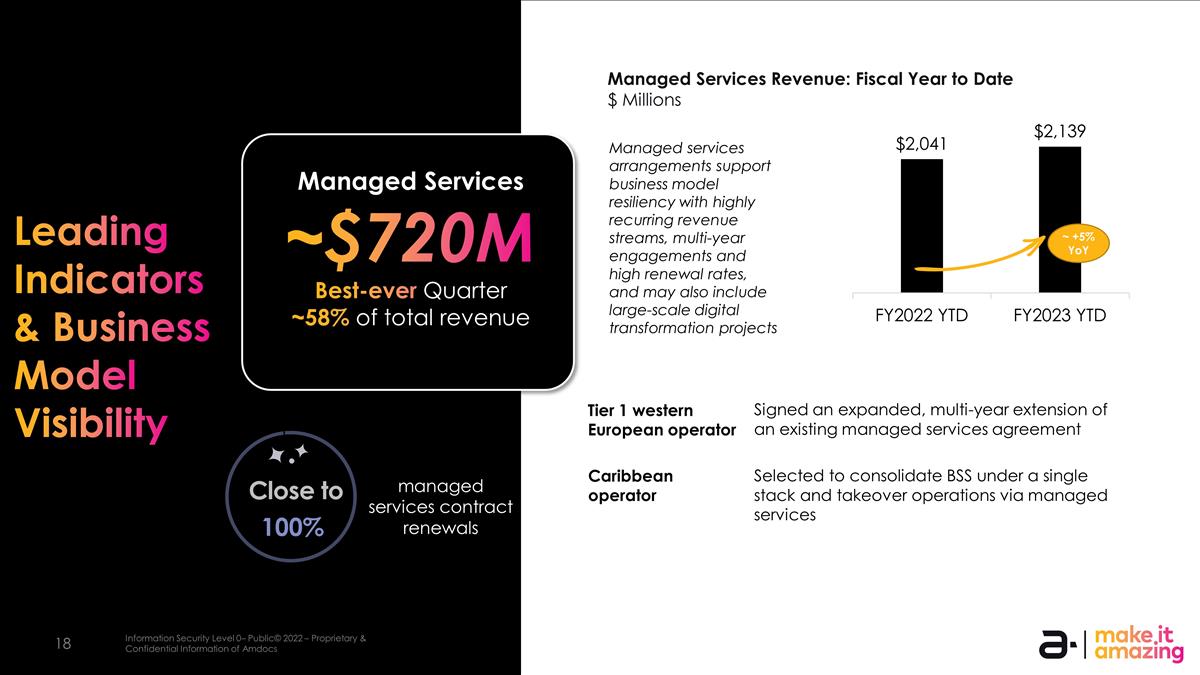
Managed Services ~$720M Best-ever Quarter ~58% of total revenue Managed Services Revenue: Fiscal Year to Date $ Millions Managed services arrangements support business model resiliency with highly recurring revenue streams, multi-year engagements and high renewal rates, and may also include large-scale digital transformation projects Leading Indicators & Business Model Visibility ~ +5% YoY 100% Close to managed services contract renewals Selected to consolidate BSS under a single stack and takeover operations via managed services Caribbean operator Signed an expanded, multi-year extension of an existing managed services agreement Tier 1 western European operator
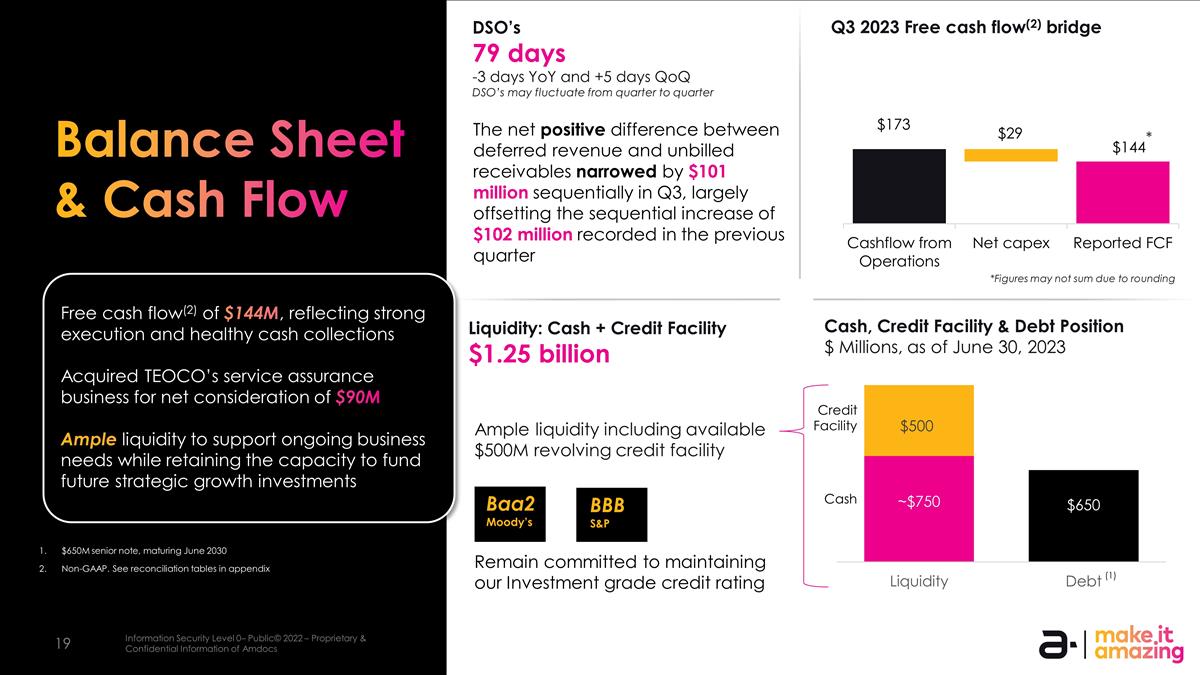
Balance Sheet & Cash Flow Liquidity: Cash + Credit Facility $1.25 billion DSO’s 79 days -3 days YoY and +5 days QoQ DSO’s may fluctuate from quarter to quarter Ample liquidity including available $500M revolving credit facility Baa2 Moody’s Remain committed to maintaining our Investment grade credit rating Q3 2023 Free cash flow(2) bridge Credit Facility Cash $650M senior note, maturing June 2030 *Figures may not sum due to rounding Non-GAAP. See reconciliation tables in appendix BBB S&P Cash, Credit Facility & Debt Position $ Millions, as of June 30, 2023 (1) Free cash flow(2) of $144M, reflecting strong execution and healthy cash collections Acquired TEOCO’s service assurance business for net consideration of $90M Ample liquidity to support ongoing business needs while retaining the capacity to fund future strategic growth investments * The net positive difference between deferred revenue and unbilled receivables narrowed by $101 million sequentially in Q3, largely offsetting the sequential increase of $102 million recorded in the previous quarter
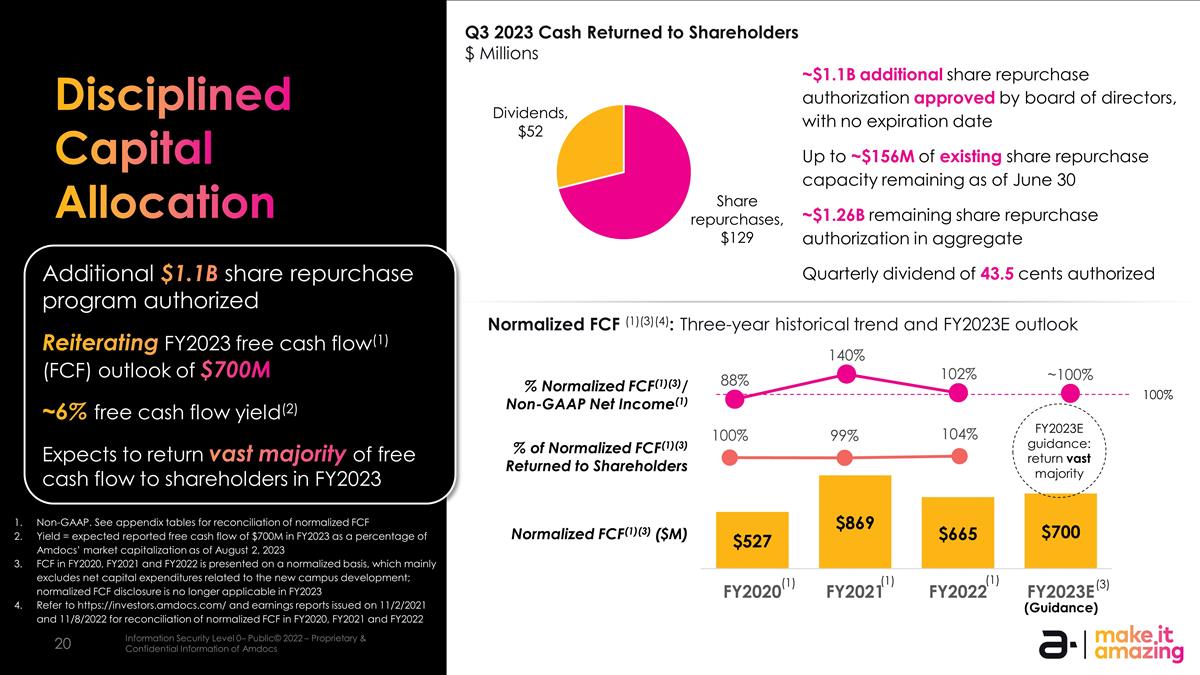
Disciplined Capital Allocation Q3 2023 Cash Returned to Shareholders $ Millions ~$1.1B additional share repurchase authorization approved by board of directors, with no expiration date Up to ~$156M of existing share repurchase capacity remaining as of June 30 ~$1.26B remaining share repurchase authorization in aggregate Quarterly dividend of 43.5 cents authorized Non-GAAP. See appendix tables for reconciliation of normalized FCF Yield = expected reported free cash flow of $700M in FY2023 as a percentage of Amdocs’ market capitalization as of August 2, 2023 FCF in FY2020, FY2021 and FY2022 is presented on a normalized basis, which mainly excludes net capital expenditures related to the new campus development; normalized FCF disclosure is no longer applicable in FY2023 Refer to https://investors.amdocs.com/ and earnings reports issued on 11/2/2021 and 11/8/2022 for reconciliation of normalized FCF in FY2020, FY2021 and FY2022 % Normalized FCF(1)(3)/ Non-GAAP Net Income(1) Normalized FCF(1)(3) ($M) % of Normalized FCF(1)(3) Returned to Shareholders Normalized FCF (1)(3)(4): Three-year historical trend and FY2023E outlook (Guidance) FY2023E guidance: return vast majority 100% Additional $1.1B share repurchase program authorized Reiterating FY2023 free cash flow(1) (FCF) outlook of $700M ~6% free cash flow yield(2) Expects to return vast majority of free cash flow to shareholders in FY2023 (3) (1) (1) (1)
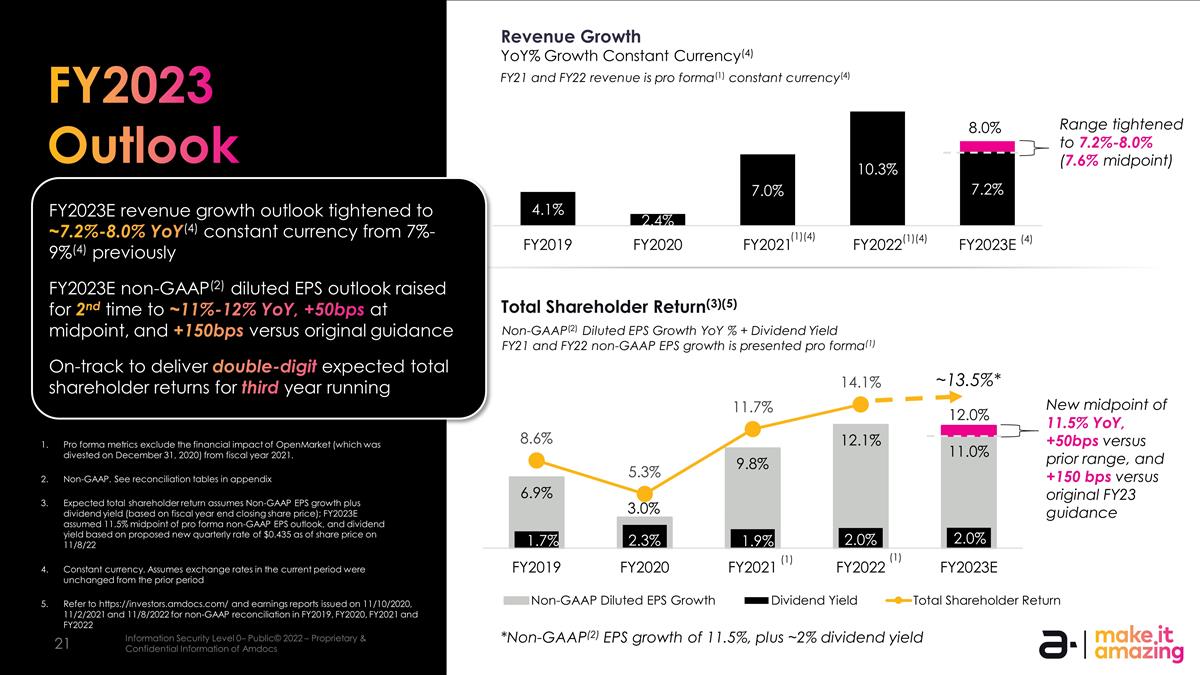
FY2023 Outlook Pro forma metrics exclude the financial impact of OpenMarket (which was divested on December 31, 2020) from fiscal year 2021. Expected total shareholder return assumes Non-GAAP EPS growth plus dividend yield (based on fiscal year end closing share price); FY2023E assumed 11.5% midpoint of pro forma non-GAAP EPS outlook, and dividend yield based on proposed new quarterly rate of $0.435 as of share price on 11/8/22 Non-GAAP. See reconciliation tables in appendix Constant currency. Assumes exchange rates in the current period were unchanged from the prior period Total Shareholder Return(3)(5) Non-GAAP(2) Diluted EPS Growth YoY % + Dividend Yield FY21 and FY22 non-GAAP EPS growth is presented pro forma(1) (1)(4) (4) 12.0% (1) ~13.5%* *Non-GAAP(2) EPS growth of 11.5%, plus ~2% dividend yield FY2023E revenue growth outlook tightened to ~7.2%-8.0% YoY(4) constant currency from 7%-9%(4) previously FY2023E non-GAAP(2) diluted EPS outlook raised for 2nd time to ~11%-12% YoY, +50bps at midpoint, and +150bps versus original guidance On-track to deliver double-digit expected total shareholder returns for third year running (1)(4) (1) New midpoint of 11.5% YoY, +50bps versus prior range, and +150 bps versus original FY23 guidance 3.0% Refer to https://investors.amdocs.com/ and earnings reports issued on 11/10/2020, 11/2/2021 and 11/8/2022 for non-GAAP reconciliation in FY2019, FY2020, FY2021 and FY2022 Range tightened to 7.2%-8.0% (7.6% midpoint)
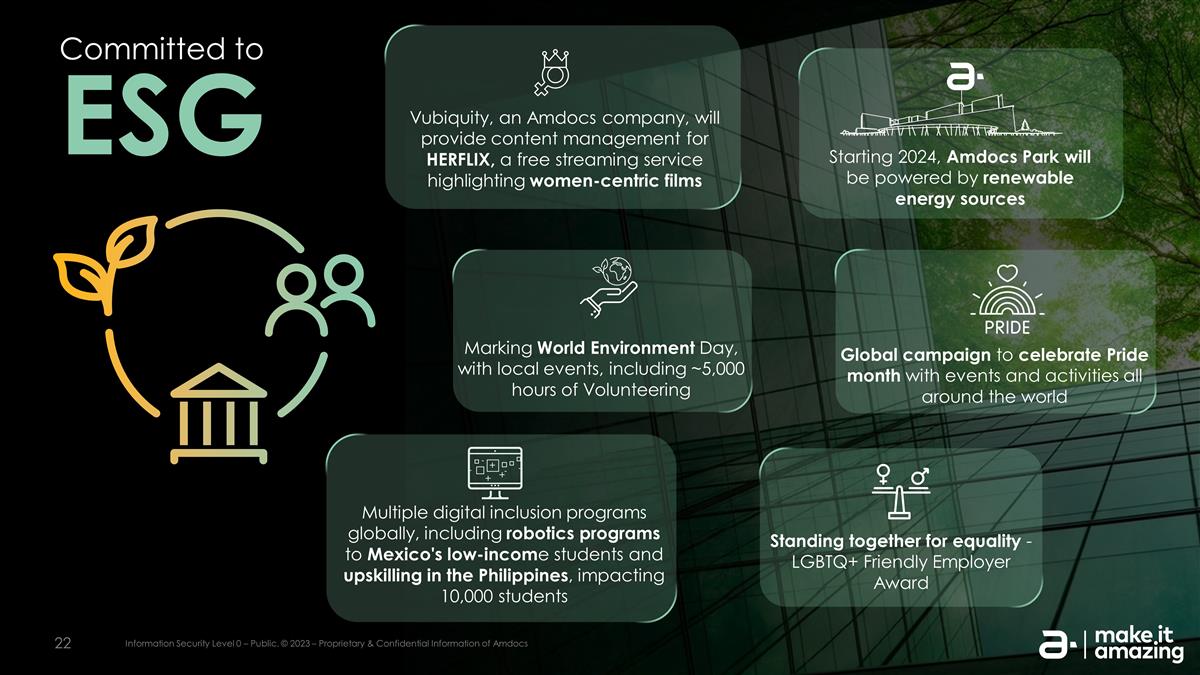
Committed to ESG Starting 2024, Amdocs Park will be powered by renewable energy sources Standing together for equality - LGBTQ+ Friendly Employer Award Marking World Environment Day, with local events, including ~5,000 hours of Volunteering Global campaign to celebrate Pride month with events and activities all around the world Multiple digital inclusion programs globally, including robotics programs to Mexico's low-income students and upskilling in the Philippines, impacting 10,000 students Vubiquity, an Amdocs company, will provide content management for HERFLIX, a free streaming service highlighting women-centric films

Q&A
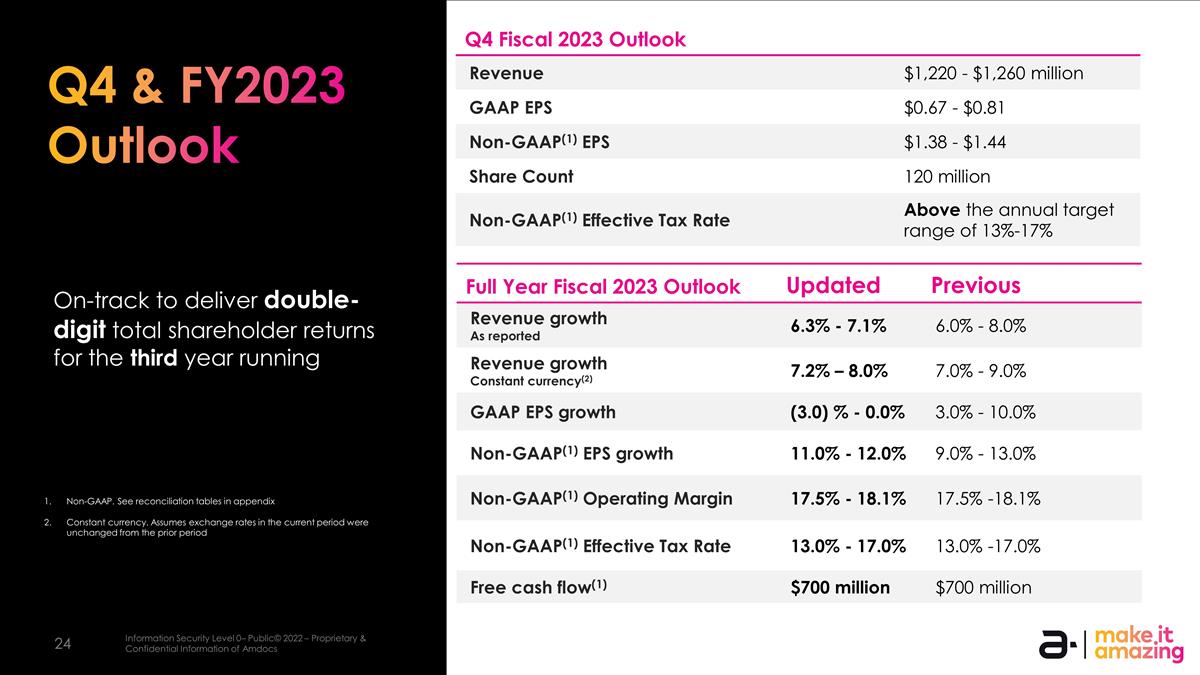
Non-GAAP. See reconciliation tables in appendix Constant currency. Assumes exchange rates in the current period were unchanged from the prior period Q4 Fiscal 2023 Outlook Category Revenue $1,220 - $1,260 million GAAP EPS $0.67 - $0.81 Non-GAAP(1) EPS $1.38 - $1.44 Share Count 120 million Non-GAAP(1) Effective Tax Rate Above the annual target range of 13%-17% Full Year Fiscal 2023 Outlook Updated Previous Revenue growth As reported 6.3% - 7.1% 6.0% - 8.0% Revenue growth Constant currency(2) 7.2% – 8.0% 7.0% - 9.0% GAAP EPS growth (3.0) % - 0.0% 3.0% - 10.0% Non-GAAP(1) EPS growth 11.0% - 12.0% 9.0% - 13.0% Non-GAAP(1) Operating Margin 17.5% - 18.1% 17.5% -18.1% Non-GAAP(1) Effective Tax Rate 13.0% - 17.0% 13.0% -17.0% Free cash flow(1) $700 million $700 million Q4 & FY2023 Outlook On-track to deliver double-digit total shareholder returns for the third year running

Appendix Reconciliation Tables
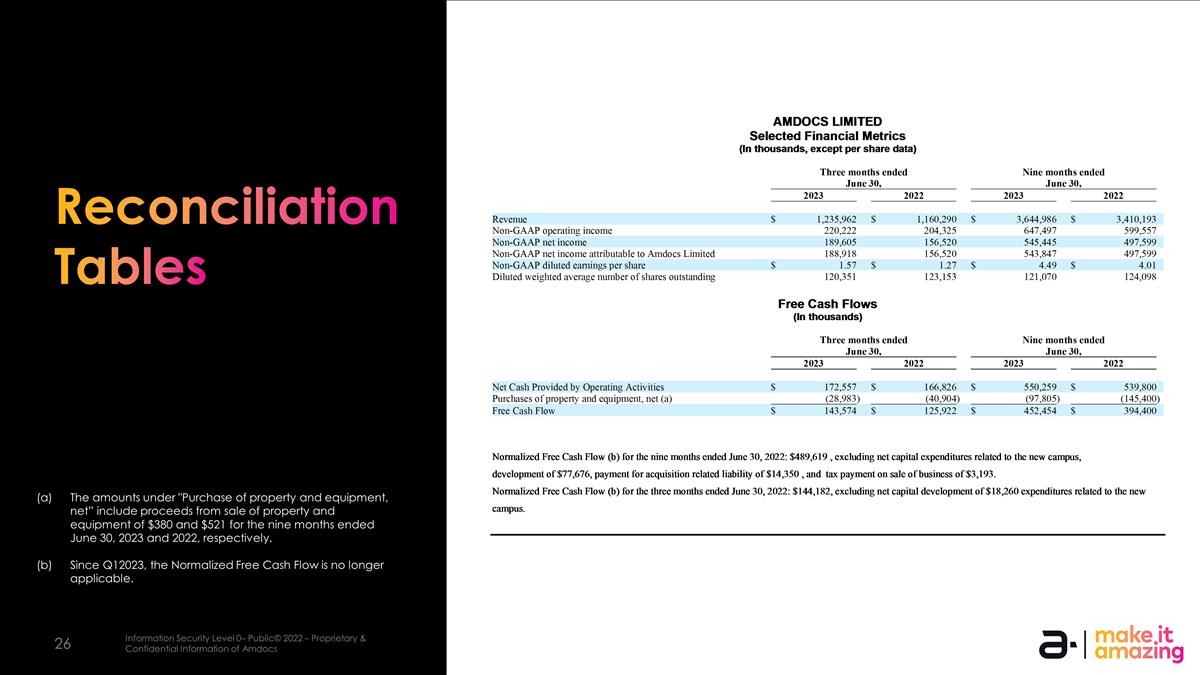
Reconciliation Tables The amounts under "Purchase of property and equipment, net” include proceeds from sale of property and equipment of $380 and $521 for the nine months ended June 30, 2023 and 2022, respectively. Since Q12023, the Normalized Free Cash Flow is no longer applicable.
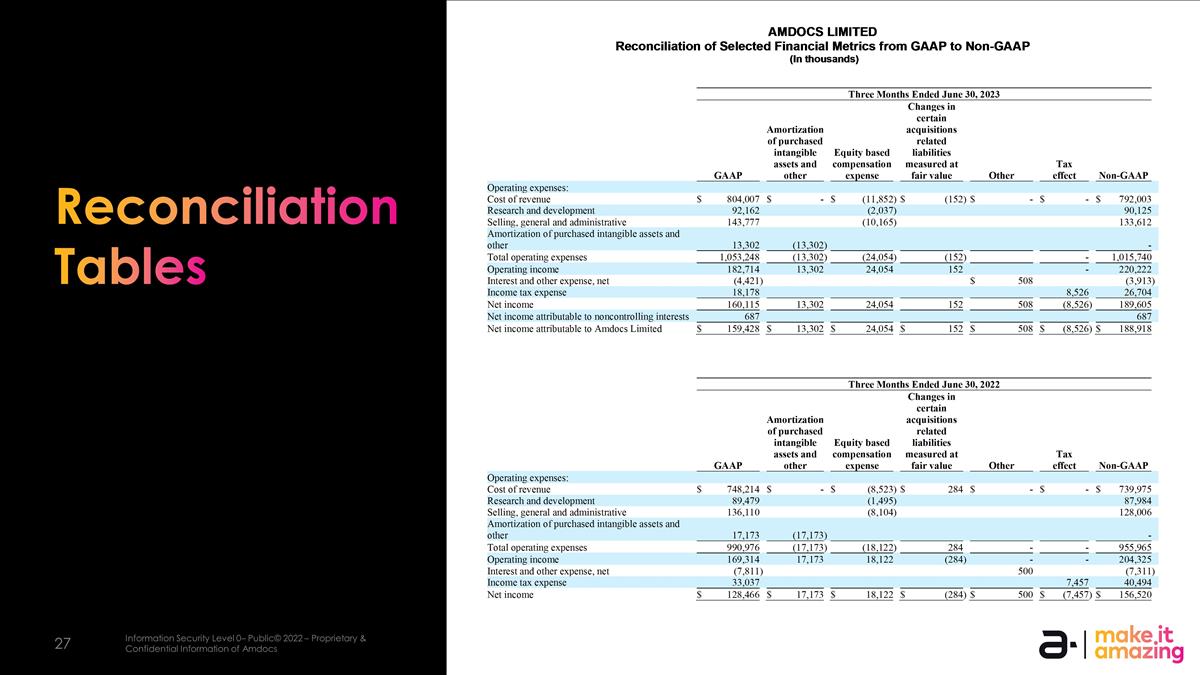
Reconciliation Tables
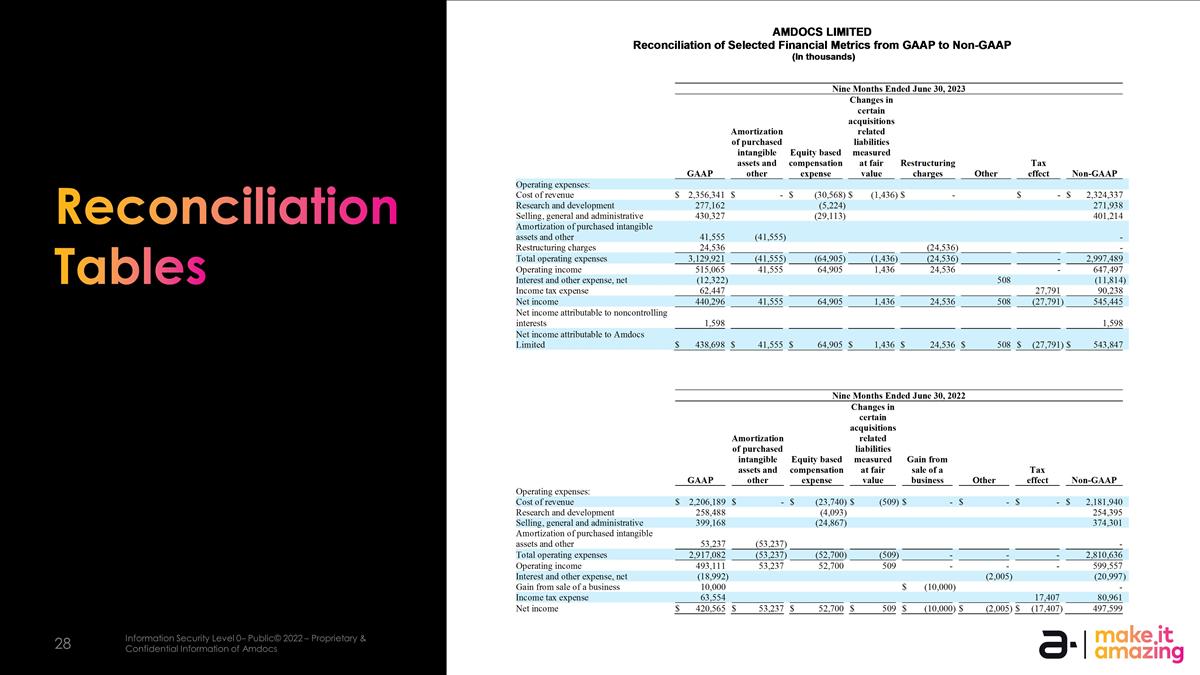
Reconciliation Tables


