
FairPoint Communications, Inc.
Lehman Brothers High Yield Bond
and Syndicated Loan Conference
March 26, 2007

Presenter
John P. Crowley – Executive Vice President, Chief Financial Officer

Forward-Looking Statement
Page 2
This presentation may contain forward-looking statements that are
not based on historical fact, including without limitation, statements containing
the words “expects,” “anticipates,” “intends,” “plans,” “believes,” “seeks,”
“estimates” and similar expressions and statements including those relating to
potential cost savings and synergies expected to be realized in the proposed
merger with the northeast wireline operations of Verizon Communications Inc.
Because these forward-looking statements involve known and unknown risks
and uncertainties, there are important factors that could cause actual results,
events or developments to differ materially from those expressed or implied by
these forward-looking statements. Such factors include those risks described from
time to time in FairPoint Communications, Inc.’s filings with the Securities and
Exchange Commission, including, without limitation, the risks described in
FairPoint’s most recent Annual Report on Form 10-K on file with the Securities and
Exchange Commission. These factors should be considered carefully and you are
cautioned not to place undue reliance on such forward-looking statements. All
information is current as of the date of this presentation, and FairPoint
Communications, Inc. undertakes no duty to update this information.

Company Overview
Page 4
Historical High Yield Activity
$125 million 9.5% senior
notes (1998)
$75 million floating rate
notes at a rate of LIBOR
plus 4.1875% (1998)
$200 million 12.5% senior
subordinated notes (2000)
$225 million 11.875%
senior subordinated notes
(2003)
Page 5
Overview of FairPoint
Significantly greater scope and scale
(1) As of December 31, 2006.
(2) Includes 149,998 wholesale access lines.
Pre-merger FairPoint(1)
311,150 total access line equivalents
194,119 residential voice access lines
57,587 business voice access lines
59,444 HSD subscribers (including DSL,
cable modem and WBB)
Post-merger(1)
2,005,843 total access line equivalents(2)
1,160,386 residential voice access lines
447,966 business voice access lines
247,493 HSD subscribers (including DSL,
cable modem and WBB)

Page 6
FairPoint Profile
(1) Includes acquired lines.
(2) Includes voice access lines and high speed data lines (DSL, cable modem and wireless broadband).
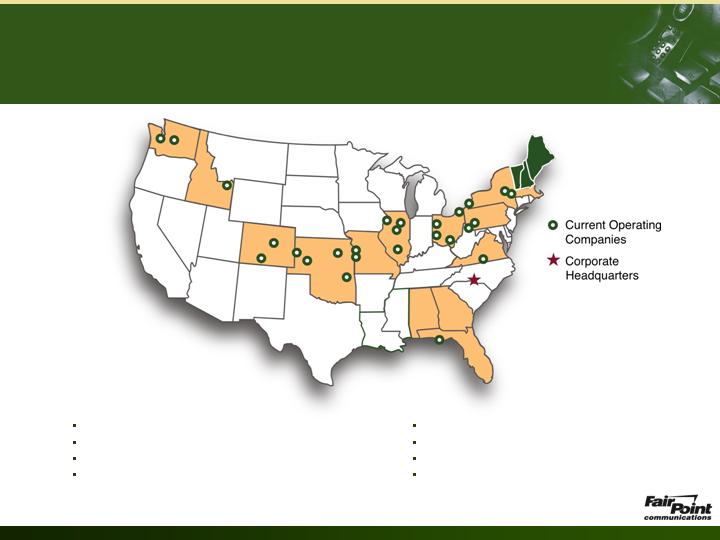
A leading provider of communications
services in rural and small urban communities
Established in 1991 to acquire Rural Local Exchange Carriers (“RLECs”)
A leading acquirer of RLEC properties, with 35 acquisitions completed
since 1993. Recent acquisitions include:
Cass County Telephone Company – closed in 3rd Quarter of 2006
Unite Communications – closed in 3rd Quarter of 2006
The Germantown Independent Telephone Company –
closed in 4th Quarter of 2006
Merger with Verizon’s Maine, Vermont and New Hampshire
wireline operations – expected to close in January 2008
Currently operate 31 local exchange companies in 18 states
311,150(1) access line equivalents(2) as of December 31, 2006,
up from 289,658 (1) access line equivalents as of December 31, 2005

Page 7
Investment Thesis
Attractive, sustainable cash flow
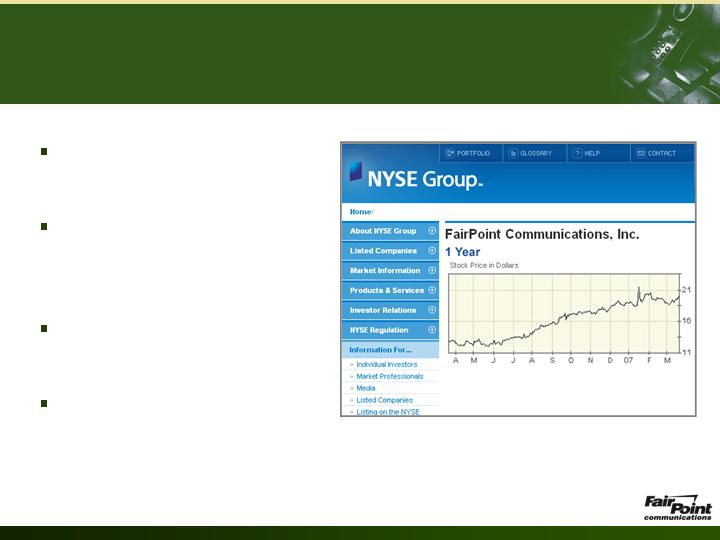
Completed initial public offering in February 2005
Regulated businesses have historically provided
relatively stable revenue base
Organic growth from non-regulated businesses: high
speed data and long distance products
External growth through acquisitions with low
integration risk
Attractive dividend yield: current quarterly dividend of
$0.39781 per share (or $1.59 annually)

Page 8
Strengthening Communities
through Communications
A leading provider of communications services in
rural and small urban communities
Average density – approximately 13 access lines per square mile
(our most rural areas have one access line per square mile)
Favorable rural market dynamics
Loyal, stable customer base
Fundamentally better wireline trends than most non-rural carriers
Technologically advanced infrastructure
92% of our access lines are high speed data capable
Use multiple technologies for high speed data
(DSL, Cable, Wireless Broadband)
Use multiple technologies for video
(IPTV, Cable, DirecTV partnerships)

Page 9
Key Financial Metrics
(1) Adjusted EBITDA is a non-GAAP financial measure (i.e., it is not a measure of financial performance under generally accepted accounting principles) and should not be considered in isolation or as a substitute for consolidated statements of operations and cash flows data prepared in accordance with GAAP. In addition, the non-GAAP financial measures used by FairPoint may not be comparable to similarly titled measures of other companies. For further information, definitions and reconciliations, see the Company’s earnings release for the fourth quarter of 2006 filed on Form 8-K with the Securities and Exchange Commission on February 23, 2007.
Results for the year ended December 31, 2006
Consolidated Revenues $270.1 million
Adjusted EBITDA(1) $133.2 million
Net Income $31.1 million
Access Line Equivalents 311,150
HSD Subscribers 59,444
Total Long Term Debt $608.0 million
(90% at fixed rates, via swaps)

Pending Merger

Page 11
Rationale For The Merger
Compelling benefits for stakeholders, customers and employees
Benefits stakeholders
Pro forma leverage improves to approximately
4.1 times EBITDA(2)
Pro forma dividend payout ratio expected
to improve to 60%–70% after anticipated
cost-savings
Improves financial flexibility
Improves revenue mix
Improves dividend sustainability (FairPoint intends to
maintain its dividend at $1.59 per share annually(1))
Benefits customers and employees
Stronger competitive operations
Increased focus on customers
Significant DSL / broadband expansion in region
Expanded employee base enhances core capabilities
Opening three scalable service centers in the region
Constructive relationships with employees, unions and policymakers
(1) Subject to declaration by the board of directors and compliance with Delaware law and covenants in agreements governing indebtedness.
(2) Estimate at closing of merger. Calculated using combined EBITDA for 2005 and combined net debt at closing.

Page 12
Long-term Strategic Flexibility
Increased opportunities to generate value
Provides multiple opportunities for value creation
Improves revenue opportunities
New product bundles
Increased broadband availability
Increased focus on local sales and marketing
Enhances operational efficiencies
Economies of scale
Investment in state-of-the-art systems
Greater operating flexibility
Improves financial strength
De-leverages balance sheet
Improves access to capital / lowers cost of capital
Increases free cash flow
Reduces reliance on access and USF revenues

Page 13
Favorable Contribution Metrics
Shareholders receive significant stake in combined entity
FRP shareholders
own approximately
40% of the
combined company
FRP contribution
14% of total
access lines
18% of total revenue
24% of total EBITDA
(1) Based on 2005 audited financial results, net of adjustments to pension and other postretirement benefit expenses and certain one time items.
(2) Based on access lines at September 30, 2006.

Page 14
Attractive Financial Characteristics
With defined opportunities for improvement
(1) Earnings before interest, taxes, depreciation and amortization.
(2) Based on 2005 audited financial results, net of adjustments to pension and other postretirement benefit expenses and certain one time items.
2005 EBITDA was $395 million but included certain expenses relating to liabilities which will not be assumed in the merger.
(3) Excludes depreciation and amortization. Includes $240 million of allocated expenses from Verizon affiliates.
Expected cost savings and
synergies of $60 - $75 million
annually
Full effect of synergies begins
12 months after closing
Planned investment of $200
million in strategic systems
6.3x
EBITDA multiple (based on 2005 EBITDA)(1)(2)
$2,715M
Total Transaction Value
$1,700M
Plus Assumed Debt
$1,015M
Implied Equity Value (@ $18.88 per share)
53.8 Million FairPoint Shares issued to Verizon Stockholders
$775 million
$431 million
Operating expenses(3)
EBITDA
$1,206 million
Revenue
Verizon’s Maine, New Hampshire and
Vermont operations (2) :

Page 15
87%
Payout ratio(1)
4.5x
Leverage(1)(5)
35.1 million
Shares Outstanding(4)
$1.59 per share
Annual Dividend
$602 million
Net Debt(3)
$135 million
EBITDA(1)
$263 million
Revenue(1)
FairPoint (pre-merger):
(1) Based on 2005 results which are the most recent full year audited financial
statements publicly available for both companies.
(2) Based on 2005 audited financial results, net of adjustments to pension and
other postretirement benefit expenses and certain one time items.
(3) Long-term debt net of cash and cash equivalents as of December 31, 2005.
(4) As of September 30, 2006.
(5) Defined as net debt/EBITDA.
(6) Pro-forma payout ratio after realization of anticipated cost savings and
synergies of $60-75 million
(7) Calculated using 2005 combined EBITDA and estimated net debt closing.
Summary Financial Comparison
Enhanced financial strength
60 – 70%
Payout ratio(6)
4.1x (at closing)
Leverage(7)
88.9 million
Shares Outstanding
$1.59 per share
Annual Dividend
$2,334 million
Net Debt(3)
$566 million
EBITDA(2)
$1,469 million
Revenue(2)
Pro forma FairPoint Consolidated:
Expected cost savings / synergies
of $60 - $75 million annually
Full effect of synergies begins
12 months after closing
Planned investment of $200
million in strategic systems
Page 16
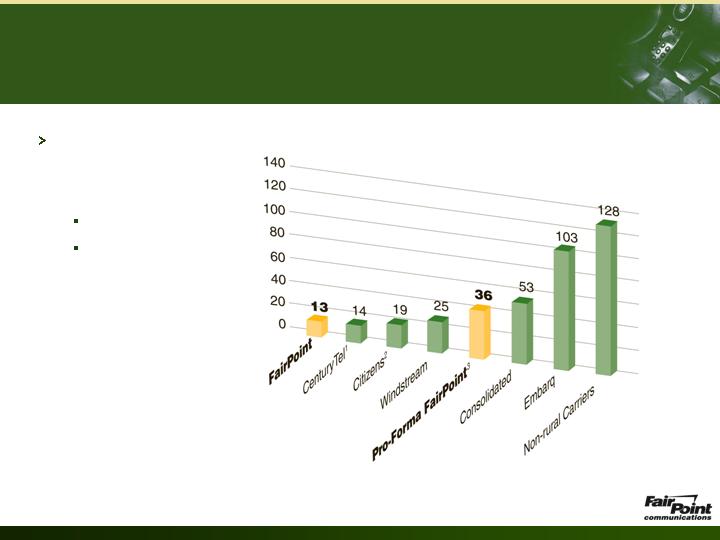
Favorable Rural Characteristics
Focus on rural / small urban markets
Continuing focus
on lower-density
markets after
transaction
36 lines / sq. mile
More than 80% of local
exchanges will
serve 5,000
customers or less
Notes
1.
Pro forma for CenturyTel’s acquisition of Madison River
2.
Pro forma for Citizens’ acquisition of Commonwealth
2.
Pro forma for Fairpoint's aquisition of Verizon's New England access lines
Source
SEC filings and
investor presentations
Access Lines/Square Mile

Page 17
Access Line Trends/Metrics
Opportunity for improvement
$29.70
39.7%
12.7%
6.4%
VZ ME, VT and
NH
$42.02
45.2%
23.6%
3.4%
FairPoint(1)
HSD ARPU(4)
Long Distance
Penetration(3)
HSD
Penetration(3)
Access Line
Losses(2)
Note: All numbers based on December 31, 2006 information.
(1)
Access lines losses excludes acquired lines.
(2)
Comparison of December 31, 2006 to December 31, 2005.
(3)
Shown as a percentage of voice access lines.
(4)
Represents average revenue per unit (ARPU) for the fourth quarter of 2006.

Page 18
Transition Planning
Existing Credit Agreement amended to facilitate a successful transition
Getting ahead -
Integration plan based upon investing $200 million for systems
development and integration (of which, approximately $95 -
$110 million invested before closing)
Verizon to pay for up to $40 million of these pre-closing transition costs
FRP expects to generate $55 million through the sale of its investment in
Orange County –Poughkeepsie to Verizon Wireless
Credit Agreement Amended to:
Consent to the sale of Orange-Poughkeepsie and exclude proceeds from
Distributable Cash Flow
Amend definition of Consolidated Capital Expenditures and EBITDA to
allow for add-back of expenditures associated with the transition not to
exceed $72.9 million
Increase leverage and dividend suspension covenants to 5.5x and 5.25x
respectively

Page 19
Merger Financing
Obtained $2.1 billion commitment for bank financing(1)
Total debt issuance at closing will approximate FairPoint’s
outstanding debt plus $1.7 billion assumed from Verizon
Bank financing
Payoff FairPoint’s existing credit facility
Finance special dividend to Verizon up to amount of existing tax basis
Terms
Revolver - 6 year maturity
Term Loan B - 8 year maturity (1% amortization beginning year 3)
Covenants
Total leverage of 5.75x in year one and 5.5x thereafter
Interest coverage ratio of 2.25x
Proposed high-yield financing(1)
Difference between $1.7 billion in assumed debt and Spinco tax basis
will be issued in unsecured bonds
(1) Offering size subject to change based on final tax basis of Spinco assets.

Summary

Page 21
Summary
Strategic win for stakeholders, employees and customers
Benefits stakeholders
Attractive valuation
Results in cash flow accretion
Enhances financial strength
Benefits customers and employees
Support services return to Maine, New Hampshire
and Vermont
FairPoint’s strong commitment to and success in
broadband Accelerates economies of scale
Leverages FairPoint’s management team
Creates multiple opportunities for
ongoing value creation
Improves revenue opportunities
Enhances operating efficiencies

Questions and Answers
March 26, 2007