Table of Contents
UNITED STATES
SECURITIES AND EXCHANGE COMMISSION
Washington, D.C. 20549
FORM N-CSR
CERTIFIED SHAREHOLDER REPORT OF REGISTERED MANAGEMENT INVESTMENT COMPANIES
Investment Company Act file number 811-08797 and 811-09049
Name of Fund: BlackRock Small Cap Growth Fund II of BlackRock Series, Inc. and BlackRock Master Small Cap Growth Portfolio of BlackRock Master LLC
Fund Address: 100 Bellevue Parkway, Wilmington, DE 19809
Name and address of agent for service: John M. Perlowski, Chief Executive Officer, BlackRock Small Cap Growth Fund II of BlackRock Series, Inc. and BlackRock Master Small Cap Growth Portfolio of BlackRock Master LLC, 55 East 52nd Street, New York, NY 10055
Registrants’ telephone number, including area code: (800) 441-7762
Date of fiscal year end: 05/31/2013
Date of reporting period: 05/31/2013
Table of Contents
Item 1 – Report to Stockholders
Table of Contents
MAY 31, 2013
ANNUAL REPORT
| BLACKROCK® |
BlackRock Disciplined Small Cap Core Fund | of BlackRock FundsSM
BlackRock Small Cap Growth Fund II | of BlackRock Series, Inc.
| Not FDIC Insured ¡ May Lose Value ¡ No Bank Guarantee |
Table of Contents
| Table of Contents |
| Page | ||||
| 3 | ||||
Annual Report: | ||||
| 4 | ||||
| 8 | ||||
| 8 | ||||
| 8 | ||||
Fund Financial Statements: | ||||
Schedule of Investments: BlackRock Disciplined Small Cap Core Fund | 9 | |||
| 16 | ||||
| 18 | ||||
| 19 | ||||
| 20 | ||||
| 24 | ||||
Fund Report of Independent Registered Public Accounting Firm | 32 | |||
| 32 | ||||
Master Portfolio Information: BlackRock Master Small Cap Growth Portfolio | 33 | |||
Master Portfolio Financial Statements: | ||||
| 34 | ||||
| 41 | ||||
| 42 | ||||
| 43 | ||||
| 43 | ||||
| 44 | ||||
Master Portfolio Report of Independent Registered Public Accounting Firm | 49 | |||
Disclosure of Investment Advisory Agreement and Sub-Advisory Agreement | 50 | |||
| 57 | ||||
| 60 | ||||
| 62 |
| 2 | ANNUAL REPORT | MAY 31, 2013 |
Table of Contents
About this time one year ago, risk assets (such as equities) began to rebound from a spring selloff as weakening global economic data spurred increasing optimism that the world’s largest central banks would intervene to stimulate growth. This theme, along with the European Central Bank’s (“ECB’s”) firm commitment to preserve the euro currency bloc, drove most asset classes higher through the summer of 2012. In early September, the ECB announced its sovereign bond-buying program designed to support the region’s debt-laden countries. Days later, the US Federal Reserve announced its own much-anticipated stimulus package.
Although financial markets worldwide were buoyed by these aggressive policy actions, risk assets weakened in the fall of 2012. Global trade slowed as many European countries fell into recession and growth continued to decelerate in China. In the United States, stocks slid on lackluster corporate earnings and volatility rose in advance of the US Presidential election. In the post-election environment, investors became more concerned about the “fiscal cliff” of tax increases and spending cuts that had been scheduled to take effect at the beginning of 2013. High levels of global market volatility persisted through year-end due to fears that bipartisan gridlock would preclude a timely resolution, putting the US economy at high risk for recession. As 2013 began, the worst of the fiscal cliff was averted with a last-minute tax deal, although decisions relating to spending cuts and the debt ceiling were postponed, leaving lingering uncertainty.
Investors shook off the nerve-wracking finale to 2012 and the New Year started with a powerful relief rally. Money that had been pulled to the sidelines amid year-end tax-rate uncertainty poured back into the markets in January. Key indicators signaling modest but broad-based improvements in the world’s major economies underpinned the rally. Underlying this aura of comfort was the absence of negative headlines out of Europe. As a result, global equities surged early in the year while rising US Treasury yields pressured high quality fixed income assets. (Bond prices move inversely with yields.)
However, February brought a slowdown in global economic momentum and investors toned down their risk appetite. In the months that followed, US equities outperformed international markets, as the US recovery showed greater stability versus most other regions. But the market’s ascent was uneven, with positive economic reports pushing US stock indices to all-time highs in March and disappointing data causing weakness in April. Also driving volatility was speculation and anxiety about how long the US Federal Reserve would continue its stimulus programs. On the whole, US stocks have performed quite well thus far in 2013 as the US economy demonstrated enough resilience to allay fears of recession, while growth has remained slow enough to dissuade the US Federal Reserve from changing its stance.
Volatility has been higher in financial markets outside the United States in 2013. International equities weakened in the middle of the first quarter when political instability in Italy and a severe banking crisis in Cyprus reminded investors that the eurozone was still vulnerable to a number of macro risks. More recently, non-US markets have been pressured by a poor outlook for European economies that are mired in recession, while China’s growth rate continued to disappoint. Emerging markets lagged the rest of the world as growth in these economies was particularly lackluster.
Despite continued headwinds for global growth, risk assets charged ahead for the reporting period, driven largely by investors seeking meaningful yields in the ongoing low-interest-rate environment. For the 12-month period ended May 31, 2013, global equity markets and high yield bonds posted strong gains. US Treasury yields remained low from a historical perspective, but were highly volatile, with a sharp rise in the final month of the period driven by concerns about central bank policy tightening. In fixed income markets, 10-year US Treasury bonds posted negative returns and investment-grade bonds generated only a slight gain. Tax-exempt municipal bonds, however, benefited from favorable supply-and-demand dynamics. Near-zero short term interest rates continued to keep yields on money market securities near their all-time lows.
Market conditions have improved over the past couple of years, but investors still remain highly uncertain and are continuing to seek out new strategies and new ways of investing. At BlackRock, we believe investors need to think globally and extend their scope across a broader array of asset classes within a portfolio that moves freely as market conditions change over time. We would encourage you to talk with your financial advisor and to visit www.blackrock.com for further insight about investing in today’s world.
Sincerely,

Rob Kapito
President, BlackRock Advisors, LLC

“Despite continued headwinds for global growth, risk assets charged ahead for the reporting period, driven largely by investors seeking meaningful yields in the ongoing low-interest-rate environment.”
Rob Kapito
President, BlackRock Advisors, LLC
| Total Returns as of May 31, 2013 | ||||||||
| 6-month | 12-month | |||||||
US large cap equities | 16.43 | % | 27.28 | % | ||||
US small cap equities | 20.60 | 31.07 | ||||||
International equities | 11.39 | 31.62 | ||||||
Emerging market | 1.30 | 14.10 | ||||||
3-month Treasury bill | 0.05 | 0.12 | ||||||
US Treasury securities | (3.37 | ) | (2.22 | ) | ||||
US investment grade | (1.05 | ) | 0.91 | |||||
Tax-exempt municipal | (0.86 | ) | 3.62 | |||||
US high yield bonds | 5.79 | 14.82 | ||||||
| Past performance is no guarantee of future results. Index performance is shown for illustrative purposes only. You cannot invest directly in an index. | ||||||||
| THIS PAGE NOT PART OF YOUR FUND REPORT | 3 |
Table of Contents
| Fund Summary as of May 31, 2013 | BlackRock Disciplined Small Cap Core Fund |
| Investment Objective |
BlackRock Disciplined Small Cap Core Fund’s (the “Fund”) investment objective is to seek capital appreciation over the long term.
| Portfolio Information |
| Ten Largest Holdings | Percent of Long-Term Investments |
Aspen Technology, Inc. | 1 | % | ||
A.O. Smith Corp. | 1 | |||
RLJ Lodging Trust | 1 | |||
Southwest Gas Corp. | 1 | |||
Syntel, Inc. | 1 | |||
Ocwen Financial Corp. | 1 | |||
Tech Data Corp. | 1 | |||
Ryder System, Inc. | 1 | |||
Bonanza Creek Energy, Inc. | 1 | |||
First Citizens BancShares, Inc., Class A | 1 |
| Sector Allocation | Percent of Long-Term Investments |
Financials | 20 | % | ||
Information Technology | 16 | |||
Consumer Discretionary | 16 | |||
Industrials | 15 | |||
Health Care | 13 | |||
Energy | 7 | |||
Materials | 5 | |||
Consumer Staples | 4 | |||
Utilities | 3 | |||
Telecommunication Services | 1 |
For Fund compliance purposes, the Fund’s sector classifications refer to any one or more of the sector sub-classifications used by one or more widely recognized market indexes or ratings group indexes, and/or as defined by Fund management. These definitions may not apply for purposes of this report, which may combine such sector sub-classifications for reporting ease.
| 4 | ANNUAL REPORT | MAY 31, 2013 |
Table of Contents
| BlackRock Disciplined Small Cap Core Fund |
| Expense Example |
| Actual | Hypothetical2 | |||||||||||||||||||||||||||
Beginning Account Value March 14, 2013 | Ending Account Value 2013 | Expenses Paid During the Period1 | Beginning Account Value March 14, 2013 | Ending Account Value May 31, 2013 | Expenses Paid During the Period1 | Annualized Expense Ratio | ||||||||||||||||||||||
Institutional | $ | 1,000.00 | $ | 1,037.00 | $ | 1.52 | $ | 1,000.00 | $ | 1,009.19 | $ | 1.50 | 0.70 | % | ||||||||||||||
Investor A | $ | 1,000.00 | $ | 1,037.00 | $ | 2.07 | $ | 1,000.00 | $ | 1,008.65 | $ | 2.04 | 0.95 | % | ||||||||||||||
Investor C | $ | 1,000.00 | $ | 1,035.00 | $ | 3.70 | $ | 1,000.00 | $ | 1,007.05 | $ | 3.65 | 1.70 | % | ||||||||||||||
| 1 | For each class of the Fund, expenses are equal to the annualized expense ratio for the class, multiplied by the average account value over the period, multiplied by 78/365 (to reflect the period from March 14, 2013, the commencement of operations, to May 31, 2013). |
| 2 | Hypothetical 5% annual return before expenses is calculated by pro rating the number of days in the most recent fiscal period divided by 365. |
See “Disclosure of Expenses” on page 8 for further information on how expenses were calculated.
| ANNUAL REPORT | MAY 31, 2013 | 5 |
Table of Contents
| Fund Summary as of May 31, 2013 | BlackRock Small Cap Growth Fund II |
| Investment Objective |
BlackRock Small Cap Growth Fund II’s (the “Fund”) investment objective is to seek long-term capital growth. In other words, the Fund tries to choose investments that will increase in value. Current income from dividends and interest will not be an important consideration in selecting portfolio securities.
| Portfolio Management Commentary |
How did the Fund perform?
| Ÿ | For the 12-month period ended May 31, 2013, through its investment in BlackRock Master Small Cap Growth Portfolio (the “Master Portfolio”), the Fund generated strong positive returns. For this period, all of the Fund’s share classes underperformed the benchmark, the Russell 2000® Growth Index, with the exception of the Institutional Share class, which outperformed the benchmark index. |
What factors influenced performance?
| Ÿ | Relative to the Russell 2000® Growth Index, stock selection within the health care and industrials sectors had a negative impact on results for the period. In health care, shares of electronic medical records provider Allscripts Healthcare Solutions, Inc. fell substantially in the fourth quarter of 2012 after the company reported declining sales, fired the long-time chief executive officer and abandoned its plans to sell the company. Shares of biopharmaceutical company Gentium SpA fell sharply in February 2013 after the company’s hepatic veno-occlusive disease drug Defibrotide failed to receive regulatory approval from the European Medicines Agency. In industrials, the Master Portfolio’s holding of office supplies name ACCO Brands Corp. hurt performance as the company reported declining earnings and a weaker business outlook. |
| Ÿ | Conversely, the Master Portfolio benefited from stock selection in the energy and information technology (“IT”) sectors. Within energy, liquefied natural gas (“LNG”) company Cheniere Energy, Inc. was a notable contributor before being sold, as LNG demand from Japan and China increased and the US Energy Department endorsed the exporting of LNG. In the IT sector, business software company PROS Holdings, Inc. appreciated significantly over the period as the company reported better-than-expected earnings and revenues and issued a positive growth forecast. |
Describe recent portfolio activity.
| Ÿ | During the 12-month period, the Master Portfolio decreased its overall weighting in the IT sector, eliminating positions in TiVo, Inc., Semtec Corp. and Dealertrack Technologies, Inc. The Master Portfolio increased exposure to financials with the addition of Ocwen Financial Corp. and WageWorks, Inc. |
Describe portfolio positioning at period end.
| Ÿ | Relative to the Russell 2000® Growth Index, the Master Portfolio ended the period with its most significant sector overweight in telecommunication services and its most significant underweight in consumer staples. |
The views expressed reflect the opinions of BlackRock as of the date of this report and are subject to change based on changes in market, economic or other conditions. These views are not intended to be a forecast of future events and are no guarantee of future results.
| 6 | ANNUAL REPORT | MAY 31, 2013 |
Table of Contents
| BlackRock Small Cap Growth Fund II |
| Total Return Based on a $10,000 Investment |
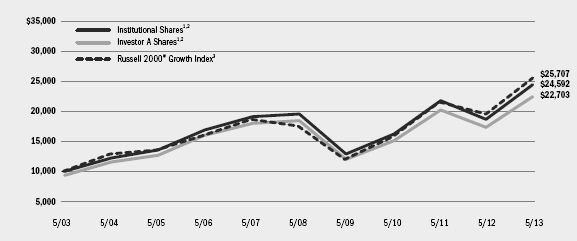
| 1 | Assuming maximum sales charges, if any, transaction costs and other operating expenses, including administration fees. Institutional Shares do not have a sales charge. |
| 2 | The Fund invests all of its assets in the Master Portfolio. The Master Portfolio invests primarily in a diversified portfolio of equity securities of small cap companies located in the United States that Master Portfolio management believes have above-average prospects for earnings growth. |
| 3 | The index contains those securities with greater-than-average growth orientations, generally having higher price-to-book and price-to-earnings ratios. |
| Performance Summary for the Period Ended May 31, 2013 | ||||||||||||||||||||||||||||
| Average Annual Total Returns4 | ||||||||||||||||||||||||||||
| 1 Year | 5 Years | 10 Years | ||||||||||||||||||||||||||
6-Month Total Returns | w/o sales charge | w/sales charge | w/o sales charge | w/sales charge | w/o sales charge | w/sales charge | ||||||||||||||||||||||
Institutional | 17.73 | % | 30.95 | % | N/A | 4.45 | % | N/A | 9.42 | % | N/A | |||||||||||||||||
Investor A | 17.49 | 30.45 | 23.60 | % | 4.17 | 3.05 | % | 9.13 | 8.54 | % | ||||||||||||||||||
Investor B | 16.84 | 28.99 | 24.49 | 2.91 | 2.56 | 8.27 | 8.27 | |||||||||||||||||||||
Investor C | 16.94 | 29.31 | 28.31 | 3.14 | 3.14 | 8.14 | 8.14 | |||||||||||||||||||||
Class R | 17.32 | 30.05 | N/A | 3.76 | N/A | 8.82 | N/A | |||||||||||||||||||||
Russell 2000® Growth Index | 21.58 | 30.86 | N/A | 7.69 | N/A | 9.90 | N/A | |||||||||||||||||||||
| 4 | Assuming maximum sales charges, if any. Average annual total returns with and without sales charges reflect reductions for distribution and service fees. See “About Fund Performance” on page 8 for a detailed description of share classes, including any related sales charges and fees. |
| N/A—Not applicable as share class and index do not have a sales charge. |
| Past performance is not indicative of future results. |
| Expense Example | ||||||||||||||||||||||||||||
| Actual | Hypothetical6 | |||||||||||||||||||||||||||
Beginning Account Value December 1, 2012 | Ending Account Value May 31, 2013 | Expenses Paid During the Period5 | Beginning Account Value December 1, 2012 | Ending Account Value May 31, 2013 | Expenses Paid During the Period5 | Annualized Expense Ratio | ||||||||||||||||||||||
Institutional | $1,000.00 | $1,177.30 | $5.59 | $1,000.00 | $1,019.80 | $5.19 | 1.03 | % | ||||||||||||||||||||
Investor A | $1,000.00 | $1,174.90 | $8.13 | $1,000.00 | $1,017.45 | $7.54 | 1.50 | % | ||||||||||||||||||||
Investor B | $1,000.00 | $1,168.40 | $13.89 | $1,000.00 | $1,012.12 | $12.89 | 2.57 | % | ||||||||||||||||||||
Investor C | $1,000.00 | $1,169.40 | $12.87 | $1,000.00 | $1,013.06 | $11.94 | 2.38 | % | ||||||||||||||||||||
Class R | $1,000.00 | $1,173.20 | $9.48 | $1,000.00 | $1,016.21 | $8.80 | 1.75 | % | ||||||||||||||||||||
| 5 | For each class of the Fund, expenses are equal to the annualized expense ratio for the class, multiplied by the average account value over the period, multiplied by 182/365 (to reflect the one-half year period shown). Because the Fund invests significantly in the Master Portfolio, the expense table reflects the net expenses of both the Fund and the Master Portfolio in which it invests. |
| 6 | Hypothetical 5% annual return before expenses is calculated by pro rating the number of days in the most recent fiscal half year divided by 365. |
| See “Disclosure of Expenses” on page 8 for further information on how expenses were calculated. |
| ANNUAL REPORT | MAY 31, 2013 | 7 |
Table of Contents
| About Fund Performance |
| Ÿ | Institutional Shares are not subject to any sales charge. These shares bear no ongoing distribution or service fees and are available only to eligible investors. |
| Ÿ | Investor A Shares are subject to a maximum initial sales charge (front-end load) of 5.25% and a service fee of 0.25% per year (but no distribution fee). |
| Ÿ | Investor B Shares (available only in BlackRock Small Cap Growth II Fund) are subject to a maximum contingent deferred sales charge (“CDSC”) of 4.50% declining to 0% after six years. In addition, these shares are subject to a distribution fee of 0.75% per year and a service fee of 0.25% per year. These shares automatically convert to Investor A Shares after approximately eight years. (There is no initial sales charge for automatic share conversions.) All returns for periods greater than eight years reflect this conversion. These shares are only available through exchanges and dividend reinvestments by existing shareholders and for purchase by certain employer-sponsored retirement plans. |
| Ÿ | Investor C Shares are subject to a 1.00% CDSC if redeemed within one year of purchase. In addition, these shares are subject to a distribution fee of 0.75% per year and a service fee of 0.25% per year. |
| Ÿ | Class R Shares (available only in BlackRock Small Cap Growth II Fund) are not subject to any sales charge. These shares are subject to a distribution fee of 0.25% per year and a service fee of |
0.25% per year. These shares are available only to certain employer-sponsored retirement plans. |
Performance information reflects past performance and does not guarantee future results. Current performance may be lower or higher than the performance data quoted. Refer to www.blackrock.com/funds to obtain performance data current to the most recent month end. Performance results do not reflect the deduction of taxes that a shareholder would pay on fund distributions or the redemption of fund shares. Figures shown in the performance table on the previous page assume reinvestment of all dividends and distributions, if any, at net asset value (“NAV”) on the ex-dividend date. Investment return and principal value of shares will fluctuate so that shares, when redeemed, may be worth more or less than their original cost. Dividends paid to each class of shares will vary because of the different levels of service, distribution and transfer agency fees applicable to each class, which are deducted from the income available to be paid to shareholders.
BlackRock Advisors, LLC (the “Manager”), BlackRock Disciplined Small Cap Core Fund’s (the “Fund’s”) investment advisor, waived and/or reimbursed a portion of the Fund’s expenses. Without such waiver and/or reimbursement, the Fund’s performance would have been lower. The Manager is under no obligation to waive or reimburse or to continue waiving or reimbursing its fees after the applicable termination date. See Note 3 of the Notes to Financial Statements for additional information on waivers and reimbursements.
| Disclosure of Expenses |
Shareholders of each Fund may incur the following charges: (a) transactional expenses, such as sales charges and (b) operating expenses, including administration and investment advisory fees, service and distribution fees, including 12b-1 fees, acquired fund fees and other Fund expenses. The expense examples shown on the previous pages (which are based on a hypothetical investment of $1,000 invested on December 1, 2012 (BlackRock Small Cap Growth Fund II) or March 14, 2013 (BlackRock Disciplined Small Cap Core Fund) and held through May 31, 2013) are intended to assist shareholders both in calculating expenses based on an investment in each Fund and in comparing these expenses with similar costs of investing in other mutual funds.
The expense examples provide information about actual account values and actual expenses. In order to estimate the expenses a shareholder paid during the period covered by this report, shareholders can divide their account value by $1,000 and then multiply the result by the number corresponding to their Fund and share class under the headings
entitled “Expenses Paid During the Period.”
The expense examples also provide information about hypothetical account values and hypothetical expenses based on each Fund’s actual expense ratio and an assumed rate of return of 5% per year before expenses. In order to assist shareholders in comparing the ongoing expenses of investing in these Funds and other funds, compare the 5% hypothetical example with the 5% hypothetical examples that appear in other funds’ shareholder reports.
The expenses shown in the expense examples are intended to highlight shareholders’ ongoing costs only and do not reflect any transactional expenses, such as sales charges, if any. Therefore, the hypothetical examples are useful in comparing ongoing expenses only, and will not help shareholders determine the relative total expenses of owning different funds. If these transactional expenses were included, shareholder expenses would have been higher.
| Derivative Financial Instruments |
BlackRock Disciplined Small Cap Core Fund (the “Fund”) and the Master Portfolio may invest in various derivative financial instruments, including financial futures contracts and options, as specified in Note 2 of the Fund’s and Master Portfolio’s Notes to Financial Statements, which may constitute forms of economic leverage. Such derivative financial instruments are used to obtain exposure to a security, index and/or market without owning or taking physical custody of securities or to hedge market and/or equity risks. Derivative financial instruments involve risks, including the imperfect correlation between the value of a derivative financial instrument and the underlying asset, possible default of the counterparty to the transaction or illiquidity of the derivative financial instrument. The Fund’s and Master Portfolio’s ability to use a derivative
financial instrument successfully depends on the investment advisor’s ability to predict pertinent market movements accurately, which cannot be assured. The use of derivative financial instruments may result in losses greater than if they had not been used, may require the Fund and Master Portfolio to sell or purchase portfolio investments at inopportune times or for distressed values, may limit the amount of appreciation the Fund and Master Portfolio can realize on an investment, may result in lower dividends paid to shareholders or may cause the Fund and Master Portfolio to hold an investment that it might otherwise sell. The Fund’s and Master Portfolio’s investments in these instruments are discussed in detail in the Fund’s and Master Portfolio’s Notes to Financial Statements.
| 8 | ANNUAL REPORT | MAY 31, 2013 |
Table of Contents
| Schedule of Investments May 31, 2013 | BlackRock Disciplined Small Cap Core Fund | |||
| (Percentages shown are based on Net Assets) |
| Common Stocks | Shares | Value | ||||||
Aerospace & Defense — 2.6% | ||||||||
AAR Corp. | 2,389 | $ | 47,923 | |||||
Alliant Techsystems, Inc. | 62 | 4,868 | ||||||
American Science & Engineering, Inc. | 282 | 16,931 | ||||||
Ducommun, Inc. (a) | 734 | 14,262 | ||||||
Esterline Technologies Corp. (a) | 52 | 3,816 | ||||||
Spirit Aerosystems Holdings, Inc., Class A (a) | 1,779 | 38,444 | ||||||
Taser International, Inc. (a) | 1,202 | 11,407 | ||||||
|
| |||||||
| 137,651 | ||||||||
Air Freight & Logistics — 0.4% | ||||||||
Atlas Air Worldwide Holdings, Inc. (a) | 146 | 6,777 | ||||||
Echo Global Logistics, Inc. (a) | 118 | 2,109 | ||||||
Pacer International, Inc. (a) | 2,189 | 13,375 | ||||||
|
| |||||||
| 22,261 | ||||||||
Airlines — 0.5% | ||||||||
Republic Airways Holdings, Inc. (a) | 1,080 | 11,588 | ||||||
SkyWest, Inc. | 585 | 8,208 | ||||||
Spirit Airlines, Inc. (a) | 241 | 7,334 | ||||||
|
| |||||||
| 27,130 | ||||||||
Auto Components — 1.2% | ||||||||
Gentherm, Inc. (a) | 267 | 4,918 | ||||||
Remy International, Inc. | 740 | 13,313 | ||||||
Stoneridge, Inc. (a) | 1,565 | 17,544 | ||||||
Tenneco, Inc. (a) | 121 | 5,368 | ||||||
Tower International, Inc. (a) | 46 | 870 | ||||||
Visteon Corp. (a) | 318 | 20,183 | ||||||
|
| |||||||
| 62,196 | ||||||||
Biotechnology — 3.9% | ||||||||
Affymax, Inc. (a) | 2,401 | 4,970 | ||||||
Agenus, Inc. (a) | 630 | 2,539 | ||||||
Alkermes Plc (a) | 144 | 4,500 | ||||||
AMAG Pharmaceuticals, Inc. (a) | 150 | 2,775 | ||||||
Astex Pharmaceuticals, Inc. (a) | 882 | 4,278 | ||||||
AVEO Pharmaceuticals, Inc. (a) | 1,028 | 2,632 | ||||||
Celldex Therapeutics, Inc. (a) | 34 | 435 | ||||||
ChemoCentryx, Inc. (a) | 269 | 3,634 | ||||||
China Biologic Products, Inc. (a) | 336 | 8,565 | ||||||
Codexis, Inc. (a) | 538 | 1,237 | ||||||
Cubist Pharmaceuticals, Inc. (a) | 56 | 3,077 | ||||||
Dendreon Corp. (a) | 925 | 3,700 | ||||||
Emergent Biosolutions, Inc. (a) | 721 | 10,238 | ||||||
Enanta Pharmaceuticals, Inc. (a) | 480 | 9,350 | ||||||
Enzon Pharmaceuticals, Inc. | 3,364 | 10,294 | ||||||
Isis Pharmaceuticals, Inc. (a) | 833 | 18,034 | ||||||
KaloBios Pharmaceuticals, Inc. (a) | 1,521 | 8,609 | ||||||
KYTHERA Biopharmaceuticals, Inc. (a) | 41 | 877 | ||||||
Ligand Pharmaceuticals, Inc., Class B (a) | 176 | 5,264 | ||||||
Maxygen, Inc. | 4,024 | 9,537 | ||||||
Merrimack Pharmaceuticals, Inc. (a) | 1,168 | 6,471 | ||||||
Myriad Genetics, Inc. (a) | 308 | 9,887 | ||||||
PDL BioPharma, Inc. | 1,766 | 14,569 | ||||||
Pharmacyclics, Inc. (a) | 262 | 24,010 | ||||||
Regulus Therapeutics, Inc. (a) | 317 | 2,840 | ||||||
Repligen Corp. (a) | 876 | 7,253 | ||||||
Rigel Pharmaceuticals, Inc. (a) | 327 | 1,511 | ||||||
Seattle Genetics, Inc. (a) | 319 | 10,948 | ||||||
| Common Stocks | Shares | Value | ||||||
Biotechnology (continued) | ||||||||
Tetraphase Pharmaceuticals, Inc. (a) | 279 | $ | 2,232 | |||||
Vanda Pharmaceuticals, Inc. (a) | 744 | 6,793 | ||||||
Verastem, Inc. (a) | 409 | 3,910 | ||||||
|
| |||||||
| 204,969 | ||||||||
Building Products — 1.6% | ||||||||
A.O. Smith Corp. | 1,596 | 62,563 | ||||||
Apogee Enterprises, Inc. | 40 | 1,067 | ||||||
Gibraltar Industries, Inc. (a) | 1,122 | 18,210 | ||||||
PGT, Inc. (a) | 72 | 594 | ||||||
Ply Gem Holdings, Inc. (a) | 27 | 624 | ||||||
Trex Co., Inc. (a) | 21 | 1,167 | ||||||
|
| |||||||
| 84,225 | ||||||||
Capital Markets — 1.4% | ||||||||
Artisan Partners Asset Management, Inc. (a) | 148 | 6,916 | ||||||
Capital Southwest Corp. | 189 | 26,061 | ||||||
FBR & Co. (a) | 566 | 13,697 | ||||||
GAMCO Investors, Inc., Class A | 42 | 2,241 | ||||||
GSV Capital Corp. (a) | 141 | 1,148 | ||||||
Investment Technology Group, Inc. (a) | 220 | 3,038 | ||||||
Manning & Napier, Inc. | 189 | 3,759 | ||||||
MCG Capital Corp. | 2,391 | 11,835 | ||||||
Oppenheimer Holdings, Inc., Class A | 115 | 2,284 | ||||||
|
| |||||||
| 70,979 | ||||||||
Chemicals — 2.3% | ||||||||
A. Schulman, Inc. | 446 | 12,889 | ||||||
American Pacific Corp. (a) | 293 | 8,145 | ||||||
Axiall Corp. | 157 | 6,775 | ||||||
Ferro Corp. (a) | 190 | 1,303 | ||||||
FutureFuel Corp. | 3,278 | 45,826 | ||||||
Kraton Performance Polymers, Inc. (a) | 321 | 6,658 | ||||||
Minerals Technologies, Inc. | 900 | 38,340 | ||||||
Tredegar Corp. | 37 | 924 | ||||||
|
| |||||||
| 120,860 | ||||||||
Commercial Banks — 6.0% | ||||||||
1st Source Corp. | 876 | 21,208 | ||||||
Access National Corp. | 658 | 8,508 | ||||||
Associated Banc-Corp. | 2,888 | 44,504 | ||||||
BancFirst Corp. | 283 | 12,129 | ||||||
Banco Latinoamericano de Comercio Exterior SA | 87 | 1,995 | ||||||
Capital Bank Financial Corp., Class A (a) | 683 | 12,226 | ||||||
Century Bancorp, Inc., Class A | 165 | 5,856 | ||||||
First Citizens BancShares, Inc., Class A | 247 | 48,726 | ||||||
First Merchants Corp. | 429 | 7,104 | ||||||
FirstMerit Corp. | 737 | 13,907 | ||||||
FNB Corp. | 779 | 8,959 | ||||||
Hancock Holding Co. | 97 | 2,769 | ||||||
Hanmi Financial Corp. (a) | 150 | 2,361 | ||||||
Home BancShares, Inc. | 61 | 2,568 | ||||||
Iberiabank Corp. | 167 | 8,607 | ||||||
Merchants Bancshares, Inc. | 299 | 8,483 | ||||||
National Bank Holdings Corp., Class A | 1,953 | 35,427 | ||||||
Prosperity Bancshares, Inc. | 85 | 4,258 | ||||||
Simmons First National Corp., Class A | 286 | 7,359 | ||||||
Southside Bancshares, Inc. | 917 | 20,761 | ||||||
| Portfolio Abbreviation | ||||
ADR American Depositary Receipts |
See Notes to Financial Statements.
| ANNUAL REPORT | MAY 31, 2013 | 9 |
Table of Contents
| Schedule of Investments (continued) | BlackRock Disciplined Small Cap Core Fund | |||
| (Percentages shown are based on Net Assets) |
| Common Stocks | Shares | Value | ||||||
Commercial Banks (continued) | ||||||||
StellarOne Corp. | 72 | $ | 1,127 | |||||
Sterling Financial Corp. | 1,192 | 26,963 | ||||||
Texas Capital Bancshares, Inc. (a) | 182 | 8,037 | ||||||
|
| |||||||
| 313,842 | ||||||||
Commercial Services & Supplies — 1.9% | ||||||||
ARC Document Solutions, Inc. (a) | 1,487 | 5,680 | ||||||
Consolidated Graphics, Inc. (a) | 367 | 17,124 | ||||||
Deluxe Corp. | 417 | 15,596 | ||||||
G&K Services, Inc., Class A | 97 | 4,686 | ||||||
Intersections, Inc. | 401 | 3,701 | ||||||
Kimball International, Inc., Class B | 299 | 2,927 | ||||||
Metalico, Inc. (a) | 1,628 | 2,344 | ||||||
RR Donnelley & Sons Co. | 95 | 1,261 | ||||||
Steelcase, Inc., Class A | 84 | 1,163 | ||||||
United Stationers, Inc. | 556 | 19,188 | ||||||
Viad Corp. | 888 | 21,898 | ||||||
West Corp. | 45 | 1,031 | ||||||
|
| |||||||
| 96,599 | ||||||||
Communications Equipment — 1.2% | ||||||||
Anaren, Inc. (a) | 43 | 1,033 | ||||||
ARRIS Group, Inc. (a) | 821 | 12,422 | ||||||
Aviat Networks, Inc. (a) | 3,196 | 8,469 | ||||||
Black Box Corp. | 310 | 8,342 | ||||||
CalAmp Corp. (a) | 123 | 1,620 | ||||||
Calix, Inc. (a) | 143 | 1,499 | ||||||
Plantronics, Inc. | 381 | 17,602 | ||||||
Symmetricom, Inc. (a) | 2,300 | 11,362 | ||||||
|
| |||||||
| 62,349 | ||||||||
Computers & Peripherals — 0.9% | ||||||||
3D Systems Corp. (a) | 77 | 3,736 | ||||||
Immersion Corp. (a) | 236 | 3,625 | ||||||
Intermec, Inc. (a) | 221 | 2,179 | ||||||
QLogic Corp. (a) | 436 | 4,247 | ||||||
Synaptics, Inc. (a) | 865 | 35,690 | ||||||
|
| |||||||
| 49,477 | ||||||||
Construction & Engineering — 1.3% | ||||||||
Argan, Inc. | 1,727 | 28,064 | ||||||
MasTec, Inc. (a) | 846 | 26,903 | ||||||
Pike Electric Corp. | 617 | 7,497 | ||||||
Sterling Construction Co., Inc. (a) | 609 | 6,303 | ||||||
|
| |||||||
| 68,767 | ||||||||
Construction Materials — 0.1% | ||||||||
United States Lime & Minerals, Inc. (a) | 68 | 3,391 | ||||||
Consumer Finance — 0.2% | ||||||||
Consumer Portfolio Services, Inc. (a) | 116 | 901 | ||||||
Nelnet, Inc., Class A | 143 | 5,586 | ||||||
Netspend Holdings, Inc. (a) | 104 | 1,665 | ||||||
Regional Management Corp. (a) | 61 | 1,440 | ||||||
|
| |||||||
| 9,592 | ||||||||
Containers & Packaging — 0.6% | ||||||||
Boise, Inc. | 3,773 | 30,410 | ||||||
| Common Stocks | Shares | Value | ||||||
Distributors — 0.1% | ||||||||
Core-Mark Holding Co., Inc. | 24 | $ | 1,421 | |||||
VOXX International Corp. (a) | 111 | 1,234 | ||||||
|
| |||||||
| 2,655 | ||||||||
Diversified Consumer Services — 1.3% | ||||||||
Apollo Group, Inc., Class A (a) | 727 | 14,533 | ||||||
Ascent Capital Group, Inc., Class A (a) | 21 | 1,523 | ||||||
Bright Horizons Family Solutions, Inc. (a) | 193 | 6,958 | ||||||
Coinstar, Inc. (a) | 569 | 33,139 | ||||||
Collectors Universe, Inc. | 290 | 3,782 | ||||||
National American University Holdings, Inc. | 385 | 1,455 | ||||||
Stewart Enterprises, Inc., Class A | 274 | 3,562 | ||||||
Weight Watchers International, Inc. | 21 | 963 | ||||||
|
| |||||||
| 65,915 | ||||||||
Diversified Financial Services — 0.0% | ||||||||
PHH Corp. (a) | 100 | 2,016 | ||||||
Diversified Telecommunication Services — 0.7% | ||||||||
Cincinnati Bell, Inc. (a) | 936 | 3,220 | ||||||
Fairpoint Communications, Inc. (a) | 504 | 4,284 | ||||||
IDT Corp., Class B | 362 | 6,295 | ||||||
magicJack VocalTec Ltd. (a) | 1,158 | 17,289 | ||||||
Neutral Tandem, Inc. | 582 | 3,387 | ||||||
Primus Telecommunications Group, Inc. | 113 | 1,339 | ||||||
|
| |||||||
| 35,814 | ||||||||
Electric Utilities — 0.6% | ||||||||
Portland General Electric Co. | 978 | 29,770 | ||||||
Electrical Equipment — 0.7% | ||||||||
Generac Holdings, Inc. | 377 | 15,269 | ||||||
Lihua International, Inc. (a) | 3,311 | 18,608 | ||||||
LSI Industries, Inc. | 209 | 1,703 | ||||||
|
| |||||||
| 35,580 | ||||||||
Electronic Equipment, Instruments & Components — 2.0% |
| |||||||
Aeroflex Holding Corp. (a) | 691 | 5,459 | ||||||
Audience, Inc. (a) | 228 | 3,192 | ||||||
AVX Corp. | 432 | 5,175 | ||||||
Benchmark Electronics, Inc. (a) | 1,235 | 24,083 | ||||||
Checkpoint Systems, Inc. (a) | 81 | 1,106 | ||||||
FARO Technologies, Inc. (a) | 26 | 973 | ||||||
InvenSense, Inc. (a) | 394 | 5,075 | ||||||
RealD, Inc. (a) | 591 | 8,918 | ||||||
Tech Data Corp. (a) | 1,025 | 51,373 | ||||||
|
| |||||||
| 105,354 | ||||||||
Energy Equipment & Services — 1.6% | ||||||||
Dawson Geophysical Co. (a) | 336 | 12,066 | ||||||
Exterran Holdings, Inc. (a) | 42 | 1,215 | ||||||
ION Geophysical Corp. (a) | 158 | 1,010 | ||||||
Key Energy Services, Inc. (a) | 389 | 2,521 | ||||||
Lufkin Industries, Inc. | 124 | 10,944 | ||||||
Parker Drilling Co. (a) | 1,676 | 7,475 | ||||||
PHI, Inc. (a) | 87 | 3,047 | ||||||
SEACOR Holdings, Inc. | 20 | 1,536 | ||||||
Tesco Corp. (a) | 425 | 5,423 | ||||||
Unit Corp. (a) | 178 | 8,040 | ||||||
USA Compression Partners LP | 1,222 | 27,116 | ||||||
Willbros Group, Inc. (a) | 710 | 4,778 | ||||||
|
| |||||||
| 85,171 | ||||||||
See Notes to Financial Statements.
| 10 | ANNUAL REPORT | MAY 31, 2013 |
Table of Contents
| Schedule of Investments (continued) | BlackRock Disciplined Small Cap Core Fund | |||
| (Percentages shown are based on Net Assets) |
| Common Stocks | Shares | Value | ||||||
Food & Staples Retailing — 1.1% | ||||||||
Nash Finch Co. | 1,238 | $ | 26,902 | |||||
The Pantry, Inc. (a) | 1,567 | 19,603 | ||||||
Rite Aid Corp. (a) | 1,100 | 3,234 | ||||||
Roundy’s, Inc. | 936 | 7,104 | ||||||
United Natural Foods, Inc. (a) | 25 | 1,323 | ||||||
|
| |||||||
| 58,166 | ||||||||
Food Products — 1.8% | ||||||||
Darling International, Inc. (a) | 117 | 2,294 | ||||||
John B. Sanfilippo & Son, Inc. | 196 | 3,797 | ||||||
Omega Protein Corp. (a) | 2,155 | 23,533 | ||||||
Pilgrim’s Pride Corp. (a) | 203 | 2,428 | ||||||
Sanderson Farms, Inc. | 499 | 34,391 | ||||||
Seaboard Corp. | 10 | 27,553 | ||||||
|
| |||||||
| 93,996 | ||||||||
Gas Utilities — 1.1% | ||||||||
Southwest Gas Corp. | 1,194 | 56,536 | ||||||
Health Care Equipment & Supplies — 3.4% | ||||||||
Alere, Inc. (a) | 107 | 2,737 | ||||||
Conceptus, Inc. (a) | 116 | 3,594 | ||||||
Cutera, Inc. (a) | 1,191 | 11,207 | ||||||
Cyberonics, Inc. (a) | 267 | 12,739 | ||||||
Cynosure, Inc., Class A (a) | 134 | 3,338 | ||||||
Invacare Corp. | 1,177 | 18,243 | ||||||
Medical Action Industries, Inc. (a) | 1,344 | 11,290 | ||||||
Natus Medical, Inc. (a) | 78 | 1,099 | ||||||
Orthofix International NV (a) | 441 | 12,189 | ||||||
RTI Biologics, Inc. (a) | 2,439 | 9,878 | ||||||
Solta Medical, Inc. (a) | 1,385 | 2,978 | ||||||
SurModics, Inc. (a) | 1,039 | 24,666 | ||||||
Symmetry Medical, Inc. (a) | 1,579 | 14,732 | ||||||
Thoratec Corp. (a) | 1,526 | 47,565 | ||||||
|
| |||||||
| 176,255 | ||||||||
Health Care Providers & Services — 1.5% | ||||||||
Air Methods Corp. | 78 | 2,920 | ||||||
AMN Healthcare Services, Inc. (a) | 357 | 4,780 | ||||||
Cross Country Healthcare, Inc. (a) | 1,320 | 6,877 | ||||||
Health Net, Inc. (a) | 508 | 16,190 | ||||||
The Providence Service Corp. (a) | 657 | 17,319 | ||||||
Select Medical Holdings Corp. | 197 | 1,556 | ||||||
Team Health Holdings, Inc. (a) | 131 | 5,118 | ||||||
VCA Antech, Inc. (a) | 843 | 21,547 | ||||||
|
| |||||||
| 76,307 | ||||||||
Health Care Technology — 0.9% | ||||||||
HealthStream, Inc. (a) | 437 | 11,703 | ||||||
MedAssets, Inc. (a) | 352 | 5,773 | ||||||
Omnicell, Inc. (a) | 1,624 | 29,443 | ||||||
|
| |||||||
| 46,919 | ||||||||
Hotels, Restaurants & Leisure — 3.1% | ||||||||
AFC Enterprises, Inc. (a) | 1,040 | 37,918 | ||||||
Ameristar Casinos, Inc. | 121 | 3,170 | ||||||
Bravo Brio Restaurant Group, Inc. (a) | 193 | 3,474 | ||||||
CEC Entertainment, Inc. | 66 | 2,643 | ||||||
Domino’s Pizza, Inc. | 311 | 18,433 | ||||||
Einstein Noah Restaurant Group, Inc. | 1,017 | 14,238 | ||||||
Jack in the Box, Inc. (a) | 252 | 9,195 | ||||||
Orient-Express Hotels Ltd., Class A (a) | 1,024 | 12,124 | ||||||
Red Lion Hotels Corp. (a) | 127 | 790 | ||||||
Ruth’s Hospitality Group, Inc. | 472 | 5,286 | ||||||
Six Flags Entertainment Corp. | 405 | 30,201 | ||||||
Speedway Motorsports, Inc. | 928 | 16,862 | ||||||
| Common Stocks | Shares | Value | ||||||
Hotels, Restaurants & Leisure (continued) | ||||||||
Vail Resorts, Inc. | 140 | $ | 8,967 | |||||
|
| |||||||
| 163,301 | ||||||||
Household Durables — 1.0% | ||||||||
American Greetings Corp., Class A | 116 | 2,134 | ||||||
Blyth, Inc. | 129 | 1,807 | ||||||
M/I Homes, Inc. (a) | 50 | 1,243 | ||||||
MDC Holdings, Inc. | 373 | 13,842 | ||||||
NACCO Industries, Inc., Class A | 33 | 1,849 | ||||||
Taylor Morrison Home Corp., Class A (a) | 176 | 4,546 | ||||||
TRI Pointe Homes, Inc. (a) | 875 | 14,735 | ||||||
Universal Electronics, Inc. (a) | 169 | 4,512 | ||||||
Zagg, Inc. (a) | 1,347 | 6,802 | ||||||
|
| |||||||
| 51,470 | ||||||||
Household Products — 0.4% | ||||||||
Central Garden and Pet Co. (a) | 195 | 1,515 | ||||||
Central Garden and Pet Co., Class A (a) | 134 | 1,017 | ||||||
Harbinger Group, Inc. (a) | 2,189 | 18,869 | ||||||
|
| |||||||
| 21,401 | ||||||||
Independent Power Producers & Energy Traders — 0.1% |
| |||||||
Genie Energy Ltd., Class B | 334 | 2,869 | ||||||
Insurance — 1.3% | ||||||||
eHealth, Inc. (a) | 484 | 11,916 | ||||||
First American Financial Corp. | 509 | 12,155 | ||||||
Fortegra Financial Corp. (a) | 154 | 1,126 | ||||||
Horace Mann Educators Corp. | 415 | 10,085 | ||||||
Montpelier Re Holdings Ltd. | 794 | 19,842 | ||||||
National Western Life Insurance Co., Class A | 10 | 1,960 | ||||||
OneBeacon Insurance Group Ltd., Class A | 585 | 8,319 | ||||||
Universal Insurance Holdings, Inc. | 218 | 1,454 | ||||||
|
| |||||||
| 66,857 | ||||||||
Internet & Catalog Retail — 0.7% | ||||||||
Blue Nile, Inc. (a) | 106 | 3,769 | ||||||
Orbitz Worldwide, Inc. (a) | 214 | 1,616 | ||||||
Overstock.com, Inc. (a) | 23 | 596 | ||||||
PetMed Express, Inc. | 2,233 | 29,900 | ||||||
Valuevision Media, Inc., Class A (a) | 604 | 3,050 | ||||||
|
| |||||||
| 38,931 | ||||||||
Internet Software & Services — 2.7% | ||||||||
AOL, Inc. | 122 | 4,229 | ||||||
Bankrate, Inc. (a) | 2,129 | 30,466 | ||||||
EarthLink, Inc. | 2,352 | 13,947 | ||||||
IntraLinks Holdings, Inc. (a) | 1,226 | 7,528 | ||||||
j2 Global, Inc. | 423 | 17,296 | ||||||
LogMeIn, Inc. (a) | 17 | 433 | ||||||
Market Leader, Inc. (a) | 85 | 909 | ||||||
MeetMe, Inc. (a) | 696 | 1,044 | ||||||
Millennial Media, Inc. (a) | 395 | 3,117 | ||||||
OpenTable, Inc. (a) | 81 | 5,403 | ||||||
Responsys, Inc. (a) | 139 | 1,359 | ||||||
Synacor, Inc. (a) | 375 | 1,414 | ||||||
Travelzoo, Inc. (a) | 1,083 | 31,125 | ||||||
United Online, Inc. | 2,896 | 19,722 | ||||||
ValueClick, Inc. (a) | 134 | 3,530 | ||||||
|
| |||||||
| 141,522 | ||||||||
IT Services — 2.1% | ||||||||
Cardtronics, Inc. (a) | 46 | 1,312 | ||||||
CoreLogic, Inc. (a) | 40 | 1,048 | ||||||
Euronet Worldwide, Inc. (a) | 284 | 8,662 | ||||||
Global Cash Access Holdings, Inc. (a) | 2,974 | 19,628 | ||||||
MAXIMUS, Inc. | 259 | 19,329 | ||||||
Syntel, Inc. | 857 | 54,771 | ||||||
See Notes to Financial Statements.
| ANNUAL REPORT | MAY 31, 2013 | 11 |
Table of Contents
| Schedule of Investments (continued) | BlackRock Disciplined Small Cap Core Fund | |||
| (Percentages shown are based on Net Assets) |
| Common Stocks | Shares | Value | ||||||
IT Services (continued) | ||||||||
Unisys Corp. (a) | 146 | $ | 3,015 | |||||
|
| |||||||
| 107,765 | ||||||||
Leisure Equipment & Products — 0.0% | ||||||||
Johnson Outdoors, Inc., Class A (a) | 82 | 2,030 | ||||||
Life Sciences Tools & Services — 0.7% | ||||||||
Albany Molecular Research, Inc. (a) | 569 | 6,259 | ||||||
Harvard Bioscience, Inc. (a) | 1,700 | 8,636 | ||||||
PAREXEL International Corp. (a) | 527 | 24,079 | ||||||
|
| |||||||
| 38,974 | ||||||||
Machinery — 2.7% | ||||||||
Ampco-Pittsburgh Corp. | 168 | 3,084 | ||||||
ESCO Technologies, Inc. | 252 | 8,094 | ||||||
Federal Signal Corp. (a) | 141 | 1,237 | ||||||
Hyster-Yale Materials Handling, Inc. | 127 | 7,849 | ||||||
John Bean Technologies Corp. | 2,029 | 43,826 | ||||||
Kadant, Inc. | 138 | 4,129 | ||||||
Kaydon Corp. | 72 | 1,947 | ||||||
L.B. Foster Co., Class A | 24 | 1,063 | ||||||
Lindsay Corp. | 333 | 27,056 | ||||||
Lydall, Inc. (a) | 385 | 5,567 | ||||||
Middleby Corp. (a) | 116 | 18,965 | ||||||
Mueller Industries, Inc. | 65 | 3,539 | ||||||
RBC Bearings, Inc. (a) | 21 | 1,028 | ||||||
Rexnord Corp. (a) | 311 | 6,201 | ||||||
Tecumseh Products Co., Class A (a) | 100 | 918 | ||||||
Terex Corp. (a) | 103 | 3,695 | ||||||
The Toro Co. | 90 | 4,289 | ||||||
|
| |||||||
| 142,487 | ||||||||
Marine — 0.2% | ||||||||
Matson, Inc. | 337 | 8,482 | ||||||
Media — 2.2% | ||||||||
Arbitron, Inc. | 97 | 4,550 | ||||||
Central European Media Enterprises Ltd., Class A (a) | 709 | 2,368 | ||||||
Crown Media Holdings, Inc., Class A (a) | 1,069 | 2,191 | ||||||
CTC Media, Inc. | 2,434 | 29,062 | ||||||
Digital Generation, Inc. (a) | 494 | 3,453 | ||||||
Entravision Communications Corp., Class A | 1,070 | 4,954 | ||||||
Harte-Hanks, Inc. | 792 | 7,080 | ||||||
John Wiley & Sons, Inc., Class A | 94 | 3,732 | ||||||
Meredith Corp. | 287 | 11,761 | ||||||
National CineMedia, Inc. | 806 | 13,388 | ||||||
Regal Entertainment Group, Class A | 452 | 8,000 | ||||||
Salem Communications Corp., Class A | 352 | 2,626 | ||||||
Starz, Class A (a) | 869 | 20,057 | ||||||
|
| |||||||
| 113,222 | ||||||||
Metals & Mining — 1.3% | ||||||||
Gold Reserve, Inc. (a) | 2,460 | 7,774 | ||||||
Kaiser Aluminum Corp. | 582 | 36,922 | ||||||
Noranda Aluminum Holding Corp. | 2,401 | 9,700 | ||||||
US Silica Holdings, Inc. | 665 | 14,690 | ||||||
|
| |||||||
| 69,086 | ||||||||
Multiline Retail — 0.1% | ||||||||
Big Lots, Inc. (a) | 134 | 4,563 | ||||||
Multi-Utilities — 0.9% | ||||||||
Avista Corp. | 941 | 25,134 | ||||||
Black Hills Corp. | 447 | 21,219 | ||||||
|
| |||||||
| 46,353 | ||||||||
Oil, Gas & Consumable Fuels — 5.0% | ||||||||
Alon USA Energy, Inc. | 750 | 13,733 | ||||||
| Common Stocks | Shares | Value | ||||||
Oil, Gas & Consumable Fuels (continued) | ||||||||
Berry Petroleum Co., Class A | 193 | $ | 8,359 | |||||
Bonanza Creek Energy, Inc. (a) | 1,312 | 48,741 | ||||||
Ceres, Inc. (a) | 429 | 927 | ||||||
Delek US Holdings, Inc. | 196 | 7,062 | ||||||
Diamondback Energy, Inc. (a) | 371 | 12,529 | ||||||
Evolution Petroleum Corp. (a) | 108 | 1,146 | ||||||
Kodiak Oil & Gas Corp. (a) | 1,585 | 13,916 | ||||||
Midstates Petroleum Co., Inc. (a) | 902 | 6,161 | ||||||
Miller Energy Resources, Inc. (a) | 962 | 3,877 | ||||||
Nordic American Tankers Ltd. | 655 | 5,489 | ||||||
Northern Oil and Gas, Inc. (a) | 886 | 11,669 | ||||||
Oasis Petroleum, Inc. (a) | 1,012 | 37,606 | ||||||
REX American Resources Corp. (a) | 559 | 15,607 | ||||||
Stone Energy Corp. (a) | 381 | 8,576 | ||||||
Vaalco Energy, Inc. (a) | 2,282 | 13,966 | ||||||
Warren Resources, Inc. (a) | 5,740 | 16,818 | ||||||
Western Refining, Inc. | 1,107 | 36,941 | ||||||
|
| |||||||
| 263,123 | ||||||||
Paper & Forest Products — 0.8% | ||||||||
Boise Cascade Co. (a) | 461 | 13,858 | ||||||
KapStone Paper and Packaging Corp. | 341 | 9,892 | ||||||
Neenah Paper, Inc. | 610 | 19,160 | ||||||
|
| |||||||
| 42,910 | ||||||||
Personal Products — 0.4% | ||||||||
Medifast, Inc. (a) | 368 | 10,602 | ||||||
Nu Skin Enterprises, Inc., Class A | 62 | 3,646 | ||||||
Prestige Brands Holdings, Inc. (a) | 234 | 6,877 | ||||||
|
| |||||||
| 21,125 | ||||||||
Pharmaceuticals — 2.0% | ||||||||
Cumberland Pharmaceuticals, Inc. (a) | 2,336 | 11,330 | ||||||
Lannett Co., Inc. (a) | 798 | 9,153 | ||||||
The Medicines Co. (a) | 1,467 | 47,252 | ||||||
Pain Therapeutics, Inc. | 1,644 | 4,389 | ||||||
Questcor Pharmaceuticals, Inc. | 198 | 6,766 | ||||||
Santarus, Inc. (a) | 802 | 17,861 | ||||||
Sciclone Pharmaceuticals, Inc. (a) | 1,836 | 8,831 | ||||||
|
| |||||||
| 105,582 | ||||||||
Professional Services — 1.2% | ||||||||
CRA International, Inc. (a) | 305 | 5,463 | ||||||
The Dolan Co. (a) | 1,767 | 2,633 | ||||||
Kforce, Inc. | 866 | 12,895 | ||||||
Resources Connection, Inc. | 594 | 6,510 | ||||||
RPX Corp. (a) | 1,415 | 21,706 | ||||||
WageWorks, Inc. (a) | 392 | 11,356 | ||||||
|
| |||||||
| 60,563 | ||||||||
Real Estate Investment Trusts (REITs) — 7.8% | ||||||||
Agree Realty Corp. | 57 | 1,900 | ||||||
Alexander’s, Inc. | 8 | 2,435 | ||||||
American Assets Trust, Inc. | 101 | 3,252 | ||||||
Apollo Residential Mortgage, Inc. | 942 | 17,955 | ||||||
Arbor Realty Trust, Inc. | 750 | 5,085 | ||||||
Ashford Hospitality Trust, Inc. | 266 | 3,514 | ||||||
Aviv REIT, Inc. | 448 | 11,612 | ||||||
CapLease, Inc. | 326 | 2,810 | ||||||
Cedar Realty Trust, Inc. | 534 | 3,071 | ||||||
Colonial Properties Trust | 94 | 2,078 | ||||||
CommonWealth REIT | 113 | 2,310 | ||||||
Coresite Realty Corp. | 151 | 4,850 | ||||||
Cousins Properties, Inc. | 3,192 | 32,941 | ||||||
DiamondRock Hospitality Co. | 193 | 1,835 | ||||||
EPR Properties | 392 | 20,549 | ||||||
Equity One, Inc. | 395 | 9,215 | ||||||
See Notes to Financial Statements.
| 12 | ANNUAL REPORT | MAY 31, 2013 |
Table of Contents
| Schedule of Investments (continued) | BlackRock Disciplined Small Cap Core Fund | |||
| (Percentages shown are based on Net Assets) |
| Common Stocks | Shares | Value | ||||||
Real Estate Investment Trusts (REITs) (continued) | ||||||||
FelCor Lodging Trust, Inc. (a) | 942 | $ | 5,803 | |||||
The Geo Group, Inc. | 260 | 9,053 | ||||||
Gramercy Property Trust, Inc. (a) | 1,052 | 4,755 | ||||||
Highwoods Properties, Inc. | 874 | 31,831 | ||||||
Inland Real Estate Corp. | 859 | 8,822 | ||||||
Invesco Mortgage Capital, Inc. | 1,579 | 29,448 | ||||||
NorthStar Realty Finance Corp. | 1,381 | 11,642 | ||||||
One Liberty Properties, Inc. | 201 | 5,316 | ||||||
PS Business Parks, Inc. | 581 | 44,336 | ||||||
Resource Capital Corp. | 1,896 | 11,736 | ||||||
RLJ Lodging Trust | 2,543 | 58,896 | ||||||
Ryman Hospitality Properties | 1,229 | 47,022 | ||||||
Sabra Health Care REIT, Inc. | 58 | 1,569 | ||||||
Spirit Realty Capital, Inc. | 326 | 6,543 | ||||||
Sunstone Hotel Investors, Inc. (a) | 394 | 4,752 | ||||||
|
| |||||||
| 406,936 | ||||||||
Real Estate Management & Development — 0.4% | ||||||||
Altisource Residential Corp. (a) | 219 | 3,995 | ||||||
Forestar Group, Inc. (a) | 711 | 16,403 | ||||||
|
| |||||||
| 20,398 | ||||||||
Road & Rail — 1.1% | ||||||||
Old Dominion Freight Line, Inc. (a) | 104 | 4,478 | ||||||
Roadrunner Transportation Systems, Inc. (a) | 41 | 1,136 | ||||||
Ryder System, Inc. | 812 | 51,188 | ||||||
Swift Transportation Co. (a) | 153 | 2,577 | ||||||
|
| |||||||
| 59,379 | ||||||||
Semiconductors & Semiconductor Equipment — 3.4% | ||||||||
Advanced Energy Industries, Inc. (a) | 237 | 4,361 | ||||||
Alpha & Omega Semiconductor Ltd. (a) | 137 | 1,081 | ||||||
Ambarella, Inc. (a) | 432 | 6,985 | ||||||
Amkor Technology, Inc. (a) | 6,065 | 27,535 | ||||||
ASML Holding NV | 131 | 10,656 | ||||||
Cavium, Inc. (a) | 250 | 8,190 | ||||||
Cirrus Logic, Inc. (a) | 269 | 4,909 | ||||||
First Solar, Inc. (a) | 240 | 13,051 | ||||||
Inphi Corp. (a) | 262 | 2,675 | ||||||
Integrated Silicon Solution, Inc. (a) | 131 | 1,417 | ||||||
Intermolecular, Inc. (a) | 123 | 1,050 | ||||||
Intersil Corp., Class A | 581 | 4,764 | ||||||
IXYS Corp. | 126 | 1,436 | ||||||
Kulicke & Soffa Industries, Inc. (a) | 3,045 | 37,758 | ||||||
Magnachip Semiconductor Corp. (a) | 1,653 | 30,581 | ||||||
Micrel, Inc. | 110 | 1,095 | ||||||
Pericom Semiconductor Corp. (a) | 137 | 960 | ||||||
Photronics, Inc. (a) | 280 | 2,136 | ||||||
Spansion, Inc., Class A (a) | 963 | 13,193 | ||||||
STR Holdings, Inc. (a) | 610 | 1,842 | ||||||
Ultra Clean Holdings (a) | 179 | 1,040 | ||||||
Volterra Semiconductor Corp. (a) | 230 | 3,234 | ||||||
|
| |||||||
| 179,949 | ||||||||
Software — 3.8% | ||||||||
Aspen Technology, Inc. (a) | 2,044 | 62,587 | ||||||
AVG Technologies NV (a) | 539 | 9,826 | ||||||
CommVault Systems, Inc. (a) | 236 | 16,520 | ||||||
Digimarc Corp. | 238 | 5,476 | ||||||
Ebix, Inc. | 104 | 2,063 | ||||||
Fleetmatics Group Plc (a) | 46 | 1,369 | ||||||
Manhattan Associates, Inc. (a) | 45 | 3,376 | ||||||
Mentor Graphics Corp. | 161 | 3,057 | ||||||
Model N, Inc. (a) | 63 | 1,273 | ||||||
Netscout Systems, Inc. (a) | 438 | 10,665 | ||||||
Progress Software Corp. (a) | 148 | 3,479 | ||||||
PTC, Inc. (a) | 1,350 | 33,899 | ||||||
| Common Stocks | Shares | Value | ||||||
Software (continued) | ||||||||
Rovi Corp. (a) | 383 | $ | 9,881 | |||||
Sapiens International Corp. NV | 445 | 2,305 | ||||||
Take-Two Interactive Software, Inc. (a) | 905 | 15,059 | ||||||
Telenav, Inc. (a) | 2,181 | 11,101 | ||||||
Verint Systems, Inc. (a) | 45 | 1,511 | ||||||
Websense, Inc. (a) | 137 | 3,404 | ||||||
|
| |||||||
| 196,851 | ||||||||
Specialty Retail — 4.4% | ||||||||
Aaron’s, Inc. (a) | 172 | 4,831 | ||||||
ANN, Inc. (a) | 1,307 | 40,099 | ||||||
Asbury Automotive Group, Inc. (a) | 128 | 5,274 | ||||||
Big 5 Sporting Goods Corp. | 847 | 16,948 | ||||||
The Buckle, Inc. | 478 | 25,563 | ||||||
Cabela’s, Inc. (a) | 68 | 4,560 | ||||||
Chico’s FAS, Inc. | 1,169 | 21,112 | ||||||
The Children’s Place Retail Stores, Inc. (a) | 103 | 5,493 | ||||||
Express, Inc. (a) | 466 | 10,159 | ||||||
Francesca’s Holdings Corp. (a) | 93 | 2,655 | ||||||
Haverty Furniture Cos, Inc. | 43 | 1,059 | ||||||
Hot Topic, Inc. | 155 | 2,168 | ||||||
Kirkland’s, Inc. (a) | 553 | 8,273 | ||||||
Lumber Liquidators Holdings, Inc. (a) | 260 | 21,349 | ||||||
Penske Automotive Group, Inc. | 125 | 4,014 | ||||||
rue21, inc. (a) | 57 | 2,393 | ||||||
Sears Hometown and Outlet Stores, Inc. (a) | 727 | 40,436 | ||||||
Tile Shop Holdings, Inc. (a) | 97 | 2,483 | ||||||
The Wet Seal, Inc., Class A (a) | 1,895 | 9,399 | ||||||
|
| |||||||
| 228,268 | ||||||||
Textiles, Apparel & Luxury Goods — 1.2% | ||||||||
Cherokee, Inc. | 39 | 527 | ||||||
Culp, Inc. | 227 | 3,916 | ||||||
Deckers Outdoor Corp. (a) | 29 | 1,557 | ||||||
Delta Apparel, Inc. (a) | 337 | 4,947 | ||||||
G-III Apparel Group Ltd. (a) | 24 | 1,011 | ||||||
Movado Group, Inc. | 942 | 34,006 | ||||||
Perry Ellis International, Inc. | 154 | 3,251 | ||||||
Skechers U.S.A., Inc., Class A (a) | 523 | 11,767 | ||||||
Unifi, Inc. (a) | 219 | 4,113 | ||||||
|
| |||||||
| 65,095 | ||||||||
Thrifts & Mortgage Finance — 2.8% | ||||||||
EverBank Financial Corp. | 2,198 | 34,509 | ||||||
Flagstar Bancorp, Inc. (a) | 210 | 2,942 | ||||||
HomeStreet, Inc. | 910 | 20,803 | ||||||
Meta Financial Group, Inc. | 707 | 19,018 | ||||||
MGIC Investment Corp. (a) | 338 | 2,089 | ||||||
Nationstar Mortgage Holdings, Inc. (a) | 116 | 4,722 | ||||||
Ocwen Financial Corp. (a) | 1,226 | 52,448 | ||||||
Provident Financial Holdings, Inc. | 435 | 6,621 | ||||||
Radian Group, Inc. | 262 | 3,372 | ||||||
|
| |||||||
| 146,524 | ||||||||
Trading Companies & Distributors — 0.7% | ||||||||
Aircastle Ltd. | 1,757 | 27,796 | ||||||
Edgen Group, Inc. (a) | 440 | 2,900 | ||||||
Lawson Products, Inc. | 140 | 2,086 | ||||||
Willis Lease Finance Corp. (a) | 253 | 3,352 | ||||||
|
| |||||||
| 36,134 | ||||||||
See Notes to Financial Statements.
| ANNUAL REPORT | MAY 31, 2013 | 13 |
Table of Contents
| Schedule of Investments (continued) | BlackRock Disciplined Small Cap Core Fund | |||
| (Percentages shown are based on Net Assets) |
| Common Stocks | Shares | Value | ||||||
Water Utilities — 0.1% | ||||||||
American States Water Co. | 87 | $ | 4,622 | |||||
Wireless Telecommunication Services — 0.5% | ||||||||
NTELOS Holdings Corp. | 752 | 12,310 | ||||||
Telephone & Data Systems, Inc. | 511 | 11,881 | ||||||
|
| |||||||
| 24,191 | ||||||||
Total Long-Term Investments (Cost — $4,987,010) — 98.0% |
| 5,116,115 | ||||||
| Short-Term Securities | Shares | Value | ||||||
BlackRock Liquidity Funds, TempFund, Institutional Class, 0.06% (b)(c) | 103,573 | $ | 103,573 | |||||
Total Short-Term Securities (Cost — $103,573) — 2.0% |
| 103,573 | ||||||
Total Investments (Cost — $5,090,583) — 100.0% | 5,219,688 | |||||||
Other Assets Less Liabilities — 0.0% | 2,402 | |||||||
|
| |||||||
Net Assets — 100.0% | $ | 5,222,090 | ||||||
|
| |||||||
| Notes to Schedule of Investments |
| (a) | Non-income producing security. |
| (b) | Investments in issuers considered to be an affiliate of the Fund during the period ended May 31, 2013, for purposes of Section 2(a)(3) of the Investment Company Act of 1940, as amended, were as follows: |
| Affiliate | Net Activity | Shares Held at May 31, 2013 | ||||||
BlackRock Liquidity Funds, TempFund, Institutional Class | 103,573 | 103,573 | ||||||
| (c) | Represents the current yield as of report date. |
| Ÿ | For Fund compliance purposes, the Fund’s industry classifications refer to any one or more of the industry sub-classifications used by one or more widely recognized market indexes or ratings group indexes, and/or as defined by Fund management. These definitions may not apply for purposes of this report, which may combine such industry sub-classifications for reporting ease. |
| Ÿ | Financial futures contracts as of May 31, 2013 were as follows: |
| Contracts Purchased | Issue | Exchange | Expiration | Notional Value | Unrealized Depreciation | |||||||||||
| 1 | E-Mini Russell 2000 Futures | New York | June 2013 | $ | 98,310 | $ | (1,172 | ) | ||||||||
| Ÿ | Fair Value Measurements — Various inputs are used in determining the fair value of investments and derivative financial instruments. These inputs to valuation techniques are categorized into a disclosure hierarchy consisting of three broad levels for financial statement purposes as follows: |
| Ÿ | Level 1 — unadjusted price quotations in active markets/exchanges for identical assets or liabilities that the Fund has the ability to access |
| Ÿ | Level 2 — other observable inputs (including, but not limited to, quoted prices for similar assets or liabilities in markets that are active, quoted prices for identical or similar assets or liabilities in markets that are not active, inputs other than quoted prices that are observable for the assets or liabilities (such as interest rates, yield curves, volatilities, prepayment speeds, loss severities, credit risks and default rates) or other market–corroborated inputs) |
| Ÿ | Level 3 — unobservable inputs based on the best information available in the circumstances, to the extent observable inputs are not available (including the Fund’s own assumptions used in determining the fair value of investments and derivative financial instruments) |
The hierarchy gives the highest priority to unadjusted quoted prices in active markets for identical assets or liabilities (Level 1 measurements) and the lowest priority to unobservable inputs (Level 3 measurements). Accordingly, the degree of judgment exercised in determining fair value is greatest for instruments categorized in Level 3. The inputs used to measure fair value may fall into different levels of the fair value hierarchy. In such cases, for disclosure purposes, the fair value hierarchy classification is determined based on the lowest level input that is significant to the fair value measurement in its entirety.
Changes in valuation techniques may result in transfers into or out of an assigned level within the disclosure hierarchy. In accordance with the Fund’s policy, transfers between different levels of the fair value disclosure hierarchy are deemed to have occurred as of the beginning of the reporting period. The categorization of a value determined for investments and derivative financial instruments is based on the pricing transparency of the investment and derivative financial instrument and is not necessarily an indication of the risks associated with investing in those securities. For information about the Fund’s policy regarding valuation of investments and derivative financial instruments, please refer to Note 1 of the Notes to Financial Statements.
The following tables summarize the Fund’s investments and derivative financial instruments categorized in the disclosure hierarchy as of May 31, 2013:
| Level 1 | Level 2 | Level 3 | Total | |||||||||||||
Assets: | ||||||||||||||||
Investments: | ||||||||||||||||
Long-Term Investments1 | $ | 5,116,115 | — | — | $ | 5,116,115 | ||||||||||
Short-Term Securities | 103,573 | — | — | 103,573 | ||||||||||||
Total | $ | 5,219,688 | — | — | $ | 5,219,688 | ||||||||||
|
| |||||||||||||||
| 1 | See above Schedule of Investments for values in each industry. |
See Notes to Financial Statements.
| 14 | ANNUAL REPORT | MAY 31, 2013 |
Table of Contents
| Schedule of Investments (concluded) | BlackRock Disciplined Small Cap Core Fund |
| Level 1 | Level 2 | Level 3 | Total | |||||||||||||
Derivative Financial Instruments2 | ||||||||||||||||
Liabilities: | ||||||||||||||||
Equity contracts | $ | (1,172 | ) | — | — | $ | (1,172 | ) | ||||||||
| 2 | Derivative financial instruments are financial futures contracts which are valued at the unrealized appreciation/depreciation on the instrument. |
Certain of the Fund’s assets are held at carrying amount, which approximates fair value for financial statement purposes. As of May 31, 2013, such assets are categorized within the disclosure hierarchy as follows:
| Level 1 | Level 2 | Level 3 | Total | |||||||||||||
Assets: | ||||||||||||||||
Cash | $ | 3,300 | — | — | $ | 3,300 | ||||||||||
Cash pledged for financial futures contracts | 6,000 | — | — | 6,000 | ||||||||||||
Total | $ | 9,300 | — | — | $ | 9,300 | ||||||||||
|
| |||||||||||||||
See Notes to Financial Statements.
| ANNUAL REPORT | MAY 31, 2013 | 15 |
Table of Contents
| Statements of Assets and Liabilities |
| May 31, 2013 | BlackRock Disciplined Small Cap Core Fund | BlackRock Small Cap Growth Fund II | ||||||
| Assets | ||||||||
Investments at value — unaffiliated (cost — $4,987,010) | $ | 5,116,115 | — | |||||
Investments at value — affiliated (cost — $103,573) | 103,573 | — | ||||||
Investments at value — Master Portfolio (cost — $194,471,427) | — | $ | 216,189,110 | |||||
Cash | 3,300 | — | ||||||
Cash pledged for financial futures contracts | 6,000 | — | ||||||
Withdrawals receivable from the Master Portfolio | — | 401,030 | ||||||
Investments sold receivable | 139,693 | — | ||||||
Capital shares sold receivable | — | 359,624 | ||||||
Deferred offering costs | 113,617 | — | ||||||
Receivable from Manager | 26,716 | — | ||||||
Dividends receivable | 5,743 | — | ||||||
Prepaid expenses | 3,500 | 22,989 | ||||||
|
| |||||||
Total assets | 5,518,257 | 216,972,753 | ||||||
|
| |||||||
| Liabilities | ||||||||
Variation margin payable | 990 | — | ||||||
Investments purchased payable | 157,100 | — | ||||||
Capital shares redeemed payable | — | 760,654 | ||||||
Offering costs payable | 96,237 | — | ||||||
Professional fees payable | 37,314 | 28,578 | ||||||
Officer’s and Trustees’ fees payable | 326 | 85 | ||||||
Transfer agent fees payable | 70 | 126,330 | ||||||
Service and distribution fees payable | 21 | 67,695 | ||||||
Administration fees payable | 16 | 36,569 | ||||||
Other affiliates payable | — | 3,830 | ||||||
Other accrued expenses payable | 4,093 | 34,207 | ||||||
|
| |||||||
Total liabilities | 296,167 | 1,057,948 | ||||||
|
| |||||||
Net Assets | $ | 5,222,090 | $ | 215,914,805 | ||||
|
| |||||||
| Net Assets Consist of | ||||||||
Paid-in capital | $ | 5,032,497 | $ | 164,498,566 | ||||
Undistributed net investment income | 12,412 | 7,396 | ||||||
Accumulated net realized gain | 49,248 | — | ||||||
Accumulated net realized gain allocated from the Master Portfolio | — | 29,691,160 | ||||||
Net unrealized appreciation/depreciation | 127,933 | — | ||||||
Net unrealized appreciation/depreciation allocated from the Master Portfolio | — | 21,717,683 | ||||||
|
| |||||||
Net Assets | $ | 5,222,090 | $ | 215,914,805 | ||||
|
| |||||||
See Notes to Financial Statements.
| 16 | ANNUAL REPORT | MAY 31, 2013 |
Table of Contents
| Statements of Assets and Liabilities (concluded) |
| May 31, 2013 | BlackRock Disciplined Small Cap Core Fund | BlackRock Small Cap Growth Fund II | ||||||
| Net Asset Value | ||||||||
Institutional | ||||||||
Net assets | $ | 5,180,661 | $ | 65,185,569 | ||||
|
| |||||||
Shares outstanding | 499,520 | 1 | 4,287,766 | 2 | ||||
|
| |||||||
Net asset value | $ | 10.37 | $ | 15.20 | ||||
|
| |||||||
Investor A | ||||||||
Net assets | $ | 20,731 | $ | 73,798,687 | ||||
|
| |||||||
Shares outstanding | 2,000 | 1 | 5,043,912 | 2 | ||||
|
| |||||||
Net asset value | $ | 10.37 | $ | 14.63 | ||||
|
| |||||||
Investor B | ||||||||
Net assets | — | $ | 2,349,540 | |||||
|
| |||||||
Shares outstanding | — | 183,649 | 2 | |||||
|
| |||||||
Net asset value | — | $ | 12.79 | |||||
|
| |||||||
Investor C | ||||||||
Net assets | $ | 20,698 | $ | 43,649,250 | ||||
|
| |||||||
Shares outstanding | 2,000 | 1 | 3,412,528 | 2 | ||||
|
| |||||||
Net asset value | $ | 10.35 | $ | 12.79 | ||||
|
| |||||||
Class R | ||||||||
Net assets | — | $ | 30,931,759 | |||||
|
| |||||||
Shares outstanding | — | 2,240,722 | 2 | |||||
|
| |||||||
Net asset value | — | $ | 13.80 | |||||
|
| |||||||
| 1 | Unlimited number of shares authorized, $0.001 par value. |
| 2 | 100 million shares authorized, $0.0001 par value. |
See Notes to Financial Statements.
| ANNUAL REPORT | MAY 31, 2013 | 17 |
Table of Contents
| Statements of Operations |
| Year Ended May 31, 2013 | BlackRock Disciplined Small Cap Core Fund1 | BlackRock Small Cap Growth Fund II | ||||||
| Investment Income | ||||||||
Dividends — unaffiliated | $ | 17,491 | — | |||||
Net investment income allocated from the Master Portfolio: | ||||||||
Dividends — unaffiliated | — | $ | 2,538,704 | |||||
Foreign taxes withheld | — | (1,006 | ) | |||||
Securities lending — affiliated — net | — | 129,925 | ||||||
Dividends — affiliated | — | 3,302 | ||||||
Expenses | — | (1,697,860 | ) | |||||
Fees waived | — | 31,439 | ||||||
|
| |||||||
Total income | 17,491 | 1,004,504 | ||||||
|
| |||||||
| Expenses | ||||||||
Organization and offering | 43,756 | — | ||||||
Professional | 37,314 | 90,254 | ||||||
Investment advisory | 4,840 | — | ||||||
Printing | 2,589 | 39,444 | ||||||
Officer and Trustees | 1,483 | 168 | ||||||
Administration | 807 | 431,110 | ||||||
Custodian | 522 | — | ||||||
Administration — class specific | 269 | — | ||||||
Transfer agent — class specific | 70 | 628,472 | ||||||
Service and distribution — class specific | 54 | 817,699 | ||||||
Registration | — | 70,930 | ||||||
Miscellaneous | 2,430 | 12,804 | ||||||
|
| |||||||
Total expenses | 94,134 | 2,090,881 | ||||||
Less fees waived and/or reimbursed by Manager | (85,471 | ) | — | |||||
Less administration fees waived | (807 | ) | — | |||||
Less administration fees waived — class specific | (227 | ) | — | |||||
Less transfer agent fees reimbursed — class specific | (47 | ) | — | |||||
|
| |||||||
Total expenses after fees waived and/or reimbursed | 7,582 | 2,090,881 | ||||||
|
| |||||||
Net investment income (loss) | 9,909 | (1,086,377 | ) | |||||
|
| |||||||
| Realized and Unrealized Gain (Loss) | ||||||||
Net realized gain from: | ||||||||
Investments | 45,192 | — | ||||||
Financial futures contracts | 4,056 | — | ||||||
Investments, financial futures contracts and options written allocated from the Master Portfolio | — | 44,216,706 | ||||||
|
| |||||||
| 49,248 | 44,216,706 | |||||||
|
| |||||||
Net change in unrealized appreciation/depreciation on: | ||||||||
Investments | 129,105 | — | ||||||
Financial futures contracts | (1,172 | ) | — | |||||
Investments and financial futures contracts allocated from the Master Portfolio | — | 14,359,572 | ||||||
|
| |||||||
| 127,933 | 14,359,572 | |||||||
|
| |||||||
Total realized and unrealized gain | 177,181 | 58,576,278 | ||||||
|
| |||||||
Net Increase in Net Assets Resulting from Operations | $ | 187,090 | $ | 57,489,901 | ||||
|
| |||||||
| 1 | For the period March 14, 2013 (commencement of operations) to May 31, 2013. |
See Notes to Financial Statements.
| 18 | ANNUAL REPORT | MAY 31, 2013 |
Table of Contents
| Statements of Changes in Net Assets |
| BlackRock Disciplined Small Cap Core Fund | BlackRock Small Cap Growth Fund II | |||||||||||
Period March 14, 20131 to May 31, 2013 | Year Ended May 31, | |||||||||||
| Increase (Decrease) in Net Assets: | 2013 | 2012 | ||||||||||
| Operations | ||||||||||||
Net investment income (loss) | $ | 9,909 | $ | (1,086,377 | ) | $ | (4,376,560 | ) | ||||
Net realized gain | 49,248 | 44,216,706 | 39,699,962 | |||||||||
Net change in unrealized appreciation/depreciation | 127,933 | 14,359,572 | (86,177,287 | ) | ||||||||
|
|
|
| |||||||||
Net increase (decrease) in net assets resulting from operations | 187,090 | 57,489,901 | (50,853,885 | ) | ||||||||
|
|
|
| |||||||||
| Distributions to Shareholders From2 | ||||||||||||
Net realized gain: | ||||||||||||
Institutional | — | (7,407,847 | ) | (2,917,094 | ) | |||||||
Investor A | — | (9,704,026 | ) | (3,971,680 | ) | |||||||
Investor B | — | (570,485 | ) | (172,651 | ) | |||||||
Investor C | — | (5,761,986 | ) | (1,273,905 | ) | |||||||
Class R | — | (4,912,014 | ) | (1,150,443 | ) | |||||||
|
|
|
| |||||||||
Decrease in net assets resulting from distributions to shareholders | — | (28,356,358 | ) | (9,485,773 | ) | |||||||
|
|
|
| |||||||||
| Capital Share Transactions | ||||||||||||
Net increase (decrease) in net assets derived from capital share transactions | 5,035,000 | (29,711,591 | ) | (226,996,043 | ) | |||||||
|
|
|
| |||||||||
| Net Assets | ||||||||||||
Total increase (decrease) in net assets | 5,222,090 | (578,048 | ) | (287,335,701 | ) | |||||||
Beginning of period | — | 216,492,853 | 503,828,554 | |||||||||
|
|
|
| |||||||||
End of period | $ | 5,222,090 | $ | 215,914,805 | $ | 216,492,853 | ||||||
|
|
|
| |||||||||
Undistributed net investment income/accumulated net investment loss | $ | 12,412 | $ | 7,396 | $ | (486,332 | ) | |||||
|
|
|
| |||||||||
| 1 | Commencement of operations. |
| 2 | Distributions are determined in accordance with federal income tax regulations. |
See Notes to Financial Statements.
| ANNUAL REPORT | MAY 31, 2013 | 19 |
Table of Contents
| Financial Highlights | BlackRock Disciplined Small Cap Core Fund |
| Period March 14, 20131 to May 31, 2013 | ||||||||||||
| Institutional | Investor A | Investor C | ||||||||||
| Per Share Operating Performance | ||||||||||||
Net asset value, beginning of period | $ | 10.00 | $ | 10.00 | $ | 10.00 | ||||||
|
| |||||||||||
Net investment income (loss)2 | 0.02 | 0.01 | (0.00 | )3 | ||||||||
Net realized and unrealized gain | 0.35 | 0.36 | 0.35 | |||||||||
|
| |||||||||||
Net increase from investment operations | 0.37 | 0.37 | 0.35 | |||||||||
|
| |||||||||||
Net asset value, end of period | $ | 10.37 | $ | 10.37 | $ | 10.35 | ||||||
|
| |||||||||||
| Total Investment Return4,5 | ||||||||||||
Based on net asset value | 3.70 | % | 3.70 | % | 3.50 | % | ||||||
|
| |||||||||||
| Ratios to Average Net Assets6 | ||||||||||||
Total expenses7 | 7.68 | % | 8.16 | % | 8.91 | % | ||||||
|
| |||||||||||
Total expenses after fees waived and/or reimbursed | 0.70 | % | 0.95 | % | 1.70 | % | ||||||
|
| |||||||||||
Net investment income (loss) | 0.93 | % | 0.67 | % | (0.08 | )% | ||||||
|
| |||||||||||
| Supplemental Data | ||||||||||||
Net assets, end of period (000) | $ | 5,181 | $ | 21 | $ | 21 | ||||||
|
| |||||||||||
Portfolio turnover | 67 | % | 67 | % | 67 | % | ||||||
|
| |||||||||||
| 1 | Commencement of operations. |
| 2 | Based on average shares outstanding. |
| 3 | Amount is greater than $(0.005) per share. |
| 4 | Where applicable, total investment returns exclude the effects of any sales charges and include the reinvestment of dividends and distributions. |
| 5 | Aggregate total investment return. |
| 6 | Annualized. |
| 7 | Organization costs were not annualized in the calculation of the expense ratios. If these expenses were annualized, the total expenses for Institutional, Investor A and Investor C would have been 8.75%, 9.23% and 9.98%, respectively. |
See Notes to Financial Statements.
| 20 | ANNUAL REPORT | MAY 31, 2013 |
Table of Contents
| Financial Highlights | BlackRock Small Cap Growth Fund II |
| Institutional | ||||||||||||||||||||
| Year Ended May 31, | ||||||||||||||||||||
| 2013 | 2012 | 2011 | 2010 | 2009 | ||||||||||||||||
| Per Share Operating Performance | ||||||||||||||||||||
Net asset value, beginning of year | $ | 13.22 | $ | 15.67 | $ | 11.64 | $ | 9.27 | $ | 14.20 | ||||||||||
|
| |||||||||||||||||||
Net investment loss1 | (0.01 | ) | (0.12 | ) | (0.13 | ) | (0.11 | ) | (0.07 | ) | ||||||||||
Net realized and unrealized gain (loss) | 3.72 | (2.03 | ) | 4.16 | 2 | 2.48 | 2 | (4.86 | )2 | |||||||||||
|
| |||||||||||||||||||
Net increase (decrease) from investment operations | 3.71 | (2.15 | ) | 4.03 | 2.37 | (4.93 | ) | |||||||||||||
|
| |||||||||||||||||||
Distributions from net realized gain3 | (1.73 | ) | (0.30 | ) | — | — | — | |||||||||||||
|
| |||||||||||||||||||
Net asset value, end of year | $ | 15.20 | $ | 13.22 | $ | 15.67 | $ | 11.64 | $ | 9.27 | ||||||||||
|
| |||||||||||||||||||
| Total Investment Return4 | ||||||||||||||||||||
Based on net asset value | 30.95 | % | (13.97 | )% | 34.62 | %5 | 25.57 | %6 | (34.72 | )%5 | ||||||||||
|
| |||||||||||||||||||
| Ratios to Average Net Assets7 | ||||||||||||||||||||
Total expenses | 1.26 | %8 | 1.29 | %9 | 1.24 | %9 | 1.31 | % | 1.35 | % | ||||||||||
|
| |||||||||||||||||||
Net investment loss | (0.04 | )% | (0.84 | )% | (0.99 | )% | (1.03 | )% | (0.69 | )% | ||||||||||
|
| |||||||||||||||||||
| Supplemental Data | ||||||||||||||||||||
Net assets, end of year (000) | $ | 65,186 | $ | 58,673 | $ | 155,169 | $ | 106,530 | $ | 89,346 | ||||||||||
| �� |
|
| ||||||||||||||||||
Portfolio turnover of the Master Portfolio | 165 | % | 143 | % | 127 | % | 114 | % | 75 | % | ||||||||||
|
| |||||||||||||||||||
| Investor A | ||||||||||||||||||||
| Year Ended May 31, | ||||||||||||||||||||
| 2013 | 2012 | 2011 | 2010 | 2009 | ||||||||||||||||
| Per Share Operating Performance | ||||||||||||||||||||
Net asset value, beginning of year | $ | 12.81 | $ | 15.22 | $ | 11.34 | $ | 9.06 | $ | 13.90 | ||||||||||
|
| |||||||||||||||||||
Net investment loss1 | (0.05 | ) | (0.14 | ) | (0.16 | ) | (0.14 | ) | (0.09 | ) | ||||||||||
Net realized and unrealized gain (loss) | 3.57 | (1.97 | ) | 4.04 | 2 | 2.42 | 2 | (4.75 | )2 | |||||||||||
|
| |||||||||||||||||||
Net increase (decrease) from investment operations | 3.52 | (2.11 | ) | 3.88 | 2.28 | (4.84 | ) | |||||||||||||
|
| |||||||||||||||||||
Distributions from net realized gain3 | (1.70 | ) | (0.30 | ) | — | — | — | |||||||||||||
|
| |||||||||||||||||||
Net asset value, end of year | $ | 14.63 | $ | 12.81 | $ | 15.22 | $ | 11.34 | $ | 9.06 | ||||||||||
|
| |||||||||||||||||||
| Total Investment Return4 | ||||||||||||||||||||
Based on net asset value | 30.45 | % | (14.12 | )% | 34.22 | %5 | 25.17 | %6 | (34.82 | )%5 | ||||||||||
|
| |||||||||||||||||||
| Ratios to Average Net Assets7 | ||||||||||||||||||||
Total expenses | 1.62 | %10 | 1.57 | %9 | 1.53 | %9 | 1.57 | % | 1.59 | % | ||||||||||
|
| |||||||||||||||||||
Net investment loss | (0.34 | )% | (1.11 | )% | (1.28 | )% | (1.29 | )% | (0.95 | )% | ||||||||||
|
| |||||||||||||||||||
| Supplemental Data | ||||||||||||||||||||
Net assets, end of year (000) | $ | 73,799 | $ | 75,467 | $ | 219,005 | $ | 184,897 | $ | 161,557 | ||||||||||
|
| |||||||||||||||||||
Portfolio turnover of the Master Portfolio | 165 | % | 143 | % | 127 | % | 114 | % | 75 | % | ||||||||||
|
| |||||||||||||||||||
| 1 | Based on average shares outstanding. |
| 2 | Includes redemption fees, which are less than $0.005 per share. |
| 3 | Distributions are determined in accordance with federal income tax regulations. |
| 4 | Where applicable, total investment returns exclude the effects of any sales charges and include the reinvestment of dividends and distributions. |
| 5 | Total return calculation includes redemption fees received by the Fund. The impact to the return is less than 0.01%. |
| 6 | Total return calculation includes redemption fees received by the Fund. The impact to the return is approximately 0.01%. |
| 7 | Includes the Fund’s share of the Master Portfolio’s allocated expenses and/or net investment loss. |
| 8 | Includes the Fund’s share of the Master Portfolio’s allocated fees waived of 0.01%. |
| 9 | Includes the Fund’s share of the Master Portfolio’s allocated fees waived of less than 0.01%. |
| 10 | Includes the Fund’s share of the Master Portfolio’s allocated fees waived of 0.02%. |
See Notes to Financial Statements.
| ANNUAL REPORT | MAY 31, 2013 | 21 |
Table of Contents
| Financial Highlights (continued) | BlackRock Small Cap Growth Fund II |
| Investor B | ||||||||||||||||||||
| Year Ended May 31, | ||||||||||||||||||||
| 2013 | 2012 | 2011 | 2010 | 2009 | ||||||||||||||||
| Per Share Operating Performance | ||||||||||||||||||||
Net asset value, beginning of year | $ | 11.43 | $ | 13.77 | $ | 10.38 | $ | 8.39 | $ | 13.06 | ||||||||||
|
| |||||||||||||||||||
Net investment loss1 | (0.17 | ) | (0.27 | ) | (0.28 | ) | (0.25 | ) | (0.21 | ) | ||||||||||
Net realized and unrealized gain (loss) | 3.14 | (1.77 | ) | 3.67 | 2 | 2.24 | 2 | (4.46 | )2 | |||||||||||
|
| |||||||||||||||||||
Net increase (decrease) from investment operations | 2.97 | (2.04 | ) | 3.39 | 1.99 | (4.67 | ) | |||||||||||||
|
| |||||||||||||||||||
Distributions from net realized gain3 | (1.61 | ) | (0.30 | ) | — | — | — | |||||||||||||
|
| |||||||||||||||||||
Net asset value, end of year | $ | 12.79 | $ | 11.43 | $ | 13.77 | $ | 10.38 | $ | 8.39 | ||||||||||
|
| |||||||||||||||||||
| Total Investment Return4 | ||||||||||||||||||||
Based on net asset value | 28.99 | % | (15.12 | )% | 32.66 | %5 | 23.72 | %6 | (35.76 | )%5 | ||||||||||
|
| |||||||||||||||||||
| Ratios to Average Net Assets7 | ||||||||||||||||||||
Total expenses | 2.79 | %8 | 2.72 | %9 | 2.71 | %9 | 2.78 | % | 2.88 | % | ||||||||||
|
| |||||||||||||||||||
Net investment loss | (1.50 | )% | (2.30 | )% | (2.46 | )% | (2.50 | )% | (2.22 | )% | ||||||||||
|
| |||||||||||||||||||
| Supplemental Data | ||||||||||||||||||||
Net assets, end of year (000) | $ | 2,350 | $ | 4,587 | $ | 8,363 | $ | 10,713 | $ | 12,197 | ||||||||||
|
| |||||||||||||||||||
Portfolio turnover of the Master Portfolio | 165 | % | 143 | % | 127 | % | 114 | % | 75 | % | ||||||||||
|
| |||||||||||||||||||
| Investor C | ||||||||||||||||||||
| Year Ended May 31, | ||||||||||||||||||||
| 2013 | 2012 | 2011 | 2010 | 2009 | ||||||||||||||||
| Per Share Operating Performance | ||||||||||||||||||||
Net asset value, beginning of year | $ | 11.44 | $ | 13.76 | $ | 10.35 | $ | 8.35 | $ | 12.96 | ||||||||||
|
| |||||||||||||||||||
Net investment loss1 | (0.15 | ) | (0.25 | ) | (0.26 | ) | (0.23 | ) | (0.18 | ) | ||||||||||
Net realized and unrealized gain (loss) | 3.15 | (1.77 | ) | 3.67 | 2 | 2.23 | 2 | (4.43 | )2 | |||||||||||
|
| |||||||||||||||||||
Net increase (decrease) from investment operations | 3.00 | (2.02 | ) | 3.41 | 2.00 | (4.61 | ) | |||||||||||||
|
| |||||||||||||||||||
Distributions from net realized gain3 | (1.65 | ) | (0.30 | ) | — | — | — | |||||||||||||
|
| |||||||||||||||||||
Net asset value, end of year | $ | 12.79 | $ | 11.44 | $ | 13.76 | $ | 10.35 | $ | 8.35 | ||||||||||
|
| |||||||||||||||||||
| Total Investment Return4 | ||||||||||||||||||||
Based on net asset value | 29.31 | % | (14.98 | )% | 32.95 | %5 | 23.95 | %6 | (35.57 | )%5 | ||||||||||
|
| |||||||||||||||||||
| Ratios to Average Net Assets7 | ||||||||||||||||||||
Total expenses | 2.52 | %10 | 2.52 | %9 | 2.48 | %9 | 2.59 | % | 2.66 | % | ||||||||||
|
| |||||||||||||||||||
Net investment loss | (1.29 | )% | (2.10 | )% | (2.24 | )% | (2.32 | )% | (2.01 | )% | ||||||||||
|
| |||||||||||||||||||
| Supplemental Data | ||||||||||||||||||||
Net assets, end of year (000) | $ | 43,649 | $ | 40,529 | $ | 62,040 | $ | 60,833 | $ | 53,668 | ||||||||||
|
| |||||||||||||||||||
Portfolio turnover of the Master Portfolio | 165 | % | 143 | % | 127 | % | 114 | % | 75 | % | ||||||||||
|
| |||||||||||||||||||
| 1 | Based on average shares outstanding. |
| 2 | Includes redemption fees, which are less than $0.005 per share. |
| 3 | Distributions are determined in accordance with federal income tax regulations. |
| 4 | Where applicable, total investment returns exclude the effects of any sales charges and include the reinvestment of dividends and distributions. |
| 5 | Total return calculation includes redemption fees received by the Fund. The impact to the return is less than 0.01%. |
| 6 | Total return calculation includes redemption fees received by the Fund. The impact to the return is approximately 0.01%. |
| 7 | Includes the Fund’s share of the Master Portfolio’s allocated expenses and/or net investment loss. |
| 8 | Includes the Fund’s share of the Master Portfolio’s allocated fees waived of 0.01%. |
| 9 | Includes the Fund’s share of the Master Portfolio’s allocated fees waived of less than 0.01%. |
| 10 | Includes the Fund’s share of the Master Portfolio’s allocated fees waived of 0.02%. |
See Notes to Financial Statements.
| 22 | ANNUAL REPORT | MAY 31, 2013 |
Table of Contents
| Financial Highlights (concluded) | BlackRock Small Cap Growth Fund II |
| Class R | ||||||||||||||||||||
| Year Ended May 31, | ||||||||||||||||||||
| 2013 | 2012 | 2011 | 2010 | 2009 | ||||||||||||||||
| Per Share Operating Performance | ||||||||||||||||||||
Net asset value, beginning of year | $ | 12.19 | $ | 14.55 | $ | 10.88 | $ | 8.72 | $ | 13.46 | ||||||||||
|
| |||||||||||||||||||
Net investment loss1 | (0.08 | ) | (0.19 | ) | (0.20 | ) | (0.17 | ) | (0.14 | ) | ||||||||||
Net realized and unrealized gain (loss) | 3.38 | (1.87 | ) | 3.87 | 2 | 2.33 | 2 | (4.60 | )2 | |||||||||||
|
| |||||||||||||||||||
Net increase (decrease) from investment operations | 3.30 | (2.06 | ) | 3.67 | 2.16 | (4.74 | ) | |||||||||||||
|
| |||||||||||||||||||
Distributions from net realized gain3 | (1.69 | ) | (0.30 | ) | — | — | — | |||||||||||||
|
| |||||||||||||||||||
Net asset value, end of year | $ | 13.80 | $ | 12.19 | $ | 14.55 | $ | 10.88 | $ | 8.72 | ||||||||||
|
| |||||||||||||||||||
| Total Investment Return4 | ||||||||||||||||||||
Based on net asset value | 30.05 | % | (14.43 | )% | 33.73 | %5 | 24.77 | %6 | (35.22 | )%5 | ||||||||||
|
| |||||||||||||||||||
| Ratios to Average Net Assets7 | ||||||||||||||||||||
Total expenses | 1.89 | %8 | 1.91 | %9 | 1.90 | %9 | 1.96 | % | 2.12 | % | ||||||||||
|
| |||||||||||||||||||
Net investment loss | (0.60 | )% | (1.49 | )% | (1.65 | )% | (1.69 | )% | (1.49 | )% | ||||||||||
|
| |||||||||||||||||||
| Supplemental Data | ||||||||||||||||||||
Net assets, end of year (000) | $ | 30,932 | $ | 37,237 | $ | 59,251 | $ | 52,704 | $ | 39,445 | ||||||||||
|
| |||||||||||||||||||
Portfolio turnover of the Master Portfolio | 165 | % | 143 | % | 127 | % | 114 | % | 75 | % | ||||||||||
|
| |||||||||||||||||||
| 1 | Based on average shares outstanding. |
| 2 | Includes redemption fees, which are less than $0.005 per share. |
| 3 | Distributions are determined in accordance with federal income tax regulations. |
| 4 | Where applicable, total investment returns include the reinvestment of dividends and distributions. |
| 5 | Total return calculation includes redemption fees received by the Fund. The impact to the return is less than 0.01%. |
| 6 | Total return calculation includes redemption fees received by the Fund. The impact to the return is approximately 0.01%. |
| 7 | Includes the Fund’s share of the Master Portfolio’s allocated expenses and/or net investment loss. |
| 8 | Includes the Fund’s share of the Master Portfolio’s allocated fees waived of 0.01%. |
| 9 | Includes the Fund’s share of the Master Portfolio’s allocated fees waived of less than 0.01%. |
See Notes to Financial Statements.
| ANNUAL REPORT | MAY 31, 2013 | 23 |
Table of Contents
| Notes to Financial Statements |
1. Organization and Significant Accounting Policies:
BlackRock Disciplined Small Cap Core Fund (“Disciplined Small Cap Core Fund”), a series of the BlackRock FundsSM (the “Trust”), and BlackRock Small Cap Growth Fund II (“Small Cap Growth Fund II”), a series of BlackRock Series, Inc. (the “Corporation”) (collectively, the “Funds”, or individually, a “Fund”), are each registered under the Investment Company Act of 1940, as amended (the “1940 Act”), as a diversified, open-end management investment company. The Trust is organized as a Massachusetts business trust. The Corporation is organized as a Maryland corporation. Small Cap Growth Fund II seeks to achieve its investment objective by investing all of its assets in BlackRock Master Small Cap Growth Portfolio (the “Master Portfolio”) of BlackRock Master LLC (the “Master LLC”), an affiliate of Small Cap Growth Fund II, which has the same investment objective and strategies as Small Cap Growth Fund II. The value of Small Cap Growth Fund II’s investment in the Master Portfolio reflects Small Cap Growth Fund II’s proportionate interest in the net assets of the Master Portfolio. The performance of Small Cap Growth Fund II is directly affected by the performance of the Master Portfolio. The percentage of the Master Portfolio owned by Small Cap Growth Fund II at May 31, 2013 was 100%. The financial statements of the Master Portfolio, including the Schedule of Investments, are included elsewhere in this report and should be read in conjunction with Small Cap Growth Fund II’s financial statements. Each Fund’s financial statements are prepared in conformity with accounting principles generally accepted in the United States of America (“US GAAP”), which may require management to make estimates and assumptions that affect the reported amounts of assets and liabilities in the financial statements and the reported amounts of increases and decreases in net assets from operations during the reporting period. Actual results could differ from those estimates. Each Fund offers multiple classes of shares. Institutional Shares are sold without a sales charge and only to certain eligible investors. Investor A Shares are generally sold with a front-end sales charge. Investor B and Investor C Shares may be subject to a CDSC. Class R Shares are sold without a sales charge and only to certain employer-sponsored retirement plans. All classes of shares have identical voting, dividend, liquidation and other rights and the same terms and conditions, except that Investor A, Investor B, Investor C and Class R Shares bear certain expenses related to the shareholder servicing of such shares, and Investor B, Investor C and Class R Shares also bear certain expenses related to the distribution of such shares. Investor B Shares automatically convert to Investor A Shares after approximately eight years. Investor B Shares are only available through exchanges and dividend reinvestments by existing shareholders and for purchase by certain employer-sponsored retirement plans. Each class has exclusive voting rights with respect to matters relating to its shareholder servicing and distribution expenditures (except that Investor B shareholders may vote on material changes to the Investor A distribution and service plan).
The following is a summary of significant accounting policies followed by the Funds:
Valuation: US GAAP defines fair value as the price the Funds would receive to sell an asset or pay to transfer a liability in an orderly transaction between market participants at the measurement date. Disciplined Small Cap Core Fund determines the fair values of its financial instruments at market value using independent dealers or pricing services
under policies approved by the Board of Trustees of the Trust (the “Board”). The BlackRock Global Valuation Methodologies Committee (the “Global Valuation Committee”) is the committee formed by management to develop global pricing policies and procedures and to provide oversight of the pricing function for Disciplined Small Cap Core Fund for all financial instruments.
Small Cap Growth Fund II’s policy is to fair value its financial instruments at market value. Small Cap Growth Fund II records its investment in the Master Portfolio at fair value based on Small Cap Growth Fund II’s proportionate interest in the net assets of the Master Portfolio. Valuation of securities held by the Master Portfolio is discussed in Note 1 of the Master Portfolio’s Notes to Financial Statements, which are included elsewhere in this report.
Disciplined Small Cap Core Fund’s equity investments traded on a recognized securities exchange or the NASDAQ Global Market System (“NASDAQ”) are valued at the last reported sale price that day or the NASDAQ official closing price, if applicable. For equity investments traded on more than one exchange, the last reported sale price on the exchange where the stock is primarily traded is used. Equity investments traded on a recognized exchange for which there were no sales on that day are valued at the last available bid price. If no bid price is available, the prior day’s price will be used, unless it is determined that such prior day’s price no longer reflects the fair value of the security. Financial futures contracts traded on exchanges are valued at their last sale price. Investments in open-end registered investment companies are valued at NAV each business day.
In the event that application of these methods of valuation results in a price for an investment which is deemed not to be representative of the market value of such investment, or if a price is not available, the investment will be valued by the Global Valuation Committee, or its delegate, in accordance with a policy approved by the Board as reflecting fair value (“Fair Value Assets”) for Disciplined Small Cap Core Fund. When determining the price for Fair Value Assets, the Global Valuation Committee, or its delegate, seeks to determine the price that Disciplined Small Cap Core Fund might reasonably expect to receive from the current sale of that asset in an arm’s-length transaction. Fair value determinations shall be based upon all available factors that the Global Valuation Committee, or its delegate, deem relevant consistent with the principles of fair value measurement which include the market approach, income approach and/or in the case of recent investments, the cost approach, as appropriate. The market approach generally consists of using comparable market transactions. The income approach generally is used to discount future cash flows to present value and adjusted for liquidity as appropriate. These factors include but are not limited to: (i) attributes specific to the investment or asset; (ii) the principal market for the investment or asset; (iii) the customary participants in the principal market for the investment or asset; (iv) data assumptions by market participants for the investment or asset, if reasonably available; (v) quoted prices for similar investments or assets in active markets; and (vi) other factors, such as future cash flows, interest rates, yield curves, volatilities, prepayment speeds, loss severities, credit risks, recovery rates, liquidation amounts and/or default rates. Due to the inherent uncertainty of valuations of such investments, the fair values may differ from the values
| 24 | ANNUAL REPORT | MAY 31, 2013 |
Table of Contents
| Notes to Financial Statements (continued) |
that would have been used had an active market existed. The Global Valuation Committee, or its delegate, employs various methods for calibrating valuation approaches for investments where an active market does not exist, including regular due diligence of Disciplined Small Cap Core Fund’s pricing vendors, a regular review of key inputs and assumptions, transactional back-testing or disposition analysis to compare unrealized gains and losses to realized gains and losses, reviews of missing or stale prices and large movements in market values and reviews of any market related activity. The pricing of all Fair Value Assets is subsequently reported to the Board or a committee thereof on a quarterly basis.
Segregation and Collateralization: In cases in which the 1940 Act and the interpretive positions of the Securities and Exchange Commission (“SEC”) require that Disciplined Small Cap Core Fund either deliver collateral or segregate assets in connection with certain investments (e.g., financial futures contracts), Disciplined Small Cap Core Fund will, consistent with SEC rules and/or certain interpretive letters issued by the SEC, segregate collateral or designate on its books and records cash or liquid securities having a market value at least equal to the amount that would otherwise be required to be physically segregated. Furthermore, based on requirements and agreements with certain exchanges and third party broker-dealers, Disciplined Small Cap Core Fund���s engaging in such transactions may have requirements to deliver/deposit securities to/with an exchange or broker-dealer as collateral for certain investments. Typically, Disciplined Small Cap Core Fund is permitted to sell, re-pledge or use collateral received from the counterparty, but counterparties typically are not permitted to sell, re-pledge or use the collateral they receive.
Investment Transactions and Investment Income: For Disciplined Small Cap Core Fund, for financial reporting purposes, investment transactions are recorded on the dates the transactions are entered into (the trade dates). Realized gains and losses on investment transactions are determined on the identified cost basis. Dividend income is recorded on the ex-dividend dates. Upon notification from issuers, some of the dividend income received from a real estate investment trust may be redesignated as a reduction of cost of the related investment and/or realized gain. Income and realized and unrealized gains and losses are allocated daily to each class based on its relative net assets. For Small Cap Growth Fund II, for financial reporting purposes, contributions to and withdrawals from the Master Portfolio are accounted on a trade date basis. Small Cap Growth Fund II records daily its proportionate share of the Master Portfolio’s income, expenses and realized and unrealized gains and losses. In addition, Small Cap Growth Fund II accrues its own expenses. Income, expenses and realized and unrealized gains and losses are allocated daily to each class based on its relative net assets.
Dividends and Distributions: Dividends and distributions paid by the Funds are recorded on the ex-dividend dates. The portion of distributions that exceeds a Fund’s current and accumulated earnings and profits, which are measured on a tax basis, will constitute a nontaxable return of capital. Distributions in excess of a Fund’s taxable income and net capital gains, but not in excess of a Fund’s earnings and profits, will be taxable to shareholders as ordinary income and will not constitute a non-taxable return of capital. Capital losses carried forward from years
beginning before 2011 do not reduce earnings and profits, even if such carried forward losses offset current year realized gains. The character and timing of dividends and distributions are determined in accordance with federal income tax regulations, which may differ from US GAAP.
Income Taxes: It is each Fund’s policy to comply with the requirements of the Internal Revenue Code of 1986, as amended, applicable to regulated investment companies and to distribute substantially all of its taxable income to its shareholders. Therefore, no federal income tax provision is required.
Each Fund files US federal and various state and local tax returns. No income tax returns are currently under examination. The statute of limitations on Small Cap Growth Fund II’s US federal tax returns remains open for each of the four years ended May 31, 2013. The statute of limitations on Disciplined Small Cap Core Fund’s US federal tax returns remains open for the period ended May 31, 2013. The statutes of limitations on Small Cap Growth Fund II’s state and local tax returns may remain open for an additional year depending upon the jurisdiction. Management does not believe there are any uncertain tax positions that require recognition of a tax liability.
Recent Accounting Standards: In December 2011, the Financial Accounting Standards Board (the “FASB”) issued guidance that will expand current disclosure requirements on the offsetting of certain assets and liabilities. The new disclosures will be required for investments and derivative financial instruments subject to master netting or similar agreements which are eligible for offset in the Statements of Assets and Liabilities and will require an entity to disclose both gross and net information about such investments and transactions in the financial statements. In January 2013, the FASB issued guidance that clarifies which investments and transactions are subject to the offsetting disclosure requirements. The scope of the disclosure requirements for offsetting will be limited to derivative instruments, repurchase agreements and reverse repurchase agreements, and securities borrowing and securities lending transactions. The guidance is effective for financial statements with fiscal years beginning on or after January 1, 2013, and interim periods within those fiscal years. Disciplined Small Cap Core Fund adopted the disclosure provisions on offsetting during the current reporting period. The disclosures required have been included for Disciplined Small Cap Core Fund’s derivative financial instruments in Note 2. Management is evaluating the impact, if any, of this guidance on Small Cap Growth Fund II’s financial statement disclosures.
Organization and Offering Costs: Upon commencement of operations, organization costs associated with the establishment of Disciplined Small Cap Core Fund were expensed by Disciplined Small Cap Core Fund and reimbursed by the Manager. The Manager reimbursed Disciplined Small Cap Core Fund $14,635 which is included in fees waived and/or reimbursed by Manager in the Statements of Operations. Offering costs are amortized over a 12-month period beginning with the commencement of operations.
Other: Expenses directly related to a Fund or its classes are charged to that Fund or class. Other operating expenses shared by several funds are pro rated among those funds on the basis of relative net assets or other
| ANNUAL REPORT | MAY 31, 2013 | 25 |
Table of Contents
| Notes to Financial Statements (continued) |
appropriate methods. Expenses directly related to a Fund and other shared expenses pro rated to a Fund are allocated daily to each class based on its relative net assets or other appropriate methods.
Disciplined Small Cap Core Fund has an arrangement with the custodian whereby fees may be reduced by credits earned on uninvested cash balances, which, if applicable, are shown as fees paid indirectly in the Statements of Operations. The custodian imposes fees on overdrawn cash balances, which can be offset by accumulated credits earned or may result in additional custody charges.
2. Derivative Financial Instruments:
Disciplined Small Cap Core Fund engages in various portfolio investment strategies using derivative contracts both to increase the returns of Disciplined Small Cap Core Fund and/or to economically hedge its exposure to certain risks such as equity risk. These contracts may be transacted on an exchange or over-the-counter.
Financial Futures Contracts: Disciplined Small Cap Core Fund purchases and/or sells financial futures contracts to gain exposure to, or economically hedge against, changes in the value of equity securities (equity risk). Financial futures contracts are agreements between Disciplined Small Cap Core Fund and a counterparty to buy or sell a specific quantity of an underlying instrument at a specified price and at a specified
date. Depending on the terms of the particular contract, financial futures contracts are settled either through physical delivery of the underlying instrument on the settlement date or by payment of a cash settlement amount on the settlement date. Upon entering into a financial futures contract, Disciplined Small Cap Core Fund is required to deposit initial margin with the broker in the form of cash or securities in an amount that varies depending on a contract’s size and risk profile. The initial margin deposit must then be maintained at an established level over the life of the contract. Securities deposited as initial margin are designated on the Schedule of Investments and cash deposited is recorded on the Statements of Assets and Liabilities as cash pledged for financial futures contracts. Pursuant to the contract, Disciplined Small Cap Core Fund agrees to receive from or pay to the broker an amount of cash equal to the daily fluctuation in value of the contract. Such receipts or payments are known as variation margin and are recorded by Disciplined Small Cap Core Fund as unrealized appreciation or depreciation. When the contract is closed, Disciplined Small Cap Core Fund records a realized gain or loss equal to the difference between the value of the contract at the time it was opened and the value at the time it was closed. The use of financial futures contracts involves the risk of an imperfect correlation in the movements in the price of financial futures contracts and the underlying assets.
The following is a summary of the Disciplined Small Cap Core Fund’s derivative financial instruments categorized by risk exposure:
| Fair Values of Derivative Financial Instruments as of May 31, 2013 | ||||
| Derivative Liabilities | ||||
| Statements of Assets and Liabilities Location | Value | |||
| Equity contracts | Net unrealized appreciation/depreciation1 | $(1,172) | ||
| 1 Includes cumulative appreciation/depreciation on financial futures contracts as reported in the Schedule of Investments. Only current day’s variation margin is reported within the Statements of Assets and Liabilities. | ||||
The Effect of Derivative Financial Instruments in the Statements of Operations Period March 14, 2013 to May 31, 2013 | ||||
| Net Realized Gain From | ||||
Equity contracts: | ||||
Financial futures contracts | $4,056 | |||
| ||||
| Net Change in Unrealized Appreciation/Depreciation on | ||||
Equity contracts: | ||||
Financial futures contracts | $(1,172) | |||
For the period ended May 31, 2013, the actual contracts of derivative financial instruments for Disciplined Small Cap Core were as follows:
Financial futures contracts: | ||||
Number of contracts purchased | 1 | |||
Notional value of contracts purchased | $ | 98,310 |
A derivative contract may suffer a mark to market loss if the value of the contract decreases due to an unfavorable change in the market rates or values of the underlying instrument. Losses can also occur if the counterparty does not perform under the contract.
With exchange traded futures, there is less counterparty credit risk to Disciplined Small Cap Core Fund since the exchange or clearinghouse, as counterparty to such instrument, guarantees against a possible default. The clearinghouse stands between the buyer and the seller of the contract; therefore, the credit risk is limited to failure of the clearinghouse. However, credit risk still exists in exchange traded futures with respect to initial and variation margin that is held in a clearing broker’s customer accounts. While clearing brokers are required to segregate customer margin from their own assets, in the event that a clearing broker becomes insolvent or goes into bankruptcy and at that time there is a shortfall in the aggregate amount of margin held by the clearing broker for all its clients, US bankruptcy laws will typically allocate that shortfall on a pro rata basis across all the clearing broker’s customers, potentially resulting in losses to Disciplined Small Cap Core Fund.
| 26 | ANNUAL REPORT | MAY 31, 2013 |
Table of Contents
| Notes to Financial Statements (continued) |
For financial reporting purposes, Disciplined Small Cap Core Fund does not offset derivative assets and derivative liabilities that are subject to netting arrangements in the Statements of Assets and Liabilities.
Disciplined Small Cap Core Fund has adopted the new disclosure requirements on offsetting in the following table. At May 31, 2013, Disciplined Small Cap Core Fund’s derivative assets and liabilities (by type) are as follows:
Disciplined Small Cap Core Fund | ||||||||
| Assets | Liabilities | |||||||
Derivative Financial Instruments: | ||||||||
Financial futures contracts | — | $ 990 | ||||||
Total derivative assets and liabilities in the Statements of Assets and Liabilities | — | 990 | ||||||
Derivatives not subject to a master netting agreement or similar agreement (“MNA”) | — | (990 | ) | |||||
Total assets and liabilities subject to a MNA | — | — | ||||||
3. Investment Advisory Agreement and Other Transactions with Affiliates:
The PNC Financial Services Group, Inc. (“PNC”) is the largest stockholder and an affiliate, for 1940 Act purposes, of BlackRock, Inc. (“BlackRock”).
The Trust, on behalf of Disciplined Small Cap Core Fund, entered into an Investment Advisory Agreement with the Manager, Disciplined Small Cap Core Fund’s investment advisor, an indirect, wholly owned subsidiary of BlackRock, to provide investment advisory and administration services. The Manager is responsible for the management of Disciplined Small Cap Core Fund’s portfolio and provides the necessary personnel, facilities, equipment and certain other services necessary to the operations of Disciplined Small Cap Core Fund. For such services, Disciplined Small Cap Core Fund pays the Manager a monthly fee based on a percentage of Disciplined Small Cap Core Fund’s average daily net assets at the following annual rates:
| Average Daily Net Assets | Investment Advisory Fee | |||
First $1 Billion | 0.45 | % | ||
$1 Billion - $3 Billion | 0.42 | % | ||
$3 Billion - $5 Billion | 0.41 | % | ||
$5 Billion - $10 Billion | 0.39 | % | ||
Greater than $10 Billion | 0.38 | % | ||
The Manager voluntarily agreed to waive its investment advisory fees by the amount of investment advisory fees Disciplined Small Cap Core Fund pays to the Manager indirectly through its investment in affiliated money market funds. However, the Manager does not waive its investment advisory fees by the amount of investment advisory fees paid in connection with Disciplined Small Cap Core Fund’s investment in other affiliated investment companies, if any. These amounts are included in fees waived and/or reimbursed by Manager in the Statements of Operations. For the period ended May 31, 2013, the amount waived was $53.
For Disciplined Small Cap Core Fund, the Manager entered into a sub-advisory agreement with BlackRock Fund Advisors (“BFA”), an affiliate of the Manager. The Manager pays BFA for services it provides, a monthly fee that is a percentage of the investment advisory fees paid by Disciplined Small Cap Core Fund to the Manager.
The Corporation, on behalf of Small Cap Growth Fund II, entered into an Administration Agreement with BlackRock Advisors, LLC (the “Administrator”), an indirect, wholly owned subsidiary of BlackRock, to provide
administrative services (other than investment advice and related portfolio activities). For such services, Small Cap Growth Fund II pays the Administrator a monthly fee at an annual rate of 0.20% of the average daily value of Small Cap Growth Fund II’s net assets. Small Cap Growth Fund II does not pay an investment advisory fee or investment management fee.
BNY Mellon Investment Servicing (US) Inc. (“BNYMIS”) and the Manager act as co-administrators for the Disciplined Small Cap Core Fund. For these services, the co-administrators receive an administration fee computed daily and payable monthly to each administrator pursuant to separate fee arrangements, based on a percentage of the average daily net assets of Disciplined Small Cap Core Fund. The combined administration fee, which is shown as administration in the Statements of Operations, is paid at the following annual rates:
| Average Daily Net Assets | Administration Fee | |||
First $500 Million. | 0.075 | % | ||
$500 Million - $1 Billion | 0.065 | % | ||
Greater than $1 Billion | 0.055 | % | ||
In addition, each of Disciplined Small Cap Core Fund’s share classes is charged an administration fee, which is shown as administration — class specific in the Statements of Operations, based on the following percentages of average daily net assets of each respective class:
| Average Daily Net Assets | Administration Fee — Class Specific | |||
First $500 Million | 0.025 | % | ||
$500 Million - $1 Billion | 0.015 | % | ||
Greater than $1 Billion | 0.005 | % | ||
In addition, BNYMIS and the Manager may have, at their discretion, voluntarily waived all or any portion of their administration fees for Disciplined Small Cap Core Fund or a share class which is included in administration fees waived and administration fees waived — class specific in the Statements of Operations. For the period ended May 31, 2013, Disciplined Small Cap Core Fund paid $41 to the Manager in return for these services, which is included in administration, administration — class specific, administration fees waived and administration fees waived — class specific in the Statements of Operations.
The Funds entered into a Distribution Agreement and Distribution and Service Plan with BlackRock Investments, LLC (“BRIL”), an affiliate of the Manager/Administrator. Pursuant to the Distribution and Service Plan
| ANNUAL REPORT | MAY 31, 2013 | 27 |
Table of Contents
| Notes to Financial Statements (continued) |
and in accordance with Rule 12b-1 under the 1940 Act, each Fund pays BRIL ongoing service and distribution fees. The fees are accrued daily and paid monthly at annual rates based upon the average daily net assets of the shares of each Fund as follows:
| Service Fee | Distribution Fee | |||||||
Investor A | 0.25 | % | — | |||||
Investor B | 0.25 | % | 0.75 | % | ||||
Investor C | 0.25 | % | 0.75 | % | ||||
Class R | 0.25 | % | 0.25 | % | ||||
Pursuant to sub-agreements with BRIL, broker-dealers and BRIL provide shareholder servicing and distribution services to each Fund. The ongoing service and/or distribution fee compensates BRIL and each broker-dealer for providing shareholder servicing and/or distribution related services to Investor A, Investor B, Investor C and Class R shareholders.
For the period ended May 31, 2013, the following table shows the class specific service and distribution fees borne directly by each class of each Fund:
| Investor A | Investor B | Investor C | Class R | Total | ||||||||||||||||
Disciplined Small Cap Core Fund | $ | 11 | — | $ | 43 | — | $ | 54 | ||||||||||||
Small Cap | ||||||||||||||||||||
Growth Fund II | $ | 184,854 | $ | 36,312 | $ | 420,655 | $ | 175,878 | $ | 817,699 | ||||||||||
Pursuant to written agreements, certain financial intermediaries, some of which may be affiliates, provide the Funds with sub-accounting, recordkeeping, sub-transfer agency and other administrative services with respect to sub-accounts they service. For these services, these entities receive an asset based fee or an annual fee per shareholder account, which will vary depending on share class and/or net assets.
The Manager/Administrator maintains a call center, which is responsible for providing certain shareholder services to the Funds, such as responding to shareholder inquiries and processing transactions based upon instructions from shareholders with respect to the subscription and redemption of Fund shares. For the year ended May 31, 2013, Small Cap Growth Fund II reimbursed the Administrator the following amounts for costs incurred in running the call center, which are included in transfer agent — class specific in the Statements of Operations:
| Institutional | Investor A | Investor B | Investor C | Class R | Total | |||||||||||||||
$708 | $ | 663 | $ | 138 | $ | 797 | $ | 840 | $ | 3,146 | ||||||||||
For the period ended May 31, 2013, the following table shows the class specific transfer agent fees borne directly by each class of each Fund:
| Institutional | Investor A | Investor B | Investor C | Class R | Total | |||||||||||||||||||
Disciplined Small Cap Core Fund | $ 50 | $ 10 | — | $ 10 | — | $70 | ||||||||||||||||||
Small Cap Growth Fund II | $108,784 | $206,502 | $25,474 | $181,508 | $106,204 | $628,472 | ||||||||||||||||||
For the period ended May 31, 2013, the following table shows the class specific administration fees borne directly by each class of Disciplined Small Cap Core Fund:
| Institutional | Investor A | Investor C | Total | |||||||||
$267 | $ | 1 | $ | 1 | $ | 269 | ||||||
With respect to Disciplined Small Cap Core Fund, the Manager contractually agreed to waive and/or reimburse fees or expenses, excluding interest expense, dividend expense, income tax expense, acquired fund fees and expenses and certain other fund expenses, which constitute extraordinary expenses not incurred in the ordinary course of Disciplined Small Cap Core Fund’s business, in order to limit expenses. The expense limitations as a percentage of average daily net assets are as follows: 0.70% for Institutional; 0.95% for Investor A and 1.70% for Investor C. The Manager has agreed not to reduce or discontinue this contractual waiver or reimbursement prior to December 1, 2014 unless approved by the Board, including a majority of the independent Trustees. These amounts waived or reimbursed are included in fees waived and/or reimbursed by Manager, and shown as administration fees waived, administration fees waived — class specific and transfer agent fees reimbursed — class specific, respectively, in the Statements of Operations. For the period ended May 31, 2013, the amount included in fees waived and/or reimbursed by Manager was $70,783 for Disciplined Small Cap Core Fund. Class specific expense waivers and reimbursements are as follows:
| Institutional | Investor A | Investor C | Total | |||||||||||||
Administration Fees Waived | $ | 225 | $ | 1 | $ | 1 | $ | 227 | ||||||||
Transfer Agent Fees Reimbursed | $ | 27 | $ | 10 | $ | 10 | $ | 47 | ||||||||
If during Disciplined Small Cap Core Fund’s fiscal year the operating expenses of a share class, that at any time during the prior two fiscal years received a waiver or reimbursement from the Manager, are less than the expense limit for that share class, the Manager is entitled to be reimbursed by such share class up to the lesser of (a) the amount of fees waived or expenses reimbursed during those prior two fiscal years under the agreement and (b) the amount by which the expense limit for that share class exceeds the operating expenses of the share class for the current fiscal year, provided that: (1) Disciplined Small Cap Core Fund has more than $50 million in assets for the fiscal year and (2) the Manager or an affiliate continues to serve as Disciplined Small Cap Core Fund’s investment advisor or administrator. In the event the expense limit for a share class is changed subsequent to a fiscal year in which the Manager becomes entitled to reimbursement for fees waived or reimbursed, the amount available to reimburse the Manager shall be calculated by reference to the expense limit for that share class in effect at the time the Manager became entitled to receive such reimbursement, rather than the subsequently changed expense limit for that share class.
On May 31, 2013, Disciplined Small Cap Core Fund’s Fund level and class specific waivers and/or reimbursements subject to possible future recoupment under the expense limitation agreement are $71,590, $252, $11, and $11 for Fund level, Institutional, Investor A and Investor C Shares, respectively, expiring May 31, 2015.
| 28 | ANNUAL REPORT | MAY 31, 2013 |
Table of Contents
| Notes to Financial Statements (continued) |
For the year ended May 31, 2013, affiliates earned underwriting discounts, direct commissions and dealer concessions on sales of Small Cap Growth Fund II’s Investor A Shares of $3,393.
For the year ended May 31, 2013, affiliates received CDSCs in the amount of $782 and $1,480 for Small Cap Growth Fund II’s Investor B and Investor C Shares, respectively.
Certain officers and/or trustees/directors of the Trust/Corporation are officers and/or directors of BlackRock or its affiliates. The Funds reimburse the Manager/Administrator for a portion of the compensation paid to the Trust’s/Corporation’s Chief Compliance Officer which is included in officer and trustees in the Statements of Operations.
4. Investments:
Purchases and sales of investments excluding short-term securities for the period ended May 31, 2013, were $7,454,240 and $2,512,425, respectively, for Disciplined Small Cap Core Fund.
5. Income Tax Information:
US GAAP requires that certain components of net assets be adjusted to reflect permanent differences between financial and tax reporting. These reclassifications have no effect on net assets or net asset values per share. The following permanent differences as of May 31, 2013 attributable to the sale of stock of passive foreign investment companies, net operating losses and non-deductible expenses were reclassified to the following accounts:
| Disciplined Small Cap Core Fund | Small Cap Growth Fund II | |||||||
Paid-in capital | $ | (2,503 | ) | — | ||||
Undistributed net investment income | $ | 2,503 | $ | 1,580,105 | ||||
Accumulated net realized gain allocated from the Master | ||||||||
Portfolio | — | $ | (1,580,105 | ) | ||||
The tax character of distributions paid during the fiscal years ended May 31, 2013 and May 31, 2012 was as follows:
| Small Cap Growth Fund II | ||||
Ordinary income | ||||
5/31/13 | $ | 4,415,641 | ||
Long-term capital gains | ||||
5/31/13 | 23,940,717 | |||
5/31/12 | 9,485,773 | |||
Total | ||||
5/31/13 | $ | 28,356,358 | ||
|
| |||
5/31/12 | $ | 9,485,773 | ||
|
| |||
As of May 31, 2013, the tax components of accumulated net earnings were as follows:
| Disciplined Small Cap Core Fund | Small Cap Growth Fund II | |||||||
Undistributed ordinary income | $ | 65,794 | $ | 10,647,664 | ||||
Undistributed long-term capital gains | 1,731 | 20,621,709 | ||||||
Net unrealized gains1 | 122,068 | 20,146,866 | ||||||
Total | $ | 189,593 | $ | 51,416,239 | ||||
| 1 | The difference between book-basis and tax-basis net unrealized gains was attributable primarily to the tax deferral of losses on wash sales and straddles, the realization for tax purposes of unrealized gains/losses on certain futures contracts, the timing and recognition of partnership income and the realization for tax purposes of unrealized gain on investments in passive foreign investment companies. |
As of May 31, 2013, gross unrealized appreciation and gross unrealized depreciation based on cost for federal income tax purposes for Disciplined Small Cap Core Fund were as follows:
Tax cost | $ | 5,097,620 | ||
|
| |||
Gross unrealized appreciation | $ | 262,729 | ||
Gross unrealized depreciation | (140,661 | ) | ||
|
| |||
Net unrealized appreciation | $ | 122,068 | ||
|
|
6. Borrowings:
Disciplined Small Cap Core Fund, along with certain other funds managed by the Manager and its affiliates (“Participating Funds”), is a party to a 364-day, $800 million credit agreement with a group of lenders, under which Disciplined Small Cap Core Fund may borrow to fund shareholder redemptions. The agreement expires in April 2014. Excluding commitments designated for a certain individual fund, other Participating Funds, including Disciplined Small Cap Core Fund, can borrow up to an aggregate commitment amount of $500 million, subject to asset coverage and other limitations as specified in the agreement. The credit agreement has the following terms: a fee of 0.065% per annum on unused commitment amounts and interest at a rate equal to the higher of (a) the one-month LIBOR plus 0.80% per annum or (b) the Fed Funds rate plus 0.80% per annum on amounts borrowed. Participating Funds paid administration and arrangement fees, which, along with commitment fees, were allocated among such funds based upon portions of the aggregate commitment available to them and relative net assets of Participating Funds. Disciplined Small Cap Core Fund did not borrow under the credit agreement during the period ended May 31, 2013.
7. Concentration, Market and Credit Risk:
In the normal course of business, Disciplined Small Cap Core Fund invests in securities and enters into transactions where risks exist due to fluctuations in the market (market risk) or failure of the issuer of a security to meet all its obligations (issuer credit risk). The value of securities held by Disciplined Small Cap Core Fund may decline in response to certain events, including those directly involving the issuers whose securities are owned by Disciplined Small Cap Core Fund; conditions affecting the general economy; overall market changes; local, regional or global political, social or economic instability; and currency and interest
| ANNUAL REPORT | MAY 31, 2013 | 29 |
Table of Contents
| Notes to Financial Statements (continued) |
rate and price fluctuations. Similar to issuer credit risk, Disciplined Small Cap Core Fund may be exposed to counterparty credit risk, or the risk that an entity with which Disciplined Small Cap Core Fund has unsettled or open transactions may fail to or be unable to perform on its commitments. Disciplined Small Cap Core Fund manages counterparty credit risk by entering into transactions only with counterparties that it believes have the financial resources to honor their obligations and by monitoring the financial stability of those counterparties. Financial assets, which potentially expose Disciplined Small Cap Core Fund to market, issuer and counterparty credit risks, consist principally of financial instruments and receivables due from counterparties. The extent of Disciplined Small
Cap Core Fund’s exposure to market, issuer and counterparty credit risks with respect to these financial assets is generally approximated by their value recorded in the Statement of Assets and Liabilities, less any collateral held by Disciplined Small Cap Core Fund.
As of May 31, 2013, Disciplined Small Cap Core Fund invested a significant portion of its assets in securities in the financials sector. Changes in economic conditions affecting the financials sector would have a greater impact on Disciplined Small Cap Core Fund and could affect the value, income and/or liquidity of positions in such securities.
8. Capital Share Transactions:
Transactions in capital shares for each class were as follows:
| Period March 14, 20131 to May 31, 2013 | ||||||||||||||||||
| Disciplined Small Cap Core Fund | Shares | Amount | ||||||||||||||||
Institutional | ||||||||||||||||||
Shares sold | 499,521 | $ | 4,995,010 | |||||||||||||||
Shares redeemed | (1 | ) | (10 | ) | ||||||||||||||
|
| |||||||||||||||||
Net increase | 499,520 | $ | 4,995,000 | |||||||||||||||
|
| |||||||||||||||||
Investor A | ||||||||||||||||||
Shares sold | 2,001 | $ | 20,010 | |||||||||||||||
Shares redeemed | (1 | ) | (10 | ) | ||||||||||||||
|
| |||||||||||||||||
Net increase | 2,000 | $ | 20,000 | |||||||||||||||
|
| |||||||||||||||||
Investor C | ||||||||||||||||||
Shares sold | 2,001 | $ | 20,010 | |||||||||||||||
Shares redeemed | (1 | ) | (10 | ) | ||||||||||||||
|
| |||||||||||||||||
Net increase | 2,000 | $ | 20,000 | |||||||||||||||
Total Net Increase | 503,520 | $ | 5,035,000 | |||||||||||||||
|
| |||||||||||||||||
1 Commencement of operations. | ||||||||||||||||||
| Year Ended May 31, 2013 | Year Ended May 31, 2012 | |||||||||||||||||
| Small Cap Growth Fund II | Shares | Amount | Shares | Amount | ||||||||||||||
Institutional | ||||||||||||||||||
Shares sold | 1,169,129 | $ | 16,244,000 | 2,345,691 | $ | 32,697,867 | ||||||||||||
Shares issued in reinvestment of distributions | 539,089 | 6,911,438 | 187,924 | 2,815,121 | ||||||||||||||
Shares redeemed | (1,857,378 | ) | (25,535,920 | ) | (8,000,165 | ) | (119,603,567 | ) | ||||||||||
|
|
|
| |||||||||||||||
Net decrease | (149,160 | ) | $ | (2,380,482 | ) | (5,466,550 | ) | $ | (84,090,579 | ) | ||||||||
|
|
|
| |||||||||||||||
Investor A | ||||||||||||||||||
Shares sold and automatic conversion of shares | 1,536,013 | $ | 20,775,563 | 3,138,026 | $ | 40,049,475 | ||||||||||||
Shares issued in reinvestment of distributions | 741,051 | 9,168,799 | 268,459 | 3,900,731 | ||||||||||||||
Shares redeemed | (3,125,461 | ) | (42,072,326 | ) | (11,904,602 | ) | (160,014,388 | ) | ||||||||||
|
|
|
| |||||||||||||||
Net decrease | (848,397 | ) | $ | (12,127,964 | ) | (8,498,117 | ) | $ | (116,064,182 | ) | ||||||||
|
|
|
| |||||||||||||||
| 30 | ANNUAL REPORT | MAY 31, 2013 |
Table of Contents
| Notes to Financial Statements (concluded) |
| Year Ended | Year Ended | |||||||||||||||||
| May 31, 2013 | May 31, 2012 | |||||||||||||||||
| Small Cap Growth Fund II (concluded) | Shares | Amount | Shares | Amount | ||||||||||||||
Investor B | ||||||||||||||||||
Shares sold | 66,833 | $ | 780,876 | 110,018 | $ | 1,334,450 | ||||||||||||
Shares issued in reinvestment of distributions | 48,683 | 530,289 | 12,776 | 167,369 | ||||||||||||||
Shares redeemed and automatic conversion of shares | (333,148 | ) | (3,927,351 | ) | (328,725 | ) | (4,002,380 | ) | ||||||||||
|
|
|
| |||||||||||||||
Net decrease | (217,632 | ) | $ | (2,616,186 | ) | (205,931 | ) | $ | (2,500,561 | ) | ||||||||
|
|
|
| |||||||||||||||
Investor C | ||||||||||||||||||
Shares sold | 403,695 | $ | 4,750,362 | 489,435 | $ | 5,868,265 | ||||||||||||
Shares issued in reinvestment of distributions | 456,125 | 4,970,460 | 90,099 | 1,179,447 | ||||||||||||||
Shares redeemed | (989,830 | ) | (11,624,587 | ) | (1,546,054 | ) | (18,715,385 | ) | ||||||||||
|
|
|
| |||||||||||||||
Net decrease | (130,010 | ) | $ | (1,903,765 | ) | (966,520 | ) | $ | (11,667,673 | ) | ||||||||
|
|
|
| |||||||||||||||
Class R | ||||||||||||||||||
Shares sold | 665,976 | $ | 8,426,340 | 1,148,960 | $ | 14,848,108 | ||||||||||||
Shares issued in reinvestment of distributions | 419,696 | 4,911,776 | 82,942 | 1,150,401 | ||||||||||||||
Shares redeemed | (1,900,842 | ) | (24,021,310 | ) | (2,248,882 | ) | (28,671,557 | ) | ||||||||||
|
|
|
| |||||||||||||||
Net decrease | (815,170 | ) | $ | (10,683,194 | ) | (1,016,980 | ) | $ | (12,673,048 | ) | ||||||||
Total Net Decrease | (2,160,369 | ) | $ | (29,711,591 | ) | (16,154,098 | ) | $ | (226,996,043 | ) | ||||||||
|
|
|
| |||||||||||||||
At May 31, 2013, 496,000 Institutional Shares, 2,000 Investor A Shares and 2,000 Investor C Shares of Disciplined Small Cap Core Fund were owned by affiliates.
9. Subsequent Events:
Management has evaluated the impact of all subsequent events on the Fund through the date the financial statements were issued and has determined that there were no subsequent events requiring adjustment or additional disclosure in the financial statements.
| ANNUAL REPORT | MAY 31, 2013 | 31 |
Table of Contents
| Report of Independent Registered Public Accounting Firm |
To the Shareholders of BlackRock Disciplined Small Cap Core Fund and Board of Trustees of BlackRock FundsSM and the Shareholders of BlackRock Small Cap Growth Fund II and Board of Directors of BlackRock Series, Inc.:
We have audited the accompanying statement of assets and liabilities of BlackRock Disciplined Small Cap Core Fund, including the schedule of investments, as of May 31, 2013, and the related statements of operations, changes in net assets and the financial highlights for the period March 14, 2013 (commencement of operations) through May 31, 2013. We have also audited the accompanying statement of assets and liabilities of BlackRock Small Cap Growth Fund II (collectively, with BlackRock Disciplined Small Cap Core Fund, the “Funds”), as of May 31, 2013, and the related statement of operations for the year then ended, the statements of changes in net assets for each of the two years in the period then ended, and the financial highlights for each of the five years in the period then ended. These financial statements and financial highlights are the responsibility of the Funds’ management. Our responsibility is to express an opinion on these financial statements and financial highlights based on our audits.
We conducted our audits in accordance with the standards of the Public Company Accounting Oversight Board (United States). Those standards require that we plan and perform the audit to obtain reasonable assurance about whether the financial statements and financial highlights are free of material misstatement. The Funds are not required to have, nor were we engaged to perform, an audit of their internal control over financial reporting. Our audits included consideration of internal control over financial reporting as a basis for designing audit procedures that are
appropriate in the circumstances, but not for the purpose of expressing an opinion on the effectiveness of the Funds’ internal control over financial reporting. Accordingly, we express no such opinion. An audit also includes examining, on a test basis, evidence supporting the amounts and disclosures in the financial statements, assessing the accounting principles used and significant estimates made by management, as well as evaluating the overall financial statement presentation. Our procedures included confirmation of securities owned as of May 31, 2013, by correspondence with the custodian and brokers. We believe that our audits provide a reasonable basis for our opinion.
In our opinion, the financial statements and financial highlights referred to above present fairly, in all material respects, the respective financial position of BlackRock Disciplined Small Cap Core Fund and BlackRock Small Cap Growth Fund II as of May 31, 2013, and as to BlackRock Disciplined Small Cap Core Fund the results of its operations, the changes in its net assets and financial highlights for the period March 14, 2013 (commencement
of operations) through May 31, 2013, and as to BlackRock Small Cap Growth Fund II the results of its operations for the year then ended, the changes in its net assets for each of the two years in the period then ended, and the financial highlights for each of the five years in the period then ended, in conformity with accounting principles generally accepted in the United States of America.
Deloitte & Touche LLP
Philadelphia, Pennsylvania
July 25, 2013
| Important Tax Information (Unaudited) |
The following information is provided with respect to the ordinary income distributions paid during the fiscal year ended May 31, 2013 for Small Cap Growth Fund II:
| Payable Date | Qualified Dividend Income for Individuals1 | Dividends Qualifying for the Dividends Received Deduction for Corporations1 | ||||||
12/07/12 | 50.19 | % | 18.09 | % | ||||
| 1 | Small Cap Growth Fund II hereby designates the percentage indicated above or the maximum amount allowable by law. |
Additionally, Small Cap Growth Fund II distributed long-term capital gains of $1.122143 per share and $0.298149 per share to shareholders of record on July 18, 2012 and December 5, 2012, respectively.
| 32 | ANNUAL REPORT | MAY 31, 2013 |
Table of Contents
| Master Portfolio Information as of May 31, 2013 |
| BlackRock Master Small Cap Growth Portfolio |
| Ten Largest Holdings | Percent of Long-Term Investments |
ExlService Holdings, Inc. | 3 | % | ||
Aspen Technology, Inc. | 3 | |||
Gentium SpA - ADR | 3 | |||
PROS Holdings, Inc. | 2 | |||
Ryder System, Inc. | 2 | |||
NIC, Inc. | 2 | |||
A.O. Smith Corp. | 2 | |||
Orbital Sciences Corp. | 2 | |||
Cbeyond, Inc. | 2 | |||
ArthroCare Corp. | 2 |
| Sector Allocation | Percent of Long-Term Investments |
Health Care | 21 | % | ||
Information Technology | 21 | |||
Industrials | 18 | |||
Consumer Discretionary | 16 | |||
Energy | 7 | |||
Financials | 7 | |||
Materials | 3 | |||
Telecommunication Services | 3 | |||
Consumer Staples | 2 | |||
Utilities | 2 |
| For Master Portfolio compliance purposes, the Master Portfolio’s sector classifications refer to any one or more of the sector sub-classifications used by one or more widely recognized market indexes or ratings group indexes, and/or as defined by Master Portfolio management. These definitions may not apply for purposes of this report, which may combine such sector sub-classifications for reporting ease. |
| ANNUAL REPORT | MAY 31, 2013 | 33 |
Table of Contents
| Schedule of Investments May 31, 2013 | BlackRock Master Small Cap Growth Portfolio | |||
| (Percentages shown are based on Net Assets) |
| Common Stocks | Shares | Value | ||||||
Aerospace & Defense — 3.6% | ||||||||
AAR Corp. | 11,556 | $ | 231,813 | |||||
Ducommun, Inc. (a) | 25,750 | 500,323 | ||||||
Erickson Air-Crane, Inc. (a) | 559 | 13,902 | ||||||
Orbital Sciences Corp. (a) | 203,588 | 3,701,230 | ||||||
Sparton Corp. (a) | 1,702 | 28,287 | ||||||
Spirit Aerosystems Holdings, Inc., Class A (a) | 152,554 | 3,296,692 | ||||||
|
| |||||||
| 7,772,247 | ||||||||
Air Freight & Logistics — 0.0% | ||||||||
Atlas Air Worldwide Holdings, Inc. (a) | 1,697 | 78,775 | ||||||
Airlines — 0.1% | ||||||||
Republic Airways Holdings, Inc. (a) | 14,201 | 152,377 | ||||||
SkyWest, Inc. | 7,823 | 109,757 | ||||||
Spirit Airlines, Inc. (a) | 623 | 18,958 | ||||||
|
| |||||||
| 281,092 | ||||||||
Auto Components — 1.1% | ||||||||
Gentherm, Inc. (a) | 8,099 | 149,184 | ||||||
Remy International, Inc. | 1,731 | 31,141 | ||||||
Stoneridge, Inc. (a) | 14,170 | 158,846 | ||||||
Tower International, Inc. (a) | 2,275 | 43,020 | ||||||
Visteon Corp. (a) | 32,241 | 2,046,336 | ||||||
|
| |||||||
| 2,428,527 | ||||||||
Biotechnology — 9.7% | ||||||||
Achillion Pharmaceuticals, Inc. (a) | 259,779 | 2,166,557 | ||||||
Affymax, Inc. (a)(b) | 64,447 | 133,405 | ||||||
Alkermes Plc (a) | 6,399 | 199,969 | ||||||
Astex Pharmaceuticals, Inc. (a) | 9,836 | 47,705 | ||||||
AVEO Pharmaceuticals, Inc. (a) | 161,851 | 414,339 | ||||||
Biospecifics Technologies Corp. (a) | 123,761 | 1,966,562 | ||||||
ChemoCentryx, Inc. (a) | 10,603 | 143,247 | ||||||
China Biologic Products, Inc. (a) | 1,342 | 34,208 | ||||||
Codexis, Inc. (a) | 609 | 1,401 | ||||||
Cubist Pharmaceuticals, Inc. (a) | 13,673 | 751,331 | ||||||
Enanta Pharmaceuticals, Inc. (a) | 7,286 | 141,931 | ||||||
Enzon Pharmaceuticals, Inc. | 118,098 | 361,380 | ||||||
Gentium SpA - ADR (a)(b) | 603,758 | 5,065,530 | ||||||
Isis Pharmaceuticals, Inc. (a) | 80,698 | 1,747,112 | ||||||
KaloBios Pharmaceuticals, Inc. (a) | 4,421 | 25,023 | ||||||
Keryx Biopharmaceuticals, Inc. (a) | 336,705 | 2,697,007 | ||||||
Ligand Pharmaceuticals, Inc., Class B (a) | 2,694 | 80,578 | ||||||
LipoScience, Inc. (a) | 471 | 3,179 | ||||||
Maxygen, Inc. | 6,932 | 16,429 | ||||||
Myriad Genetics, Inc. (a) | 33,510 | 1,075,671 | ||||||
Novavax, Inc. (a) | 410,000 | 783,100 | ||||||
PDL BioPharma, Inc. | 83,518 | 689,023 | ||||||
Pharmacyclics, Inc. (a) | 7,099 | 650,552 | ||||||
Protalix BioTherapeutics, Inc. (a) | 2,889 | 14,705 | ||||||
Puma Biotechnology, Inc. (a) | 231 | 8,993 | ||||||
Repligen Corp. (a) | 35,917 | 297,393 | ||||||
Rigel Pharmaceuticals, Inc. (a) | 13,531 | 62,513 | ||||||
| Common Stocks | Shares | Value | ||||||
Biotechnology (continued) | ||||||||
Sunesis Pharmaceuticals, Inc. (a)(b) | 210,123 | $ | 1,132,563 | |||||
Tetraphase Pharmaceuticals, Inc. (a) | 5,076 | 40,608 | ||||||
Vanda Pharmaceuticals, Inc. (a) | 9,514 | 86,863 | ||||||
Verastem, Inc. (a) | 5,539 | 52,953 | ||||||
|
| |||||||
| 20,891,830 | ||||||||
Building Products — 2.1% | ||||||||
A.O. Smith Corp. | 95,424 | 3,740,621 | ||||||
Apogee Enterprises, Inc. | 2,763 | 73,717 | ||||||
Griffon Corp. | 19,590 | 226,069 | ||||||
Insteel Industries, Inc. | 1,657 | 29,677 | ||||||
PGT, Inc. (a) | 5,895 | 48,634 | ||||||
Trex Co., Inc. (a)(b) | 9,298 | 516,690 | ||||||
|
| |||||||
| 4,635,408 | ||||||||
Capital Markets — 0.5% | ||||||||
Artisan Partners Asset Management, Inc. (a) | 14,053 | 656,697 | ||||||
Capital Southwest Corp. | 241 | 33,231 | ||||||
FBR & Co. (a) | 2,699 | 65,316 | ||||||
GAMCO Investors, Inc., Class A | 1,595 | 85,093 | ||||||
GSV Capital Corp. (a) | 7,600 | 61,864 | ||||||
MCG Capital Corp. | 42,078 | 208,286 | ||||||
|
| |||||||
| 1,110,487 | ||||||||
Chemicals — 0.7% | ||||||||
A. Schulman, Inc. | 7,818 | 225,940 | ||||||
American Pacific Corp. (a) | 2,464 | 68,499 | ||||||
American Vanguard Corp. | 10,024 | 305,331 | ||||||
FutureFuel Corp. | 3,321 | 46,428 | ||||||
Kraton Performance Polymers, Inc. (a) | 33,980 | 704,745 | ||||||
Landec Corp. (a) | 1,271 | 17,845 | ||||||
Minerals Technologies, Inc. | 4,063 | 173,084 | ||||||
OM Group, Inc. (a) | 2,143 | 62,876 | ||||||
Stepan Co. | 42 | 2,269 | ||||||
|
| |||||||
| 1,607,017 | ||||||||
Commercial Banks — 1.6% | ||||||||
1st Source Corp. | 1,802 | 43,626 | ||||||
Access National Corp. | 1,546 | 19,990 | ||||||
BancFirst Corp. | 4,390 | 188,155 | ||||||
Banco Latinoamericano de Comercio Exterior SA | 3,762 | 86,263 | ||||||
Capital Bank Financial Corp., Class A (a) | 20,235 | 362,207 | ||||||
Century Bancorp, Inc., Class A | 41 | 1,455 | ||||||
Columbia Banking System, Inc. | 2,449 | 53,486 | ||||||
First Citizens BancShares, Inc., Class A | 328 | 64,705 | ||||||
FNB United Corp. (a) | 4,630 | 39,448 | ||||||
Hancock Holding Co. | 2,655 | 75,800 | ||||||
Hanmi Financial Corp. (a) | 416 | 6,548 | ||||||
Heritage Financial Corp. | 3,505 | 48,404 | ||||||
Home BancShares, Inc. | 7,013 | 295,247 | ||||||
Iberiabank Corp. | 6,959 | 358,667 | ||||||
| Portfolio Abbreviations | ||||
ADR American Depositary Receipts | ||||
See Notes to Financial Statements.
| 34 | ANNUAL REPORT | MAY 31, 2013 |
Table of Contents
| Schedule of Investments (continued) | BlackRock Master Small Cap Growth Portfolio | |||
| (Percentages shown are based on Net Assets) |
| Common Stocks | Shares | Value | ||||||
Commercial Banks (continued) | ||||||||
Independent Bank Group, Inc. (a) | 321 | $ | 9,116 | |||||
Mercantile Bank Corp. | 1,501 | 25,202 | ||||||
MetroCorp Bancshares, Inc. (a) | 4,376 | 42,797 | ||||||
National Bank Holdings Corp., Class A | 44,367 | 804,817 | ||||||
Simmons First National Corp., Class A | 2,733 | 70,320 | ||||||
Southside Bancshares, Inc. | 7,553 | 171,000 | ||||||
StellarOne Corp. | 9,923 | 155,295 | ||||||
Sterling Financial Corp. | 19,986 | 452,083 | ||||||
Texas Capital Bancshares, Inc. (a) | 1,074 | 47,428 | ||||||
Umpqua Holdings Corp. | 3,022 | 40,857 | ||||||
West Bancorporation, Inc. | 3,791 | 43,900 | ||||||
|
| |||||||
| 3,506,816 | ||||||||
Commercial Services & Supplies — 1.6% | ||||||||
ARC Document Solutions, Inc. (a) | 2,600 | 9,932 | ||||||
Consolidated Graphics, Inc. (a) | 8,257 | 385,272 | ||||||
Deluxe Corp. | 66,321 | 2,480,405 | ||||||
G&K Services, Inc., Class A | 5,248 | 253,531 | ||||||
Intersections, Inc. | 273 | 2,520 | ||||||
Kimball International, Inc., Class B | 6,722 | 65,808 | ||||||
Performant Financial Corp. (a) | 623 | 6,872 | ||||||
Schawk, Inc. | 228 | 2,702 | ||||||
Viad Corp. | 7,899 | 194,789 | ||||||
West Corp. | 6,061 | 138,797 | ||||||
|
| |||||||
| 3,540,628 | ||||||||
Communications Equipment — 1.3% | ||||||||
Anaren, Inc. (a) | 2,328 | 55,919 | ||||||
ARRIS Group, Inc. (a) | 44,408 | 671,893 | ||||||
Aviat Networks, Inc. (a) | 37,854 | 100,313 | ||||||
Bel Fuse, Inc., Class B | 1,539 | 24,501 | ||||||
Black Box Corp. | 3,244 | 87,296 | ||||||
Calix, Inc. (a) | 7,773 | 81,461 | ||||||
Ixia (a)(b) | 102,300 | 1,608,156 | ||||||
Symmetricom, Inc. (a) | 11,329 | 55,965 | ||||||
Ubiquiti Networks, Inc. | 1,574 | 29,764 | ||||||
|
| |||||||
| 2,715,268 | ||||||||
Computers & Peripherals — 1.4% | ||||||||
Super Micro Computer, Inc. (a) | 9,601 | 98,986 | ||||||
Synaptics, Inc. (a) | 69,592 | 2,871,366 | ||||||
|
| |||||||
| 2,970,352 | ||||||||
Construction & Engineering — 1.8% | ||||||||
Comfort Systems USA, Inc. | 7,698 | 106,386 | ||||||
MasTec, Inc. (a) | 19,139 | 608,620 | ||||||
Pike Electric Corp. | 44,535 | 541,100 | ||||||
Quanta Services, Inc. (a) | 89,800 | 2,547,626 | ||||||
|
| |||||||
| 3,803,732 | ||||||||
Consumer Finance — 0.1% | ||||||||
Netspend Holdings, Inc. (a) | 8,929 | 142,953 | ||||||
Regional Management Corp. (a) | 1,622 | 38,279 | ||||||
|
| |||||||
| 181,232 | ||||||||
Containers & Packaging — 0.4% | ||||||||
Boise, Inc. | 97,626 | 786,866 | ||||||
Distributors — 0.0% | ||||||||
Core-Mark Holding Co., Inc. | 291 | 17,224 | ||||||
Diversified Consumer Services — 2.0% | ||||||||
Apollo Group, Inc., Class A (a) | 31,574 | 631,164 | ||||||
Bright Horizons Family Solutions, Inc. (a) | 41,776 | 1,506,025 | ||||||
Career Education Corp. (a) | 6,875 | 20,487 | ||||||
Coinstar, Inc. (a)(b) | 32,008 | 1,864,146 | ||||||
Collectors Universe, Inc. | 3,957 | 51,599 | ||||||
National American University Holdings, Inc. | 2,699 | 10,202 | ||||||
| Common Stocks | Shares | Value | ||||||
Diversified Consumer Services (continued) | ||||||||
Weight Watchers International, Inc. | 4,680 | $ | 214,578 | |||||
|
| |||||||
| 4,298,201 | ||||||||
Diversified Telecommunication Services — 2.0% |
| |||||||
Cbeyond, Inc. (a) | 425,314 | 3,653,447 | ||||||
Fairpoint Communications, Inc. (a) | 1,795 | 15,257 | ||||||
magicJack VocalTec Ltd. (a)(b) | 30,646 | 457,545 | ||||||
Neutral Tandem, Inc. | 21,803 | 126,893 | ||||||
Premiere Global Services, Inc. (a) | 6,052 | 72,927 | ||||||
|
| |||||||
| 4,326,069 | ||||||||
Electrical Equipment — 1.3% | ||||||||
Generac Holdings, Inc. | 39,326 | 1,592,703 | ||||||
Lihua International, Inc. (a) | 10,529 | 59,173 | ||||||
LSI Industries, Inc. | 6,382 | 52,013 | ||||||
Thermon Group Holdings, Inc. (a) | 53,332 | 1,054,374 | ||||||
|
| |||||||
| 2,758,263 | ||||||||
Electronic Equipment, Instruments & Components — 1.3% |
| |||||||
Aeroflex Holding Corp. (a) | 7,223 | 57,062 | ||||||
Audience, Inc. (a) | 19,629 | 274,806 | ||||||
AVX Corp. | 1,431 | 17,143 | ||||||
Benchmark Electronics, Inc. (a) | 21,725 | 423,637 | ||||||
InvenSense, Inc. (a) | 3,699 | 47,643 | ||||||
RealD, Inc. (a) | 103,295 | 1,558,722 | ||||||
Tech Data Corp. (a) | 10,600 | 531,272 | ||||||
Vishay Precision Group, Inc. (a) | 65 | 940 | ||||||
|
| |||||||
| 2,911,225 | ||||||||
Energy Equipment & Services — 0.6% | ||||||||
Dawson Geophysical Co. (a) | 3,408 | 122,381 | ||||||
Lufkin Industries, Inc. | 10,593 | 934,938 | ||||||
Parker Drilling Co. (a) | 30,101 | 134,250 | ||||||
Tesco Corp. (a) | 442 | 5,640 | ||||||
USA Compression Partners LP | 7,801 | 173,104 | ||||||
|
| |||||||
| 1,370,313 | ||||||||
Food & Staples Retailing — 0.6% | ||||||||
Ingles Markets, Inc., Class A | 1,806 | 39,768 | ||||||
Nash Finch Co. | 2,135 | 46,394 | ||||||
Natural Grocers by Vitamin Cottage, Inc. (a) | 3,416 | 96,844 | ||||||
The Pantry, Inc. (a) | 32,561 | 407,338 | ||||||
United Natural Foods, Inc. (a) | 13,525 | 715,743 | ||||||
|
| |||||||
| 1,306,087 | ||||||||
Food Products — 1.5% | ||||||||
Annie’s, Inc. (a) | 32,293 | 1,256,521 | ||||||
Feihe International, Inc. (a) | 2,192 | 16,111 | ||||||
John B. Sanfilippo & Son, Inc. | 4,636 | 89,799 | ||||||
Lifeway Foods, Inc. | 417 | 7,302 | ||||||
Omega Protein Corp. (a) | 4,983 | 54,414 | ||||||
Pilgrim’s Pride Corp. (a) | 30,000 | 358,800 | ||||||
Sanderson Farms, Inc. | 20,817 | 1,434,708 | ||||||
Seaboard Corp. | 5 | 13,776 | ||||||
|
| |||||||
| 3,231,431 | ||||||||
Gas Utilities — 0.7% | ||||||||
Southwest Gas Corp. | 32,487 | 1,538,259 | ||||||
Health Care Equipment & Supplies — 5.6% | ||||||||
Alere, Inc. (a) | 38,152 | 975,928 | ||||||
ArthroCare Corp. (a) | 103,957 | 3,527,261 | ||||||
Conceptus, Inc. (a) | 9,893 | 306,485 | ||||||
Cutera, Inc. (a) | 6,579 | 61,908 | ||||||
Cyberonics, Inc. (a) | 5,019 | 239,456 | ||||||
GenMark Diagnostics, Inc. (a) | 63,241 | 942,291 | ||||||
Haemonetics Corp. (a)(b) | 45,093 | 1,861,439 | ||||||
See Notes to Financial Statements.
| ANNUAL REPORT | MAY 31, 2013 | 35 |
Table of Contents
| Schedule of Investments (continued) | BlackRock Master Small Cap Growth Portfolio | |||
| (Percentages shown are based on Net Assets) |
| Common Stocks | Shares | Value | ||||||
Health Care Equipment & Supplies (continued) | ||||||||
ICU Medical, Inc. (a) | 1,751 | $ | 125,004 | |||||
Medical Action Industries, Inc. (a) | 4,458 | 37,447 | ||||||
Meridian Bioscience, Inc. | 10,744 | 232,178 | ||||||
Orthofix International NV (a) | 8,627 | 238,450 | ||||||
RTI Biologics, Inc. (a) | 6,677 | 27,042 | ||||||
Solta Medical, Inc. (a) | 95,048 | 204,353 | ||||||
Spectranetics Corp. (a) | 26,235 | 490,595 | ||||||
SurModics, Inc. (a) | 15,054 | 357,382 | ||||||
Thoratec Corp. (a) | 81,962 | 2,554,756 | ||||||
Vascular Solutions, Inc. (a) | 798 | 12,106 | ||||||
|
| |||||||
| 12,194,081 | ||||||||
Health Care Providers & Services — 1.5% | ||||||||
Air Methods Corp. | 37,504 | 1,404,150 | ||||||
AMN Healthcare Services, Inc. (a) | 19,881 | 266,207 | ||||||
Cross Country Healthcare, Inc. (a) | 6,630 | 34,542 | ||||||
Five Star Quality Care, Inc. (a) | 19,254 | 98,773 | ||||||
Health Net, Inc. (a) | 3,560 | 113,457 | ||||||
PDI, Inc. (a) | 3,809 | 16,569 | ||||||
PharMerica Corp. (a) | 9,240 | 144,236 | ||||||
The Providence Service Corp. (a) | 1,853 | 48,845 | ||||||
Team Health Holdings, Inc. (a) | 341 | 13,323 | ||||||
VCA Antech, Inc. (a) | 46,094 | 1,178,163 | ||||||
|
| |||||||
| 3,318,265 | ||||||||
Health Care Technology — 0.4% | ||||||||
HealthStream, Inc. (a) | 2,320 | 62,130 | ||||||
MedAssets, Inc. (a) | 42,894 | 703,462 | ||||||
|
| |||||||
| 765,592 | ||||||||
Hotels, Restaurants & Leisure — 2.2% | ||||||||
AFC Enterprises, Inc. (a) | 18,866 | 687,854 | ||||||
Ameristar Casinos, Inc. | 9,044 | 236,953 | ||||||
Bloomin’ Brands, Inc. (a) | 32,176 | 748,414 | ||||||
Carrols Restaurant Group, Inc. (a) | 2,490 | 14,193 | ||||||
CEC Entertainment, Inc. | 8,222 | 329,291 | ||||||
Del Frisco’s Restaurant Group, Inc. (a) | 6,483 | 120,519 | ||||||
Domino’s Pizza, Inc. | 269 | 15,944 | ||||||
Einstein Noah Restaurant Group, Inc. | 1,088 | 15,232 | ||||||
Frisch’s Restaurants, Inc. | 245 | 4,099 | ||||||
Jack in the Box, Inc. (a) | 23,067 | 841,715 | ||||||
Luby’s, Inc. (a) | 533 | 4,520 | ||||||
Monarch Casino & Resort, Inc. (a) | 1,781 | 27,445 | ||||||
Red Lion Hotels Corp. (a) | 7,213 | 44,865 | ||||||
Six Flags Entertainment Corp. | 21,491 | 1,602,584 | ||||||
Speedway Motorsports, Inc. | 449 | 8,158 | ||||||
|
| |||||||
| 4,701,786 | ||||||||
Household Durables — 1.3% | ||||||||
MDC Holdings, Inc. | 8,045 | 298,550 | ||||||
NACCO Industries, Inc., Class A | 441 | 24,705 | ||||||
Taylor Morrison Home Corp., Class A (a) | 44,154 | 1,140,498 | ||||||
TRI Pointe Homes, Inc. (a) | 39,878 | 671,546 | ||||||
Zagg, Inc. (a) | 131,367 | 663,403 | ||||||
|
| |||||||
| 2,798,702 | ||||||||
Household Products — 0.0% | ||||||||
Central Garden and Pet Co. (a) | 2,781 | 21,608 | ||||||
Central Garden and Pet Co., Class A (a) | 9,393 | 71,293 | ||||||
|
| |||||||
| 92,901 | ||||||||
Insurance — 0.1% | ||||||||
eHealth, Inc. (a) | 9,121 | 224,559 | ||||||
Fortegra Financial Corp. (a) | 8,347 | 61,017 | ||||||
Hallmark Financial Services, Inc. (a) | 2,698 | 24,525 | ||||||
|
| |||||||
| 310,101 | ||||||||
| Common Stocks | Shares | Value | ||||||
Internet & Catalog Retail — 1.0% | ||||||||
1-800-Flowers.com, Inc., Class A (a) | 14,649 | $ | 89,212 | |||||
Blue Nile, Inc. (a) | 28,461 | 1,012,073 | ||||||
CafePress, Inc. (a) | 1,037 | 6,751 | ||||||
Orbitz Worldwide, Inc. (a) | 17,178 | 129,694 | ||||||
Overstock.com, Inc. (a) | 19,489 | 505,155 | ||||||
PetMed Express, Inc. | 17,481 | 234,071 | ||||||
Valuevision Media, Inc., Class A (a) | 51,948 | 262,337 | ||||||
|
| |||||||
| 2,239,293 | ||||||||
Internet Software & Services — 3.2% | ||||||||
AOL, Inc. | 1,680 | 58,229 | ||||||
Bankrate, Inc. (a) | 25,724 | 368,110 | ||||||
CoStar Group, Inc. (a) | 11,709 | 1,309,183 | ||||||
Digital River, Inc. (a) | 1,729 | 30,206 | ||||||
EarthLink, Inc. | 8 | 47 | ||||||
IntraLinks Holdings, Inc. (a) | 1,536 | 9,431 | ||||||
Keynote Systems, Inc. | 3,650 | 45,990 | ||||||
Limelight Networks, Inc. (a) | 31,205 | 73,956 | ||||||
Marin Software, Inc. (a) | 7,544 | 90,453 | ||||||
Market Leader, Inc. (a) | 6,179 | 66,115 | ||||||
Monster Worldwide, Inc. (a) | 15 | 83 | ||||||
NIC, Inc. | 233,014 | 3,895,994 | ||||||
OpenTable, Inc. (a) | 1,833 | 122,261 | ||||||
Perficient, Inc. (a) | 14,793 | 186,392 | ||||||
Responsys, Inc. (a) | 8,190 | 80,098 | ||||||
Spark Networks, Inc. (a) | 8,055 | 65,729 | ||||||
support.com, Inc. (a) | 14,631 | 69,936 | ||||||
Synacor, Inc. (a) | 9,528 | 35,921 | ||||||
Travelzoo, Inc. (a) | 4,496 | 129,215 | ||||||
United Online, Inc. | 32,059 | 218,322 | ||||||
ValueClick, Inc. (a) | 713 | 18,780 | ||||||
VistaPrint NV (a) | 1,540 | 70,763 | ||||||
Vocus, Inc. (a) | 2,122 | 18,546 | ||||||
|
| |||||||
| 6,963,760 | ||||||||
IT Services — 3.7% | ||||||||
EPAM Systems, Inc. (a)(b) | 14,654 | 339,387 | ||||||
ExlService Holdings, Inc. (a) | 183,392 | 5,378,887 | ||||||
Global Cash Access Holdings, Inc. (a) | 133,419 | 880,565 | ||||||
ModusLink Global Solutions, Inc. (a) | 11,096 | 31,846 | ||||||
WNS Holdings Ltd. — ADR (a) | 83,851 | 1,350,001 | ||||||
|
| |||||||
| 7,980,686 | ||||||||
Life Sciences Tools & Services — 0.5% | ||||||||
Albany Molecular Research, Inc. (a) | 17,373 | 191,103 | ||||||
Furiex Pharmaceuticals, Inc. (a) | 601 | 22,219 | ||||||
Harvard Bioscience, Inc. (a) | 33,203 | 168,671 | ||||||
Luminex Corp. (a) | 792 | 15,262 | ||||||
PAREXEL International Corp. (a)(b) | 13,654 | 623,851 | ||||||
|
| |||||||
| 1,021,106 | ||||||||
Machinery — 3.4% | ||||||||
ESCO Technologies, Inc. | 15,680 | 503,642 | ||||||
Federal Signal Corp. (a) | 5,051 | 44,297 | ||||||
Hyster-Yale Materials Handling, Inc. | 588 | 36,338 | ||||||
John Bean Technologies Corp. | 8,702 | 187,963 | ||||||
L.B. Foster Co., Class A | 2,348 | 104,040 | ||||||
Lindsay Corp. | 16,863 | 1,370,119 | ||||||
Luxfer Holdings Plc — ADR | 141,668 | 2,377,189 | ||||||
Lydall, Inc. (a) | 4,005 | 57,912 | ||||||
NN, Inc. (a) | 3,565 | 33,012 | ||||||
RBC Bearings, Inc. (a) | 11,739 | 574,741 | ||||||
Rexnord Corp. (a) | 1,205 | 24,028 | ||||||
Trimas Corp. (a)(b) | 49,687 | 1,602,406 | ||||||
See Notes to Financial Statements.
| 36 | ANNUAL REPORT | MAY 31, 2013 |
Table of Contents
| Schedule of Investments (continued) | BlackRock Master Small Cap Growth Portfolio | |||
| (Percentages shown are based on Net Assets) |
| Common Stocks | Shares | Value | ||||||
Machinery (continued) | ||||||||
Wabash National Corp. (a) | 35,134 | $ | 368,907 | |||||
|
| |||||||
| 7,284,594 | ||||||||
Marine — 0.1% | ||||||||
International Shipholding Corp. | 2,013 | 37,502 | ||||||
Matson, Inc. | 2,975 | 74,881 | ||||||
|
| |||||||
| 112,383 | ||||||||
Media — 3.1% | ||||||||
Arbitron, Inc. | 6,777 | 317,909 | ||||||
Central European Media Enterprises Ltd., Class A (a) | 65,877 | 220,029 | ||||||
Crown Media Holdings, Inc., Class A (a) | 28,850 | 59,143 | ||||||
CTC Media, Inc. | 166,159 | 1,983,938 | ||||||
John Wiley & Sons, Inc., Class A | 1,442 | 57,247 | ||||||
Martha Stewart Living Omnimedia, Class A (a) | 7,237 | 17,369 | ||||||
National CineMedia, Inc. | 173,479 | 2,881,486 | ||||||
Salem Communications Corp., Class A | 6,278 | 46,834 | ||||||
Starz, Class A (a) | 44,642 | 1,030,337 | ||||||
|
| |||||||
| 6,614,292 | ||||||||
Metals & Mining — 0.5% | ||||||||
Globe Specialty Metals, Inc. | 22,009 | 270,050 | ||||||
Gold Resource Corp. | 3,281 | 31,498 | ||||||
Golden Star Resources Ltd. (a) | 90,227 | 63,583 | ||||||
Schnitzer Steel Industries, Inc., Class A | 2,983 | 73,680 | ||||||
US Silica Holdings, Inc. (b) | 29,025 | 641,162 | ||||||
|
| |||||||
| 1,079,973 | ||||||||
Multi-Utilities — 0.7% | ||||||||
Avista Corp. | 39,233 | 1,047,913 | ||||||
Black Hills Corp. | 8,508 | 403,875 | ||||||
|
| |||||||
| 1,451,788 | ||||||||
Oil, Gas & Consumable Fuels — 6.3% | ||||||||
Alon USA Energy, Inc. | 39,442 | 722,183 | ||||||
Berry Petroleum Co., Class A | 16,572 | 717,733 | ||||||
Bonanza Creek Energy, Inc. (a)(b) | 91,249 | 3,389,900 | ||||||
Callon Petroleum Co. (a) | 19,369 | 72,053 | ||||||
Crimson Exploration, Inc. (a) | 23,386 | 67,352 | ||||||
CVR Energy, Inc. | 1,380 | 86,678 | ||||||
Delek US Holdings, Inc. | 56,332 | 2,029,642 | ||||||
Diamondback Energy, Inc. (a)(b) | 8,523 | 287,822 | ||||||
Energy XXI Bermuda Ltd. | 1,471 | 37,555 | ||||||
Evolution Petroleum Corp. (a) | 1,631 | 17,305 | ||||||
Gastar Exploration Ltd. (a) | 1,430 | 3,546 | ||||||
Hallador Energy Co. | 486 | 3,835 | ||||||
L&L Energy, Inc. (a) | 32,854 | 132,730 | ||||||
LinnCo LLC | 1,012 | 36,731 | ||||||
Midstates Petroleum Co., Inc. (a)(b) | 56,253 | 384,208 | ||||||
Nordic American Tankers Ltd. | 3,520 | 29,498 | ||||||
Northern Oil and Gas, Inc. (a) | 45,285 | 596,403 | ||||||
Oasis Petroleum, Inc. (a) | 55,727 | 2,070,815 | ||||||
SandRidge Mississippian Trust II | 33,635 | 425,483 | ||||||
Stone Energy Corp. (a) | 1,950 | 43,895 | ||||||
Vaalco Energy, Inc. (a) | 23,449 | 143,508 | ||||||
Warren Resources, Inc. (a) | 130,449 | 382,216 | ||||||
Western Refining, Inc. | 57,417 | 1,916,005 | ||||||
|
| |||||||
| 13,597,096 | ||||||||
Paper & Forest Products — 1.4% | ||||||||
Boise Cascade Co. (a) | 28,440 | 854,906 | ||||||
KapStone Paper and Packaging Corp. | 75,483 | 2,189,762 | ||||||
PH Glatfelter Co. | 4 | 99 | ||||||
|
| |||||||
| 3,044,767 | ||||||||
| Common Stocks | Shares | Value | ||||||
Personal Products — 0.4% | ||||||||
Nu Skin Enterprises, Inc., Class A | 444 | $ | 26,107 | |||||
Prestige Brands Holdings, Inc. (a) | 26,069 | 766,168 | ||||||
|
| |||||||
| 792,275 | ||||||||
Pharmaceuticals — 3.6% | ||||||||
Cumberland Pharmaceuticals, Inc. (a) | 21,270 | 103,159 | ||||||
Hi-Tech Pharmacal Co., Inc. | 760 | 24,290 | ||||||
Lannett Co., Inc. (a) | 16,037 | 183,944 | ||||||
The Medicines Co. (a)(b) | 91,679 | 2,952,981 | ||||||
Pain Therapeutics, Inc. | 18,189 | 48,565 | ||||||
Questcor Pharmaceuticals, Inc. | 912 | 31,163 | ||||||
Sagent Pharmaceuticals, Inc. (a) | 8,540 | 153,805 | ||||||
Santarus, Inc. (a) | 78,403 | 1,746,035 | ||||||
Sciclone Pharmaceuticals, Inc. (a) | 20,290 | 97,595 | ||||||
Transcept Pharmaceuticals, Inc. (a) | 298 | 882 | ||||||
ViroPharma, Inc. (a)(b) | 88,234 | 2,426,435 | ||||||
|
| |||||||
| 7,768,854 | ||||||||
Professional Services — 1.8% | ||||||||
The Dolan Co. (a) | 6,869 | 10,235 | ||||||
ICF International, Inc. (a) | 196 | 5,909 | ||||||
Kforce, Inc. | 30,313 | 451,361 | ||||||
On Assignment, Inc. (a) | 29,330 | 763,753 | ||||||
Resources Connection, Inc. | 11,135 | 122,040 | ||||||
RPX Corp. (a) | 25,617 | 392,965 | ||||||
WageWorks, Inc. (a) | 73,867 | 2,139,927 | ||||||
|
| |||||||
| 3,886,190 | ||||||||
Real Estate Investment Trusts (REITs) — 2.6% | ||||||||
American Assets Trust, Inc. | 627 | 20,189 | ||||||
Apollo Residential Mortgage, Inc. | 51,087 | 973,718 | ||||||
Arbor Realty Trust, Inc. | 3,882 | 26,320 | ||||||
Ashford Hospitality Trust, Inc. (b) | 30,498 | 402,879 | ||||||
Aviv REIT, Inc. | 14,232 | 368,893 | ||||||
Cedar Realty Trust, Inc. | 92,506 | 531,909 | ||||||
Chatham Lodging Trust | 2,046 | 37,953 | ||||||
Coresite Realty Corp. | 3,291 | 105,707 | ||||||
DiamondRock Hospitality Co. | 1,667 | 15,853 | ||||||
Equity One, Inc. | 14,270 | 332,919 | ||||||
One Liberty Properties, Inc. | 2,456 | 64,961 | ||||||
PS Business Parks, Inc. | 288 | 21,977 | ||||||
Ryman Hospitality Properties | 27,277 | 1,043,618 | ||||||
Sabra Health Care REIT, Inc. | 3,658 | 98,949 | ||||||
Spirit Realty Capital, Inc. | 46,773 | 938,734 | ||||||
Sunstone Hotel Investors, Inc. (a) | 44,851 | 540,903 | ||||||
|
| |||||||
| 5,525,482 | ||||||||
Real Estate Management & Development — 0.2% | ||||||||
Altisource Residential Corp. (a) | 23,374 | 426,342 | ||||||
AV Homes, Inc. (a) | 11 | 146 | ||||||
Forestar Group, Inc. (a) | 1,679 | 38,735 | ||||||
Thomas Properties Group, Inc. | 205 | 1,109 | ||||||
|
| |||||||
| 466,332 | ||||||||
Road & Rail — 2.1% | ||||||||
Marten Transport Ltd. | 2,719 | 65,229 | ||||||
Roadrunner Transportation Systems, Inc. (a)(b) | 8,312 | 230,242 | ||||||
Ryder System, Inc. | 67,116 | 4,230,993 | ||||||
|
| |||||||
| 4,526,464 | ||||||||
Semiconductors & Semiconductor Equipment — 2.9% | ||||||||
Advanced Energy Industries, Inc. (a) | 31,297 | 575,865 | ||||||
Alpha & Omega Semiconductor Ltd. (a) | 11,371 | 89,717 | ||||||
Ambarella, Inc. (a) | 41,639 | 673,303 | ||||||
Amkor Technology, Inc. (a) | 59,790 | 271,447 | ||||||
See Notes to Financial Statements.
| ANNUAL REPORT | MAY 31, 2013 | 37 |
Table of Contents
| Schedule of Investments (continued) | BlackRock Master Small Cap Growth Portfolio | |||
| (Percentages shown are based on Net Assets) |
| Common Stocks | Shares | Value | ||||||
Semiconductors & Semiconductor Equipment (continued) |
| |||||||
ASML Holding NV | 3,474 | $ | 282,250 | |||||
Entegris, Inc. (a) | 1,116 | 11,629 | ||||||
FormFactor, Inc. (a) | 6,052 | 35,646 | ||||||
Integrated Silicon Solution, Inc. (a) | 6,978 | 75,502 | ||||||
Intermolecular, Inc. (a) | 21,071 | 179,946 | ||||||
IXYS Corp. | 238 | 2,713 | ||||||
Magnachip Semiconductor Corp. (a) | 60,502 | 1,119,287 | ||||||
Micrel, Inc. | 8,667 | 86,237 | ||||||
Microsemi Corp. (a)(b) | 118,943 | 2,608,420 | ||||||
Pericom Semiconductor Corp. (a) | 6,929 | 48,572 | ||||||
Sigma Designs, Inc. (a) | 6,295 | 28,894 | ||||||
Spansion, Inc., Class A (a) | 12,935 | 177,209 | ||||||
STR Holdings, Inc. (a) | 8,893 | 26,857 | ||||||
Ultra Clean Holdings (a) | 1,050 | 6,101 | ||||||
|
| |||||||
| 6,299,595 | ||||||||
Software — 7.0% | ||||||||
Aspen Technology, Inc. (a) | 165,759 | 5,075,541 | ||||||
AVG Technologies NV (a)(b) | 46,635 | 850,156 | ||||||
Ebix, Inc. | 6,685 | 132,630 | ||||||
Fleetmatics Group Plc (a) | 56,963 | 1,694,649 | ||||||
Manhattan Associates, Inc. (a) | 582 | 43,667 | ||||||
MicroStrategy, Inc., Class A (a) | 3,920 | 358,602 | ||||||
Netscout Systems, Inc. (a)(b) | 17,844 | 434,501 | ||||||
Progress Software Corp. (a) | 11,136 | 261,807 | ||||||
PROS Holdings, Inc. (a)(b) | 148,251 | 4,288,901 | ||||||
PTC, Inc. (a) | 1,161 | 29,153 | ||||||
Rosetta Stone, Inc. (a) | 1,212 | 20,628 | ||||||
Rovi Corp. (a) | 39,713 | 1,024,595 | ||||||
Sapiens International Corp. NV | 392 | 2,031 | ||||||
Silver Spring Networks, Inc. (a) | 3,106 | 64,605 | ||||||
Take-Two Interactive Software, Inc. (a) | 33,126 | 551,217 | ||||||
Telenav, Inc. (a) | 5,307 | 27,013 | ||||||
Tyler Technologies, Inc. (a) | 690 | 47,617 | ||||||
Verint Systems, Inc. (a) | 1,498 | 50,288 | ||||||
Viggle, Inc. (Acquired 2/11/11, cost $18,142) (a)(c) | 302,362 | 108,850 | ||||||
Websense, Inc. (a) | 3,722 | 92,492 | ||||||
|
| |||||||
| 15,158,943 | ||||||||
Specialty Retail — 3.4% | ||||||||
Aaron’s, Inc. (a) | 1,551 | 43,568 | ||||||
ANN, Inc. (a) | 59,841 | 1,835,922 | ||||||
Big 5 Sporting Goods Corp. | 14,992 | 299,990 | ||||||
The Buckle, Inc. | 12,881 | 688,876 | ||||||
Chico’s FAS, Inc. | 85,341 | 1,541,258 | ||||||
The Children’s Place Retail Stores, Inc. (a)(b) | 27,263 | 1,453,936 | ||||||
Express, Inc. (a) | 2,559 | 55,786 | ||||||
Francesca’s Holdings Corp. (a) | 2,568 | 73,316 | ||||||
Haverty Furniture Cos, Inc. | 5,895 | 145,135 | ||||||
hhgregg, Inc. (a) | 2,158 | 33,643 | ||||||
Hot Topic, Inc. | 13,300 | 186,067 | ||||||
Kirkland’s, Inc. (a) | 3,549 | 53,093 | ||||||
Orchard Supply Hardware Stores Corp., Class A (a)(b) | 1,845 | 4,373 | ||||||
Pacific Sunwear of California, Inc. (a) | 2,058 | 6,771 | ||||||
rue21, inc. (a) | 3,961 | 166,322 | ||||||
Sears Hometown and Outlet Stores, Inc. (a) | 7,398 | 411,477 | ||||||
The Wet Seal, Inc., Class A (a) | 58,642 | 290,864 | ||||||
|
| |||||||
| 7,290,397 | ||||||||
Textiles, Apparel & Luxury Goods — 1.8% | ||||||||
Delta Apparel, Inc. (a) | 5,351 | 78,553 | ||||||
G-III Apparel Group Ltd. (a) | 32,739 | 1,378,639 | ||||||
Movado Group, Inc. | 41,790 | 1,508,619 | ||||||
Perry Ellis International, Inc. | 10,339 | 218,256 | ||||||
| Common Stocks | Shares | Value | ||||||
Textiles, Apparel & Luxury Goods (concluded) | ||||||||
Skechers U.S.A., Inc., Class A (a) | 35,169 | $ | 791,303 | |||||
|
| |||||||
| 3,975,370 | ||||||||
Thrifts & Mortgage Finance — 1.6% | ||||||||
EverBank Financial Corp. | 59,137 | 928,451 | ||||||
First Pactrust Bancorp, Inc. | 4,745 | 62,492 | ||||||
Flagstar Bancorp, Inc. (a) | 3,075 | 43,081 | ||||||
Heritage Financial Group, Inc. | 967 | 13,818 | ||||||
HomeStreet, Inc. | 7,527 | 172,067 | ||||||
Nationstar Mortgage Holdings, Inc. (a) | 4,723 | 192,273 | ||||||
Ocwen Financial Corp. (a) | 42,080 | 1,800,182 | ||||||
Provident Financial Holdings, Inc. | 8,743 | 133,068 | ||||||
WSFS Financial Corp. | 462 | 23,211 | ||||||
|
| |||||||
| 3,368,643 | ||||||||
Trading Companies & Distributors — 0.4% | ||||||||
Aceto Corp. | 1,438 | 18,306 | ||||||
Aircastle Ltd. (b) | 25,419 | 402,129 | ||||||
Applied Industrial Technologies, Inc. | 1,255 | 60,328 | ||||||
DXP Enterprises, Inc. (a) | 3,002 | 177,328 | ||||||
Edgen Group, Inc. (a) | 1,991 | 13,121 | ||||||
Houston Wire & Cable Co. | 6,241 | 87,436 | ||||||
MRC Global, Inc. (a) | 4,313 | 122,446 | ||||||
Watsco, Inc. | 356 | 31,061 | ||||||
Willis Lease Finance Corp. (a) | 3,171 | 42,016 | ||||||
|
| |||||||
| 954,171 | ||||||||
Water Utilities — 0.2% | ||||||||
American States Water Co. | 7,145 | 379,614 | ||||||
Wireless Telecommunication Services — 0.5% |
| |||||||
Boingo Wireless, Inc. (a) | 517 | 3,748 | ||||||
Telephone & Data Systems, Inc. | 50,098 | 1,164,779 | ||||||
|
| |||||||
| 1,168,527 | ||||||||
Total Common Stocks — 99.5% | 215,199,372 | |||||||
| Warrants (d) — 0.0% | ||||||||
Pharmaceuticals — 0.0% | ||||||||
Alexza Pharmaceuticals, Inc. (Issued/Exercisable 5/06/11, 1 Share for 1 Warrant, Expires 5/06/16, Strike Price $17.70) | 222,516 | — | ||||||
Total Long-Term Investments (Cost — $193,467,689) — 99.5% |
| 215,199,372 | ||||||
| Short-Term Securities | ||||||||
BlackRock Liquidity Funds, TempFund, Institutional Class, 0.06% (e)(f) | 3,189,995 | 3,189,995 | ||||||
| Beneficial Interest (000) | ||||||||
BlackRock Liquidity Series LLC, Money Market Series, 0.19% (e)(f)(g) | $ | 15,812 | 15,812,414 | |||||
Total Short-Term Securities (Cost — $19,002,409) — 8.8% |
| 19,002,409 | ||||||
Total Investments (Cost — $212,470,098*) — 108.3% |
| 234,201,781 | ||||||
Liabilities in Excess of Other Assets — (8.3)% |
| (18,012,671 | ) | |||||
|
| |||||||
Net Assets — 100.0% | $ | 216,189,110 | ||||||
|
| |||||||
See Notes to Financial Statements.
| 38 | ANNUAL REPORT | MAY 31, 2013 |
Table of Contents
| Schedule of Investments (continued) | BlackRock Master Small Cap Growth Portfolio |
| Notes to Schedule of Investments |
| * | As of May 31, 2013, gross unrealized appreciation and gross unrealized depreciation based on cost for federal income tax purposes were as follows: |
Tax cost | $ | 214,044,297 | ||
|
| |||
Gross unrealized appreciation | $ | 24,524,484 | ||
Gross unrealized depreciation | (4,367,000 | ) | ||
|
| |||
Net unrealized appreciation | $ | 20,157,484 | ||
|
|
| (a) | Non-income producing security. |
| (b) | Security, or a portion of security, is on loan. |
| (c) | Restricted security as to resale. As of report date, the Master Portfolio held less than 0.1% of its net assets, with a current value of $108,850 and an original cost of $18,142, in this security. |
| (d) | Warrants entitle the Master Portfolio to purchase a predetermined number of shares of common stock and are non-income producing. The purchase price and number of shares are subject to adjustment under certain conditions until the expiration date of the warrants, if any. |
| (e) | Investments in issuers considered to be an affiliate of the Master Portfolio during the year ended May 31, 2013, for purposes of Section 2(a)(3) of the Investment Company Act of 1940, as amended, were as follows: |
| Affiliate | Shares/ Beneficial Interest Held at May 31, 2012 | Net Activity | Shares/Beneficial Interest Held at May 31, 2013 | Income | ||||||||||||
BlackRock Liquidity Funds, TempFund, Institutional Class | 4,846,990 | (1,656,995 | ) | 3,189,995 | $ | 3,302 | ||||||||||
BlackRock Liquidity Series, LLC Money Market Series | $26,663,181 | $(10,850,767) | $15,812,414 | $ | 129,925 | |||||||||||
| (f) | Represents the current yield as of report date. |
| (g) | Security was purchased with the cash collateral from loaned securities. The Master Portfolio may withdraw up to 25% of its investment daily, although the manager of the BlackRock Liquidity Series, LLC Money Market Series, in its sole discretion, may permit an investor to withdraw more than 25% on any one day. |
| Ÿ | For Master Portfolio compliance purposes, the Master Portfolio’s industry classifications refer to any one or more of the industry sub-classifications used by one or more widely recognized market indexes or ratings group indexes, and/or as defined by Master Portfolio management. These definitions may not apply for purposes of this report, which may combine such industry sub-classifications for reporting ease. |
| Ÿ | Financial futures contracts as of May 31, 2013 were as follows: |
Contracts Purchased | Issue | Exchange | Expiration | Notional Value | Unrealized Depreciation | |||||||||||||||
| 15 | E-Mini Russell 2000 Futures | New York | June 2013 | $ | 1,474,650 | $ | (14,000 | ) | ||||||||||||
| Ÿ | Fair Value Measurements — Various inputs are used in determining the fair value of investments or derivative financial instruments. These inputs to valuation techniques are categorized into a disclosure hierarchy consisting of three broad levels for financial statement purposes as follows: |
| Ÿ | Level 1 — unadjusted price quotations in active markets/exchanges for identical assets or liabilities that the Master Portfolio has the ability to access |
| Ÿ | Level 2 — other observable inputs (including, but not limited to, quoted prices for similar assets or liabilities in markets that are active, quoted prices for identical or similar assets or liabilities in markets that are not active, inputs other than quoted prices that are observable for the assets or liabilities (such as interest rates, yield curves, volatilities, prepayment speeds, loss severities, credit risks and default rates) or other market–corroborated inputs) |
| Ÿ | Level 3 — unobservable inputs based on the best information available in the circumstances, to the extent observable inputs are not available (including the Master Portfolio’s own assumptions used in determining the fair value of investments and derivative financial instruments) |
The hierarchy gives the highest priority to unadjusted quoted prices in active markets for identical assets or liabilities (Level 1 measurements) and the lowest priority to unobservable inputs (Level 3 measurements). Accordingly, the degree of judgment exercised in determining fair value is greatest for instruments categorized in Level 3. The inputs used to measure fair value may fall into different levels of the fair value hierarchy. In such cases, for disclosure purposes, the fair value hierarchy classification is determined based on the lowest level input that is significant to the fair value measurement in its entirety.
Changes in valuation techniques may result in transfers into or out of an assigned level within the disclosure hierarchy. In accordance with the Master Portfolio’s policy, transfers between different levels of the fair value disclosure hierarchy are deemed to have occurred as of the beginning of the reporting period. The categorization of a value determined for investments and derivative financial instruments is based on the pricing transparency of the investment and derivative financial instrument and is not necessarily an indication of the risks associated with investing in those securities. For information about the Master Portfolio’s policy regarding valuation of investments and derivative financial instruments, please refer to Note 1 of the Notes to Financial Statements.
See Notes to Financial Statements.
| ANNUAL REPORT | MAY 31, 2013 | 39 |
Table of Contents
| Schedule of Investments (concluded) | BlackRock Master Small Cap Growth Portfolio |
The following tables summarize the Master Portfolio’s investments and derivative financial instruments categorized in the disclosure hierarchy as of May 31, 2013:
| Level 1 | Level 2 | Level 3 | Total | |||||||||||||
Assets: | ||||||||||||||||
Investments: | ||||||||||||||||
Long-Term Investments1 | $ | 215,090,522 | — | $ | 108,850 | $ | 215,199,372 | |||||||||
Short-Term Securities | 3,189,995 | $ | 15,812,414 | — | 19,002,409 | |||||||||||
Total | $ | 218,280,517 | $ | 15,812,414 | $ | 108,850 | $ | 234,201,781 | ||||||||
|
| |||||||||||||||
1 See above Schedule of Investments for values in each industry excluding Level 3, Software, within the table. | ||||||||||||||||
| Level 1 | Level 2 | Level 3 | Total | |||||||||||||
Derivative Financial Instruments2 | ||||||||||||||||
Liabilities: | ||||||||||||||||
Equity contracts | $ | (14,000 | ) | — | — | $ | (14,000 | ) | ||||||||
| 2 | Derivative financial instruments are financial futures contracts which are valued at the unrealized appreciation/depreciation on the instrument. |
Certain of the Master Portfolio’s assets and liabilities are held at carrying amount, which approximates fair value for financial statement purposes. As of May 31, 2013, such assets and liabilities are categorized within the disclosure hierarchy as follows:
| Level 1 | Level 2 | Level 3 | Total | |||||||||||||
Assets: | ||||||||||||||||
Cash | $ | 59,993 | — | — | $ | 59,993 | ||||||||||
Cash pledged for financial futures contracts | 132,000 | — | — | 132,000 | ||||||||||||
Liabilities: | ||||||||||||||||
Collateral on securities loaned at value | — | $ | (15,812,414 | ) | — | (15,812,414 | ) | |||||||||
Total | $ | 191,993 | $ | (15,812,414 | ) | — | $ | (15,620,421 | ) | |||||||
|
| |||||||||||||||
There were no transfers between levels during the year ended May 31, 2013.
See Notes to Financial Statements.
| 40 | ANNUAL REPORT | MAY 31, 2013 |
Table of Contents
| Statement of Assets and Liabilities | BlackRock Master Small Cap Growth Portfolio |
| May 31, 2013 | ||||
| Assets | ||||
Investments at value — unaffiliated (including securities loaned at value of $15,208,380) (cost — $193,467,689) | $ | 215,199,372 | ||
Investments at value — affiliated (cost — $19,002,409) | 19,002,409 | |||
Cash | 59,993 | |||
Cash pledged for financial futures contracts | 132,000 | |||
Investments sold receivable | 5,082,887 | |||
Dividends receivable — unaffiliated | 143,776 | |||
Dividends receivable — affiliated | 235 | |||
Securities lending income receivable — affiliated | 14,815 | |||
Prepaid expenses | 3,705 | |||
|
| |||
Total assets | 239,639,192 | |||
|
| |||
| Liabilities | ||||
Collateral on securities loaned at value | 15,812,414 | |||
Variation margin payable | 14,783 | |||
Investments purchased payable | 7,056,951 | |||
Withdrawals payable to investors | 401,030 | |||
Investment advisory fees payable | 98,654 | |||
Directors’ fees payable | 1,653 | |||
Other affiliates payable | 1,638 | |||
Other accrued expenses payable | 62,959 | |||
|
| |||
Total liabilities | 23,450,082 | |||
|
| |||
Net Assets | $ | 216,189,110 | ||
|
| |||
| Net Assets Consist of | ||||
Investors’ capital | $ | 194,471,427 | ||
Net unrealized appreciation/depreciation | 21,717,683 | |||
|
| |||
Net Assets | $ | 216,189,110 | ||
|
| |||
See Notes to Financial Statements.
| ANNUAL REPORT | MAY 31, 2013 | 41 |
Table of Contents
| Statement of Operations | BlackRock Master Small Cap Growth Portfolio |
| Year Ended May 31, 2013 | ||||
| Investment Income | ||||
Dividends — unaffiliated | $ | 2,538,704 | ||
Foreign taxes withheld | (1,006 | ) | ||
Securities lending — affiliated — net | 129,925 | |||
Dividends — affiliated | 3,302 | |||
|
| |||
Total income | 2,670,925 | |||
|
| |||
| Expenses | ||||
Investment advisory | 1,511,391 | |||
Accounting services | 46,872 | |||
Professional | 89,230 | |||
Custodian | 36,000 | |||
Directors | 11,435 | |||
Printing | 210 | |||
Miscellaneous | 2,722 | |||
|
| |||
Total expenses | 1,697,860 | |||
Less fees waived by Manager | (31,439 | ) | ||
|
| |||
Total expenses after fees waived | 1,666,421 | |||
|
| |||
Net investment income | 1,004,504 | |||
|
| |||
| Realized and Unrealized Gain (Loss) | ||||
Net realized gain from: | ||||
Investments | 43,727,968 | |||
Financial futures contracts | 422,180 | |||
Options written | 66,558 | |||
|
| |||
| 44,216,706 | ||||
|
| |||
Net change in unrealized appreciation/depreciation on: | ||||
Investments | 14,373,572 | |||
Financial futures contracts | (14,000 | ) | ||
|
| |||
| 14,359,572 | ||||
|
| |||
Total realized and unrealized gain | 58,576,278 | |||
|
| |||
Net Increase in Net Assets Resulting from Operations | $ | 59,580,782 | ||
|
| |||
See Notes to Financial Statements.
| 42 | ANNUAL REPORT | MAY 31, 2013 |
Table of Contents
| Statements of Changes in Net Assets | BlackRock Master Small Cap Growth Portfolio |
| Year Ended May 31, | ||||||||
| Decrease in Net Assets: | 2013 | 2012 | ||||||
| Operations | ||||||||
Net investment income (loss) | $ | 1,004,504 | $ | (1,166,331 | ) | |||
Net realized gain | 44,216,706 | 39,699,962 | ||||||
Net change in unrealized appreciation/depreciation | 14,359,572 | (86,177,287 | ) | |||||
|
| |||||||
Net increase (decrease) in net assets resulting from operations | 59,580,782 | (47,643,656 | ) | |||||
|
| |||||||
| Capital Transactions | ||||||||
Proceeds from contributions | 68,961,000 | 94,798,165 | ||||||
Value of withdrawals | (129,190,224 | ) | (334,608,497 | ) | ||||
|
| |||||||
Net decrease in net assets derived from capital transactions | (60,229,224 | ) | (239,810,332 | ) | ||||
|
| |||||||
| Net Assets | ||||||||
Total decrease in net assets | (648,442 | ) | (287,453,988 | ) | ||||
Beginning of year | 216,837,552 | 504,291,540 | ||||||
|
| |||||||
End of year | $ | 216,189,110 | $ | 216,837,552 | ||||
|
| |||||||
| Financial Highlights | BlackRock Master Small Cap Growth Portfolio |
| Year Ended May 31, | ||||||||||||||||||||
| 2013 | 2012 | 2011 | 2010 | 2009 | ||||||||||||||||
| Total Investment Return | ||||||||||||||||||||
Total investment return | 31.47 | % | (13.48 | )% | 35.13 | % | 26.12 | % | (34.16 | )% | ||||||||||
|
| |||||||||||||||||||
| Ratios to Average Net Assets | ||||||||||||||||||||
Total expenses | 0.79 | % | 0.77 | % | 0.76 | % | 0.77 | % | 0.78 | % | ||||||||||
|
| |||||||||||||||||||
Total expenses after fees waived | 0.77 | % | 0.77 | % | 0.76 | % | 0.77 | % | 0.78 | % | ||||||||||
|
| |||||||||||||||||||
Net investment income (loss) | 0.47 | % | (0.32 | )% | (0.51 | )% | (0.50 | )% | (0.13 | )% | ||||||||||
|
| |||||||||||||||||||
| Supplemental Data | ||||||||||||||||||||
Net assets, end of year (000) | $ | 216,189 | $ | 216,838 | $ | 504,292 | $ | 416,087 | $ | 356,614 | ||||||||||
|
| |||||||||||||||||||
Portfolio turnover | 165 | % | 143 | % | 127 | % | 114 | % | 75 | % | ||||||||||
|
| |||||||||||||||||||
See Notes to Financial Statements.
| ANNUAL REPORT | MAY 31, 2013 | 43 |
Table of Contents
| Notes to Financial Statements | BlackRock Master Small Cap Growth Portfolio |
1. Organization and Significant Accounting Policies:
BlackRock Master Small Cap Growth Portfolio (the “Master Portfolio”), a series of BlackRock Master LLC (the “Master LLC”), is registered under the Investment Company Act of 1940, as amended (the “1940 Act”), as a diversified, open-end management investment company. The Master Portfolio is organized as a Delaware limited liability company. The Limited Liability Company Agreement of the Master LLC permits the Board of Directors of the Master LLC (the “Board”) to issue non-transferable interests in the Master LLC, subject to certain limitations. The Master Portfolio’s financial statements are prepared in conformity with accounting principles generally accepted in the United States of America (“US GAAP”), which may require management to make estimates and assumptions that affect the reported amounts of assets and liabilities in the financial statements and the reported amounts of increases and decreases in net assets from operations during the reporting period. Actual results could differ from those estimates.
The following is a summary of significant accounting policies followed by the Master Portfolio:
Valuation: US GAAP defines fair value as the price the Master Portfolio would receive to sell an asset or pay to transfer a liability in an orderly transaction between market participants at the measurement date. The Master Portfolio determines the fair values of its financial instruments at market value using independent dealers or pricing services under policies approved by the Board. The BlackRock Global Valuation Methodologies Committee (the “Global Valuation Committee”) is the committee formed by management to develop global pricing policies and procedures and to provide oversight of the pricing function for the Master Portfolio for all financial instruments.
Equity investments traded on a recognized securities exchange or the NASDAQ Global Market System (“NASDAQ”) are valued at the last reported sale price that day or the NASDAQ official closing price, if applicable. For equity investments traded on more than one exchange, the last reported sale price on the exchange where the stock is primarily traded is used. Equity investments traded on a recognized exchange for which there were no sales on that day are valued at the last available bid price. If no bid price is available, the prior day’s price will be used, unless it is determined that such prior day’s price no longer reflects the fair value of the security. Financial futures contracts traded on exchanges are valued at their last sale price. Investments in open-end registered investment companies are valued at NAV each business day.
The Master Portfolio values its investments in BlackRock Liquidity Series, LLC Money Market Series (the “Money Market Series”) at fair value, which is ordinarily based upon its pro rata ownership in the underlying fund’s net assets. The Money Market Series seeks current income consistent with maintaining liquidity and preserving capital. Although the Money Market Series is not registered under the 1940 Act, its investments will follow the parameters of investments by a money market fund that is subject to Rule 2a-7 under the 1940 Act. The Master Portfolio may withdraw up to 25% of its investment daily, although the manager of the Money Market Series, in its sole discretion, may permit an investor to withdraw more than 25% on any one day.
Exchange-traded options are valued at the mean between the last bid and ask prices at the close of the options market in which the options trade. An exchange-traded option for which there is no mean price is valued at the last bid (long positions) or ask (short positions) price. If no bid or ask price is available, the prior day’s price will be used, unless it is determined that the prior day’s price no longer reflects the fair value of the option. Over-the-counter (“OTC”) options are valued by an independent pricing service using a mathematical model, which incorporates a number of market data factors, such as the trades and prices of the underlying instruments.
In the event that application of these methods of valuation results in a price for an investment that is deemed not to be representative of the market value of such investment, or if a price is not available, the investment will be valued by the Global Valuation Committee, or its delegate, in accordance with a policy approved by the Board as reflecting fair value (“Fair Value Assets”). When determining the price for Fair Value Assets, the Global Valuation Committee, or its delegate, seeks to determine the price that the Master Portfolio might reasonably expect to receive from the current sale of that asset in an arm’s-length transaction. Fair value determinations shall be based upon all available factors that the Global Valuation Committee, or its delegate, deem relevant consistent with the principles of fair value measurement which include the market approach, income approach and/or in the case of recent investments, cost approach, as appropriate. The market approach generally consists of using comparable market transactions. The income approach generally is used to discount future cash flows to present value and adjust for liquidity as appropriate. These factors include but are not limited to (i) attributes specific to the investment or asset; (ii) the principal market for the investment or asset; (iii) the customary participants in the principal market for the investment or asset; (iv) data assumptions by market participants for the investment or asset, if reasonably available; (v) quoted prices for similar investments or assets in active markets; and (vi) other factors, such as future cash flows, interest rates, yield curves, volatilities, prepayment speeds, loss severities, credit risks, recovery rates, liquidation amounts and/or default rates. Due to the inherent uncertainty of valuations of such investments, the fair values may differ from the values that would have been used had an active market existed. The Global Valuation Committee, or its delegate, employs various methods for calibrating valuation approaches for investments where an active market does not exist, including regular due diligence of the Master Portfolio’s pricing vendors, a regular review of key inputs and assumptions, transactional back-testing or disposition analysis to compare unrealized gains and losses to realized gains and losses, reviews of missing or stale prices and large movements in market values and reviews of any market related activity. The pricing of all Fair Value Assets is subsequently reported to the Board or a committee thereof on a quarterly basis.
Segregation and Collateralization: In cases in which the 1940 Act and the interpretative positions of the Securities and Exchange Commission (“SEC”) require that the Master Portfolio either deliver collateral or segregate assets in connection with certain investments (e.g., financial futures contracts and options written), the Master Portfolio will, consistent with SEC rules and/or certain interpretive letters issued by the SEC, segregate collateral or designate on its books and records cash or liquid
| 44 | ANNUAL REPORT | MAY 31, 2013 |
Table of Contents
| Notes to Financial Statements (continued) | BlackRock Master Small Cap Growth Portfolio |
securities having a market value at least equal to the amount that would otherwise be required to be physically segregated. Furthermore, based on requirements and agreements with certain exchanges and third party broker-dealers, the Master Portfolio engaging in such transactions may have requirements to deliver/deposit securities to/with an exchange or broker-dealer as collateral for certain investments. Typically, the Master Portfolio is permitted to sell, re-pledge or use collateral received from the counterparty, but counterparties typically are not permitted to sell, re-pledge or use the collateral they receive.
Investment Transactions and Investment Income: For financial reporting purposes, investment transactions are recorded on the dates the transactions are entered into (the trade dates). Realized gains and losses on investment transactions are determined on the identified cost basis. Dividend income is recorded on the ex-dividend dates. Dividends from foreign securities where the ex-dividend date may have passed are subsequently recorded when the Master Portfolio is informed of the ex-dividend date. Under the applicable foreign tax laws, a withholding tax at various rates may be imposed on capital gains, dividends and interest. Upon notification from issuers, some of the dividend income received from a real estate investment trust may be redesignated as a reduction of cost of the related investment and/or realized gain.
Securities Lending: The Master Portfolio may lend securities to approved borrowers, such as banks, brokers and other financial institutions. The borrower pledges cash, securities issued or guaranteed by the US government or irrevocable letters of credit issued by a bank as collateral. The initial collateral received by the Master Portfolio has a value of at least 102% of the current value of the loaned securities for securities traded on US exchanges and a value of at least 105% for all other securities. The collateral is maintained thereafter in an amount equal to at least 100% of the current market value of the loaned securities. The market value of the loaned securities is determined at the close of business of the Master Portfolio and any additional required collateral is delivered to the Master Portfolio on the next business day. Securities lending income, as disclosed in the Statement of Operations, represents the income earned from the investment of the cash collateral, net of rebates paid to, or fees paid by, borrowers and less the fees paid to the securities lending agent. During the term of the loan, the Master Portfolio earns dividend or interest income on the securities loaned but does not receive interest income on the securities received as collateral. Loans of securities are terminable at any time and the borrower, after notice, is required to return borrowed securities within the standard time period for settlement of securities transactions. The risks of securities lending include the risk that the borrower may not provide additional collateral when required or may not return the securities when due. To mitigate this risk the Master Portfolio benefits from a borrower default indemnity provided by BlackRock, Inc. (“BlackRock”). BlackRock’s indemnity allows for full replacement of securities lent. The Master Portfolio also could suffer a loss if the value of an investment purchased with cash collateral falls below the market value of loaned securities or if the value of an investment purchased with cash collateral falls below the value of the original cash collateral received. During the year ended May 31, 2013, any securities on loan were collateralized by cash.
Income Taxes: The Master Portfolio is disregarded as an entity separate from its owner for tax purposes. As such, the owner of the Master Portfolio is treated as the owner of the net assets, income, expenses and realized and unrealized gains and losses of the Master Portfolio. Therefore, no federal tax provision is required. It is intended that the Master Portfolio’s assets will be managed so the owner of the Master Portfolio can satisfy the requirements of Subchapter M of the Internal Revenue Code of 1986, as amended.
Recent Accounting Standard: In December 2011, the Financial Accounting Standards Board (the “FASB”) issued guidance that will expand current disclosure requirements on the offsetting of certain assets and liabilities. The new disclosures will be required for investments and derivative financial instruments subject to master netting or similar agreements which are eligible for offset in the Statement of Assets and Liabilities and will require an entity to disclose both gross and net information about such investments and transactions in the financial statements. In January 2013, the FASB issued guidance that clarifies which investments and transactions are subject to the offsetting disclosure requirements. The scope of the disclosure requirements for offsetting will be limited to derivative instruments, repurchase agreements and reverse repurchase agreements, and securities borrowing and securities lending transactions. The guidance is effective for financial statements with fiscal years beginning on or after January 1, 2013, and interim periods within those fiscal years. Management is evaluating the impact, if any, of this guidance on the Master Portfolio’s financial statement disclosures.
Other: Expenses directly related to the Master Portfolio are charged to the Master Portfolio. Other operating expenses shared by several funds are pro rated among those funds on the basis of relative net assets or other appropriate methods.
The Master Portfolio has an arrangement with the custodian whereby fees may be reduced by credits earned on uninvested cash balances, which, if applicable, are shown as fees paid indirectly in the Statement of Operations. The custodian imposes fees on overdrawn cash balances, which can be offset by accumulated credits earned or may result in additional custody charges.
2. Derivative Financial Instruments:
The Master Portfolio engages in various portfolio investment strategies using derivative contracts both to increase the returns of the Master Portfolio and/or to economically hedge its exposure to certain risks such as equity risk. These contracts may be transacted on an exchange or OTC.
Financial Futures Contracts: The Master Portfolio purchases and/or sells financial futures contracts to gain exposure to, or economically hedge against, changes in the value of equity securities (equity risk). Financial futures contracts are agreements between the Master Portfolio and a counterparty to buy or sell a specific quantity of an underlying instrument at a specified price and at a specified date. Depending on the terms of the particular contract, financial futures contracts are settled either through physical delivery of the underlying instrument on the settlement date or by payment of a cash settlement amount on the
| ANNUAL REPORT | MAY 31, 2013 | 45 |
Table of Contents
| Notes to Financial Statements (continued) | BlackRock Master Small Cap Growth Portfolio |
settlement date. Upon entering into a financial futures contract, the Master Portfolio is required to deposit initial margin with the broker in the form of cash or securities in an amount that varies depending on a contract’s size and risk profile. The initial margin deposit must then be maintained at an established level over the life of the contract. Securities deposited as initial margin are designated on the Schedule of Investments and cash deposited is recorded on the Statement of Assets and Liabilities as cash pledged for financial futures contracts. Pursuant to the contract, the Master Portfolio agrees to receive from or pay to the broker an amount of cash equal to the daily fluctuation in value of the contract. Such receipts or payments are known as variation margin and are recorded by the Master Portfolio as unrealized appreciation or depreciation. When the contract is closed, the Master Portfolio records a realized gain or loss equal to the difference between the value of the contract at the time it was opened and the value at the time it was closed. The use of financial futures contracts involves the risk of an imperfect correlation in the movements in the price of financial futures contracts and the underlying assets.
Options: The Master Portfolio purchases and writes call and put options to increase or decrease its exposure to underlying instruments (including equity risk) and/or, in the case of options written, to generate gains from options premiums. A call option gives the purchaser (holder) of the option the right (but not the obligation) to buy, and obligates the seller (writer) to sell (when the option is exercised), the underlying instrument at the exercise or strike price at any time or at a specified time during the option period. A put option gives the holder the right to sell and obligates the writer to buy the underlying instrument at the exercise or strike price at any time or at a specified time during the option period. When the Master Portfolio purchases (writes) an option, an amount equal to the premium paid (received) by the Master Portfolio is reflected as an asset (liability). The amount of the asset (liability) is subsequently marked-to-market to reflect the current market value of the option purchased (written). When an instrument is purchased or sold through an exercise of an option, the related premium paid (or received) is added to (or deducted from) the basis of the instrument acquired or deducted from (or added to) the proceeds of the instrument sold. When an option expires (or the Master Portfolio enters into a closing transaction), the Master Portfolio realizes a gain or loss on the option to the extent of the premiums received or paid (or gain or loss to the extent the cost of the closing transaction exceeds the premiums received or paid). When the Master Portfolio writes a call option, such option is “covered,” meaning that the Master Portfolio holds the underlying instrument subject to being called by the option counterparty. When the Master Portfolio writes a put option, such option is covered by cash in an amount sufficient to cover the obligation.
In purchasing and writing options, the Master Portfolio bears the risk of an unfavorable change in the value of the underlying instrument or the risk that the Master Portfolio may not be able to enter into a closing transaction due to an illiquid market. Exercise of a written option could result in the Master Portfolio purchasing or selling a security when it otherwise would not, or at a price different from the current market value.
The following is a summary of the Master Portfolio’s derivative financial instruments categorized by risk exposure:
| Fair Values of Derivative Financial Instruments as of May 31, 2013 | ||||||
| Derivative Liabilities | ||||||
| Statement of Assets and Liabilities Location | Value | |||||
Equity contracts | Net unrealized appreciation/depreciation1 | $ | (14,000 | ) | ||
| 1 | Includes cumulative appreciation/depreciation on financial futures contracts as reported in the Schedule of Investments. Only current day’s variation margin is reported within the Statement of Assets and Liabilities. |
The Effect of Derivative Financial Instruments in the Statement of Operations Year Ended May 31, 2013 | ||||
| Net Realized Gain (Loss) From | ||||
Equity contracts: | ||||
Financial futures contracts | $ | 422,180 | ||
Options2 | (250,232 | ) | ||
|
| |||
Total | $ | 171,948 | ||
|
| |||
| Net Change in Unrealized Appreciation/Depreciation on | ||||
Equity contracts: | ||||
Financial futures contracts | $ | (14,000 | ) | |
| 2 | Options purchased are included in the net realized loss from investments. |
For the year ended May 31, 2013, the average quarterly balances of outstanding derivative financial instruments were as follows:
Financial futures contracts: | ||||
Average number of contracts purchased | 4 | |||
Average notional value of contracts purchased | $ | 368,663 | ||
Options: | ||||
Average number of option contracts purchased. | 68 | |||
Average number of option contracts written | 111 | |||
Average notional value of option contracts purchased | $ | 5,906,250 | ||
Average notional value of option contracts written | $ | 399,300 |
A derivative contract may suffer a mark to market loss if the value of the contract decreases due to an unfavorable change in the market rates or values of the underlying instrument. Losses can also occur if the counterparty does not perform under the contract.
Options written by the Master Portfolio do not typically give rise to counterparty credit risk, as options written generally obligate the Master Portfolio, and not the counterparty, to perform.
With exchange traded purchased options and futures, there is less counterparty credit risk to the Master Portfolio since the exchange or clearinghouse, as counterparty to such instruments, guarantees against a possible default. The clearinghouse stands between the buyer and the seller of the contract; therefore, the credit risk is limited to failure of the clearinghouse. However, credit risk still exists in exchange traded futures with respect to initial and variation margin that is held in a clearing broker’s customer accounts. While clearing brokers are required to segregate customer margin from their own assets, in the event that a clearing broker becomes insolvent or goes into bankruptcy and at that time there is a shortfall in the aggregate amount of margin held by the clearing broker for all its clients, US bankruptcy laws will typically allocate that shortfall on a pro rata basis across all the clearing broker’s customers, potentially resulting in losses to the Master Portfolio.
| 46 | ANNUAL REPORT | MAY 31, 2013 |
Table of Contents
| Notes to Financial Statements (continued) | BlackRock Master Small Cap Growth Portfolio |
For financial reporting purposes, the Master Portfolio does not offset derivative assets and derivative liabilities that are subject to netting arrangements in the Statement of Assets and Liabilities.
3. Investment Advisory Agreement and Other Transactions with Affiliates:
The PNC Financial Services Group, Inc. (“PNC”) is the largest stockholder and an affiliate, for 1940 Act purposes, of BlackRock.
The Master LLC, on behalf of the Master Portfolio, entered into an Investment Advisory Agreement with BlackRock Advisors, LLC (the “Manager”), the Master Portfolio’s investment advisor, an indirect, wholly owned subsidiary of BlackRock, to provide investment advisory and administration services. The Manager is responsible for the management of the Master Portfolio and provides the necessary personnel, facilities, equipment and certain other services necessary to the operations of the Master Portfolio. For such services, the Master Portfolio pays the Manager a monthly fee based on a percentage of the Master Portfolio’s average daily net assets at the following annual rates:
| Average Daily Net Assets | Investment Advisory Fee | |||
First $1 Billion. | 0.70 | % | ||
$1 Billion - $3 Billion | 0.66 | % | ||
$3 Billion - $5 Billion | 0.63 | % | ||
$5 Billion - $10 Billion. | 0.61 | % | ||
Greater than $10 Billion | 0.60 | % | ||
Effective May 1, 2013, the Manager entered into a contractual agreement to waive 0.16% of the advisory fee payable as a percentage of the Master Portfolio’s average daily net assets until October 1, 2014. The contractual agreement may be terminated upon 90 days’ notice by a majority of the independent directors of the Master LLC or by a vote of a majority of the outstanding voting securities of the Master Portfolio. For the year ended May 31, 2013, the Manager waived $29,303 of investment advisory fees, which is included in fees waived by Manager in the Statement of Operations.
The Manager voluntarily agreed to waive its investment advisory fees by the amount of investment advisory fees the Master Portfolio pays to the Manager indirectly through its investment in affiliated money market funds. However, the Manager does not waive its investment advisory fees by the amount of investment advisory fees paid in connection with the Master Portfolio’s investment in other affiliated investment companies, if any. This amount is included in fees waived by Manager in the Statement of Operations. For the year ended May 31, 2013, the amount waived was $2,136.
The Manager entered into a sub-advisory agreement with BlackRock Capital Management, Inc. (“BCM”), an affiliate of the Manager. The Manager pays BCM, for services it provides, a monthly fee that is a percentage of the investment advisory fees paid by the Master Portfolio to the Manager.
For the year ended May 31, 2013, the Master Portfolio reimbursed the Manager $2,662 for certain accounting services, which is included in accounting services in the Statement of Operations.
The Master Portfolio received an exemptive order from the SEC permitting it, among other things, to pay an affiliated securities lending agent a fee based on a share of the income derived from the securities lending activities and has retained BlackRock Investment Management, LLC (“BIM”) as the securities lending agent. BIM may, on behalf of the Master Portfolio, invest cash collateral received by the Master Portfolio for such loans in a private investment company managed by the Manager or in registered money market funds advised by the Manager or its affiliates. The market value of securities on loan and the value of the related collateral, if applicable, is shown in the Statement of Assets and Liabilities as securities loaned at value and collateral on securities loaned at value, respectively. The cash collateral invested by BIM, if any, is disclosed in the Schedule of Investments. Securities lending income is equal to the total of income earned from the reinvestment of cash collateral, net of rebates paid to, or fees paid by, borrowers of securities. The Master Portfolio retains 65% of securities lending income and pays a fee to BIM equal to 35% of such income. The Master Portfolio benefits from a borrower default indemnity provided by BlackRock. As securities lending agent, BIM bears all operational costs directly related to securities lending as well as the cost of borrower default indemnification. BIM does not receive any fees for managing the cash collateral. The share of income earned by the Master Portfolio on the reinvestment of cash collateral is shown as securities lending — affiliated — net in the Statement of Operations. For the year ended May 31, 2013, BIM received $71,088 in securities lending agent fees related to securities lending activities for the Master Portfolio.
Certain officers and/or directors of the Master LLC are officers and/or directors of BlackRock or its affiliates.
The Master Portfolio may purchase securities from, or sell securities to, an affiliated fund provided the affiliation is due solely to having a common investment adviser, common officers, or common trustees. For the year ended May 31, 2013, the purchase and sale transactions from an affiliated fund in compliance with Rule 17a-7 of the 1940 Act were $552,322 and $12,118,782, respectively.
4. Investments:
Purchases and sales of investments excluding short-term securities for the year ended May 31, 2013, were $351,533,831 and $409,416,868, respectively.
Transactions in options written for the year ended May 31, 2013, were as follows:
| Calls | ||||||||
| Contracts | Premiums Received | |||||||
Outstanding options, beginning of year | — | — | ||||||
Options written | 953 | $ | 104,916 | |||||
Options expired. | (749 | ) | (89,619 | ) | ||||
Options closed | (204 | ) | (15,297 | ) | ||||
Outstanding options, end of year | — | — | ||||||
| ANNUAL REPORT | MAY 31, 2013 | 47 |
Table of Contents
| Notes to Financial Statements (concluded) | BlackRock Master Small Cap Growth Portfolio |
5. Borrowings:
The Master Portfolio, along with certain other funds managed by the Manager and its affiliates (“Participating Funds”), is a party to a 364-day, $800 million credit agreement with a group of lenders, under which the Master Portfolio may borrow to fund shareholder redemptions. The agreement expires in April 2014. Excluding commitments designated for a certain individual fund, other Participating Funds, including the Master Portfolio, can borrow up to an aggregate commitment amount of $500 million, subject to asset coverage and other limitations as specified in the agreement. The credit agreement has the following terms: a fee of 0.065% per annum on unused commitment amounts and interest at a rate equal to the higher of (a) the one-month LIBOR plus 0.80% per annum or (b) the Fed Funds rate plus 0.80% per annum on amounts borrowed. Participating Funds paid administration and arrangement fees, which, along with commitment fees, were allocated among such funds based upon portions of the aggregate commitment available to them and relative net assets of Participating Funds. The Master Portfolio did not borrow under the credit agreement during the year ended May 31, 2013.
6. Concentration, Market and Credit Risk:
In the normal course of business, the Master Portfolio invests in securities and enters into transactions where risks exist due to fluctuations in the market (market risk) or failure of the issuer of a security to meet all its obligations (issuer credit risk). The value of securities held by the Master Portfolio may decline in response to certain events, including those directly involving the issuers whose securities are owned by the Master Portfolio; conditions affecting the general economy; overall market changes; local, regional or global political, social or economic insta-
bility; and currency and interest rate and price fluctuations. Similar to issuer credit risk, the Master Portfolio may be exposed to counterparty credit risk, or the risk that an entity with which the Master Portfolio has unsettled or open transactions may fail to or be unable to perform on its commitments. The Master Portfolio manages counterparty credit risk by entering into transactions only with counterparties that it believes have the financial resources to honor their obligations and by monitoring the financial stability of those counterparties. Financial assets, which potentially expose the Master Portfolio to market, issuer and counterparty credit risks, consist principally of financial instruments and receivables due from counterparties. The extent of the Master Portfolio’s exposure to market, issuer and counterparty credit risks with respect to these financial assets is generally approximated by their value recorded in the Statement of Assets and Liabilities, less any collateral held by the Master Portfolio.
As of May 31, 2013, the Master Portfolio invested a significant portion of its assets in securities in the health care and information technology sectors. Changes in economic conditions affecting the health care and information technology sectors would have a greater impact on the Master Portfolio and could affect the value, income and/or liquidity of positions in such securities.
7. Subsequent Events:
Management has evaluated the impact of all subsequent events on the Master Portfolio through the date the financial statements were issued and has determined that there were no subsequent events requiring adjustment or additional disclosure in the financial statements.
| 48 | ANNUAL REPORT | MAY 31, 2013 |
Table of Contents
| Report of Independent Registered Public Accounting Firm | BlackRock Master Small Cap Growth Portfolio |
To the Investor of BlackRock Master Small Cap Growth Portfolio and Board of Directors of BlackRock Master LLC:
We have audited the accompanying statement of assets and liabilities, including the schedule of investments, of BlackRock Master Small Cap Growth Portfolio (the “Master LLC”), as of May 31, 2013, and the related statement of operations for the year then ended, the statements of changes in net assets for each of the two years in the period then ended, and the financial highlights for each of the five years in the period then ended. These financial statements and financial highlights are the responsibility of the Master LLC’s management. Our responsibility is to express an opinion on these financial statements and financial highlights based on our audits.
We conducted our audits in accordance with the standards of the Public Company Accounting Oversight Board (United States). Those standards require that we plan and perform the audit to obtain reasonable assurance about whether the financial statements and financial highlights are free of material misstatement. The Master LLC is not required to have, nor were we engaged to perform, an audit of its internal control over financial reporting. Our audits included consideration of internal control over financial reporting as a basis for designing audit procedures that are appropriate in the circumstances, but not for the purpose of
expressing an opinion on the effectiveness of the Master LLC’s internal control over financial reporting. Accordingly, we express no such opinion. An audit also includes examining, on a test basis, evidence supporting the amounts and disclosures in the financial statements, assessing the accounting principles used and significant estimates made by management, as well as evaluating the overall financial statement presentation. Our procedures included confirmation of securities owned as of May 31, 2013, by correspondence with the custodian and brokers. We believe that our audits provide a reasonable basis for our opinion.
In our opinion, the financial statements and financial highlights referred to above present fairly, in all material respects, the financial position of BlackRock Master Small Cap Growth Portfolio as of May 31, 2013, the results of its operations for the year then ended, the changes in its net assets for each of the two years in the period then ended, and the financial highlights for each of the five years in the period then ended, in conformity with accounting principles generally accepted in the United States of America.
Deloitte & Touche LLP
Philadelphia, Pennsylvania
July 25, 2013
| ANNUAL REPORT | MAY 31, 2013 | 49 |
Table of Contents
| Disclosure of Investment Advisory Agreement and Sub-Advisory Agreement |
The Board of Directors of BlackRock Master LLC (the “Master LLC”) met on April 11, 2013 (the “April Meeting”) and May 21-22, 2013 (the “May Meeting”) to consider the approval of the Master LLC’s investment advisory agreement (the “Advisory Agreement”) with BlackRock Advisors, LLC (the “Manager”), the Master LLC’s investment advisor, on behalf of BlackRock Master Small Cap Growth Portfolio (the “Master Portfolio”), a series of the Master LLC. The Board of Directors of the Master LLC also considered the approval of the sub-advisory agreement (the “Sub-Advisory Agreement”) between the Manager and BlackRock Capital Management, Inc. (the “Sub-Advisor”), with respect to the Master Portfolio. BlackRock Small Cap Growth Fund II (the “Fund”), a series of BlackRock Series, Inc. (the “Corporation”), is a “feeder” fund that invests all of its investable assets in the Master Portfolio. Accordingly, the Board of Directors of the Corporation also considered the approval of the Advisory Agreement and the Sub-Advisory Agreement with respect to the Master Portfolio. The Manager and the Sub-Advisor are referred to herein as “BlackRock.” The Advisory Agreement and the Sub-Advisory Agreement are referred to herein as the “Agreements.” For simplicity, (a) the Board of Directors of the Master LLC and the Board of Directors of the Corporation are referred to herein collectively as the “Board,” and the members are referred to as “Board Members,” and (b) the shareholders of the Fund and the interest holders of the Master Portfolio are referred to as “shareholders.”
Activities and Composition of the Board
The Board consists of fourteen individuals, twelve of whom are not “interested persons” of the Master LLC or the Corporation as defined in the Investment Company Act of 1940, as amended (the “1940 Act”) (the “Independent Board Members”). The Board Members are responsible for the oversight of the operations of the Master LLC or the Corporation, as pertinent, and perform the various duties imposed on the directors of investment companies by the 1940 Act. The Independent Board Members have retained independent legal counsel to assist them in connection with their duties. The Co-Chairs of the Board are each Independent Board Members. The Board has established five standing committees: an Audit Committee, a Governance and Nominating Committee, a Compliance Committee, a Performance Oversight and Contract Committee and an Executive Committee, each of which is chaired by an Independent Board Member and composed of Independent Board Members (except for the Executive Committee, which also has one interested Board Member).
The Agreements
Pursuant to the 1940 Act, the Board is required to consider the continuation of the Agreements on an annual basis. The Board has four quarterly meetings per year, each extending over two days, and a fifth one-day meeting to consider specific information surrounding the consideration of renewing the Agreements In connection with this process, the Board assessed, among other things, the nature, scope and quality of the services provided to the Master Portfolio and the Fund by BlackRock, its personnel and its affiliates, including investment management, administrative and shareholder services, oversight of fund accounting and custody, marketing services, risk oversight, compliance and assistance in meeting applicable legal and regulatory requirements.
The Board, acting directly and through its committees, considers at each of its meetings, and from time to time as appropriate, factors that are relevant to its annual consideration of the renewal of the Agreements, including the services and support provided by BlackRock to the Master Portfolio, the Fund and their shareholders. Among the matters the Board considered were: (a) investment performance for one-year, three-year, five-year and/or since inception periods, as applicable, against peer funds, and applicable benchmarks, if any, as well as senior management’s and portfolio managers’ analysis of the reasons for any over performance or underperformance against its peers and/or benchmark, as applicable; (b) fees, including advisory, administration, if applicable, and other amounts paid to BlackRock and its affiliates by the Master Portfolio and/or the Fund for services, such as marketing and distribution, call center and fund accounting; (c) the Master Portfolio’s and/or the Fund’s operating expenses and how BlackRock allocates expenses to the Master Portfolio and the Fund; (d) the resources devoted to, risk oversight of, and compliance reports relating to, implementation of the Master Portfolio’s and the Fund’s investment objective, policies and restrictions; (e) the Master LLC’s and the Corporation’s compliance with its respective Code of Ethics and other compliance policies and procedures; (f) the nature, cost and character of non-investment management services provided by BlackRock and its affiliates; (g) BlackRock’s and other service providers’ internal controls and risk and compliance oversight mechanisms; (h) BlackRock’s implementation of the proxy voting policies approved by the Board; (i) the use of brokerage commissions and execution quality of portfolio transactions; (j) BlackRock’s implementation of the Master LLC’s and/or the Corporation’s valuation and liquidity procedures; (k) an analysis of management fees for products with similar investment objectives across the open-end fund, exchange-traded fund (“ETF”), closed-end fund and institutional account product channels, as applicable; (l) BlackRock’s compensation methodology for its investment professionals and the incentives it creates; and (m) periodic updates on BlackRock’s business.
The Board has engaged in an ongoing strategic review with BlackRock of opportunities to consolidate funds and of BlackRock’s commitment to investment performance. In addition, the Board requested and BlackRock provided an analysis of fair valuation and stale pricing policies. BlackRock also furnished information to the Board in response to specific questions. These questions covered issues such as BlackRock’s profitability, investment performance and management fee levels. The Board further considered the importance of: (i) organizational and structural variables to investment performance; (ii) rates of portfolio turnover; (iii) BlackRock’s performance accountability for portfolio managers; (iv) marketing support for the funds; (v) services provided to the Master Portfolio/Fund by BlackRock affiliates; and (vi) BlackRock’s oversight of relationships with third party service providers.
Board Considerations in Approving the Agreements
The Approval Process: Prior to the April Meeting, the Board requested and received materials specifically relating to the Agreements. The Board is engaged in a process with its independent legal counsel and BlackRock to review the nature and scope of the information provided to better assist its deliberations. The materials provided in connection with the April Meeting included (a) information independently compiled and
| 50 | ANNUAL REPORT | MAY 31, 2013 |
Table of Contents
| Disclosure of Investment Advisory Agreement and Sub-Advisory Agreement (continued) |
prepared by Lipper, Inc. (“Lipper”) on fees and expenses of the Master Portfolio and the Fund, as applicable, as compared with a peer group of funds as determined by Lipper (“Expense Peers”) and the investment performance of the Fund as compared with a peer group of funds as determined by Lipper;1 (b) information on the profits realized by BlackRock and its affiliates pursuant to the Agreements and a discussion of fall-out benefits to BlackRock and its affiliates; (c) a general analysis provided by BlackRock concerning investment management fees charged to other clients, such as institutional clients, ETFs and closed-end funds, under similar investment mandates, as well as the performance of such other clients, as applicable; (d) review of non-management fees; (e) the existence, impact and sharing of potential economies of scale; (f) a summary of aggregate amounts paid by the Master Portfolio and/or the Fund to BlackRock; (g) sales and redemption data regarding the Fund’s shares; and (h) if applicable, a comparison of management fees to similar BlackRock open-end funds, as classified by Lipper.
At the April Meeting, the Board reviewed materials relating to its consideration of the Agreements. As a result of the discussions that occurred during the April Meeting, and as a culmination of the Board’s year-long deliberative process, the Board presented BlackRock with questions and requests for additional information. BlackRock responded to these requests with additional written information in advance of the May Meeting.
At the May Meeting, the Board of the Master LLC, including the Independent Board Members, unanimously approved the continuation of the Advisory Agreement between the Manager and the Master LLC with respect to the Master Portfolio and the Sub-Advisory Agreement between the Manager and the Sub-Advisor, with respect to the Master Portfolio, each for a one-year term ending June 30, 2014. The Board of the Corporation, including the Independent Board Members, also considered the continuation of the Agreements and found the Agreements to be satisfactory. In approving the continuation of the Agreements, the Board of the Master LLC considered: (a) the nature, extent and quality of the services provided by BlackRock; (b) the investment performance of the Master Portfolio, the Fund and BlackRock; (c) the advisory fee and the cost of the services and profits to be realized by BlackRock and its affiliates from their relationship with the Master Portfolio and the Fund; (d) economies of scale; (e) fall-out benefits to BlackRock as a result of its relationship with the Master Portfolio and the Fund; and (f) other factors deemed relevant by the Board Members.
The Board also considered other matters it deemed important to the approval process, such as payments made to BlackRock or its affiliates relating to the distribution of Fund shares and securities lending, services related to the valuation and pricing of portfolio holdings of the Master Portfolio, direct and indirect benefits to BlackRock and its affiliates from their relationship with the Master Portfolio and the Fund and advice from independent legal counsel with respect to the review process and materials submitted for the Board’s review.
| 1 | Lipper ranks funds in quartiles, ranging from first to fourth, where first is the most desirable quartile position and fourth is the least desirable. |
The Board noted the willingness of BlackRock personnel to engage in open, candid discussions with the Board. The Board did not identify any particular information as determinative, and each Board Member may have attributed different weights to the various items considered.
A. Nature, Extent and Quality of the Services Provided by BlackRock:
The Board, including the Independent Board Members, reviewed the nature, extent and quality of services provided by BlackRock, including the investment advisory services and the resulting performance of the Fund. Throughout the year, the Board compared the Fund’s performance to the performance of a comparable group of mutual funds and/or the performance of a relevant benchmark, if any. The Board met with BlackRock’s senior management personnel responsible for investment operations, including the senior investment officers. The Board also reviewed the materials provided by the Master Portfolio’s portfolio management team discussing the Master Portfolio’s performance and the Master Portfolio’s investment objective, strategies and outlook.
The Board considered, among other factors, with respect to BlackRock: the number, education and experience of investment personnel generally and the Master Portfolio’s portfolio management team; investments by portfolio managers in the funds they manage; portfolio trading capabilities; use of technology; commitment to compliance; credit analysis capabilities; risk analysis and oversight capabilities; and the approach to training and retaining portfolio managers and other research, advisory and management personnel. The Board engaged in a review of BlackRock’s compensation structure with respect to the Master Portfolio’s portfolio management team and BlackRock’s ability to attract and retain high-quality talent and create performance incentives.
In addition to advisory services, the Board considered the quality of the administrative and non-investment advisory services provided to the Master Portfolio and the Fund. BlackRock and its affiliates provide the Master Portfolio and the Fund with certain administrative, shareholder and other services (in addition to any such services provided to the Master Portfolio and the Fund by third parties) and officers and other personnel as are necessary for the operations of the Master Portfolio and the Fund. In particular, BlackRock and its affiliates provide the Master Portfolio and the Fund with the following administrative services, including, among others: (i) preparing disclosure documents, such as the prospectus, the summary prospectus (as applicable), the statement of additional information and periodic shareholder reports; (ii) assisting with daily accounting and pricing; (iii) overseeing and coordinating the activities of other service providers; (iv) organizing Board meetings and preparing the materials for such Board meetings; (v) providing legal and compliance support; and (vi) performing other administrative functions necessary for the operation of the Master Portfolio and the Fund, such as tax reporting, fulfilling regulatory filing requirements and call center services. The Board reviewed the structure and duties of BlackRock’s fund administration, shareholder services, legal and compliance departments and considered BlackRock’s policies and procedures for assuring compliance with applicable laws and regulations.
B. The Investment Performance of the Master Portfolio, the Fund and BlackRock:
The Board, including the Independent Board Members, also reviewed and considered the performance history of the Master Portfolio
| ANNUAL REPORT | MAY 31, 2013 | 51 |
Table of Contents
| Disclosure of Investment Advisory Agreement and Sub-Advisory Agreement (continued) |
and the Fund, as applicable. The Board noted that the Fund’s investment results correspond directly to the investment results of the Master Portfolio. In preparation for the April Meeting, the Board worked with its independent counsel, BlackRock and Lipper to develop a template for, and was provided with, reports independently prepared by Lipper, which included a comprehensive analysis of the Fund’s performance. The Board also reviewed a narrative and statistical analysis of the Lipper data that was prepared by BlackRock, which analyzed various factors that affect Lipper’s rankings. In connection with its review, the Board received and reviewed information regarding the investment performance of the Fund as compared to other funds in its applicable Lipper category. The Board was provided with a description of the methodology used by Lipper to select peer funds and periodically meets with Lipper representatives to review its methodology. The Board and its Performance Oversight and Contract Committee regularly review, and meet with Master Portfolio management to discuss, the performance of the Master Portfolio and the Fund, as applicable, throughout the year.
The Board noted that the Fund ranked in the fourth, fourth and third quartiles against its Lipper Performance Universe for the one-, three- and five-year periods reported, respectively. The Board and BlackRock reviewed and discussed the reasons for the Fund’s underperformance during these periods compared to its Lipper Performance Universe. The Board was informed that, among other things, the six-month period in the middle of 2010 detracted from performance, which affected the three- and five-year periods. A number of factors affected performance in 2010, the most significant being poor stock selection within the consumer discretionary sector. Additionally, the Fund had significant underperformance during the fourth quarter of 2012 due to an overweight in the healthcare sector.
The Board and BlackRock also discussed BlackRock’s strategy for improving the Master Portfolio’s/Fund’s performance and BlackRock’s commitment to providing the resources necessary to assist the Master Portfolio’s portfolio managers and to improve the Master Portfolio’s/ Fund’s performance. BlackRock and the Board concurred, given the Master Portfolio’s/Fund’s poor historical performance, in changing the portfolio management team effective May 2013. Both BlackRock and the Board are hopeful that the change in portfolio management will result in improved performance going forward, although there can be no assurance that will be the case. The Board will continue to monitor the Master Portfolio’s/Fund’s performance.
The Board noted that BlackRock has recently made, and continues to make, changes to the organization of BlackRock’s overall portfolio management structure designed to result in strengthened leadership teams.
C. Consideration of the Advisory/Management Fees and the Cost of the Services and Profits to be Realized by BlackRock and its Affiliates from their Relationship with the Master Portfolio and the Fund: The Board, including the Independent Board Members, reviewed the Master Portfolio’s/Fund’s contractual management fee rate compared with the other funds in the Fund’s Lipper category. The contractual management fee rate represents a combination of the advisory fee and any administrative fees, before taking into account any reimbursements of fee waivers. The Board also compared the Fund’s total net operating expense
ratio, as well as the Master Portfolio’s/Fund’s actual management fee rate, to those of other funds in the Fund’s Lipper category. The total net operating expense ratio and actual management fee rate gives effect to any expense reimbursements or fee waivers that benefit the funds. The Board considered the services provided and the fees charged by BlackRock to other types of clients with similar investment mandates, including institutional accounts.
The Board received and reviewed statements relating to BlackRock’s financial condition. The Board was also provided with a profitability analysis that detailed the revenues earned and the expenses incurred by BlackRock for services provided to the Master Portfolio and the Fund. The Board reviewed BlackRock’s profitability with respect to the Master Portfolio and the Fund, as applicable, and other funds the Board currently oversees for the year ended December 31, 2012 compared to available aggregate profitability data provided for the two prior years. The Board reviewed BlackRock’s profitability with respect to certain other fund complexes managed by the Manager and/or its affiliates. The Board reviewed BlackRock’s assumptions and methodology of allocating expenses in the profitability analysis, noting the inherent limitations in allocating costs among various advisory products. The Board recognized that profitability may be affected by numerous factors including, among other things, fee waivers and expense reimbursements by the Manager, the types of funds managed, precision of expense allocations and business mix. As a result, comparing profitability is difficult.
The Board noted that, in general, individual fund or product line profitability of other advisors is not publicly available. The Board reviewed BlackRock’s overall operating margin, in general, compared to that of certain other publicly-traded asset management firms. The Board considered the differences between BlackRock and these other firms, including the contribution of technology at BlackRock, BlackRock’s expense management and the relative product mix.
In addition, the Board considered the cost of the services provided to the Master Portfolio and the Fund by BlackRock, and BlackRock’s and its affiliates’ profits relating to the management and distribution of the Master Portfolio and the Fund and the other funds advised by BlackRock and its affiliates. As part of its analysis, the Board reviewed BlackRock’s methodology in allocating its costs to the management of the Master Portfolio and the Fund. The Board also considered whether BlackRock has the financial resources necessary to attract and retain high quality investment management personnel to perform its obligations under the Agreements and to continue to provide the high quality of services that is expected by the Board.
The Board noted that the Master Portfolio’s/Fund’s contractual management fee rate ranked in the third quartile relative to the Fund’s Expense Peers. The Board determined that the Master Portfolio’s/Fund’s contractual management fee rate was reasonable relative to the median contractual management fee rate paid by the Fund’s Expense Peers. The Board also noted that the Master Portfolio has an advisory fee arrangement that includes breakpoints that adjust the fee rate downward as the size of the Master Portfolio increases above certain contractually specified levels. Additionally, the Board noted that BlackRock has contractually agreed to waive a portion of the advisory fee for the Master Portfolio.
| 52 | ANNUAL REPORT | MAY 31, 2013 |
Table of Contents
| Disclosure of Investment Advisory Agreement and Sub-Advisory Agreement (continued) |
D. Economies of Scale: The Board, including the Independent Board Members, considered the extent to which economies of scale might be realized as the assets of the Master Portfolio and the Fund increase, as well as the existence of expense caps, as applicable. The Board also considered the extent to which the Master Portfolio and the Fund benefit from such economies and whether there should be changes in the advisory fee rate or breakpoint structure in order to enable the Master Portfolio and the Fund to participate in these economies of scale, for example through the use of revised breakpoints in the advisory fee based upon the asset level of the Master Portfolio. In its consideration, the Board took into account the existence of expense caps and further considered the continuation and/or implementation, as applicable, of such caps.
E. Other Factors Deemed Relevant by the Board Members: The Board, including the Independent Board Members, also took into account other ancillary or “fall-out” benefits that BlackRock or its affiliates may derive from their respective relationships with the Master Portfolio and the Fund, both tangible and intangible, such as BlackRock’s ability to leverage its investment professionals who manage other portfolios and risk management personnel, an increase in BlackRock’s profile in the investment advisory community, and the engagement of BlackRock’s affiliates as service providers to the Master Portfolio and the Fund, including for administrative, distribution, securities lending and cash management services. The Board also considered BlackRock’s overall operations and its efforts to expand the scale of, and improve the quality of, its operations. The Board also noted that BlackRock may use and benefit from third party research obtained by soft dollars generated by certain registered fund transactions to assist in managing all or a number of its other client accounts. The Board further noted that it had considered the investment by BlackRock’s funds in ETFs without any offset against the management fees payable by the funds to BlackRock.
In connection with its consideration of the Agreements, the Board also received information regarding BlackRock’s brokerage and soft dollar practices. The Board received reports from BlackRock which included information on brokerage commissions and trade execution practices throughout the year.
The Board noted the competitive nature of the open-end fund marketplace, and that shareholders are able to redeem their Fund shares if they believe that the Fund’s and/or the Master Portfolio’s fees and expenses are too high or if they are dissatisfied with the performance of the Fund.
Conclusion
The Board of the Master LLC, including the Independent Board Members, unanimously approved the continuation of the Advisory Agreement between the Manager and the Master LLC, with respect to the Master Portfolio, for a one-year term ending June 30, 2014 and the Sub-Advisory Agreement between the Manager and the Sub-Advisor, with respect to the Master Portfolio, for a one-year term ending June 30, 2014. Based upon its evaluation of all of the aforementioned factors in their totality, the Board of the Master LLC, including the Independent Board Members, was satisfied that the terms of the Agreements were fair and reasonable and in the best interest of the Master Portfolio and its shareholders. The Board of the Corporation, including the Independent
Board Members, also considered the continuation of the Agreements with respect to the Master Portfolio and found the Agreements to be satisfactory. In arriving at its decision to approve the Agreements, the Board of the Master LLC did not identify any single factor or group of factors as all-important or controlling, but considered all factors together, and different Board Members may have attributed different weights to the various factors considered. The Independent Board Members were also assisted by the advice of independent legal counsel in making this determination. The contractual fee arrangements for the Master Portfolio reflect the results of several years of review by the Board Members and predecessor Board Members, and discussions between such Board Members (and predecessor Board Members) and BlackRock. As a result, the Board Members’ conclusions may be based in part on their consideration of these arrangements in prior years.
| ANNUAL REPORT | MAY 31, 2013 | 53 |
Table of Contents
| Disclosure of Investment Advisory Agreement and Sub-Advisory Agreement (continued) |
The Board of Trustees (the “Board,” and the members of which are referred to as “Board Members”) of BlackRock FundsSM (the “Trust”) met in person on November 30, 2012 (the “Meeting”) to consider the approval of the Trust’s proposed investment advisory agreement (the “Advisory Agreement”) with BlackRock Advisors, LLC (the “Manager”) on behalf of BlackRock Disciplined Small Cap Core Fund (the “Fund”), a portfolio of the Trust. The Advisory Agreement was the same agreement that had previously been approved by the Board with respect to other portfolios of the Trust. The Board also considered the approval of the sub-advisory agreement between the Manager and BlackRock Fund Advisors (the “Sub-Advisor”) with respect to the Fund (the “Sub-Advisory Agreement”). The Sub-Advisory Agreement was substantially the same as the sub-advisory agreements previously approved with respect to certain other portfolios of the Trust. The Manager and the Sub-Advisor are referred to herein as “BlackRock.” The Advisory Agreement and the Sub-Advisory Agreement are referred to herein as the “Agreements.” The Fund commenced operations in March 2013.
Activities and Composition of the Board
The Board consists of fourteen individuals, twelve of whom are not “interested persons” of the Trust or the Fund as defined in the Investment Company Act of 1940, as amended (the “1940 Act”) (the “Independent Board Members”). The Board Members are responsible for the oversight of the operations of the Trust and perform the various duties imposed on the directors of investment companies by the 1940 Act. The Independent Board Members have retained independent legal counsel to assist them in connection with their duties. The Co-Chairs of the Board are each Independent Board Members. The Board has established five standing committees: an Audit Committee, a Governance and Nominating Committee, a Compliance Committee, a Performance Oversight and Contract Committee and an Executive Committee, each of which is chaired by an Independent Board Member and composed of Independent Board Members (except for the Executive Committee, which also has one interested Board Member).
The Agreements
Pursuant to the 1940 Act, the Board is required to consider the initial approval of the Agreements. In connection with this process, the Board assessed, among other things, the nature, scope and quality of the services to be provided to the Fund by BlackRock, its personnel and its affiliates, including investment management, administrative and shareholder services, oversight of fund accounting and custody, marketing services, risk oversight, compliance and assistance in meeting applicable legal and regulatory requirements.
Board Considerations in Approving the Agreements
The Approval Process: At the Meeting, the Board reviewed materials relating to its consideration of the Agreements. The Board considered all factors it believed relevant with respect to the Trust and the Fund, including, among other factors: (a) the nature, extent and quality of the services to be provided by BlackRock; (b) the investment performance of BlackRock portfolio management; (c) the advisory fee and the cost of the services to be provided and profits to be realized by BlackRock and its affiliates from their relationship with the Fund; (d) review of non-management fees; (e) economies of scale; (f) fall out benefits to
BlackRock as a result of its relationship with the Fund; (g) possible alternatives to the proposed Agreements; (h) the policies and practices of BlackRock with respect to portfolio transactions for the Fund; and (i) other factors deemed relevant by the Board Members.
In determining whether to approve the Agreements, the Board met with the relevant investment advisory personnel from BlackRock and considered all information it deemed reasonably necessary to evaluate the terms of the Agreements. The Board received materials in advance of the Meeting relating to its consideration of the Agreements, including (a) fees and estimated expense ratios of each class of the Fund, and for a representative class of the Fund, in comparison to the fees and expense ratios of a peer group of funds; (b) information regarding BlackRock’s economic outlook for the Fund and its general investment outlook for the markets; (c) information regarding fees paid to service providers that are affiliates of BlackRock; and (d) information outlining the legal duties of the Board under the 1940 Act with respect to the consideration and approval of the Agreements. The Board also noted information received at prior Board meetings concerning compliance records and regulatory matters relating to BlackRock.
The Board also considered other matters it deemed important to the approval process, such as services related to the valuation and pricing of Fund portfolio holdings, direct and indirect benefits to BlackRock and its affiliates from their relationship with the Fund and advice from independent legal counsel with respect to the review process and materials submitted for the Board’s review. The Board noted the willingness of BlackRock personnel to engage in open, candid discussions with the Board. The Board did not identify any particular information as determinative, and each Board Member may have attributed different weights to the various items considered.
A. Nature, Extent and Quality of the Services Provided by BlackRock: The Board, including the Independent Board Members, reviewed the nature, extent and quality of services to be provided by BlackRock, including the investment advisory services to be provided to the Fund. The Board received information concerning the investment philosophy and investment process to be used by BlackRock in managing the Fund, as well as a description of the capabilities, personnel and services of BlackRock. In connection with this review, the Board considered BlackRock’s in-house research capabilities as well as other resources available to its personnel. The Board considered the scope of the services provided by BlackRock to the Fund under the Agreements relative to services typically provided by third parties to other funds. The Board noted that the standard of care applicable under the Agreements was comparable to that found generally in investment company advisory agreements. The Board concluded that the scope of BlackRock’s services to be provided to the Fund was consistent with the Fund’s operational requirements, including, in addition to seeking to meet its investment objective, compliance with investment restrictions, tax and reporting requirements and related shareholder services.
The Board, including the Independent Board Members, also considered the quality of the administrative and non-investment advisory services to be provided by BlackRock and its affiliates to the Fund. The Board evaluated the procedures of BlackRock designed to fulfill its fiduciary duty to
| 54 | ANNUAL REPORT | MAY 31, 2013 |
Table of Contents
| Disclosure of Investment Advisory Agreement and Sub-Advisory Agreement (continued) |
the Fund with respect to possible conflicts of interest, including BlackRock’s code of ethics (regulating the personal trading of BlackRock’s officers and employees), the procedures by which BlackRock allocates trades among its various investment advisory clients, the integrity of the systems in place to ensure compliance with the foregoing and the record of BlackRock in these matters. The Board also noted information received at prior Board meetings concerning standards of BlackRock with respect to the execution of portfolio transactions.
The Board considered, among other factors, with respect to BlackRock: the number, education and experience of investment personnel generally and the Fund’s portfolio management team; investments by portfolio managers in the funds they manage; portfolio trading capabilities; use of technology; commitment to compliance; credit analysis capabilities; risk analysis and oversight capabilities; and the approach to training and retaining portfolio managers and other research, advisory and management personnel. The Board reviewed BlackRock’s compensation structure with respect to the Fund’s portfolio management team and BlackRock’s ability to attract and retain high-quality talent and create performance incentives. The Board also considered the business reputation of BlackRock and its financial resources and concluded that BlackRock would be able to meet any reasonably foreseeable obligation under the Agreements.
In addition to advisory services, the Board considered the quality of the administrative and other non-investment advisory services to be provided to the Fund. The Board noted that BlackRock and its affiliates will provide the Fund with certain administrative, shareholder and other services (in addition to any such services provided to the Fund by third parties) and officers and other personnel as are necessary for the operations of the Fund. In particular, BlackRock and its affiliates will provide the Fund with the following administrative services, including, among others: (i) preparing disclosure documents, such as the prospectus, the summary prospectus, the statement of additional information and periodic shareholder reports; (ii) assisting with daily accounting and pricing; (iii) overseeing and coordinating the activities of other service providers; (iv) organizing Board meetings and preparing the materials for such Board meetings; (v) providing legal and compliance support; and (vi) performing other administrative functions necessary for the operation of the Fund, such as tax reporting, fulfilling regulatory filing requirements and call center services. The Board reviewed the structure and duties of BlackRock’s fund administration, shareholder services, legal and compliance departments and considered BlackRock’s policies and procedures for assuring compliance with applicable laws and regulations.
B. The Investment Performance of the Fund and BlackRock: The Board, including the Independent Board Members, previously received and considered information about BlackRock’s investment performance for other funds. The Board, however, did not consider the performance history of the Fund because the Fund was newly organized and had not yet commenced operations as of the date of the Meeting.
C. Consideration of the Advisory/Management Fees and the Cost of the Services and Profits to be Realized by BlackRock and its Affiliates from their Relationship with the Fund: In connection with the initial approval
of the Agreements, the Board, including the Independent Board Members, reviewed the Fund’s contractual management fee rate compared with the other funds in the Fund’s peer group of funds. The contractual management fee rate represents a combination of the advisory fee and any administrative fees, before taking into account any reimbursements of fee waivers. Both the peer group and the funds within the peer group (collectively, “Expense Peers”) were selected by Lipper, Inc. (“Lipper”)1, which is not affiliated with BlackRock. The Board also compared the Fund’s estimated total net operating expense ratio, as well as the Fund’s estimated actual management fee rate, to those of its Peers. The total net operating expense ratio and the actual management fee rate gives effect to any expense reimbursements or fee waivers that benefit the funds. The Board noted that the Fund has an advisory fee arrangement that includes breakpoints that adjust the fee rate downward as the size of the Fund increases above certain contractually specified levels. The Board further considered the contractual cap in place on the Fund’s total net operating expenses on a class-by-class basis. Additionally, the Board noted information received at prior Board meetings concerning the services rendered, and the fee rates offered, to other clients advised by BlackRock.
The Board noted that the Fund’s contractual management fee rate ranked in the first quartile relative to the Fund’s Expense Peers
Following consideration of this information, the Board, including the Independent Board Members, concluded that the fees to be paid pursuant to the Agreements were fair and reasonable in light of the services provided.
As the Fund had not commenced operations as of the date of the Meeting, BlackRock was not able to provide the Board with specific information concerning the expected profits to be realized by BlackRock and its affiliates from their relationships with the Fund. BlackRock, however, will provide the Board with such information at future meetings.
D. Economies of Scale: The Board, including the Independent Board Members, considered the extent to which economies of scale might be realized in respect of the management of the Fund in tandem with other portfolios of the Trust. Since the Fund is newly formed, BlackRock was not able to provide the Board with specific information concerning the extent to which economies of scale would be realized as the Fund grows and whether fee levels would reflect such economies of scale, if any.
E. Other Factors Deemed Relevant by the Board Members: The Board, including the Independent Board Members, also took into account other ancillary or “fall-out” benefits that BlackRock or its affiliates may derive from their respective relationships with the Fund, both tangible and intangible, such as BlackRock’s ability to leverage its investment professionals who manage other portfolios and risk management personnel, an increase in BlackRock’s profile in the investment advisory community, and the engagement of BlackRock’s affiliates as service providers to the Fund, including for administrative, distribution, securities lending and
| 1 | Lipper ranks funds in quartiles, ranging from first to fourth, where first is the most desirable quartile position and fourth is the least desirable. |
| ANNUAL REPORT | MAY 31, 2013 | 55 |
Table of Contents
| Disclosure of Investment Advisory Agreement and Sub-Advisory Agreement (concluded) |
cash management services. The Board also considered BlackRock’s overall operations and its efforts to expand the scale of, and improve the quality of, its operations. The Board also noted that BlackRock may use and benefit from third party research obtained by soft dollars generated by certain registered fund transactions to assist in managing all or a number of its other client accounts. The Board further noted that it had considered the investment by BlackRock’s funds in ETFs without any offset against the management fees payable by the funds to BlackRock.
The Board, including all of the Independent Board Members, concluded that these ancillary benefits that BlackRock and its affiliates could receive with regard to providing investment advisory and other services to the Fund were consistent with those generally available to other mutual fund sponsors.
The Board noted the competitive nature of the open-end fund marketplace, and that shareholders would be able to redeem their Fund shares if they believe that the Fund’s fees and expenses are too high or if they are dissatisfied with the performance of the Fund.
Conclusion
The Board, including the Independent Board Members, unanimously approved (i) the Advisory Agreement between the Manager and the Trust on behalf of the Fund and (ii) the Sub-Advisory Agreement between the Manager and the Sub-Advisor with respect to the Fund, each for a two-year term beginning on the effective date of the Agreements. Based upon its evaluation of all of the aforementioned factors in their totality, the Board, including the Independent Board Members, was satisfied that the terms of the Agreements were fair and reasonable and in the best interest of the Fund and its shareholders. In arriving at a decision to approve the Agreements, the Board did not identify any single factor or group of factors as all-important or controlling, but considered all factors together, and different Board Members may have attributed different weights to the various factors considered. The Independent Board Members were also assisted by the advice of independent legal counsel in making this determination.
| 56 | ANNUAL REPORT | MAY 31, 2013 |
Table of Contents
| Officers and Directors/Trustees |
Name, Address, and Year of Birth | Position(s) Held with Corporation/ Master LLC/ Trust | Length of Time Served as a Director/ Trustee2 | Principal Occupation(s) During Past 5 Years | Number of BlackRock- Advised Registered Investment Companies (“RICs”) Consisting of Investment Portfolios (“Portfolios”) Overseen | Public Directorships | |||||
| Independent Directors/Trustees1 | ||||||||||
Ronald W. Forbes 55 East 52nd Street New York, NY 10055 1940 | Co-Chairman of the Board and Director/Trustee | Since 2007 | Professor Emeritus of Finance, School of Business, State University of New York at Albany since 2000. | 33 RICs consisting of 108 Portfolios | None | |||||
Rodney D. Johnson 55 East 52nd Street New York, NY 10055 1941 | Co-Chairman of the Board and Director/Trustee | Since 2007 | President, Fairmount Capital Advisors, Inc. since 1987; Member of the Archdiocesan Investment Committee of the Archdiocese of Philadelphia from 2004 to 2012; Director, The Committee of Seventy (civic) from 2006 to 2012; Director, Fox Chase Cancer Center from 2004 to 2011. | 33 RICs consisting of 108 Portfolios | None | |||||
David O. Beim 55 East 52nd Street New York, NY 10055 1940 | Director/Trustee | Since 2007 | Professor of Professional Practice at the Columbia University Graduate School of Business since 1991; Trustee, Phillips Exeter Academy from 2002 to 2012; Chairman, Wave Hill, Inc. (public garden and cultural center) from 1990 to 2006. | 33 RICs consisting of 108 Portfolios | None | |||||
Dr. Matina S. Horner 55 East 52nd Street New York, NY 10055 1939 | Director/Trustee | Since 2004 | Executive Vice President of Teachers Insurance and Annuity Association and College Retirement Equities Fund from 1989 to 2003. | 33 RICs consisting of 108 Portfolios | NSTAR (electric and gas utility) | |||||
Herbert I. London 55 East 52nd Street New York, NY 10055 1939 | Director/Trustee | Since 2007 | Professor Emeritus, New York University since 2005; John M. Olin Professor of Humanities, New York University from 1993 to 2005 and Professor thereof from 1980 to 2005; President Emeritus, Hudson Institute (policy research organization) from 2011 to 2012, President thereof from 1997 to 2011 and Trustee from 1980 to 2012; Chairman of the Board of Trustees for Grantham University since 2006; Director, InnoCentive, Inc. since 2005; Director, Cerego, LLC (educational software) since 2005; Director Cybersettle (online adjudication) since 2009; Director, AIMS Worldwide, Inc. from 2007 to 2012. | 33 RICs consisting of 108 Portfolios | None | |||||
Ian A. MacKinnon 55 East 52nd Street New York, NY 10055 1948 | Director/Trustee | Since 2012 | Director, Kennett Capital, Inc. (investments) since 2006; Director, Free Library of Philadelphia from 1999 to 2008. | 33 RICs consisting of 108 Portfolios | None | |||||
Cynthia A. Montgomery 55 East 52nd Street New York, NY 10055 1952 | Director/Trustee | Since 2007 | Professor, Harvard Business School since 1989; Director, McLean Hospital from 2005 to 2012; Director, Harvard Business School Publishing from 2005 to 2010. | 33 RICs consisting of 108 Portfolios | Newell Rubbermaid, Inc. (manufacturing) | |||||
Joseph P. Platt 55 East 52nd Street New York, NY 10055 1947 | Director/Trustee | Since 2007 | Director, Jones and Brown (Canadian insurance broker) since 1998; Director, The West Penn Allegheny Health System (a not-for-profit health system) since 2008; General Partner, Thorn Partners, LP (private investment) since 1998; Director, WQED Multi-Media (public broadcasting not-for-profit) since 2001; Partner, Amarna Corporation, LLC (private investment company) from 2002 to 2008. | 33 RICs consisting of 108 Portfolios | Greenlight Capital Re, Ltd. (reinsurance company) | |||||
Robert C. Robb, Jr. 55 East 52nd Street New York, NY 10055 1945 | Director/Trustee | Since 2007 | Partner, Lewis, Eckert, Robb and Company (management and financial consulting firm) since 1981. | 33 RICs consisting of 108 Portfolios | None | |||||
Toby Rosenblatt 55 East 52nd Street New York, NY 10055 1938 | Director/Trustee | Since 2005 | President, Founders Investments Ltd. (private investments) since 1999; Director, Forward Management, LLC since 2007; Director, College Access Foundation of California (philanthropic foundation) since 2009; Director, A.P. Pharma Inc. (specialty pharmaceuticals) from 1983 to 2011; Director, The James Irvine Foundation (philanthropic foundation) from 1998 to 2008. | 33 RICs consisting of 108 Portfolios | None | |||||
| ANNUAL REPORT | MAY 31, 2013 | 57 |
Table of Contents
| Officers and Directors/Trustees (continued) |
Name, Address, and Year of Birth | Position(s) Held with Corporation/ Master LLC/ Trust | Length of Time Served as a Director/ Trustee2 | Principal Occupation(s) During Past 5 Years | Number of BlackRock- Advised Registered Investment Companies (“RICs”) Consisting of Investment Portfolios (“Portfolios”) Overseen | Public Directorships | |||||
| Independent Directors/Trustees1 (concluded) | ||||||||||
Kenneth L. Urish 55 East 52nd Street New York, NY 10055 1951 | Director/Trustee | Since 2007 | Managing Partner, Urish Popeck & Co., LLC (certified public accountants and consultants) since 1976; Chairman of the Professional Ethics Committee of the Pennsylvania Institute of Certified Public Accountants since 2010 and Committee Member thereof since 2007; Member of External Advisory Board, The Pennsylvania State University Accounting Department since 2001; Trustee, The Holy Family Institute from 2001 to 2010; President and Trustee, Pittsburgh Catholic Publishing Associates from 2003 to 2008; Director, Inter-Tel from 2006 to 2007. | 33 RICs consisting of 108 Portfolios | None | |||||
Frederick W. Winter 55 East 52nd Street New York, NY 10055 1945 | Director/Trustee | Since 2007 | Professor and Dean Emeritus of the Joseph M. Katz School of Business, University of Pittsburgh since 2005 and Dean thereof from 1997 to 2005; Director, Alkon Corporation (pneumatics) since 1992; Director, Tippman Sports (recreation) since 2005; Director, Indotronix International (IT services) from 2004 to 2008. | 33 RICs consisting of 108 Portfolios | None | |||||
1 Directors/Trustees serve until their resignation, removal or death, or until December 31 of the year in which they turn 72. The Board has approved one-year extensions in terms of Directors/Trustees who turn 72 prior to December 31, 2013.
2 Date shown is the earliest date a person has served for the Corporation/Master LLC/Trust covered by this annual report. Following the combination of Merrill Lynch Investment Managers, L.P. (“MLIM”) and BlackRock, Inc. (“BlackRock”) in September 2006, the various legacy MLIM and legacy BlackRockfund boards were realigned and consolidated into three new fund boards in 2007. As a result, although the chart shows certain Directors/Trustees as joining the Corporation/Master LLC/Trust’s board in 2007, those Directors/Trustees first became members of the boards of other legacy MLIM or legacy BlackRock funds as follows: David O. Beim, 1998; Ronald W. Forbes, 1977; Dr. Matina S. Horner, 2004; Rodney D. Johnson, 1995; Herbert I. London, 1987; Cynthia A. Montgomery, 1994; Joseph P. Platt, 1999; Robert C. Robb, Jr., 1998; Toby Rosenblatt, 2005; Kenneth L. Urish, 1999; and Frederick W. Winter, 1999. | ||||||||||
| Interested Directors/Trustees3 | ||||||||||
Paul L. Audet 55 East 52nd Street New York, NY 10055 1953 | Director/Trustee | Since 2011 | Senior Managing Director of BlackRock and Head of U.S. Mutual Funds since 2011; Chair of the U.S. Mutual Funds Committee reporting to the Global Executive Committee since 2011; Head of BlackRock’s Real Estate business from 2008 to 2011; Member of BlackRock’s Global Operating and Corporate Risk Management Committees and of the BlackRock Alternative Investors Executive Committee and Investment Committee for the Private Equity Fund of Funds business since 2008; Head of BlackRock’s Global Cash Management business from 2005 to 2010; Acting Chief Financial Officer of BlackRock from 2007 to 2008; Chief Financial Officer of BlackRock from 1998 to 2005. | 155 RICs consisting of 282 Portfolios | None | |||||
Henry Gabbay 55 East 52nd Street New York, NY 10055 1947 | Director/Trustee | Since 2007 | Consultant, BlackRock from 2007 to 2008; Managing Director, BlackRock from 1989 to 2007; Chief Administrative Officer, BlackRock Advisors, LLC from 1998 to 2007; President of BlackRock Funds and BlackRock Bond Allocation Target Shares from 2005 to 2007 and Treasurer of certain closed-end funds in the BlackRock fund complex from 1989 to 2006. | 155 RICs consisting of 282 Portfolios | None | |||||
3 Mr. Audet is an “interested person,” as defined in the 1940 Act, of the Corporation/Master LLC/Trust based on his position with BlackRock and its affiliates. Mr. Gabbay is an “interested person” of the Corporation/Master LLC/Trust based on his former positions with BlackRock and its affiliates as well as his ownership of BlackRock and The PNC Financial Services Group, Inc. securities. Mr. Audet and Mr. Gabbay are also Directors/Trustees of the BlackRock registered closed-end funds and Directors/Trustees of other BlackRock registered open-end funds. Directors/Trustees serve until their resignation, removal or death, or until December 31 of the year in which they turn 72. | ||||||||||
| 58 | ANNUAL REPORT | MAY 31, 2013 |
Table of Contents
| Officers and Directors/Trustees (concluded) |
Name, Address, and Year of Birth | Position(s) Held with Corporation/ Master LLC /Trust | Length of Time Served | Principal Occupation(s) During Past 5 Years | |||
| Officers1 | ||||||
John M. Perlowski 55 East 52nd Street New York, NY 10055 1964 | President and Chief Executive Officer | Since 2010 | Managing Director of BlackRock since 2009; Global Head of BlackRock Fund Services since 2009; Managing Director and Chief Operating Officer of the Global Product Group at Goldman Sachs Asset Management, L.P. from 2003 to 2009; Treasurer of Goldman Sachs Mutual Funds from 2003 to 2009 and Senior Vice President thereof from 2007 to 2009; Director of Goldman Sachs Offshore Funds from 2002 to 2009; Director of Family Resource Network (charitable foundation) since 2009. | |||
Richard Hoerner, CFA 55 East 52nd Street New York, NY 10055 1958 | Vice President | Since 2009 | Managing Director of BlackRock since 2000; Head of the Global Cash Group since 2013; Co-head of the Global Cash and Securities Lending Group from 2010 to 2013; Member of the Cash Management Group Executive Committee since 2005. | |||
Brendan Kyne 55 East 52nd Street New York, NY 10055 1977 | Vice President | Since 2009 | Managing Director of BlackRock since 2010; Director of BlackRock from 2008 to 2009; Head of Product Development and Management for BlackRock’s U.S. Retail Group since 2009; and Co-head thereof from 2007 to 2009; Vice President of BlackRock from 2005 to 2008. | |||
Christopher Stavrakos, CFA 55 East 52nd Street New York, NY 10055 1959 | Vice President | Since 2009 | Managing Director of BlackRock since 2006; Co-head of BlackRock’s Cash Management Portfolio Management Group since 2006; Senior Vice President, CIO, and Director of Liability Management for the Securities Lending Group at Mellon Bank from 1999 to 2006. | |||
Neal Andrews 55 East 52nd Street New York, NY 10055 1966 | Chief Financial Officer | Since 2007 | Managing Director of BlackRock since 2006; Senior Vice President and Line of Business Head of Fund Accounting and Administration at PNC Global Investment Servicing (U.S.) Inc. from 1992 to 2006. | |||
Jay Fife 55 East 52nd Street New York, NY 10055 1970 | Treasurer | Since 2007 | Managing Director of BlackRock since 2007; Director of BlackRock in 2006; Assistant Treasurer of the MLIM and Fund Asset Management, L.P. advised funds from 2005 to 2006; Director of MLIM Fund Services Group from 2001 to 2006. | |||
Brian Kindelan 55 East 52nd Street New York, NY 10055 1959 | Chief Compliance Officer and Anti-Money Laundering Officer | Since 2007 | Chief Compliance Officer of the BlackRock-advised funds since 2007; Managing Director and Senior Counsel of BlackRock since 2005. | |||
Benjamin Archibald 55 East 52nd Street New York, NY 10055 1975 | Secretary | Since 2012 | Director of BlackRock since 2010; Assistant Secretary to the funds from 2010 to 2012; General Counsel and Chief Operating Officer of Uhuru Capital Management from 2009 to 2010; Executive Director and Counsel of Goldman Sachs Asset Management from 2005 to 2009. | |||
1 Officers of the Corporation/Master LLC/Trust serve at the pleasure of the Board. | ||||||
| Further information about the Corporation/Master LLC/Trust’s Officers and Directors/Trustees is available in the Corporation/Master LLC/Trust’s Statement of Additional Information, which can be obtained without charge by calling 1-800-441-7762. | ||||||
Investment Advisor and Co-Administrator BlackRock Advisors, LLC1 Wilmington, DE 19809 | Sub-Advisor BlackRock Capital2 Management, Inc. New York, NY 10055
BlackRock Fund Advisors3 Princeton, NJ 08540 | Accounting Agent, Co-Administrator and Transfer Agent BNY Mellon Investment1 Servicing (US) Inc. Wilmington, DE 19809 | Address of the Fund/Trust 100 Bellevue Parkway Wilmington, DE 19809 | |||
Independent Registered Public Accounting Firm Deloitte & Touche LLP Philadelphia, PA 19103 | Custodian Brown Brothers2 Harriman & Co. Boston, MA 02109
The Bank of New York Mellon3 New York, NY 10286 | Distributor BlackRock Investments, LLC New York, NY 10022 | Legal Counsel Sidley Austin LLP New York, NY 10019 | |||
1 Co-Administrator for BlackRock Disciplined Small Cap Core Fund. | ||||||
2 For BlackRock Master Small Cap Growth Portfolio. | ||||||
3 For BlackRock Disciplined Small Cap Core Fund. | ||||||
| ANNUAL REPORT | MAY 31, 2013 | 59 |
Table of Contents
| Additional Information |
| General Information |
Electronic Delivery
Electronic copies of most financial reports and prospectuses are available on the Funds’ website or shareholders can sign up for e-mail notifications of quarterly statements, annual and semi-annual reports and prospectuses by enrolling in the Funds’ electronic delivery program.
To enroll:
Shareholders Who Hold Accounts with Investment Advisors,
Banks or Brokerages:
Please contact your financial advisor. Please note that not all investment advisors, banks or brokerages may offer this service.
Shareholders Who Hold Accounts Directly With BlackRock:
| 1) | Access the BlackRock website at |
http://www.blackrock.com/ edelivery
| 2) | Select “eDelivery” under the “More Information” section |
| 3) | Log into your account |
Householding
The Funds will mail only one copy of shareholder documents, including prospectuses, annual and semi-annual reports and proxy statements, to shareholders with multiple accounts at the same address. This practice is commonly called “householding” and is intended to reduce expenses and eliminate duplicate mailings of shareholder documents. Mailings of your shareholder documents may be householded indefinitely unless you instruct us otherwise. If you do not want the mailing of these documents to be combined with those for other members of your household, please contact the Funds at (800) 441-7762.
Availability of Quarterly Portfolio Schedule
The Funds/Master Portfolio file their complete schedule of portfolio holdings with the SEC for the first and third quarters of each fiscal year on Form N-Q. The Funds’/Master Portfolio’s Forms N-Q are available on the SEC’s website at http://www.sec.gov and may also be reviewed and copied at the SEC’s Public Reference Room in Washington, D.C. Information on how to access documents on the SEC’s website without charge may be obtained by calling (800) SEC-0330. The Funds’/Master Portfolio’s Forms N-Q may also be obtained upon request and without charge by calling (800) 441-7762.
Availability of Proxy Voting Policies and Procedures
A description of the policies and procedures that the Funds/Master Portfolio use to determine how to vote proxies relating to portfolio securities is available (1) without charge, upon request, by calling (800) 441-7762; (2) at http://www.blackrock.com; and (3) on the SEC’s website at http://www.sec.gov.
Availability of Proxy Voting Record
Information about how the Funds/Master Portfolio voted proxies relating to securities held in the Funds’/Master Portfolio’s portfolios during the most recent 12-month period ended June 30 is available upon request and without charge (1) at http://www.blackrock.com or by calling (800) 441-7762 and (2) on the SEC’s website at http://www.sec.gov.
| Shareholder Privileges |
Account Information
Call us at (800) 441-7762 from 8:00 AM to 6:00 PM EST on any business day to get information about your account balances, recent transactions and share prices. You can also reach us on the Web at http:// www.blackrock.com/funds.
Automatic Investment Plans
Investor Class shareholders who want to invest regularly can arrange to have $50 or more automatically deducted from their checking or savings account and invested in any of the BlackRock funds.
Systematic Withdrawal Plan
Investor Class shareholders can establish a systematic withdrawal plan and receive periodic payments of $50 or more from their BlackRock funds, as long as their account balance is at least $10,000.
Retirement Plans
Shareholders may make investments in conjunction with Traditional, Rollover, Roth, Coverdell, Simple IRAs, SEP IRAs and 403(b) Plans.
| 60 | ANNUAL REPORT | MAY 31, 2013 |
Table of Contents
| Additional Information (concluded) |
| BlackRock Privacy Principles |
BlackRock is committed to maintaining the privacy of its current and former fund investors and individual clients (collectively, “Clients”) and to safeguarding their non-public personal information. The following information is provided to help you understand what personal information BlackRock collects, how we protect that information and why in certain cases we share such information with select parties.
If you are located in a jurisdiction where specific laws, rules or regulations require BlackRock to provide you with additional or different privacy-related rights beyond what is set forth below, then BlackRock will comply with those specific laws, rules or regulations.
BlackRock obtains or verifies personal non-public information from and about you from different sources, including the following: (i) information we receive from you or, if applicable, your financial intermediary, on applications, forms or other documents; (ii) information about your transactions with us, our affiliates, or others; (iii) information we receive from a consumer reporting agency; and (iv) from visits to our websites.
BlackRock does not sell or disclose to non-affiliated third parties any non-public personal information about its Clients, except as permitted by law or as is necessary to respond to regulatory requests or to service Client accounts. These non-affiliated third parties are required to protect the confidentiality and security of this information and to use it only for its intended purpose.
We may share information with our affiliates to service your account or to provide you with information about other BlackRock products or services that may be of interest to you. In addition, BlackRock restricts access to non-public personal information about its Clients to those BlackRock employees with a legitimate business need for the information. BlackRock maintains physical, electronic and procedural safeguards that are designed to protect the non-public personal information of its Clients, including procedures relating to the proper storage and disposal of such information.
| ANNUAL REPORT | MAY 31, 2013 | 61 |
Table of Contents
| A World-Class Mutual Fund Family |
BlackRock offers a diverse lineup of open-end mutual funds crossing all investment styles and managed by experts in equity, fixed income and tax-exempt investing.
| Equity Funds |
BlackRock ACWI ex-US Index Fund
BlackRock All-Cap Energy & Resources Portfolio
BlackRock Basic Value Fund
BlackRock Capital Appreciation Fund
BlackRock China Fund
BlackRock Commodity Strategies Fund
BlackRock Disciplined Small Cap Core Fund
BlackRock Emerging Markets Fund
BlackRock Emerging Markets Long/Short Equity Fund
BlackRock Energy & Resources Portfolio
BlackRock Equity Dividend Fund
BlackRock EuroFund
BlackRock Flexible Equity Fund
BlackRock Focus Growth Fund
BlackRock Global Dividend Income Portfolio
BlackRock Global Long/Short Equity Fund
BlackRock Global Opportunities Portfolio
BlackRock Global SmallCap Fund
BlackRock Health Sciences Opportunities Portfolio
BlackRock India Fund
BlackRock International Fund
BlackRock International Index Fund
BlackRock International Opportunities Portfolio
BlackRock Large Cap Core Fund
BlackRock Large Cap Core Plus Fund
BlackRock Large Cap Growth Fund
BlackRock Large Cap Value Fund
BlackRock Latin America Fund
BlackRock Long-Horizon Equity Fund
BlackRock Mid-Cap Growth Equity Portfolio
BlackRock Mid-Cap Value Opportunities Fund
BlackRock Natural Resources Trust
BlackRock Pacific Fund
BlackRock Real Estate Securities Fund
BlackRock Russell 1000 Index Fund
BlackRock Science & Technology Opportunities Portfolio
BlackRock Small Cap Growth Equity Portfolio
BlackRock Small Cap Growth Fund II
BlackRock Small Cap Index Fund
BlackRock S&P 500 Stock Fund
BlackRock U.S. Opportunities Portfolio
BlackRock Value Opportunities Fund
BlackRock World Gold Fund
| Taxable Fixed Income Funds |
BlackRock Bond Index Fund
BlackRock Core Bond Portfolio
BlackRock CoreAlpha Bond Fund
BlackRock Emerging Market Local Debt Portfolio
BlackRock Floating Rate Income Portfolio
BlackRock Global Long/Short Credit Fund
BlackRock GNMA Portfolio
BlackRock High Yield Bond Portfolio
BlackRock Inflation Protected Bond Portfolio
BlackRock International Bond Portfolio
BlackRock Investment Grade Bond Portfolio
BlackRock Low Duration Bond Portfolio
BlackRock Secured Credit Portfolio
BlackRock Short Obligations Fund
BlackRock Short-Term Treasury Fund
BlackRock Strategic Income Opportunities Portfolio
BlackRock Total Return Fund
BlackRock U.S. Government Bond Portfolio
BlackRock U.S. Mortgage Portfolio
BlackRock Ultra-Short Obligations Fund
BlackRock World Income Fund
| Municipal Fixed Income Funds |
BlackRock California Municipal Bond Fund
BlackRock High Yield Municipal Fund
BlackRock Intermediate Municipal Fund
BlackRock National Municipal Fund
BlackRock New Jersey Municipal Bond Fund
BlackRock New York Municipal Bond Fund
BlackRock Pennsylvania Municipal Bond Fund
BlackRock Short-Term Municipal Fund
| Mixed Asset Funds |
| BlackRock Balanced Capital Fund | LifePath Active Portfolios | LifePath Index Portfolios | ||||||||||||
| BlackRock Emerging Market Allocation Portfolio | 2015 | 2040 | Retirement | 2040 | ||||||||||
| BlackRock Global Allocation Fund | 2020 | 2045 | 2020 | 2045 | ||||||||||
| BlackRock Managed Volatility Portfolio | 2025 | 2050 | 2025 | 2050 | ||||||||||
| BlackRock Multi-Asset Income Portfolio | 2030 | 2055 | 2030 | 2055 | ||||||||||
| BlackRock Multi-Asset Real Return Fund | 2035 | 2035 | ||||||||||||
| BlackRock Strategic Risk Allocation Fund | ||||||||||||||
| BlackRock Prepared Portfolios | LifePath Portfolios | |||||||||||||
Conservative Prepared Portfolio | Retirement | 2040 | ||||||||||||
Moderate Prepared Portfolio | 2020 | 2045 | ||||||||||||
Growth Prepared Portfolio | 2025 | 2050 | ||||||||||||
Aggressive Growth Prepared Portfolio | 2030 | 2055 | ||||||||||||
2035 | ||||||||||||||
BlackRock mutual funds are currently distributed by BlackRock Investments, LLC. You should consider the investment objectives, risks, charges and expenses of the funds under consideration carefully before investing. Each fund’s prospectus contains this and other information and is available at www.blackrock.com or by calling (800) 441-7762 or from your financial advisor. The prospectus should be read carefully before investing.
| 62 | ANNUAL REPORT | MAY 31, 2013 |
Table of Contents
This report is transmitted to shareholders only. It is not authorized for use as an offer of sale or a solicitation of an offer to buy shares of a Fund unless accompanied or preceded by that Fund’s current prospectus. Past performance results shown in this report should not be considered a representation of future performance. Investment returns and principal value of shares will fluctuate so that shares, when redeemed, may be worth more or less than their original cost. Statements and other information herein are as dated and are subject to change.

SC2-5/13-AR |  | |
Table of Contents
| Item 2 – | Code of Ethics – Each registrant (or “Fund”) has adopted a code of ethics, as of the end of the period covered by this report, applicable to the registrant’s principal executive officer, principal financial officer, principal accounting officer or controller, or persons performing similar functions. During the period covered by this report, there have been no amendments to or waivers granted under the code of ethics. A copy of the code of ethics is available without charge at www.blackrock.com. | |
| Item 3 – | Audit Committee Financial Expert – Each registrant’s board of directors (the “board of directors”), has determined that (i) the registrant has the following audit committee financial expert serving on its audit committee and (ii) each audit committee financial expert is independent: | |
| Kenneth L. Urish | ||
| Under applicable securities laws, a person determined to be an audit committee financial expert will not be deemed an “expert” for any purpose, including without limitation for the purposes of Section 11 of the Securities Act of 1933, as a result of being designated or identified as an audit committee financial expert. The designation or identification of a person as an audit committee financial expert does not impose on such person any duties, obligations, or liabilities greater than the duties, obligations, and liabilities imposed on such person as a member of the audit committee and board of directors in the absence of such designation or identification. | ||
| Item 4 – | Principal Accountant Fees and Services | |
| The following table presents fees billed by Deloitte & Touche LLP (“D&T”) in each of the last two fiscal years for the services rendered to the Funds: | ||
| (a) Audit Fees | (b) Audit-Related Fees1 | (c) Tax Fees2 | (d) All Other Fees3 | |||||||||||||
| Entity Name | Current Fiscal Year End | Previous Fiscal Year End | Current Fiscal Year End | Previous Fiscal Year End | Current Fiscal Year End | Previous Fiscal Year End | Current Fiscal Year End | Previous Fiscal Year End | ||||||||
| BlackRock Small Cap Growth Fund II of BlackRock Series, Inc. | $7,263 | $7,000 | $0 | $0 | $12,850 | $12,350 | $0 | $0 | ||||||||
| BlackRock Master Small Cap Growth Portfolio of BlackRock Master LLC | $31,763 | $31,500 | $0 | $0 | $0 | $0 | $0 | $0 | ||||||||
The following table presents fees billed by D&T that were required to be approved by each registrant’s audit committee (each a “Committee”) for services that relate directly to the operations or financial reporting of the Fund and that are rendered on behalf of BlackRock Advisors, LLC (“Investment Adviser” or “BlackRock”) and entities controlling, controlled by, or under common control with BlackRock (not including any sub-adviser whose role is primarily portfolio management and is subcontracted with or overseen by another investment adviser) that provide ongoing services to the Fund (“Fund Service Providers”):
| Current Fiscal Year End | Previous Fiscal Year End | |||
| (b) Audit-Related Fees1 | $0 | $0 | ||
| (c) Tax Fees2 | $0 | $0 | ||
| (d) All Other Fees3 | $2,865,000 | $2,970,000 |
1 The nature of the services includes assurance and related services reasonably related to the performance of the audit of financial statements not included in Audit Fees.
2 The nature of the services includes tax compliance, tax advice and tax planning.
3 Aggregate fees borne by BlackRock in connection with the review of compliance procedures and attestation thereto performed by D&T with respect to all of the registered closed-end funds and some of the registered open-end funds advised by BlackRock.
(e)(1) Audit Committee Pre-Approval Policies and Procedures:
2
Table of Contents
Each Committee has adopted policies and procedures with regard to the pre-approval of services. Audit, audit-related and tax compliance services provided to the registrant on an annual basis require specific pre-approval by the registrant’s Committee. The Committee also must approve other non-audit services provided to the registrant and those non-audit services provided to the Investment Adviser and Fund Service Providers that relate directly to the operations and the financial reporting of the registrant. Certain of these non-audit services that the Committee believes are (a) consistent with the SEC’s auditor independence rules and (b) routine and recurring services that will not impair the independence of the independent accountants may be approved by the Committee without consideration on a specific case-by-case basis (“general pre-approval”). The term of any general pre-approval is 12 months from the date of the pre-approval, unless the Committee provides for a different period. Tax or other non-audit services provided to the registrants which have a direct impact on the operations or financial reporting of the registrant will only be deemed pre-approved provided that any individual project does not exceed $10,000 attributable to the registrant or $50,000 per project. For this purpose, multiple projects will be aggregated to determine if they exceed the previously mentioned cost levels.
Any proposed services exceeding the pre-approved cost levels will require specific pre-approval by the registrant’s Committee, as will any other services not subject to general pre-approval (e.g., unanticipated but permissible services). The Committee is informed of each service approved subject to general pre-approval at the next regularly scheduled in-person board meeting. At this meeting, an analysis of such services is presented to the Committee for ratification. The Committee may delegate to the Committee Chairman the authority to approve the provision of and fees for any specific engagement of permitted non-audit services, including services exceeding pre-approved cost levels.
(e)(2) None of the services described in each of Items 4(b) through (d) were approved by either Committee pursuant to the de minimus exception in paragraph (c)(7)(i)(C) of Rule 2-01 of Regulation S-X.
(f) Not Applicable
(g) The aggregate non-audit fees paid to the accountant for services rendered by the accountant to the registrant, the Investment Adviser and the Fund Service Providers were:
| Entity Name | Current Fiscal Year End | Previous Fiscal Year End | ||
| BlackRock Small Cap Growth Fund II of BlackRock Series, Inc. | $12,850 | $12,350 | ||
| BlackRock Master Small Cap Growth Portfolio of BlackRock Master LLC | $0 | $0 |
Additionally, SSAE 16 Review (Formerly, SAS No. 70) fees for the current and previous fiscal years of $2,865,000 and $2,970,000, respectively, were billed by D&T to the Investment Adviser.
(h) Each Committee has considered and determined that the provision of non-audit services that were rendered to the Investment Adviser and the Fund Service Providers that were not pre-approved pursuant to paragraph (c)(7)(ii) of Rule 2-01 of Regulation S-X is compatible with maintaining the principal accountant’s independence.
Item 5 – Audit Committee of Listed Registrants – Not Applicable
3
Table of Contents
| Item 6 – | Investments | |
| (a) The registrants’ Schedules of Investments are included as part of the Report to Stockholders filed under Item 1 of this Form. | ||
| (b) Not Applicable due to no such divestments during the semi-annual period covered since the previous Form N-CSR filing. | ||
| Item 7 – | Disclosure of Proxy Voting Policies and Procedures for Closed-End Management Investment Companies – Not Applicable | |
| Item 8 – | Portfolio Managers of Closed-End Management Investment Companies – Not Applicable | |
| Item 9 – | Purchases of Equity Securities by Closed-End Management Investment Company and Affiliated Purchasers – Not Applicable | |
| Item 10 – | Submission of Matters to a Vote of Security Holders – There have been no material changes to these procedures. | |
| Item 11 – | Controls and Procedures | |
| (a) – The registrants’ principal executive and principal financial officers, or persons performing similar functions, have concluded that the registrants’ disclosure controls and procedures (as defined in Rule 30a-3(c) under the Investment Company Act of 1940, as amended (the “1940 Act”)) are effective as of a date within 90 days of the filing of this report based on the evaluation of these controls and procedures required by Rule 30a-3(b) under the 1940 Act and Rule 15(d)-15(b) under the Securities Exchange Act of 1934, as amended. | ||
| (b) – There were no changes in the registrants’ internal control over financial reporting (as defined in Rule 30a-3(d) under the 1940 Act) that occurred during the second fiscal quarter of the period covered by this report that have materially affected, or are reasonably likely to materially affect, the registrants’ internal control over financial reporting. | ||
| Item 12 – | Exhibits attached hereto | |
| (a)(1) – Code of Ethics – See Item 2 | ||
| (a)(2) – Certifications – Attached hereto | ||
| (a)(3) – Not Applicable | ||
(b) – Certifications– Attached hereto | ||
4
Table of Contents
Pursuant to the requirements of the Securities Exchange Act of 1934 and the Investment Company Act of 1940, each registrant has duly caused this report to be signed on its behalf by the undersigned, thereunto duly authorized.
BlackRock Small Cap Growth Fund II of BlackRock Series, Inc. and BlackRock Master Small Cap Growth Portfolio of BlackRock Master LLC
| By: | /s/ John M. Perlowski | |
| John M. Perlowski | ||
| Chief Executive Officer (principal executive officer) of | ||
| BlackRock Small Cap Growth Fund II of BlackRock Series, Inc. and BlackRock Master Small Cap Growth Portfolio of BlackRock Master LLC | ||
| Date: August 1, 2013 | ||
Pursuant to the requirements of the Securities Exchange Act of 1934 and the Investment Company Act of 1940, this report has been signed below by the following persons on behalf of each registrant and in the capacities and on the dates indicated.
| By: | /s/ John M. Perlowski | |
| John M. Perlowski | ||
| Chief Executive Officer (principal executive officer) of | ||
| BlackRock Small Cap Growth Fund II of BlackRock Series, Inc. and BlackRock Master Small Cap Growth Portfolio of BlackRock Master LLC | ||
| Date: August 1, 2013 | ||
| By: | /s/ Neal J. Andrews | |
| Neal J. Andrews | ||
| Chief Financial Officer (principal financial officer) of | ||
| BlackRock Small Cap Growth Fund II of BlackRock Series, Inc. and BlackRock Master Small Cap Growth Portfolio of BlackRock Master LLC | ||
| Date: August 1, 2013 | ||
5