40|86 STRATEGIC INCOME FUND
New York Stock Exchange Listed
Ticker Symbol: CFD
June 30, 2005
40 | 86 Strategic Income Fund | Annual Report |
Portfolio Managers’ Review | June 30, 2005 |
How did the Fund perform relative to its Benchmark?
The 40|86 Strategic Income Fund generated an 11.98% increase in Net Asset Value (NAV) for the fiscal year ended June 30, 2005. The Fund’s benchmark, the Merrill Lynch High Yield Master II Index, returned 10.62% for the same period. As a closed-end mutual fund, the 40|86 Strategic Income Fund’s stock trades independently from the underlying NAV on the New York Stock Exchange. The stock’s return for the fiscal year ended June 30, 2005 was 14.84%
What factors contributed to the Fund exceeding its benchmark?
Our credit analysts identified three industry sectors that contributed to our success. Relative to our benchmark, we held larger positions in telecommunications, emerging markets and tobacco, each of which delivered returns that exceeded the benchmark. We were able to take advantage of buying opportunities in these under-valued sectors.
Which holding enhanced the Fund’s performance?
The Fund’s return was increased by its holdings in leaf tobacco merchant Dimon International, beneficial certificates in airline US Airways and wireless phone company Alamosa. Dimon was our best performing holding for the fiscal year, generating a 29.19% return. The US Airways beneficial certificates returned 15.79%. Alamosa generated a return of 14.13%. Alamosa benefited from improving fundamentals in the wireless arena, reflected by growing subscribers, stable average revenue per customer and declining customer turnover.
Which holdings most negatively impacted the Fund’s performance?
The Fund’s main detractors were semiconductor outsourcer Amkor Technologies, auto parts company Affinia Group and cosmetic and over-the-counter pharmaceutical maker Del Laboratories. Amkor Technologies, which we no longer hold, dropped 11.07%. Affinia Group, which was purchased from Dana Corporation in 2004, detracted from performance with an 8.54% decline. Affinia reported disappointing first quarter 2005 results due to its inability to pass on increasing raw material prices and the loss of a $75 million contract with AutoZone. Del Laboratories negatively impacted performance with a 3.37% decline. Poor operating performance led to a ratings downgrade by Moody’s and a change to negative outlook by Standard & Poor’s.
What is your outlook for the next fiscal year?
We expect the Federal Reserve will continue to increase short-term interest rates at a measured pace into early 2006. We believe this policy will result in low inflation and slow but steady economic growth. These conditions should allow credit conditions to improve and default rates to remain low. Although we do not anticipate new inflows into fixed income or high yield, this backdrop is well suited for high yield bonds to out-perform other fixed income segments, at least through mid-year 2006. During the second half of 2006, we expect economic growth will begin to slow to the point where credit spreads will widen and default rates will increase.
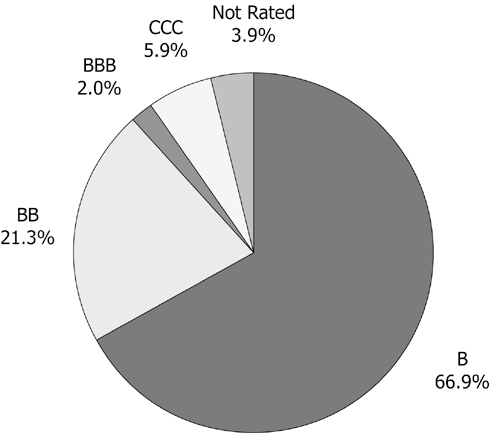
As a result, we expect credit markets will become increasingly concerned with credit quality. The core of the Fund remains in the middle tier (rated “B” by Standard and Poor’s) of the high yield market. Based on our reasonably strong economic outlook, the middle tier is positioned to show the most improvement in credit quality over the next year. We are under-weight the upper tier of the market for two reasons. First, the highest quality segment is the most sensitive to the anticipated increases in interest rates. Second, the highest quality segments have been the most vulnerable to event risk (unpredictable risk due to unforeseen events). This event risk can be seen in recent leveraged buyouts that have led to rating agency downgrades and subsequent under-performance. Software and IT service provider Sungard, upscale department store Neiman Marcus and retailer Toys R Us are examples of leveraged transactions that have had adverse affects on existing bondholders’ returns. Private equity firms have raised significant amounts of capital over the last year, and these dollars need to be invested.
Companies that have reasonably strong balance sheets remain prime candidates for these pools of capital. We are reducing positions in industry segments we believe will first show weakness when the economy begins to slow. Now that China has taken action to slow its economy, some of the sectors that have benefited most from China’s growth are likely to experience slowing growth. These industries include many of the commodity producers of metals, chemicals and paper along with some capital goods producers. We are also reducing positions in weaker companies that will need to refinance next year. These companies could be vulnerable if the financial markets become more selective.
40 | 86 Strategic Income Fund | Annual Report |
Portfolio Managers’ Review | June 30, 2005 |
We continue to select securities based on recommendations from our credit research team. We are concentrating on those companies that are positioned well within their respective industries, have manageable debt maturities and have strong management teams. These companies generally have enterprise values able to withstand more volatile financial markets. These companies include independent natural gas producer Chesapeake Energy, medical equipment and service provider Universal Hospital Corporation, hotel resort and casino Wynn Las Vegas and petroleum supply chain manager Transmontaigne.
| Amy Gibson | Richard Matas |
| Vice President | Senior Trader |
| 40|86 Advisors, Inc. | 40|86 Advisors, Inc. |
_________
| (1) | Past performance does not guarantee future results. Your investment return and principal will fluctuate, and your shares may be worth more or less than their original cost. Total return is provided in accordance with SEC guidelines for comparative purposes. The Merrill Lynch High Yield Master II Index is an unmanaged, market capitalization weighted index of all domestic and yankee high yield bonds. |
Management of the Fund
Amy Gibson, CFA and Richard Matas are the Fund’s portfolio managers. Ms. Gibson is head of the high yield group for 40|86 Advisors, Inc. She is responsible for the oversight of the high yield, bank loan and collateralized debt obligation portfolios. Richard Matas is a high yield trader for 40|86 Advisors, Inc. He is responsible for providing portfolio management support for high yield and collateralized debt obligations. |
S&P Rating as a Percent of Total Investments
40 | 86 Strategic Income Fund | Annual Report |
Schedule of Investments | June 30, 2005 |
SHARES OR PRINCIPAL AMOUNT | VALUE |
| | |
CORPORATE BONDS (143.8%) | |
| | |
Amusement and Recreation Services (7.0%) | |
| $ 1,000,000 | Blockbuster, Inc., 9.000%, due 09/01/2012, (a) Cost — $985,000; | |
| | Acquired — 08/13/2004, 09/29/2004, 10/21/2004, 11/12/2004 and 03/09/2005 (d) | $940,000 |
| 1,500,000 | Movie Gallery, 11.000%, due 05/01/2012, (a) Cost — $1,509,030; | |
| | Acquired — 04/25/2005 and 05/05/2005 (d) | 1,582,500 |
| 1,650,000 | Pinnacle Entertainment, 8.250%, due 03/15/2012 (d) | 1,724,250 |
| 1,075,000 | Vail Resorts, Inc., 6.750%, due 02/15/2014 (d) | 1,096,500 |
| | | 5,343,250 |
Apparel and Other Finished Products (4.9%) | |
| 1,500,000 | Brown Shoe Company, Inc., 8.750%, due 05/01/2012, (a) Cost — $1,511,250; | |
| | Acquired — 04/19/2005 and 05/18/2005 (d) | 1,571,250 |
| 945,000 | Phillips Van-Heusen Corp., 7.250%, due 02/15/2011 (d) | 996,975 |
| 1,155,000 | Russell Corp., 9.250%, due 05/01/2010 (d) | 1,224,300 |
| | | 3,792,525 |
Building Services (5.1%) | |
| 585,000 | Hexcel Corp., 6.750%, due 02/01/2015 | 587,925 |
| 1,775,000 | Universal Hospital Services, Inc., 10.125%, due 11/01/2011 (d) | 1,801,625 |
| 1,600,000 | Williams Lyon Homes, 7.625%, due 12/15/2012 (d) | 1,536,000 |
| | | 3,925,550 |
Cable and Other Pay Television Services (9.1%) | |
| 615,000 | Cablevision Systems Corp., 8.000%, due 04/15/2012 (d) | 605,775 |
| 1,640,000 | Charter Communications OPT, 8.375%, due 4/30/14, (a) Cost — $1,664,600; | |
| | Acquired — 11/05/2004 (d) | 1,640,000 |
| 1,110,000 | Echostar DBS Corp., 6.625%, due 10/01/2014 (d). | 1,101,675 |
| 1,345,000 | Innova S De R. L., 9.375%, due 09/19/2013 (d) | 1,523,212 |
| 1,110,000 | Qwest Communications, 7.250%, due 02/15/2011 (d) | 1,079,475 |
| 1,080,000 | Superior Essex Communications & Essex Group., Inc., 9.000%, due 04/15/2012 (d) | 1,074,600 |
| | | 7,024,737 |
Chemicals and Allied Products (8.5%) | |
| 1,600,000 | Del Laboratories, Inc., 8.000%, due 02/01/2012 (d) | 1,384,000 |
| 1,290,000 | Elizabeth Arden, Inc., 7.750%, due 01/15/2014, (d) | 1,351,275 |
| 630,000 | Hercules, Inc., 6.750%, due 10/15/2029 (d) | 614,250 |
| 147,000 | Huntsman ICI Chemicals, 10.125%, due 07/01/2009 (d) | 151,961 |
| 765,000 | Huntsman International, Inc., 7.375%, due 01/01/2015, (a) Cost — $765,000; Acquired 12/03/2004 | 759,263 |
| 825,000 | Lyondell Chemical Co., 11.125%, due 07/15/2012 (d) | 940,500 |
| 585,000 | Nalco Co., 8.875%, due 11/15/2013 | 630,337 |
| 635,000 | Rockwood Specialties Group, 10.625%, due 05/15/2011 (d) | 703,262 |
| | | 6,534,848 |
Communication Services (8.4%) | |
| 1,465,000 | American Tower Corp., 7.125%, due 10/15/2012 (d) | 1,556,562 |
| 610,000 | Intelsat Bermuda Ltd., 7.794%, due 01/15/2012, (a) Cost — $610,000; Acquired — 01/25/05, (b) | 623,725 |
| 305,000 | Intelsat Bermuda Ltd., 8.625%, due 01/15/2015, (a) Cost — $305,000; Acquired — 01/25/05 | 323,300 |
| 275,000 | New Skies Satellites NV, 9.125%, due 11/01/2012, (a) Cost — $275,000; Acquired — 10/22/2004 | 274,312 |
| 1,018,000 | Panamsat Corp., 9.000%, due 08/15/2014 (d) | 1,115,983 |
| 440,000 | Rogers Wireless, Inc., 9.625%, due 05/01/2011 (d) | 518,650 |
The accompanying notes are an integral part of these financial statements.
40 | 86 Strategic Income Fund | Annual Report |
Schedule of Investments (continued) | June 30, 2005 |
SHARES OR PRINCIPAL AMOUNT | VALUE |
| | |
Communication Services (continued) | |
| $520,000 | Rogers Wireless, Inc., 7.500%, due 03/15/2015 | $568,100 |
| 620,000 | Rural Cellular Corp., 8.250%, due 03/15/2012 (d) | 651,000 |
| 780,000 | Spectrasite, Inc., 8.250%, due 05/15/2010 | 830,700 |
| | | 6,462,332 |
Electric, Gas, and Sanitary Services (3.4%) | |
| 580,000 | Allied Waste North America, 7.250%, due 03/15/2015, (a) Cost — $580,000; Acquired — 03/03/2005 | 564,050 |
| 800,000 | Midwest Generation LLC, 8.560%, due 01/02/2016 (d) | 882,000 |
| 1,090,000 | Texas Genco LLC/Financing, 6.875%, due 12/15/2014, (a) Cost — $1,090,000; Acquired-12/08/2004 (d) | 1,152,675 |
| | | 2,598,725 |
Electronic, Other Electrical Equipment, except Computers (2.9%) | |
| 357,000 | Alamosa Delaware, Inc., 11.000%, due 07/31/2010 (d) | 402,071 |
| 865,000 | Celestica, Inc., 7.875%, due 07/01/2011 | 890,950 |
| 850,000 | IPC Acquisition Corp., 11.500%, due 12/15/2009 (d). | 926,500 |
| | | 2,219,521 |
Fabricated Metal Products, except Machinery and Transportation Equipment (1.6%) | |
| 1,205,000 | Novelis Inc., 7.250%, due 02/15/2015, (a) Cost — $1,207,475; Acquired — 01/28/2005 and 06/02/2005 (d). | 1,215,544 |
Food and Kindred Products (4.1%) | |
| 1,500,000 | Alliance One, 11.000%, due 05/15/2012, (a) Cost — $1,500,000; Acquired — 05/10/2005 (d) | 1,552,500 |
| 1,000,000 | Del Monte Corp., 6.750%, due 02/15/2015, (a) Cost — $992,500; Acquired — 01/25/2005 and 04/01/2005 | 1,025,000 |
| 480,000 | Reddy Ice Group, Inc., 8.875%, due 08/01/2011 (d). | 535,200 |
| | | 3,112,700 |
Foreign Goverments (4.3%) | |
| 1,345,000 | Federative Republic of Brazil, 10.500%, due 07/14/2014 | 1,593,825 |
| 545,000 | Republic of Panama, 7.250%, due 03/15/2015 | 595,140 |
| 1,120,000 | Republic of Turkey, 7.375%, due 02/05/2025 | 1,115,072 |
| | | 3,304,037 |
Health Services (5.6%) | |
| 1,455,000 | Davita Inc., 7.250%, due 03/15/2015, (a) Cost — $1,457,900; Acquired — 03/15/2005 | 1,502,288 |
| 500,000 | HealthSouth Corp., 7.375%, due 10/01/2006 (d) | 507,500 |
| 1,305,000 | HealthSouth Corp., 10.750%, due 10/01/2008 (d) | 1,363,725 |
| 1,000,000 | VWR International, Inc., 8.000%, due 04/15/2014 | 957,500 |
| | | 4,331,013 |
Hotels, Other Lodging Places (3.1%) | |
| 590,000 | Host Marriott, LP, 7.125%, due 11/01/2013 | 618,025 |
| 1,795,000 | Wynn Las Vegas, 6.625%, due 12/01/2014, (a) Cost — $1,786,038; | |
| | Acquired — 12/17/2004 and 02/22/2005 (d | 1,754,613 |
| | | 2,372,638 |
The accompanying notes are an integral part of these financial statements.
40 | 86 Strategic Income Fund | Annual Report |
Schedule of Investments (continued) | June 30, 2005 |
SHARES OR PRINCIPAL AMOUNT | VALUE |
| | |
Industrial and Commercial Machinery and Computer Equipment (5.8%) | |
| $ 1,685,000 | Case Corp., 7.250%, due 01/15/2016 (d) | $1,613,387 |
| 1,380,000 | Park-Ohio Industries, Inc., 8.375%, due 11/15/2014, (a) Cost — $1,336,675; Acquired — 11/19/2004, 12/09/2004 and 05/13/2005 (d) | 1,238,550 |
| 473,000 | Rexnord Corp., 10.125%, due 12/15/2012 | 520,300 |
| 1,050,000 | Terex Corp., 7.375%, due 01/15/2014 (d) | 1,092,000 |
| | | 4,464,237 |
Lumber and Wood Products, except Furniture (3.0%) | |
| 890,000 | Ainsworth Lumber Corp., 6.750%, due 03/15/2014 (d) | 814,350 |
| 1,400,000 | Georgia-Pacific Corp., 7.375%, due 12/01/2025 (d) | 1,520,750 |
| | | 2,335,100 |
Measuring Instruments, Photo Goods, Watches (1.0%) | |
| 775,000 | DRS Technologies, Inc., 6.875%, due 11/01/2013 (d) | 806,000 |
Miscellaneous Manufacturing Industries (3.5%) | |
| 1,845,000 | Blount, Inc., 8.875%, due 08/01/2012 (d) | 1,983,375 |
| 275,000 | Dresser-Rand Group, Inc., 7.375%, due 11/01/2014, (a) Cost — $275,000; Acquired — 10/14/2004. | 287,375 |
| 440,000 | Polypore, Inc., 8.750%, due 05/15/2012 | 413,600 |
| | | 2,684,350 |
Miscellaneous Retail (3.4%) | |
| 1,000,000 | Suburban Propane Partners L.P., 6.875%, due 12/15/2013, (a) Cost — $991,810; Acquired — 12/18/2003 and 03/18/2005. | 955,000 |
| 1,630,000 | Jean Coutu Group PJC Inc., 7.625%, due 08/01/2012 (d) | 1,691,125 |
| | | 2,646,125 |
Non-Depository Credit Institutions (0.9%) | |
| 700,000 | General Motors Acceptance Corp., 7.750%, due 01/19/2010 | 684,922 |
Oil and Gas Extraction (4.2%) | |
| 1,155,000 | Chesapeake Energy, 7.500%, due 09/15/2013 (d) | 1,256,063 |
| 450,000 | Chesapeake Energy, 6.625%, due 01/15/2016, (a) Cost — $445,811; Acquired — 04/13/2005 (d) | 466,875 |
| 790,000 | El Paso Production Holdings, 7.750%, due 06/01/2013 (d) | 847,275 |
| 650,000 | Houston Exploration Co., 7.000%, due 06/15/2013 (d) | 674,375 |
| | | 3,244,588 |
Paper and Allied Products (8.6%) | |
| 1,640,000 | Boise Cascade, 7.125%, due 10/15/2014, (a) Cost — $1,640,000; Acquired — 10/15/2004 (d) | 1,619,500 |
| 835,000 | Cenveo Corp., 9.625%, due 03/15/2012 (d) | 905,975 |
| 1,385,000 | Graham Packing Co., 8.500%, due 10/15/2012, (a) Cost — $1,431,281; Acquired — 09/29/2004 and 02/07/2005 (d) | 1,405,775 |
| 1,100,000 | Graphic Packaging International, 9.500%, due 08/15/2013 (d) | 1,113,750 |
| 575,000 | Neenah Paper, Inc., 7.375%, due 11/15/2014, (a) Cost — $578,750; Acquired — 11/18/2004 and 02/11/2005 (d) | 560,625 |
| 1,055,000 | Stone Container, 7.375%, due 07/15/2014, (d) | 996,975 |
| | | 6,602,600 |
The accompanying notes are an integral part of these financial statements.
40 | 86 Strategic Income Fund | Annual Report |
Schedule of Investments (continued) | June 30, 2005 |
SHARES OR PRINCIPAL AMOUNT | VALUE |
| | |
Personal Services (4.4%) | |
| $ 1,360,000 | Adesa Corp., 7.625%, due 06/15/2012 (d) | $1,387,200 |
| 1,205,000 | Goodman Global Holdings, 7.875%, due 12/15/2012, (a) Cost — $1,205,000; Acquired — 12/15/2004 (d) | 1,120,650 |
| 875,000 | Navistar International, 7.500%, due 06/15/2011 | 896,875 |
| | | 3,404,725 |
Pipelines (5.9%) | |
| 1,490,000 | Dynegy Holdings, Inc., 10.125%, due 07/15/2013, (a) Cost — $1,587,946; | |
| | Acquired — 08/01/2003, 03/11/2004 and 05/17/2005 (d) | 1,691,150 |
| 1,120,000 | Pacific Energy Partners, 7.125%, due 06/15/2014 (d) | 1,171,800 |
| 1,600,000 | Transmontaigne, Inc., 9.125%, due 06/01/2010 (d) | 1,672,000 |
| | | 4,534,950 |
Printing, Publishing and Allied Industries (3.8%) | |
| 1,110,000 | RH Donnelley Corp., 6.875%, due 01/15/2013, (a) Cost — $1,110,000; Acquired — 01/11/05 (d) | 1,137,750 |
| 655,000 | Sun Media Corp., 7.625%, due 02/15/2013 | 696,756 |
| 1,055,000 | Warner Music Group., 7.375%, due 04/15/2014 (d) | 1,070,825 |
| | | 2,905,331 |
Railroad Transportation (2.3%) | |
| 1,665,000 | TFM SA DE CV, 9.375%, due 05/01/2012, (a) Cost — $1,688,250; Acquired — 04/13/05, 05/02/05 and 05/18/2005 | 1,739,925 |
Real Estate Investment Trusts (REITS) (1.6%) | |
| 1,090,000 | Senior Housing Properties Trust, 8.625%, due 01/15/2012 (d) | 1,223,525 |
Retail - Toy Store (1.3%) | |
| 1,200,000 | Toys R Us, 7.375%, due 10/15/2018 | 978,000 |
Stone, Clay, Glass and Concrete Products (3.3%) | |
| 1,475,000 | Owens-Brockway Glass, 8.250%, due 05/15/2013 (d) | 1,609,594 |
| 1,005,000 | U.S. Concrete, Inc., 8.375%, due 04/01/2014 (d) | 949,725 |
| | | 2,559,319 |
Special Purpose Entity (9.9%) | |
| 645,000 | Academia Charter School, 8.100%, due 08/15/2024, (a) Cost — $645,000; Acquired — 08/18/04 | 692,388 |
| 585,000 | American Commercial, 9.500%, due 02/15/2015, (a) Cost — $585,000; Acquired — 02/08/2005 | 620,100 |
| 3,222,000 | Dow Jones CDX Hybrid, 8.250%, due 06/29/2010, (a) Cost — $3,197,835; Acquired — 04/13/2005 | 3,238,110 |
| 1,500,000 | Fort Eustis/Story House, 7.125%, due 12/15/2034 (d) | 1,599,240 |
| 1,415,000 | Riddell Bell Holdings, 8.375%, due 10/01/2012 (d) | 1,425,613 |
| | | 7,575,451 |
Telephone Communications (4.6%) | |
| 741,200 | AirGate PCS, Inc., 9.375% due 09/01/2009, (a) Cost — $548,272; Acquired — 02/26/04 (d) | 781,966 |
| 1,300,000 | Cincinnati Bell, Inc., 8.375%, due 01/15/2014 (d) | 1,339,000 |
| 1,300,000 | Hawaiian Telecom Communication, 9.750%, due 05/01/2013, (a) Cost — $1,307,000; Acquired — 04/27/2005, 05/05/2005 and 05/17/2005 | 1,384,500 |
| | | 3,505,466 |
Television Broadcasting Stations (1.7%) | |
| 1,235,000 | Sinclair Broadcasting Group, 8.000%, due 03/15/2012 (d) | 1,272,050 |
The accompanying notes are an integral part of these financial statements.
40 | 86 Strategic Income Fund | Annual Report |
Schedule of Investments (continued) | June 30, 2005 |
SHARES OR PRINCIPAL AMOUNT | VALUE |
| | | |
Transportation Equipment (3.8%) | | |
| $835,000 | Tenneco Automotive Inc., 8.625%, due 11/15/2014 | $843,350 |
| 1,280,000 | TRW Automotive Inc., 9.375%, due 02/15/2013 | 1,424,000 |
| 645,000 | United Components, Inc., 9.375%, due 06/15/2013 | 653,063 |
| | | 2,920,413 |
Wholesale Trade - Durable Goods (1.3%) | |
| 1,000,000 | Vedanta Resources, 6.625%, due 02/22/2010, (a) Cost — $997,390; Acquired — 12/10/2004 (d) | 987,914 |
Wholesale Trade - Non-Durable Goods (1.5%) | |
| 1,055,000 | FastenTech, Inc., 11.500%, due 05/01/2011 (d) | 1,149,950 |
| | Total Corporate Bonds (cost $108,571,125) | $110,462,361 |
COMMON STOCK (0.2%) | |
Chemical Products (0.2%) | |
| 7,104 | Huntsman Corp. (c) | 143,996 |
| | Total Common Stock (cost $49,399) | 143,996 |
PREFERRED STOCK (1.0%) | |
Apparel and Other Finished Products (1.0%) | |
| 29,717 | Tommy Hilfiger USA, Inc., 9.000% | 764,024 |
| | Total Preferred Stock (cost $741,147) | 764,024 |
BENEFICIAL CERTIFICATES (0.4%) | |
Transportation by Air (0.4%) | |
| 10,723,505 | US Airways, Inc. (c) (d) (e) | 321,705 |
| | Total Beneficial Certificates (cost $0) | 321,705 |
SHORT-TERM INVESTMENTS (0.5%) | |
| 374,708 | Temporary Investment Fund, Inc. | 374,708 |
| | Total Short-Term Investments (cost $374,708) | 374,708 |
| | Total Investments (145.9% of net assets) (cost $109,736,379) (f). | $112,066,794 |
| | Liabilities, less other assets (-45.9% of net assets) | (35,232,065) |
| | Total Net Assets (100.0%) | $76,834,729 |
__________
| (a) | | Restricted under Rule 144A of the Securities Act of 1933. |
| (b) | | Variable rate bond-coupon rate changes semi-annually. |
| (c) | | Non-income producing security. |
| (d) | | All or a portion of these securities were included in a pledge account (see footnote 7). |
| (e) | | Security valued at fair value as determined under supervision of the Board of Trustees. |
| (f) | | Aggregate cost for Federal income tax purposes is $ 109,789,445. The aggregate gross unrealized appreciation (depreciation) for Federal income tax purposes is as follows: |
| | | Excess of market value over tax cost | $3,537,579 | | |
| | | Excess of tax cost over market value | (1,260,230) | | |
| | | | $2,277,349 | | |
The accompanying notes are an integral part of these financial statements.
40 | 86 Strategic Income Fund | Annual Report |
Statement of Assets and Liabilities | June 30, 2005 |
| Assets: | | | | |
| Investments at cost | | $ | 109,736,379 | |
| Investments at value | | $ | 112,066,794 | |
| Cash | | | 39,013 | |
| Receivable for securities sold | | | 803,578 | |
| Interest receivable | | | 2,233,960 | |
| Other assets | | | 13,542 | |
| Total assets | | | 115,156,887 | |
| Liabilities and net assets: | | | | |
| Payable to Conseco, Inc. subsidiaries | | | 186,591 | |
| Accrued expenses | | | 89,422 | |
| Distribution payable | | | 578,635 | |
| Interest payable | | | 115,612 | |
| Payables for securities purchased | | | 802,703 | |
| Line of credit payable | | | 36,549,195 | |
| Total liabilities | | | 38,322,158 | |
| Net assets | | $ | 76,834,729 | |
| Net assets consist of: | | | | |
| Capital stock, $0.001 par value (unlimited shares of beneficial interest authorized) | | $ | 6,840 | |
| Paid-in capital | | | 101,202,966 | |
| Undistributed net investment income | | | 109,360 | |
| Accumulated net realized loss on investments | | | (26,814,852 | ) |
| Net unrealized appreciation on investments | | | 2,330,415 | |
| Net assets | | $ | 76,834,729 | |
| Shares outstanding | | | 6,839,661 | |
| Net asset value per share | | $ | 11.23 | |
The accompanying notes are an integral part of these financial statements.
40 | 86 Strategic Income Fund | Annual Report |
Statement of Operations | |
| For the Year Ended June 30, 2005 | |
| Investment Income: | | | | |
| Interest | | $ | 8,219,959 | |
| Dividends | | | 66,863 | |
| Total investment income. | | | 8,286,822 | |
| Expenses: | | | | |
| Investment advisory fees | | | 982,027 | |
| Shareholders service fees | | | 109,114 | |
| Administration fees. | | | 90,246 | |
| Trustees' fees | | | 74,316 | |
| Transfer agent fees | | | 55,599 | |
| Registration and filing fees | | | 26,325 | |
| Audit fees | | | 23,491 | |
| Custodian fees | | | 20,216 | |
| Legal fees | | | 17,779 | |
| Reports — printing | | | 9,292 | |
| Other | | | 19,779 | |
| Total expenses before interest expense. | | | 1,428,184 | |
| Interest expense | | | 985,999 | |
| Total expenses | | | 2,414,183 | |
| Net investment income | | | 5,872,639 | |
| Net realized and unrealized gain (loss) on investments: | | | | |
| Net realized gain on sales of investments | | | 4,588,134 | |
| Net change in unrealized depreciation of investments | | | (1,623,372 | ) |
| Net realized and unrealized gain on investments | | | 2,964,762 | |
| Net increase in net assets from operations | | $ | 8,837,401 | |
The accompanying notes are an integral part of these financial statements.
40 | 86 Strategic Income Fund | Annual Report |
Statement of Changes in Net Assets | |
| For the Year Ended June 30, | |
| | | | 2005 | | | 2004 | |
| Operations: | | | | | | | |
| Net investment income | | $ | 5,872,639 | | $ | 6,447,244 | |
| Net realized gain (loss) on sales of investments | | | 4,588,134 | | | 6,387,784 | |
| Net change in unrealized depreciation of investments | | | (1,623,372 | ) | | (2,308,821 | ) |
| Net increase from operations | | | 8,837,401 | | | 10,526,207 | |
| Distributions to shareholders: | | | | | | | |
| Net investment income | | | (5,878,689 | ) | | (6,438,483 | ) |
| Net decrease from distributions | | | (5,878,689 | ) | | (6,438,483 | ) |
| Capital Share Transactions: | | | | | | | |
| Reinvestment of distributions | | | | | | | |
| (including $0 and $11,349 paid to Conseco, Inc., respectively) | | | — | | | 33,444 | |
| Net increase from capital share transactions | | | — | | | 33,444 | |
| Total increase in net assets | | | 2,958,712 | | | 4,121,168 | |
| Net assets: | | | | | | | |
| Beginning of year | | | 73,876,017 | | | 69,754,849 | |
| End of year | | $ | 76,834,729 | | $ | 73,876,017 | |
| Share data: | | | | | | | |
| Reinvestment of distributions | | | — | | | 3,129 | |
| Net increase | | | — | | | 3,129 | |
| Shares outstanding: | | | | | | | |
| Beginning of year | | | 6,839,661 | | | 6,836,532 | |
| End of year | | | 6,839,661 | | | 6,839,661 | |
The accompanying notes are an integral part of these financial statements.
40 | 86 Strategic Income Fund | Annual Report |
Statement of Cash Flows | |
| For the Year Ended June 30, | |
| | | | 2005 | |
CASH FLOWS FROM OPERATING ACTIVITIES: | | | | |
| Investment income | | $ | 7,684,002 | |
| Interest expense paid | | | (897,116 | ) |
| Operating expenses paid | | | (1,288,480 | ) |
| Net cash provided by operating activities | | | 5,498,406 | |
CASH FLOWS FROM INVESTING ACTIVITIES: | | | | |
| Proceeds from sales of investments | | | 160,403,455 | |
| Purchases of investments | | | (178,099,621 | ) |
| Net (increase) decrease in short-term investments | | | (374,708 | ) |
| Net cash provided by (used for) investing activities | | | (18,070,874 | ) |
CASH FLOWS FROM FINANCING ACTIVITIES: | | | | |
| Cash distributions paid (net of reinvestment of $0 and $33,444, respectively) . | | | (5,787,722 | ) |
| Net increase (decrease) in loans outstanding | | | 18,500,000 | |
| Net cash provided by (used for) financing activities | | | 12,712,278 | |
| Net increase (decrease) in cash | | | 139,810 | |
| Cash at beginning of year | | | (100,797 | ) |
| Cash at end of year | | $ | 39,013 | |
Reconciliation of Net Investment Income to Net Cash Provided By Operating Activities: | | | | |
| Net investment income | | $ | 5,872,639 | |
| Net decrease (increase) in interest and dividends receivable | | | (551,510 | ) |
| Net decrease (increase) in other assets | | | 467 | |
| Net increase (decrease) in payable to Conseco, Inc. subsidiaries | | | 111,576 | |
| Net increase (decrease) in accrued expenses | | | 27,661 | |
| Net increase (decrease) in interest payable | | | 88,883 | |
| Payment in kind bonds | | | — | |
| Accretion and amortization of discounts and premiums | | | (51,310 | ) |
| Net cash provided by operating activities. | | $ | 5,498,406 | |
The accompanying notes are an integral part of these financial statements.
40 | 86 Strategic Income Fund | Annual Report |
Financial Highlights | |
| For a share outstanding during the Year Ended June 30, | |
| | | | 2005 | | | 2004 | | | 2003 | | | 2002 | | | 2001 | |
| Net asset value per share, | | | | | | | | | | | | | | | | |
| beginning of year | | $ | 10.80 | | $ | 10.20 | | $ | 7.81 | | $ | 9.28 | | $ | 11.15 | |
| Income from investment operations (a): | | | | | | | | | | | | | | | | |
| Net investment income | | | 0.86 | | | 0.94 | | | 0.96 | | | 1.01 | | | 1.11 | |
| Net realized gain (loss) and change in unrealized appreciation (depreciation) on investments | | | 0.43 | | | 0.60 | | | 2.38 | | | (1.47 | ) | | (1.89 | ) |
| Net increase (decrease) from investment operations | | | 1.29 | | | 1.54 | | | 3.34 | | | (0.46 | ) | | (0.78 | ) |
| Distributions: | | | | | | | | | | | | | | | | |
| Net investment income | | | (0.86 | ) | | (0.94 | ) | | (0.95 | ) | | (1.01 | ) | | (1.09 | ) |
| Net decrease from distributions | | | (0.86 | ) | | (0.94 | ) | | (0.95 | ) | | (1.01 | ) | | (1.09 | ) |
| Net asset value per share, end of year. | | $ | 11.23 | | $ | 10.80 | | $ | 10.20 | | $ | 7.81 | | $ | 9.28 | |
| Per share market value, end of year | | $ | 10.13 | | $ | 9.60 | | $ | 10.17 | | $ | 7.82 | | $ | 9.51 | |
| Total return (b) | | | 14.84 | % | | 3.30 | % | | 45.80 | % | | (7.60 | %) | | 3.39 | % |
| Ratios/supplemental data: | | | | | | | | | | | | | | | | |
| Net assets (dollars in thousands), end of year. | | $ | 76,835 | | $ | 73,876 | | $ | 69,755 | | $ | 53,170 | | $ | 62,753 | |
| Ratios of expenses to average net assets | | | 3.13 | % | | 2.38 | % | | 2.84 | % | | 3.13 | % | | 4.04 | % |
| Ratios of operating expenses to average net assets (c). | | | 1.85 | % | | 1.79 | % | | 1.98 | % | | 1.93 | % | | 1.80 | % |
| Ratios of net investment income to average net assets | | | 7.60 | % | | 8.77 | % | | 11.43 | % | | 11.47 | % | | 10.95 | % |
| Portfolio turnover | | | 150 | % | | 113 | % | | 112 | % | | 248 | % | | 213 | % |
____________
| (a) | Per share amounts presented are based on an average of monthly shares outstanding throughout the period indicated. |
| (b) | Total return is calculated assuming a purchase of common stock at the current market price on the first day and a sale at the current market price on the last day of each period. Dividends and distributions, if any, are assumed for purposes of this calculation to be reinvested at prices obtained under the Fund's dividend reinvestment plan. Total investment return does not reflect brokerage commissions or sales charges. |
| (c) | Excluding interest expense. |
The accompanying notes are an integral part of these financial statements.
40 | 86 Strategic Income Fund | Annual Report |
Notes to Financial Statements | |
1. ORGANIZATION
The 40|86 Strategic Income Fund (formerly, the Conseco Strategic Income Fund) (the "Fund") was organized as a business trust under the laws of the Commonwealth of Massachusetts on June 2, 1998, and commenced operations on July 31, 1998. The Fund is registered with the Securities and Exchange Commission (“SEC”) under the Investment Company Act of 1940 (the “1940 Act”), as amended, as a closed-end, non-diversified management investment company. At June 30, 2005, Conseco, Inc. (“Conseco”) owned 13,894 shares of the Fund’s common stock.
2. SIGNIFICANT ACCOUNTING POLICIES
Security Valuation, Transactions and Related Investment Income
Investment transactions are accounted for on the trade date. The cost of investments sold is determined by use of the specific identification method for both financial reporting and income tax reporting purposes. Interest income is recorded on an accrual basis; dividend income is recorded on the ex-dividend date. The Fund holds investments that are restricted as to resale with a cost of $35,809,812 and a market value of $36,409,173 under Rule 144A of the Securities Act of 1933. These securities represent 47.39% of the net assets of the Fund. These securities may be resold to qualified institutional buyers in transactions exempt from registration.
Investments are stated at market value in the accompanying financial statements. Values for fixed income and other securities are provided by third-party pricing services. Securities traded in the over-the-counter market are valued at the mean between the closing bid and asked prices or, if such data is not available, at the most recently available prices or under policies adopted by the Board of Trustees. Securities traded on stock exchanges are valued at the last sale price as of the close of business on the date of determination or, lacking any sales, at the mean between the closing bid and asked prices. Fund securities, which are traded both in the over-the-counter market and on an exchange, are valued according to the broadest and most representative market, and it is expected that for debt securities this ordinarily will be the over-the-counter market. Securities for which market quotations are not readily available are valued at fair value as determined in good faith by or under the supervision of the Board of Trustees. Debt securities purchased with maturities of sixty days or less are valued at amortized cost.
Investments held by the Fund may be purchased with accrued interest, and the investments owned by the Fund may accrue interest during the period the investment is owned by the Fund. If an investment owned by the Fund experiences a default and has accrued interest from purchase or has recorded accrued interest during the period it is owned, the Fund’s policy is to cease interest accruals from the time the investments are traded as “flat” in the market. The Fund evaluates the collectibility of purchased accrued interest and previously recorded interest on an investment-by-investment basis.
Distribution of Income and Gains
The Fund intends to distribute monthly to shareholders substantially all of its net investment income and to distribute, at least annually, any net realized capital gains in excess of net realized capital losses (including any capital loss carryovers). However, the Board of Trustees may decide to declare dividends at other intervals.
Federal Income Taxes
For federal income tax purposes, the Fund intends to qualify as a regulated investment company under Subchapter M of the Internal Revenue Code by distributing substantially all of its taxable income and net capital gains to its shareholders annually and otherwise complying with the requirements for regulated investment companies. Therefore, no provision has been made for federal income taxes.
Income and Capital Gain distributions are determined in accordance with federal income tax regulations which may differ from GAAP. The tax character of distributions paid during the year ended June 30, 2005 and June 30, 2004 were as follows:
| Ordinary income (2005) | | $ | 5,787,722 | |
| Ordinary income (2004) | | | 6,371,292 | |
At June 30, 2005, the components of net assets (excluding paid in capital) on a tax basis were as follows:
| Undistributed Ordinary Income | | $ | 109,361 | |
| Capital Loss and other loss carryovers | | | (26,761,787 | ) |
| Accumulated Earnings | | | (26,652,426 | ) |
| Unrealized Appreciation — Tax | | | 2,277,349 | |
| Total Accumulated Earnings (Deficit) | | $ | (24,375,077 | ) |
The differences between book and tax basis net unrealized appreciation are primarily attributable to wash sales. The cumulative timing difference for ordinary income is due to the timing of distributions. The cumulative timing difference for the capital loss carryover is due to Wash Sales.
| Net Asset Value | | $ | 76,834,729 | |
| Paid in Capital | | | (101,209,806 | ) |
| Net assets (excluding paid in capital) | | $ | (24,375,077 | ) |
During the year ended June 30, 2005, the Fund used capital loss carryforwards of $4,513,347. As of June 30, 2005, the Fund had a total capital loss carryover of $26,761,787 which is available to offset future net realized gains on securities transactions to the extent provided for in the Internal Revenue Code. The capital loss of $16,920,009 will expire in 2008, $5,367,863 in 2009, and $4,473,915 in 2010.
40 | 86 Strategic Income Fund | Annual Report |
Notes to Financial Statements (continued) | June 30, 2005 |
Use of Estimates
The preparation of financial statements in conformity with accounting principles generally accepted in the United States of America requires management to make estimates and assumptions that affect the reported amounts of assets and liabilities and disclosure of contingent assets and liabilities, as of the date of the financial statements, and the reported amount of increases and decreases in net assets from operations during the reporting period. Actual results could differ from those estimates.
3. OTHER EXPENSES
The Fund pays expenses of Trustees who are not affiliated persons of the Fund or 40|86 Advisors, Inc. (the “Adviser” and “Administrator”), a wholly-owned subsidiary of Conseco. The Fund pays each of its Trustees who is not a Trustee, officer or employee of the Adviser, the Administrator or any affiliate thereof an annual fee of $7,500 plus $1,500 for each Board of Trustees meeting attended. Additionally, each Trustee receives a fee of $500 for Board meetings and separate committee meetings attended that are conducted by telephone. The Board Chairman receives an additional $375 for each meeting attended. The Fund reimburses all Trustees for travel and out-of-pocket expenses incurred in connection with Board of Trustees meetings.
4. TRANSACTIONS WITH AFFILIATES
Investment Management and Administration Agreement
The Adviser serves as the Investment Manager and Administrator to the Fund under the terms of the Investment Management and Administration Agreement. The Adviser supervises the Fund’s management and investment program, performs a variety of services in connection with management and operation of the Fund and pays all compensation of officers and Trustees of the Fund who are affiliated persons of the Adviser or the Fund. As compensation for its services to the Fund, the Fund has agreed to pay the Adviser a monthly advisory fee equal to an annual rate of 0.90 percent of the value of the average weekly value of the total assets of the Fund less the sum of accrued liabilities (other than the aggregate indebtedness constituting financial leverage) (the “Managed Assets”). The total fees incurred for such services for the year ended June 30, 2005 were $982,027.
Shareholder Servicing Agreement
Conseco Services, LLC, a wholly-owned subsidiary of Conseco, acts as the Shareholder Servicing Agent to the Fund under the Shareholder Service Agreement. As compensation for its services, the Fund has agreed to pay Conseco Services, LLC a monthly shareholder servicing fee equal to an annual rate of 0.10 percent of the Managed Assets. The total fees incurred for such services for the year ended June 30, 2005 were $109,114.
5. ADMINISTRATION AGREEMENT
The Fund contracted for certain administration services with PFPC, Inc. (“PFPC”). For its services, PFPC receives a monthly fee equal to an annual rate of 0.105 percent of the first $250 million of average weekly net assets; 0.080 percent of the next $250 million of average weekly net assets; 0.055 percent of the next $250 million of average weekly net assets; and 0.035 percent of average weekly net assets in excess of $750 million, subject to a minimum monthly charge of $7,500. The total fees incurred for such services for the year ended June 30, 2005 were $90,246.
6. PORTFOLIO ACTIVITY
Purchases and sales of securities other than short-term obligations aggregated $174,231,520 and $158,834,428, respectively, for the year ended June 30, 2005.
7. INDEBTEDNESS
The Fund expects to utilize financial leverage through borrowings, including the issuance of debt securities, preferred shares or through other transactions, such as reverse repurchase agreements, which have the effect of financial leverage. There can be no assurance that a leveraging strategy will be successful during any period in which it is used. The Fund intends to utilize leverage to provide the shareholders with a potentially higher return. Leverage creates risks for the shareholders, including the likelihood of greater volatility of net asset value and market price of the shares, and the risk of fluctuations in interest rates on borrowings.
Loan Agreement
The Fund entered into a secured Loan and Pledge Agreement with Custodial Trust Company (the “Agreement”) on October 4, 2000. The Agreement is callable on demand. Under the Agreement, the aggregate amount of the loans outstanding may not exceed 331/3 percent of total assets (including the amount obtained through leverage). Borrowings bear interest at the Federal Funds Rate plus a margin of 0.75 percent. Interest payments are made monthly. Advances made under the Agreement are due and payable on demand. The Fund shall maintain a pledge account which gives the Custodial Trust Company as pledgee effective control over the Fund assets with a collateral value greater than the sum of the outstanding aggregate principal amount of the loans and the interest accrued thereon. The Fund is required to maintain asset coverage, as defined in the Agreement, of at least 3:1. Portfolio securities with an aggregate value of $78,453,265 were included in the pledge account at June 30, 2005. The Fund was in compliance with the terms of the agreement at June 30, 2005.
40 | 86 Strategic Income Fund | Annual Report |
Notes to Financial Statements (continued) | June 30, 2005 |
Borrowings at June 30, 2005 totaled $36.5 million and the interest rate on such borrowings was 4.125 percent.
| Average daily balance of loans outstanding during the year ended June 30, 2005 | | $ | 31,876,592 | |
| Weighted average interest rate for the period | | | 2.94 | % |
| Maximum amount of loans outstanding at any month-end during the year ended June 30, 2005 | | $ | 36,549,194 | |
| Maximum percentage of total assets at any month-end during the year ended June 30, 2005 | | | 31.74 | % |
| Amount of loans outstanding at June 30, 2005 | | $ | 36,549,194 | |
| Percentage of total assets at June 30, 2005 | | | 31.74 | % |
8. INDEMNIFICATIONS
Under the Fund’s organizational documents, its officers and trustees are indemnified against certain liabilities arising out of the performance of their duties to the Fund. In addition, in the normal course of business, the Fund enters into contracts with its vendors and others that provide for general indemnifications. The Fund’s maximum exposure under these arrangements is unknown, as this would involve future claims that may be made against the Fund. However, based on experience, the Fund expects the risk of loss to be remote.
Report of Independent Registered Public Accounting Firm
To the Board of Trustees and Shareholders of the 40 | 86 Strategic Income Fund:
In our opinion, the accompanying statement of assets and liabilities, including the schedule of investments, and the related statements of operations, changes in net assets and cash flows, and the financial highlights present fairly, in all material aspects, the financial position of the 40|86 Strategic Income Fund (the “Fund”) at June 30, 2005, the results of its operations for the year then ended, the changes in its net assets for each of the two years in the period then ended and its cash flows for the year then ended and the financial highlights for each of the five years in the period then ended, in conformity with accounting principles generally accepted in the United States of America. These financial statements are the responsibility of the Fund’s management. Our responsibility is to express an opinion on these financial statements based on our audits. We conducted our audits of these statements in accordance with the standards of the Public Company Accounting Oversight Board (United States). Those standards require that we plan and perform the audit to obtain reasonable assurance about whether the financial statements are free of material misstatement. An audit includes examining, on a test basis, evidence supporting the amounts and disclosures in the financial statements, assessing the accounting principles used and significant estimates made by management, and evaluating the overall financial statement presentation. We believe that our audits, which included confirmation of securities at June 30, 2005 by correspondence with the custodian and brokers, provide a reasonable basis for our opinion.

Indianapolis, Indiana
August 17, 2005
40 | 86 Strategic Income Fund | Annual Report |
Automatic Dividend Reinvestment Plan (unaudited) | |
Pursuant to the Fund’s Automatic Dividend Reinvestment Plan (the “DRIP”), unless a shareholder otherwise elects, all dividends and capital gain distributions will be automatically reinvested in additional shares by PFPC, Inc. (“PFPC”), as agent for shareholders in administering the DRIP (the “DRIP Agent”). Shareholders who elect not to participate in the DRIP will receive all dividends and other distributions in cash paid by check mailed directly to the shareholder of record (or, if the shares are held in street or other nominee name, then to such nominee) by PFPC as dividend disbursing agent. DRIP participants may elect not to participate in the DRIP and to receive all dividends and capital gain distributions in cash by sending written instructions to PFPC, as dividend disbursing agent, at the address set forth below. Participation in the DRIP is completely voluntary and may be terminated or resumed at any time without penalty by written notice if received by the DRIP Agent not less than ten days prior to any distribution record date; otherwise such termination will be effective with respect to any subsequently declared dividend or other distribution.
Whenever the Fund declares an income dividend or a capital gain distribution (collectively referred to in this section as “dividends”) payable either in shares or in cash, non-participants in the DRIP will receive cash and participants in the DRIP will receive the equivalent in shares. The shares will be acquired by the DRIP Agent or an independent broker-dealer for the participants’ accounts, depending upon the circumstances described below, either: (i) through receipt of additional unissued but authorized shares from the Fund (“newly issued shares”); or (ii) by purchase of outstanding shares on the open market (“open market purchases”) on the NYSE or elsewhere. If on the payment date for the dividend, the net asset value per share is equal to or less than the market price per share plus estimated brokerage commissions (such condition being referred to herein as “market premium”), the DRIP Agent will invest the dividend amount in newly issued shares on behalf of the participants. The number of newly issued shares to be credited to each participant’s account will be determined by dividing the dollar amount of the dividend by the net asset value per share on the date the shares are issued, provided that the maximum discount from the then current market price per share on the date of issuance may not exceed 5%. If on the dividend payment date, the net asset value per share is greater than the market value thereof (such condition being referred to herein as “market discount”), the DRIP Agent will invest the dividend amount in shares acquired on behalf of the participants in open-market purchases.
In the event of a market discount on the dividend payment date, the DRIP Agent will have until the last business day before the next date on which the shares trade on an “ex-dividend” basis, but no more than 30 days after the dividend payment date, to invest the dividend amount in shares acquired in open-market purchases. It is contemplated that the Fund will pay monthly income dividends. Therefore, the period during which open-market purchases can be made will exist only from the payment date of the dividend through the date before the next “ex-dividend” date, which typically will be approximately ten days. If, before the DRIP Agent has completed its open-market purchases, the market price of a share exceeds the net asset value per share, the average per share purchase price paid by the DRIP Agent may exceed the net asset value per share, resulting in the acquisition of fewer shares than if the dividend had been paid in newly issued shares on the dividend payment date. Because of the foregoing difficulty with respect to open-market purchases, the DRIP provides that if the DRIP Agent is unable to invest the full dividend amount in open-market purchases during the purchase period or if the market discount shifts to a market premium during the purchase period, the DRIP Agent will cease making open-market purchases and will invest the uninvested portion of the dividend amount in newly issued shares at the close of business on the earlier of the last day of the purchase period or the first day during the purchase period on which the market discount shifts to a market premium. The DRIP Agent maintains all shareholders’ accounts in the DRIP and furnishes written confirmation of all transactions in the accounts, including information needed by shareholders for tax records. Shares in the account of each DRIP participant will be held on his or her behalf by the DRIP Agent on behalf of the DRIP participant, and each shareholder proxy will include those shares purchased or received pursuant to the DRIP. The DRIP Agent will forward all proxy solicitation materials to participants and vote proxies for shares held pursuant to the DRIP in accordance with the instructions of the participants.
In the case of shareholders such as banks, brokers or nominees that hold shares for others who are the beneficial owners, the DRIP Agent will administer the DRIP on the basis of the number of shares certified from time to time by the record shareholder’s name and held for the account of beneficial owners who participate in the DRIP.
There will be no brokerage charges with respect to shares issued directly by the Fund as a result of dividends payable either in shares or in cash. However, each participant will pay a pro rata share of brokerage commissions incurred with respect to the DRIP Agents open-market purchases in connection with the reinvestment of dividends.
The automatic reinvestment of dividends will not relieve participants of any federal, state or local income tax that may be payable (or required to be withheld) on the dividends. Shareholders participating in the DRIP may receive benefits not available to shareholders not participating in the DRIP. If the market price (plus commissions) of the Fund’s shares is above their net asset value, participants of the DRIP will receive shares of the Fund at less than they could otherwise purchase them and will have shares with a cash value greater than the value of any cash distribution they would have received on their shares. If the market price (plus commissions) is below the net asset value, participants will receive distributions in shares with a net asset value greater than the value of any cash distribution they would have received on their shares. However, there may be insufficient shares available in the market to make distributions in shares at prices below the net asset value. Also, because the Fund does not redeem its shares, the price on resale may be more or less than the net asset value.
40 | 86 Strategic Income Fund | Annual Report |
Automatic Dividend Reinvestment Plan (unaudited) (continued) | |
Experience under the DRIP may indicate that changes are desirable. Accordingly, the Fund reserves the right to amend or terminate the DRIP. There is no direct service charge to participants in the DRIP, however, the Fund reserves the right to amend the DRIP to include a service charge payable by the participants.
All correspondence concerning the DRIP should be directed to the DRIP Agent at PFPC, Inc., PO Box 43027, Providence, RI 02940-3027.
Federal Tax Information (unaudited)
For the year ended June 30, 2005, 1% of ordinary income distributions paid by the Fund may be subject to a maximum tax rate of 15%, as provided by the Jobs and Growth Tax Relief and Reconciliation Act of 2003. The Fund intends to designate the maximum amount allowable as taxed at a maximum rate of 15%. Complete information will be reported in conjunction with your 2005 Form 1099-DIV. For corporate shareholders, 1% of ordinary income distributions paid by the Fund qualifies for the dividend received deduction.
Portfolio Management of the Fund
Amy L. Gibson, CFA and Richard M. Matas are the Fund’s portfolio managers. Ms. Gibson joined 40|86 Advisors, Inc. (“40|86”) in 2000 and is the head of the high yield group. Additionally, she is responsible for oversight of the bank loan, collateralized debt obligations and high yield portfolios. Prior to joining 40|86, she was a vice president and high yield portfolio manager at Lincoln National Corp. Ms. Gibson has a B.S. in economics from Indiana University, graduating magna cum laude, and an M.B.A. from Indiana University with a concentration in finance. Mr. Matas is a high yield trader for 40|86. He is also responsible for providing portfolio management support for collateralized bond obligations and high yield portfolios. Prior to joining 40|86 in 1999, Mr. Matas was a personal financial analyst with American Express Financial Advisors. Mr. Matas has a B.A. degree from Anderson University and holds Series 7 and 63 licenses with the NASD.
Management of the Fund
On June 28, 2005, Audrey L. Kurzawa was elected president of the Fund, replacing Gregory J. Hahn, who resigned as president and trustee effective June 27, 2005. Ms. Kurzawa, formerly treasurer of the Fund, will also serve as a Fund trustee for the remainder of Mr. Hahn’s unexpired term. Daniel J. Murphy, formerly the Fund's assistant treasurer, was named treasurer.
Ms. Kurzawa is the controller and a senior vice president of 40|86 Advisors, Inc., the Fund’s investment adviser. Previously, she held positions in the corporate finance department at Conseco, Inc. and was a senior auditor with KPMG Peat Marwick.
40 | 86 Strategic Income Fund | Annual Report |
Board of Trustees Approval of Investment Advisory Contract | June 30, 2005 |
Members of the Board of Trustees (the “Board” or “Trustees”) of 40|86 Strategic Income Fund (the “Fund”) were advised by, and met in executive session with, independent legal counsel to consider the Fund’s investment management and administration agreement with 40|86 Advisors, Inc. (the “Adviser”). Based upon the evaluation of the information provided, the Board, at a meeting held May 19th, approved the continuation of the investment management and administration agreement of the Fund for a period through July 27, 2006. The Board based its decision upon its most recent evaluation of the Adviser’s investment staff, portfolio process and performance. The Trustees considered the factors discussed below, among others. No single factor determined whether the Board approved the arrangement. Rather, it was the totality of the circumstances that drove the Trustee’s decision.
Nature and Quality of Services Provided by the Adviser
The Trustees noted that the Adviser, subject to the Board’s control, administers the Fund's business and other affairs. The Adviser manages the investment of the assets of the Fund, including making purchases and sales of portfolio securities consistent with the Fund's investment objective and policies. The Adviser also provides the Fund with such office space, administrative and other services and executive and other personnel as are necessary for the Fund's operations. The Adviser pays all of the compensation of Trustees who are affiliated persons of the Adviser and of the officers of the Fund. The Trustees considered the scope and quality of services provided by the Adviser under the Investment Management and Administration Agreement and noted that the scope of services provided had expanded over time as a result of regulatory and other developments. The Trustees noted that, for example, the Adviser is responsible for maintaining and monitoring its own and, to varying degrees, the Fund's compliance programs, and these compliance programs have recently been refined and enhanced in light of new regulatory requirements. The Trustees considered the quality of the investment capabilities of the Adviser and the other resources it has dedicated to performing services for the Fund. The quality of administrative and other services, including the Adviser's role in coordinating the activities of the Fund's other service providers, were also considered. The Trustees concluded that, overall, they were satisfied with the nature, extent and quality of services provided to the Fund under the Investment Management and Administration Agreement.
Performance
In addition to the information reviewed by the Trustees in connection with the meeting, the Trustees had received performance information for the Fund at each regular Board meeting during the year. At the meeting, the Trustees received oral presentations from the Adviser on the current and historical performance of the Fund. The Trustees noted that the current and historical performance for the Fund exceeded the peer group median in nearly every period of measurement.
Based on their review and their discussion of the Fund's investment performance with the Adviser, the Trustees expressed confidence in the Adviser's ability to continue to manage the Fund and concluded that the Fund's investment performance was acceptable. The Board informed the Adviser that they planned to closely monitor the Fund's continued investment performance.
Management Fee and Total Operating Expenses
The Trustees compared the management fee payable to the Adviser, with and without the effect of leverage, with the comparative management fee information for other closed-end funds managed in a similar style. The Board recognized that it is difficult to make comparisons of management fees because there are variations in the services that are included in the fees paid by other closed-end funds. The Trustees noted that while the management fee for some comparative funds was lower than for the Fund, the management fee for the Fund was within the median and average for the presented peer group. The Trustees concluded that the Fund’s management fee was satisfactory. The Board also compared the total operating expenses, with and without the effect of leverage, for the Fund with the total operating expenses charged by other closed-end funds managed in a similar style. The Trustees recognized that the total operating expense information reflects upon the Adviser's overall provision of services, as the Adviser is responsible for coordinating services provided to the Fund by others. The Trustees noted that while the total operating expenses for some comparative closed-end funds was lower than those of the Fund, the total operating expenses for the Fund was within the median and average for the presented peer group. The Trustees concluded that the Fund’s total operating expenses were satisfactory.
Profitability
The Board reviewed a schedule of the revenues, expenses and related notes indicating the profitability of the Fund to the Adviser for 2004. The Board reviewed the assumptions and methods of allocation used by the Adviser in preparing the profitability data. The Board noted that the Adviser believed that the methods of allocation used in preparing the profitability information were reasonable and appropriate and that there is no generally accepted allocation methodology for information of this type. The Trustees recognized that comparative profitability information is not generally publicly available and is affected by numerous factors, including the structure of the particular adviser, the types of funds it manages, its business mix, numerous assumptions regarding allocations and the adviser's capital structure and cost of capital.
40 | 86 Strategic Income Fund | Annual Report |
Board of Trustees Approval of Investment Advisory Contract (continued) | |
The Board recognized that the Adviser is entitled to earn a reasonable level of profits for the services it provides to the Fund and, based upon their review, concluded that the Adviser's profitability from its relationship with the Fund was not excessive.
Economies of Scale
The Trustees determined, based upon their discussions and the materials provided to them by the Adviser, that the benefits derived by the Adviser through economies of scale relative to the Fund were not excessive.
After full consideration of the above factors as well as other factors, the Board concluded that the approval of the Fund’s agreement was in the best interest of the Fund and its shareholders.
40 | 86 Strategic Income Fund | Annual Report |
Board of Trustees and Officers (unaudited) | |
Name (Age) | Position Held | Principal Occupation(s) |
Address | With Trust | During Past 5 Years |
David N. Walthall (59) 11815 N. Pennsylvania St. Carmel, IN 46032 | Chairman of the Board Since March 2004 and Trustee Since December 1998 | Principal, Walthall Asset Management. Director, Da-Lite Screen Company, Former President, Chief Executive Officer and Director of Lyrick Corporation. Formerly, President and CEO, Heritage Media Corporation. Formerly, Director, Eagle National Bank. Chairman of the Board and Trustee of one other mutual fund managed by the Adviser. |
| | | |
Audrey L. Kurzawa* (38) 11815 N. Pennsylvania St. Carmel, IN 46032 | President and Trustee Since June 2005 and Formerly Treasurer Since October 2002 | Certified Public Accountant. Controller, Adviser. President and Trustee of one other mutual fund managed by the Adviser. |
| | | |
Harold W. Hartley (81) 11815 N. Pennsylvania St. Carmel, IN 46032 | Trustee Since July 1998 | Chartered Financial Analyst. Director, Ennis, Inc. Retired, Executive Vice President, Tenneco Financial Services, Inc. Trustee of one other mutual fund managed by the Adviser. |
| | | |
Dr. R. Jan LeCroy (73) 11815 N. Pennsylvania St. Carmel, IN 46032 | Trustee Since July 1998 | Director, SWS Group, Inc. Retired, President, Dallas Citizens Council. Trustee of one other mutual fund managed by the Adviser. |
| | | |
Diana H. Hamilton (48) 11815 N. Pennsylvania St. Carmel, IN 46032 | Trustee Since December 2004 | President, Sycamore Advisors, LLC, a municipal finance advisory firm; Formerly, State of Indiana Director of Public Finance. Trustee of one other mutual fund managed by the Adviser. |
| | | |
R. Matthew Neff (49) 11815 N. Pennsylvania St. Carmel, IN 46032 | Trustee Since December 2004 | Chairman and Co-Chief Executive Officer of Senex Financial Corp., a financial services company engaged in the healthcare finance field. Trustee of one other mutual fund managed by the Adviser. |
| | | |
William T. Devanney (49) 11815 N. Pennsylvania St. Carmel, IN 46032 | Vice President Since July 1998 | Senior Vice President, Corporate Taxes of Conseco Services, LLC and various affiliates. Vice President of one other mutual fund managed by the Adviser. |
| | | |
Daniel Murphy (49) 11815 N. Pennsylvania St. Carmel, IN 46032 | Treasurer Since June 2005 | Senior Vice President and Treasurer, Conseco, Inc. Treasurer of one other mutual fund managed by the Adviser. |
| | | |
Jeffrey M. Stautz (47) 11815 N. Pennsylvania St. Carmel, IN 46032 | Chief Legal Officer and Secretary Since May 2005 | Vice President, General Counsel, Secretary and Chief Compliance Officer, Adviser. Chief Legal Officer and Secretary of one other mutual fund managed by the Adviser. |
| | | |
Sarah L. Bertrand (37) 11815 N. Pennsylvania St. Carmel, IN 46032 | Chief Compliance Officer and Assistant Secretary Since December 2004 | Assistant Vice President, Legal and Compliance, Adviser. Chief Compliance Officer and Assistant Secretary of one other mutual fund managed by the Adviser. |
____________
* The Trustee so indicated is an ”interested person,” as defined in the 1940 Act, of the Trust due to the positions indicated with the Adviser and its affiliates. Each Trustee serves until the expiration of the term of his designated class and until his successor is elected and qualified, or until his death or resignation, or removal as provided in the Fund’s by—laws or charter or statute.
All Trustees oversee the 7 portfolios that make up the total fund complex including 40|86 Strategic Income Fund (1) and 40|86 Series Trust (6).
40 | 86 Strategic Income Fund | Annual Report |
| INVESTMENT ADVISER | INDEPENDENT REGISTERED PUBLIC | LEGAL COUNSEL |
| 40|86 Advisors, Inc. | ACCOUNTING FIRM | Kirkpatrick & Lockhart |
| Carmel, IN | PricewaterhouseCoopers LLP | Nicholson Graham LLP |
| | Indianapolis, IN | Washington, DC |
| TRANSFER AGENT | CUSTODIAN |
| PFPC, Inc. | PFPC Trust Company |
| Providence, RI | Philadelphia, PA |
PROXY VOTING POLICIES AND PROCEDURES
A description of the policies and procedures that the Fund uses to determine how to vote proxies relating to portfolio securities is available without charge, upon request, by calling (800) 852-4750. Furthermore, you can obtain the description on the SEC’s website at http://www.sec.gov.
PROXY VOTING RECORDS FOR THE 12-MONTH PERIOD ENDED JUNE 30, 2005
Information regarding how the Fund voted proxies relating to portfolio securities during the most recent 12-month period ended June 30 is available without charge, upon request, by calling (800) 852-4750. Furthermore, you can obtain the Fund’s proxy voting records on the SEC’s website at http://www.sec.gov.
AVAILABILITY OF QUARTERLY PORTFOLIO SCHEDULE
The Fund files its complete schedule of portfolio holdings with the SEC for the first and third quarters of each fiscal year on Form N-Q. The filing for the most recent quarter is available without charge, upon request, by calling (800) 852-4750. Furthermore, you can obtain the Fund’s quarterly portfolio schedule on the SEC’s website at http://www.sec.gov. The Fund’s Forms N-Q may also be reviewed and copied at the SEC’s Public Reference Room in Washington, DC, and information on the operation of the Public Reference Room may be obtained by calling (800) SEC-0330.
40|86 STRATEGIC INCOME FUND
11815 N. Pennsylvania Street Carmel, IN 46032
800-852-4750
40|86 STRATEGIC INCOME FUND
11815 N. Pennsylvania Street
Carmel, IN 46032
Item 2. Code of Ethics.
| (a) | The registrant, as of the end of the period covered by this report, has adopted a code of ethics that applies to the registrant’s principal executive officer, principal financial officer, principal accounting officer or controller, or persons performing similar functions, regardless of whether these individuals are employed by the registrant or a third party. |
| | (c) | There have been no amendments, during the period covered by this report, to a provision of the code of ethics that applies to the registrant’s principal executive officer, principal financial officer, principal accounting officer or controller, or persons performing similar functions, regardless of whether these individuals are employed by the registrant or a third party, and that relates to any element of the code of ethics description. |
| | (d) | The registrant has not granted any waivers, including an implicit waiver, from a provision of the code of ethics that applies to the registrant’s principal executive officer, principal financial officer, principal accounting officer or controller, or persons performing similar functions, regardless of whether these individuals are employed by the registrant or a third party, that relates to one or more of the items set forth in paragraph (b) of this item’s instructions. |
The registrant undertakes to provide to any person without charge, upon request, a copy of its code of ethics by mail when they call the registrant at 1-800-852-4750.
Item 3. Audit Committee Financial Expert.
As of the end of the period covered by the report, the registrant’s board of trustees has determined that Harold W. Hartley is qualified to serve as an audit committee financial expert serving on its audit committee and that he is "independent," as defined by Item 3 of Form N-CSR.
Item 4. Principal Accountant Fees and Services.
Audit Fees
| (a) | The aggregate fees billed for each of the last two fiscal years for professional services rendered by the principal accountant for the audit of the registrant's annual financial statements or services that are normally provided by the accountant in connection with statutory and regulatory filings or engagements for those fiscal years are $23,400 for the year ended June 30, 2004 and $23,815 for the year ended June 30, 2005. |
Audit-Related Fees
| (b) | There were no fees billed in either of the last two fiscal years for assurance and related services by the principal accountant that are reasonably related to the performance of the audit of the registrant's financial statements and are not reported under paragraph (a) of this Item. |
Tax Fees
| (c) | The aggregate fees billed in each of the last two fiscal years for professional services rendered by the principal accountant for tax compliance, tax advice, and tax planning are $2,700 for the year ended June 30, 2004 and $2,600 for the year ended June 30, 2005. |
Tax return review and Excise Review
All Other Fees
| | (d) | There were no fees billed in either of the last two fiscal years for products and services provided by the principal accountant, other than the services reported in paragraphs (a) through (c) of this Item. |
| (e)(1) | Disclose the audit committee's pre-approval policies and procedures described in paragraph (c)(7) of Rule 2-01 of Regulation S-X. Before the accountant is engaged by the registrant to render audit or non-audit services, the engagement is approved by the registrant’s audit committee. The Chairman of the audit committee is authorized to pre-approve engagement of the accountant to perform other non-audit services for the registrant and to report such pre-approvals to the audit committee at their next meeting. |
| (e)(2) | The percentage of services described in each of paragraphs (b) through (d) of this Item that were approved by the audit committee pursuant to paragraph (c)(7)(i)(C) of Rule 2-01 of Regulation S-X are as follows: |
| (f) | The percentage of hours expended on the principal accountant's engagement to audit the registrant's financial statements for the most recent fiscal year that were attributed to work performed by persons other than the principal accountant's full-time, permanent employees was less than fifty percent. |
| (g) | The aggregate non-audit fees billed by the registrant's accountant for services rendered to the registrant, and rendered to the registrant's investment adviser (not including any sub-adviser whose role is primarily portfolio management and is subcontracted with or overseen by another investment adviser), and any entity controlling, controlled by, or under common control with the adviser that provides ongoing services to the registrant for each of the last two fiscal years of the registrant was $10,435.90 for the year ended June 30, 2004 and $62,067.06 for the year ended June 30, 2005. |
| | (h) | The registrant's audit committee of the board of directors has considered whether the provision of non-audit services that were rendered to the registrant's investment adviser (not including any sub-adviser whose role is primarily portfolio management and is subcontracted with or overseen by another investment adviser), and any entity controlling, controlled by, or under common control with the investment adviser that provides ongoing services to the registrant that were not pre-approved pursuant to paragraph (c)(7)(ii) of Rule 2-01 of Regulation S-X is compatible with maintaining the principal accountant's independence. |
Item 5. Audit Committee of Listed registrants.
The registrant has a separately designated audit committee consisting of all the independent directors of the registrant. The members of the audit committee are: Harold W. Hartley, Dr. R. Jan LeCroy, David N. Walthall, Diana H. Hamilton and R. Matthew Neff.
Item 6. Schedule of Investments
Schedule of Investments in securities of unaffiliated issuers as of the close of the reporting period is included as part of the report to shareholders filed under Item 1 of this form.
Item 7. Disclosure of Proxy Voting Policies and Procedures for Closed-End Management Investment Companies.
The Proxy Voting Policies are enclosed herewith.
40|86 Strategic Income fund
POLICIES AND PROCEDURES
SECTION 1.F. PROXY VOTING POLICY
I. Statement of Policy
| | It shall be the policy of 40|86 Strategic Income Fund (the “Fund��) to delegate the authority and responsibility to vote proxies related to portfolio securities to its investment adviser, 40|86 Advisors, Inc. (the “Adviser”). Accordingly, the Board of Trustees of the Fund has authorized the proxy voting policies and procedures of the Adviser (“Proxy Voting Procedures”) as the proxy voting policies and procedures that will be used by or on behalf of the Fund when exercising voting authority on behalf of the Fund. |
II. Standard
The Adviser shall vote proxies related to portfolio securities of the Fund in the best interests of the Fund and its shareholders.
III. Review of Proxy Voting Procedures
| | The Board of Trustees of the Fund shall periodically review the Proxy Voting Procedures presented by the Adviser to determine the following: |
| A. | The Proxy Voting Procedures promote the voting of proxies in a manner that is consistent with the standard set forth in Section II above. |
| B. | The Proxy Voting Procedures provide for the voting of proxies in a manner that is consistent with the standard set forth in Section II above in situations where a proxy vote presents a conflict between the interests of the shareholders of the Fund, on the one hand, and those of the Adviser or any affiliated person of the Adviser, on the other. |
| | The Adviser shall provide a written report to the Fund’s Board of Trustees regarding any proxy voted where a conflict of interest (as set forth above) was identified, except in circumstances where: |
| | (i) | the Adviser and/or the Fund engaged an independent third party to provide a recommendation on how to vote such proxy; |
| | (ii) | the Adviser caused the proxy to be voted consistent with the recommendation of the independent third party; and |
| | (iii) | the instructions to the independent third party with respect to the proxy voted were consistent with the standard set forth in Section II above. |
The Adviser shall provide such report at the next regularly scheduled meeting of the Board.
| | The Adviser shall notify the Board promptly of any material change to its Proxy Voting Procedures. |
IV. Disclosure
The following disclosure shall be provided:
| A. | The Adviser shall make available its proxy voting records in respect of the Fund, for inclusion in the Fund’s Form N-PX. |
| B. | The Fund’s administrator, Conseco Services LLC (the “Administrator”), shall cause the Trust to include the proxy voting policies and procedures required in the Fund’s annual filing on Form N-CSR. |
| C. | The Administrator shall cause the Fund’s shareholder reports to include a statement that a copy of these policies and procedures is available upon request (i) by calling a toll-free number and (ii) on the SEC’s website. |
| D. | The Administrator shall cause the Fund’s annual and semi-annual reports to include a statement that information is available regarding how the Fund voted proxies during the most recent twelve-month period (i) without charge, upon request, by calling a toll-free number and (ii) on the SEC’s website. |
Adopted effective as of July 1, 2003.
| (a) | | Does the registrant invest exclusively in non-voting securities? If YES, then do not respond to the remaining portion of this item. No. |
| | | |
| (b)(i) | | Provide the policies and procedures that the registrant uses to determine how to vote proxies relating to portfolio securities. Include any policies and procedures of the company’s investment adviser, or any other third party, that the company uses, or that are used on the company’s behalf, to determine how to vote proxies relating to portfolio securities. |
| | | |
| | | Disclosed Above. |
| | | |
| (b)(ii) | | Provide the policies and procedures that the registrant uses if a conflict arises between the interests of the registrant’s shareholders and the company’s investment adviser, principal underwriter or affiliated person. Include any policies and procedures of the company’s investment adviser, or any other third party, that the company uses, or that are used on the company’s behalf, to determine how to vote proxies relating to portfolio securities. |
| | | |
| | | Disclosed Above. |
Item 8. Portfolio Managers of Closed-End Management Investment Companies.
Not yet applicable.
Item 9. Purchases of Equity Securities by Closed-End Management Investment Company and Affiliated Purchasers.
[Provide the information specified in the table with respect to any purchase made by or on behalf of the registrant or any “affiliated purchaser” as defined in Rule 10b-18(a)(3) under the Exchange Act (17CFR 240-10b-18(a)(3)), of shares or other units of any class of the registrant’s equity securities that is registered by the registrant pursuant to Section 12 of the Exchange Act (15 U.S.C. 781). Identification of equity purchases to be reported according to this section should be determined by client and fund counsel.]
REGISTRANT PURCHASES OF EQUITY SECURITIES
Period | (a) Total Number of Shares (or Units) Purchased | (b) Average Price Paid per Share (or Unit) | (c) Total Number of Shares (or Units) Purchased as Part of Publicly Announced Plans or Programs | (d) Maximum Number (or Approximate Dollar Value) of Shares (or Units) that May Yet Be Purchased Under the Plans or Programs |
Month #1 (1/1/05 - 1/31/05) | None | None | None | None |
Month #2 (2/1/05 - 2/28/05) | None | None | None | None |
Month #3 (3/1/05 - 3/31/05) | None | None | None | None |
Month #4 (4/1/05 - 4/30/05) | None | None | None | None |
Month #5 (5/1/05 - 5/31/05) | None | None | None | None |
Month #6 (6/1/05 - 6/30/05) | None | None | None | None |
| Total | None | None | None | None |
[Footnote columns (c) and (d) of the table, by disclosing the following information in the aggregate for all plans or programs publicly announced: Not applicable
| a. | The date each plan or program was announced |
| b. | The dollar amount (or share or unit amount) approved |
| c. | The expiration date (if any) of each plan or program |
| d. | Each plan or program that has expired during the period covered by the table |
| e. | Each plan or program the registrant has determined to terminate prior to expiration, or under which the registrant does not intend to make further purchases.] |
Item 10. Submission of Matters to a Vote of Security Holders.
There have been no material changes to the procedures by which the shareholders may recommend nominees to the registrant’s board of directors, where those changes were implemented after the registrant last provided disclosure in response to the requirements of Item 7(d)(2)(ii)(G) of Schedule 14A (17 CFR 240.14a-101), or this Item.
Item 11. Controls and Procedures.
| (a) | The registrant’s principal executive and principal financial officers, or persons performing similar functions, have concluded that the registrant’s disclosure controls and procedures (as defined in Rule 30a-3(c) under the Investment Company Act of 1940, as amended (the “1940 Act”) (17 CFR 270.30a-3(c))) are effective, as of a date within 90 days of the filing date of the report that includes the disclosure required by this paragraph, based on their evaluation of these controls and procedures required by Rule 30a-3(b) under the 1940 Act (17 CFR 270.30a-3(b)) and Rules 13a-15(b) or 15d-15(b) under the Securities Exchange Act of 1934, as amended (17 CFR 240.13a-15(b) or 240.15d-15(b)). |
| (b) | There were no changes in the registrant’s internal control over financial reporting (as defined in Rule 30a-3(d) under the 1940 Act (17 CFR 270.30a-3(d)) that occurred during the registrant’s second fiscal quarter of the period covered by this report that has materially affected, or is reasonably likely to materially affect, the registrant’s internal control over financial reporting. |
Item 12. Exhibits.
| | (a)(1) | Code of ethics, or any amendment thereto, that is the subject of disclosure required by Item 2 is attached hereto. |
| | (a)(2) | Certifications pursuant to Rule 30a-2(a) under the 1940 Act and Section 302 of the Sarbanes-Oxley Act of 2002 are attached hereto. |
| | (b) | Certifications pursuant to Rule 30a-2(b) under the 1940 Act and Section 906 of the Sarbanes-Oxley Act of 2002 are attached hereto. |
SIGNATURES
Pursuant to the requirements of the Securities Exchange Act of 1934 and the Investment Company Act of 1940, the registrant has duly caused this report to be signed on its behalf by the undersigned, thereunto duly authorized.
(registrant) 40|86 Strategic Income Fund
By (Signature and Title)* /s/ Audrey L. Kurzawa
Audrey L. Kurzawa, President
(principal executive officer)
Date 8/26/05
Pursuant to the requirements of the Securities Exchange Act of 1934 and the Investment Company Act of 1940, this report has been signed below by the following persons on behalf of the registrant and in the capacities and on the dates indicated.
By (Signature and Title)* /s/ Audrey L. Kurzawa
Audrey L. Kurzawa, President
(principal executive officer)
Date 8/26/05
By (Signature and Title)* /s/ Daniel J. Murphy
Daniel J. Murphy, Treasurer
(principal financial officer)
Date 8/29/05
* Print the name and title of each signing officer under his or her signature.