QuickLinks -- Click here to rapidly navigate through this document
Filed with the Securities and Exchange Commission on February 21, 2003
Registration No. 333-101976
SECURITIES AND EXCHANGE COMMISSION
Washington, D.C. 20549
AMENDMENT NO. 1
TO
FORM S-1
REGISTRATION STATEMENT
UNDER
THE SECURITIES ACT OF 1933
ACCPAC INTERNATIONAL, INC.
(Exact Name of Registrant as Specified in Its Charter)
| Delaware (State or Other Jurisdiction of Incorporation or Organization) | 7372 (Primary Standard Industrial Classification Code Number) | 77-0469911 (I.R.S. Employer Identification Number) |
6700 Koll Center Parkway
Pleasanton, California 94566
(925) 461-2625
(Address, Including Zip Code and Telephone Number,
Including Area Code, of Registrant's Principal Executive Offices)
David M. Hood
President, Chief Executive Officer and
Chairman of the Board of Directors
6700 Koll Center Parkway
Pleasanton, California 94566
(925) 461-2625
(Name, Address, Including Zip Code and Telephone Number,
Including Area Code, of Agent For Service)
With copies to:
| Paul V. Rogers | Christopher M. Kelly | |||
| Andrea Vachss | Sean M. McAvoy | |||
| Covington & Burling | Jones Day | |||
| One Front Street | 2882 Sand Hill Road | |||
| San Francisco, California 94111 | Menlo Park, California 94025 | |||
| (415) 591-6000 | (650) 739-3939 |
Approximate date of commencement of proposed sale to the public: As soon as practicable after this registration statement becomes effective.
If any of the securities being registered on this form are to be offered on a delayed or continuous basis pursuant to Rule 415 under the Securities Act of 1933, check the following box: o
If this form is filed to register additional securities for an offering pursuant to Rule 462(b) under the Securities Act, check the following box and list the Securities Act registration statement number of the earlier effective registration statement for the same offering. o
If this form is a post-effective amendment filed pursuant to Rule 462(c) under the Securities Act, check the following box and list the Securities Act registration statement number of the earlier effective registration statement for the same offering. o
If this form is a post-effective amendment filed pursuant to Rule 462(d) under the Securities Act, check the following box and list the Securities Act registration number of the earlier effective registration statement for the same offering. o
If delivery of the prospectus is expected to be made pursuant to Rule 434, check the following box. o
The Registrant hereby amends this registration statement on such date or dates as may be necessary to delay its effective date until the Registrant shall file a further amendment which specifically states that this registration statement shall thereafter become effective in accordance with Section 8(a) of the Securities Act of 1933, as amended, or until the registration statement shall become effective on such date as the Commission, acting pursuant to said Section 8(a), may determine.
Subject to completion, dated February 21, 2003
PROSPECTUS
The information in this prospectus is not complete and may be changed. We may not sell these securities until the registration statement filed with the Securities and Exchange Commission is effective. This prospectus is not an offer to sell these securities and it is not soliciting an offer to buy these securities in any state where the offer or sale is not permitted.
Shares

Common Stock
This is our initial public offering. We are offering shares of our common stock, and one of our stockholders, listed under "Principal and Selling Stockholders" on page 78, is offering an additional 105,000 shares. We expect the public offering price to be between $ and $ per share. Currently, no public market exists for the shares. After pricing the offering, we expect the common stock will be traded on the Nasdaq National Market under the symbol "ACPC."
Investing in our common stock involves significant risks. See "Risk Factors" beginning on page 6.
| PRICE $ PER SHARE |
| | Per Share | Total | ||||
|---|---|---|---|---|---|---|
| Public offering price | $ | $ | ||||
| Underwriting discounts and commissions | $ | $ | ||||
| Proceeds, before expenses, to ACCPAC | $ | $ | ||||
| Proceeds, before expenses, to the selling stockholder | $ | $ | ||||
The underwriters may also purchase up to an additional shares from ACCPAC at the public offering price, less the underwriting discount, within 30 days from to cover over-allotments.
The underwriters expect to deliver the shares on or about , 2003.
Neither the Securities and Exchange Commission nor any state securities commission has approved or disapproved of these securities or passed upon the adequacy or accuracy of this prospectus. Any representation to the contrary is a criminal offense.
RBC Capital Markets
SoundView Technology Group
Adams, Harkness & Hill, Inc.
, 2003.
| | Page | |
|---|---|---|
| Prospectus Summary | 1 | |
| Risk Factors | 6 | |
| Forward-Looking Statements | 19 | |
| Market and Industry Data | 19 | |
| Use of Proceeds | 20 | |
| Dividend Policy | 20 | |
| Capitalization | 21 | |
| Dilution | 22 | |
| Selected Consolidated Financial and Other Financial Data | 24 | |
| Management's Discussion and Analysis of Financial Condition and Results of Operations | 26 | |
| Business | 49 | |
| Management | 64 | |
| Certain Transactions | 73 | |
| Principal and Selling Stockholders | 78 | |
| Description of Capital Stock | 79 | |
| Shares Eligible for Future Sale | 83 | |
| Underwriting | 85 | |
| Legal Matters | 88 | |
| Experts | 88 | |
| Where You Can Find More Information | 88 | |
| Trademarks | 88 | |
| Index to Financial Statements | F-1 |
You should rely only on the information contained in this prospectus. We have not, and the underwriters have not, authorized anyone to provide you with information different from that contained in this prospectus. We are offering to sell and seeking offers to buy shares of common stock only in jurisdictions where offers and sales are permitted. The information contained in this prospectus is accurate only as of the date of this prospectus, regardless of the time of delivery of the prospectus or any sale of the common stock. Information on our website or in our promotional literature is not part of this prospectus.
DEALER PROSPECTUS DELIVERY OBLIGATION
Until , 2003, which is 25 days after commencement of this offering, all dealers that effect transactions in our securities, whether or not participating in this offering, may be required to deliver a prospectus. This is in addition to the dealers' obligation to deliver a prospectus when acting as underwriters and with respect to their unsold allotments or subscriptions.
The following summary provides an overview of the material aspects of our business and the offering. This summary is not complete and may not contain all of the information you should consider before investing in our common stock. You should read the entire prospectus carefully, especially the discussion regarding the risks of investing in our common stock under "Risk Factors" and the consolidated financial statements and the related notes included elsewhere in this prospectus, before investing in our common stock.
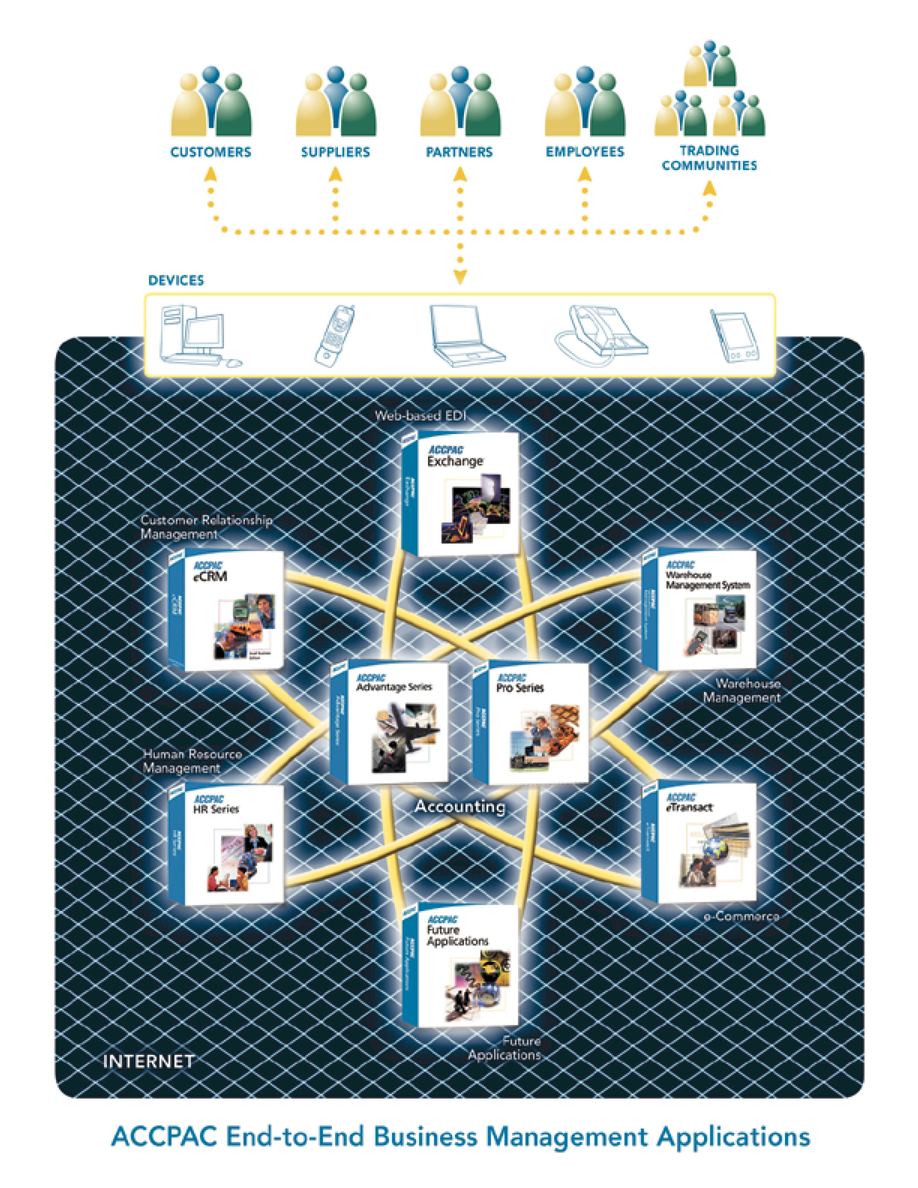
We are a global provider of end-to-end business management applications for small and midsize businesses, or SMBs. We believe that we offer the most comprehensive and functionally complete suite of business management applications specifically designed for these businesses. Our accounting applications are the foundation of our applications suite. We complement these accounting applications with a number of other applications that address our customers' needs in the areas of customer relationship management, electronic commerce, human resource management, warehouse management and Internet-based business-to-business transaction exchange. We market all of these applications, some of which are licensed from technology partners, under the ACCPAC brand. By integrating our business management applications and making them accessible via the Internet, we offer an end-to-end business management solution to our SMB customers. We sell these business management applications through our network of more than 3,000 SMB-focused business partners in our distribution channel worldwide. We have been in business for over 20 years and have registered more than 140,000 SMB customers. We currently maintain relationships with customers in over 130 countries. In addition, we also offer accounting software for small office and home office, or SOHO, businesses.
Industry Background
Businesses are increasingly challenged to raise employee productivity, increase the speed and accuracy of decision-making, and establish more efficient relationships with customers, suppliers and partners. Businesses rely on business management applications to meet these challenges. Increasingly, businesses are demanding that these applications be integrated with one another and accessible via the Internet, or e-business enabled. International Data Corporation estimates that the market for e-business applications will grow at approximately three times the rate of the overall business applications market, from $4.4 billion in 2001 to $19.5 billion in 2006, which represents a compound annual growth rate of 34.4%. We believe our products address a substantial portion of this market.
The accounting application is the central repository for all business transactions, financial data and other critical business information. Accordingly, the accounting application has emerged as the foundation for integrated business management applications. This development, coupled with the increased demand for these applications to be e-business enabled, has fueled the emergence of end-to-end business management applications.
To date, most business management applications targeted at the small and midsize business market have been stand-alone, non-integrated applications that have been expensive and have not been e-business enabled. As a consequence, while Gartner Group estimates that there are more than 8.0 million of these businesses worldwide, we believe most are not benefiting from end-to-end business management applications. However, the emergence of the Internet as a secure, low-cost
1
platform for business transactions, and the availability of affordable information technology infrastructure, are driving an increasing demand for end-to-end business management applications in this market.
Our Solution
We believe our end-to-end business management solution addresses the requirements of small and midsize businesses by offering the following benefits:
- •
- a comprehensive suite of applications tightly integrated with our accounting applications;
- •
- rapid, low-cost implementation;
- •
- flexible pricing, packaging and deployment options;
- •
- Internet and wireless device accessibility;
- •
- low-cost business-to-business electronic connectivity; and
- •
- local consulting and implementation support.
Our Strategy
Our goal is to be the leading provider of end-to-end business management applications for small and midsize businesses. Key elements of our strategy are as follows:
- •
- leverage and expand our large network of more than 3,000 SMB-focused business partners to grow our revenues;
- •
- leverage our large installed base of accounting software customers to generate additional sales of our accounting and complementary business management applications;
- •
- enhance our products and develop new products by leveraging our extensive technical expertise and market knowledge;
- •
- expand our application hosting service, ACCPAC Online, which today provides one or more of our business management applications to over 100 customer sites on a subscription-fee basis; and
- •
- expand international operations, which we believe will continue to represent a significant opportunity for future sales growth of our end-to-end business management applications.
Relationship with Computer Associates
We are a majority-owned subsidiary of Computer Associates International, Inc., a leading enterprise software company. After this offering, Computer Associates will continue to own approximately % of our common stock, or % if the underwriters exercise their over-allotment option in full, and will continue to be able to exercise control over matters requiring stockholder approval. In addition, we are a party to several agreements with Computer Associates relating to matters such as technology licensing, finance and real estate. See "Certain Transactions."
2
Acquisition of eWare Limited
On December 18, 2002, we completed our acquisition of eWare Limited, a privately held developer of customer relationship management software products for small and midsize businesses. Prior to the acquisition, we sold eWare products under license, and we anticipate that this acquisition will enable us to enhance our future product development. In connection with this transaction, we acquired all of the outstanding shares of stock of eWare in exchange for $1.8 million in cash and 761,110 shares of our common stock. We also issued 69,445 shares of restricted common stock to eWare executives and, in January 2003, 113,889 shares of restricted common stock to eWare employees. The restricted shares vest over periods of one to three years, subject to continued employment. Of the shares we issued as acquisition consideration and as compensation to eWare executives, 707,220 are subject to a put option, entitling the stockholders to sell their shares to us for $5.82 per share, and a call option, entitling us to buy shares from the stockholders for $10.85 per share. These options are exercisable at any time during the 28-day period beginning November 19, 2003 and will terminate at the earlier of December 17, 2003, or the last business day prior to the effectiveness of a registration statement relating to the initial public offering of our common stock. For more information about our acquisition of eWare, see "Management's Discussion and Analysis of Financial Condition and Results of Operations—Acquisition of eWare Limited."
We were incorporated in Delaware in October 1997. Our principal office is located at 6700 Koll Center Parkway, Pleasanton, California 94566. Our telephone number is (925) 461-2625.
3
| Common stock we are offering | shares | |
| Common stock the selling stockholder is offering | 105,000 shares | |
| Common stock to be outstanding after this offering | shares | |
| Underwriters' over-allotment option | shares | |
| Use of proceeds | We intend to use the net proceeds of this offering for working capital and general corporate purposes. We may also acquire other businesses, products and technologies. We will not receive any proceeds from sales of shares by the selling stockholder. See "Use of Proceeds." | |
| Proposed Nasdaq National Market symbol | ACPC |
The number of shares of common stock to be outstanding after this offering is based on the number of shares outstanding as of December 31, 2002, and excludes:
- •
- 2,885,000 shares subject to options outstanding as of December 31, 2002, at a weighted average exercise price of $7.46 per share;
- •
- 2,114,500 additional shares that we could issue under our stock option plans as of December 31, 2002;
- •
- 113,889 restricted shares granted to eWare employees in January 2003; and
- •
- 1,000,000 shares that we could issue under our employee stock purchase plan subsequent to completion of the offering.
Except where we state otherwise, the information we present in this prospectus reflects no exercise of the underwriters' over-allotment option.
4
Summary Consolidated Financial Data
The following tables set forth our summary historical consolidated financial data. You should read the following data in conjunction with "Management's Discussion and Analysis of Financial Condition and Results of Operations," our consolidated financial statements and the notes to those statements included in this prospectus.
The summary consolidated statements of operations data for the fiscal years ended March 31, 2000, 2001 and 2002 and the nine months ended December 31, 2001 and 2002, and the summary consolidated balance sheet data as of December 31, 2002 are derived from our consolidated financial statements and the notes to those statements included in this prospectus. The summary consolidated statements of operations data for the fiscal years ended March 31, 1998 and 1999 are derived from our consolidated financial statements not included in this prospectus. The summary "as adjusted" consolidated balance sheet data as of December 31, 2002 gives effect to the receipt and application of the net proceeds from the sale of shares of common stock we are offering at an assumed initial offering price of $ per share after deducting underwriting discounts and commissions and estimated offering expenses payable by us.
| | Fiscal Year Ended March 31, | Nine Months Ended December 31, | ||||||||||||||||||||||
|---|---|---|---|---|---|---|---|---|---|---|---|---|---|---|---|---|---|---|---|---|---|---|---|---|
| | 1998 | 1999 | 2000 | 2001 | 2002 | 2001 | 2002 | |||||||||||||||||
| | (In Thousands, Except Per Share Data) | |||||||||||||||||||||||
| Consolidated Statements of Operations Data: | ||||||||||||||||||||||||
| Revenue: | ||||||||||||||||||||||||
| License | $ | 24,820 | $ | 27,362 | $ | 41,683 | $ | 46,908 | $ | 38,787 | $ | 25,802 | $ | 28,394 | ||||||||||
| Maintenance and other | 7,495 | 10,439 | 20,366 | 28,728 | 33,962 | 25,319 | 30,664 | |||||||||||||||||
| Third-party products | 16,623 | 14,124 | 12,069 | 10,292 | 5,540 | 4,336 | 3,513 | |||||||||||||||||
| Total revenue | 48,938 | 51,925 | 74,118 | 85,928 | 78,289 | 55,457 | 62,571 | |||||||||||||||||
| Amortization of acquired intangibles | — | — | 277 | 1,347 | 1,636 | 1,228 | 1,228 | |||||||||||||||||
| Cost of revenue | 21,282 | 20,845 | 25,737 | 29,288 | 24,945 | 18,103 | 18,495 | |||||||||||||||||
| Gross profit | 27,656 | 31,080 | 48,381 | 56,640 | 53,344 | 37,354 | 44,076 | |||||||||||||||||
| Amortization of goodwill and other intangibles | — | — | 60 | 4,644 | 6,567 | 4,949 | 2,141 | |||||||||||||||||
| Acquired in-process research and development | — | — | 60 | 3,900 | — | — | 110 | |||||||||||||||||
| Operating expenses | 21,029 | 25,124 | 38,140 | 71,769 | 63,483 | 51,046 | 38,757 | |||||||||||||||||
| Income (loss) from operations | 6,627 | 5,956 | 10,241 | (15,129 | ) | (10,139 | ) | (13,692 | ) | 5,319 | ||||||||||||||
| Net income (loss) | $ | 4,131 | $ | 3,043 | $ | 6,187 | $ | (11,167 | ) | $ | (10,564 | ) | $ | (13,236 | ) | $ | 2,569 | |||||||
| Net income (loss) per share: | ||||||||||||||||||||||||
| Basic | $ | 0.38 | $ | 0.28 | $ | 0.57 | $ | (1.04 | ) | $ | (0.98 | ) | $ | (1.23 | ) | $ | 0.24 | |||||||
| Diluted | 0.38 | 0.28 | 0.56 | (1.04 | ) | (0.98 | ) | (1.23 | ) | 0.23 | ||||||||||||||
| Shares used in per share computation: | ||||||||||||||||||||||||
| Basic | 10,800 | 10,773 | 10,773 | 10,773 | 10,773 | 10,773 | 10,812 | |||||||||||||||||
| Diluted | 10,800 | 10,773 | 11,103 | 10,773 | 10,773 | 10,773 | 11,089 | |||||||||||||||||
| | As of December 31, 2002 | |||||
|---|---|---|---|---|---|---|
| | Actual | As Adjusted | ||||
| | (In Thousands) | |||||
| Consolidated Balance Sheet Data: | ||||||
| Cash and cash equivalents | $ | 13,751 | $ | |||
| Working capital (deficit) | (18,305 | ) | ||||
| Total assets | 65,280 | |||||
| Note payable to Computer Associates | 16,195 | |||||
| Stockholders' equity | 1,923 | |||||
5
An investment in our common stock involves risks. You should carefully consider the risks described below and the other information in this prospectus including our financial statements and the related notes before you decide to buy our common stock. If any of the following risks actually occur, our business could be harmed, the market price of our common stock could decline and you may lose all or part of your investment.
We have incurred losses in the past and may again incur net losses in the future.
We incurred a net loss in the first quarter of fiscal 2003, in the first, second and third quarters of fiscal 2002 and in the second, third and fourth quarters of fiscal 2001. While we are presently profitable, we may again incur net losses in fiscal 2003 and possibly longer. If we incur net losses in the future, we may not be able to hire additional personnel or make necessary investments in application development, sales, marketing or customer support. Although we have been profitable for certain periods in the recent past, we do not know if we will be able to maintain profitability.
Additionally, in December 2002, we acquired eWare Limited, a private software company located in Ireland. During the period from January 1, 2002 to December 18, 2002, eWare incurred net losses of approximately $0.9 million. eWare could continue to incur losses for the foreseeable future as our subsidiary. Such losses, if any, would be included in our consolidated operating results.
Our quarterly revenue and operating results fluctuate significantly, and a decline in revenue or operating results may disappoint securities analysts or investors and may result in a decline in our stock price.
Our quarterly operating results have fluctuated significantly in the past and may vary significantly in the future. If our operating results are below the expectations of securities analysts or investors, our stock price is likely to decline. Fluctuations in our quarterly operating results may be caused by a number of factors, including:
- •
- timing of customer orders;
- •
- deferrals of customer orders in anticipation of application enhancements or new applications;
- •
- costs related to acquisition of technologies or businesses;
- •
- timing of our development and release of new applications or enhancements to existing applications;
- •
- customer budget cycles and changes in these budget cycles;
- •
- higher than expected product returns or bad debt expense;
- •
- success in maintaining and enhancing existing relationships and developing new relationships with channel partners;
- •
- actions taken by our competitors, including new product introductions and pricing changes;
6
- •
- the publication of opinions about our applications or our competitors by industry analysts, opinion influencers or others;
- •
- costs of maintaining and expanding our operations;
- •
- costs and timing of hiring qualified personnel; or
- •
- technological changes in our market, including changes in standards for protocols, platforms and operating systems applicable to software, hardware and networking environments.
In addition, in accordance with accounting principles generally accepted in the United States, we may be required to recognize impairment charges for certain long-lived assets, including goodwill, to reduce the carrying value of those assets to their estimated fair value. Impairment charges in any period will further increase the fluctuations in, and may depress, our operating results.
In part as a consequence of the foregoing, we believe that our quarterly operating results are likely to vary significantly in the future. We also expect to continue to experience seasonality in our business. In recent years, we have recognized a proportionately lower percentage of our revenue in our first fiscal quarter. As a result, we believe that period-to-period comparisons of our historical results of operations are not a good predictor of our future performance.
Our expenditures are tied to anticipated revenue, and therefore imprecise forecasts may result in poor operating results.
Our expense levels are based, in part, on our expectations of our future revenue and are to some extent fixed. However, our revenue is difficult to forecast because even though maintenance and other revenue is often based on orders booked in prior quarters, we generally ship software products within a short period after receipt of an order and do not have a material backlog of unfilled orders. As a result, license revenue in any quarter is substantially dependent on orders booked in that quarter. We may be unable to adjust spending in a timely manner to compensate for any unexpected revenue shortfall. Any significant shortfall of demand in relation to our expectations and our spending would depress our operating results and impair our ability to maintain or achieve profitability.
Downturns in the software market, and in the SOHO and the SMB markets in particular, may decrease our revenue and profit margins.
The market for our applications depends on economic conditions affecting the broader software market. Downturns in the economy may cause businesses to delay or cancel technology purchases and reduce their overall information technology budgets. During weak economic periods, customers may experience financial difficulty, fail to budget or defer the budget for the purchase of our applications, or cease operations. This, in turn, may lead to longer sales cycles, delays or failures in payment and collection, and price pressures, causing us to realize lower revenue and profit margins. In particular, capital spending in the information technology sector generally has decreased since mid-2000. Any significant downturn in the SOHO or SMB markets, in particular, or in general economic conditions which result in the reduction of information technology budgets or the delay in software purchases would likely result in a reduction in demand for our applications and services and could decrease our revenue and margins.
7
If our products and services fail to maintain or achieve market acceptance, our business and results of operations will suffer.
Our products and services may fail to achieve or maintain market acceptance for any or all of the following reasons:
- •
- customers may not need the functionality provided by our products and services;
- •
- customers may opt to achieve the functionality provided by our products or services through non-software-based methods;
- •
- we may fail to respond and adapt to technological change and changing customer requirements;
- •
- our competitors may introduce superior applications or applications with greater marketing support or lower prices;
- •
- we may fail to improve our existing applications or fail to develop and introduce applications with new or enhanced capabilities;
- •
- we may experience significant delays in the development or introduction of new applications or upgrades;
- •
- we may receive negative publicity about our company or our products;
- •
- we may fail to integrate our applications with multiple platforms and existing, or legacy, systems; or
- •
- we may fail to have access to application interfaces that are used for communication between external software products and packaged application software.
The occurrence of one or more of these events may harm our current or future results of operations.
We face intense competition from businesses with significantly greater financial, technical and marketing resources, which could harm our ability to maintain or increase sales of our applications.
The market for business management applications is extremely competitive, evolving and subject to rapid technological change. We have experienced competition to date from both established and emerging software businesses that offer similar products and services targeted at our markets. We also face competition from local businesses in the international markets in which we compete. This competition may increase in the future.
Many competitors have more financial, technical and marketing resources, broader customer relationships and greater name recognition than we do. Our competitors may also bundle their software with other software or enter into agreements with third parties to sell their software. In addition, if one of our competitors is acquired by a well-capitalized company, we could face increased competition. For example, Microsoft has acquired two of our competitors, Great Plains and Navision, and has announced its intention to actively pursue the SMB market. If competitors lower their prices, we may be forced to match price cuts and decrease our profitability. We may not be able to design new products or improve existing ones to maintain our competitive position in the industry. Any of these competitive pressures from current and future competitors could harm our ability to sell our products.
8
We rely primarily on partners in our distribution channel to sell, install and service the products from which we derive the majority of our revenue, and if we do not maintain our existing relationships or establish new relationships with these channel partners, or our channel partners are not successful in their sales or services efforts, our results of operations would suffer.
We depend upon our channel partners to sell, install and service the products from which we derive the majority of our revenue. If we are unable to extend or leverage relationships with existing channel partners or to add new channel partners to effectively market our products, our revenue may decline. In addition, we cannot control the level and quality of service provided by our channel partners, which could harm our reputation and future sales efforts. Our channel partners operate independently from us, are not contractually required to sell our products and may sell or give higher priority to competing products. In addition, our channel partners may fail to:
- •
- aggressively market or sell our products;
- •
- maintain their relationships with us;
- •
- sell customers the products that suit the customers' needs; or
- •
- properly install, implement or support our products.
The occurrence of one or more of these events will cause our results of operations to suffer.
We depend on applications licensed from software developers, and our ability to develop and sell our products and services could be delayed or impaired if these license arrangements are terminated.
Our strategic products include customized business management applications that we license and then market under the ACCPAC brand. These applications have been customized to integrate with our accounting suites and include:
- •
- ACCPAC HR Series, a human resources application;
- •
- ACCPAC Warehouse Management System, a warehouse management application; and
- •
- ACCPAC Exchange, an Internet-based business-to-business transaction exchange application.
These license agreements generally have terms of between three and five years and provide for automatic renewal unless we fail to meet minimum royalty obligations to the licensor when due and may be terminated by the licensor if we materially breach our obligations under these agreements. These software licenses may not continue to be available on commercially reasonable terms, if at all. Our loss of or inability to maintain these software licenses could cause us to lose revenue and incur substantial costs to license or develop alternative product offerings. We may be unable to license or develop comparable alternative products that integrate with our product offerings in a timely manner, if at all, which could harm our business and impair our future growth.
In addition, we bundle with our products software applications that we license from other parties, such as Microsoft, which is one of our competitors, and Crystal Decisions. This licensed software may not continue to be available on commercially reasonable terms or with acceptable levels of support, or at all. Our loss of or inability to maintain these software licenses could delay
9
or impair the sale of our products and services until comparable software, if available, is identified, licensed, developed and integrated with our applications, which could harm our business and impair our future growth.
Our software products, and the applications with which they integrate, may contain errors or design defects, which may cause delays in product introduction and shipments, require design modifications and result in customer dissatisfaction, negative publicity, litigation and potential liability.
The interactions by our applications and other integrated applications with our customers' software applications and information technology systems are complex and, accordingly, there may be undetected errors or design defects when applications are introduced or as new versions are released. In the past, we have discovered integration, implementation and software errors in our new releases and new applications after their introduction, which have resulted in additional research and development expenses. Such errors may result in application release delays, delayed revenue, customer dissatisfaction, negative publicity, litigation and potential liability, and may require us to create and release service patches or service packs to solve these problems, which in turn could be time consuming and expensive. In many cases, our applications integrate with software developed by third parties, and any errors or design defects in this software could harm the marketability of our applications. Since many customers use our applications for core business operations, any of these occurrences could generate negative publicity and subject us to litigation and potential liability.
If we fail to introduce new versions or releases of our applications in a timely manner, our revenue may decline.
We believe that we must continue to enhance our current applications while we concurrently develop and introduce new applications in anticipation of emerging technology standards and keep pace with competitive and technological developments. Our accounting applications must be routinely updated for changes in laws, regulations and generally accepted accounting principles in order to maintain their accuracy and competitiveness. These necessary software changes and updates could require us to make a significant investment in modifications of our accounting applications, which would increase our development costs, reduce our operating margins and harm our financial condition. If our new releases or applications are delayed or do not achieve market acceptance, we could experience a delay in the recognition of, or loss of, revenue.
We derive a substantial amount of our revenue from international sources and risks associated with selling our applications outside of the United States may harm our business.
For the fiscal year ended March 31, 2002, and nine months ended December 31, 2002, we derived approximately 57% and 60%, respectively, of our total revenue from sales outside of the United States. We currently have foreign offices in Australia, Canada, India, Ireland, Mexico, the Netherlands, Singapore, South Africa, the United Arab Emirates and the United Kingdom, and we have customers in over 130 countries. We may not be able to maintain and expand our activities in international markets. Even if we are able to successfully expand our international operations, we cannot be certain that we will be able to maintain or increase international market demand for our applications.
10
Our sales in international markets are denominated in foreign currencies and then translated into U.S. dollars for accounting purposes. As a result, a decline in the value of such currencies relative to the value of the U.S. dollar may decrease the amount of revenue reported from international operations, and an increase relative to the U.S. dollar could increase our expenses in such jurisdictions.
In addition, there are other risks in doing business in international markets, such as:
- •
- local economic or market conditions;
- •
- unexpected changes in regulatory requirements;
- •
- export controls relating to encryption technology and other export restrictions;
- •
- tariffs and other trade barriers;
- •
- longer sales cycles;
- •
- reduced protection for intellectual property rights in some countries combined with a greater incidence and acceptance of software piracy;
- •
- political instability, threats or acts of terrorism, or sabotage;
- •
- potentially adverse tax consequences;
- •
- difficulties in staffing and managing foreign operations; and
- •
- potential liability associated with possible errors that may occur in the translation or localization of our applications for specific countries.
The occurrence of one or more of these factors may harm our business.
11
Security risks expose us to additional costs and to litigation which could harm our business.
Anyone who circumvents our security measures or the security measures of third parties on which we rely could misappropriate proprietary information or cause disruptions in our services or operations. The Internet is a public network, and data is sent over this network from many sources. We rely on standard encryption and authentication technology to provide security and authentication to effect the secure exchange of confidential information over the Internet. We also have redundant systems and disaster recovery plans. Despite these security measures, our applications may be vulnerable to unauthorized and illegal access, sabotage, computer viruses and other disruptive problems, including natural disasters. Eliminating computer viruses and addressing other security problems and disasters may cause either loss or compromise of data, or interruptions, delay or cessation of service to users accessing our business management applications via the Internet, which could harm our business, expose us to risk of loss or litigation and possible liability. We may be required to expend significant capital or other resources to protect against the threat of security breaches or to alleviate problems caused by breaches.
We rely on third parties to host our applications that allow the exchange of information over the Internet. Generally, Internet service providers and online service providers have in the past experienced, and may in the future experience, interruptions in service as a result of the accidental or intentional actions of Internet users, current and former employees, or others. We cannot be certain that the third parties who host our applications have adequate security measures and disaster recovery plans in place or that such measures or plans are implemented adequately.
Our security measures, and those of third parties on which we rely may be inadequate to prevent security breaches or disruptions in service, and our business would be harmed if we or they do not prevent them.
We depend on the increasing use of the Internet and the growth of electronic commerce. If the Internet and electronic commerce do not grow as anticipated, our revenue could decline and our business will be harmed.
We depend on the increased acceptance and use of the Internet as a medium for electronic commerce and the adoption by businesses of Internet-based business solutions. Acceptance and use of the Internet may not continue to develop at historical rates and a sufficiently broad base of SMB customers may not adopt or continue to use the Internet as a medium of commerce. Demand and market acceptance for recently introduced services and products over the Internet are subject to a high level of uncertainty and there exist few proven Internet-based services and products for the SMB market.
The measures on which we rely to protect our intellectual property rights, and to protect the intellectual property that we license from third parties, offer only limited protection, and failures to protect such intellectual property could harm our business.
Our ability to compete successfully and achieve future revenue growth will depend, in part, on our ability to protect our intellectual property and the ability of third parties to protect the intellectual property that we license from them. We may not be able to successfully protect our intellectual property and third parties may not be able to successfully protect the intellectual property that we license from them, which in either case could harm our business.
12
To establish and protect our proprietary rights in our applications, we rely on a combination of copyright, trademark and trade secret laws, a mandatory software registration mechanism in certain applications, confidentiality and non-disclosure agreements with our employees, licensing arrangements with our customers and limitations on access to and distribution of our proprietary information. We have no patents or material patent applications pending, and existing trade secret and copyright laws provide only limited protection of our proprietary rights. In addition, the laws of certain countries in which our applications are sold do not protect our intellectual property rights to the same extent as the laws of the United States. We currently license most of our applications under shrink-wrap or click-through licenses that are not signed by our licensees. These shrink-wrap or click-through licenses may be unenforceable under the laws of certain jurisdictions. Attempts may be made to copy or reverse engineer aspects of our applications or to obtain and use information we regard as proprietary. We have also historically released the source code to some of our legacy applications and to ACCPAC Pro Series to certain of our customers. This availability may increase the likelihood of misappropriation or other misuse of our intellectual property. Additionally, prior versions of ACCPAC Simply Accounting did not include an activation code mechanism and therefore were particularly susceptible to unauthorized copying and distribution. We believe that at least three parties have unlawfully copied and distributed our products. We have initiated a lawsuit against one of these parties and are evaluating whether to pursue litigation against others. Policing unauthorized use of applications is difficult and expensive litigation may be necessary in the future to enforce our intellectual property and proprietary technology rights.
Our applications, trademarks and other intellectual property could infringe or be alleged to infringe the intellectual property rights of others causing costly litigation and the loss of significant rights.
As the number of patents, copyrights and other intellectual property rights in the software industry increases, and as the coverage of these rights and the functionality of these products in the market further overlap, we believe that software developers and distributors may increasingly become the subject of infringement claims and related litigation. Such claims or litigation, with or without merit, could result in substantial costs and diversion of our management's time and other resources. From time to time, we have been subject to claims by third parties that some of our intellectual property infringes on their rights. To date, these claims have not harmed our business. However, in the event an infringement claim against us is successful and we cannot obtain a license on acceptable terms, license a substitute technology or redesign our applications to avoid infringement, our business would be harmed. Furthermore, former employers of our current or future employees may assert that our employees have improperly disclosed to us or are using their confidential or proprietary information.
In addition, we license technology from third parties, and it is possible that we could become a party to infringement actions based upon the licenses from those third parties. Such claims, with or without merit, could subject us to costly litigation and the diversion of our management.
Recent and future acquisitions could disrupt our business, dilute stockholder value, decrease our operating results or disappoint analysts or investors and cause a decline in our stock price.
We have acquired a number of businesses in the past and we may acquire other businesses in the future. If we do acquire a business, we could have difficulty retaining and assimilating that business' personnel. In addition, we could have difficulty assimilating acquired products, services or
13
technologies into our operations. These difficulties could disrupt our ongoing business, distract our management and employees, increase our expenses and harm our business.
In December 2002, we acquired eWare Limited, a private software company located in Ireland. Although we had been selling eWare products prior to the acquisition, we have not yet fully integrated eWare's business into ours. We cannot guarantee that we will realize any of the benefits and strategic objectives we are seeking to obtain by acquiring eWare, or that we will successfully integrate eWare's operations into ours.
We may incur debt or issue equity securities to pay for any future acquisitions. If we issue equity securities, your percentage ownership would be diluted. Additionally, analysts or investors may disapprove of an acquisition on the grounds that we overpaid for the business or the acquired business does not further our strategic goals, either of which could result in a decline in our stock price.
A potential new accounting pronouncement may cause our net income to decrease.
We currently account for employee stock options using the intrinsic-value method in accordance with Accounting Principles Board Opinion No. 25,Accounting for Stock Issued to Employees, and have not recognized any compensation expense for awards of employee stock options in the fiscal years ended March 31, 2000, 2001 and 2002 and the nine months ended December 31, 2002. Statement of Financial Accounting Standards No. 123,Accounting for Stock-Based Compensation, permits us to continue accounting for stock-based compensation as set forth in APB 25, provided we disclose the pro forma effect on net income (loss) and net income (loss) per share of using a fair value method of accounting for stock-based employee compensation plans. If we changed our method of accounting for employee stock options, whether voluntarily or as a result of changes in accounting rules, it could materially decrease our net income.
14
Risks Relating to Computer Associates
We will be controlled by Computer Associates as long as it owns a majority of our common stock, and our other stockholders will not be able to affect the outcome of stockholder votes during that time.
Following the offering, Computer Associates will own approximately % of our outstanding common stock, or approximately, % if the underwriters exercise their over-allotment option in full. As a result, as long as Computer Associates owns a majority of our outstanding common stock, it will be able to exercise control over all matters requiring stockholder approval, including the election of directors and approval of significant corporate transactions, such as any proposed merger. In addition, Computer Associates is not prohibited from selling a controlling interest in our common stock to a third-party.
We may experience conflicts of interest with Computer Associates, and because of Computer Associates' controlling interest, we may not resolve these conflicts on terms that are favorable to us.
We may experience conflicts of interest with Computer Associates, and the resolution of such conflicts may be less favorable than if we were dealing with an unaffiliated party. We have entered into certain agreements with Computer Associates. These agreements may be amended in the future, and because of Computer Associates' controlling interest, such amendments may be less favorable to us than the current terms of the agreements. See "Certain Transactions—Transactions with Computer Associates" for a description of our agreements with Computer Associates.
Our certificate of incorporation includes provisions designed to address our relationship with Computer Associates. Among other things, these provisions provide that:
- •
- Computer Associates and its officers and directors will not be liable to us or our stockholders for breach of any fiduciary duty by reason of any activities of Computer Associates in competition with us;
- •
- Computer Associates will have no duty to communicate or offer corporate opportunities to us and will not be liable for breach of any fiduciary duty as a stockholder by reason of the fact that Computer Associates pursues or acquires a corporate opportunity for itself, directs a corporate opportunity to another person or does not communicate information regarding a corporate opportunity to us; and
- •
- business opportunities that may be suitable for both us and Computer Associates will be allocated between the parties based on principles set forth in our certificate of incorporation.
As a result of Computer Associates' majority ownership of our common stock and the provisions of our certificate of incorporation, Computer Associates may take opportunities for itself or may require us to take actions which may not be in the best interests of our other stockholders. See "Description of Capital Stock — Corporate Opportunities" for additional information on the allocation of corporate opportunities between Computer Associates and ACCPAC.
15
A member of our board of directors may have duties to Computer Associates that conflict with his duties to ACCPAC and our stockholders, and we do not have any plan to resolve potential conflicts.
Currently, Alfonse D'Amato is a member of our board of directors and the board of directors of Computer Associates. Mr. D'Amato has fiduciary duties to Computer Associates and its stockholders. He also has fiduciary duties to ACCPAC and our stockholders. In some circumstances, Mr. D'Amato's duties to Computer Associates and its stockholders, including his time commitments, may conflict with his duties as a director of ACCPAC. We do not have any plan or agreement with Computer Associates that would determine how to resolve potential conflicts of interest. Moreover, we may not be able to resolve any potential conflicts, and any resolution may be less favorable than if we were dealing with an unaffiliated party.
Our stock price may suffer so long as Computer Associates or another entity continues to own a substantial portion of our common stock.
The liquidity of our common stock in the market could be constrained unless and until Computer Associates elects to sell or distribute some significant portion of its shares of our common stock to unaffiliated persons. The potential sale of our shares by Computer Associates could harm the market price of our common stock. In addition, because of the relatively limited liquidity of the market for our common stock, relatively small trades of our common stock may have a disproportionate effect on our common stock price.
The substantial number of shares that will be eligible for sale in the near future by Computer Associates and other stockholders may cause the market price for our common stock to decline.
Sales of substantial numbers of shares of our common stock in the public market following this offering could cause the market price of our common stock to decline. In addition, the perception that a sale or divestiture by Computer Associates could occur could also harm the market price for our common stock. The number of shares of common stock available for sale in the public market is limited by restrictions under federal securities laws and under agreements that some of our stockholders, including Computer Associates, have entered into with the underwriters. Those lock-up agreements restrict those stockholders from selling, pledging or otherwise disposing of their shares for a period of 180 days after the date of this prospectus without the prior written consent of RBC Dain Rauscher Inc. However, RBC Dain Rauscher Inc. may, in its sole discretion, release all or any portion of the common stock from the restrictions in the lock-up agreements. The following table indicates approximately when the 11,499,055 shares of our common stock that are not being sold in this offering but which were outstanding as of December 31, 2002, will be eligible for sale into the public market:
| | Eligibility of Restricted Shares for Sale in Public Market | |
|---|---|---|
| On the date of this prospectus | 83,400 | |
| 90 days after the date of this prospectus | 500 | |
| 180 days after the date of this prospectus (subject to compliance with Rule 144 in certain cases) | 11,415,155 |
16
In addition, of the 2,885,000 shares issuable upon exercise of options to purchase our common stock as of December 31, 2002, approximately 1,295,951 shares will be vested and eligible for sale 180 days after the date of this prospectus. We intend to file a registration statement on Form S-8 with the Securities and Exchange Commission covering 5,999,500 shares reserved for issuance under our stock option plans and employee stock purchase plan. For a further description of the eligibility of shares for sale into the public market following this offering, please see "Shares Eligible for Future Sale."
Failure to raise additional capital or generate significant capital necessary to expand our operations and invest in new applications could reduce our ability to compete and result in lower revenue.
We currently anticipate that the net proceeds from this offering, together with our current cash and cash equivalents and cash from operations, will be sufficient for us to meet our anticipated cash needs for working capital and capital expenditures for at least the next 12 months. After that, we may need to raise additional funds, and we cannot be certain that we will be able to obtain additional financing on favorable terms, or at all. If we need additional capital and cannot raise it on acceptable terms we may not be able to, among other things:
- •
- develop or enhance our applications or services;
- •
- expand our domestic or international operations;
- •
- respond to competitive pressures or unanticipated capital requirements;
- •
- hire, train or retain employees; or
- •
- acquire complementary technologies or businesses.
Our failure to do any of these activities could result in lower revenue and harm our business.
If we raise additional funds through public or private equity or convertible debt financings, your percentage ownership of ACCPAC will be reduced and the value of your common stock may be diluted. We may also issue securities with rights, preferences and privileges that are senior to our common stock without further action by our stockholders. For more information regarding our ability to issue these types of securities, see "Description of Capital Stock."
The market price of our stock is likely to experience extreme price and volume fluctuations, and you may lose all or part of your investment.
There has been no prior public market for our common stock. An active public market for our common stock may not develop or be sustained after the offering, and therefore we cannot predict how liquid this market will become. The initial public offering price will be determined by negotiations among our management and board of directors and representatives of the underwriters and may not be indicative of future market prices. See "Underwriting" for information regarding the method of determining the initial public offering price. As a result, you may be unable to sell your shares of common stock at or above the offering price. The market price of our common stock may fluctuate significantly in response to the following factors, most of which are beyond our control:
- •
- variations in operating results;
- •
- changes in earnings estimates by analysts or changes in estimates of our financial performance;
17
- •
- changes in market valuation of similar companies; and
- •
- announcements of technological innovations, new products, acquisitions, strategic partnerships, joint ventures or capital commitments by us or our competitors.
In addition, in recent years the stock market in general, and the shares of technology companies in particular, have experienced extreme price fluctuations. This volatility has had a substantial effect on the market prices of securities issued by many companies for reasons unrelated to the operating performance of the specific companies, such as general economic and political conditions including recessions and military conflicts. A continuation of these broad market fluctuations may harm the market price of our common stock.
We may be subject to securities class action litigation, which could distract management and result in substantial costs.
In the past, securities class action litigation has often been brought against a company following periods of volatility in the market price of its securities. This risk is especially acute for us because technology companies have experienced greater than average stock price volatility in recent years and as a result have been subject to a greater number of securities class action claims than companies in other industries. We therefore believe that we may in the future be the target of similar litigation. Securities litigation could result in substantial costs and divert management's attention and resources, which could harm our business.
We have broad discretion over the use of the proceeds from this offering and may fail to use them to effectively grow our business.
We will have significant flexibility in using the proceeds we receive from this offering and may fail to use the proceeds to effectively grow our business. Because the proceeds are not allocated for any specific purpose, you will not be able, as part of your investment decision, to determine the value or appropriateness of our use of the proceeds.
New investors in our common stock will experience immediate and substantial dilution.
The offering price is substantially higher than the book value per share of our common stock. Investors purchasing common stock in the offering will, therefore, incur immediate and substantial dilution of $ in net tangible book value per share of common stock based on an assumed initial public offering price of $ per share. Investors will incur additional dilution upon the exercise of outstanding stock options. See "Dilution" for a more detailed discussion of the dilution new investors will incur in this offering.
18
This prospectus contains forward-looking statements. Forward-looking statements relate to future events or future financial performance. Words such as "anticipate," "believe," "continue," "could," "estimate," "expect," "intend," "may," "plan," "potential," "predict," "project," "should," "will" and variations of these words and similar expressions are generally used to identify forward-looking statements, but are not the exclusive expressions of forward-looking statements. These statements are only predictions and are not guarantees of future performance. Actual events or results may differ materially. In evaluating these forward-looking statements, you should specifically consider various factors, including:
- •
- our ability to compete effectively;
- •
- economic conditions in the software market;
- •
- our ability to achieve market acceptance of our products;
- •
- our ability to maintain relationships with resellers; and
- •
- our ability to maintain relationships with licensors.
You should also consider the risks outlined under "Risk Factors." These factors may cause our actual results to differ materially from any forward-looking statement. You should not place undue reliance on these forward-looking statements.
Although we believe that the expectations reflected in our forward-looking statements are reasonable, we cannot guarantee future results, levels of activity, performance or achievement. Moreover, neither we nor any other person assumes responsibility for the accuracy and completeness of such statements. We are under no duty to update any of the forward-looking statements after the date of this prospectus to conform such statements to actual results.
The market and industry data we have included in this prospectus is derived from independent publications. We have not independently verified this market and industry information, and we cannot assure you that it is accurate or complete.
19
We estimate that we will receive net proceeds from the sale of shares of our common stock in this offering of approximately $ , assuming an initial public offering price of $ per share and after deducting underwriting discounts and commissions and estimated expenses of $ . We estimate that we will receive additional net proceeds of up to $ if the underwriters' over-allotment option is exercised in full. We will not receive any proceeds from the sale of shares by the selling stockholder.
We intend to use the net proceeds, including amounts we may receive from the exercise of the underwriters' over-allotment option, for working capital and general corporate purposes. We may also use a portion of the net proceeds to acquire additional businesses, products and technologies. However, we have no specific plans, agreements or commitments to do so and are not currently engaged in any negotiations for any acquisition.
We will retain broad discretion in the allocation of the net proceeds of this offering. Pending the uses described above, we intend to invest the net proceeds of this offering we receive in money-market funds or short-term interest-bearing, investment-grade securities. We cannot predict whether the proceeds invested will yield a favorable return. We believe that our available cash, together with the net proceeds of this offering, will be sufficient to meet our capital requirements for the next twelve months.
We have never declared or paid any cash dividends on our capital stock. We currently intend to retain any future earnings to fund the development and growth of our business and therefore do not anticipate paying cash dividends in the foreseeable future. See "Description of Capital Stock."
20
The following table presents our capitalization as of December 31, 2002:
- •
- on an actual basis; and
- •
- as adjusted to reflect the sale of shares of common stock by us in this offering, assuming an initial public offering price of $ per share and after deducting underwriting discounts and commissions and estimated offering expenses of $ .
This information should be read in conjunction with "Management's Discussion and Analysis of Financial Condition and Results of Operations," our consolidated financial statements and the notes to those statements included in this prospectus.
| | As of December 31, 2002 | ||||||
|---|---|---|---|---|---|---|---|
| | Actual | As Adjusted | |||||
| | (In Thousands) | ||||||
| Note payable to Computer Associates, less current portion | $ | 10,855 | $ | ||||
| Stockholders' equity: | |||||||
| Preferred stock, $0.01 par value; 5,000,000 shares authorized actual and as adjusted; no shares issued and outstanding actual and as adjusted | — | — | |||||
| Common stock, $0.01 par value; 100,000,000 shares authorized actual and as adjusted; 11,604,055 shares issued and outstanding actual and shares issued and outstanding as adjusted (1) | 116 | ||||||
| Common stock to be issued, $0.01 par value; 113,889 at December 31, 2002 | 1 | ||||||
| Additional paid-in capital | 15,176 | ||||||
| Deferred compensation | (1,650 | ) | |||||
| Accumulated deficit | (10,618 | ) | |||||
| Accumulated other comprehensive loss | (1,102 | ) | |||||
| Total stockholders' equity | 1,923 | ||||||
| Total capitalization | $ | 12,778 | $ | ||||
The table excludes the following shares:
- •
- 2,885,000 shares subject to options outstanding as of December 31, 2002, at a weighted average exercise price of $7.46 per share;
- •
- 2,114,500 shares that we could issue under our stock option plans as of December 31, 2002; and
- •
- 113,889 restricted shares granted to eWare employees in January 2003; and
- •
- 1,000,000 additional shares that we could issue under our employee stock purchase plan subsequent to completion of the offering.
- (1)
- On December 18, 2002, we issued 761,110 shares of common stock in connection with our acquisition of eWare. We also issued 69,445 restricted shares to eWare executives and, in January 2003, 113,889 restricted shares to eWare employees. Of the shares we issued as acquisition consideration and as compensation to eWare executives, 707,220 are subject to a put option, entitling the holders of the shares to sell their shares to us for $5.82 per share. These shares are also subject to a call option, entitling us to repurchase the shares for $10.85 per share. These options are exercisable at any time during the 28-day period beginning November 19, 2003 and will terminate at the earlier of December 17, 2003 or the last business day prior to the effectiveness of a registration statement relating to the initial public offering of our common stock.
21
As of December 31, 2002, the net tangible book value (deficit) of our common stock was approximately ($29.7 million), or ($2.56) per share of common stock. Net tangible book value (deficit) per share represents the amount of our tangible assets less total liabilities, divided by the total number of shares of our common stock outstanding before this offering.
Dilution per share to new investors represents the difference between the amount per share paid by purchasers of our common stock in this offering and the net tangible book value per share of our common stock immediately after completion of this offering. After giving effect to the sale of shares of common stock by us in this offering, assuming an initial public offering price of $ per share and after deducting underwriting discounts and commissions and estimated offering expenses of $ , our net tangible book value as of December 31, 2002 would have been approximately $ million, or $ per share. This amount represents an immediate decrease in net tangible book value of $ per share to new investors purchasing shares of common stock in this offering. The following table illustrates this dilution:
| Assumed initial public offering price per share | $ | |||||
| Net tangible book value (deficit) per share as of December 31, 2002 | (2.56 | ) | ||||
| Increase per share attributable to new investors | ||||||
| Net tangible book value per share after this offering | ||||||
| Dilution per share to new investors | $ | |||||
The following table presents as of December 31, 2002 the differences between the number of shares of common stock purchased from us, the total consideration paid and the average price per share paid by existing stockholders and by the new investors purchasing shares in this offering. We used the assumed initial public offering price of $ per share, and we have not deducted underwriting discounts and commissions and estimated offering expenses in our calculations. The shares to be sold by the selling stockholder are excluded from the number of shares purchased by the new investors and included in the number of shares held by the existing stockholders in this table.
| | Shares Purchased | Total Consideration | | ||||||||||
|---|---|---|---|---|---|---|---|---|---|---|---|---|---|
| | Average Price Per Share | ||||||||||||
| | Number | Percent | Amount | Percent | |||||||||
| Existing stockholders | 11,604,055 | % | $ | 13,643,000 | % | $ | 1.18 | ||||||
| New investors | |||||||||||||
| Total | |||||||||||||
Sales by the selling stockholder in this offering will have the following effect:
- •
- these sales will reduce the shares held by existing stockholders to shares, or % of the total shares outstanding after this offering; and
- •
- these sales will increase the shares held by new investors to , or % of the total shares outstanding after this offering.
22
The calculation of net tangible book value per share assumes no exercise of any outstanding stock options. As of December 31, 2002, we had options outstanding to purchase a total of 2,885,000 shares of our common stock at a weighted average exercise price of $7.46 per share. Investors in this offering will experience additional dilution if any of these outstanding options are exercised. See "Capitalization" and "Management—Employee Stock Plans."
If the underwriters exercise their over-allotment in full, the following will occur:
- •
- the number of shares of common stock held by existing stockholders will decrease to , or approximately % of the total number of shares of common stock outstanding;
- •
- the number of shares of common stock held by new investors will increase to , or approximately % of the total number of shares of common stock outstanding; and
- •
- the dilution per share to the new investors will be $ per share.
23
SELECTED CONSOLIDATED FINANCIAL DATA
The consolidated statements of operations data for the fiscal years ended March 31, 2000, 2001 and 2002 and the nine months ended December 31, 2002 and the consolidated balance sheet data as of March 31, 2001 and 2002 and December 31, 2002 are derived from our audited consolidated financial statements included in this prospectus. The consolidated statements of operations data for the fiscal years ended March 31, 1998 and 1999 and the consolidated balance sheet data as of March 31, 1998, 1999 and 2000 are derived from our audited consolidated financial statements not included in this prospectus. The consolidated statements of operations data for the nine months ended December 31, 2001 are derived from our unaudited consolidated financial statements included elsewhere in this prospectus. Historical results are not necessarily indicative of results to be expected in future periods. The data set forth below should be read in conjunction with the "Management's Discussion and Analysis of Financial Condition and Results of Operations," the consolidated financial statements, and the notes to those statements included in this prospectus.
| | Fiscal Year Ended March 31, | Nine Months Ended December 31, | |||||||||||||||||||||
|---|---|---|---|---|---|---|---|---|---|---|---|---|---|---|---|---|---|---|---|---|---|---|---|
| | 1998 | 1999 | 2000 | 2001(1) | 2002 | 2001 | 2002 | ||||||||||||||||
| | (In Thousands, Except Per Share Data) | ||||||||||||||||||||||
| Consolidated Statements of Operations Data: | |||||||||||||||||||||||
| Revenue: | |||||||||||||||||||||||
| License | $ | 24,820 | $ | 27,362 | $ | 41,683 | $ | 46,908 | $ | 38,787 | $ | 25,802 | $ | 28,394 | |||||||||
| Maintenance and other | 7,495 | 10,439 | 20,366 | 28,728 | 33,962 | 25,319 | 30,664 | ||||||||||||||||
| Third-party products | 16,623 | 14,124 | 12,069 | 10,292 | 5,540 | 4,336 | 3,513 | ||||||||||||||||
| Total revenue | 48,938 | 51,925 | 74,118 | 85,928 | 78,289 | 55,457 | 62,571 | ||||||||||||||||
| Cost of revenue: | |||||||||||||||||||||||
| License | 4,675 | 5,192 | 9,386 | 10,598 | 8,862 | 5,941 | 5,419 | ||||||||||||||||
| Maintenance and other | 1,937 | 3,306 | 5,351 | 9,407 | 10,394 | 7,554 | 9,478 | ||||||||||||||||
| Third-party products | 14,670 | 12,347 | 10,723 | 7,936 | 4,053 | 3,380 | 2,370 | ||||||||||||||||
| Amortization of acquired intangibles | — | — | 277 | 1,347 | 1,636 | 1,228 | 1,228 | ||||||||||||||||
| Total cost of revenue | 21,282 | 20,845 | 25,737 | 29,288 | 24,945 | 18,103 | 18,495 | ||||||||||||||||
| Gross profit | 27,656 | 31,080 | 48,381 | 56,640 | 53,344 | 37,354 | 44,076 | ||||||||||||||||
| Operating expenses: | |||||||||||||||||||||||
| Sales and marketing | 9,428 | 15,835 | 25,245 | 38,854 | 35,833 | 28,722 | 22,420 | ||||||||||||||||
| Research and development | 3,916 | 3,905 | 5,693 | 10,415 | 10,343 | 8,236 | 6,598 | ||||||||||||||||
| General and administrative | 4,885 | 5,384 | 7,082 | 13,956 | 10,740 | 9,139 | 7,488 | ||||||||||||||||
| Amortization of goodwill and other intangibles | — | — | 60 | 4,644 | 6,567 | 4,949 | 2,141 | ||||||||||||||||
| Stock-based compensation | 2,800 | — | — | — | — | — | — | ||||||||||||||||
| Acquired in-process research and development | — | — | 60 | 3,900 | — | — | 110 | ||||||||||||||||
| Total operating expenses | 21,029 | 25,124 | 38,140 | 71,769 | 63,483 | 51,046 | 38,757 | ||||||||||||||||
| Income (loss) from operations | 6,627 | 5,956 | 10,241 | (15,129 | ) | (10,139 | ) | (13,692 | ) | 5,319 | |||||||||||||
| Other income (expense), net | (18 | ) | (1,087 | ) | 257 | 994 | (1,862 | ) | (1,342 | ) | (499 | ) | |||||||||||
| Income (loss) before income taxes | 6,609 | 4,869 | 10,498 | (14,135 | ) | (12,001 | ) | (15,034 | ) | 4,820 | |||||||||||||
| Provision (benefit) for income taxes | 2,478 | 1,826 | 4,311 | (2,968 | ) | (1,437 | ) | (1,798 | ) | 2,251 | |||||||||||||
| Net income (loss) | $ | 4,131 | $ | 3,043 | $ | 6,187 | $ | (11,167 | ) | $ | (10,564 | ) | $ | (13,236 | ) | $ | 2,569 | ||||||
| Net income (loss) per share: | |||||||||||||||||||||||
| Basic | $ | 0.38 | $ | 0.28 | $ | 0.57 | $ | (1.04 | ) | $ | (0.98 | ) | $ | (1.23 | ) | $ | 0.24 | ||||||
| Diluted | 0.38 | 0.28 | 0.56 | (1.04 | ) | (0.98 | ) | (1.23 | ) | 0.23 | |||||||||||||
| Shares used in per share computation: | |||||||||||||||||||||||
| Basic | 10,800 | 10,773 | 10,773 | 10,773 | 10,773 | 10,773 | 10,812 | ||||||||||||||||
| Diluted | 10,800 | 10,773 | 11,103 | 10,773 | 10,773 | 10,773 | 11,089 | ||||||||||||||||
- (1)
- In July 2000 we acquired Software Business Technologies, Inc., or SBT. The results of SBT's operations are included from the date of acquisition. See Note 5 of our notes to consolidated financial statements in this prospectus.
24
| | As of March 31, | | |||||||||||||||||
|---|---|---|---|---|---|---|---|---|---|---|---|---|---|---|---|---|---|---|---|
| | As of December 31, 2002 | ||||||||||||||||||
| | 1998 | 1999 | 2000 | 2001 | 2002 | ||||||||||||||
| | (In Thousands) | ||||||||||||||||||
| Consolidated Balance Sheet Data: | |||||||||||||||||||
| Cash and cash equivalents | $ | 4,013 | $ | 11,459 | $ | 23,841 | $ | 12,241 | $ | 14,042 | $ | 13,751 | |||||||
| Working capital (deficit) | 3,788 | 829 | 4,368 | (33,448 | ) | (11,455 | ) | (18,305 | ) | ||||||||||
| Total assets | 13,990 | 27,370 | 42,200 | 73,049 | 60,602 | 65,280 | |||||||||||||
| Note payable to Computer Associates | 5,000 | — | — | — | 26,700 | 16,195 | |||||||||||||
| Total stockholders' equity (deficit) | (798 | ) | 2,051 | 9,486 | (133 | ) | (8,316 | ) | 1,923 | ||||||||||
25
MANAGEMENT'S DISCUSSION AND ANALYSIS OF
FINANCIAL CONDITION AND RESULTS OF OPERATIONS
The following discussion should be read in conjunction with our consolidated financial statements and the notes to those statements that appear in this prospectus. The following discussion contains forward-looking statements that involve risks and uncertainties. Our actual results could differ materially from those anticipated in these forward-looking statements as a result of certain factors, including those discussed below and elsewhere in this prospectus, particularly under the heading "Risk Factors."
Our fiscal year ends on March 31. Throughout this document we refer to the fiscal year ended March 31, 2000 as fiscal 2000, the fiscal year ended March 31, 2001 as fiscal 2001 and the fiscal year ended March 31, 2002 as fiscal 2002.
Overview
We are a global provider of end-to-end business management software applications for small and midsize businesses, or SMBs. Our history of developing and marketing accounting applications provides a foundation for addressing critical business needs, including those in the areas of customer relationship management, electronic commerce, human resources management, warehouse management and Internet-based business-to-business transaction exchange.
We are a majority-owned subsidiary of Computer Associates. In April 1996, we were organized into a single business division of Computer Associates, following a series of acquisitions that Computer Associates made between 1985 and 1996, including its acquisition of Basic Software Group, which had developed and marketed accounting software products since 1979. In October 1997, we were incorporated as a wholly-owned subsidiary of Computer Associates. Since 1997, we have issued common stock to former shareholders of eWare Limited and to our officers, directors and employees. Upon the closing of this offering, Computer Associates will own approximately % of our common stock, or % if the underwriters exercise their over-allotment option in full. During the last two fiscal years, we have incurred significant losses. As of December 31, 2002, we had an accumulated deficit of $10.6 million.
In fiscal 2000 and fiscal 2001, we acquired several businesses and products that have expanded the breadth of our product offerings. These acquisitions include Software Business Technologies, Inc., or SBT, in July 2000, which provided us with the Pro Series accounting source code product, and a messaging product line that was transferred to us by Computer Associates in January 2000. The results of operations for the businesses that we acquired have been included in our financial statements since their respective dates of acquisition.
Acquisition of eWare Limited
On December 18, 2002, we acquired eWare Limited, a privately held developer of customer relationship management software products for small and midsize businesses. Prior to the acquisition we sold eWare products under license, and we anticipate that this acquisition will enable us to enhance our future product development. In connection with this transaction, we acquired all of the outstanding shares of stock of eWare in exchange for $1.8 million in cash and 761,110 shares of our common stock. We also issued 69,445 restricted shares to eWare executives and, in January 2003, 113,889 restricted shares to eWare employees. The restricted shares vest over periods of one to three years, subject to continued employment. Of the shares we issued as acquisition consideration and as compensation to eWare executives, 707,220 are subject to a put
26
option, entitling the shareholders to sell their shares to us for $5.82 per share, and a call option, entitling us to buy shares from the shareholders for $10.85 per share. These options are exercisable at any time during the 28-day period beginning November 19, 2003, and will terminate at the earlier of December 17, 2003 or the last business day prior to the effectiveness of a registration statement relating to the initial public offering of our common stock.
The acquisition of eWare has been accounted for as a purchase. Under the purchase method of accounting, the total purchase price of approximately $9.4 million has been allocated to eWare's net tangible and identifiable intangible assets based upon their estimated fair value as of the date of acquisition. A portion of the purchase price was allocated to in-process research and development and expensed at the time of the acquisition. The other identifiable acquired intangibles will be amortized over five years. We expect amortization of other identifiable intangibles to be $0.2 million, $0.7 million, $0.7 million, $0.7 million, $0.7 million and $0.4 million for fiscal 2003, fiscal 2004, fiscal 2005, fiscal 2006, fiscal 2007 and fiscal 2008, respectively. The residual purchase price was recorded as goodwill. In accordance with SFAS No. 142,Goodwill and Other Intangible Assets, goodwill relating to the eWare acquisition will not be amortized, but will be carried at cost and tested for impairment annually or whenever events indicate that impairment may have occurred.
In connection with the acquisition, we issued 69,445 shares of restricted common stock and committed to issue another 113,889 shares of restricted common stock to eWare executives and employees that vest over periods of one to three years, based on their continuous employment. We have recognized $1.6 million as deferred stock compensation based on the fair value of our common stock of $9.00 per share. We expect stock-based compensation relating to these issuances to be $0.2 million, $0.6 million, $0.5 million and $0.3 million for fiscal 2003, fiscal 2004, fiscal 2005 and fiscal 2006, respectively.
The results of eWare's operations subsequent to December 18, 2002 have been included in our operating results for the nine months ended December 31, 2002. The total purchase price and purchase price allocation are subject to adjustment based upon finalization of management's estimates of the direct costs of the acquisition and the realization of net assets acquired.
We are presently integrating eWare's 62 employees into our company. During the period from January 1, 2002 to December 18, 2002, eWare achieved revenue of $4.0 million and incurred a loss of $0.9 million. We anticipate that our operating expenses, primarily for sales and marketing and research and development, will increase in our fourth quarter of fiscal 2003 and for the foreseeable future as we continue to support an expanded organization. Please see "Note 5—Notes to the Consolidated Financial Statements" for more detailed information.
Revenue
We derive our revenue from license fees, maintenance and other fees, and the license of third-party applications.
License. Our license revenue is comprised of fees from our strategic and legacy products. Our strategic products include ACCPAC Advantage Series, ACCPAC Pro Series, ACCPAC eCRM and ACCPAC eTransact, as well as messaging and small office and home office, or SOHO, accounting applications. Our strategic products also include ACCPAC HR Series, ACCPAC Warehouse Management System and ACCPAC Exchange, which we license from technology vendors and market under the ACCPAC brand. Our legacy products consist of DOS-based
27
applications that we continue to offer and support in order to serve existing users. We offer our applications primarily on a perpetual license basis. Through our ACCPAC Online offering, we also provide our customers access on a monthly subscription-fee basis to some of our applications, which are hosted on remote servers. Our SMB-focused applications are distributed principally through our network of value-added resellers, certified consultants, accounting firms, third-party developers, and application service providers. Our SOHO-focused applications are distributed primarily through retail channels.
Maintenance and Other. Our maintenance and other revenue is comprised primarily of strategic and legacy revenue from maintenance contracts purchased by our customers. We offer maintenance contracts that provide product upgrades, on a when and if available basis, and a choice of various levels of technical support. A one-year SupportPlus maintenance contract is typically required as part of the purchase of our SMB-focused applications. Other revenue is comprised of consulting and training fees and fees from our annual reseller education and training conference held in August. Historically, maintenance and other revenue has grown in absolute dollars. We expect this trend will continue in the future.
Third-party. Our third-party revenue consists of revenue generated from third-party applications that complement and extend the functionality of our Advantage Series and Pro Series accounting suites. These applications are marketed under the third party developers' brands, and we do not provide maintenance for these applications.
Product Trends. Our goal is to continue to increase the sale of our strategic products through focused sales and marketing efforts. Over the last three fiscal years, the combined revenue from the sale of our strategic products and related maintenance contracts has increased both in absolute dollars and as a percentage of total revenue. Over the same period, our revenue related to legacy and third-party products has declined both in terms of absolute dollars and as a percentage of revenue. Our legacy products revenue declined due to decreased demand from prospective customers for these products primarily because they are DOS-based. Our third-party products revenue declined because we intentionally discontinued the sale of several third-party products with lower margins. We expect these declines in revenue from the sale of legacy and third-party products to continue in the future.
Geographic Trends. Historically, a majority of our revenue has been derived from international markets. Sales of our products in Canada, which are substantially all sales of SOHO-focused accounting products, were 40%, 32%, 35% and 35% of total revenue for fiscal 2000, fiscal 2001 and fiscal 2002, and the nine months ended December 31, 2002, respectively. Sales of our products in Singapore were 11%, 15%, 10% and 9%, respectively, of total revenue for these same periods. Sales of our products in other international markets were 10%, 11%, 13% and 16%, respectively, of total revenue for these same periods. The destination of product shipments is used to determine the classification of sales by geographic region. We expect to derive a significant portion of revenues from international markets in the future.
Critical Accounting Policies and Estimates
Our discussion and analysis of our financial condition and results of operations are based upon our consolidated financial statements, which have been prepared in accordance with accounting principles generally accepted in the United States. The preparation of these financial statements requires us to make estimates and judgments that affect the reported amounts of
28
assets, liabilities, revenue and expenses and the related disclosure of contingent assets and liabilities. Our actual results may differ from those estimates. We have discussed the development and selection of our critical accounting policies and estimates with our audit committee. The following critical accounting policies affect the significant judgments and estimates we use in preparing our consolidated financial statements.
Revenue Recognition. We recognize revenue in accordance with American Institute of Certified Public Accountants (AICPA) Statement of Position (SOP) 97-2,Software Revenue Recognition, and SOP 98-9,Modification of SOP 97-2, Software Revenue Recognition, with Respect to Certain Transactions. We recognize the revenue allocable to software licenses and third-party products upon shipment to our value-added resellers, certified consultants, accounting firms, third-party developers and application service providers, net of an allowance for estimated returns, provided the fee is fixed or determinable, persuasive evidence of an arrangement exists, collectibility of the fee is probable and vendor-specific objective evidence, or VSOE, of the fair value of all undelivered elements has been established. The fee we charge our value-added resellers is negotiated at the outset of an arrangement and is generally based on the specific volume of product to be delivered. Our normal and customary business practice is to offer payment terms of 30 days to 180 days. Accordingly, payment terms that extend beyond 180 days are considered to be an extended payment arrangement. Revenue relating to extended payment arrangements is recognized when amounts become due and payable. If collectibility is not considered probable, revenue is recognized when the fee is collected. Collectibility is assessed on a reseller-by-reseller basis. We typically sell to established resellers from which we have had a history of successful collection. New resellers are subject to a credit review process, in which we evaluate the reseller's financial position and ultimately its ability to pay. New resellers are typically assigned credit limits based on a review of their financial position. These credit limits are only increased after a successful collection history with the reseller has been established. On sales through wholesale distributors that resell our products to retailers, we recognize revenue allocable to software licenses upon the sale by the retailer to the end-user. We receive inventory and sales information on a regular basis from our distributors to determine the appropriate amount of revenue to recognize. We recognize revenue allocable to hosted applications ratably over the term of the agreement. Revenue attributable to hosted services typically consists of monthly recurring fees to access one or more of our on-line products.
VSOE. We have established VSOE of fair value for post-contract customer support based on the price customers are charged when maintenance and other support is sold separately. Our customers typically purchase maintenance agreements annually. We recognize revenue from maintenance and support agreements ratably over the term of the agreement, which is typically one year. VSOE of fair value for our undelivered elements that are bundled in a multiple-element arrangement is based on standard rates, or negotiated rates where applicable, for the individuals providing services. The standard rates are typically the same rates charged when the undelivered elements are sold separately. We typically recognize revenue from training services and consulting services that are bundled in a multiple-element arrangement upon completion of the service.
Returns Allowance. We analyze historical returns, current economic trends, changes in consumer demand, the introduction of new competing software and the acceptance of our products in estimating returns. As a result of these factors, we reduce our gross sales to reflect our estimated amount of returns. If our actual returns are higher than our estimate, our revenue would decline and our results of operations may be harmed.
29
Allowance for Doubtful Accounts. We analyze customer concentrations, customer credit-worthiness and current economic trends to determine our allowance for doubtful accounts. We determine a specific allowance to individual receivable balances when full or partial collection is deemed doubtful. In addition, we also calculate a non-specific allowance that is applied against outstanding receivables for which we have not assessed a specific allowance but for which historical experience indicates loss exposure. If we make different judgments or use different estimates, the result may be material differences in the amount and timing of our bad debt expense for any period. If our customers experience financial difficulties and are not able to meet their ongoing financial obligations to us, our results of operations may be harmed.
Impairment of Goodwill and Other Intangible Assets. Throughout fiscal 2002, we periodically assessed whether any event, including a significant decline in demand for our strategic products and changes in market conditions, resulted in an impairment of the carrying value of these assets in accordance with SFAS No. 121,Accounting for the Impairment of Long-Lived Assets and for Long-Lived Assets to be Disposed of, and Accounting Principles Board Opinion No. 17,Intangible Assets. We have not recognized any impairment charges.
At the beginning of fiscal 2003, we adopted SFAS No. 142,Goodwill and Other Intangible Assets, and as a result, we no longer amortize goodwill and other intangible assets with indefinite useful lives. During fiscal 2002, goodwill was amortized on a straight-line basis over a five-year period, resulting in recurring quarterly amortization charges of $0.9 million. However, other intangible assets with definite useful lives will continue to be amortized on a straight-line basis over a five-year period. We expect to incur amortization charges of $1.3 million, $5.2 million, $4.9 million, $1.3 milion, $0.7 million and $0.5 million for fiscal 2003, fiscal 2004, fiscal 2005, fiscal 2006, fiscal 2007 and fiscal 2008, respectively, for identifiable intangible assets recorded as of December 31, 2002.
Under SFAS No. 142, we are required to assess the fair value and recoverability of goodwill upon adoption, as well as at least once a year prospectively. Accordingly, we will continue to evaluate whether any event has occurred that might indicate that the carrying value of goodwill is not recoverable. Changes in market conditions and other business indicators could give rise to factors that would require us to assess whether goodwill is impaired. Conditions having an impact on our revenue or operations could result in significant non-cash operating charges reflecting the write down of goodwill to estimated fair value. In accordance with SFAS No. 142, we have determined that we have one reporting unit, which is consistent with our one operating segment. We completed the transitional impairment test under SFAS No. 142 during the quarter ended September 30, 2002. The results of the transitional impairment test indicated that the fair value of our reporting unit exceeded its carrying value. Accordingly, there was no impairment of goodwill. During the quarter ended December 31, 2002, we tested for impairment under SFAS No. 142. The results of the annual impairment test indicated that the fair value of the reporting unit exceeded its carrying value. Accordingly, no impairment charge was recorded.
Beginning in fiscal 2003, we evaluate all of our long-lived assets, including intangible assets other than goodwill, for impairment in accordance with the provisions of SFAS No. 144,Accounting for the Impairment or Disposal of Long-Lived Assets. SFAS No. 144 requires that long-lived assets and intangible assets other than goodwill be evaluated for impairment whenever events or changes in circumstances indicate that the carrying value of an asset may not be recoverable based on expected undiscounted cash flows attributable to that asset. Should events indicate that any of our assets are impaired, the amount of such impairment will be measured as
30
the difference between the carrying value and the fair value of the impaired asset and recorded as income during the period of such impairment.
Income Taxes. We have established a valuation allowance against deferred tax assets to reduce our deferred tax assets to an amount that is more likely than not to be realized. If our assessment of the deferred tax assets or the corresponding valuation allowance were to change, the related adjustment would be recorded to income during the period in which we make the determination. The tax rate may also vary based on our results and the mix of income or loss in domestic and foreign tax jurisdictions in which we operate.
Results of Operations
The following table sets forth, for each of the periods indicated, certain consolidated statements of operations data as a percentage of total revenue:
| | Fiscal Year Ended March 31, | Nine Months Ended December 31, | |||||||||
|---|---|---|---|---|---|---|---|---|---|---|---|
| | 2000 | 2001 | 2002 | 2001 | 2002 | ||||||
| Revenue: | |||||||||||
| License | 56.2 | % | 54.6 | % | 49.5 | % | 46.5 | % | 45.4 | % | |
| Maintenance and other | 27.5 | 33.4 | 43.4 | 45.7 | 49.0 | ||||||
| Third-party products | 16.3 | 12.0 | 7.1 | 7.8 | 5.6 | ||||||
| Total revenue | 100.0 | 100.0 | 100.0 | 100.0 | 100.0 | ||||||
| Cost of revenue: | |||||||||||
| License | 12.7 | 12.3 | 11.3 | 10.7 | 8.7 | ||||||
| Maintenance and other | 7.2 | 11.0 | 13.3 | 13.6 | 15.1 | ||||||
| Third-party products | 14.5 | 9.2 | 5.2 | 6.1 | 3.8 | ||||||
| Amortization of acquired intangibles | 0.3 | 1.6 | 2.1 | 2.2 | 2.0 | ||||||
| Total cost of revenue | 34.7 | 34.1 | 31.9 | 32.6 | 29.6 | ||||||
| Gross profit | 65.3 | 65.9 | 68.1 | 67.4 | 70.4 | ||||||
| Operating expenses: | |||||||||||
| Sales and marketing | 34.1 | 45.2 | 45.8 | 51.8 | 35.8 | ||||||
| Research and development | 7.7 | 12.1 | 13.2 | 14.9 | 10.5 | ||||||
| General and administrative | 9.5 | 16.2 | 13.7 | 16.5 | 12.0 | ||||||
| Amortization of intangibles | 0.1 | 5.4 | 8.4 | 8.9 | 3.4 | ||||||
| Acquired in-process research and development | 0.1 | 4.6 | — | — | 0.2 | ||||||
| Total operating expenses | 51.5 | 83.5 | 81.1 | 92.1 | 61.9 | ||||||
| Income (loss) from operations | 13.8 | (17.6 | ) | (13.0 | ) | (24.7 | ) | 8.5 | |||
| Other income (expense), net | 0.3 | 1.2 | (2.3 | ) | (2.4 | ) | (0.8 | ) | |||
| Income (loss) before income taxes | 14.1 | (16.4 | ) | (15.3 | ) | (27.1 | ) | 7.7 | |||
| Provision (benefit) for income taxes | 5.8 | (3.4 | ) | (1.8 | ) | (3.2 | ) | 3.6 | |||
| Net income (loss) | 8.3 | % | (13.0 | )% | (13.5 | )% | (23.9 | )% | 4.1 | % | |
31
Nine Months Ended December 31, 2002 Compared With Nine Months Ended December 31, 2001
Revenue
Total revenue increased 12.8% from $55.5 million for the nine months ended December 31, 2001, to $62.6 million for the nine months ended December 31, 2002. This increase resulted from a 19.9% increase in revenue from the combined license and maintenance and other revenue related to our strategic products, and was predominately due to an increased volume of products sold and services performed, as our prices have remained relatively constant the past three fiscal years and in the first nine months of fiscal 2003. This increase was partially offset by a decrease of 24.0% in revenues from our combined legacy and third-party products. The combined license and maintenance and other revenue related to our strategic products increased from approximately $46.5 million for the nine months ended December 31, 2001, to approximately $55.7 million for the nine months ended December 31, 2002. This increase was partially offset by a decrease of approximately $2.2 million in revenue from our combined legacy and third-party products because of decreased demand for our DOS-based products and because of our continued de-emphasis of lower margin third-party products.
License. License revenue increased 10% from $25.8 million for the nine months ended December 31, 2001, to $28.4 million for the nine months ended December 31, 2002. The increase in license revenue is attributable to increased demand for our strategic products from both new and existing customers. License revenue from our strategic products increased 13.6% from approximately $24.2 million for the nine months ended December 31, 2001, to approximately $27.5 million for the nine months ended December 31, 2002. This increase was partially offset by a decrease of 44.8% in license revenue from our legacy products, from approximately $1.6 million for the nine months ended December 31, 2001, to approximately $0.9 million for the nine months ended December 31, 2002. As a percentage of total revenue, total license revenue decreased from 46.5% for the nine months ended December 31, 2001, to 45.4% for the nine months ended December 31, 2002, as a result of maintenance and other revenue growing faster than license revenue.
Maintenance and Other. Maintenance and other revenue increased 21.1% from $25.3 million for the nine months ended December 31, 2001, to $30.7 million for the nine months ended December 31, 2002. The increase in maintenance revenue and increase in maintenance revenue as a percentage of total revenue is due to the maintenance revenue associated with an increase in the number of licenses for our strategic products and increasing renewals of existing maintenance contracts from the installed base of customers. Maintenance and other revenue from our strategic products increased 26.8% from approximately $22.3 million for the nine months ended December 31, 2001, to approximately $28.2 million for the nine months ended December 31, 2002. This increase was partially offset by a decrease in maintenance and other revenue from our legacy products of 20.2% from approximately $3.1 million for the nine months ended December 31, 2001, to approximately $2.4 million for the nine months ended December 31, 2002. As a percentage of total revenue, maintenance and other revenue increased from 45.7% for the nine months ended December 31, 2001, to 49.0% for the nine months ended December 31, 2002. Although we anticipate that maintenance and other revenue will continue to grow, we do not anticipate that maintenance and other revenue will continue to increase at this rate in the future.
Third-party Products. Third-party products revenue decreased 19.0% from $4.3 million for the nine months ended December 31, 2001, to $3.5 million for the nine months ended
32
December 31, 2002. As a percentage of total revenue, third-party products revenue decreased from 7.8% for the nine months ended December 31, 2001, to 5.6% for the nine months ended December 31, 2002. The decrease in both absolute dollars and as a percentage of revenue is due to our decision to discontinue the sale of several third-party products with lower margins. We anticipate that third-party products revenue will remain constant in absolute dollars for the foreseeable future.
Cost of Revenue
Total cost of revenue increased 2.2% from $18.1 million for the nine months ended December 31, 2001, to $18.5 million for the nine months ended December 31, 2002. As a percentage of total revenue, total cost of revenue decreased from 32.6% for the nine months ended December 31, 2001, to 29.6% for the nine months ended December 31, 2002. The decrease resulted primarily from a decrease of $0.5 million in cost of license revenue and of $1.0 million in cost of third-party products revenue. This decrease was partially offset by an increase of $1.9 million in cost of maintenance and other revenue.
Cost of License. Cost of license revenue consists primarily of the packaging, assembly, storage and shipping and handling costs of our software. Our cost of license revenue for our strategic products also includes royalties paid to third-party technology vendors and commissions paid to channel partners that facilitate sales to our end-users. Cost of license revenue decreased 8.8% from $5.9 million for the nine months ended December 31, 2001, to $5.4 million for the nine months ended December 31, 2002. As a percentage of license revenue, cost of license revenue decreased from 23.0% for the nine months ended December 31, 2001, to 19.1% for the nine months ended December 31, 2002. The decrease, both in absolute dollars and as a percentage of revenue, resulted primarily from a decrease of $1.0 million in material and shipping costs as a result of the introduction of our master CD program in fiscal 2002. Under our master CD program, we provide our channel partners with a single master CD for an application, which they can use to install the application at multiple end-user sites, thereby reducing the costs we incur from distributing separate CDs to each end-user. The cost reductions due to our master CD program were substantially offset by an increase of approximately $0.6 million in royalties related to sales of our strategic products. As license revenue from our strategic products grows, we expect that royalties expense will continue to increase the cost of license revenue.
Cost of Maintenance and Other. Cost of maintenance and other revenue consists primarily of salaries paid to our technical support, training and consulting staff, fees paid to third parties for subcontracted professional services and support, and royalties paid to third-party technology vendors. Cost of maintenance and other revenue also consists of the cost of packaging, assembly, shipping and handling, and storage related to product upgrades offered on a when and if available basis in connection with our maintenance contracts and commissions paid to our channel partners for the renewal by end-users of their maintenance contracts. Cost of maintenance and other revenue increased 25.5% from $7.6 million for the nine months ended December 31, 2001, to $9.5 million for the nine months ended December 31, 2002. As a percentage of maintenance and other revenue, cost of maintenance and other revenue increased from 29.8% for the nine months ended December 31, 2001, to 30.9% for the nine months ended December 31, 2002. The increase, both in absolute dollars and as a percentage of revenue, resulted primarily from an increase of $2.5 million in commissions paid to our channel partners resulting from a $5.3 million increase in maintenance and other revenue. This increase was partially offset by a $0.8 million reduction in
33
support overhead and packaging costs due to reduced packaging, assembly, shipping and handling, and storage costs relative to maintenance and other revenue as a result of distributing more product upgrades through the Internet and our master CD program.
Cost of Third-party Products. Cost of third-party products revenue consists of license fees paid to software application developers who create products that we sell in conjunction with our own software. Cost of third-party products revenue decreased 29.9% from $3.4 million for the nine months ended December 31, 2001, to $2.4 million for the nine months ended December 31, 2002. The decrease was as a result of the de-emphasis of low-margin third-party products. As a percentage of third-party products revenue, the cost of third-party products revenue decreased from 78.0% for the nine months ended December 31, 2001, to 67.5% for the nine months ended December 31, 2002, as we focused on selling third-party products with higher margins in the nine months ended December 31, 2002, relative to the six months ended September 30, 2001.
Amortization of Acquired Intangibles. Cost of amortization of acquired intangibles consists of amortization of capitalized acquired technology that was recorded as a result of our acquisitions. The acquired technology is amortized on a straight-line basis over the estimated useful life of the asset. The cost of amortization of acquired intangibles remained constant at $1.2 million for the nine months ended December 31, 2001 and December 31, 2002. As a percentage of total revenue, the cost of amortization of acquired intangibles decreased from 2.2% for the nine months ended December 31, 2001, to 2.0% for the nine months ended December 31, 2002. We expect that the absolute dollar amount of this cost will increase in future periods due to our recent acquisition of eWare.
Operating Expenses
In August and October of 2001, in response to the weakening economy, we initiated a number of cost control measures, including personnel reductions and facility consolidations, that resulted in reduced sales and marketing, research and development and general and administrative expenses for the nine months ended December 31, 2002, when compared to the same period in the prior fiscal year.
Sales and Marketing. Sales and marketing expenses consist of salaries, commissions and related costs for sales and marketing personnel, including travel costs and promotion expenditures, including public relations, advertising and trade show costs. Sales and marketing expenses decreased 21.9% from $28.7 million for the nine months ended December 31, 2001, to $22.4 million for the nine months ended December 31, 2002. As a percentage of total revenue, sales and marketing expenses decreased from 51.8% for the nine months ended December 31, 2001, to 35.8% for the nine months ended December 31, 2002. The decrease, both in absolute dollars and as a percentage of total revenue, was primarily the result of a $5.5 million decrease in promotional expenses and a $1.0 million reduction in personnel costs. In August and October 2001, in response to a weakening economy, we reduced personnel in the sales and marketing organization by seven and 24 employees, respectively. We anticipate that the acquisition of eWare will result in an increase in our sales and marketing expense in absolute dollars.
Research and Development. Research and development expenses consist primarily of costs associated with software development, which include salaries and other related costs for our in-house development staff. The majority of our in-house development staff is located in Canada. From time to time, our in-house development staff is supported by outside developers on a
34
contract basis. Research and development expenses decreased 19.9% from $8.2 million for the nine months ended December 31, 2001, to $6.6 million for the nine months ended December 31, 2002. As a percentage of total revenue, research and development expenses decreased from 14.8% for the nine months ended December 31, 2001, to 10.5% for the nine months ended December 31, 2002. The decrease in research and development expenses, both in absolute dollars and as a percentage of total revenue, resulted from a $1.0 million reduction in personnel expenses, primarily due to a reduction of our in-house development staff in August and October 2001 by 10 and 21 employees, respectively, and a decrease of $0.3 million due to reduced use of outside developers during the period. We expect our research and development expense will increase as a result of our acquisition of eWare.
General and Administrative. General and administrative expenses consist primarily of salaries and related costs for financial, administrative and management personnel, as well as costs related to travel, financial, accounting, human resources, legal, facilities, equipment and other general operations. General and administrative expenses decreased 18.1% from $9.1 million for the nine months ended December 31, 2001, to $7.5 million for the nine months ended December 31, 2002. As a percentage of total revenue, general and administrative expenses decreased from 16.5% for the nine months ended December 31, 2001, to 12.0% for the six months ended December 31, 2002. The decrease in general and administrative expenses, both in absolute dollars and as a percentage of total revenue, resulted from reduced general office and facilities costs of $1.3 million primarily due to the subleasing of office space and a $0.5 million reduction in legal costs. We anticipate that general and administrative expenses will increase due to the additional costs of being a public company and due to our recent growth of our business as a result of the acquisition of eWare.
Amortization of Goodwill and Intangibles
Amortization of intangibles decreased 56.7% from $4.9 million for the nine months ended December 31, 2001, to $2.1 million for the nine months ended December 31, 2002. The decrease in amortization of intangibles resulted from our adoption of SFAS No. 142 on April 1, 2002, whereby goodwill and other intangibles with indefinite useful lives are no longer amortized but instead are tested for impairment annually and more frequently upon the occurrence of certain events, as defined by SFAS No. 142.
We continue to amortize other intangible assets of $13.9 million as of December 31, 2002, on a straight-line basis over their remaining useful lives. Amortization related to these intangibles is currently expected to be $1.3 million, $5.2 million, $4.9 million, $1.3 million, $0.7 million and $0.5 million for the remaining three months of fiscal 2003, fiscal 2004, fiscal 2005, fiscal 2006, fiscal 2007 and fiscal 2008, respectively.
Acquired In-process Research and Development
Acquired in-process research and development expenses were $0.1 million for the nine months ended December 31, 2002, as a result of our acquisition of eWare. The acquired in-process research and development had not reached technological feasibility and, in the opinion of management, has no alternative future use.
Other Income/Expense
Other income/expense consists primarily of interest expense from outstanding indebtedness and interest income received on our bank deposits. Other expense, net decreased from $1.3 million for the nine months ended December 31, 2001, to $0.5 million for the nine months
35
ended December 31, 2002. The decline in other expense resulted primarily from a $0.6 million reduction in interest expense due to a reduction of principal and a reduction of the interest rate from 7.5% to 5.5% per annum under the promissory note payable to Computer Associates. The interest rate decrease was the result of a negotiation with Computer Associates and is reflective of a general decline in interest rates. The interest rate reduction was effective April 1, 2002. See "Certain Transactions—Asset Assignment Agreements."
Provision for Income Taxes
We recorded an income tax benefit of $1.8 million for the nine months ended December 31, 2001 and an income tax provision of $2.3 million for the nine months ended December 31, 2002. The change was due to the mix of domestic and international income (loss) and due to certain foreign operating losses for which we did not receive a tax benefit. The expected effective tax rate on estimated taxable income for fiscal 2003 is 47%.
Fiscal 2002 Compared With Fiscal 2001
Revenue
Total revenue decreased 8.9% from $85.9 million in fiscal 2001, to $78.3 million in fiscal 2002. The decrease was predominantly due to a decrease in volume of products sold, partially offset by an increase in services performed, as our prices have remained relatively constant between the periods. Total revenue from strategic products increased by 0.9% from approximately $66.2 million in fiscal 2001, to approximately $66.8 million in fiscal 2002. The growth in total revenue from our strategic products was driven by an increase of approximately $6.5 million in related maintenance and other revenue, which was partially offset by a decline of approximately $5.9 million in license revenue related to our strategic products, which we believe was due primarily to a deterioration of economic conditions as well as the integration of the SBT sales channel into our sales channel. Total revenue from our combined legacy and third-party products decreased 41.9% from approximately $19.7 million in fiscal 2001, to approximately $11.5 million in fiscal 2002.
License. License revenue decreased 17.3% from $46.9 million in fiscal 2001 to $38.8 million in fiscal 2002. License revenue from our strategic products decreased 13.7% from approximately $42.7 million in fiscal 2001, to approximately $36.8 million in fiscal 2002. The decline was a result of reduced volume, which we believe was due to a deterioration of economic conditions, which caused some customers to cancel or delay their purchases. In addition, license revenue from our legacy products decreased 53.4% from approximately $4.2 million in fiscal 2001, to approximately $2.0 million in fiscal 2002. This decrease is attributed to our customers' continued migration from legacy products to next generation products. As a percentage of total revenue, license revenue decreased from 54.6% in fiscal 2001, to 49.5% in fiscal 2002 as a result of maintenance and other revenue growing at a faster rate than license revenue.
36
Maintenance and Other. Maintenance and other revenue increased 18.2% from $28.7 million in fiscal 2001, to $34.0 million in fiscal 2002. Maintenance and other revenue from our strategic products increased 27.6% from approximately $23.5 million in fiscal 2001, to approximately $30.0 million in fiscal 2002 as a result of increased renewal rates from our existing customers, growing our customer base following the acquisitions that we completed in fiscal 2001 and an increased selling effort related to our maintenance contracts, partially offset by a decline license sales. These increases were also partially offset by a 24.1% decrease in maintenance and other revenue from our legacy products from approximately $5.2 million in fiscal 2001, to approximately $4.0 million in fiscal 2002. As a percentage of total revenue, maintenance and other revenue increased from 33.4% in fiscal 2001, to 43.4% in fiscal 2002.
Third-party Products. Third-party products revenue decreased 46.2% from $10.3 million in fiscal 2001, to $5.5 million in fiscal 2002. As a percentage of total revenue, third-party products revenue decreased from 12.0% in fiscal 2001, to 7.1% in fiscal 2002. The decrease in both absolute dollars and as a percentage of revenue is due to our decision to discontinue the sale of several third party products with lower margins.
Cost of Revenue
Total cost of revenue decreased 14.8% from $29.2 million in fiscal 2001, to $24.9 million in fiscal 2002. As a percentage of total revenue, total cost of revenue decreased from 34.1% in fiscal 2001, to 31.9% in fiscal 2002.
Cost of License. Cost of license revenue decreased 16.4% from $10.6 million in fiscal 2001, to $8.9 million in fiscal 2002 as a result of decreased license revenue. As a percentage of license revenue, cost of license revenue increased slightly from 22.5% in fiscal 2001, to 22.8% in fiscal 2002 due to a $2.9 million reduction in packaging costs as a result of distributing software upgrades through the Internet and through the use of the master CD program which was partially offset by an increase of $1.0 million in commissions paid to our channel partners and an increase of approximately $0.3 million in royalty payments related to our strategic products relative to the total amount of license revenue generated.
Cost of Maintenance and Other. Cost of maintenance and other revenue increased 10.5% from $9.4 million in fiscal 2001, to $10.4 million in fiscal 2002 primarily as a result of a $2.9 million increase in commissions paid to our channel partners. The increase in commissions resulted from modifications we made in fiscal 2002 to our commission plan. These modifications included paying our channel partners varying levels of commissions depending on the percentage of their customers that renew their maintenance contracts. The increase in commissions was partially offset by a $1.8 million reduction in packaging costs as a result of distributing software upgrades through the Internet and through the use of the master CD program. As a percentage of maintenance and other revenue, cost of maintenance and other revenue decreased from 32.7% in fiscal 2001, to 30.6% in fiscal 2002 due to reduced packaging costs relative to maintenance and other revenue as a result of distributing software upgrades through the Internet and our master CD program.
Cost of Third-party Products. Cost of third-party products revenue decreased 48.9% from $7.9 million in fiscal 2001, to $4.1 million in fiscal 2002 as a result of reduced sales of lower margin third-party products. As a percentage of third-party products revenue, cost of third-party
37
products revenue decreased from 77.1% in fiscal 2001, to 73.2% in fiscal 2002 as a result of our focus on selling third-party products with higher margins during fiscal 2002 relative to fiscal 2001.
Cost of Amortization of Acquired Intangibles. The cost of amortization of acquired intangibles increased 21.5% from $1.3 million in fiscal 2001, to $1.6 million in fiscal 2002. As a percentage of total revenue, the cost of amortization of acquired intangibles increased from 1.6% in fiscal 2001, to 2.1% in fiscal 2002. The increase in both absolute dollars and the percentage of revenue was a result of the acquisition of SBT in July 2000.
Operating Expenses
Sales and Marketing. Sales and marketing expenses decreased 7.8% from $38.9 million in fiscal 2001, to $35.8 million in fiscal 2002. This decrease resulted primarily from changes we implemented in response to weaker economic conditions, including a $1.6 million decrease in personnel expenses resulting from a personnel reduction of 31 employees in our sales and marketing organization and reduced travel expenses of $0.8 million. As a percentage of total revenue, sales and marketing expenses remained relatively flat, increasing slightly from 45.2% in fiscal 2001, to 45.8% in fiscal 2002 due to a decrease in total revenue that was not fully offset by a corresponding decrease in sales and marketing expenses.
Research and Development. Research and development expenses remained relatively flat, decreasing slightly from $10.4 million in fiscal 2001, to $10.3 million in fiscal 2002 due primarily to a decrease of $0.3 million in personnel expenses in response to weaker economic conditions, offset by a $0.2 million increase in third-party consulting expenses. As a percentage of total revenue, research and development expenses increased from 12.1% in fiscal 2001, to 13.2% in fiscal 2002 due to a decrease in total revenue that was not fully offset by a corresponding decrease in research and development expenses.
General and Administrative. General and administrative expenses decreased 23.0% from $14.0 million in fiscal 2001, to $10.7 million in fiscal 2002. As a percentage of total revenue, general and administrative expenses decreased from 16.2% in fiscal 2001, to 13.7% in fiscal 2002. The decrease, both in absolute dollars and as a percentage of revenue, resulted from a $2.7 million reduction in legal fees principally relating to a copyright infringement lawsuit that we initiated and have now settled, as well as a $0.4 million reduction in personnel costs as a result of staff reductions in response to weaker economic conditions and a $0.7 million reduction in general office costs.
Amortization of Goodwill and Other Intangibles
Amortization of goodwill and other intangibles increased 41.4% from $4.6 million in fiscal 2001 to $6.6 million in fiscal 2002. This increase in amortization of goodwill and other intangibles was the result of recognizing a full year of amortization of goodwill and other intangibles related to the acquisition of SBT. While we continue to amortize intangible assets with definite useful lives, on April 1, 2002 we ceased amortizing goodwill and other intangibles with indefinite useful lives as a result of our adoption of SFAS No. 142. We estimate that this will result in a $3.7 million reduction of amortization expense for fiscal 2003 relative to fiscal 2002. On a pro forma basis, if SFAS No. 142 had been adopted on April 1, 2000, amortization of intangibles for fiscal 2001 and fiscal 2002 would have been $4.0 million and $4.5 million, respectively.
38
Acquired In-process Research and Development
We did not incur in-process research and development charges in fiscal 2002, which resulted in a $3.9 million decrease from fiscal 2001. The $3.9 million in research and development charges in fiscal 2001 was a result of our acquisition of SBT in July 2000.
Other Income/Expense
Other expense, net was $1.9 million in fiscal 2002 compared to other income, net of $1.0 million in fiscal 2001. The change in other income/expense, net resulted from reduced interest income as our level of bank deposits declined for substantially all of fiscal 2002 and from interest expense of $2.0 million under our note payable to Computer Associates, compared to no interest expense in fiscal 2001 because no interest accrued on the note payable to Computer Associates until April 2001. See "Certain Transactions—Asset Assignment Agreements."
Provision for Income Taxes
We recorded an income tax benefit of $3.0 million and $1.4 million in fiscal 2001 and fiscal 2002, respectively. Our effective tax rate was 21.0% in fiscal 2001, compared to 11.9% in fiscal 2002. The decrease in the effective tax rate was primarily caused by an increase in the valuation allowance due to the uncertainty of being able to realize certain deferred tax assets in foreign tax jurisdictions where we operate, as well as additional amortization expense related to goodwill in fiscal 2002 compared to fiscal 2001. These costs are not deductible for tax purposes. These decreases to income tax benefit were slightly offset by an increase in the income tax benefit that we realized in fiscal 2002 compared to fiscal 2001 in certain foreign tax jurisdictions where we operate and as a result of not incurring any acquired in-process research and development charges. Acquired in-process research and development costs are not deductible for tax purposes.
Fiscal 2001 Compared With Fiscal 2000
Revenue
Total revenue increased 15.9% from $74.1 million in fiscal 2000, to $85.9 million in fiscal 2001. The total revenue from our strategic products increased by 44.6% from approximately $45.8 million in fiscal 2000, to approximately $66.2 million in fiscal 2001 due to license and maintenance and other sales growth from existing and newly acquired products. The increase in revenue from our strategic products was partially offset by a 30.4% decrease in revenue from our legacy and third-party products from approximately $28.3 million in fiscal 2000, to approximately $19.7 million in fiscal 2001.
License. License revenue increased 12.5% from $41.7 million in fiscal 2000, to $46.9 million in fiscal 2001. License revenue from our strategic products increased 38.2% from approximately $30.9 million in fiscal 2000, to approximately $42.7 million in fiscal 2001, primarily as a result of $5.3 million in sales of products acquired from SBT in July 2000, $4.7 million in sales of the messaging products transferred from Computer Associates in January 2000 and, to a lesser extent, an increase of approximately $1.8 million in sales of our existing strategic products. These increases were partially offset by a 60.8% decrease in license revenue from legacy products from approximately $10.8 million for fiscal 2000, to approximately $4.2 million for fiscal 2001. As a percentage of total revenue, license revenue decreased from 56.2% in fiscal 2000, to 54.6% in
39
fiscal 2001 as a result of maintenance and other revenue growing at a faster rate than license revenue.
Maintenance and Other. Maintenance and other revenue increased 41.1% from $20.4 million in fiscal 2000, to $28.7 million in fiscal 2001. Maintenance and other revenue from our strategic products increased 58.0% from approximately $14.9 million in fiscal 2000, to approximately $23.5 million in fiscal 2001 primarily as a result of an increase in maintenance fees from our existing customers and as a result of a broader customer base following the acquisitions that we completed in fiscal 2001. These increases were partially offset by a 4.9% decrease in maintenance and other revenue related to our legacy products from approximately $5.5 million for fiscal 2000, to approximately $5.2 million for fiscal 2001. As a percentage of total revenue, maintenance and other revenue increased from 27.5% in fiscal 2000, to 33.4% in fiscal 2001.
Third-party Products. Third-party products revenue decreased 14.7% from $12.1 million in fiscal 2000, to $10.3 million in fiscal 2001. As a percentage of total revenue, third-party products revenue decreased from 16.3% in fiscal 2000 to 12.0% in fiscal 2001. The decrease in both absolute dollars and as a percentage of revenue is due to our decision to discontinue the sale of several third party products with lower margins.
Cost of Revenue
Total cost of revenue increased 13.8% from $25.7 million in fiscal 2000, to $29.2 million in fiscal 2001. As a percentage of total revenue, total cost of revenue decreased from 34.7% in fiscal 2000 to 34.1% in fiscal 2001.
Cost of License. Cost of license revenue increased 12.9% from $9.4 million in fiscal 2000, to $10.6 million in fiscal 2001 as a result of an increase in license revenue. As a percentage of license revenue, cost of license revenue increased slightly from 22.5% in fiscal 2000, to 22.6% in fiscal 2001 primarily as a result of a $0.4 million increase in royalty payments related to our strategic products, a $0.3 million increase in freight costs and a $0.3 million increase in personnel costs associated with our messaging products.
Cost of Maintenance and Other. Cost of maintenance and other revenue increased 75.8% from $5.4 million in fiscal 2000, to $9.4 million in fiscal 2001 as a result of an increase in maintenance and other revenue. As a percentage of maintenance and other revenue, cost of maintenance and other revenue increased from 26.3% in fiscal 2000, to 32.7% in fiscal 2001 as a result of a $2.0 million increase in personnel costs primarily due to the acquisition of SBT that were only partially offset by the increase in maintenance and other revenue.
Cost of Third-party Products. Cost of third-party products revenue decreased 26.0% from $10.7 million in fiscal 2000, to $7.9 million in fiscal 2001 as a result of reduced sales of third-party products. As a percentage of third-party products revenue, the cost of third-party products revenue decreased from 88.8% in fiscal 2000, to 77.1% in fiscal 2001 as a result of our focus on selling third-party products with higher margins during fiscal 2001 relative to fiscal 2000.
Amortization of Acquired Intangibles. The cost of amortization of acquired intangibles increased 386.3% from $0.3 million in fiscal 2000 to $1.3 million in fiscal 2001. As a percentage of total revenue, the cost of amortization of acquired intangibles increased from 0.3% in fiscal 2000 to 1.6% in fiscal 2001. The increase in both absolute dollars and the percentage of revenue was a result of the acquisition of SBT in July 2000.
40
Operating Expenses
Sales and Marketing. Sales and marketing expenses increased 53.9% from $25.2 million in fiscal 2000, to $38.9 million in fiscal 2001. As a percentage of total revenue, sales and marketing expenses increased from 34.1% of total revenue in fiscal 2000, to 45.2% of total revenue in fiscal 2001. The increase in sales and marketing expenses, both in absolute dollars and as a percentage of total revenue, was attributable to increased sales and marketing personnel costs of $4.6 million following the acquisition of SBT and a $5.8 million increase in promotional expenses primarily due to increased advertising, direct mail campaigns and trade show participation.
Research and Development. Research and development expenses increased 82.9% from $5.7 million in fiscal 2000, to $10.4 million in fiscal 2001. As a percentage of total revenue, research and development expenses increased from 7.7% in fiscal 2000, to 12.1% in fiscal 2001. The increase in research and development expenses, both in absolute dollars and as a percentage of total revenue, was attributable to a $3.6 million increase in personnel costs, primarily due to the acquisition of SBT and the transfer of messaging products from Computer Associates.
General and Administrative. General and administrative expenses increased 97.1% from $7.1 million in fiscal 2000, to $14.0 million in fiscal 2001. As a percentage of total revenue, general and administrative expenses increased from 9.5% in fiscal 2000, to 16.2% in fiscal 2001. The increase in general and administrative expenses, both in absolute dollars and as a percentage of total revenue, was attributable to an increase of $2.1 million in personnel costs and $1.8 million in general office costs, both primarily due to the acquisition of SBT, and an increase in legal fees of $1.8 million in connection with a copyright infringement lawsuit that we filed.
Amortization of Goodwill and Other Intangibles
Amortization of goodwill and other intangibles increased from $0.1 million in fiscal 2000, to $4.6 million in fiscal 2001 as a result of amortization of goodwill and other intangibles related to acquisitions consummated in fiscal 2001, most notably the acquisition of SBT. On a pro forma basis, if SFAS No. 142 had been adopted on April 1, 1999, amortization of other intangibles for fiscal 2000 and fiscal 2001 would have been $0.2 million and $4.0 million, respectively.
Acquired In-process Research and Development
Acquired in-process research and development expenses increased from $0.1 million in fiscal 2000, to $3.9 million in fiscal 2001 as a result of our acquisition of SBT. The value assigned to in-process research and development was determined by estimating the cost to develop the in-process research and development to commercially viable products, forecasting revenue expected from sales of the first generation of the in-process product, determining and deducting a percentage of the gross in-process product revenue to account for any strategic technology to be leveraged by the in-process product, determining and removing a percentage of the net in-process product revenue to account for the incomplete portion of the project, deducting appropriate operating expenses, cash flow adjustments and contributory asset returns to arrive at a forecast of net returns on the completed portion of the in-process technology, and discounting these net returns to a present value at an appropriate discount rate.
41
Other Income/Expense
Other income, net increased from $0.3 million in fiscal 2000, to $1.0 million in fiscal 2001. The increase in other income, net, resulted from an increase in interest income as we shifted our cash into money market funds and a reduction in interest expense as we repaid $5.0 million owed to Computer Associates pursuant to a promissory note in November 1999. This promissory note was established in 1998 as a part of the Contribution Agreement, which is more fully described in "Certain Transactions."
Provision/Benefit for Income Taxes
We recorded an income tax provision of $4.3 million and an income tax benefit of $3.0 million in fiscal 2000 and fiscal 2001, respectively. This change in provision/benefit for income taxes is primarily due to the shift from profit to loss from fiscal 2000 to fiscal 2001. We recognized income before income taxes of $10.5 million in fiscal 2000 compared to a loss before income taxes of $14.1 million in fiscal 2001. The change in provision/benefit for income taxes was slightly offset by costs that we incurred for acquired in-process research and development charges in fiscal 2001. No such costs were incurred during fiscal 2000. Acquired in-process research and development expenses are not deductible for tax purposes.
42
Quarterly Results of Operations
The following tables set forth the unaudited quarterly statements of operations data for each of the eleven quarters ended December 31, 2002, as well as such data expressed as a percentage of our total revenue for the quarters presented. The information for each of these quarters is derived from the unaudited consolidated financial statements and, in our opinion, includes all adjustments, consisting of only normal and recurring adjustments, necessary for a fair presentation of that information. The results of operations for any quarter and any quarter-to-quarter trends are not necessarily indicative of the results to be expected for any future period.
| | Quarter Ended | |||||||||||||||||||||||||||||||||||
|---|---|---|---|---|---|---|---|---|---|---|---|---|---|---|---|---|---|---|---|---|---|---|---|---|---|---|---|---|---|---|---|---|---|---|---|---|
| | June 30, 2000 | Sept 30, 2000 | Dec 31, 2000 | Mar 31, 2001 | June 30, 2001 | Sept 30, 2001 | Dec 31, 2001 | Mar 31, 2002 | June 30, 2002 | Sept 30, 2002 | Dec 31, 2002 | |||||||||||||||||||||||||
| | (Dollars in Thousands) | |||||||||||||||||||||||||||||||||||
| Consolidated Statements of Operations Data: | ||||||||||||||||||||||||||||||||||||
| Revenue: | ||||||||||||||||||||||||||||||||||||
| License | $ | 10,285 | $ | 11,993 | $ | 11,848 | $ | 12,782 | $ | 7,949 | $ | 8,184 | $ | 9,669 | $ | 12,985 | $ | 8,028 | $ | 8,783 | $ | 11,583 | ||||||||||||||
| Maintenance and other | 5,848 | 7,559 | 7,877 | 7,444 | 7,791 | 8,990 | 8,538 | 8,643 | 9,303 | 10,910 | 10,451 | |||||||||||||||||||||||||
| Third-party products | 2,233 | 2,863 | 2,893 | 2,303 | 1,975 | 1,200 | 1,161 | 1,204 | 1,221 | 974 | 1,318 | |||||||||||||||||||||||||
| Total revenue | 18,366 | 22,415 | 22,618 | 22,529 | 17,715 | 18,374 | 19,368 | 22,832 | 18,552 | 20,667 | 23,352 | |||||||||||||||||||||||||
| Cost of revenue: | ||||||||||||||||||||||||||||||||||||
| License | 2,351 | 2,492 | 2,605 | 3,150 | 1,937 | 1,871 | 2,133 | 2,921 | 1,576 | 1,823 | 2,021 | |||||||||||||||||||||||||
| Maintenance and other | 1,969 | 2,802 | 2,397 | 2,239 | 2,597 | 2,368 | 2,589 | 2,840 | 2,717 | 3,296 | 3,465 | |||||||||||||||||||||||||
| Third-party products | 1,899 | 2,143 | 2,217 | 1,677 | 1,556 | 938 | 886 | 673 | 814 | 648 | 908 | |||||||||||||||||||||||||
| Amortization of acquired intangibles | 111 | 401 | 426 | 409 | 409 | 409 | 409 | 409 | 409 | 409 | 409 | |||||||||||||||||||||||||
| Total cost of revenue | 6,330 | 7,838 | 7,645 | 7,475 | 6,499 | 5,586 | 6,017 | 6,843 | 5,516 | 6,176 | 6,803 | |||||||||||||||||||||||||
| Gross profit | 12,036 | 14,577 | 14,973 | 15,054 | 11,216 | 12,788 | 13,351 | 15,989 | 13,036 | 14,491 | 16,549 | |||||||||||||||||||||||||
| Operating expenses: | ||||||||||||||||||||||||||||||||||||
| Sales and marketing | 7,002 | 10,543 | 10,329 | 10,980 | 9,072 | 9,577 | 10,073 | 7,111 | 7,424 | 7,724 | 7,272 | |||||||||||||||||||||||||
| Research and development | 1,961 | 2,911 | 2,784 | 2,759 | 3,029 | 2,845 | 2,362 | 2,107 | 2,200 | 2,130 | 2,268 | |||||||||||||||||||||||||
| General and administrative | 2,096 | 3,157 | 4,149 | 4,554 | 3,085 | 3,098 | 2,956 | 1,601 | 2,355 | 2,396 | 2,737 | |||||||||||||||||||||||||
| Amortization of intangibles | 57 | 1,309 | 1,610 | 1,668 | 1,631 | 1,670 | 1,649 | 1,617 | 756 | 713 | 672 | |||||||||||||||||||||||||
| Acquired in-process research and development | — | 3,900 | — | — | — | — | — | — | — | — | 110 | |||||||||||||||||||||||||
| Total operating expenses | 11,116 | 21,820 | 18,872 | 19,961 | 16,817 | 17,190 | 17,040 | 12,436 | 12,735 | 12,963 | 13,059 | |||||||||||||||||||||||||
| Income (loss) from operations | 920 | (7,243 | ) | (3,899 | ) | (4,907 | ) | (5,601 | ) | (4,402 | ) | (3,689 | ) | 3,553 | 301 | 1,528 | 3,490 | |||||||||||||||||||
| Other income (expense), net | 180 | 124 | 226 | 464 | (413 | ) | (438 | ) | (491 | ) | (520 | ) | (324 | ) | (346 | ) | 171 | |||||||||||||||||||
| Income (loss) before income taxes | 1,100 | (7,119 | ) | (3,673 | ) | (4,443 | ) | (6,014 | ) | (4,840 | ) | (4,180 | ) | 3,033 | (23 | ) | 1,182 | 3,661 | ||||||||||||||||||
| Provision (benefit) for income taxes | 214 | (1,384 | ) | (714 | ) | (1,084 | ) | (716 | ) | (585 | ) | (497 | ) | 361 | 61 | 719 | 1,471 | |||||||||||||||||||
| Net income (loss) | $ | 886 | $ | (5,735 | ) | $ | (2,959 | ) | $ | (3,359 | ) | $ | (5,298 | ) | $ | (4,255 | ) | $ | (3,683 | ) | $ | 2,672 | $ | (84 | ) | $ | 463 | $ | 2,190 | |||||||
| Net income (loss) per share: | ||||||||||||||||||||||||||||||||||||
| Basic | $ | 0.08 | $ | (0.53 | ) | $ | (0.27 | ) | $ | (0.31 | ) | $ | (0.49 | ) | $ | (0.39 | ) | $ | (0.34 | ) | $ | 0.25 | $ | (0.01 | ) | $ | 0.04 | $ | 0.20 | |||||||
| Diluted | 0.08 | (0.53 | ) | (0.27 | ) | (0.31 | ) | (0.49 | ) | (0.39 | ) | (0.34 | ) | 0.24 | (0.01 | ) | 0.04 | 0.19 | ||||||||||||||||||
| Shares used in per share computation: | ||||||||||||||||||||||||||||||||||||
| Basic | 10,773 | 10,773 | 10,773 | 10,773 | 10,773 | 10,773 | 10,773 | 10,773 | 10,773 | 10,774 | 10,900 | |||||||||||||||||||||||||
| Diluted | 11,211 | 10,773 | 10,773 | 10,773 | 10,773 | 10,773 | 10,773 | 11,217 | 10,773 | 11,171 | 11,293 | |||||||||||||||||||||||||
| As a Percentage of Revenue: | ||||||||||||||||||||||||||||||||||||
| Revenue: | ||||||||||||||||||||||||||||||||||||
| License | 56.0 | % | 53.5 | % | 52.4 | % | 56.7 | % | 44.9 | % | 44.6 | % | 49.9 | % | 56.9 | % | 43.3 | % | 42.5 | % | 49.6 | % | ||||||||||||||
| Maintenance and other | 31.8 | 33.7 | 34.8 | 33.1 | 44.0 | 48.9 | 44.1 | 37.8 | 50.1 | 52.8 | 44.8 | |||||||||||||||||||||||||
| Third-party products | 12.2 | 12.8 | 12.8 | 10.2 | 11.1 | 6.5 | 6.0 | 5.3 | 6.6 | 4.7 | 5.6 | |||||||||||||||||||||||||
| Total revenue | 100.0 | 100.0 | 100.0 | 100.0 | 100.0 | 100.0 | 100.0 | 100.0 | 100.0 | 100.0 | 100.0 | |||||||||||||||||||||||||
| Cost of revenue: | ||||||||||||||||||||||||||||||||||||
| License | 12.8 | 11.1 | 11.5 | 14.0 | 10.9 | 10.2 | 11.0 | 12.8 | 8.5 | 8.8 | 8.7 | |||||||||||||||||||||||||
| Maintenance and other | 10.7 | 12.5 | 10.6 | 9.9 | 14.7 | 12.9 | 13.4 | 12.4 | 14.6 | 15.9 | 14.8 | |||||||||||||||||||||||||
| Third-party products | 10.4 | 9.6 | 9.8 | 7.5 | 8.8 | 5.1 | 4.6 | 3.0 | 4.4 | 3.2 | 3.9 | |||||||||||||||||||||||||
| Amortization of acquired intangibles | 0.6 | 1.8 | 1.9 | 1.8 | 2.3 | 2.2 | 2.1 | 1.8 | 2.2 | 2.0 | 1.7 | |||||||||||||||||||||||||
| Total cost of revenue | 34.5 | 35.0 | 33.8 | 33.2 | 36.7 | 30.4 | 31.1 | 30.0 | 29.7 | 29.9 | 29.1 | |||||||||||||||||||||||||
| Gross profit | 65.5 | 65.0 | 66.2 | 66.8 | 63.3 | 69.6 | 68.9 | 70.0 | 70.3 | 70.1 | 70.9 | |||||||||||||||||||||||||
| Operating expenses: | ||||||||||||||||||||||||||||||||||||
| Sales and marketing | 38.1 | 47.0 | 45.7 | 48.7 | 51.2 | 52.1 | 52.0 | 31.1 | 40.0 | 37.4 | 31.1 | |||||||||||||||||||||||||
| Research and development | 10.7 | 13.0 | 12.3 | 12.3 | 17.1 | 15.5 | 12.2 | 9.2 | 11.9 | 10.3 | 9.7 | |||||||||||||||||||||||||
| General and administrative | 11.4 | 14.1 | 18.3 | 20.2 | 17.4 | 16.9 | 15.3 | 7.0 | 12.7 | 11.6 | 11.7 | |||||||||||||||||||||||||
| Amortization of intangibles | 0.3 | 5.8 | 7.1 | 7.4 | 9.2 | 9.1 | 8.5 | 7.1 | 4.1 | 3.4 | 2.9 | |||||||||||||||||||||||||
| Acquired in-process research and development | — | 17.4 | — | — | — | — | — | — | — | — | 0.5 | |||||||||||||||||||||||||
| Total operating expenses | 60.5 | 97.3 | 83.4 | 88.6 | 94.9 | 93.6 | 88.0 | 54.4 | 68.7 | 62.7 | 55.9 | |||||||||||||||||||||||||
| Income (loss) from operations | 5.0 | (32.3 | ) | (17.2 | ) | (21.8 | ) | (31.6 | ) | (24.0 | ) | (19.1 | ) | 15.6 | 1.6 | 7.4 | 15.0 | |||||||||||||||||||
| Other income (expense), net | 1.0 | 0.5 | 1.0 | 2.1 | (2.3 | ) | (2.4 | ) | (2.5 | ) | (2.3 | ) | (1.7 | ) | (1.7 | ) | 0.7 | |||||||||||||||||||
| Income (loss) before income taxes | 6.0 | (31.8 | ) | (16.2 | ) | (19.7 | ) | (33.9 | ) | (26.4 | ) | (21.6 | ) | 13.3 | (0.1 | ) | 5.7 | 15.7 | ||||||||||||||||||
| Provision (benefit) for income taxes | 1.2 | (6.2 | ) | (3.1 | ) | (4.8 | ) | (4.0 | ) | (3.2 | ) | (2.6 | ) | 1.6 | 0.4 | 3.5 | 6.3 | |||||||||||||||||||
| Net income (loss) | 4.8 | % | (25.6 | )% | (13.1 | )% | (14.9 | )% | (29.9 | )% | (23.2 | )% | (19.0 | )% | 11.7 | % | (0.5 | )% | 2.2 | % | 9.4 | % | ||||||||||||||
43
Our customers typically purchase new accounting applications and upgrades at the end of their fiscal year, which generally occurs during the quarters ending December 31 and March 31 of each year. In recent years, we have recognized a proportionately lower percentage of our revenue in the first quarter of our fiscal year.
For the quarter ended September 30, 2000, we recognized a significant increase in both our revenues and our operating expenses in connection with our acquisition of SBT. Also in connection with our acquisition of SBT, we incurred a significant increase in our amortization of intangible assets and a one-time charge of $3.9 million for acquired in-process research and development.
In the quarter ending September 30 of each fiscal year, we conduct a reseller education and training conference. The fees from this conference have historically resulted in increased maintenance and other revenue for the quarters ended September 30 of past fiscal years. In connection with this conference, we also incur additional cost of maintenance and other revenues and sales and marketing expenses in the quarters ending September 30 of each fiscal year.
For the quarter ended March 31, 2002, we began to benefit from cost control measures initiated in the quarters ended September 30 and December 31, 2001. These measures included a reduction in a number of areas, including a 96 employee reduction in personnel and reductions in, trade show participation, marketing expenditures and travel costs, and the consolidation of facilities. In addition, general and administrative expenses for the quarter ended March 31, 2002 were further reduced by a reimbursement of legal fees of $0.8 million from our insurance company for a copyright infringement lawsuit we initiated. This lawsuit has been settled, and we expect that it will have no material impact in the future.
Liquidity and Capital Resources
We have financed our operations primarily through internally generated cash flows and extensions of credit from Computer Associates. We financed our acquisition of SBT through $26.7 million in funds we borrowed from Computer Associates, evidenced by a promissory note, of which $16.2 million remains outstanding as of December 31, 2002. In December 2002, we acquired eWare Limited for $9.4 million, including a payment of $1.8 million in cash. As of December 31, 2002, we had cash and cash equivalents of $13.8 million and a working capital deficit of $18.3 million.
Cash provided by (used in) operating activities was $(5.0) million and $12.2 million for the nine months ended December 31, 2001 and December 31, 2002, respectively. The change from cash used in operations in the nine months ended December 31, 2001 to the cash provided by operations for the nine months ended December 31, 2002, was primarily attributable to the reduced operating expenses resulting from the cost control measures, such as personnel reductions and facility consolidations, that we implemented in August and October 2001, as well as increased revenue from our strategic products. The $(5.0) million of net cash used in operating activities during the nine months ended December 31, 2001 was primarily attributable to our $13.2 million net loss, a $1.9 million decrease in accounts payable, a $1.0 million decrease in amounts payable to Computer Associates and a $2.7 million decrease in other liabilities, which were partially offset by $7.5 million of non-cash expenses for depreciation and amortization and a $3.8 million decrease in accounts receivable. The $12.2 million of net cash provided by operating activities during the nine months ended December 31, 2002 was primarily attributable to our net income of $2.6 million, $5.0 million of non-cash expenses for depreciation and amortization, a $2.8 million
44
increase in deferred revenue due to increased maintenance renewals, a $1.6 million decrease in accounts receivable due to improved collection efforts, a $1.0 million increase in accounts payable, and a $0.9 million increase in amounts payable to Computer Associates, which was partially offset by a $2.2 million decrease in other assets.
Cash provided by (used in) operating activities was $19.3 million, $(0.7) million and $2.4 million for fiscal 2000, 2001 and 2002, respectively. The change from cash provided by operations in fiscal 2000 as compared with cash used in operations in fiscal 2001 was primarily due to a net loss in fiscal 2001 resulting from expansion of our operations primarily through the acquisition of SBT, as compared to a net income in fiscal 2000. In addition to net income (loss), our cash provided by (used in) operating activities is impacted by changes in our working capital and by non-cash charges. Our non-cash charges include amortization of intangible assets, including goodwill and other intangibles with indefinite useful lives prior to April 1, 2002, and acquired in-process research and development. The $19.3 million of cash provided by operating activities for fiscal 2000 was primarily attributable to our $6.2 million of net income and a $6.5 million increase in amounts payable to Computer Associates. The $(0.7) million of net cash used in operating activities for fiscal 2001 was primarily attributable to our $11.2 million net loss and a $4.0 million increase in accounts receivable which were substantially offset by $5.9 million of non-cash expenses for amortization, a $3.9 million increase in in-process research and development, a $2.5 million increase in amounts payable to Computer Associates and $2.8 million increase in deferred revenue.
Cash used in investing activities was $0.1 million and $2.1 million for the nine months ended December 31, 2001 and December 31, 2002, respectively, and $5.6 million, $37.1 million and $0.3 million for fiscal 2000, 2001 and 2002, respectively. The increase in cash used in investing activities in fiscal 2001 was attributable to the acquisitions of SBT and other businesses, and in the nine months ended December 31, 2002, to the acquisition of eWare and purchases of property and equipment.
Cash provided by (used in) financing activities was $0.0 million and $10.5 million for the nine months ended December 31, 2001 and December 31, 2002, respectively, and $(1.7) million, $26.8 million and $0.0 million for fiscal 2000, 2001, and 2002, respectively. Cash provided by financing activities in fiscal 2001 principally consisted of a promissory note payable to Computer Associates of $26.7 million to fund the acquisition of SBT. In the nine months ended December 31, 2002, we made scheduled and unscheduled principal payments of $10.5 million towards the note payable to Computer Associates.
Taxes. Historically, we have filed tax returns on a consolidated basis with Computer Associates. Therefore, we have not filed separate tax returns with the federal government or any state agencies as a stand-alone entity. A contribution agreement with Computer Associates allocates responsibility for certain tax matters while we are a subsidiary of Computer Associates for tax purposes. Prior to the closing of this offering, tax obligations to Computer Associates of $2.3 million as of December 31, 2002 will be included as part of a net settlement of an intercompany account we maintain with Computer Associates. Had the closing of the offering occurred on December 31, 2002, we would have settled the intercompany obligation to Computer Associates for $1.5 million. In addition, following the closing of this offering, we will file separate tax returns with the federal government and certain state agencies, and we may have to pay taxes in the future.
45
The tax authority in Canada recently completed an examination of the fiscal 1999 and 2000 tax filings of our subsidiary, ACCPAC Canada Inc. As a result of this examination the tax authorities have taken a tax position that is contrary to the tax position taken by us. We believe that the tax authority will accept our tax position. However, in the event we are unable to prevail, we will be subjected to additional tax liabilities which we estimate to be as high as $1.7 million.
Promissory Note. In July 2000, we borrowed $26.7 million from Computer Associates, evidenced by a promissory note to finance the acquisition of SBT. From July 2000 to March 31, 2001, no interest accrued on the note because the note had not been formalized. From April 1, 2001 to March 31, 2002, the interest rate on this note was 7.5% per annum. From April 1, 2002 until the note is fully paid the interest rate is 5.5% per annum. As of April 15, 2002, we began making quarterly payments of principal of $1.3 million plus any accrued interest. As of December 31, 2002, the principal outstanding balance under the note was $16.2 million, and we made payments totalling $5.3 million on the note in the fourth quarter of fiscal 2003. On November 13, 2002, the promissory note was amended to provide that we will pay Computer Associates the remaining amount payable as of the closing date of this offering, estimated to be approximately $10.9 million, over 16 years. The amendment will take effect upon the closing of this offering. Commencing the first day of the month after the expiration of 15 months following the closing of this offering, we will be obligated to repay principal and interest, at the 10-year treasury note rate plus 0.5%, quarterly. The rate will be reset April 1 of each year to the 10-year treasury note rate then in effect.
Line of Credit. In December 2001, we entered into a line of credit with Computer Associates to borrow up to $5.0 million in increments of $0.5 million at the interest rate at which Computer Associates borrows. To date we have not borrowed any money under this facility. This facility will terminate upon completion of this offering. We currently have no other borrowing facilities in place.
Intercompany Account. We have an intercompany account with Computer Associates that reflects our transactions with Computer Associates for royalties, license fees from customers, rent and related expenses payable under real estate leases, tax consequences under the contribution agreement, salary and benefit payments and other obligations. Upon the closing of this offering, the amount of the intercompany obligation will be reduced to reflect the amount Computer Associates has recorded as being owed to it. We will estimate the adjustment to the intercompany obligation to Computer Associates prior to the closing of the offering and remit a payment to Computer Associates for an amount equal to the estimated adjusted intercompany obligation. Differences between the estimated and actual intercompany obligation will be settled within 90 days of the closing of the offering. At December 31, 2002, we had recorded intercompany obligations to Computer Associates of approximately $8.7 million. However, had the closing of the offering occurred on December 31, 2002, we would have settled the intercompany obligation to Computer Associates for $1.5 million. Although no transactions with Computer Associates are presently contemplated, there may be intercompany transactions in the ordinary course of business which will be reflected in the intercompany account.
Lease Obligations. We lease certain of our facilities and equipment under non-cancelable operating lease agreements. As of December 31, 2002, we had total operating lease obligations of approximately $12.7 million due under these leases.
46
The following is a schedule by fiscal years of future non-cancelable minimum lease payments under operating leases, net of sublease income for the remaining three months of fiscal 2003 and each the fiscal years through 2007 and thereafter, as of December 31, 2002:
| Fiscal Year | Amount | ||
|---|---|---|---|
| | (In Thousands) | ||
| 2003 | $ | 745 | |
| 2004 | 2,299 | ||
| 2005 | 2,435 | ||
| 2006 | 2,369 | ||
| 2007 | 2,340 | ||
| Thereafter | 2,454 | ||
Operating Capital Requirements. We currently anticipate that the net proceeds from this offering, together with our current cash and cash equivalents, and cash from operations, will be sufficient for us to meet our anticipated cash needs for working capital and capital expenditures for at least the next 12 months. Although operating activities may provide cash in certain periods, our operating and investing activities may require additional cash to facilitate future growth. Consequently, we may be required to obtain additional equity or debt financing in the future. Factors that could affect our cash used or generated from operations and, as a result, our need to seek additional borrowings or capital include:
- •
- timing of customer orders;
- •
- deferrals of customer orders in anticipation of application enhancements or new applications;
- •
- costs related to acquisition of technologies or business;
- •
- timing of our development and release of new applications or enhancements to existing applications;
- •
- customer budget cycles and changes in these budget cycles; and
- •
- higher than expected returns or bad debt expense.
Please also see our risk factor entitled "Our quarterly revenue and operating results fluctuate significantly, and a decline in revenue or operating results may disappoint securities analysts or investors and may result in a decline in our stock price" under the heading titled "Risk Factors."
Recent Accounting Pronouncements
In June 2002, the FASB issued Statement of Financial Accounting Standards No. 146,Accounting for Costs Associated with Exit or Disposal Activities, effective for exit or disposal activities initiated after December 31, 2002. Under the new rules, a liability for a cost associated with an exit or disposal activity must only be recognized when the liability is incurred. Under previous guidance, liabilities for exit costs were recognized at the date of an entity's commitment to an exit plan. We do not expect the adoption of SFAS No. 146 to have a material impact on our consolidated financial statements.
In November 2002, the FASB issued Interpretation No. 45,Guarantor's Accounting and Disclosure Requirements for Guarantees, Including Indirect Guarantees of Indebtedness of Others. For
47
guarantees issued or modified after December 31, 2002, a liability shall be recognized for the fair value of the obligation undertaken in issuing the guarantee. We do not expect the adoption of FASB Interpretation No. 45, to have a material effect on our consolidated financial statements.
In December 2002, the FASB issued Statement of Financial Accounting Standards No. 148,Accounting for Stock-Based Compensation—Transition and Disclosure—an Amendment of FASB Statement No. 123. SFAS 148 amends SFAS 123,Accounting for Stock-Based Compensation, to provide alternative methods of transition for a voluntary change to the fair value based method of accounting for stock-based employee compensation. In addition, SFAS 148 amends the disclosure requirements of SFAS 123 to require prominent disclosures in both annual and interim financial statements about the method of accounting for stock-based employee compensation and the effect of the method used on reported results. SFAS No. 148 is effective for fiscal years ending after December 15, 2002. We do not expect the adoption of SFAS No. 148, to have a material effect on our consolidated financial statements.
In January 2003, the FASB issued Interpretation No. 46,Consolidation of Variable Interest Entities, an Interpretation of ARB No. 51. This Interpretation provides guidance for determining a primary beneficiary period. The effective date of Interpretation No. 46 is the first interim period beginning after June 15, 2003 for variable interest entities acquired before February 1, 2003 and immediately to variable interest entities created after January 31, 2003. We do not expect the adoption of FASB Interpretation No. 46 to have a material effect on our consolidated financial statements.
Quantitative and Qualitative Disclosures About Market Risk
For the nine months ended December 31, 2001 and December 31, 2002, revenue from international markets accounted for approximately 57% and 60%, respectively, of our total revenue. We do not engage in any hedging activities to guard against currency risk. We have not had any material exposure to factors such as changes in foreign currency exchange rates or weak economic conditions in the foreign markets that we serve. However, in future periods, we expect sales in international markets, including Canada, Ireland, Singapore and the U.K., to account for a significant portion of our revenue. As our sales in Singapore are primarily invoiced and collected in U.S. dollars, a strengthening of the U.S. dollar could cause our products to be less attractive in this market. Our cash and cash equivalents of $13.8 million as of December 31, 2002, which consisted primarily of demand deposits and money market funds held by large institutions in the United States and Canada and our short-term investments were invested in corporate debt and equity securities maturing in less than one year.
The indebtedness that we have to Computer Associates currently accrues interest at a fixed rate of 5.5% per annum. Due to the nature of our short-term investments and to the fixed rate of interest on our indebtedness, we do not expect our operating results or cash flows to be affected to any significant degree by the effect of a sudden change in market interest rates.
48
Overview
We are a global provider of end-to-end business management applications for small and midsize businesses, or SMBs. We believe that we offer the most comprehensive and functionally complete suite of business management applications specifically designed for these businesses. Our accounting applications are the foundation of our application suite. We complement these accounting applications with a number of other applications that address our customers' needs in the areas of customer relationship management, electronic commerce, human resource management, warehouse management and Internet-based business-to-business transaction exchange. We market all of these applications, some of which are licensed from technology partners, under the ACCPAC brand. By integrating our business management applications and making them accessible via the Internet, we offer an end-to-end business management solution to our SMB customers. We sell these business management applications through our network of more than 3,000 SMB-focused channel partners worldwide. We have been in business for over 20 years and have registered more than 140,000 SMB customers. We currently maintain relationships with customers in over 130 countries. In addition, we also offer accounting software for small office and home office, or SOHO, businesses.
Industry Background
Emergence of end-to-end business management applications
Businesses are increasingly challenged to raise employee productivity, increase the speed and accuracy of decision-making, and establish more efficient relationships with customers, suppliers and partners. Businesses rely on business management applications to meet these challenges. Increasingly, businesses are demanding that these applications be integrated with one another and that they be accessible via the Internet, or e-business enabled. International Data Corporation estimates that the market for e-business applications will grow at approximately three times the rate of the overall business applications market, from $4.4 billion in 2001 to $19.5 billion in 2006, which represents a compound annual growth rate of 34.4%. We believe our products address a substantial portion of this market.
The accounting application has emerged as the foundation for integrated business management applications because it is the central repository for all business transactions, financial data and other critical business information. All business transactions, from online sales to warehouse shipments, must flow through and be recorded by the accounting application. By integrating other business management applications with their accounting application, businesses can realize increased value. For example, a stand-alone customer relationship management application may only track basic customer information for a sales representative. However, when the customer relationship management application is integrated with the accounting application, the sales representative can also track detailed customer status and transactional information such as credit availability, customer-specific pricing and recent customer orders. The emergence of the accounting application as the foundation for integrated business management applications, coupled with the increasing demand for these applications to be e-business enabled, has resulted in the emergence of end-to-end business management applications.
49
Opportunities in the SMB market
To date, businesses that have sought to integrate and e-business enable their business management applications have had to purchase expensive software applications that require complex, costly and time-consuming custom programming. Accordingly, large enterprises with substantial financial and information technology resources were the first to adopt end-to-end business management applications. However, applications marketed to large enterprises generally cost too much, take too long to implement and are too difficult to maintain for most SMBs. Moreover, most business management applications targeted at the SMB market are stand-alone, non-integrated applications and are not e-business enabled. As a consequence, while Gartner Group estimates that there are more than 8.0 million of these businesses worldwide, we believe most are not benefiting from end-to-end business management applications.
The emergence of the Internet as a secure, low-cost platform for business transactions and the availability of affordable information technology infrastructure is driving an increasing demand for end-to-end business management applications in the SMB market. To meet the needs of the SMB market, we believe an end-to-end business management solution should provide the following:
- •
- a comprehensive suite of applications seamlessly integrated with the accounting system;
- •
- rapid, low-cost implementation;
- •
- flexible pricing, packaging and deployment options;
- •
- Internet and wireless device accessibility;
- •
- low-cost business-to-business electronic connectivity; and
- •
- local consulting and implementation support.
We believe a significant opportunity exists in the SMB market to provide a solution that meets these requirements. Further, we believe we are uniquely positioned to exploit this emerging market opportunity by virtue of our experienced reseller channel, our large installed base of SMB accounting customers and our comprehensive suite of SMB-focused, e-business enabled, and tightly integrated business management applications.
Our Solution
We are a global provider of end-to-end business management applications for SMBs. Our applications address critical business needs, including those in the areas of accounting, customer relationship management, electronic commerce, human resource management, warehouse management and Internet-based business-to-business transaction exchange. We believe that we offer the most comprehensive and functionally complete suite of business management applications designed for SMBs. By integrating and e-business enabling these applications, we offer an end-to-end business management solution.
We believe that our end-to-end business management solution addresses the requirements of the SMB market by offering the following benefits:
- •
- Increased functionality through comprehensive, integrated applications. The breadth and integrated design of our suite of applications enables our customers to realize more value than they would with non-integrated business management applications. For example,
50
- •
- Rapid, low-cost implementation. Our business management applications are designed to be implemented in a relatively short period of time, making them well suited for the SMB market's more limited financial and information technology resources. In addition, our applications are designed to integrate seamlessly with our core accounting applications. As a result, our customers can rapidly implement our suite of applications to realize advanced functionality without the significant time and costs typically associated with integrating a number of disparate software offerings.
- •
- Flexible pricing, packaging and deployment options. We offer our customers a wide variety of pricing, packaging and deployment options which allows them to license our applications based on their price sensitivities and deployment needs. These options include a variety of software editions, which vary based on features, price and the number of users or transactions. Our packaging options allow businesses to easily upgrade as they grow, without purchasing an entirely new application. In addition, our fully integrated business management applications may be deployed at a customer's site, on a hosted basis, or a combination of both.
- •
- Internet and wireless device accessibility. Most of our applications can be accessed via the Internet and wireless devices, including mobile telephones and personal digital assistants. As a result, our customers are able to more easily interact with their customers, suppliers, partners and employees, enabling better service and lower operational costs.
- •
- Low-cost business-to-business electronic commerce connectivity. We offer our customers the ability to electronically transmit and receive critical business documents, such as purchase orders, sales orders, invoices and shipping acknowledgements via the Internet. This allows our customers to use the Internet as a secure electronic data interchange transport at a much lower cost than traditionally associated with electronic data interchange transactions.
- •
- Local consulting and implementation support. Our existing network of over 3,000 geographically diverse SMB-focused channel partners, including value added resellers, certified consultants, accounting firms, third-party developers and application service providers, offers many advantages to our customers, many of whom lack the financial or information technology resources to implement applications on their own. Principally, these channel partners assist our customers with implementation and ongoing maintenance.
because our accounting application is integrated with our web store and warehouse management applications, a customer can deploy a web store that readily adapts to its existing business practices, such as customer-specific pricing, credit terms and shipping methods maintained within the accounting system.
Our Strategy
Our goal is to be the leading global provider of end-to-end business management applications for the SMB market. Key elements of our strategy are as follows:
- •
- Leverage and expand our large network of business partners. We have built and currently maintain relationships with more than 3,000 SMB-focused channel partners worldwide. We believe that our channel partner network has been successful in penetrating the SMB market by providing high-quality and cost-effective marketing, sales and service. Through our recruiting and channel development efforts, which include training, certification and
51
- •
- Leverage our large customer base. Over the past 20 years, we have registered more than 140,000 customers in the SMB market. We plan to leverage our large installed base to generate additional sales of our accounting and complementary business management applications.
- •
- Enhance existing products and develop new applications. We intend to continue to leverage our extensive technical expertise and market knowledge to enhance our existing products and develop new business applications designed to provide our customers with additional functionality and other benefits. We believe that this will increase our revenue opportunities and enhance our competitive position.
- •
- Expand our application hosting services. SMBs are increasingly using hosted applications as an alternative or complement to applications deployed on premises. Today, ACCPAC Online, our application hosting service, with data centers in North America, Europe and Africa, provides one or more of our business management applications to over 100 customer sites on a subscription-fee basis. We believe that expanding our ACCPAC Online hosting services will increase our opportunities to build recurring revenue.
- •
- Expand international operations. We currently maintain relationships with customers in over 130 countries. The flexibility of our accounting software architecture allows us to provide applications that are customized to the various international tax laws, accounting principles and languages needed by our customers. We believe that international markets will continue to represent a significant opportunity for sales of our accounting applications, as well as the sale of our complementary business management applications.
performance recognition programs, described more fully below, we intend to continue to leverage, expand and strengthen this network to further grow our revenue.
52
Products
We provide a broad range of accounting, business management and messaging applications to the SMB and SOHO markets. The following table outlines our strategic business management applications and their target markets:
| Product Name | Target Market | Function | Description | |||
|---|---|---|---|---|---|---|
ACCPAC Advantage Series | SMB | Financial and Operational Accounting | Modular accounting application that can be accessed via a web browser, a wireless device or a traditional desktop | |||
ACCPAC Pro Series | SMB | Financial and Operational Accounting | Modular accounting application that offers source code availability | |||
ACCPAC Pro Series Manufacturing | SMB | Manufacturing and Production Management | Flexible, expandable manufacturing management application | |||
ACCPAC Simply Accounting | SOHO | Financial and Operational Accounting | Bundled accounting application that can be easily installed and used by the end user | |||
ACCPAC eCRM | SMB | Web and Wireless Customer Relationship Management | Integrated sales force, marketing, customer support, and call center automation application accessible via a web browser or wireless device | |||
ACCPAC ePOS | SMB | Point of Sale Management | Internet-based point of sale application for high-volume, multi-site retail operations | |||
ACCPAC eTransact | SMB, SOHO | Point and Click Web Store Creation | Business-to-business and business-to-consumer web store application | |||
ACCPAC HR Series | SMB | Human Resource Management | Employee, benefits and compliance administration tracking and reporting application | |||
ACCPAC Warehouse Management System | SMB | Radio Frequency-Based Warehouse Management | Automated warehouse inventory-handling and resource management application | |||
ACCPAC Exchange | SMB | Internet-Based Business-to-Business Transaction Exchange | Internet-based electronic data interchange application, which also enables participation in Internet trading communities | |||
ACCPAC Messenger | SMB, SOHO | Centralized Message Management | Networked fax, voice and text-messaging application | |||
ACCPAC FAXserve | SMB | Network Faxing | Server-based fax application capable of sending and receiving over shared network hardware | |||
ACCPAC Advantage Series is a set of accounting modules accessible via a web browser, a wireless device or a desktop computer in a traditional client/server network environment.
53
Advantage Series is available in four editions, each of which offers one or more of the following accounting modules: system manager, general ledger, accounts payable, accounts receivable, inventory control, order entry, purchase orders, payroll (U.S. and Canadian), general ledger consolidations and intercompany transactions. We also provide functional enhancements to Advantage Series under the ACCPAC Options brand and, in conjunction with our development partners, provide vertical-market targeted applications that extend Advantage Series functionality for particular industries. Advantage Series supports Microsoft, Linux and Novell-based operating systems and Microsoft SQL Server, IBM DB2, Oracle and Pervasive's P.SQL 2000 databases. In addition, the architecture provides multiple integration points that embrace current and emerging industry standards, including COM, SOAP, .Net and J2EE.
ACCPAC Pro Series is a set of accounting modules designed to provide our channel partners and customers with access to source code, enabling them to modify and manipulate the application for diverse business needs. For example, a customer that is required to pay special regulatory taxes on the sale of its products can modify inventory control, accounts receivable and order entry modules to enable the collection and reporting of the information required to calculate the special tax. We offer two editions of Pro Series for the SMB market; both editions include one or more of eighteen fully integrated accounting modules. In addition to the base accounting modules, we provide functional enhancements to the Pro Series under the ACCPAC Options brand and, in conjunction with our development partners, provide vertical-market targeted applications that extend Pro Series functionality for particular industries. Pro Series supports Microsoft, Novell and Linux-based server operating systems and Microsoft FoxPro and Microsoft SQL Server databases.
ACCPAC Pro Series Manufacturing is a set of manufacturing modules designed to allow customers to customize and expand their systems as their businesses change, from simple desktop personalization and user-specific customization to extensive source code modification. ACCPAC Pro Series Manufacturing includes production modules, such as Production Entry, Work Orders and Shop Control. ACCPAC Pro Series Manufacturing is available in two editions.
ACCPAC Simply Accounting is our SOHO-focused set of accounting modules. Simply Accounting is available in two editions, Standard and Pro, each of which offers ease-of-use and a robust feature set, including international tax and multi-currency support. Simply Accounting Pro supports up to six concurrent users on the Windows operating system. We are currently working to integrate our ACCPAC eTransact application with Simply Accounting.
ACCPAC eCRM is a customer relationship management application designed to integrate a business' interactions with its customers, partners, and prospects across the enterprise by providing sales force automation, call center automation, marketing automation, customer and partner Internet self-service and integrated workflow. ACCPAC eCRM can be accessed via the Internet or wireless devices, which allows users to access and update the system at anytime, from anywhere their Internet or wireless service is available. For example, a remote field sales organization can access customers' past communications as well as vital information such as customer credit status, inventory availability, quote and order processing and transaction history. Available in three editions, ACCPAC eCRM integrates with our Advantage Series and Pro Series software.
ACCPAC ePOS is a comprehensive, Internet-based point of sale solution for fast-paced, high-volume, multi-site retail operations. ACCPAC ePOS offers full integration with ACCPAC Advantage Series and integrates with retail technologies, such as barcode scanners, real-time credit card processors, weigh scales and pole displays.
54
ACCPAC eTransact is a business-to-business and business-to-consumer web store creation and management system. Businesses use eTransact to generate a web store from their accounting data and rules located in the accounting system without custom programming. The web store can be quickly deployed on premises or as a hosted service at ACCPAC Online. In either case, the web store is fully integrated with our accounting applications. For example, the web store reflects the most current customer-specific pricing, taxation and payment terms maintained in the accounting system. In addition, transactions, such as web store orders and shipping acknowledgements, are automatically shared between the systems. ACCPAC eTransact integrates with both ACCPAC Advantage Series and ACCPAC Pro Series software.
ACCPAC HR Series is a human resource management solution that helps SMBs collect, manage, calculate and report employee data. By automating most aspects of the human resources process, including compliance with governmental regulations, such as COBRA administration and 401(k) management, HR Series streamlines human resource tasks and reduces manual input and paperwork. ACCPAC HR Series integrates with our Advantage Series software. We are currently working to integrate our HR application with Pro Series and expect this capability to be generally available in the spring of 2003.
ACCPAC Warehouse Management System is a solution for automating the warehouse inventory and handling process. ACCPAC Warehouse Management System is designed to scale to the varied demands of both small to midsize distribution centers and highly complex, high-volume shipping environments. With ACCPAC Warehouse Management System, customers can allocate resources within the warehouse so orders are accurately picked, packed and shipped. Our product provides the core functionality for fulfillment center and warehouse management operations, including radio frequency device support, order management, receiving, stocking, replenishment, picking, labor control, bar coding and warehouse task management. This product integrates with both ACCPAC Advantage Series and ACCPAC Pro Series software.
ACCPAC Exchange is an Internet-based business-to-business transaction exchange solution. It provides the electronic transaction processing efficiencies of electronic data interchange to SMBs at a reasonable cost. Through the use of the Internet as the medium for exchange of electronic data interchange transactions, we help businesses reduce the large costs associated with electronic data interchange services offered through traditional value-added networks. With ACCPAC Exchange, customers achieve connectivity services with other ACCPAC Exchange users as well as legacy electronic data interchange users on IBM, Sterling, General Electric and EDS value-added networks, without paying for access to each network. By subscribing to the ACCPAC Exchange network, customers can be both end points in a trading community and/or the center of their own trading community. ACCPAC Exchange integrates with both ACCPAC Advantage Series and ACCPAC Pro Series software.
ACCPAC Messenger is a messaging solution that allows multiple communication types to flow through a desktop computer or wireless device. Using shared hardware and a common voice mail and fax system, networked users can send, receive, save and recall voice, fax and text messages using a desktop computer, telephone or wireless device. ACCPAC Messenger supports Microsoft Outlook 2000 and 2002 (XP) and Windows Explorer.
ACCPAC FAXserve is an advanced network fax solution which enables users to send and receive faxes directly from their desktop computer, store faxes in electronic files and share fax hardware with other users on a network. FAXserve runs as a service under Windows NT/2000
55
server and as a native Netware Loadable Module under Novell NetWare and is designed to scale with the growth of a business. Inbound routing options automate the delivery of faxes without the need for manual fax delivery.
In addition to these strategic products, we also continue to sell and support legacy DOS-based products, including ACCPAC Plus, ACCPAC Vision Point and ACCPAC BPI Accounting. We believe that revenue from these products will continue to decrease due to decreased demand from prospective customers for these products, primarily because they are DOS-based. We also sell third-party products, including those designed to enhance our legacy products, although we are generally de-emphasizing low-margin third-party products as we increase our focus on our strategic products.
Technology
We believe that the strength of the architectures of our Advantage Series and Pro Series products provide the foundation for the functionality and utility of our entire suite of end-to-end business management applications.
The ACCPAC Advantage Series Architecture consists of three distinct layers: the user interface layer, the business logic layer and the database layer. The user interface layer and the database layers are separated from the business logic layer by common interfaces designed to easily support a variety of end-user devices or databases in a fashion that insulates the business logic from potentially intrusive modifications. The business logic layer consists of more than 600 business logic objects that enforce the rules and procedures within the accounting system, ensuring that transactions are processed the same way regardless of their method of entry. The following is a diagram depicting the advanced architecture of our Advantage Series product:
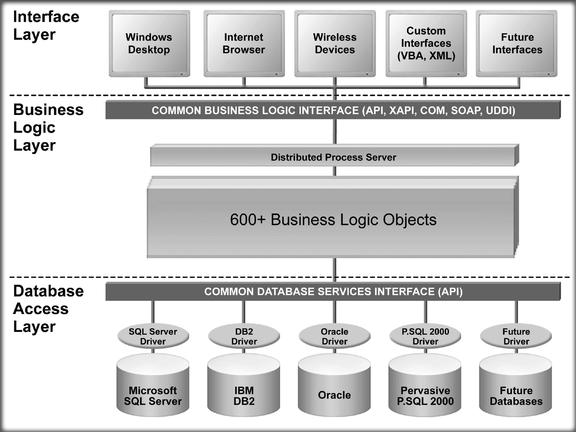
56
The architecture of ACCPAC Advantage Series offers the following benefits:
- •
- Rapid and Robust Integration of Additional Business Management Applications — Allows our customers to adopt and implement additional business management applications fully integrated with their accounting system with minimal disruption to their business activities and with minimal implementation costs. The architecture of ACCPAC Advantage Series allows us to use Internet standard technologies such as Extensible Markup Language (XML), Simple Object Access Protocol (SOAP) and Universal Description, Discovery and Integration (UDDI), as well as industry standard application integration technologies such as Microsoft Visual Basic for Applications (VBA), the use of Application Programming Interfaces (APIs) and a Component Object Model (COM).
- •
- Investment Protection — Allows us to adapt our applications to new and rapidly evolving technology paradigms while preserving our large investments in the business logic code base. As such, we can extend and enhance ACCPAC Advantage Series to integrate applications to offer web services, offer electronic business-to-business connectivity and readily deploy our offerings in hosted environments, among others, without rewriting the core business logic within our applications every time a new technology is introduced or computing platforms change.
- •
- Web and Wireless Accessible — Allows our customers to access our applications anywhere, anytime their Internet service is available through various end-user devices, including wireless devices, personal digital assistants and personal computers.
- •
- Open Deployment — Allows our customers a choice of a number of operating systems, such as Windows 2000, Linux and Novell, and a number of databases, such as Microsoft SQL, IBM DB2, Oracle and Pervasive P.SQL 2000, because our Advantage Series applications can be deployed in heterogeneous environments. Additionally, high transaction volume customers benefit from our distributed processing technology, known as our "Process Server." This module allows customers to transfer CPU intensive tasks such as the processing of large amounts of data from individual workstations to high performance servers.
- •
- Business Logic Componentization — Allows us to package and price our products with varying levels of functionality to attract SMBs with diverse product requirements and price sensitivities.
- •
- Business Logic Adaptability — Allows us to penetrate targeted international markets because we provide our customers with the tax law and language localization that they need without substantial alterations of our core business logic.
The ACCPAC Pro Series Open Architecture is designed to provide the flexibility to address the diverse needs of our customers. This is possible because the Pro Series source code may be licensed by the customer and because our Pro Series authorized resellers and certified consultants, who have, in most cases, worked with the Pro Series source code for years, can provide high-quality development services to our customers as they require them. The source code for Pro Series is based on an advanced object model designed to provide rapid modification with minimal
57
intrusion to the core business logic and designed to support multiple databases through a common database interface. The architecture of Pro Series includes the following benefits:
- •
- Rapid and Robust Integration of Additional Business Management Applications — Allows our customers to implement additional business management applications fully integrated to their Pro Series system with minimal disruptions to their core business activities.
- •
- Unrestricted Modification Capabilities — Allows customers to make any modifications to the manner in which Pro Series operates. For example, a customer who desires to change the method by which customer discounts are calculated may make this modification using standard development tools.
- •
- Investment Protection — Ensures our customers have control of their applications regardless of how their business changes.
Research and Development
Since our inception, we have made substantial investments in research and development. During our fiscal years ended March 31, 2000, 2001 and 2002, and the nine months ended December 31, 2002, respectively, research and development expenditures were approximately $5.7 million, $10.4 million, $10.3 million and $6.6 million, respectively. All of these expenditures were expensed as incurred. As of December 31, 2002, we had a total of 159 employees engaged in research and development, quality assurance and documentation on a full-time basis. We expect our research and development expense will increase as we continue to develop and enhance our products.
Customers
We sell our SMB business management solutions to a wide range of SMBs, including divisions of large enterprises, through our network of channel partners. We sell Simply Accounting to a wide range of SOHO businesses through retail channels. Since our inception, we have registered over 500,000 customers, and we currently maintain relationships with customers in over 130 countries. Approximately 360,000 of these are SOHO businesses and approximately 140,000 of these are SMBs. During the nine months ended December 31, 2002, sales in the United States, Canada, Singapore and other international markets accounted for 40%, 35%, 9% and 16% of our total sales, respectively, and no single customer represented 10% or more of our total sales. See Note 12 of our notes to consolidated financial statements included in this prospectus for further financial information about geographic areas.
Customer Case Studies
The following case studies illustrate the selection, implementation and use of our products by certain of our customers.
Metrohm-Peak, Inc.
Metrohm-Peak, Inc. is a distributor of ion chromatography instrumentation and provider of laboratory services. Created in April 2000, Metrohm-Peak is a partnership between Peak Analytical, Inc. in Houston, Texas and Metrohm, Ltd., based in Herisau, Switzerland. At its formation, the company's accounting system was unable to manage the requirements resulting from the merger. In addition, Metrohm-Peak had a sales force automation system that was not
58
integrated with its accounting system. Each department from sales and marketing to receivables and customer service kept its own information. With separate databases of information throughout the organization, employees were forced to perform tasks without working from consistent customer data. As a result, customer service and sales did not perform optimally, and analysis, reporting and forecasting were insufficient for the merged company's needs.
Metrohm-Peak selected ACCPAC Advantage Series integrated with ACCPAC eCRM to address its business management system needs. The multi-lingual and multi-currency capabilities of ACCPAC Advantage Series provided an accounting system that could manage the increased requirements resulting from the merger. In addition, the integration of the two products facilitates real-time transaction processing from within ACCPAC eCRM such as order entry, invoicing, item lookup, commissions and quoting. With this improved information flow, employees now have access through a web browser, from any location, to more accurate and complete sales and service histories. Metrohm-Peak has advised us that their sales cycle is now significantly shorter, sales productivity has begun to increase, service issues are resolved rapidly and access to timely, reliable sales reports and forecasts is less complicated. The implementation process for these solutions was less than a month, allowing the company to quickly take advantage of the benefits of these integrated products.
Plains Cotton Cooperative Association
Plains Cotton Cooperative Association, or PCCA, is one of the largest cotton marketing organizations in the world. PCCA markets nearly three million bales of cotton annually from its Lubbock, Texas headquarters. In order to reduce overhead costs, PCCA decided to replace its mainframe systems with client/server-based applications. Among the first applications targeted for this migration was accounting. PCCA needed a cost-effective accounting application that could provide centralized management of 165 separate general ledgers and that could be quickly implemented.
PCCA selected ACCPAC Pro Series to provide cost-effective accounting services to its geographically diverse locations, while, at the same time, preserving centralized management. In addition to offering a cost-effective solution, ACCPAC provided PCCA with the source code for its accounting application. PCCA programmers were able to easily create a different interface for each member, with the first 10 members using the accounting services within 30 days of installation.
Carlson Hospitality Worldwide
Carlson Hospitality Worldwide operates and franchises hotels worldwide and manages approximately 20 hotels under the Radisson name. Carlson regularly acquires Radisson properties with disparate accounting systems and, as a result, is faced with a wide variety of geographically dispersed and varied accounting systems. The lack of standardization constrained the quantity and quality of management information, making it difficult to generate reports and perform in-depth analysis. However, integration of all these diverse accounting systems would have been an inefficient and labor-intensive process.
Carlson decided to select a new accounting system for its company-managed hotels, but due to limited technical staff resources at each hotel site, managing installed software at each location was not viable. Also, Carlson did not want to commit a large amount of initial capital. In addition, Carlson needed an accounting system that could accommodate future expansion to new locations.
59
Carlson decided that outsourcing would be an attractive proposition to overcome their constraints, but when analyzing proposed solutions, Carlson found that many solutions either had no hosting experience or infrastructure, or only provided hosting through a third-party arrangement.
To date, Carlson has converted 14 managed hotels to ACCPAC Online, which provides Carlson the flexibility to implement software features as needed, without requiring technical staff to travel to remote locations, and avoids a large initial capital requirement. Also, each existing or future hotel location can upgrade its individual location when it is convenient and can integrate complementary products. Carlson found a distinct advantage to having one company as both their software and hosted services provider.
Sales and Marketing
SMB Sales. We license our SMB business management applications to end-users through our network of value added resellers globally, except in Eastern Europe where we utilize a distributor who resells the products to our value added resellers. In total, our SMB-focused channel includes more than 3,000 channel partners, including value added resellers, certified consultants, accounting firms, third-party developers and application service providers.
Because our channel partners often have significant influence over customer purchase decisions, we believe that having qualified and knowledgeable channel partners is critical to the success of selling and supporting our products. Our two main SMB-focused channel partner programs are the ACCPAC Certified Consultant Program, which certifies individuals to install and maintain our products, and the ACCPAC Solution Provider Program, which certifies entities to resell our products.
To become a certified consultant, an individual typically must complete an ACCPAC training program, pass a standardized exam and pay initial and recurring partnership fees. Certified consultants are not authorized to resell our products, but are typically employed by a solution provider to provide services such as software installation, implementation and maintenance.
To become a solution provider, an entity typically must employ one or more certified consultants, operate from a professional office and pay initial and recurring partnership fees. Solution providers are authorized to resell our products and may also be involved in any or all stages of the software sales and fulfillment process, including pre-sales consulting, sales, implementation, application installation, customization (where appropriate), end user training, technical support and on-going upgrades and services.
In addition to the Certified Consultant Program and the Solution Provider Program, we offer other SMB-focused channel partner programs. Some of these other programs include the ACCPAC Development Partner Program, which certifies entities to develop software products that complement our products and the ACCPAC Hosting Partner Program, which certifies entities to provide online access to ACCPAC products.
We invest considerable resources in the professional development of our business partners. We provide extensive training in the installation, implementation and maintenance of our products. We also offer our business partners technical support, presales consulting, monthly conference calls with senior trainers and technical support people and access to a private section of our website which contains a knowledge base of our products and technical discussion groups.
60
SMB Marketing. Our SMB marketing efforts are focused on increasing awareness and brand recognition for the ACCPAC family of products. We promote our products worldwide through a combination of advertisements in financial and technical publications, links from our channel partners and industry-focused websites, a public relations program and presentations at industry tradeshows. Our direct marketing efforts to our installed base include a combination of direct mail and telemarketing designed to create customer interest in upgrading their business management software, purchasing add-on modules and additional user seats and, where appropriate, migrating from our DOS-based products to our Windows, Linux and Novell-based products.
We also provide marketing support for our channel partners to enable them to successfully market and sell our products. We assist our partners with direct mail campaigns, telemarketing and advertising and engage in cooperative marketing efforts to support their local marketing efforts. In addition, we host an annual conference for our channel partners to provide them with information and training on our products.
SOHO Sales and Marketing. We sell our SOHO products through wholesale distributors that resell the products to retail channels. We also sell product upgrades and services directly to our customers. We actively market our SOHO products through cooperative advertising, in-store promotions with retailers and our existing base of more than 3,500 SOHO-focused channel partners.
Our two SOHO-focused channel partner programs are the ACCPAC Simply Accounting Certified Consultant Program and the ACCPAC Simply Accounting Solution Provider Program. SOHO-focused channel partners are certified to install and maintain our products. These channel partners are not presently authorized to resell our products, although we may provide this authorization in the future. To become either a Simply Accounting Certified Consultant or Simply Accounting Solution Provider, an individual must pay initial and recurring fees and must be in the business of providing accounting services to fee-paying clients. Additionally, Simply Accounting Certified Consultants must pass a standardized exam.
Maintenance and Support Services
Product maintenance and support services are an important component of our business management solution. Typically, we offer product maintenance to our customers pursuant to annual, renewable contracts that are priced as a percentage of product license fees. Customers under maintenance contracts receive technical product updates and upgrades, on a when and if available basis, during the term of the maintenance contracts and, in some cases, technical support. In addition, utilizing our staff of 99 business process and technical consultants, we provide our customers with professional services, training and product information that supplements the primary technical support offered to our customers by our partners. Also, our customer service professionals are available by telephone, over the Internet, or by e-mail to assist with customer support requests 24 hours a day, seven days a week.
Competition
We have experienced competition to date from both established and emerging software companies that offer similar products targeted at businesses within our markets. We also face
61
additional competition in individual countries from local competitors. We believe we currently compete favorably on the basis of:
- •
- the scope and integration of a broad range of products;
- •
- technology;
- •
- the ease of use, features, performance and price of our products;
- •
- the quality and size of our channel partner network;
- •
- the quality of our service and technical support for our customers and business partners; and
- •
- new product introductions.
We currently compete in the SMB market with Microsoft, The Sage Group, Softline and Epicor Software, among others. Other vendors who traditionally compete in the large enterprise market may offer products to the SMB market. These potential competitors include SAP, PeopleSoft, Lawson Software and J.D. Edwards. In the SOHO market, our primary competitors include Intuit and The Sage Group, among others.
Certain competitors may have greater financial, technical and marketing resources and name recognition than we do. Competitors may bundle their software with other software or enter into agreements with third parties to sell their software. In addition, we bundle software applications that we license from third parties and may lose the ability to maintain these licenses. Any of these actions may decrease the attractiveness of our products. In addition, competitors may lower their prices, which may force us to match price cuts and decrease our profitability. We may not be able to design new products or improve existing ones to maintain our competitive position in the industry. Increased competitive pressures from current and future competitors could harm our ability to sell our products. In addition, if one of our competitors is acquired by a well-capitalized company, we could face increased competition.
Intellectual Property
We rely on a combination of copyright, trademark and trade secret laws, a mandatory software registration mechanism for certain products, confidentiality and non-disclosure agreements with our employees, licensing arrangements with our customers, and limitations on access to and distribution of our proprietary information. We have no patents or material patent applications pending. We believe that because of the rapid pace of technological change in the computer software industry, trade secret and copyright protection are less significant than factors such as the knowledge, ability and experience of our employees, frequent product enhancements and the timeliness and quality of support services. It is our policy to file for protection of our primary trademarks and service marks in countries in which we sell our products either directly or through our international channel partners and in which protection is available and advisable. In many cases, we license our products under shrink wrap or click through licenses that are not signed by our licensees. These shrink wrap or click through licenses may be unenforceable under the laws of certain jurisdictions. In addition, the laws of certain countries in which our products are sold do not protect our intellectual property rights to the same extent as the laws of the United States. Despite the protective measures we undertake, we may not be able to fully protect our intellectual property.
62
Technology Partners
Our strategic products include customized business management applications that we license and then market under the ACCPAC brand. These applications have been customized to integrate with our accounting applications and include ACCPAC HR Series, ACCPAC Warehouse Management System and ACCPAC Exchange. These agreements generally have terms between three and five years and provide for automatic renewal unless we fail to meet minimum royalty obligations to the licensor when due and these agreements may be terminated by the licensor if we materially breach our obligations under these agreements. Further, we also bundle with our products software applications that we license from other parties such as Microsoft and Crystal Decisions.
Employees
We currently have approximately 582 full-time equivalent employees. Of such employees, 163 are based in the United States, 264 are based in Canada and 155 are based in other countries. None of our employees are represented by a labor union. We believe that our relations with our employees are good.
Legal Proceedings
There is no litigation presently pending that we believe could have, individually or in the aggregate, a material and adverse effect on our financial position or results of operation. However, from time to time we are subject to lawsuits and claims. We believe that the disposition of any of the claims currently pending will not materially and adversely affect our financial position or results of operations.
Facilities
Our principal executive, administrative, sales and marketing and operations facility is located in Pleasanton, California, where we lease approximately 29,357 square feet under a lease that expires in February 2009. We also lease 54,444 square feet of research and development, customer and technical support facilities located in Richmond, Canada, which leases expire in November 2007. We also lease facilities located in Sydney, Australia; Bangalore, India; Dublin, Ireland; Arnheim, the Netherlands; Singapore; Johannesburg, Cape Town and Durban, South Africa; Dubai, United Arab Emirates; and Middlesex, the United Kingdom. In addition, we lease facilities in Toronto, Canada and Slough, United Kingdom from Computer Associates. We believe that our current domestic and international facilities will be sufficient to meet our needs for at least the next twelve months and that, if required, suitable additional or alternative space will be available on commercially reasonable terms.
Seasonality
We experience seasonality in our business. In recent years, we have recognized a proportionately lower percentage of our revenue in the first quarter of our fiscal year.
63
Officers and Directors
The following table presents information about each of our officers and directors as of February 21, 2003:
| Name | Age | Position | ||
|---|---|---|---|---|
| David M. Hood | 37 | President, Chief Executive Officer and Chairman of the Board of Directors | ||
| Donnat Lettman | 42 | Executive Vice President, Chief Operating Officer and Director | ||
| Michael Hoberg | 50 | Senior Vice President, Chief Financial Officer | ||
| Garry Nishimura | 42 | Senior Vice President, Research and Development | ||
| Michael Bongiovanni | 41 | Senior Vice President, Sales | ||
| Susan Sheridan | 47 | Senior Vice President, Marketing | ||
| Sidney Braginsky(1)(2) | 65 | Director | ||
| William Rizzardi(1)(2) | 60 | Director | ||
| David Giddings(1)(2) | 59 | Director | ||
| Alfonse D'Amato | 65 | Director | ||
| Bruce Blakeman | 47 | Director |
- (1)
- Member of the Compensation Committee.
- (2)
- Member of the Audit Committee.
David M. Hood has served as our President and Chief Executive Officer since April 1999 and as a director since September 1999. Mr. Hood became the Chairman of our Board of Directors in November 2002. Mr. Hood joined Computer Associates in 1990, and from September 1998 to March 1999 he served as the Senior Vice President of Worldwide Channel Marketing at Computer Associates. From September 1996 to August 1998, Mr. Hood was Vice President of Industry Analyst Relations at Computer Associates. In addition, Mr. Hood was responsible for the development of several business growth areas, including the establishment of the Computer Associates offices in Puerto Rico, South Africa and Bahrain, and was also responsible for running distributor operations throughout Latin America, Africa, the Caribbean and the Middle East. Mr. Hood earned a B.S. in Management Advisory Services, majoring in both Accounting and Computer Information Systems, from Southern New Hampshire University.
Donnat Lettman has served as our Executive Vice President since November 1997 and our Chief Operating Officer and as a director since November 2002. From November 1997 to November 2002, Mr. Lettman served as our Chief Financial Officer. From April 1996 to November 1997, Mr. Lettman served as Treasurer for Infresco Corporation, a data integration software company and a wholly-owned subsidiary of Computer Associates. From April 1994 to March 1996, Mr. Lettman served as Assistant Vice President, Finance for Computer Associates. From April 1993 to March 1994, Mr. Lettman was Controller for Computer Associates Canada Limited, a wholly-owned Canadian subsidiary of Computer Associates. Mr. Lettman earned a B.S. in Business Administration and an M.B.A. in Finance from New York Institute of Technology.
Michael Hoberg has served as our Senior Vice President, Chief Financial Officer since November 2002. From August 2002 to November 2002, Mr. Hoberg served as a financial
64
consultant to Tvia, Inc., a multi-media display processor company, and as Chief Financial Officer of Tvia, Inc. from February 2000 to July 2002. From November 1998 to January 2000, Mr. Hoberg served as Chief Financial Officer of U.S. Cancer Care, Inc., a radiation oncology company. From July 1998 to November 1998, Mr. Hoberg served as Advisor to the Chief Executive Officer of Faroudja, Inc., a manufacturer of video enhancement products, and from December 1996 to June 1998, Mr. Hoberg served as Chief Financial Officer of Faroudja, Inc. Mr. Hoberg received a B.B.A. in Accounting from the University of Wisconsin at Madison and is a Certified Public Accountant.
Garry Nishimura has served as our Senior Vice President, Research and Development since October 2001. From October 2000 to October 2001, Mr. Nishimura served as our Vice President of Research and Development and, from July 1997 to October 2000, he served as our Assistant Vice President of Research and Development. From November 1989 to July 1997, Mr. Nishimura worked as Development Manager. From 1984 until November 1989, Mr. Nishimura was a programmer in our Research and Development Department. Mr. Nishimura earned a Bachelor of Commerce with a concentration in Computer Science from the University of British Columbia.
Michael Bongiovanni has served as our Senior Vice President, Sales since August 2001. From February 2001 to August 2001, Mr. Bongiovanni served as our Vice President of Sales. Mr. Bongiovanni co-founded Micro Strategies, Inc., a computer consulting firm, in 1983, where he served as Director, Business Applications from March 1997 to February 2001. He also founded Common Practice, Inc., a software development firm, in 1990. Mr. Bongiovanni earned a B.S. in Mechanical Engineering and Applied Mechanics from the University of Pennsylvania.
Susan Sheridan has served as our Senior Vice President, Marketing since September 2001. From July 2001 to September 2001, she served as our Vice President, Marketing, and from August 2000 to November 2000, she served as our Senior Vice President, Marketing. Ms. Sheridan joined us in July 2000 upon our acquisition of SBT where, from April 2000 to July 2000, she served as Executive Vice President, Marketing, from April 1999 to April 2000, she served as Senior Vice President, Marketing and, from February 1996 to April 1999, she served as Vice President, Marketing. Before she joined SBT, Ms. Sheridan worked as Marketing Director and in other product and channel- marketing positions for Autodesk, Inc., a software development company. Ms. Sheridan earned a B.A. in English from the University of Maryland.
Sidney Braginsky is Chairman of the Boards of Directors of ISO TC172 Optics and Electro Optic Devices, an optical device company, and Digilab, LLC, a medical equipment company owned by Mr. Braginsky. Additionally, since July 2000, Mr. Braginsky has served as President, Chief Executive Officer and Chairman of the Board of Atropos Technology, Inc., a technology consulting company. From 1994 to 2000, Mr. Braginsky was President of Olympus America, Inc., an international manufacturer of consumer products, cameras, tape recorders and medical equipment. Mr. Braginsky also serves on the board of directors of Noven Pharmaceuticals, Inc. and Frontline Capital Group. Mr. Braginsky earned a B.S. in Biology and Chemistry from Queens College.
William Rizzardi has served on our board of directors since July 2002. Since May 1999, Mr. Rizzardi has served as the Chief Information Officer of Twinlab Corporation, a vitamin, herbal supplement and sports nutrition company. From 1995 to 1999, Mr. Rizzardi served as President and Chief Operations Officer of Perlucid Corp., a biotechnology company, and simultaneously operated WDR Consulting LLC, a private consulting firm. From 1954 to 1994, Mr. Rizzardi was employed at Grumman Corporation, where he served as Vice President and
65
Chief Information Officer. Mr. Rizzardi earned a B.S. in Physics from City College of the City University of New York.
David Giddings has served on our board of directors since August 2002. Mr. Giddings currently serves as President and Chief Operating Officer of Digilab, LLC, a medical equipment company. Mr. Giddings is also a consultant to Diametrics Medical, Inc., a blood and tissue analysis systems provider. From 1996 until June 2002 Mr. Giddings served as the Chairman, President and Chief Executive Officer of Diametrics Medical. Prior to that, he held various managerial positions, including President and Chief Operating Officer, for Boehringer Mannheim Corporation, a biomedical research company. Mr. Giddings earned a B.A. in Liberal Arts from Middlebury College and an M.B.A. from Rider University.
The HonorableAlfonse D'Amato has served on our board of directors since November 2002. He has been Managing Director of Park Strategies LLC, a business consulting firm, since January 1999. Previously, he was a United States Senator from January 1981 until January 1999. During his tenure, he served as Chairman of the Senate Committee on Banking, Housing and Urban Affairs, and Chairman of the Commission on Security and Cooperation in Europe. Mr. D'Amato has served as a director of Computer Associates International, Inc. since 1999. Mr. D'Amato earned a B.S. from Syracuse University School of Business Administration and a J.D. from Syracuse Law School.
Bruce Blakeman has served on our board of directors since November 2002. He has been Commissioner of the Port Authority of New York & New Jersey since June 2001, and President of Madison Strategies, a strategic consulting firm servicing large financial services companies, since April 2000. Mr. Blakeman has also served as an Adjunct Associate Professor in the Department of Accounting and Business Law at Hofstra University since September 2002. From January 1996 to December 1999, Mr. Blakeman served as Legislator in the Nassau County Legislature, and as Chairman of the Budget Review Committee. He has also been a Partner in the law firm of Robert M. Blakeman & Associates from 1984 to present. Mr. Blakeman has served on the board of North Sea Insurance Company since 1989. Mr. Blakeman earned a B.S. in Political Science from Arizona State University and a J.D. from California Western School of Law.
Board Composition
We currently have seven directors. Each director serves for a one-year term.
Board Committees
Audit Committee. Our audit committee was formed in August 2002. Our audit committee will appoint the independent public accountants to audit our annual financial statements. The audit committee will review and approve the planned scope of the annual audit, discuss with the independent auditors their independence, review and pre-approve any non-audit services that may be rendered by our independent auditors, review and discuss the audited financial statements with the independent auditors and management, oversee internal audit functions and will recommend to the board of directors whether the audited financials should be included in the annual reports on Form 10-K we will be required to file with the Securities and Exchange Commission. Current members of our audit committee are Sidney Braginsky, David Giddings and William Rizzardi, all of whom are independent directors.
Compensation Committee. Our compensation committee reviews and recommends to the board of directors the compensation and benefits of all our officers and reviews general policy
66
relating to compensation and benefits of our employees. The compensation committee also administers the issuance of stock options and other awards under our stock plans. Current members of our compensation committee are Sidney Braginsky, David Giddings and William Rizzardi.
Compensation Committee Interlocks and Insider Participation
None of our executive officers serves as a member of the board of directors or compensation committee of any other entity that has one or more executive officers serving as a member of our board of directors or compensation committee. Prior to the formation of our compensation committee in August 2002, our board of directors as a whole made decisions relating to the compensation of our executive officers and Mr. Hood, our Chief Executive Officer, made recommendations to the board with respect to executive compensation.
Director Compensation
Each non-employee director receives $1,000 cash compensation and reimbursement for reasonable travel expenses for each meeting of the board of directors attended. Our board of directors has approved a policy whereby it will grant each non-employee director an option to purchase up to 10,000 shares of our stock annually pursuant to our 2002 Stock Incentive Plan.
Executive Compensation Policy
Our compensation committee determines the components of compensation that will be paid by us to our executive officers. These components include payments relating to salary, annual bonus, monthly incentive compensation and benefits. Base salaries for executive officers are designed to attract and retain superior, high-performing individuals. Each executive officer is eligible to receive an annual bonus, which is payable at the discretion of our board of directors based on the executive officer's performance during the year. Each executive officer is also eligible to receive monthly incentive compensation payments, which are based on the attainment of performance goals established by our compensation committee and approved by our board of directors. These performance goals are generally based on internally established targets for revenue and profitability for ACCPAC as a whole as well as each executive's individual performance. The calculation and payment of the incentive compensation payable to each executive officer other than our president is at the sole discretion of our president. Additionally, each executive officer is eligible to receive a travel allowance. The amount of each travel allowance is determined annually by the compensation committee and approved by our board of directors.
Limitation on Directors' and Officers' Liability
Our bylaws provide that we will indemnify our directors and executive officers and may indemnify our other officers, employees and other agents to the fullest extent permitted by Delaware law. We are also empowered to purchase insurance on behalf of any person we are required or permitted to indemnify. We intend to enter into indemnification agreements with each of our directors and executive officers.
We intend to obtain a director and officer insurance policy that is designed to provide for reimbursement or payments for losses arising from claims, including matters arising under the Securities Act, against covered directors and officers. In addition, our certificate of incorporation provides that, to the fullest extent permitted by Delaware law, our directors will not be liable for
67
monetary damages for breach of the directors' fiduciary duty of care to us and our stockholders. This provision in the certificate of incorporation does not eliminate the duty of care, and in appropriate circumstances, equitable remedies such as an injunction or other forms of non-monetary relief would remain available under Delaware law. Under current Delaware law, a director's liability to us or our stockholders may not be limited with respect to any breach of the director's duty of loyalty to us or our stockholders, for acts or omissions not in good faith or involving intentional misconduct, for knowing violations of law, for any transaction from which the director derived an improper personal benefit, for improper transactions between the director and us and for improper distributions to stockholders and loans to directors and officers. This provision also does not affect a director's responsibilities under any other laws such as the federal securities laws.
There is no pending litigation or proceeding involving any of our directors or officers as to which indemnification is being sought, nor are we aware of any pending or threatened litigation that may result in claims for indemnification by any director or officer.
Executive Compensation
The following table summarizes the compensation paid to or earned by our chief executive officer and the other four most highly compensated executive officers whose salary and bonus for services rendered in all capacities for the fiscal year ended March 31, 2002 exceeded $100,000.
| | | Annual Compensation | | ||||||||||||
|---|---|---|---|---|---|---|---|---|---|---|---|---|---|---|---|
| Name and Principal Position | Fiscal Year | Salary | Bonus(1) | Other Annual Compensation | All Other Compensation | ||||||||||
| David M. Hood | 2002 | $ | 150,000 | $ | 278,257 | (4) | $ | 10,125 | (10) | ||||||
| President, Chief Executive Officer and Chairman of the Board of Directors | |||||||||||||||
| Donnat Lettman(2) | 2002 | $ | 140,000 | $ | 215,021 | (5) | $ | 9,450 | (11) | ||||||
| Executive Vice President, Chief Operating Officer and Director | |||||||||||||||
| Garry Nishimura(3) | 2002 | $ | 82,214 | $ | 28,885 | (6) | $ | 4,720 | (12) | ||||||
| Senior Vice President, Research and Development | |||||||||||||||
| Michael Bongiovanni | 2002 | $ | 150,000 | $ | 71,759 | (7) | $919 | (9) | $ | 531 | (13) | ||||
| Senior Vice President, Sales | |||||||||||||||
| Susan Sheridan | 2002 | $ | 90,945 | $ | 84,621 | (8) | $ | 7,136 | (14) | ||||||
| Senior Vice President, Marketing | |||||||||||||||
- (1)
- Includes annual bonus and incentive compensation payments. Each named executive officer is eligible to receive an annual bonus, which is payable at the discretion of our board of directors based on the named executive officer's performance during the year. Each named executive officer is also eligible to receive incentive compensation payments, which are based on the attainment of performance goals established by our compensation committee and
68
approved by our board of directors. These performance goals are generally based on internally established targets for revenue and profitability for ACCPAC as a whole as well as each named executive officer's individual performance.
- (2)
- Mr. Lettman served as our Executive Vice President and Chief Financial Officer in fiscal 2002. In November 2002 Mr. Lettman became our Executive Vice President and Chief Operating Officer, and Michael Hoberg joined the company as our Chief Financial Officer.
- (3)
- The calculation of Mr. Nishimura's compensation was converted at the April 1, 2002 rate of 0.6252 Canadian dollar per U.S. dollar. Source: Bank of Canada.
- (4)
- Represents $166,257 in incentive compensation payments, $100,000 in annual bonus payments and a $12,000 travel allowance.
- (5)
- Represents $133,021 in incentive compensation payments, $70,000 in annual bonus payments and a $12,000 travel allowance.
- (6)
- Represents $16,068 in incentive compensation payments, $6,252 in annual bonus payments and a $6,565 travel allowance.
- (7)
- Represents $47,759 in incentive compensation, $15,000 in annual bonus payments and a $9,000 travel allowance.
- (8)
- Represents $61,930 in incentive compensation, $15,000 in annual bonus payments and a $7,691 travel allowance.
- (9)
- Represents a $919 reimbursement for taxable relocation expenses.
- (10)
- Represents $3,750 in matching contributions and $6,375 in discretionary contributions we made to a 401(k) savings plan.
- (11)
- Represents $3,500 in matching contributions and $5,950 in discretionary contributions we made to a 401(k) savings plan.
- (12)
- Represents $1,184 in matching contributions and $3,536 in discretionary contributions we made to a Canadian deferred profit sharing plan.
- (13)
- Represents $531 in discretionary contributions we made to a 401(k) savings plan.
- (14)
- Represents $1,823 in matching contributions and $5,313 in discretionary contributions we made to a 401(k) savings plan.
None of the executive officers named in the above table received stock option grants during the fiscal year ended March 31, 2002. To date, in the fiscal year ending March 31, 2003, we have granted our officers, employees and directors options to purchase an aggregate of 1,506,600 shares of our common stock, including options to our named executive officers to purchase an aggregate of 850,000 shares of common stock.
Option Values at March 31, 2002
None of the executive officers named in the above table exercised options during the fiscal year ended March 31, 2002. The following table presents the number and value of securities underlying unexercised options held by the executive officers named in the table above as of March 31, 2002. Amounts shown under the column "Value of Unexercised In-the-Money Options
69
at March 31, 2002" are based on the assumed initial public offering price of $ per share, less the applicable exercise price per share without taking into account any taxes that may be payable in connection with the transaction, multiplied by the number of shares underlying the option. We have assumed the fair market value of our common stock as of March 31, 2002 was equal to the assumed initial public offering price solely for the purpose of this table.
| | Number of Securities Underlying Unexercised Options at March 31, 2002 | Value of Unexercised In-the-Money Options at March 31, 2002 | ||||||
|---|---|---|---|---|---|---|---|---|
| Name | ||||||||
| Exercisable | Unexercisable | Exercisable | Unexercisable | |||||
| David M. Hood | 35,000 | 90,000 | ||||||
| Donnat Lettman | 90,000 | 92,500 | ||||||
| Garry Nishimura | 41,000 | 39,000 | ||||||
| Michael Bongiovanni | — | — | — | — | ||||
| Susan Sheridan | — | — | — | — | ||||
Option Values at March 31, 2002 for Computer Associates' Stock
The following table presents the number and value of securities underlying unexercised options held as of March 31, 2002 to purchase shares of Computer Associates' common stock held by the executive officers named in the table above. Amounts shown under the column "Value of Unexercised In-the-Money Options at March 31, 2002" are based on the fair market value of Computer Associates' common stock of $21.89 as reported on the New York Stock Exchange on March 28, 2002, the last trading date before March 31, 2002, less the applicable exercise price per share, without taking into account any taxes that may be payable in connection with the transaction, multiplied by the number of shares underlying the option.
| | Number of Securities Underlying Unexercised Options at March 31, 2002 | Value of Unexercised In-the-Money Options at March 31, 2002 | |||||||
|---|---|---|---|---|---|---|---|---|---|
| Name | |||||||||
| Exercisable | Unexercisable | Exercisable | Unexercisable | ||||||
| David M. Hood | 2,195 | 193 | $ | 2,156 | — | ||||
| Donnat Lettman | 5,605 | 315 | $ | 35,531 | — | ||||
| Garry Nishimura | 4,965 | 225 | $ | 31,338 | — | ||||
| Michael Bongiovanni | — | — | — | — | |||||
| Susan Sheridan | — | — | — | — | |||||
Employee Stock Plans
1998 Stock Incentive Plan
Our board of directors and our stockholders approved our 1998 Stock Incentive Plan, or the 1998 Plan, in January 1998. All employees are eligible to receive awards under the 1998 Plan. The 1998 Plan provides for the granting of stock options and stock appreciation rights. The 1998 Plan will terminate in 2008 unless the board terminates it sooner.
The board authorized and reserved an aggregate of 2,690,500 shares of ACCPAC common stock for issuance under the 1998 Plan. If the recipient of a stock award does not purchase the shares under the stock award before the stock award expires or otherwise terminates, the shares that are not purchased again become available for issuance under the 1998 Plan. The 1998 Plan
70
provides for the grant of incentive stock options to employees and nonstatutory stock options to employees and consultants of ACCPAC and its subsidiaries. The 1998 Plan provides that it will be administered by the board, or a committee appointed by the board, which determines recipients and types of options to be granted, including number of shares under the option and the exercisability of the shares.
As of December 31, 2002, options to purchase (a) 2,641,500 shares of our common stock at a weighted average exercise price of $7.32 per share were outstanding under the 1998 Plan and (b) 500 shares had been exercised.
2002 Stock Incentive Plan
Our board of directors and our stockholders approved our 2002 Stock Incentive Plan, or 2002 Plan, in August 2002. The 2002 Plan will terminate in 2012 unless the board terminates it sooner.
The board authorized and reserved an aggregate of 2,309,500 shares of ACCPAC common stock for issuance under the 2002 Plan. If the recipient of a stock award does not purchase the shares under the stock award before the stock award expires or otherwise terminates, the shares that are not purchased again become available for issuance under the 2002 Plan. The 2002 Plan provides for the grant of incentive stock options to employees and nonstatutory stock options to employees, directors and consultants of ACCPAC and its subsidiaries. The 2002 Plan provides that it will be administered by the board, or a committee appointed by the board, which determines recipients and types of options to be granted, including number of shares under the option and the exercisability of the shares.
As of December 31, 2002, options to purchase 243,500 shares of our common stock at a weighted average exercise price of $9.00 per share were outstanding under the 2002 Plan and no shares had been exercised.
2002 Employee Stock Purchase Plan
Our 2002 Employee Stock Purchase Plan, or 2002 ESPP, is designed to replace Computer Associates' Year 2000 Employee Stock Purchase Plan. Our 2002 ESPP was approved by our board of directors and our stockholders in August 2002, and will take effect subsequent to the completion of the offering. The plan provides eligible employees with the opportunity to acquire an ownership interest in us through a payroll-deduction based plan designed to qualify under Section 423 of the Internal Revenue Code. The 2002 ESPP will terminate the earlier of June 30, 2009, or the date all shares authorized for issuance under the plan have been sold.
Administration. Administration of the 2002 ESPP is delegated to a committee of the board of directors which has full and final authority to administer and interpret the plan.
Shares Reserved for Issuance. Our board of directors has reserved 1,000,000 shares of ACCPAC common stock for issuance under the 2002 ESPP. If a participant does not exercise the purchase right for the shares before expiration of the purchase right, the shares that are not purchased again become available for issuance under the plan.
Eligibility. Any employee who is not a 5% owner of our outstanding stock and who is regularly scheduled to work at least 20 hours per week and five months per calendar year is eligible to participate.
71
Participation. The 2002 ESPP permits participants to purchase common stock through payroll deductions of up to 25% of their eligible compensation, which includes only a participant's base salary, unless the committee determines that the maximum payroll deduction for that offer period will be less than 25%. Participants are granted separate purchase rights for each offer period, the duration of which is determined by the committee but will not exceed 24 months. There are multiple purchase intervals within each offer period and amounts are deducted and accumulated for the participant and are used to purchase shares of our common stock at the end of each purchase interval. The price is 85% of the lower of the fair market value of our common stock at the beginning of an offer period or on the last day of a purchase interval. Participants may end their participation at any time during an offering period, and will be paid their payroll deductions to date. Participation ends after termination of employment with us.
Computer Associates' Year 2000 Employee Stock Purchase Plan
Computer Associates maintains an employee stock purchase plan for the benefit of its employees and the employees of its subsidiaries. Computer Associates' Year 2000 Employee Stock Purchase Plan permits participants to purchase common stock through payroll deductions of up to 25% of their eligible compensation, which includes only a participant's base salary. A participant may purchase a maximum of 5,000 shares during the six-month purchase period. Purchase periods begin on January 1 and July 1 of each calendar year. Amounts deducted and accumulated by the participant are used to purchase shares of Computer Associates' common stock at the end of each six-month purchase period. The price is 85% of the lower of the fair market value of Computer Associates' common stock at the beginning of an offer period or on the last day of an offer period. Participants may not withdraw, revoke or change their payroll deduction until the following offer period. Participation ends after termination of employment with us. Our employees' participation in the Computer Associates' Year 2000 Employee Stock Purchase Plan will end at the close of the purchase period in which the closing of this offering occurs.
Other Computer Associates Plans
Computer Associates maintains a 401(k) plan for the benefit of its employees and the employees of its subsidiaries that is intended to be a qualified plan under the Internal Revenue Code. The 401(k) plan provides that each participant may contribute up to a statutory limit, which is $12,000 in calendar year 2003. Computer Associates makes matching and discretionary contributions for participants in the 401(k) plan. These matching and discretionary contributions are allocated to us via an intercompany charge. The 401(k) plan is administered by a committee of officers and employees of Computer Associates appointed by Computer Associates' board of directors. Computer Associates also maintains a registered retirement savings plan and a deferred profit sharing plan for the benefit of its and its subsidiaries' Canadian employees, including our Canadian employees. Following the closing of this offering, we intend to implement our own employee savings plans, similar to Computer Associates' plans, at which time our employees will no longer participate in the Computer Associates' plans.
72
Transactions with Computer Associates
The predecessors to our current products were acquired by Computer Associates, a leading enterprise software company, as part of a series of unrelated business acquisitions between 1985 and 2000. We became an independent business unit of Computer Associates in April 1996, were incorporated in Delaware in October 1997, and became a subsidiary of Computer Associates effective January 1998. Computer Associates owns 10,500,000 shares of our common stock, which, immediately after this offering, will represent approximately % of our outstanding common stock, or % if the underwriters' over-allotment option is exercised in full. After this offering, as the owner of such shares, Computer Associates will have the ability to elect all of our directors and will therefore be in a position to control all matters affecting us. Computer Associates is not subject to any contractual obligation to retain any of our common stock, except that Computer Associates has agreed not to, directly or indirectly, offer, sell, offer to sell, contract to sell or otherwise dispose of any shares of our common stock for a period of 180 days after the date of this prospectus without the prior written consent of RBC Dain Rauscher Inc.
The following is a summary of certain agreements we have with Computer Associates.
Contribution Agreement
In January 1998, we entered into a contribution agreement with Computer Associates pursuant to which Computer Associates contributed to us all of the assets of our business owned by Computer Associates in exchange for 10,500,000 shares of our common stock and a $5.0 million promissory note, which has since been repaid in full. Under the contribution agreement, we assumed all of the liabilities and obligations relating to these assets without limitation. We also granted Computer Associates a worldwide, perpetual, fully-paid license for the internal use by Computer Associates and its subsidiaries of all of our then-existing and future software products. Computer Associates reimburses us for any royalties that we are required to pay to a third party as a result of Computer Associates' use of such software. Except as expressly set forth in the agreement, neither party made any representation or warranty as to the contributed assets, business or assumed liabilities. The contribution agreement expressly provides that Computer Associates contributed the assets to us on an "as is," "where is" basis. We agreed to indemnify Computer Associates from any and all costs or liabilities arising from our breach of the contribution agreement and the assets contributed by Computer Associates. Computer Associates agreed to indemnify us from any and all costs or liabilities arising from any breach by Computer Associates of the contribution agreement.
We entered into agreements with Computer Associates and two of its subsidiaries, CA Management, Inc. and Computer Associates Think, Inc., in order to clarify the trademarks and copyrights assigned under the contribution agreement.
Under the contribution agreement, we must make payments to Computer Associates in an amount equal to 37.5% of our and our subsidiaries' income (before income taxes), in order to compensate Computer Associates for our share of any consolidated or combined taxes. For our fiscal year ended March 31, 1998, we incurred an income tax expense of approximately $2.5 million. Pursuant to the contribution agreement, any amount owed to Computer Associates for income taxes for fiscal 1998 was included in the $5.0 million principal amount of the promissory note, which was repaid in full in November 1999. In fiscal 1999 and fiscal 2000 and the
73
nine months ended December 31, 2002, we incurred income tax expense of approximately $1.8 million, $4.3 million and $2.3 million, respectively, and in fiscal 2001 and fiscal 2002 we had a tax benefit of approximately $3.0 million and $1.4 million, respectively. Upon the closing of this offering the tax sharing arrangement with Computer Associates will be terminated, and tax obligations arising from the contribution agreement will be determined. We anticipate that we will owe Computer Associates approximately $2.3 million, which will be included as part of the $1.5 million net settlement described in "Certain Transactions—Intercompany Account."
Asset Assignment Agreements
Computer Associates, or its subsidiaries, acquired and then assigned to us their right, title and interest in a number of our assets. All consideration for Computer Associates' purchase of the assets listed in the table below were funded by ACCPAC. Under the assignment and assumption agreements, we assumed all liabilities and obligations of Computer Associates under its acquisition agreements with the third parties referenced in the table below and we granted Computer Associates and its subsidiaries a worldwide, perpetual, non-exclusive, royalty free license, for non-commercial, internal use of the intellectual property assigned under the applicable agreement.
| Date of Assignment | Third Party | Total Consideration | ||
|---|---|---|---|---|
| August 1999 | Conamex International, Inc. | CDN $0.3 million | ||
| February 2000 | ACCPAC On-Line Inc. | CDN $0.2 million | ||
| July 2000 | L.A. Technology (Pty) Ltd. and Jeremy Waterman | $2.6 million | ||
| July 2000 | Software Business Technologies, Inc. | $31.7 million | ||
| January 2001 | Softline Systems, Inc. | CDN $4.5 million | ||
| August 2001 | Smart Business Systems Pty Ltd, Cathryn Louise Holz and David Holden | $0.9 million |
All consideration for Computer Associates' purchase of SBT's assets under the June 8, 2000 asset purchase agreement was funded by ACCPAC pursuant to a $26.7 million promissory note. Under the terms of this note, we make quarterly payments of approximately $1.3 million, consisting of principal and payments of interest at the rate of 5.5% per annum. On November 13, 2002, the promissory note was amended to provide that we will pay Computer Associates the remaining amount payable as of the closing date of this offering, estimated to be approximately $10.9 million, over 16 years. The amendment will take effect upon the closing of this offering. Commencing the first day of the month after the expiration of 15 months following the closing of this offering, we will be obligated to repay principal and interest, at the 10-year treasury note rate plus 0.5%, quarterly. The rate will be reset April 1 of each year to the 10-year treasury note rate then in effect.
In February 2002, we entered into a transfer and assignment agreement with Computer Associates in which Computer Associates transferred and assigned to us its 51% equity interest in Simplysoft Technologies Private Limited that it acquired in May 2000 under a joint venture agreement with Pentasoft Technologies Limited. We paid Computer Associates $79,000 for Computer Associates' equity interest in the joint venture and agreed to perform all of Computer Associates' obligations under the joint venture agreement. We also agreed to indemnify Computer Associates if we fail to comply with the joint venture agreement.
74
Intercompany Account
We have an intercompany account with Computer Associates that reflects our transactions with Computer Associates for royalties, license fees from customers, rent and related expenses payable under real estate leases, tax consequences under the contribution agreement and other obligations. From time to time, certain employees of Computer Associates provide service to us and the actual cost of their salaries and benefits are charged through the intercompany account. In addition, our employees participate in Computer Associates' benefit plans, such as a 401(k) plan. The actual costs of such benefits are also charged through the intercompany account. Upon the closing of this offering, the amount of the intercompany obligation will be reduced to reflect the amount Computer Associates has recorded as being owed to it. We will estimate the adjustment to the intercompany obligation to Computer Associates prior to the closing of the offering and remit a payment to Computer Associates for an amount equal to the estimated adjusted intercompany obligation. Differences between the estimated and actual intercompany obligation will be settled within 90 days of the closing of the offering. At December 31, 2002, we had recorded intercompany obligations to Computer Associates of approximately $8.7 million. However, had the closing of the offering occurred on December 31, 2002, we would have settled the intercompany obligation to Computer Associates for $1.5 million. On November 13, 2002, Computer Associates agreed to forgive a portion of its intercompany advances, which include the settlement of the tax sharing arrangement, to the Company in the event the Company completes an initial public offering. Although no additional transactions with Computer Associates are presently contemplated, there may be intercompany transactions in the ordinary course of business which will be reflected in the intercompany account.
Real Estate Agreement
In April 1998, we entered into a real estate agreement with Computer Associates under which we lease premises from Computer Associates. Under the real estate agreement we lease our Toronto and United Kingdom facilities. Our approximate annual obligations under each is as follows:
- •
- Toronto facility, $35,000; and
- •
- United Kingdom facility, $84,000.
The Toronto lease and the United Kingdom facility license will continue upon the closing of this offering. The term of the Toronto lease runs through September 2005. The United Kingdom facility lease does not have a termination date, but both the Toronto lease and the United Kingdom facility lease may be terminated at any time by either party upon six months' prior notice.
In February 2001, a subsidiary of Computer Associates assigned us its lease for our Richmond, British Columbia facility. Our approximate annual obligation for this property is $896,000. The term of this lease runs through November 2007.
75
Certificate of Incorporation
Our certificate of incorporation includes provisions designed to address our relationship with Computer Associates. Among other things, these provisions provide that:
- •
- Computer Associates and its officers and directors will not be liable to us or our stockholders for breach of any fiduciary duty by reason of any activities of Computer Associates in competition with us;
- •
- Computer Associates will have no duty to communicate or offer corporate opportunities to us and will not be liable for breach of any fiduciary duty as a stockholder by reason of the fact that Computer Associates pursues or acquires a corporate opportunity for itself, directs a corporate opportunity to another person, or does not communicate information regarding a corporate opportunity to us; and
- •
- business opportunities that may be suitable for both us and Computer Associates will be allocated between the parties based on principles set forth in our certificate of incorporation.
As a result of Computer Associates' majority ownership of our common stock and the provisions of our certificate of incorporation, Computer Associates may take opportunities for itself or may require us to take actions which may not be in the best interests of our other stockholders. See "Description of Capital Stock — Corporate Opportunities" for additional information on the allocation of corporate opportunities between Computer Associates and ACCPAC.
Price Book License Agreement
In September 2002, Computer Associates granted us a perpetual, royalty-free license to use certain software and associated documentation and training materials for our internal use and to use certain products in support of our hosted environments, including ACCPAC Online, which enable our customers to access and process data using our applications. In the event that Computer Associates is required to pay royalties to any third party as a result of our use of the license, we are required to reimburse Computer Associates. Title and ownership of the licensed programs is held by Computer Associates. As of December 31, 2002, we had not been required to make any payments to Computer Associates under the Price Book License Agreement.
Product Transfer Agreement
In January 2000, we entered into a product transfer agreement with Computer Associates pursuant to which Computer Associates assigned to us all right, title and interest in a number of assets, including our FAXserve, BitWare and BitFax products. Pursuant to this agreement, we granted Computer Associates and its subsidiaries a fully-paid, perpetual, worldwide license for internal use of the assets assigned under the agreement and a further license to enable Computer Associates to honor any agreements with respect to the assigned assets.
BitWare Distribution Agreements
We have oral agreements with subsidiaries of Computer Associates in Taiwan and Japan. Under these agreements, these Computer Associates subsidiaries sell our BitWare product to local distributors in these countries and collect royalties from them on our behalf. We do not
76
compensate these subsidiaries for acting on our behalf. These agreements will continue after the closing of this offering. In the future, we may have to compensate these subsidiaries of Computer Associates for their services rendered under these agreements.
EZ Armor Distribution Agreement
We have an agreement with Computer Associates, which entitles us to distribute their EZ Armor software product in exchange for payment of royalties to Computer Associates. As of December 31, 2002, we had not sold any products under this agreement. This agreement will continue following the closing of the offering.
Revolving Credit Agreement and Promissory Note
In December 2001, we entered into an agreement with Computer Associates whereby Computer Associates agreed to provide us up to $5,000,000 in revolving credit until December 31, 2003, payable on demand together with all accrued and unpaid interest. Each borrowing under the facility must be for at least $500,000, and bears interest based on the rates payable by Computer Associates under a credit agreement among Computer Associates, the banks that are party thereto and Credit Suisse First Boston. Interest on amounts borrowed under the facility is payable quarterly. As of December 31, 2002, there was no outstanding balance on this line of credit. This facility terminates upon the closing of this offering. We currently have no other borrowing facilities in place.
Agreements with Directors and Officers
Digilab Agreement
In January 2003 we entered into a two-year agreement with Digilab, LLC, of which Sidney Braginsky, one of our directors, is Chairman of the Board of Directors and a stockholder and David Giddings, one of our directors, is the President and Chief Operating Officer. Under the agreement, we will provide hosted applications and professional services to Digilab. The agreement provides that Digilab will pay us an initial setup fee of $18,000 for access to hosted applications, and will pay us a monthly subscription fee of $13,336. We estimate that Digilab will also pay us a total of $108,600 for implementation, training and other professional services over the term of the agreement.
Indemnification Agreements
We have indemnification agreements with each of our directors and officers for the indemnification of these persons to the fullest extent permitted by law. We also intend to execute these agreements with our future directors and officers. We have obtained directors and officers liability insurance to cover obligations under these agreements to the extent permitted by law.
77
PRINCIPAL AND SELLING STOCKHOLDERS
The following table presents information regarding the beneficial ownership of our common stock as of February 21, 2003, and as adjusted to reflect the sale of common stock in this offering, by:
- •
- each person known by us to be the beneficial owner of more than 5% of our common stock;
- •
- each director;
- •
- each of the individuals listed in the "Summary Compensation Table" above;
- •
- all executive officers and directors as a group; and
- •
- the selling stockholder.
Beneficial ownership is determined in accordance with the rules of the Securities and Exchange Commission and generally includes voting or investment power with respect to securities where applicable. Shares of common stock subject to options that are presently exercisable or exercisable within 60 days of February 21, 2003 are deemed to be beneficially owned by the person holding these options for the purpose of computing the percentage ownership of the person but are not treated as outstanding for the purpose of computing the percentage ownership of any other person.
The ownership percentages set forth in the table are based on 11,717,944 shares of common stock outstanding as of February 21, 2003 and shares upon the closing of this offering. Except as otherwise noted, the persons or entities named in the table have sole voting and investment power with respect to all the shares of common stock beneficially owned by them, subject to community property laws where applicable. Except as otherwise noted, the address for each listed director and officer is ACCPAC International, Inc., 6700 Koll Center Parkway, Pleasanton, CA 94566. The address of Computer Associates is One Computer Associates Plaza, Islandia, New York 11749.
| | Beneficial Ownership Prior to Offering | Percentage Beneficially Owned | ||||||
|---|---|---|---|---|---|---|---|---|
| Name of Beneficial Owner | Number of Shares Owned | Shares Issuable Pursuant to Options Exercisable within 60 days of February 21, 2003 | Before Offering | After Offering | ||||
| 5% Stockholders | ||||||||
| Computer Associates | 10,500,000 | — | 89.6 | % | ||||
| Directors and Executive Officers | ||||||||
| David M. Hood | — | 160,000 | 1.4 | % | * | |||
| Donnat Lettman | 27,000 | 171,600 | 1.7 | % | ||||
| Michael Hoberg | — | — | * | * | ||||
| Garry Nishimura | 10,500 | 72,900 | * | * | ||||
| Michael Bongiovanni | — | 25,000 | * | * | ||||
| Susan Sheridan | — | 25,000 | * | * | ||||
| Sidney Braginsky | — | — | * | * | ||||
| William Rizzardi | — | — | * | * | ||||
| David Giddings | — | — | * | * | ||||
| Alfonse D'Amato | — | — | * | * | ||||
| Bruce Blakeman | — | — | * | * | ||||
| All executive officers and directors as a group (eleven persons) | 37,500 | 454,500 | 4.2 | % | ||||
| Selling Stockholder | ||||||||
| Fredrick Wysocki | 105,000 | — | * | * | ||||
- *
- Less than 1% of the outstanding common stock.
78
Our authorized capital stock consists of 100,000,000 shares of common stock, $0.01 par value, and 5,000,000 shares of undesignated preferred stock, $0.01 par value.
Common Stock
As of February 21, 2003, we had 11,717,944 shares of common stock outstanding held by 52 stockholders of record. Based on this number of outstanding shares, following the closing of this offering we will have outstanding shares of common stock. In addition, as of December 31, 2002, we had outstanding stock options for the purchase of a total of 2,885,000 shares of common stock at a weighted average exercise price of $7.46 per share and 113,889 of restricted common stock to be issued. The holders of common stock are entitled to one vote for each share held of record on all matters submitted to a vote of the stockholders. The holders of common stock are entitled to receive ratably such dividends as may be declared by the board of directors out of funds legally available therefore, subject to the rights of the holders of preferred stock. See "Dividend Policy." In the event of a liquidation, dissolution or winding up of ACCPAC, holders of the common stock are entitled to share ratably in all assets remaining after payment of liabilities and amounts due to the holders of preferred stock as described below. Holders of common stock have no preemptive rights and no right to convert their common stock into any other securities. There are no redemption or sinking fund provisions applicable to the common stock. All outstanding shares of common stock are and all shares of common stock to be outstanding upon completion of this offering will be, fully paid and non-assessable.
Of the aggregate of 830,555 shares of our common stock issued to shareholders in connection with our acquisition of eWare and as compensation to eWare executives on December 18, 2002, 707,220 are subject to both a put option and a call option. Both options are exercisable at any time within the 28 days after November 19, 2003, and will terminate at the earlier of December 17, 2003 or the last business day prior to the effectiveness of a registration statement relating to our initial public offering of our common stock.
Registration Rights
Pursuant to the terms of Subscription and Registration Rights Agreements dated as of December 18, 2002, the holders of the 830,555 shares of common stock we issued in connection with our acquisition of eWare in December 2002 are entitled to certain rights with respect to the registration of those shares under the Securities Act.
If we propose to register any of our securities under the Securities Act (with certain exceptions, including this offering), the registration rights holders are entitled to notice and to include their shares of common stock in the registration. However, in the event of an underwritten public offering of common stock, the underwriters will have the right, subject to certain conditions, to limit the number of shares included in such registration. These registration rights terminate on December 18, 2004.
In general, we will pay all fees, costs and expenses of registering the shares of the registration rights holders (other than fees and disbursements of counsel to the selling stockholders in excess of $10,000, unless the selling stockholder is a director, officer or any other person who is a "control person" under the Securities Act). We have agreed to indemnify the registration rights
79
holders against, and provide contribution with respect to, certain liabilities relating to any registration in which any shares of the registration rights holders are sold under the Securities Act.
Preferred Stock
Our certificate of incorporation allows us to issue, without stockholder approval, up to 5,000,000 shares of preferred stock having rights senior to those of the common stock. Our board of directors may, without further approval of the stockholders, issue shares of preferred stock in one or more series and fix the rights, preferences, privileges and restrictions of any series of preferred stock, including dividend rights, conversion rights, redemption privileges, voting rights, liquidation preferences and any other rights, preferences, privileges and restrictions applicable to each series of the preferred stock.
Our issuance of preferred stock could adversely affect the voting power of the holders of the common stock and, under certain circumstances, may render more difficult, or have the effect of discouraging, unsolicited takeover bids from third parties, or the removal of incumbent management or otherwise adversely affect the market price for our common stock.
Limitation of Liability of Directors and Officers
As permitted by Delaware law, our certificate of incorporation provides that our directors will not be liable to us or our stockholders for monetary damages for breach of fiduciary duty as a director to the fullest extent permitted by Delaware law. As of the date of this prospectus, Delaware law permits limitations of liability for a director's breach of fiduciary duty other than liability for the following:
- •
- any breach of the director's duty of loyalty to us or our stockholders;
- •
- acts or omissions not in good faith or which involve intentional misconduct or a knowing violation of law;
- •
- unlawful payments of dividends or unlawful stock repurchases or redemptions; or
- •
- any transaction from which the director derived an improper personal benefit.
The effect of this provision will be to eliminate the personal liability of directors for monetary damages for actions involving a breach of their fiduciary duty of care, including any such actions involving gross negligence, except in the situations described above.
Anti-Takeover Provisions and Charter Provisions
Delaware Law
We are subject to Section 203 of the Delaware General Corporation Law. This statute prohibits a publicly held Delaware corporation from engaging in any business combination with any interested stockholder for a period of three years following the date that the stockholder became an interested stockholder unless:
- •
- prior to the date, the board of directors of the corporation approved either the business combination or the transaction that resulted in the stockholder becoming an interested stockholder;
80
- •
- upon consummation of the transaction that resulted in the stockholder's becoming an interested stockholder, the interested stockholder owned at least 85% of the voting stock of the corporation outstanding at the time the transaction commenced, excluding those shares owned by persons who are directors and also officers and employee stock plans in which employee participants do not have the right to determine confidentially whether shares held subject to the plan will be tendered in a tender or exchange offer; or
- •
- on or subsequent to the date, the business combination is approved by the board of directors and authorized at an annual or special meeting of stockholders and not by written consent, by the affirmative vote of at least two-thirds of the outstanding voting stock that is not owned by the interested stockholder.
Section 203 defines "business combination" to include:
- •
- any merger or consolidation involving the corporation and the interested stockholder;
- •
- any sale, transfer, pledge, lease, exchange, mortgage or other disposition involving the interested stockholder of 10% or more of the assets of the corporation;
- •
- subject to exceptions, any transaction that results in the issuance or transfer by the corporation of any stock of the corporation to the interested stockholder; or
- •
- the receipt by the interested stockholder of the benefit of any loans, advances, guarantees, pledges or other financial benefits provided by or through the corporation.
In general, Section 203 defines an interested stockholder as any entity or person beneficially owning 15% or more of the outstanding voting stock of the corporation and any entity or person affiliated with or controlling or controlled by the entity or person.
Charter Provisions
Provisions of our certificate of incorporation and bylaws could discourage potential acquisition proposals and could delay or prevent a change in control transaction that our stockholders favor. These provisions could have the effect of discouraging others from making offers to purchase shares of our stock. As a result, these provisions may prevent the market price of our stock from reflecting the effects of actual or rumored takeover attempts and may prevent stockholders from reselling their stock at or above the price at which they purchased their stock. These provisions may also prevent or restrict our stockholders from changing our management. Our certificate of incorporation and bylaws do not permit stockholders to act by written consent after the closing of this offering, and do not permit stockholders to call a general meeting. Furthermore, our board of directors has the authority to issue up to 5,000,000 shares of preferred stock in one or more series. Our board of directors can fix the price, rights, preferences, privileges and restrictions of our preferred stock without any further vote or action by our stockholders. The issuance of preferred stock may delay or prevent a change in control transaction without further action by our stockholders or make removal of our management more difficult.
Corporate Opportunities
Our certificate of incorporation provides that Computer Associates will have no duty or obligation to communicate, offer to us or refrain from engaging in opportunities that may be a potential corporate opportunity for both Computer Associates and us. However, if a corporate opportunity is offered to one of our directors or officers who is also a director or officer of
81
Computer Associates, the opportunity will be deemed a corporate opportunity of Computer Associates or us based on the following principles:
- •
- a corporate opportunity offered to one of our officers who is also a director but not an officer of Computer Associates, will belong to us;
- •
- a corporate opportunity offered to one of our directors, who is not our officer, but who is also a director or officer of Computer Associates, will belong to us if such opportunity is expressly offered to that person in writing solely in his or her capacity as our director, and otherwise will belong to Computer Associates; and
- •
- a corporate opportunity offered to one of our officers, who is also an officer of Computer Associates will belong to us if such opportunity is expressly offered to that person in writing solely in his or her capacity as our officer, and otherwise will belong to Computer Associates.
This provision of our certificate of incorporation will expire on the date that both Computer Associates ceases to beneficially own common stock representing at least 20% of our outstanding capital stock, and no person who is one of our directors or officers is also a director or officer of Computer Associates or any of its subsidiaries, other than us. Until the expiration of this provision, the vote of more than 80% of our outstanding capital stock will be required in order to amend this provision in a manner adverse to the interests of Computer Associates and inconsistent with our corporate opportunity provisions.
Transfer Agent and Registrar
The transfer agent and registrar for our common stock will be US Stock Transfer Corp.
Listing
We have applied for the quotation of our common stock on the Nasdaq National Market under the symbol "ACPC."
82
SHARES ELIGIBLE FOR FUTURE SALE
Prior to this offering, there has been no public market for our common stock. A large number of shares of our common stock outstanding will not be available for sale shortly after this offering because of contractual and legal restrictions on resale, as described below. However, sales of substantial amounts of our common stock in the public market after these restrictions lapse could adversely affect the prevailing market price. Upon the closing of this offering, shares of our common stock will be outstanding, assuming no exercise of the underwriters over-allotment option and no exercise of outstanding options. Of these shares, all of the shares sold in this offering will be freely tradable without restriction or further registration under the Securities Act, unless the shares are purchased by our affiliates. Upon completion of this offering, 11,499,055 shares of common stock held by existing stockholders will be restricted securities. Restricted securities may be not sold in the public market unless they are registered or they qualify for an exemption under the Securities Act.
As a result of the lock-up agreements described below and the rules under the Securities Act, the restricted securities will be available for sale in the public market as follows:
| Days After the Effective Date | Shares Eligible for Sale | Comment | ||
|---|---|---|---|---|
| On Effectiveness | 83,400 | Shares not locked up and saleable under Rule 144 | ||
| 90 days | 500 | Shares not locked up and saleable under Rules 144 and 701 | ||
| 180 days | 11,415,155 | Lock-up released: shares saleable under Rules 144 and 701 |
Additionally, of the 2,885,000 shares that may be issued upon the exercise of options outstanding as of December 31, 2002, approximately 1,295,951 shares will be vested and eligible for sale 180 days after the date of this prospectus.
Lock-up Agreements
All of our directors and executive officers and certain of our stockholders and optionholders have agreed not to offer, sell or agree to sell, directly or indirectly, or otherwise dispose of shares of our common stock, enter into any swap, hedge, or similar agreement or arrangement that transfers the economic risk of our common stock or engage in any short selling of our common stock for a period of 180 days after the date the registration statement of which this prospectus is a part is declared effective. Some transfers or dispositions can be made sooner with the prior written consent of RBC Dain Rauscher Inc. This consent may be given at any time without public notice.
Rule 144
In general, beginning 90 days after the date the registration statement of which this prospectus is a part is declared effective, a person or persons who has owned shares of our common stock for at least one year, including the holding period of any prior owner except an
83
affiliate, would be entitled to sell within any three-month period a number of shares of common stock that does not exceed the greater of:
- •
- 1% of the number of shares of common stock then outstanding, which will equal approximately shares immediately after this offering; or
- •
- the average weekly trading volume of our common stock on the Nasdaq National Market during the four calendar weeks preceding the filing of a notice on Form 144 with respect to that sale.
Sales under Rule 144 are also governed by manner of sale provisions and notice requirements, and current public information about our company must be available.
Under Rule 144(k), a person who is not an affiliate of our company at any time during the three months preceding a sale, and who has owned the shares proposed to be sold for at least two years, including the holding period of any prior owner except an affiliate, is entitled to sell the shares without complying with the manner of sale, public information, volume limitation, or notice provisions of Rule 144. Therefore, unless otherwise restricted, "Rule 144(k) shares" may be sold immediately upon the completion of this offering.
Rule 701
Rule 701 permits resales of shares in reliance upon Rule 144 but without compliance with some restrictions, including the holding period requirements, of Rule 144. Any of our employees who have purchased shares from us in connection with a compensatory stock purchase plan or option plan or other written agreement is eligible to resell those shares 90 days after the effective date of this offering in reliance on Rule 701 (except where restricted by a lock-up agreement). Rule 701 permits non-affiliates to sell their Rule 701 shares subject only to the manner of sale provisions of Rule 144, without complying with the public information holding period, volume limitation, or notice provisions of Rule 144. Rule 701 permits affiliates to sell their Rule 701 shares without having to comply with the Rule 144 holding period restrictions. All holders of Rule 701 shares are required to wait 90 days after the date of this prospectus before selling such shares.
Stock Incentive Plan and Employee Stock Purchase Plan
As soon as practicable after this offering, we expect to file a registration statement on Form S-8 under the Securities Act of 1933 covering approximately 5,999,500 shares of common stock reserved for issuance under our stock incentive and employee stock purchase plans. This registration statement is expected to be filed and become effective as soon as practicable after the effective date of this offering. Shares registered under such registration statement will be available for immediate resale in the open market, subject to vesting provisions, lock-up agreements and Rule 144 volume limitations applicable to our affiliates.
84
Subject to the terms and conditions of the underwriting agreement dated , 2003, the underwriters named below, through their representatives RBC Dain Rauscher Inc., SoundView Technology Corporation and Adams, Harkness & Hill, Inc. have severally agreed to purchase from us and the selling stockholder the number of shares of common stock set forth opposite their names at the public offering price less the underwriting discounts and commissions set forth on the cover page of this prospectus.
| Name | Number of Shares | ||
|---|---|---|---|
| RBC Dain Rauscher Inc. | |||
| SoundView Technology Corporation | |||
| Adams, Harkness & Hill, Inc. | |||
| Total | |||
The underwriting agreement provides that the obligations of the underwriters may be terminated upon the occurrence of the events specified in the underwriting agreement. The underwriters are severally committed to purchase all of the common stock being offered by us and the selling stockholder if any of such shares are purchased, other than those covered by the over-allotment option described below.
The underwriters propose to offer the common stock directly to the public at the public offering price set forth on the cover page of this prospectus. The underwriting fee is an amount equal to the offering price to the public less the amount paid per share by the underwriters to us and the selling stockholder. The underwriters may offer the common stock to some dealers at that price less a concession not in excess of $ per share. Dealers may reallow a concession not in excess of $ per share to some other dealers. After the shares of common stock are released for sale to the public, the underwriters may vary the offering price and other selling terms.
We have granted to the underwriters an option, exercisable for up to 30 days after the date of this prospectus, to purchase up to additional shares of common stock at the public offering price set forth on the cover of this prospectus less the underwriting discounts and commissions to cover over-allotments, if any. If the underwriters exercise their over-allotment option, the underwriters have severally agreed, subject to limited conditions, to purchase approximately the same percentage that the number of shares of common stock to be purchased by each of them, as shown in the foregoing table, bears to the common stock covered by this prospectus.
At our request, the underwriters have reserved up to 5% of the shares of common stock for sale at the initial public offering price to our employees, directors, specific existing stockholders, specific customers and third-party vendors. The number of shares of common stock available for sale to the general public will be reduced to the extent such persons purchase such reserved shares. Any reserved shares that are not so purchased will be offered by the underwriters to the general public on the same basis as the other shares offered hereby.
We and the selling stockholder intend to enter into agreements to indemnify the underwriters against some liabilities, including liabilities under the Securities Act, and to contribute to payments that the underwriters may be required to make in respect thereof.
85
All of our directors and officers and certain other stockholders holding, including Computer Associates, in the aggregate, approximately 98.4% of our outstanding stock, have agreed that for a period of at least 180 days following the date of this prospectus, without the prior written consent of RBC Dain Rauscher Inc., they will not directly or indirectly, offer, sell, assign, transfer, pledge, contract to sell, or otherwise dispose of or hedge, other than by operation of law, any shares of common stock or any securities convertible into or exercisable or exchangeable for common stock, including, without limitation, common stock which may be deemed to be beneficially owned in accordance with rules and regulations promulgated under the Securities Act.
The representatives of the underwriters may engage in over-allotment, stabilizing transactions, syndicate covering transactions, penalty bids and passive market making in accordance with Regulation M under the Securities Exchange Act of 1934.
- •
- Over-allotment involves syndicate sales in excess of the offering size, which creates a syndicate short position. The short position may be either a covered short position or a naked short position. In a covered short position, the number of shares over-allotted by the underwriters is not greater than the number of shares that they may purchase in the over-allotment option. In a naked short position, the number of shares involved is greater than the number of shares in the over-allotment option. The underwriters may close out any covered short position by either exercising their over-allotment option or purchasing shares in the open market.
- •
- Stabilizing transactions permit bids to purchase the underlying security so long as the stabilizing bids do not exceed a specified maximum.
- •
- Syndicate covering transactions involve purchases of the common stock in the open market after the distribution has been completed in order to cover syndicate short positions. In determining the source of shares to close out the short position, the underwriters will consider, among other things, the price of shares available for purchase in the open market as compared to the price at which they may purchase shares through the over-allotment option. If the underwriters sell more shares than could be covered by the over-allotment option, a naked short position, the position can only be closed out by buying shares in the open market. A naked short position is more likely to be created if the underwriters are concerned that there could be downward pressure on the price of the shares in the open market after pricing that could adversely affect investors who purchase in the offering.
- •
- Penalty bids permit the representatives to reclaim a selling concession from a syndicate member when the common stock originally sold by the syndicate member is purchased in a syndicate covering transaction to cover syndicate short positions. Penalty bids may have the effect of deterring syndicate members from selling to people who have a history of quickly selling their shares.
- •
- In passive market making, market makers in the common stock who are underwriters or prospective underwriters may, subject to some limitations, make bids for or purchases of the common stock until the time, if any, at which a stabilizing bid is made.
These stabilizing transactions, syndicate covering transactions and penalty bids may cause the price of the common stock to be higher than it would otherwise be in the absence of these transactions. These transactions may be effected on the Nasdaq National Market or otherwise and, if commenced, may be discontinued at any time.
86
The underwriters have advised us and the selling stockholder that they do not intend to confirm sales in excess of % of the common stock offered to any account over which they exercise discretionary authority. RBC Dain Rauscher Inc. is delivering this prospectus in both printed and electronic form simultaneously.
A prospectus in electronic format is being made available on an Internet website maintained by E*TRADE Securities, Inc. SoundView Technology Corporation, pursuant to a Relationship Agreement with E*TRADE, may offer shares that it underwrites to customers of E*TRADE. The underwriters may allocate a number of shares to SoundView Technology Corporation for sale to online brokerage account holders of E*TRADE Securities, Inc. These online brokerage account holders will have the opportunity to purchase shares using the Internet in accordance with procedures established by E*TRADE Securities, Inc. Other than the prospectus in electronic format, the information on the E*TRADE web site is not part of this prospectus or the registration statement of which this prospectus forms a part, has not been approved or endorsed by us or any underwriter in its capacity as underwriter, and should not be relied upon by investors.
Prior to this offering, there has been no public market for our common stock. Consequently, the initial public offering price will be determined by negotiations between us and the underwriters. Among the factors considered in these negotiations will be prevailing market conditions, the market capitalizations and the stages of development of other companies that we and the underwriters believe to be comparable to us, our current financial condition, estimates of our business potential, our results of operations in recent periods, our management, the present state of our development and other factors deemed relevant.
The following table shows the underwriting discounts and commissions that we and the selling stockholder are to pay to the underwriters in connection with this offering. The amounts paid by us are shown assuming no exercise and full exercise of the underwriters' option to purchase additional shares of common stock.
| | Paid by ACCPAC | |||||
|---|---|---|---|---|---|---|
| | No Exercise | Full Exercise | ||||
| Per share | $ | $ | ||||
| Total | $ | $ | ||||
| | Paid by the Selling Stockholder | ||||
|---|---|---|---|---|---|
| | | | |||
| Per share | $ | ||||
| Total | $ | ||||
We estimate that our out of pocket expenses for this offering, excluding underwriting discounts and commissions, will be approximately $ .
We have applied for the quotation of our common stock on the Nasdaq National Market under the symbol "ACPC."
87
The validity of the shares of common stock offered by this prospectus will be passed upon for us by Covington & Burling, San Francisco, California. The underwriters have been represented by Jones Day, Menlo Park, California. Covington & Burling has in the past provided, and may continue to provide, legal services to Computer Associates and its affiliates.
The consolidated balance sheets of ACCPAC International, Inc. and subsidiaries as of March 31, 2001 and 2002 and December 31, 2002, and the related consolidated statements of operations, stockholders' equity (deficit) and comprehensive income (loss) and cash flows for each of the years in the three-year period ended March 31, 2002, and nine-month period ended December 31, 2002, have been included herein and elsewhere in the registration statement, of which this prospectus is a part, in reliance upon the report of KPMG LLP, independent certified public accountants and upon the authority of said firm as experts in accounting and auditing.
The consolidated balance sheet of eWare Limited and subsidiaries as of December 18, 2002 and the related consolidated profit and loss account, statement of total recognized gains and losses and cash flow statement for the period from January 1, 2002 to December 18, 2002, have been included herein and elsewhere in the registration statement, of which this prospectus is a part, in reliance upon the report of KPMG, independent accountants and upon the authority of said firm as experts in accounting and auditing.
WHERE YOU CAN FIND MORE INFORMATION
We have filed with the Securities and Exchange Commission a registration statement on Form S-1 under the Securities Act of 1933 regarding the shares of common stock offered by us. This prospectus, which forms a part of the registration statement, does not contain all of the information included in the registration statement. Some information is omitted from this prospectus in accordance with the rules of the Securities and Exchange Commission and you should refer to the registration statement, including the exhibits, financial statements and notes filed as part of it, for additional information about ACCPAC and the common stock offered. You may inspect a copy of the registration statement, including the exhibits, financial statements, and notes filed as part of it, without charge at the offices of the Securities and Exchange Commission at Judiciary Plaza, 450 Fifth Street, Washington, D.C. 20549. You may obtain copies of all or any part of the registration statement from the Public Reference Room of the Securities and Exchange Commission, 450 Fifth Street, Washington, D.C. 20549, upon the payment of the prescribed fees. You may obtain information on the operation of the Public Reference Room by calling the Securities and Exchange Commission at 1-800-SEC-0330. Securities and Exchange Commission filings and the registration statement can also be reviewed by accessing the Securities and Exchange Commission's website atwww.sec.gov.
"ACCPAC" is our registered trademark. "ACCPAC Advantage Series," "ACCPAC eCRM," "ACCPAC ePOS," "ACCPAC eTransact," "ACCPAC Exchange," "ACCPAC HR Series," "ACCPAC Online," "ACCPAC Pro Series," "ACCPAC Pro Series Manufacturing," "ACCPAC Warehouse Management," "ACCPAC Simply Accounting," "ACCPAC FAXserve" and "ACCPAC Messenger" are some of our trademarks. Service marks, trademarks and trade names of other companies also appear in this prospectus and are the property of their respective owners.
88
ACCPAC International, Inc.
and Subsidiaries
Index to Consolidated Financial Statements
| ACCPAC International, Inc. Financial Statements | |||
Independent Auditors' Report | F-2 | ||
Consolidated Balance Sheets | F-3 | ||
Consolidated Statements of Operations | F-4 | ||
Consolidated Statements of Stockholders' Equity (Deficit) and Comprehensive Income (Loss) | F-5 | ||
Consolidated Statements of Cash Flows | F-6 | ||
Notes to Consolidated Financial Statements | F-7 | ||
Pro Forma Financial Information | F-37 | ||
eWare Limited Financial Statements | |||
Independent Auditors' Report | F-42 | ||
Consolidated Profit and Loss Account | F-43 | ||
Statement of Total Recognized Gains and Losses | F-44 | ||
Consolidated Balance Sheet | F-45 | ||
Consolidated Cash Flow Statement | F-46 | ||
Notes to Consolidated Financial Statements | F-47 | ||
F-1
The Board of Directors
ACCPAC International, Inc.:
We have audited the accompanying consolidated balance sheets of ACCPAC International, Inc. and subsidiaries (the Company) as of March 31, 2001 and 2002 and December 31, 2002, and the related consolidated statements of operations, stockholders' equity (deficit) and comprehensive income (loss), and cash flows for each of the years in the three-year period ended March 31, 2002 and for the nine-month period ended December 31, 2002. These consolidated financial statements are the responsibility of the Company's management. Our responsibility is to express an opinion on these consolidated financial statements based on our audits.
We conducted our audits in accordance with auditing standards generally accepted in the United States of America. Those standards require that we plan and perform the audit to obtain reasonable assurance about whether the financial statements are free of material misstatement. An audit includes examining, on a test basis, evidence supporting the amounts and disclosures in the financial statements. An audit also includes assessing the accounting principles used and significant estimates made by management, as well as evaluating the overall financial statement presentation. We believe that our audits provide a reasonable basis for our opinion.
In our opinion, the consolidated financial statements referred to above present fairly, in all material respects, the consolidated financial position of ACCPAC International, Inc. and subsidiaries as of March 31, 2001 and 2002 and December 31, 2002, and the results of their operations and their cash flows for each of the years in the three-year period ended March 31, 2002 and for the nine-month period ended December 31, 2002, in conformity with accounting principles generally accepted in the United States of America.
/s/ KPMG LLP
Mountain View, California
January 31, 2003
F-2
ACCPAC International, Inc. and Subsidiaries
Consolidated Balance Sheets
(In Thousands, Except Share and Per Share Amounts)
| | March 31, | | |||||||||||
|---|---|---|---|---|---|---|---|---|---|---|---|---|---|
| | December 31, 2002 | ||||||||||||
| | 2001 | 2002 | |||||||||||
| Assets | |||||||||||||
| Current assets: | |||||||||||||
| Cash and cash equivalents | $ | 12,241 | $ | 14,042 | $ | 13,751 | |||||||
| Accounts receivable, less allowance for doubtful accounts of $1,512, $1,309 and $1,091, as of March 31, 2001 and 2002 and December 31, 2002, respectively | 11,402 | 11,660 | 11,083 | ||||||||||
| Inventories | 2,509 | 1,490 | 1,038 | ||||||||||
| Deferred income taxes | 4,997 | 2,354 | 1,156 | ||||||||||
| Other current assets | 1,656 | 1,098 | 2,744 | ||||||||||
| Total current assets | 32,805 | 30,664 | 29,772 | ||||||||||
| Property and equipment, net | 4,791 | 3,370 | 2,815 | ||||||||||
| Goodwill | 16,763 | 12,782 | 17,766 | ||||||||||
| Other intangibles, net | 18,357 | 13,673 | 13,862 | ||||||||||
| Other assets | 333 | 133 | 1,065 | ||||||||||
| Total assets | $ | 73,049 | $ | 60,602 | $ | 65,280 | |||||||
| Liabilities and Stockholders' Equity (Deficit) | |||||||||||||
| Current liabilities: | |||||||||||||
| Accounts payable | $ | 4,635 | $ | 3,101 | $ | 4,644 | |||||||
| Current portion of note payable to Computer Associates International, Inc. | — | 5,340 | 5,340 | ||||||||||
| Deferred revenue | 14,632 | 18,589 | 21,687 | ||||||||||
| Payable to Computer Associates International, Inc. | 39,205 | 8,464 | 8,743 | ||||||||||
| Other accrued liabilities | 7,781 | 6,625 | 7,663 | ||||||||||
| Total current liabilities | 66,253 | 42,119 | 48,077 | ||||||||||
| Note payable to Computer Associates International, Inc., less current portion | — | 21,360 | 10,855 | ||||||||||
| Deferred income taxes | 6,929 | 5,439 | 4,425 | ||||||||||
| Total liabilities | 73,182 | 68,918 | 63,357 | ||||||||||
| Commitments | |||||||||||||
| Stockholders' equity (deficit) | |||||||||||||
| Preferred stock, $0.01 par value; 1,000,000, 1,000,000 and 5,000,000 shares authorized at March 31, 2001 and 2002 and December 31, 2002, respectively; none issued and outstanding at March 31, 2001 and 2002 and at December 31, 2002 | — | — | — | ||||||||||
| Common stock, $0.01 par value; 25,000,000, 25,000,000, and 100,000,000 shares authorized at March 31, 2001 and 2002 and December 31, 2002, respectively; 10,773,000 shares issued and outstanding at March 31, 2001 and 2002 and 11,604,055 issued and outstanding at December 31, 2002 | 108 | 108 | 116 | ||||||||||
| Common stock to be issued, $0.01 par value; 113,889 shares at December 31, 2002 | — | — | 1 | ||||||||||
| Additional paid-in capital | 3,283 | 6,398 | 15,176 | ||||||||||
| Deferred compensation | — | — | (1,650 | ) | |||||||||
| Accumulated deficit | (2,623 | ) | (13,187 | ) | (10,618 | ) | |||||||
| Accumulated other comprehensive loss | (901 | ) | (1,635 | ) | (1,102 | ) | |||||||
| Total stockholders' equity (deficit) | (133 | ) | (8,316 | ) | 1,923 | ||||||||
| Total liabilities and stockholders' equity (deficit) | $ | 73,049 | $ | 60,602 | $ | 65,280 | |||||||
See accompanying notes to consolidated financial statements.
F-3
ACCPAC International, Inc. and Subsidiaries
Consolidated Statements of Operations
(In Thousands, Except Per Share Amounts)
| | Years Ended March 31, | Nine Months Ended December 31, | |||||||||||||||||
|---|---|---|---|---|---|---|---|---|---|---|---|---|---|---|---|---|---|---|---|
| | 2000 | 2001 | 2002 | 2001 | 2002 | ||||||||||||||
| | | | | (Unaudited) | | ||||||||||||||
| Revenue: | |||||||||||||||||||
| License | $ | 41,683 | $ | 46,908 | $ | 38,787 | $ | 25,802 | $ | 28,394 | |||||||||
| Maintenance and other | 20,366 | 28,728 | 33,962 | 25,319 | 30,664 | ||||||||||||||
| Third-party products | 12,069 | 10,292 | 5,540 | 4,336 | 3,513 | ||||||||||||||
| Total revenue | 74,118 | 85,928 | 78,289 | 55,457 | 62,571 | ||||||||||||||
| Cost of revenue: | |||||||||||||||||||
| License | 9,386 | 10,598 | 8,862 | 5,941 | 5,419 | ||||||||||||||
| Maintenance and other | 5,351 | 9,407 | 10,394 | 7,554 | 9,478 | ||||||||||||||
| Third-party products | 10,723 | 7,936 | 4,053 | 3,380 | 2,370 | ||||||||||||||
| Amortization of acquired intangibles | 277 | 1,347 | 1,636 | 1,228 | 1,228 | ||||||||||||||
| Total cost of revenue | 25,737 | 29,288 | 24,945 | 18,103 | 18,495 | ||||||||||||||
| Gross profit | 48,381 | 56,640 | 53,344 | 37,354 | 44,076 | ||||||||||||||
| Operating expenses: | |||||||||||||||||||
| Sales and marketing | 25,245 | 38,854 | 35,833 | 28,722 | 22,420 | ||||||||||||||
| Research and development | 5,693 | 10,415 | 10,343 | 8,236 | 6,598 | ||||||||||||||
| General and administrative | 7,082 | 13,956 | 10,740 | 9,139 | 7,488 | ||||||||||||||
| Amortization of goodwill and other intangibles | 60 | 4,644 | 6,567 | 4,949 | 2,141 | ||||||||||||||
| Acquired in-process research and development | 60 | 3,900 | — | — | 110 | ||||||||||||||
| Total operating expenses | 38,140 | 71,769 | 63,483 | 51,046 | 38,757 | ||||||||||||||
| Income (loss) from operations | 10,241 | (15,129 | ) | (10,139 | ) | (13,692 | ) | 5,319 | |||||||||||
| Interest income | 604 | 947 | 298 | 249 | 146 | ||||||||||||||
| Interest expense | (347 | ) | (28 | ) | (2,007 | ) | (1,500 | ) | (896 | ) | |||||||||
| Other income (expense), net | — | 75 | (153 | ) | (91 | ) | 251 | ||||||||||||
| Income (loss) before income taxes | 10,498 | (14,135 | ) | (12,001 | ) | (15,034 | ) | 4,820 | |||||||||||
| Provision (benefit) for income taxes | 4,311 | (2,968 | ) | (1,437 | ) | (1,798 | ) | 2,251 | |||||||||||
| Net income (loss) | $ | 6,187 | $ | (11,167 | ) | $ | (10,564 | ) | $ | (13,236 | ) | $ | 2,569 | ||||||
| Net earnings (loss) per share: | |||||||||||||||||||
| Basic | $ | 0.57 | $ | (1.04 | ) | $ | (0.98 | ) | $ | (1.23 | ) | $ | 0.24 | ||||||
| Diluted | $ | 0.56 | $ | (1.04 | ) | $ | (0.98 | ) | $ | (1.23 | ) | $ | 0.23 | ||||||
| Shares used in per share computation: | |||||||||||||||||||
| Basic | 10,773 | 10,773 | 10,773 | 10,773 | 10,812 | ||||||||||||||
| Diluted | 11,103 | 10,773 | 10,773 | 10,773 | 11,089 | ||||||||||||||
See accompanying notes to consolidated financial statements.
F-4
ACCPAC International, Inc. and Subsidiaries
Consolidated Statements of Stockholders' Equity (Deficit) and
Comprehensive Income (Loss)
(In Thousands)
| | | | Common Stock to be issued | | | | | | | ||||||||||||||||||||
|---|---|---|---|---|---|---|---|---|---|---|---|---|---|---|---|---|---|---|---|---|---|---|---|---|---|---|---|---|---|
| | Common Stock | | | | Accumulated Other Comprehensive Loss | | Total Stockholders' Equity (Deficit) | ||||||||||||||||||||||
| | Additional Paid-in Capital | Deferred Compensation | Accumulated Deficit | Comprehensive Income (Loss) | |||||||||||||||||||||||||
| | Shares | Amount | Shares | Amount | |||||||||||||||||||||||||
| Balance as of March 31, 1999 | 10,773 | $ | 108 | — | $ | — | $ | — | $ | — | $ | 2,357 | $ | (414 | ) | $ | 2,051 | ||||||||||||
| Capital contribution related to tax sharing arrangement | — | — | — | — | 374 | — | — | — | 374 | ||||||||||||||||||||
| Tax benefit from employee stock option plans | — | — | — | — | 576 | — | — | — | 576 | ||||||||||||||||||||
| Foreign currency translation | — | — | — | — | — | — | — | 298 | $ | 298 | 298 | ||||||||||||||||||
| Net income | — | — | — | — | — | — | 6,187 | — | 6,187 | 6,187 | |||||||||||||||||||
| Comprehensive income | — | — | $ | 6,485 | |||||||||||||||||||||||||
| Balance as of March 31, 2000 | 10,773 | 108 | — | — | 950 | — | 8,544 | (116 | ) | 9,486 | |||||||||||||||||||
| Capital contribution related to tax sharing arrangement | — | — | — | — | 2,333 | — | — | — | 2,333 | ||||||||||||||||||||
| Foreign currency translation | — | — | — | — | — | — | — | (785 | ) | $ | (785 | ) | (785 | ) | |||||||||||||||
| Net loss | — | — | — | — | — | — | (11,167 | ) | — | (11,167 | ) | (11,167 | ) | ||||||||||||||||
| Comprehensive loss | — | — | $ | (11,952 | ) | ||||||||||||||||||||||||
| Balance as of March 31, 2001 | 10,773 | 108 | — | — | 3,283 | — | (2,623 | ) | (901 | ) | (133 | ) | |||||||||||||||||
| Capital contribution related to tax sharing arrangement | — | — | — | — | 3,063 | — | — | — | 3,063 | ||||||||||||||||||||
| Tax benefit from employee stock option plans | — | — | — | — | 52 | — | — | — | 52 | ||||||||||||||||||||
| Foreign currency translation | — | — | — | — | — | — | — | (734 | ) | $ | (734 | ) | (734 | ) | |||||||||||||||
| Net loss | — | — | — | — | — | — | (10,564 | ) | — | (10,564 | ) | (10,564 | ) | ||||||||||||||||
| Comprehensive loss | — | — | $ | (11,298 | ) | ||||||||||||||||||||||||
| Balance as of March 31, 2002 | 10,773 | 108 | — | — | 6,398 | — | (13,187 | ) | (1,635 | ) | (8,316 | ) | |||||||||||||||||
| Exercise of common stock options | 1 | — | — | — | 2 | — | — | — | 2 | ||||||||||||||||||||
| Capital contribution related to tax sharing arrangement | — | — | — | — | 443 | — | — | 443 | |||||||||||||||||||||
| Stock grants in connection with acquisition | 830 | 8 | 114 | 1 | 8,333 | (1,650 | ) | — | — | — | 6,692 | ||||||||||||||||||
| Foreign currency translation | — | — | — | — | — | — | 533 | $ | 533 | 533 | |||||||||||||||||||
| Net income | — | — | — | — | — | 2,569 | — | 2,569 | 2,569 | ||||||||||||||||||||
| Comprehensive income | — | — | $ | 3,102 | |||||||||||||||||||||||||
| Balance as of December 31, 2002 | 11,604 | $ | 116 | 114 | $ | 1 | $ | 15,176 | $ | (1,650 | ) | $ | (10,618 | ) | $ | (1,102 | ) | $ | 1,923 | ||||||||||
See accompanying notes to consolidated financial statements.
F-5
ACCPAC International, Inc. and Subsidiaries
Consolidated Statements of Cash Flows
(In Thousands)
| | Years Ended March 31, | Nine Months Ended December 31, | ||||||||||||||||||
|---|---|---|---|---|---|---|---|---|---|---|---|---|---|---|---|---|---|---|---|---|
| | 2000 | 2001 | 2002 | 2001 | 2002 | |||||||||||||||
| | | | | (unaudited) | | |||||||||||||||
| Cash flows from operating activities: | ||||||||||||||||||||
| Net income (loss) | $ | 6,187 | $ | (11,167 | ) | $ | (10,564 | ) | $ | (13,236 | ) | $ | 2,569 | |||||||
| Adjustments to reconcile net income (loss) to cash provided by (used in) operating activities: | ||||||||||||||||||||
| Depreciation | 585 | 1,308 | 1,706 | 1,340 | 1,664 | |||||||||||||||
| Provision for doubtful accounts | 355 | 686 | 546 | 187 | 277 | |||||||||||||||
| Amortization of goodwill and other intangibles | 337 | 5,991 | 8,203 | 6,177 | 3,369 | |||||||||||||||
| Acquired in-process research and development | 60 | 3,900 | — | — | 110 | |||||||||||||||
| Tax benefit from employee stock option plans | 576 | — | 52 | — | — | |||||||||||||||
| Deferred income taxes | (826 | ) | (3,267 | ) | 1,153 | — | 184 | |||||||||||||
| Changes in operating assets and liabilities, net of effect of acquisitions: | ||||||||||||||||||||
| Accounts receivable | 2,525 | (4,013 | ) | (804 | ) | 3,798 | 1,617 | |||||||||||||
| Inventories | 1,105 | 1,668 | 1,019 | 565 | 452 | |||||||||||||||
| Other assets | (1,057 | ) | (337 | ) | 758 | 551 | (2,216 | ) | ||||||||||||
| Accounts payable | (1,079 | ) | (624 | ) | (1,534 | ) | (1,875 | ) | 953 | |||||||||||
| Payable to Computer Associates International, Inc. | 6,466 | 2,537 | (978 | ) | (1,043 | ) | 885 | |||||||||||||
| Other accrued liabilities | 2,367 | (140 | ) | (1,156 | ) | (2,726 | ) | (481 | ) | |||||||||||
| Deferred revenue | 1,723 | 2,761 | 3,957 | 1,290 | 2,799 | |||||||||||||||
| Net cash provided by (used in) operating activities | 19,324 | (697 | ) | 2,358 | (4,972 | ) | 12,182 | |||||||||||||
| Cash flows from investing activities: | ||||||||||||||||||||
| Purchases of property and equipment | (2,636 | ) | (2,370 | ) | (285 | ) | (138 | ) | (977 | ) | ||||||||||
| Cash paid for acquisitions of businesses | (3,001 | ) | (34,705 | ) | — | — | (1,171 | ) | ||||||||||||
| Net cash used in investing activities | (5,637 | ) | (37,075 | ) | (285 | ) | (138 | ) | (2,148 | ) | ||||||||||
| Cash flows from financing activities: | ||||||||||||||||||||
| Exercise of common stock options | — | — | — | — | 2 | |||||||||||||||
| Transfer from (to) Computer Associates International, Inc. | (1,708 | ) | 26,817 | — | — | (10,505 | ) | |||||||||||||
| Net cash provided by (used in) financing activities | (1,708 | ) | 26,817 | — | — | (10,503 | ) | |||||||||||||
| Effect of exchange rate changes | 403 | (645 | ) | (272 | ) | (129 | ) | 178 | ||||||||||||
| Net increase (decrease) in cash and cash equivalents | 12,382 | (11,600 | ) | 1,801 | (5,239 | ) | (291 | ) | ||||||||||||
| Cash and cash equivalents at beginning of period | 11,459 | 23,841 | 12,241 | 12,241 | 14,042 | |||||||||||||||
| Cash and cash equivalents at end of period | $ | 23,841 | $ | 12,241 | $ | 14,042 | $ | 7,002 | $ | 13,751 | ||||||||||
| Supplemental disclosures of cash flow information: | ||||||||||||||||||||
| Noncash investing and financing activities: | ||||||||||||||||||||
| Capital contribution related to tax sharing arrangement | $ | 374 | $ | 2,333 | $ | 3,063 | $ | 2,297 | $ | 443 | ||||||||||
| Conversion of payable to Computer Associates International, Inc. to a long-term note payable | — | — | $ | 26,700 | — | — | ||||||||||||||
See accompanying notes to consolidated financial statements.
F-6
ACCPAC International, Inc. and Subsidiaries
Notes to the Consolidated Financial Statements
(Information for the
Nine-Months Ended December 31, 2001 is Unaudited)
(1) Organization and Summary of Significant Accounting Policies
- (a)
- Description of Business
- (b)
- Basis of Presentation
ACCPAC International, Inc. (the Company) is a subsidiary of Computer Associates International, Inc. (Computer Associates). The Company was incorporated in October 1997. The Company designs, develops, markets and supports a suite of business management and business management software products. Prior to January l, 1998, the Company operated as a division of Computer Associates. Effective January 1, 1998, pursuant to a contribution agreement (the Contribution Agreement) between Computer Associates and the Company, Computer Associates contributed and transferred to the Company the assets and liabilities constituting the ACCPAC International, Inc. division of Computer Associates. The assets and liabilities transferred to the Company were recorded at Computer Associates' carryover basis.
In connection with the Contribution Agreement, the Company issued 10,500,000 shares of common stock to Computer Associates and issued a note payable to Computer Associates in the amount of $5,000,000. The note payable to Computer Associates was paid during the fiscal year ended March 31, 2000.
- (c)
- Interim Financial Statements
The consolidated financial statements include allocations from Computer Associates, primarily of expenses directly related to the Company. Allocations of expenses from Computer Associates to the Company are primarily comprised of actual costs associated with payroll, benefits, rent, business acquisitions and income taxes. These allocations have been determined on bases that Computer Associates and the Company considered to be a reasonable reflection of the utilization of services provided or the benefit received by the Company. The allocation methods include relative sales, headcount and square footage.
The accompanying consolidated financial statements may not necessarily reflect the consolidated financial position, results of operations, changes in stockholders' equity (deficit) and cash flows of the Company in the future or what they would have been had it been a separate, stand-alone entity during all of the periods presented.
The unaudited interim financial information for the nine months ended December 31, 2001 and the audited interim financial information for the nine months ended December 31, 2002, have been prepared in accordance with accounting principles generally accepted in the United States. In the opinion of the Company's management, the interim consolidated financial statements have been prepared on the same basis as the annual consolidated financial statements and include all adjustments necessary for the
F-7
- (d)
- Consolidation
fair presentation of the Company's interim financial information. The results of the nine months ended December 31, 2002 are not necessarily indicative of the results to be expected for the year ending March 31, 2003.
- (e)
- Use of Estimates
The consolidated financial statements include the accounts of the Company and its wholly owned subsidiaries, ACCPAC Africa Pty Ltd. (South Africa), ACCPAC Australia Pacific, Inc. (Australia), ACCPAC Canada Inc. (Canada), ACCPAC Europe Ltd. (Ireland), ACCPAC India Pvt. Ltd. (India), ACCPAC Mexico, S.A. de C.V. (Mexico), ACCPAC Software International Pte Ltd. (Singapore) and ACCPAC UK Ltd. (UK). All significant intercompany balances and transactions have been eliminated in consolidation. ACCPAC Europe Ltd. and ACCPAC UK Ltd. include the subsidiaries formerly comprising eWare Limited.
- (f)
- Foreign Currency
The preparation of the consolidated financial statements in conformity with accounting principles generally accepted in the United States of America requires management to make estimates and assumptions that affect the reported amounts of assets and liabilities and disclosure of contingent assets and liabilities at the date of the consolidated financial statements, and the reported amounts of revenue and expenses during the reporting period. Actual results could differ from those estimates.
- (g)
- Comprehensive Income (Loss)
The financial statements of foreign subsidiaries (for which the local currency is the functional currency) are translated into U.S. dollars using the current exchange rate at the balance sheet date for assets and liabilities and a weighted-average rate for the period for revenue and expenses. The cumulative adjustments that result from these translations are included in accumulated other comprehensive loss. Transaction gains or losses, which to date have not been significant, are included in operating results.
Comprehensive income (loss) is a measure of all changes in equity of an enterprise that result from transactions and other economic events of the period other than transactions with stockholders. Comprehensive income (loss) is the total of net income (loss) and all other non-owner changes in equity. The only component of comprehensive income (loss), other than net income (loss), relates to foreign currency translation. The tax effects related to foreign currency translation are not significant.
F-8
- (h)
- Cash and Cash Equivalents
- (i)
- Inventories
The Company considers all highly liquid debt instruments with maturities of three months or less when acquired to be cash equivalents.
- (j)
- Property and Equipment
Inventories, which consist primarily of finished software products, documentation and packaging materials, are carried at the lower of cost (weighted-average method) or market (net realizable value).
Property and equipment are stated at cost, less accumulated depreciation. Depreciation is calculated using the straight-line method over the estimated useful lives of the related assets as follows:
| Computer equipment and software | 3 years | |
| Furniture and fixtures | 7 years |
- (k)
- Goodwill and Other Intangibles
Leasehold improvements are amortized over the lesser of the estimated useful life or the lease term.
Goodwill, purchased technology and certain other intangible assets are stated at cost less accumulated amortization.
The Financial Accounting Standards Board (FASB) issued Statement of Financial Accounting Standards, (SFAS) No. 142Goodwill and Other Intangible Assets, in July 2001. SFAS 142 requires that identifiable intangible assets with an indefinite life not be amortized until their life is determined to be finite and all other intangible assets to be amortized over their useful life. SFAS 142 also requires that goodwill not be amortized but instead be tested for impairment in accordance with the provisions of SFAS 142 at least annually and more frequently upon the occurrence of certain events.
The Company adopted SFAS 142 effective April 1, 2002. In connection with the adoption of SFAS 142, the Company determined the following as of April 1, 2002: (i) the Company had one reporting unit which is the same as its operating segment; and (ii) the original estimated lives of other intangibles with definite lives were appropriate.
As required by SFAS 142, the Company ceased amortization of its goodwill associated with all acquisitions. Prior to April 1, 2002, the Company amortized goodwill arising from acquisitions over five years using the straight-line method. The Company concluded that
F-9
- (l)
- Impairment of Long-Lived Assets
none of its other intangible assets had lives that were considered to be indefinite. During the quarter ended September 30, 2002 the Company completed the transitional impairment test under SFAS 142. The results of the transitional impairment test indicated that the fair value of the reporting unit exceeded its carrying value. Accordingly, there is no indicator of goodwill impairment. Goodwill will be tested for impairment annually during the third quarter. During the quarter ended December 31, 2002, the Company tested goodwill for impairment under SFAS No. 142. The results of the annual impairment test indicated that the fair value of the reporting unit exceeded its carrying value. Accordingly, no impairment charge was recorded.
Identifiable intangibles with definite lives are currently amortized over five years using the straight-line method.
Prior to April 1, 2002, the Company accounted for long-lived assets, including goodwill and certain identifiable intangibles, in accordance with the provisions of SFAS No. 121,Accounting for the Impairment of Long-Lived Assets and for Long-Lived Assets to Be Disposed Of. SFAS No. 121 requires that long-lived assets and certain identifiable intangibles be reviewed for impairment whenever events or changes in circumstances indicate that the carrying amount of an asset may not be recoverable. Recoverability of assets to be held and used is measured by a comparison of the carrying amount of an asset to future undiscounted net cash flows expected to be generated by the asset. If such assets are considered impaired, the impairment to be recognized is measured by the amount by which the carrying value of the assets exceeds the fair value of the assets. Assets to be disposed of are reported at the lower of their carrying amount or fair value, less cost to sell.
On April 1, 2002, the Company adopted SFAS No. 144,Accounting for the Impairment or Disposal of Long-Lived Assets. SFAS 144 addresses financial accounting and reporting for the impairment or disposal of long-lived assets and supersedes SFAS 121 and the accounting and reporting provisions of APB No. 30,Reporting the Results of Operations — Reporting the Effects of Disposal of a Segment of a Business, and Extraordinary, Unusual and Infrequently Occurring Events and Transactions, for the disposal of a segment of a business (as previously defined in APB No. 30). SFAS 144 also amends Accounting Research Bulletin No. 51,Consolidated Financial Statements, to eliminate the exception to consolidation for subsidiaries for which control is likely to be temporary. The adoption of SFAS 144 did not have a material effect on the Company's consolidated financial statements.
F-10
- (m)
- Revenue Recognition
The Company primarily derives revenue from perpetual software licenses, maintenance and third-party product sales and hosted applications. Maintenance includes telephone support and rights to updates on a when-and-if-available basis. The Company recognizes revenue in accordance with American Institute of Certified Public Accountants (AICPA) Statement of Position (SOP) 97-2,Software Revenue Recognition and SOP 98-9,Modification of SOP 97-2, Software Revenue Recognition, with Respect to Certain Transactions.
The Company recognizes the revenue allocable to software licenses and third-party products upon shipment to its value-added resellers, net of an allowance for estimated returns, provided the fee is fixed or determinable, persuasive evidence of an arrangement exists, collectibility of the fee is probable and vendor-specific objective evidence of the fair value of all undelivered elements has been established. The allowance for estimated returns is determined based upon an analysis of historical experience.
The fee the Company's customers pay for products is negotiated at the outset of an arrangement and is generally based on the specific volume of product to be delivered. Therefore, the Company's fees are considered to be fixed and determinable at the inception of an arrangement.
If collectibility is not considered probable, revenue is recognized when the fee is collected. Collectibility is assessed on a reseller-by-reseller basis and, where applicable, on a customer-by-customer basis. The Company typically sells to established resellers from which there is a history of successful collection. New resellers are subjected to a credit review process, which evaluates the reseller's financial position and ultimately their ability to pay. New resellers are typically assigned a credit limit based on a review of their financial position. Such credit limits are maintained and only increased after a successful collection history with the reseller has been established.
On sales to its distributors, the Company recognizes revenue allocable to software licenses upon "sell-through" to the end user. The Company receives sales reports and on-hand inventory information from its distributors on a regular basis to determine the appropriate amount of revenue to recognize.
The Company recognizes the revenue allocable to hosted applications and material set-up fees ratably over the term of the agreement. Revenue attributable to hosted services typically consists of initial set-up fees and monthly recurring fees for access to one or more of the Company's products on-line.
F-11
- (n)
- Fair Value of Financial Instruments and Concentration of Credit Risk
The Company has established sufficient vendor-specific objective evidence (VSOE) to ascribe a fair value to maintenance customer support based on the price charged when maintenance is sold separately. Customers typically purchase maintenance agreements annually. The Company recognizes revenue from maintenance and support agreements ratably over the term of the agreement, which is typically one year.
The Company receives revenue from training services and consulting services which are generally short-term in duration. This revenue is generally recognized upon completion of the services and is included in maintenance and other revenue. VSOE for consulting services is based on standard billing rates for the individuals providing services. These rates are the same rates charged when the services are sold separately. The Company bases VSOE for training on standard rates charged for each particular training course. These rates are the rates charged when the training is sold separately.
Total cost of revenue consists of cost of license revenue, cost of service revenue, cost of third-party products revenue and amortization of capitalized acquired technology. Cost of license revenue includes royalties to third parties for software embedded in the Company's products and the costs of documentation, delivery and packaging. Cost of service revenue includes salaries and related expenses for the customer support organization and associated overhead expenses. Cost of third-party products revenue includes the cost paid by the Company for third-party software sold to the Company's customers. Amortization of capitalized acquired technology relates to technology that was recorded as a result of the Company's acquisitions.
In November 2001, the Emerging Issues Task Force (EITF) reached a consensus on EITF 01-14,Income Statement Characterization of Reimbursements Received for "Out-of-Pocket" Expenses Incurred. EITF 01-14 requires companies to record certain reimbursements received for out-of-pocket expenses as revenue instead of an offset to the related expense. Upon application of EITF 01-14, comparative financial statements for prior periods must be reclassified to comply with the guidance in this announcement. The Company adopted the provisions of EITF 01-14 as of April 1, 2002. The adoption of EITF 01-14 did not have a material impact on the Company's consolidated financial position, results of operations or cash flows, and as a result, the Company did not reclassify prior period results.
The carrying amounts for cash and cash equivalents, accounts receivable, payable to Computer Associates and accounts payable, approximate fair value due to the short-term nature of these instruments. The fair market value of the Company's outstanding note
F-12
- (o)
- Software Development Costs
payable to Computer Associates approximates its carrying value based upon current market rates of interest.
Financial instruments that potentially subject the Company to concentrations of credit risk consist primarily of cash and cash equivalents and accounts receivable. The Company's cash and cash equivalents are maintained with highly accredited financial institutions. The Company sells its software products to established companies throughout the world and generally does not require collateral on accounts receivable. To date, the Company has had minimal write-offs of accounts receivable and maintains an allowance for doubtful accounts receivable based upon expected credit losses.
- (p)
- Advertising Costs
The Company accounts for software development costs in accordance with SFAS No. 86,Accounting for Costs of Computer Software to Be Sold, Leased, or Otherwise Marketed, under which certain development costs incurred subsequent to the establishment of technological feasibility are capitalized and amortized over the estimated lives of the related products. Technological feasibility is established upon completion of a working model. To date, no software development costs have been capitalized.
The Company accounts for the costs of computer software developed or obtained for internal use in accordance with SOP 98-1,Accounting for the Costs of Computer Software Developed or Obtained for Internal Use. This statement requires that certain costs incurred during a software development project be capitalized. To date, such capitalizable software development costs have not been material.
- (q)
- Stock-Based Compensation
Advertising costs are expensed as incurred. These amounts are included in sales and marketing expenses in the accompanying consolidated financial statements. Such costs were approximately $6.8 million, $8.4 million, $15.1 million and $8.3 million for the years ended March 31, 2000, 2001 and 2002, and the nine months ended December 31, 2002, respectively.
The Company accounts for employee stock options in accordance with Accounting Principles Board (APB) Opinion No. 25,Accounting for Stock Issued to Employees.
SFAS 123,Accounting for Stock-Based Compensation, established accounting and disclosure requirements using a fair-value method of accounting for stock-based employee compensation plans. As allowed by SFAS 123, the Company elected to continue to apply
F-13
- (r)
- Income Taxes
the intrinsic-value method of accounting under APB No. 25, and has adopted only the disclosure requirements of SFAS 123.
- (s)
- Recent Accounting Pronouncements
Income taxes are accounted for under the asset and liability method. Deferred tax assets and liabilities are recognized for the future tax consequences attributable to differences between the financial statement carrying amounts of existing assets and liabilities and their respective tax bases and operating loss and tax credit carryforwards. Deferred tax assets and liabilities are measured using enacted tax rates expected to apply to taxable income in the years in which those temporary differences are expected to be recovered or settled. The effect on deferred tax assets and liabilities of a change in tax rates is recognized in income in the period that includes the enactment date.
The Company's operating results are included in the consolidated income tax returns of Computer Associates. Under the terms of the Company's tax allocation agreement with Computer Associates, the Company is required to pay to Computer Associates an amount computed at 37.5% of the Company's earnings before income taxes as presented in the Company's consolidated financial statements, subject to certain modifications. In addition, the Company will receive a tax benefit payment from Computer Associates computed as 37.5% of the Company's loss before income taxes for periods in which losses are reported. Any material difference between the income tax provision (benefit) calculated as if the Company were a separate taxpayer and the 37.5% provision (benefit) is recorded as an increase or decrease to additional paid-in capital. Also see Note 14(a).
In June 2002, the FASB issued Statement of Financial Accounting Standards No. 146,Accounting for Costs Associated with Exit or Disposal Activities, effective for exit or disposal activities initiated after December 31, 2002. Under the new rules, a liability for a cost associated with an exit or disposal activity must only be recognized when the liability is incurred. Under previous guidance, liabilities for exit costs were recognized at the date of an entity's commitment to an exit plan. The Company does not expect the adoption of SFAS No. 146 to have a material impact on its consolidated financial statements.
In November 2002, the FASB issued Interpretation No. 45,Guarantor's Accounting and Disclosure Requirements for Guarantees, Including Indirect Guarantees of Indebtedness of Others. For guarantees issued or modified after December 31, 2002, a liability must be recognized for the fair value of the obligation undertaken in issuing the guarantee. The Company does not expect the adoption of FASB Interpretation No. 45 to have a material effect on its consolidated financial statements.
F-14
In December 2002, the FASB issued Statement of Financial Accounting Standards No. 148,Accounting for Stock-Based Compensation—Transition and Disclosure—an Amendment of FASB Statement No. 123. SFAS No. 148 amends SFAS No. 123,Accounting for Stock-Based Compensation, to provide alternative methods of transition for a voluntary change to the fair value based method of accounting for stock-based employee compensation. In addition, SFAS No. 148 amends the disclosure requirements of SFAS No. 123 to require prominent disclosures in both annual and interim financial statements about the method of accounting for stock-based employee compensation and the effect of the method used on reported results. The Company does not expect the adoption of SFAS No. 148, effective for fiscal years ending after December 15, 2002, to have a material effect on its financial statements.
In January 2003, the FASB issued Interpretation No. 46,Consolidation of Variable Interest Entities, an Interpretation of ARB No. 51. This Interpretation provides guidance for determining a primary beneficiary period. The effective date of Interpretation No. 46 is the first interim period beginning after June 15, 2003 for variable interest entities acquired before February 1, 2003 and immediately to variable interest entities created after January 31, 2003. The Company does not expect the adoption of FASB Interpretation No. 46 to have a material effect on its consolidated financial statements.
(2) Accounts Receivable
Changes in the Company's allowance for doubtful accounts for the years ended March 31, 2000, 2001 and 2002, and the nine months ended December 31, 2002, are as follows (in thousands):
| | Beginning Balance | Additions | Deductions | Ending Balance | ||||||||
|---|---|---|---|---|---|---|---|---|---|---|---|---|
| Year ended March 31, 2000 | $ | 860 | $ | 355 | $ | 106 | $ | 1,109 | ||||
| Year ended March 31, 2001 | $ | 1,109 | $ | 686 | $ | 283 | $ | 1,512 | ||||
| Year ended March 31, 2002 | $ | 1,512 | $ | 546 | $ | 749 | $ | 1,309 | ||||
| Nine months ended December 31, 2002 | $ | 1,309 | $ | 277 | $ | 495 | $ | 1,091 | ||||
Deductions include all charges against the allowance for doubtful accounts. These deductions were made in the normal course of business and only for the specific use for which the allowance was identified and intended.
F-15
(3) Property and Equipment
Property and equipment consisted of the following (in thousands):
| | March 31, | | |||||||
|---|---|---|---|---|---|---|---|---|---|
| | December 31, 2002 | ||||||||
| | 2001 | 2002 | |||||||
| Computer equipment and software | $ | 4,562 | $ | 4,675 | $ | 5,567 | |||
| Furniture and fixtures | 1,795 | 1,781 | 1,952 | ||||||
| Leasehold improvements | 566 | 696 | 742 | ||||||
| 6,923 | 7,152 | 8,261 | |||||||
| Less accumulated depreciation | 2,132 | 3,782 | 5,446 | ||||||
| $ | 4,791 | $ | 3,370 | $ | 2,815 | ||||
(4) Goodwill and Other Intangible Assets
- (a)
- Goodwill and other intangible assets consisted of the following (in thousands):
| | March 31, | | |||||||||
|---|---|---|---|---|---|---|---|---|---|---|---|
| | December 31, 2002 | ||||||||||
| | 2001 | 2002 | |||||||||
| Goodwill | $ | 18,868 | $ | 18,538 | $ | 23,617 | |||||
| Less accumulated amortization | 2,105 | 5,756 | 5,851 | ||||||||
| Goodwill, net | $ | 16,763 | $ | 12,782 | $ | 17,766 | |||||
| Other intangible assets | |||||||||||
| Customer relationships | $ | 14,464 | $ | 14,180 | $ | 15,757 | |||||
| Less accumulated amortization | 2,672 | 5,433 | 7,673 | ||||||||
| 11,792 | 8,747 | 8,084 | |||||||||
Acquired technology | 8,187 | 8,187 | 10,267 | ||||||||
| Less accumulated amortization | 1,622 | 3,261 | 4,489 | ||||||||
| 6,565 | 4,926 | 5,778 | |||||||||
Total other intangibles, net | $ | 18,357 | $ | 13,673 | $ | 13,862 | |||||
F-16
- (b)
- As discussed in Note 1, the Company adopted SFAS 142 on April 1, 2002. The Company ceased amortizing goodwill on April 1, 2002. A reconciliation of previously reported net income (loss) and net income (loss) per share to the amounts adjusted for the exclusion of amortization of goodwill for the three years ended March 31, 2000, 2001 and 2002 and the nine-months ended December 31, 2001 and 2002 is as follows (in thousands, except per share amounts):
| | Years Ended March 31, | Nine Months Ended December 31, | |||||||||||||
|---|---|---|---|---|---|---|---|---|---|---|---|---|---|---|---|
| | 2000 | 2001 | 2002 | 2001 | 2002 | ||||||||||
| | | | | (unaudited) | | ||||||||||
| Net income (loss) as reported | $ | 6,187 | $ | (11,167 | ) | $ | (10,564 | ) | $ | (13,236 | ) | $ | 2,569 | ||
| Amortization | 133 | 1,978 | 3,720 | 2,812 | — | ||||||||||
| Adjusted net income (loss) | $ | 6,320 | $ | (9,189 | ) | $ | (6,844 | ) | $ | (10,424 | ) | $ | 2,569 | ||
| Adjusted net income (loss) per common share —basic | $ | 0.59 | $ | (0.85 | ) | $ | (0.64 | ) | $ | (0.97 | ) | $ | 0.24 | ||
| Adjusted net income (loss) per common share — diluted | $ | 0.57 | $ | (0.85 | ) | $ | (0.64 | ) | $ | (0.97 | ) | $ | 0.23 | ||
F-17
Other intangible assets are displayed in the consolidated balance sheets net of accumulated amortization. Amortization expense, in thousands, related to these intangible assets was $204, $4,013, $4,483 and $3,369 for the years ended March 31, 2000, 2001, 2002 and the nine months ended December 31, 2002, respectively.
The future estimated amortization expense related to these intangible assets for the remaining three months of fiscal year 2003 and each of the fiscal years ending through 2008 as of December 31, 2002 is as follows:
| | Year Ending March 31, | ||
|---|---|---|---|
| | (in thousands) | ||
| 2003 | $ | 1,294 | |
| 2004 | 5,177 | ||
| 2005 | 4,901 | ||
| 2006 | 1,291 | ||
| 2007 | 687 | ||
| 2008 | 512 | ||
(5) Business Combinations
- (a)
- Software Business Technologies, Inc.
- (b)
- LA Technologies (Proprietary) Ltd.
In July 2000, the Company completed its acquisition of Software Business Technologies, Inc. (SBT). The acquisition has been accounted for as a purchase, and accordingly, the total purchase price of approximately $31.7 million in cash has been allocated to the tangible and intangible assets acquired and the liabilities assumed based on their respective fair values on the acquisition date. Prior to April 1, 2002, goodwill and other intangible assets were amortized on a straight-line basis over five years. On April 1, 2002, the Company ceased amortizing goodwill as a result of adopting SFAS 142. SBT's results of operations have been included in the consolidated financial statements from its date of acquisition.
In July 2000, the Company completed its acquisition of LA Technologies (Proprietary) Ltd. (LA Technologies). The acquisition has been accounted for as a purchase, and accordingly, the total purchase price of approximately $2.6 million in cash has been allocated to the tangible and intangible assets acquired and the liabilities assumed based on their respective fair values on the acquisition date. Prior to April 1, 2002, goodwill and other intangible assets were amortized on a straight-line basis over
F-18
- (c)
- Smart Business Systems Pty Ltd.
five years. On April 1, 2002, the Company ceased amortizing goodwill as a result of adopting SFAS 142. LA Technologies' results of operations have been included in the consolidated financial statements from its date of acquisition.
- (d)
- eWare Limited
In November 2000, the Company completed its acquisition of Smart Business Systems Pty Ltd. (Smart Business Systems). The acquisition has been accounted for as a purchase, and accordingly, the total purchase price of approximately $1.0 million in cash has been allocated to the tangible and intangible assets acquired and the liabilities assumed based on their respective fair values on the acquisition date. Prior to April 1, 2002, goodwill and other intangible assets were being amortized on a straight-line basis over five years. On April 1, 2002 the Company ceased amortizing goodwill as a result of adopting SFAS 142. Smart Business Systems' results of operations have been included in the consolidated financial statements from its date of acquisition.
On December 18, 2002, the Company acquired eWare Limited (eWare), a privately held developer of customer relationship management software products for small and midsize businesses, to enhance its future product development.
The Company acquired all of the outstanding shares of stock of eWare in exchange for $1.8 million in cash and 761,110 shares of the Company's common stock. In connection with the acquisition, the Company issued 69,445 shares of restricted common stock to eWare executives and committed to issue another 113,889 restricted shares of common stock to eWare employees. The restricted shares vest over periods of one to three years, subject to continued employment. $1.6 million has been recognized as deferred stock compensation related to these shares of restricted common stock based on the fair value of the Company's common stock of $9.00 per share. Of the shares we issued as acquisition consideration and as compensation to eWare executives, 707,220 shares are subject to a put option, entitling the stockholders to sell their shares to the Company for $5.82 per share, and a call option, entitling the Company to buy shares from the stockholders for $10.85 per share. Both options are exercisable at any time during the 28-day period beginning November 19, 2003, and will terminate at the earlier of December 17, 2003, or the last business day prior to the effectiveness of a registration statement relating to the initial public offering of the Company's common stock.
F-19
The acquisition of eWare was accounted for as a purchase. The aggregate preliminary purchase price of approximately $9.4 million includes the following (in thousands):
| Value of common stock | $6,850 | |
| Cash paid | 1,750 | |
| Direct acquisition costs | 958 | |
| Value of put and call options | (158) | |
| $9,400 | ||
The aggregate value of common stock issued reflects the fair value of the Company's common stock of $9.00 per share.
The total preliminary purchase price has been allocated to eWare's net tangible and identifiable intangible assets based upon their estimated fair value as of the date of acquisition. $0.1 million of the purchase price was allocated to in-process research and development and expensed at the time of the acquisition. The other identifiable acquired intangibles will be amortized over their estimated useful lives of five years. The residual purchase price has been recorded as goodwill. In accordance with SFAS No. 142,Goodwill and Other Intangible Assets, goodwill relating to the eWare acquisition will not be amortized, but will be carried at cost and tested for impairment annually or whenever events indicate that impairment may have occurred.
The results of eWare's operations subsequent to December 18, 2002 have been included in the Company's operating results for the nine months ended December 31, 2002. The total preliminary purchase price and purchase price allocation is subject to adjustments based upon finalization of management's estimates of the direct costs of the acquisition and the realization of net assets acquired.
F-20
- (e)
- Purchase Price Allocations
The total consideration paid for each of the acquisitions was allocated to the assets acquired and liabilities assumed based on fair values as follows (in thousands):
| | SBT Accounting Systems | LA Technologies | Smart Business Systems | eWare Limited | ||||||||
|---|---|---|---|---|---|---|---|---|---|---|---|---|
| Net tangible assets | $ | 1,253 | $ | 236 | $ | 17 | $ | 1,136 | ||||
| In-process research and development | 3,900 | — | — | 110 | ||||||||
| Developed technology | 5,800 | — | — | 2,080 | ||||||||
| Customer relationships | 13,200 | 1,110 | 290 | 1,320 | ||||||||
| Deferred tax liabilities attributable to identifiable intangible assets | (7,871 | ) | — | — | — | |||||||
| Goodwill | 15,445 | 1,290 | 640 | 4,754 | ||||||||
| $ | 31,727 | $ | 2,636 | $ | 947 | $ | 9,400 | |||||
- (f)
- Purchased In-Process Research and Development
The portion of the SBT purchase price allocated to in-process research and development (IPR&D) was $3.9 million and was expensed during the year ended March 31, 2001. As of the acquisition date, SBT was in the process of developing technology related to its Nova software project. The IPR&D had not yet reached technological feasibility and had no alternative use. The technological feasibility of in-process development efforts is established when the enterprise has completed all planning, designing, coding and testing activities that are necessary to establish that the technology can be utilized to meet its design specifications including functions, features and technical performance requirements.
The estimated costs to complete this acquired in-process research and development as of the date of the acquisition was $0.6 million. The remaining activities consisted primarily of coding and testing activities. The Company invested approximately $0.3 million in research and development costs from the date of acquisition through March 31, 2001. However, during the year ended March 31, 2002, no research and development costs related to the development of this product were incurred as the Company discontinued the project.
The portion of the eWare purchase price allocated to IPR&D was $0.1 million and was expensed during the nine months ended December 31, 2002. The IPR&D had not
F-21
- (g)
- Pro forma Results of Operations (Unaudited)
reached technological feasibility, and, in the opinion of management, has no alternative future use.
The table presented below, prepared on an unaudited pro forma basis, combines the Company's consolidated results of operations with the results of operations of SBT, LA Technologies, Smart Business Systems and eWare as if each company had been acquired as of April 1, 1999. The pro forma results of operations include the impact of amortization of goodwill, intangible assets for all acquisitions, the IPR&D charge for the eWare acquisition and reflect the elimination of all intercompany activity between eWare and the Company (in thousands, except per share data):
| | Years Ended March 31, | Nine Months Ended December 31, | |||||||||||
|---|---|---|---|---|---|---|---|---|---|---|---|---|---|
| | 2000 | 2001 | 2002 | 2002 | |||||||||
| Revenue | $ | 97,777 | $ | 96,184 | $ | 81,938 | $ | 65,244 | |||||
| Net income (loss) | $ | 5,451 | $ | (16,400 | ) | $ | (15,098 | ) | $ | 1,578 | |||
| Net income (loss) per share: | |||||||||||||
| Basic | $ | 0.47 | $ | (1.40 | ) | $ | (1.29 | ) | $ | 0.13 | |||
| Diluted | $ | 0.45 | $ | (1.40 | ) | $ | (1.29 | ) | $ | 0.13 | |||
The pro forma results are not necessarily indicative of what would have occurred if the acquisitions had been in effect for the periods presented. In addition, they are not intended to be a projection of future results and do not reflect any synergies that might be achieved from combined operations.
(6) Related Party Activity with Computer Associates International, Inc.
As described in footnote 1, the Company has entered into various transactions with Computer Associates. The table below summarizes the activity of such transactions with and amounts payable to Computer Associates as of and for the years ended March 31,
F-22
2000, 2001 and 2002 and the nine months ended December 31, 2002, consisted of the following (in thousands):
| | Years Ended March 31, | Nine Months Ended December 31, 2002 | ||||||||||||
|---|---|---|---|---|---|---|---|---|---|---|---|---|---|---|
| | 2000 | 2001 | 2002 | |||||||||||
| Beginning payable balance | $ | 7,874 | $ | 12,258 | $ | 39,205 | $ | 8,464 | ||||||
Additions: | ||||||||||||||
| Allocation of costs primarily related to payroll, benefits and rent | 1,682 | 5,828 | 5,303 | 656 | ||||||||||
| Advances related to acquisitions | 3,292 | 30,109 | — | 79 | ||||||||||
| Accrued interest on long-term interest-bearing note | — | — | 2,007 | (1,775 | ) | |||||||||
| Income taxes payable | 4,187 | — | — | 1,560 | ||||||||||
| Cash advances | 1,998 | 6,670 | 6 | — | ||||||||||
| Other | 66 | — | — | — | ||||||||||
Deletions: | ||||||||||||||
| Cash payments | (5,000 | ) | (9,425 | ) | (3,583 | ) | — | |||||||
| Income tax receivable | — | (2,034 | ) | (5,741 | ) | — | ||||||||
| Credit for cash collected by Computer Associates on accounts receivable | (1,833 | ) | (4,201 | ) | (2,033 | ) | (241 | ) | ||||||
| Conversion of payable to long-term interest-bearing note | — | — | (26,700 | ) | — | |||||||||
| Other | (8 | ) | — | — | — | |||||||||
| Ending payable balance | $ | 12,258 | $ | 39,205 | $ | 8,464 | $ | 8,743 | ||||||
F-23
The weighted average outstanding balance payable to Computer Associates for the years ended March 31, 2000, 2001 and 2002 and the nine months ended December 31, 2002 was approximately $8.9 million, $28.9 million, $8.4 million and $8.0 million, respectively. With the exception of 9% interest paid on the $5.0 million note related to the Contribution Agreement and the 5.5% interest that is currently charged on the $26.7 million long-term interest-bearing note as discussed below, Computer Associates has not charged the Company interest on the outstanding payable for any period presented.
In April 2001, $26.7 million of the payable to Computer Associates was converted into a long-term interest-bearing note. From April 1, 2001 to March 31, 2002 the interest rate on this note was 7.5% per annum. From April 1, 2002 until the note is fully paid the interest rate is 5.5% per annum. As of April 15, 2002 the Company began making quarterly payments of $1.3 million plus any accrued interest. The note becomes due and payable upon the earlier of: (i) the consummation of a public offering of more than 1,000,000 shares, (ii) upon transfer of ownership of more than 20% of the outstanding common stock of the Company, or (iii) a sale of substantially all of the assets of the Company.
On November 13, 2002, the promissory note was amended to provide that the Company will pay Computer Associates the remaining amount payable as of the closing date of the initial public offering of the Company's stock, estimated to be approximately $10.9 million, over 16 years. The amendment will take effect upon the closing of this offering. Commencing the first day of the month after the expiration of 15 months following the closing of this offering, the Company will be obligated to repay principal and interest, at the 10-year treasury note rate plus 0.5%, quarterly. The rate will be reset April 1 of each year to the 10-year treasury note rate then in effect.
Occasionally, customers of Computer Associates will send remittances to the Company's lock box bank account. The Company will subsequently forward these funds to Computer Associates. Given that the Company does not have any ownership rights to these funds, such transactions are not reflected in the Company's consolidated financial statements. The Company has excluded cash totaling $6.6 million from its consolidated balance sheet as of March 31, 2002. This cash was received by the Company from a customer of Computer Associates. The Company remitted the cash to Computer Associates during April 2002 and July 2002.
Tax Sharing Arrangement
Upon the closing of the Company's initial public offering, the tax sharing arrangement with Computer Associates, as defined in an agreement with Computer Associates, will be terminated. As of December 31, 2002, the Company and Computer Associates determined that remaining outstanding tax obligation resulting from the termination of
F-24
- •
- Toronto facility, $35,000; and
- •
- United Kingdom facility, $84,000.
the tax sharing arrangement is approximately $2.3 million. This amount is due and payable to Computer Associates and is included in the net settlement of $1.5 million described in Intercompany Advances.
Intercompany Advances
On November 13, 2002, Computer Associates agreed to forgive a portion of its intercompany advances, which include the settlement of the tax sharing arrangement, to the Company in the event the Company completes an initial public offering. The forgiveness of the intercompany advances will be recorded as a contribution to paid-in capital. The amount of intercompany advances that will ultimately be forgiven will be determined on the closing date of the initial public offering. Had the closing of an initial public offering occurred on December 31, 2002, the Company would have settled the intercompany obligation to Computer Associates for $1.5 million. At December 31, 2002, the Company had recorded intercompany obligations to Computer Associates of approximately $8.7 million. Although no transactions with Computer Associates are presently contemplated, there may be intercompany transactions in the ordinary course of business which will be reflected in the intercompany account.
Real Estate Agreement
In April 1998, the Company entered into a real estate agreement with Computer Associates under which it leases premises from Computer Associates. Under the real estate agreement the Company leases its Toronto and United Kingdom facilities. The allocation of the Company's portion of the lease obligations has been determined based on square footage, a basis that Computer Associates and the Company considered to be a reasonable reflection of the benefit received by the Company. The Company's approximate annual obligations under each is as follows:
The Toronto lease and the United Kingdom facility license will continue upon the closing of this offering. The term of the Toronto lease runs through September 2005. The United Kingdom facility lease does not have a termination date, but both the Toronto lease and the United Kingdom facility lease may be terminated at any time by either party upon six months' prior notice.
In February 2001, a subsidiary of Computer Associates assigned the Company its lease for the Company's Richmond, British Columbia facility. The Company's approximate annual obligation for this property is $896,000. The term of this lease runs through November 2007.
F-25
(7) Line of Credit
On December 12, 2001, the Company entered into a $5.0 million revolving credit agreement and promissory note (revolver) with Computer Associates. The revolver bears interest at the rate or rates payable by Computer Associates on funds borrowed by Computer Associates. Outstanding amounts are due upon demand and the revolver expires on December 31, 2003. All amounts outstanding are due and payable within 10 days in the event a change in ownership that exceeds 5% of the Company's outstanding common stock. As of December 31, 2002, no amounts were outstanding under this arrangement.
(8) Savings Plans
The majority of the Company's employees are eligible to participate in savings plans sponsored by Computer Associates. The plans allow employees to contribute a portion of their pretax salaries in accordance with specified guidelines. The Company matches a certain percentage of employee contributions up to certain limits. Computer Associates also maintains a profit sharing plan. The Company's expense related to the Computer Associates savings plans was approximately $0.6 million, $0.8 million, $0.8 million and $0.6 million for the years ended March 31, 2000, 2001 and 2002 and the nine months ended December 31, 2002, respectively.
(9) Leases
The Company leases certain of its facilities and equipment under noncancelable operating lease agreements with terms ranging up to seven years. The following is a schedule by year of future noncancelable minimum lease payments under operating leases for the remaining three-months of fiscal year 2003 and each of the fiscal years through 2007 and thereafter as of December 31, 2002 (in thousands):
| Year Ending March 31, | | ||
|---|---|---|---|
| 2003 | $ | 745 | |
| 2004 | 2,299 | ||
| 2005 | 2,435 | ||
| 2006 | 2,396 | ||
| 2007 | 2,340 | ||
| Thereafter | 2,454 | ||
| Total minimum lease payments | $ | 12,669 | |
F-26
Rental expense under operating leases for the years ended March 31, 2000, 2001 and 2002 and the nine months ended December 31, 2002 was approximately $0.9 million, $2.5 million, $2.8 million and $1.8 million, respectively.
During the year ended March 31, 2002, the Company subleased office space to a third party. The Company received payments of $0.2 million during fiscal 2002 and $0.2 million during the nine months ended December 31, 2002 and will receive payments of $0.1 million, $0.5 million, $0.5 million, $0.5 million, $0.5 million and $0.1 million for the remaining three months of fiscal years 2003 and in fiscal years 2003, 2004, 2005, 2006, 2007 and thereafter, respectively.
(10) Equity and Stock Compensation
(a) Capitalization
In August 2002, the Company amended its certificate of incorporation to increase the number of authorized shares of common stock to 100,000,000 and to increase the number of authorized shares of preferred stock to 5,000,000.
(b) Options to Purchase Common Stock in Computer Associates
Prior to January 1, 1998, options to purchase common stock of Computer Associates were issued to the Company's employees while the Company was a division of Computer Associates. As of March 31, 2000, 2001, 2002 and December 31, 2002, options to purchase approximately 95,200, 84,000, 68,719 and 61,455 shares, respectively, were outstanding. During the years ended March 31, 2001 and 2002, approximately 9,200 and 8,693 shares were exercised, and for the nine month period ended December 31, 2002 approximately 1,935 shares were exercised, respectively.
(c) 1998 Stock Incentive Plan
The Company's 1998 Stock Incentive Plan (the Plan) as amended in April 2002 was approved by the board of directors in January 1998. The Plan provides for the grant of incentive stock options, nonstatutory stock options and stock purchase rights to employees. The Company initially reserved 5,000,000 shares of common stock for issuance under the Plan. In August 2002, the Company reduced to 2,690,500 the number of shares of common stock that may be issued under the Plan. The Plan expires in 2008. Pursuant to the Plan, the exercise price may not be less than the fair market value of common stock on the date of grant determined by the Company's board of directors. Stock options expire no later than 10 years from the date of grant. Vesting provisions for
F-27
options granted under the Plan are determined by the board of directors. Options generally vest ratably over a 5-year period.
(d) 2002 Stock Incentive Plan
In August 2002, the Company adopted the 2002 Stock Incentive Plan (the 2002 Plan) which provides for the issuance of 2,309,500 shares of common stock. The 2002 Plan expires in 2012. Pursuant to the 2002 Plan, the exercise price of an option granted may not be less than the fair market value of the Company's common stock on the date of grant determined by the Company's board of directors. Stock options expire no later than 10 years from the date of grant. Vesting provisions for options granted under the 2002 Plan are determined by the board of directors. Options generally vest ratably over a 5-year period.
(e) 2002 Employee Stock Purchase Plan
In August 2002, the Company also established a stock purchase plan for its employees (ESPP). The ESPP will become effective subsequent to completion of the Company's initial public offering of its common stock and upon the fulfillment of certain other conditions. The Company authorized and reserved 1,000,000 shares of the Company's common stock for issuance under the ESPP.
F-28
A summary of the Company's stock option activity is as follows:
| | Shares Available for Grant | Number of Options Outstanding | Weighted Average Exercise Price | ||||
|---|---|---|---|---|---|---|---|
| Balance as of March 31, 1999 | 2,399,350 | 600,650 | $ | 5.60 | |||
Options granted | (585,700 | ) | 585,700 | 4.60 | |||
| Options canceled | 135,900 | (135,900 | ) | 5.60 | |||
| Balance as of March 31, 2000 | 1,949,550 | 1,050,450 | 4.87 | ||||
| Options granted | (1,037,500 | ) | 1,037,500 | 8.69 | |||
| Options canceled | 224,880 | (224,880 | ) | 7.56 | |||
| Balance as of March 31, 2001 | 1,136,930 | 1,863,070 | 6.62 | ||||
| Options canceled | 356,020 | (356,020 | ) | 6.81 | |||
| Balance as of March 31, 2002 | 1,492,950 | 1,507,050 | 6.62 | ||||
Additional shares reserved | 2,000,000 | — | — | ||||
| Options granted | (1,506,600 | ) | 1,506,600 | 8.26 | |||
| Options exercised | — | (500 | ) | 4.20 | |||
| Options canceled | 128,150 | (128,150 | ) | 7.09 | |||
| Balance as of December 31, 2002 | 2,114,500 | 2,885,000 | 7.46 | ||||
F-29
The following table summarizes information about stock options outstanding and exercisable as of December 31, 2002:
| | Options Outstanding | Options Exercisable | ||||||||||
|---|---|---|---|---|---|---|---|---|---|---|---|---|
| Range of Exercise Prices | Number | Weighted Average Remaining Contractual Life (years) | Weighted Average Exercise Price | Number | Weighted Average Exercise Price | |||||||
| $4.20-5.60 | 744,550 | 5.84 | $ | 4.86 | 513,460 | $ | 4.96 | |||||
| 8.10 | 1,228,600 | 9.25 | 8.10 | — | — | |||||||
| 8.50 | 612,350 | 7.26 | 8.50 | 244,940 | 8.50 | |||||||
| 9.00 | 270,000 | 9.85 | 9.00 | — | — | |||||||
| 10.50 | 29,500 | 7.58 | 10.50 | 11,800 | 10.50 | |||||||
| $4.20-10.50 | 2,885,000 | 7.99 | 7.46 | 770,200 | 6.17 | |||||||
Pro forma information regarding net income (loss) and income (loss) per share is required by SFAS No. 123, which requires that the information be determined as if the Company had accounted for its employee stock options under the fair-value method.
The fair value of the options granted was estimated at the date of grant, assuming no dividends and the following risk-free interest rates and expected lives:
| | Years Ended March 31, | Nine Months Ended December 31, 2002 | |||||||
|---|---|---|---|---|---|---|---|---|---|
| | 2000 | 2001 | 2002 | ||||||
| Risk-free interest rate | 5.90 | % | 6.25 | % | — | 3.00 | % | ||
| Expected life of option | 5 years | 5 years | — | 5 years | |||||
| Volatility | 45% | 60% | — | 60% | |||||
The estimated weighted-average fair value of employee stock options granted was $2.03, $4.97 and $4.42 for the years ended March 31, 2000 and 2001 and the nine months ended December 31, 2002, respectively. No options were granted during the year ended March 31, 2002.
F-30
For purposes of pro forma disclosures, the estimated fair value of the options is amortized to expense over the option's vesting period. The Company's pro forma information is as follows:
| | Years Ended March 31, | Nine Months Ended December 31, 2002 | ||||||||||||
|---|---|---|---|---|---|---|---|---|---|---|---|---|---|---|
| | 2000 | 2001 | 2002 | |||||||||||
| Net income (loss) (in thousands): | ||||||||||||||
| As reported | $ | 6,187 | $ | (11,167 | ) | $ | (10,564 | ) | $ | 2,569 | ||||
| Pro forma | $ | 5,796 | $ | (12,476 | ) | $ | (11,890 | ) | $ | 682 | ||||
| Net income (loss) per share: | ||||||||||||||
| As reported: | ||||||||||||||
| Basic | $ | 0.57 | $ | (1.04 | ) | $ | (0.98 | ) | $ | 0.24 | ||||
| Diluted | $ | 0.56 | $ | (1.04 | ) | $ | (0.98 | ) | $ | 0.23 | ||||
| Pro forma: | ||||||||||||||
| Basic | $ | 0.54 | $ | (1.16 | ) | $ | (1.10 | ) | $ | 0.06 | ||||
| Diluted | $ | 0.52 | $ | (1.16 | ) | $ | (1.10 | ) | $ | 0.06 | ||||
(11) Income Taxes
Computer Associates will prepare and file all consolidated federal, combined state and local income tax or franchise tax returns required to be filed for periods during which the Company is a member of Computer Associates' consolidated group. Pursuant to the Contribution Agreement, the Company is required to pay to Computer Associates an amount computed at 37.5% of the Company's earnings before income taxes as presented in the Company's consolidated financial statements, subject to certain modifications. In addition, the Company will receive a tax benefit payment from Computer Associates computed at 37.5% of the Company's loss before income taxes for periods in which losses are reported. Any difference between the income tax provision (benefit) calculation as if the Company were a separate taxpayer and the 37.5% provision (benefit) is recorded as an increase or decrease to additional paid-in capital.
F-31
The provision (benefit) for income taxes consisted of the following (in thousands):
| | Years Ended March 31, | Nine Months Ended December 31, 2002 | |||||||||||
|---|---|---|---|---|---|---|---|---|---|---|---|---|---|
| | 2000 | 2001 | 2002 | ||||||||||
| Current | $ | 4,561 | $ | 299 | $ | (2,678 | ) | $ | 2,622 | ||||
| Deferred | (826 | ) | (3,267 | ) | 1,189 | (371 | ) | ||||||
| Charge in lieu of taxes attributable to employee stock plans | 576 | — | 52 | — | |||||||||
| $ | 4,311 | $ | (2,968 | ) | $ | (1,437 | ) | 2,251 | |||||
Income tax expense (benefit) differed from the amounts computed by applying the U.S. federal income tax rate to pretax income (loss) as a result of the following:
| | Years Ended March 31, | Nine Months Ended December 31, 2002 | ||||||||
|---|---|---|---|---|---|---|---|---|---|---|
| | 2000 | 2001 | 2002 | |||||||
| Federal statutory rate | 35.0 | % | (35.0 | )% | (35.0 | )% | 35.0 | % | ||
| State tax expense, net of federal benefit | 4.0 | (2.0 | ) | (3.1 | ) | 4.4 | % | |||
| Nondeductible acquired in-process research and development | — | 12.5 | — | — | ||||||
| Nondeductible goodwill | — | 3.0 | 9.9 | — | ||||||
| Increase in valuation allowance | — | — | 22.5 | 13.5 | ||||||
| Foreign tax differential | — | — | (6.5 | ) | (6.6 | ) | ||||
| Other, net | 2.0 | 0.5 | 0.3 | 0.4 | ||||||
| Effective tax rate | 41.0 | % | (21.0 | )% | (11.9 | )% | 46.7 | % | ||
Deferred income taxes reflect the net tax effects of temporary differences between the carrying amounts of assets and liabilities for financial reporting purposes and the amounts
F-32
used for income tax purposes. Net deferred tax assets consisted of the following (in thousands):
| | March 31, | December 31, | ||||||||||
|---|---|---|---|---|---|---|---|---|---|---|---|---|
| | 2001 | 2002 | 2002 | |||||||||
| Deferred tax assets: | ||||||||||||
| Accruals and allowances | $ | 4,177 | $ | 1,667 | $ | 1,153 | ||||||
| Net operating loss and credit carryforwards | 820 | 3,390 | 1,782 | |||||||||
| Deferred state taxes | — | 7 | 4 | |||||||||
| 4,997 | 5,064 | 2,939 | ||||||||||
| Valuation allowance | — | (2,710 | ) | (1,542 | ) | |||||||
| Total deferred tax assets | 4,997 | 2,354 | 1,397 | |||||||||
| Deferred tax liability — identifiable intangible assets acquired | 6,929 | 5,439 | (4,666 | ) | ||||||||
| Net deferred tax liability | $ | (1,932 | ) | $ | (3,085 | ) | $ | (3,269 | ) | |||
Recorded as: | ||||||||||||
| Deferred income taxes-current | $ | 4,997 | $ | 2,354 | $ | 1,156 | ||||||
| Deferred income taxes-noncurrent | (6,929 | ) | (5,439 | ) | (4,425 | ) | ||||||
| $ | (1,932 | ) | $ | (3,085 | ) | $ | (3,269 | ) | ||||
In assessing the realizability of the Company's deferred tax assets, management considers whether it is more likely than not that some portion or all of the deferred tax assets will not be realized. Deferred tax assets, related valuation allowances and deferred tax liabilities are determined separately by tax jurisdiction. The Company believes that it is more likely than not that it will not realize its deferred tax assets in certain foreign jurisdictions and, accordingly, a valuation allowance has been established against the deferred tax assets in those jurisdictions. The ultimate realization of deferred tax assets is dependent upon the generation of future taxable income during the periods in which those temporary differences become deductible.
In June 2002, the tax authority in Canada completed an examination of the 1999 and 2000 tax year filing for ACCPAC Canada Inc., a subsidiary of the Company. As a result of this examination, the tax authority has taken a tax position that is contrary to the tax position taken by the Company. It is the Company's belief that the tax authority will accept the tax position taken by the Company. However, in the event the Company is unable to prevail, the
F-33
Company will be subjected to additional tax liabilities which are estimated to be as high as $1.7 million. The Company has not accrued for this contingent liability.
(12) Segment Information
The Company has adopted SFAS No. 131,Disclosures about Segments of an Enterprise and Related Information. SFAS No. 131 establishes standards for the reporting by business enterprises of information about operating segments, products and services, geographic areas and major customers. The method for determining what information is reported is based on the way that management organizes the operating segments within the Company for making operational decisions and assessments of financial performance.
The Company's chief operating decision maker is considered to be the Company's chief executive officer (CEO). The CEO reviews financial information presented on a consolidated basis for purposes of making operating decisions and assessing financial performance. The consolidated financial information reviewed by the CEO is identical to the information presented in the accompanying consolidated statements of operations. Therefore, the Company has determined that it operates in a single reportable segment.
The Company maintains significant operations in the United States with direct sales and marketing offices located in Australia, Canada, India, Ireland, Mexico, the Netherlands, Singapore, South Africa and the United Arab Emirates and the United Kingdom.
Revenue from sales made to customers in Canada represents a combination of export sales made from the United States to Canadian customers and sales originated by the Canadian sales subsidiary to Canadian customers. Revenue in all other countries represents sales originated by the foreign sales subsidiary to its customers.
F-34
Financial information for the Company's operating segments is summarized as follows:
| | Years Ended March 31, | Nine Months Ended December 31, 2002 | |||||||||||
|---|---|---|---|---|---|---|---|---|---|---|---|---|---|
| | 2000 | 2001 | 2002 | ||||||||||
| Strategic product revenue: | |||||||||||||
| United States | $ | 12,376 | $ | 24,731 | $ | 27,656 | $ | 21,859 | |||||
| Canada | 20,616 | 21,281 | 23,426 | 19,410 | |||||||||
| Singapore | 7,415 | 11,662 | 6,903 | 5,398 | |||||||||
| All other countries | 5,369 | 8,527 | 8,837 | 9,076 | |||||||||
| $ | 45,776 | $ | 66,201 | $ | 66,822 | $ | 55,743 | ||||||
| Legacy and third-party product revenue: | |||||||||||||
| United States | $ | 15,942 | $ | 11,272 | $ | 5,759 | $ | 3,205 | |||||
| Canada | 9,009 | 6,272 | 3,886 | 2,591 | |||||||||
| Singapore | 1,048 | 1,102 | 628 | 204 | |||||||||
| All other countries | 2,343 | 1,081 | 1,194 | 828 | |||||||||
| $ | 28,342 | $ | 19,727 | $ | 11,467 | $ | 6,828 | ||||||
| $ | 74,118 | $ | 85,928 | $ | 78,289 | $ | 62,571 | ||||||
| | As of March 31, | | ||||||||
|---|---|---|---|---|---|---|---|---|---|---|
| | December 31, 2002 | |||||||||
| | 2001 | 2002 | ||||||||
| Long-lived assets: | ||||||||||
| United States | $ | 36,192 | $ | 27,464 | $ | 31,994 | ||||
| Canada | 1,761 | 1,158 | 774 | |||||||
| Singapore | 39 | 71 | 49 | |||||||
| All other countries | 1,919 | 1,132 | 1,626 | |||||||
| $ | 39,911 | $ | 29,825 | $ | 34,443 | |||||
Long-lived assets consist primarily of goodwill and other intangible assets, property and equipment and other long-term tangible assets.
F-35
(13) Net Income (Loss) per Share
Basic net income (loss) per share is computed using the weighted-average number of shares of common stock outstanding for the period. Diluted net income (loss) per share is based upon the weighted-average number of shares of common stock outstanding for the period plus dilutive potential common shares, including stock options using the treasury-stock method (in thousands, except per share data).
| | | | | Nine Months Ended December 31, | ||||||||||||
|---|---|---|---|---|---|---|---|---|---|---|---|---|---|---|---|---|
| | Years Ended March 31, | |||||||||||||||
| | 2001 (unaudited) | | ||||||||||||||
| | 2000 | 2001 | 2002 | 2002 | ||||||||||||
| Net income (loss) | $ | 6,187 | $ | (11,167 | ) | $ | (10,564 | ) | $ | (13,236 | ) | $ | 2,569 | |||
| Weighted average shares of common stock outstanding | 10,773 | 10,773 | 10,773 | 10,773 | 10,821 | |||||||||||
| Less weighted average shares subject to forfeiture | — | — | — | — | (9 | ) | ||||||||||
| Shares used to compute basic net earnings (loss) per share (weighted-average shares outstanding during the period) | 10,773 | 10,773 | 10,773 | 10,773 | 10,812 | |||||||||||
| Dilutive common equivalent shares — stock options | 330 | — | — | — | 277 | |||||||||||
| Shares used to compute diluted net income (loss) per share | 11,103 | 10,773 | 10,773 | 10,773 | 11,089 | |||||||||||
| Basic income (loss) per share | $ | 0.57 | $ | (1.04 | ) | $ | (0.98 | ) | $ | (1.23 | ) | $ | 0.24 | |||
| Diluted income (loss) | $ | 0.56 | $ | (1.04 | ) | $ | (0.98 | ) | $ | (1.23 | ) | $ | 0.23 | |||
As of March 31, 2000, 2001 and 2002, options to purchase approximately 1,050,450, 1,863,070 and 1,507,050 shares, respectively, of common stock with weighted-average exercise prices of $4.87 as of March 31, 2000 and $6.62 as of March 2001 and 2002 were outstanding. As of December 31, 2001 and 2002, options to purchase approximately 1,614,410 and 2,885,000 shares, respectively, of common stock with weighted-average exercise prices of $6.58 as of December 31, 2001 and $7.46 as of December 31, 2002, were outstanding. For the years ended March 31, 2001 and 2002 and the nine months ended December 31, 2002, all of the options to purchase common stock were excluded in the calculation of diluted income per share as the effect of including such securities would be antidilutive.
F-36
PRO FORMA FINANCIAL INFORMATION
On December 18, 2002, the Company acquired eWare Limited (eWare), a privately held developer of customer relationship management software products for small and midsize businesses, to enhance its future product development.
The Company acquired all of the outstanding shares of stock of eWare in exchange for $1.8 million in cash and 761,110 shares of the Company's common stock. In connection with the acquisition, the Company issued 69,445 shares of restricted common stock to eWare executives and committed to issue another 113,889 restricted shares of common stock to eWare employees. The restricted shares vest over periods of one to three years, subject to continued employment. $1.6 million has been recognized as deferred stock compensation related to these shares of restricted common stock based on the fair value of the Company's common stock of $9.00 per share. Of the shares we issued as acquisition consideration and as compensation to eWare executives, 707,220 shares are subject to a put option, entitling the stockholders to sell their shares to the Company for $5.82 per share, and a call option, entitling the Company to buy shares from the stockholders for $10.85 per share. Both options are exercisable at any time during the 28-day period beginning November 19, 2003, and will terminate at the earlier of December 17, 2003, or the last business day prior to the effectiveness of a registration statement relating to the initial public offering of the Company's common stock.
The acquisition was accounted for in accordance with the Statement of Financial Accounting Standard No. 141,Business Combinations, using the purchase method of accounting. The aggregate preliminary purchase price of approximately $9.4 million includes the following (in thousands):
| Value of common stock | $ | 6,850 | ||
| Cash paid | 1,750 | |||
| Direct acquisition costs | 958 | |||
| Value of put and call options | (158 | ) | ||
| $ | 9,400 | |||
The aggregate value of common stock issued reflects the fair value of the Company's common stock of $9.00 per share.
The total preliminary purchase price has been allocated to eWare's net tangible and identifiable intangible assets based upon their estimated fair value as of the date of acquisition. $0.1 million of the purchase price was allocated to in-process research and development and expensed at the time of the acquisition. The other identifiable acquired intangibles will be amortized over their respective useful lives. The residual purchase price has been recorded as goodwill. In accordance with SFAS No. 142,Goodwill and Other Intangible Assets, goodwill relating to the eWare acquisition will not be amortized, but will be carried at cost and tested for impairment annually or whenever events indicate that impairment may have occurred. The total purchase price is subject to adjustments based upon finalization of management's estimates of the direct costs of the acquisition and the realization of net assets acquired.
F-37
The purchase price of approximately $9.4 million was allocated to the assets acquired and liabilities assumed based on fair values as follows (in thousands):
| Net tangible assets | $ | 1,136 | |
| In-process research and development | 110 | ||
| Developed technology | 2,080 | ||
| Customer relationships | 1,320 | ||
| Goodwill | 4,754 | ||
| $ | 9,400 | ||
The following unaudited pro forma combined financial statements give effect to the Company's acquisition of eWare as a purchase transaction. The Company's historical condensed financial information has been derived from the Company's audited financial statements included in this registration statement. The historical eWare financial information has been translated from euros to U.S. dollars using average exchange rates for the respective periods for the statements of operations. The Company has excluded an unaudited pro forma combined condensed balance sheet since a combined balance sheet has been included in the accompanying audited financial statements of the Company as of December 31, 2002. The unaudited pro forma combined condensed statements of operations assume that the acquisition took place as of the beginning of the periods presented.
The unaudited pro forma combined financial statements are based on the assumptions set forth in the notes to such statements. The unaudited pro forma adjustments made in connection with the development of the unaudited pro forma information have been made solely for purposes of developing such unaudited pro forma information for illustrative purposes necessary to comply with the disclosure requirements of the Securities and Exchange Commission. The unaudited pro forma combined financial statements do not purport to be indicative of the results of operations for future periods or the combined financial position or the results that actually would have been realized had the entities been a single entity during these periods.
We allocated approximately $0.1 million of the purchase price to eWare's in-process research and development, which was expensed upon consummation of the merger as it has not reached technological feasibility and, in the opinion of management, has no alternative future use. This amount has not been removed from the accompanying pro forma statements of operations as it is a nonrecurring charge.
These unaudited pro forma combined financial information should be read in conjunction with the historical financial statements of the Company and eWare and related notes thereto and "Management's Discussion and Analysis of Financial Condition and Results of Operations" of the Company included elsewhere in this registration statement.
F-38
ACCPAC International, Inc.
Pro Forma Unaudited Combined Condensed Statements of Operations
Year Ended March 31, 2002
(In Thousands, Except Per Share Amounts)
| | ACCPAC | eWare | Pro Forma Adjustments | | Pro Forma Combined | ||||||||||||
|---|---|---|---|---|---|---|---|---|---|---|---|---|---|---|---|---|---|
| Revenue: | |||||||||||||||||
| License | $ | 38,787 | $ | 2,090 | $ | (243 | ) | (A | ) | $ | 40,634 | ||||||
| Maintenance and other | 33,962 | 1,802 | — | 35,764 | |||||||||||||
| Third-party products | 5,540 | — | — | 5,540 | |||||||||||||
| Total revenues | 78,289 | 3,892 | (243 | ) | 81,938 | ||||||||||||
Cost of revenue: | |||||||||||||||||
| License | 8,862 | 17 | (243 | ) | (A | ) | 8,636 | ||||||||||
| Maintenance and other | 10,394 | 1,224 | — | 11,618 | |||||||||||||
| Third-party products | 4,053 | — | — | 4,053 | |||||||||||||
| Amortization of acquired intangibles | 1,636 | — | 416 | (B | ) | 2,052 | |||||||||||
| Total cost of revenues | 24,945 | 1,241 | 173 | 26,359 | |||||||||||||
| Gross profit | 53,344 | 2,651 | (416 | ) | 55,579 | ||||||||||||
Operating expenses: | |||||||||||||||||
| Sales and marketing | 35,833 | 3,259 | — | 39,092 | |||||||||||||
| Research and development | 10,343 | 1,056 | — | 11,399 | |||||||||||||
| General and administrative | 10,740 | 2,269 | — | 13,009 | |||||||||||||
| Amortization of goodwill and other intangibles | 6,567 | — | 264 | (C | ) | 6,831 | |||||||||||
| Acquired in-process research and development | — | — | — | — | |||||||||||||
| Stock-based compensation | — | — | 629 | (D | ) | 629 | |||||||||||
| Total operating expenses | 63,483 | 6,584 | 893 | 70,960 | |||||||||||||
Loss from operations | (10,139 | ) | (3,933 | ) | (1,309 | ) | (15,381 | ) | |||||||||
| Other income (expense), net | (1,862 | ) | 79 | — | (1,783 | ) | |||||||||||
| Loss before income taxes | (12,001 | ) | (3,854 | ) | (1,309 | ) | (17,164 | ) | |||||||||
| Provision (benefit) for income taxes | (1,437 | ) | — | — | (1,437 | ) | |||||||||||
| Net loss | $ | (10,564 | ) | $ | (3,854 | ) | $ | (1,309 | ) | $ | (15,727 | ) | |||||
| Net loss per share: | |||||||||||||||||
| Basic | $ | (0.98 | ) | $ | (0.15 | ) | $ | (1.34 | ) | ||||||||
| Diluted | $ | (0.98 | ) | $ | (0.15 | ) | $ | (1.34 | ) | ||||||||
| Shares used in per share computation: | |||||||||||||||||
| Basic | 10,773 | 25,543 | (E | ) | 11,717 | ||||||||||||
| Diluted | 10,773 | 25,543 | 11,717 | ||||||||||||||
F-39
ACCPAC International, Inc.
Pro Forma Unaudited Combined Condensed Statements of Operations
Nine Months Ended December 31, 2002
(In Thousands, Except Per Share Amounts)
| | ACCPAC | eWare | Pro Forma Adjustments | | Pro Forma Combined | ||||||||||||
|---|---|---|---|---|---|---|---|---|---|---|---|---|---|---|---|---|---|
| Revenue: | |||||||||||||||||
| License | $ | 28,394 | $ | 1,134 | $ | (327 | ) | (F | ) | $ | 29,201 | ||||||
| Maintenance and other | 30,664 | 1,866 | — | 32,530 | |||||||||||||
| Third-party products | 3,513 | — | 3,513 | ||||||||||||||
| Total revenues | 62,571 | 3,000 | (327 | ) | 65,244 | ||||||||||||
Cost of revenue: | |||||||||||||||||
| License | 5,419 | — | (327 | ) | (F | ) | 5,092 | ||||||||||
| Maintenance and other | 9,478 | 689 | — | 10,167 | |||||||||||||
| Third-party products | 2,370 | — | — | 2,370 | |||||||||||||
| Amortization of acquired intangibles | 1,228 | — | 312 | (G | ) | 1,540 | |||||||||||
| Total cost of revenues | 18,495 | 689 | (15 | ) | 19,169 | ||||||||||||
| Gross profit | 44,076 | 2,311 | (312 | ) | 46,075 | ||||||||||||
Operating expenses: | |||||||||||||||||
| Sales and marketing | 22,420 | 1,252 | — | 23,672 | |||||||||||||
| Research and development | 6,598 | 677 | — | 7,275 | |||||||||||||
| General and administrative | 7,488 | 872 | — | 8,360 | |||||||||||||
| Amortization of goodwill and other intangibles | 2,141 | — | 198 | (H | ) | 2,339 | |||||||||||
| Acquired in-process research and development | 110 | — | — | 110 | |||||||||||||
| Stock-based compensation | — | — | 472 | (I | ) | 472 | |||||||||||
| Total operating expenses | 38,757 | 2,801 | 670 | 42,228 | |||||||||||||
Income (loss) from operations | 5,319 | (490 | ) | (982 | ) | 3,847 | |||||||||||
| Other income (expense), net | (499 | ) | 10 | — | (489 | ) | |||||||||||
| Income (loss) before income taxes | 4,820 | (481 | ) | (982 | ) | 3,358 | |||||||||||
| Provision (benefit) for income taxes | 2,251 | — | — | 2,251 | |||||||||||||
| Net income (loss) | $ | 2,569 | $ | (481 | ) | $ | (982 | ) | $ | 1,107 | |||||||
| Net income (loss) per share: | |||||||||||||||||
| Basic | $ | 0.24 | $ | (0.02 | ) | $ | 0.09 | ||||||||||
| Diluted | $ | 0.23 | $ | (0.02 | ) | $ | 0.09 | ||||||||||
| Shares used in per share computation: | |||||||||||||||||
| Basic | 10,773 | 25,543 | (J | ) | 11,717 | ||||||||||||
| Diluted | 11,051 | 25,543 | 11,995 | ||||||||||||||
F-40
NOTES TO THE
UNAUDITED PRO FORMA COMBINED CONDENSED FINANCIAL INFORMATION
The adjustments to the pro forma combined condensed statements of operations for the year ended March 31, 2002 assume the acquisitions occurred on April 1, 2001 and are as follows:
- (A)
- To reflect the elimination of intercompany revenue and cost of revenue between eWare and the Company.
- (B)
- To reflect the amortization of approximately $0.4 million of the purchased technology resulting from the eWare acquisition. The purchased technology will be amortized over five years.
- (C)
- To reflect the amortization of approximately $0.3 million of other intangibles resulting from the eWare acquisition. The other intangible assets will be amortized over five years.
- (D)
- To reflect the amortization of stock-based compensation resulting from the eWare acquisition. The deferred compensation will be amortized over three years.
- (E)
- The unaudited pro forma net income per share assumes the 944,444 shares issued to eWare stockholders and former eWare executives and employees in connection with the acquisition were outstanding as of the beginning of each period presented.
The adjustments to the pro forma combined statements of operations for the nine months ended December 31, 2002 assume the eWare acquisition occurred on April 1, 2002 and are as follows:
- (F)
- To reflect the elimination of intercompany revenue and cost of revenue between eWare and the Company.
- (G)
- To reflect the amortization of approximately $0.3 million of the purchased technology resulting from the eWare acquisition. The purchased technology will be amortized over five years.
- (H)
- To reflect the amortization of approximately $0.2 million of other intangibles resulting from the eWare acquisition. The other intangible assets will be amortized over five years.
- (I)
- To reflect the amortization of stock-based compensation resulting from the eWare acquisition. The deferred compensation will be amortized over three years.
- (J)
- The unaudited pro forma net loss per share assumes the 944,444 shares issued to eWare stockholders and former eWare executives and employees in connection with the acquisition were outstanding as of the beginning of each period presented.
F-41
INDEPENDENT AUDITORS' REPORT TO THE BOARD OF DIRECTORS AND SHAREHOLDERS OF EWARE LIMITED
We have audited the accompanying consolidated balance sheet of eWare Limited and subsidiaries ("the Group") as of December 18, 2002, and the related consolidated profit and loss account, statement of total recognized gains and losses, and cash flow statement for the period from January 1, 2002 to December 18, 2002. These consolidated financial statements are the responsibility of the Group's management. Our responsibility is to express an opinion on these consolidated financial statements based on our audit.
We conducted our audit in accordance with auditing standards generally accepted in the United States of America. Those standards require that we plan and perform the audit to obtain reasonable assurance about whether the financial statements are free of material misstatement. An audit includes examining, on a test basis, evidence supporting the amounts and disclosures in the financial statements. An audit also includes assessing the accounting principles used and significant estimates made by management, as well as evaluating the overall financial statement presentation. We believe that our audit provides a reasonable basis for our opinion.
In our opinion, the consolidated financial statements referred to above present fairly, in all material respects, the financial position of eWare Limited and subsidiaries as of December 18, 2002, and the results of their operations and their cash flows for the period from January 1, 2002 to December 18, 2002 in conformity with generally accepted accounting principles in the Republic of Ireland.
Accounting principles generally accepted in the Republic of Ireland vary in certain significant respects from accounting principles generally accepted in the United States of America. Application of accounting principles generally accepted in the United States of America would have affected results of operations for the period from January 1, 2002 to December 18, 2002 and stockholders' equity as of December 18, 2002, to the extent summarized in Note 19 to the consolidated financial statements.
/s/ KPMG
Chartered Accountants
Dublin
Ireland
January 24, 2003
F-42
eWare Limited and Subsidiaries
Consolidated Profit and Loss Account
| | Notes | Period from January 1, 2002 to December 18, 2002 € | |||
|---|---|---|---|---|---|
| Turnover | 2 | 4,291,485 | |||
| Cost of sales | (950,431 | ) | |||
| Gross profit | 3,341,054 | ||||
| Selling and marketing costs | (1,873,574 | ) | |||
| Research and development expenses | (1,169,729 | ) | |||
| Administrative expenses | (1,534,155 | ) | |||
| Loss on sale of fixed assets | (1,119 | ) | |||
| Other operating income—government grants | 251,788 | ||||
| Loss on ordinary activities before interest | (985,735 | ) | |||
| Interest receivable and similar income | 63,684 | ||||
| Interest payable and similar charges | 4 | (63,594 | ) | ||
| Loss on ordinary activities before taxation | 5 | (985,645 | ) | ||
| Tax on loss on ordinary activities | 6 | (3,900 | ) | ||
| Loss for the financial period | (989,545 | ) | |||
| Profit and loss account at beginning of period | (9,544,609 | ) | |||
| Profit and loss account at end of period | (10,534,154 | ) | |||
See accompanying notes to the consolidated financial statements.
F-43
eWare Limited and Subsidiaries
Consolidated Statement of Total Recognized Gains and Losses
| | Notes | Period from January 1, 2002 to December 18, 2002 € | |||
|---|---|---|---|---|---|
| Loss for the financial period | (989,545 | ) | |||
| Foreign currency loss on translation of foreign subsidiaries | (60,325 | ) | |||
| Total recognized gains and losses for the period | 13 | (1,049,870 | ) | ||
See accompanying notes to the consolidated financial statements.
F-44
eWare Limited and Subsidiaries
Consolidated Balance Sheet
| | Notes | As at December 18, 2002 € | |||
|---|---|---|---|---|---|
| Fixed assets | |||||
| Tangible assets | 7 | 200,163 | |||
Current assets | |||||
| Debtors (of which €48,600 due after more than one year) | 8 | 1,782,031 | |||
| Cash at bank and in hand | 694,266 | ||||
| 2,476,297 | |||||
Creditors: Amounts falling due within one year | 9 | (1,493,095 | ) | ||
Net current assets | 983,202 | ||||
Total assets less current liabilities | 1,183,365 | ||||
Creditors: Amounts falling due after more than one year | 10 | (10,487 | ) | ||
Net assets | 1,172,878 | ||||
Capital and reserves | |||||
| Called up share capital | 11 | 684,546 | |||
| Share premium | 11,087,824 | ||||
| Profit and loss account | (10,534,154 | ) | |||
| Foreign currency reserve | (102,350 | ) | |||
| Other reserves | 12 | 37,012 | |||
Shareholders' funds (all equity interests) | 13 | 1,172,878 | |||
See accompanying notes to the consolidated financial statements.
F-45
eWare Limited and Subsidiaries
Consolidated Cash Flow Statement
for the Period Ended December 18, 2002
| | Notes | Period from January 1, 2002 to December 18, 2002 € | |||
|---|---|---|---|---|---|
| Cash outflow from operating activities | 17 | (1,078,110 | ) | ||
Returns on investments and servicing of finance | |||||
| Interest received | 63,684 | ||||
| Interest paid | (63,594 | ) | |||
Net cash inflow from return on investments and servicing of finance | 90 | ||||
Taxation | |||||
| Tax paid | — | ||||
Capital expenditure and financial investment | |||||
| Purchase of tangible fixed assets | (47,115 | ) | |||
Net cash outflow from capital expenditure and financial investment | (47,115 | ) | |||
Net cash outflow before financing | (1,125,135 | ) | |||
Financing | |||||
| New finance leases | (55,898 | ) | |||
Decrease in cash and cash equivalents | 18a | (1,181,033 | ) | ||
See accompanying notes to the consolidated financial statements.
F-46
eWare Limited and Subsidiaries
Notes to the Consolidated Financial Statements
1. Statement of accounting policies
The following accounting policies have been applied consistently in dealing with items which are considered material in relation to the Group's financial statements.
Basis of preparation
The financial statements are prepared in accordance with generally accepted accounting principles under the historic cost convention and comply with the financial reporting standards of the Accounting Standards Board, as promulgated by the Institute of Chartered Accountants in Ireland ("Irish GAAP") which differ in certain significant respects from accounting principles generally accepted in the United States of America ("US GAAP").
The significant differences between the financial statements prepared under Irish GAAP and US GAAP and reconciliation of the net loss and shareholders' funds from Irish GAAP to US GAAP is provided in note 19.
These financial statements are not the statutory financial statements of the Group which company law requires to be prepared and laid before the members at an annual general meeting. Those statutory financial statements will be prepared separately.
Consolidation
The financial statements are consolidated and including all subsidiary undertakings as at December 18, 2002. The results of subsidiary undertakings acquired during the year are included in the consolidated profit and loss account from the date of acquisition.
Revenue recognition
Turnover represents the invoiced amount of goods and services excluding value added tax provided in the normal course of business and is recognized on the following basis:
Licences:
Licence revenues are credited to profit and loss account upon the later of:
- •
- a signed contract or purchase order;
- •
- delivery of the product; and
- •
- the fulfilling of any obligation defined in the contract or purchase order related to the delivered software, such as installation.
Royalties receivable from resellers are recognized on the basis of sales made by the resellers to end customers. Non-refundable royalties received upfront from resellers are recognized immediately.
F-47
Maintenance:
Amounts paid for maintenance are deferred in the balance sheet and amortized to the profit and loss account over the period to which the maintenance contract relates.
Consulting services:
Consulting revenues are recognized when provided to the customer and the cost of providing these services are recognized as incurred.
Government revenue grants
Revenue based training grants are credited to income in the same year as the related expense is incurred. Employment grants are credited to income in the year in which they become payable.
Tangible fixed assets
Tangible fixed assets are stated at cost less accumulated depreciation. Depreciation is calculated on all tangible fixed assets at rates calculated to write off the cost less estimated residual value of each asset over its expected useful life, being 3 years.
Taxation
Corporation tax is provided on taxable profits at current rates.
Full provision, without discounting, is made for all timing differences at the balance sheet date in accordance with Financial Reporting Standard 19—Deferred Tax. Provision is made at the tax rates that are expected to apply in the periods in which the timing differences are expected to reverse. Deferred tax assets are stated net of any recoverability adjustment.
Research and development costs
Research and development costs are written off as incurred.
Leases
Assets held under leasing arrangements which transfer substantially all the risks and rewards of ownership to the Group ("finance leases") are capitalized. The capital element of the related rental obligations is included in creditors. The interest element of the rental obligations is charged to the profit and loss account so as to produce a constant periodic rate of change in proportion to the capital balances outstanding.
Rentals in respect of all other leases ("operating leases") are charged to the profit and loss account as they fall due.
F-48
Foreign currency transactions and balances
Transactions in foreign currencies are recorded at the rate ruling at the date of the transactions. The resulting monetary assets and liabilities are translated at the balance sheet rate and the exchange differences are dealt with in the profit and loss account.
The balance sheets of foreign subsidiaries are translated, for the purposes of consolidation, at the period end rates and their profit and loss accounts are translated at average rates. Translation gains or losses arising are disclosed as a movement on reserves.
2. Operations and going concern
The Group consists of eWare Limited, a company incorporated in the Republic of Ireland, and its wholly owned subsidiaries, details of which are set out in note 14. The principal activity of the Group is the development and sale of web based solutions for customer relationship management and e-business. All revenue arises from such activities conducted in Europe.
On December 18, 2002, the entire share capital of eWare Limited was purchased by ACCPAC International, Inc. ("ACCPAC"), a company incorporated in the State of Delaware. ACCPAC then became the parent undertaking and controlling party. All costs relating to the transaction were incurred by the former shareholders of the company and ACCPAC. These financial statements have been prepared on a pre-acquisition basis and therefore do not reflect the adjustments that would be required from push down of the acquirer's basis or from the cancellation of employee share options and replacement by restricted common stock in ACCPAC referred to in note 12. The directors have sought and obtained confirmation from ACCPAC that sufficient financial support will be provided to the company to enable it to meet its obligations as they fall due for the foreseeable future covering the period to at least 12 months from the date of approval of the financial statements. As a result, the directors believe it appropriate to prepare the financial statements on the going concern basis.
F-49
3. Employees and remuneration
The average number of persons employed by the Group during the period was as follows:
| | Period from January 1, 2002 to December 18, 2002 No. | |
|---|---|---|
| Research and development | 19 | |
| Sales, marketing, services and support | 33 | |
| Finance and administration | 9 | |
| 61 | ||
| Their total remuneration was: | ||
| € | ||
| Wages and salaries | 3,300,448 | |
| Social welfare costs | 338,926 | |
| 3,639,374 | ||
4. Interest payable and similar charges
| | Period from January 1, 2002 to December 18, 2002 € | |
|---|---|---|
| On bank overdrafts wholly repayable within one year | 31,583 | |
| Other interest payable | 32,011 | |
| 63,594 | ||
F-50
5. Loss on ordinary activities before taxation
The loss on ordinary activities before taxation has been determined after charging/(crediting) the following:
| | Period from January 1, 2002 to December 18, 2002 € | |||
|---|---|---|---|---|
| Directors' remuneration | ||||
| Fees | 44,096 | |||
| Other | 327,174 | |||
| Depreciation | 177,591 | |||
| Operating lease rentals | 196,204 | |||
| Government grants received/receivable | (251,788 | ) | ||
| All losses were generated by continuing operations. | ||||
6. Tax on loss on ordinary activities
| | Period from January 1, 2002 to December 18, 2002 € | |
|---|---|---|
| Tax payable on passive income | 3,900 | |
No deferred tax asset has been recorded in respect of operating loss carry forwards available to the Group. The Group's management believe that there is significant uncertainty surrounding the ability of the Group to make sufficient profits in the foreseeable future against which the loss carryforwards may be utilised. At December 18, 2002 the Group has tax loss carryforwards available of approximately €10 million.
F-51
7. Tangible fixed assets
| | Office Equipment € | Furniture & Fittings € | Computer Equipment € | Computer Software € | Office Total € | ||||||
|---|---|---|---|---|---|---|---|---|---|---|---|
| Cost | |||||||||||
| At January 1, 2002 | 23,640 | 19,112 | 415,308 | 93,466 | 551,526 | ||||||
| Additions | 19,689 | — | 29,312 | — | 49,001 | ||||||
| Disposals | — | — | (2,989 | ) | — | (2,989 | ) | ||||
| At December 18, 2002 | 43,329 | 19,112 | 441,631 | 93,466 | 597,538 | ||||||
| Accumulated depreciation | |||||||||||
| At January 1, 2002 | 8,625 | 7,366 | 185,291 | 19,605 | 220,887 | ||||||
| Charge for period | 14,998 | 5,902 | 126,626 | 30,065 | 177,591 | ||||||
| Disposals | — | — | (1,103 | ) | — | (1,103 | ) | ||||
| At December 18, 2002 | 23,623 | 13,268 | 310,814 | 49,670 | 397,375 | ||||||
| Net book value At December 18, 2002 | 19,706 | 5,844 | 130,817 | 43,796 | 200,163 | ||||||
The net book value of assets held under finance leases at December 18, 2002 included above amounted to €62,205 on which depreciation of €127,070 was charged in the period.
The Group had no capital commitments at December 18, 2002.
8. Debtors
| | As at December 18, 2002 € | |
|---|---|---|
| Trade debtors | 749,825 | |
| Prepayments and accrued income | 167,608 | |
| Unbilled receivables | 344,914 | |
| VAT receivable | 279,009 | |
| Foreign withholding tax recoverable | 48,600 | |
| Government grants receivable | 192,075 | |
| 1,782,031 | ||
F-52
9. Creditors: Amounts falling due within one year
| | As at December 18, 2002 € | |
|---|---|---|
| Trade creditors | 348,102 | |
| Accruals and other creditors | 411,902 | |
| Deferred income | 315,862 | |
| Payroll taxes | 366,318 | |
| Finance lease obligations | 50,911 | |
| 1,493,095 | ||
10. Creditors: Amounts falling due after more than one year
| | As at December 18, 2002 € | |
|---|---|---|
| Finance lease obligations (due within two to five years) | 10,487 | |
11. Called up share capital
| | As at December 18, 2002 € | |
|---|---|---|
| Authorised: | ||
| 500,000 "A" Ordinary shares of €1.26974 each | 634,870 | |
| 28,248,602 "B" Ordinary shares of €0.0126974 each | 358,684 | |
| 14,624,000 "C" Ordinary shares of €0.0126974 each | 185,687 | |
| 7,127,398 "D" Ordinary shares of €0.0126974 each | 90,499 | |
| 1,269,740 | ||
| | As at December 18, 2002 € | |
|---|---|---|
| Allotted, called-up and fully paid: | ||
| 286,560 "A" ordinary shares of €1.26974 each | 363,856 | |
| 3,504,952 "B" ordinary shares of €0.0126974 each | 44,504 | |
| 14,624,000 "C" ordinary shares of €0.0126974 each | 185,687 | |
| 7,127,398 "D" ordinary shares of €0.0126974 each | 90,499 | |
| 684,546 | ||
F-53
All shares rankpari passu except:
- •
- "A" shares do not have voting rights or an entitlement to dividends.
- •
- "C" shares rank after all other classes of shares on winding up.
- •
- The holders of "D" shares are not entitled to exercise more than 24.9% of the voting rights attached to the shares from time to time.
12. Other reserves
| | As at December 18, 2002 € | |
|---|---|---|
| Balance at January 1, 2002 | — | |
| Cost associated with modification of share options | 37,012 | |
| Balance at December 18, 2002 | 37,012 | |
On November 21, 2002, options over 240,106 "B" shares were granted at a price of €0.1764 each. The company is recording the difference between the estimated market value of the options at the grant date and the option price to the profit and loss account over the vesting terms resulting in a charge to the profit and loss account for the period of €37,012.
On April 29, 2002 options over 1,580,697 "B" ordinary shares, which had been granted to employees and directors, were cancelled without recourse. On the same date 585,500 options over "B" shares were granted at a price of €0.3745 each and 995,197 options over "B" shares were granted at a price of €0.5618 under share option plans. As the market value of these shares at the grant date was not higher than the exercise price, no profit and loss charge arose in respect of these options.
On January 8, 2003, all outstanding options were cancelled and replaced by grants of restricted common stock in ACCPAC. As explained in note 2 the financial statements are prepared on a pre-acquisition basis and therefore do not reflect the impact of these charges.
13. Reconciliation of movement in shareholders' funds
| | As at December 18, 2002 € | ||
|---|---|---|---|
| Opening shareholders' funds | 2,185,736 | ||
| Total recognized gains and losses for the period | (1,049,870 | ) | |
| Movement in reserves | 37,012 | ||
| Closing shareholders' funds | 1,172,878 | ||
F-54
14. Subsidiary undertakings
Details of the company's subsidiary undertakings at December 18, 2002 are set out below:
| Name and registered office | Country of incorporation | Details of investment | Proportion held | Principal activity | ||||
|---|---|---|---|---|---|---|---|---|
| eWare (UK) Limited Suite C 7 Leonard Street London EC2A 4AQ United Kingdom | United Kingdom | Ordinary shares of Stg £1 each | 100 | % | Sales office | |||
eWare Inc. 2711 Centre Road, Suite 400, Wilmington, County of New Castle, Delaware 19808, USA | United States | Ordinary shares of US$1 each | 100 | % | Dormant | |||
eWare GmbH Oberanger 43, 80331 Munchen, Germany | Germany | Ordinary shares of €1 each | 100 | % | Dormant | |||
eWare BV Strawinskylaan 3051, 1077ZX Amsterdam, The Netherlands | The Netherlands | Ordinary shares of €1 each | 100 | % | Sales office |
15. Related party transactions
The Group entered into a number of related party transactions during the period as follows:
- •
- Sean Melly, a director of the company during the period, is Chief Executive Officer of eTel Group Limited. During the period, the Group supplied software and services to eTel Group Limited. These transactions were conducted at arms length and had a value of €141,756.
- •
- David Hargaden, a director of the company during the period, is non-executive chairman of MyHome.ie, to which the Group made sales of €69,494 on an arms length basis during the period.
- •
- The Group also generated turnover of €494,367 on an arms length basis from ACCPAC during the period.
F-55
- (i)
- Government grants
16. Commitments and contingencies
- (ii)
- Operating lease commitments
Under the terms of grant agreements with Enterprise Ireland, the Group is entitled to receive grants in respect of marketing development, employment, and research and development costs. The Group has a contingent liability to repay part or all of certain of these grants in certain circumstances, the principal ones being the winding up of the Group or the failure of the Group to meet employment targets specified in the grant agreements. At December 18, 2002 the total of such grants received or receivable amounted to €193,217.
The Group has annual commitments under operating leases at December 18, 2002, principally in respect of premises, as follows:
| | As at December 18, 2002 € | |
|---|---|---|
| Operating leases which expire: | ||
| Within one year | 84,771 | |
| 84,771 | ||
17. Reconciliation of net cash outflow from operating loss
| | Period from January 1, 2002 to December 18, 2002 € | ||
|---|---|---|---|
| Operating loss | (985,735 | ) | |
| Depreciation of tangible fixed assets | 177,591 | ||
| Share options charge | 37,012 | ||
| (Increase) in debtors | (356,498 | ) | |
| Increase in creditors | 49,520 | ||
| Net cash outflow from operating activities | (1,078,110 | ) | |
F-56
18a. Reconciliation of net cash outflow to net funds
| | Period from January 1, 2002 to December 18, 2002 € | ||
|---|---|---|---|
| Decrease in cash | (1,181,033 | ) | |
| Change in net funds resulting from cash flows | (1,181,033 | ) | |
| Non-cash changes in net funds | 55,898 | ||
| Movement in net funds during period | (1,125,135 | ) | |
| Net funds at the beginning of the period | 1,758,003 | ||
| Net funds at end of period | 632,868 | ||
18b. Reconciliation of net funds
| | At December 18, 2002 € | At January 1, 2001 € | Cash flow 2002 € | ||||
|---|---|---|---|---|---|---|---|
| Cash at bank and in hand | 1,875,299 | (1,181,033 | ) | 694,266 | |||
| Finance lease obligations | (117,296 | ) | 55,898 | (61,398 | ) | ||
| Net funds at start and end of period | 1,758,003 | (1,125,135 | ) | 632,868 | |||
19. Differences between Irish and US GAAP
A reconciliation of net loss and shareholders' funds under Irish and US GAAP is provided below. The financial statements of the Group are prepared under Irish GAAP, which differ in certain significant respects from US GAAP. The significant differences, as they apply to the financial statements, are as follows:
Revenue recognition
There are no definitive accounting standards under Irish GAAP in relation to software revenue recognition. The Group's accounting policy as detailed in note 1 is in accordance with available guidance.
Under US GAAP, the Group applies SOP 97-2 "Software Revenue Recognition", as supplemented by other related guidance issued by the AICPA. In accordance with SOP 97-2, revenue is recognized when persuasive evidence of an arrangement exists, delivery has occurred, the fee is fixed and determinable, and collectibility is probable. Under SOP 97-2, revenue on multiple element arrangements is allocated to the various elements based on vendor specific objective evidence of the fair values.
F-57
Support revenues are recognized rateably over the term of the maintenance contract, typically 12 months. Consulting and training revenues are recognized as the services are performed and are usually on a time and materials basis. Such services primarily consist of implementation services related to the installation of the Group's products and do not include significant customisation or development of the underlying software code.
For arrangements involving significant production, modification or customisation of software, the Group applies SOP 81-1 "Accounting for Performance of Construction-Type and Certain Production-Type Contracts" as required by SOP 97-2. Under SOP 81-1, arrangements are accounted for using the percentage of completion method whereby revenues and costs are recognized based on the stage of completion of the contract at the balance sheet date, or the completed contract method whereby revenues and costs are recognized on completion of the contract, depending on the nature of individual arrangements. The percentage of completion method is used when the Group can reliably estimate in advance the revenues and costs associated with the contract. The completed contract method is used when the Group cannot reliably estimate in advance the revenues and costs associated with the contract.
In the year ended December 31, 2001 the Group entered into a long-term arrangement involving significant customization of software. The Group received a non-refundable upfront fee for the arrangement. Under Irish GAAP the revenue from this arrangement is recognized up front. Under US GAAP, as the Group could not reliably estimate all revenues and costs associated with the arrangement in advance, the Group has deferred all revenues received and costs incurred by the balance sheet date until the completion of the arrangement.
In the period ended December 18, 2002 the Group entered into an arrangement involving license, support and service revenue with payment for the license fees related to the completion of the services. Under Irish GAAP license revenue from this arrangement has been fully recognized in the period. Under US GAAP the license fee instalments are being recognized as they become due and payable.
Vacation accrual
Under US GAAP, employers must accrue for the cost of all vacation days due to employees at the balance sheet date. Under Irish GAAP, there is no requirement to accrue for these costs.
F-58
19. Difference between Irish and United States accounting principles
The following is the reconciliation between Irish GAAP and US GAAP of net loss and shareholders' equity:
| Net loss | Period from January 1, 2002 to December 18, 2002 € | ||||
|---|---|---|---|---|---|
| Net loss as stated under Irish GAAP | (989,545 | ) | |||
| Adjustments to conform to US GAAP | |||||
| Revenue recognition—Revenue | (142,500 | ) | |||
| Research and development | 191,000 | ||||
| Administrative expenses | 56,000 | ||||
| Vacation accrual | (8,170 | ) | |||
| Net loss as stated under US GAAP | (893,215 | ) | |||
| Shareholders' equity | As at December 18, 2002 € | |||
|---|---|---|---|---|
| Shareholders' funds as stated under Irish GAAP | 1,172,878 | |||
| Adjustments to conform to US GAAP | ||||
| Revenue recognition | (341,588 | ) | ||
| Vacation accrual | (96,496 | ) | ||
| Shareholders' equity as stated under US GAAP | 734,794 | |||
Consolidated cash flow data
In accordance with Irish GAAP the Group complies with Financial Reporting Standard No 1,Cash Flow Statements ("FRS 1"). Its objectives and principles are similar to those set out in SFAS No. 95,Statement of Cash Flows ("SFAS 95"). The principal difference between the standards is in respect to classification. Under FRS 1, the Group has presented its cashflows for (a) operating activities; (b) returns on investment and servicing of finance; (c) taxation; (d) capital expenditure; and (e) financing activities. SFAS 95 requires only three categories of cash flow activities, (a) operating; (b) investing; and (c) financing. Cash flows arising from taxation and returns on
F-59
investments and servicing of finance under FRS 1 are included as operating activities under SFAS 95. The following is the US GAAP cashflow data.
| | Period from January 1, 2002 to December 18, 2002 € | ||
|---|---|---|---|
| Net cash outflow from operating activities | (1,078,020 | ) | |
| Net cash outflow from investing activities | (47,115 | ) | |
| Net cash outflow from financing activities | (55,898 | ) | |
| Net decrease in cash and cash equivalents under US GAAP | (1,181,033 | ) | |
| Cash and cash equivalents at beginning of period | 1,875,299 | ||
| Cash and cash equivalents at end of period | 694,266 | ||
20. Financial period
The financial statements cover the period from January 1, 2002 to December 18, 2002.
F-60
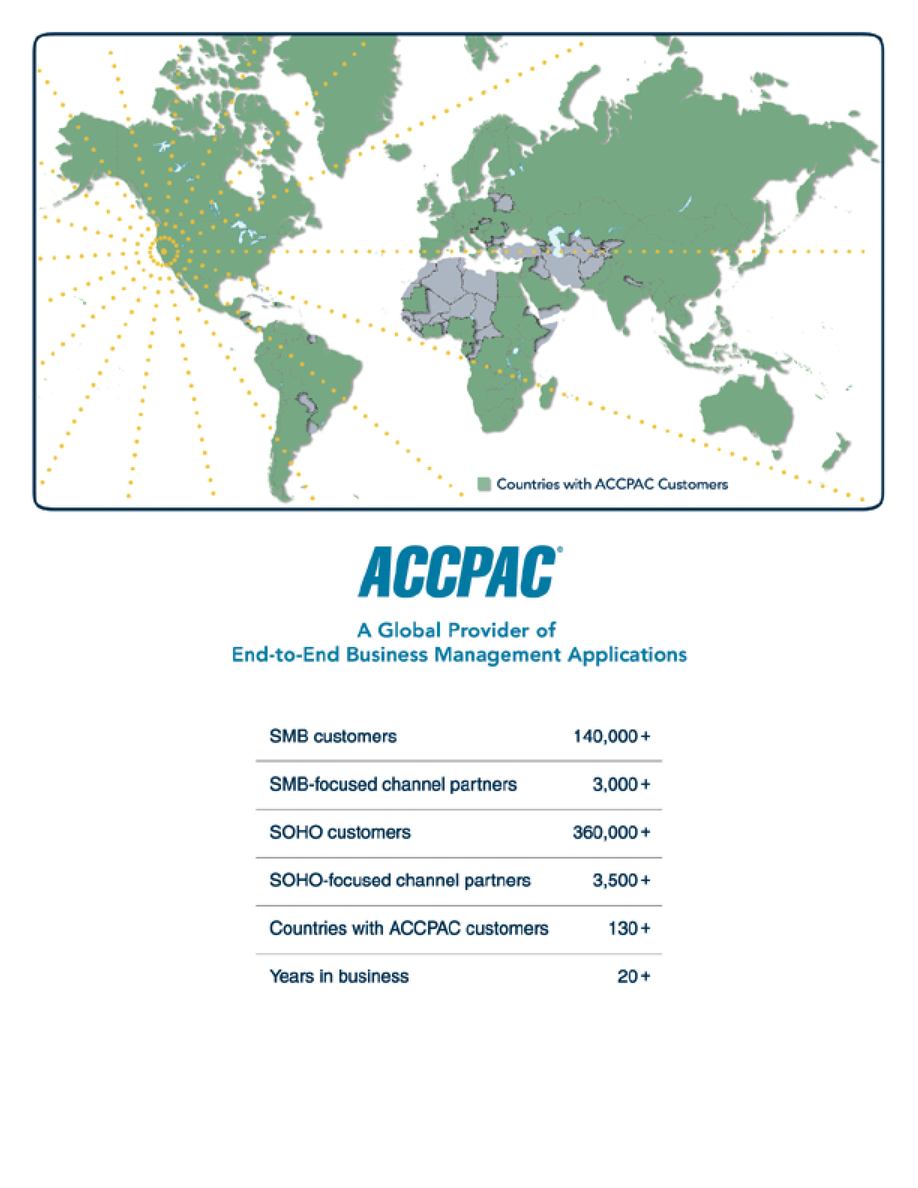
Derived from aggregate customer data over the past 20 years.
Shares

Common Stock
PRICE $ PER SHARE
RBC Capital Markets
SoundView Technology Group
Adams, Harkness & Hill, Inc.
, 2003
PART II
INFORMATION NOT REQUIRED IN PROSPECTUS
Item 13. Other Expenses of Issuance and Distribution
The following table sets forth the fees and expenses, other than the underwriting discounts and commissions, payable by the Registrant in connection with the sale of the common stock being registered. All amounts shown are estimates except for the Securities and Exchange Commission registration fee, the NASD filing fee and the Nasdaq National Market listing fee.
| SEC registration fee | $ | 3,680 | ||
| NASD filing fee | 4,500 | |||
| Nasdaq National Market listing fee | 100,000 | |||
| Blue sky qualification fees and expenses | 5,000 | |||
| Accounting fees and expenses | 1,250,000 | |||
| Legal fees and expenses | 650,000 | |||
| Printing and engraving expenses | 325,000 | |||
| Transfer agent and registrar fees | 10,000 | |||
| Miscellaneous fees | 1,820 | |||
| Total | $ | 2,350,000 | ||
Item 14. Indemnification of Directors and Officers
Section 145 of the General Corporation Law of the State of Delaware empowers a Delaware corporation to indemnify any persons who are, or are threatened to be made, parties to any threatened, pending or completed legal action, suit or proceeding, whether civil, criminal, administrative or investigative (other than an action by or in the right of such corporation), by reason of the fact that such person is or was an officer or director of such corporation, or is or was serving at the request of such corporation as a director, officer, employee or agent of another corporation or enterprise. The indemnity may include expenses (including attorneys' fees), judgments, fines and amounts paid in settlement actually and reasonably incurred by such person in connection with such action, suit or proceeding, provided that such officer or director acted in good faith and in a manner he or she reasonably believed to be in or not opposed to the corporation's best interests, and, for criminal proceedings, had no reasonable cause to believe his or her conduct was illegal. A Delaware corporation may indemnify officers and directors against expenses (including attorneys' fees) in connection with the defense or settlement of an action by or in the right of the corporation under the same conditions, except that no indemnification is permitted without judicial approval if the officer or director is adjudged to be liable to the corporation unless and only to the extent that the court in which the action or suit was brought will determine upon application that the defendant directors, officers, employees or agents are fairly and reasonably entitled to indemnity for such expenses despite such adjudication of liability. Where an officer or director is successful on the merits or otherwise in the defense of any action referred to above, the corporation must indemnify him or her against the expenses which such officer or director actually and reasonably incurred.
As permitted by Delaware law, our certificate of incorporation provides that our directors will not be personally liable to us or our stockholders for monetary damages for breach of fiduciary duty as a director to the fullest extent permitted by Delaware law as it now exists or as it may be
II-1
amended. As of the date of this prospectus, Delaware law permits limitations of liability for a director's breach of fiduciary duty other than liability for the following:
- •
- any breach of the director's duty of loyalty to us or our stockholders;
- •
- acts or omissions not in good faith or that involve intentional misconduct or a knowing violation of law;
- •
- unlawful payments of dividends or unlawful stock repurchases or redemptions, pursuant to section 174 of the Delaware General Corporation Law; or
- •
- any transaction from which the director derived an improper personal benefit.
The effect of this provision will be to eliminate the personal liability of directors for monetary damages for actions involving a breach of their fiduciary duty of care, including any such actions involving gross negligence, except in the situations described above.
Our bylaws provide that we will indemnify our directors, officers, employees and agents (and those serving at our request as a director, officer, partner, trustee, employee or agent of another corporation, partnership, joint venture, trust or other enterprise or as a trustee or administrator under an employee benefit plan) against expenses (including attorneys' fees), judgments, fines and amounts paid in settlement actually and reasonably incurred in any action, suit or proceeding arising out of his or her status as a director, officer, employee or agent or activities in any of those capacities if he or she acted in good faith and in a manner he or she reasonably believed to be in, or not opposed to, the best interests of us. We will pay expenses incurred by a director, officer, employee or agent in defending an action, suit or proceeding, or at a time when he or she has not been named as a defendant or a respondent, in advance of the final disposition of the action, suit or proceeding upon receipt of an undertaking by or on behalf of the director, officer, employee or agent to repay the amount if it will ultimately be determined that he or she is not entitled to be indemnified by us.
We have entered into indemnification agreements with each of our directors and officers. These agreements, among other things, will require us to indemnify each director and officer for some expenses including attorneys' fees, judgments, fines and settlement amounts incurred by any of these persons in any action or proceeding, including any action by or in the right of ACCPAC, arising out of the person's services as our director or officer, any subsidiary of ours or any other company or enterprise to which the person provides services at our request.
The underwriting agreement will provide for indemnification by the underwriters of ACCPAC, our directors, our officers who sign the registration statement, and our controlling persons for some liabilities, including liabilities arising under the Securities Act of 1933, as amended (the "Securities Act").
We have entered into a director and officer insurance policy that is intended to provide for reimbursement or payments for losses arising from claims against covered directors and officers, up to the limits of the coverage.
Item 15. Recent Transfers of Unregistered Securities
Between October 1, 1999 and December 31, 2002, we granted options to purchase an aggregate of 2,885,000 shares of our common stock to our executive officers and employees at per share exercise prices ranging from $4.20 to $10.50. In connection with these grants, between
II-2
October 1, 1999 and December 31, 2002 we issued 500 shares of our common stock to our executive officers and employees at a per share exercise price of $4.20.
On August 6, 2002, we issued to our directors Sidney Braginsky, David Giddings and William Rizzardi options to purchase an aggregate of 30,000 shares of our common stock under the 2002 Stock Incentive Plan at an exercise price per share of $9.00.
On November 11, 2002, we issued to our directors Alfonse D'Amato and Bruce Blakeman options to purchase an aggregate of 20,000 shares of our common stock under the 2002 Stock Incentive Plan at an exercise price per share of $9.00.
�� On December 2, 2002, we issued to Michael Hoberg, our Chief Financial Officer, and other employees options to purchase an aggregate of 193,500 shares of our common stock under the 2002 Stock Incentive Plan at an exercise price per share of $9.00.
On December 18, 2002, we issued a total of 830,555 restricted shares of common stock in a transaction exempt from the registration requirements of the Securities Act pursuant to Regulation S promulgated thereunder, in connection with the acquisition of eWare Limited, a privately held company organized under the laws of Ireland.
On January 8, 2003, we issued 113,889 shares of restricted common stock to employees of eWare Limited, which will vest in three equal annual installments, subject to continued employment. The issuance was exempt from the registration requirements of the Securities Act pursuant to Rule 701 thereof.
No underwriters were engaged in connection with any of the foregoing issuances of securities. With the exception of the restricted shares of common stock issued in connection with our acquisition of eWare Limited, the securities issued in the above transactions were offered and sold in reliance upon the exemptions from registration under Section 4(2) of the Securities Act or Rule 701 promulgated under the Securities Act, relative to sales by an issuer not involving any public offering.
Item 16. Exhibits and Financial Statement Schedules
- (a)
- Exhibits
| 1.1 | * | Form of Underwriting Agreement |
| 3.1 | ** | Amended and Restated Certificate of Incorporation of the Registrant |
| 3.2 | ** | Amended and Restated Bylaws of the Registrant |
| 4.1 | * | Form of Common Stock Certificate of the Registrant |
| 4.2 | ** | Forms of Subscription and Registration Rights Agreement and Share Sale Agreement |
| 5.1 | * | Opinion of Covington & Burling |
| 10.1 | ** | Contribution Agreement between the Registrant and Computer Associates, dated January 7, 1998 |
| 10.2 | ** | Promissory Note, between the Registrant and Computer Associates dated January 7, 1998 |
| 10.3 | ** | Amended and Restated Real Estate Agreement between the Registrant and Computer Associates, dated October 1, 2001 |
| 10.4 | ** | Form of Indemnification Agreement |
| 10.5 | ** | 1998 Stock Incentive Plan of the Registrant |
| 10.6 | ** | 2002 Stock Incentive Plan of the Registrant |
| 10.7 | ** | 2002 Employee Stock Purchase Plan of the Registrant |
II-3
| 10.8 | ** | Computer Associates Year 2000 Employee Stock Purchase Plan (incorporated by reference to Exhibit A of Computer Associates' definitive Proxy Statement dated July 12, 1999) |
| 10.9 | ** | Office Lease between Registrant and Patrician Associates, Inc., dated June 5, 1998 |
| 10.10 | ** | Office Lease, as amended February 21, 2001, between Bentall Properties Ltd., Westminster Management Corp. and ACCPAC Canada Inc. |
| 10.11 | ** | Office Lease, as amended March 6, 2000, between Bentall Properties Ltd., Westminster Management Corp. and ACCPAC Canada Inc. |
| 10.12 | ** | Assignment and Assumption Agreement between the Registrant and Computer Associates dated July 14, 2000 |
| 10.13 | ** | Promissory Note, as amended November 13, 2002, between the Registrant and Computer Associates |
| 10.14 | ** | Assignment and Assumption Agreement between ACCPAC Australia Pacific, Inc. and Computer Associates Pty Limited dated August 15, 2000 |
| 10.15 | ** | Assignment and Assumption Agreement between ACCPAC Africa (Pty) Ltd. and Computer Associates Africa (Pty) Ltd. dated July 13, 2000 |
| 10.16 | ** | Price Book License Agreement between the Registrant and Computer Associates dated September 3, 2002 |
| 10.17 | ** | Product Transfer Agreement between the Registrant and Computer Associates dated January 1, 2000 |
| 10.18 | ** | Waiver, Consent and Agreement between the Registrant and Computer Associates, dated November 13, 2002 |
| 21.1 | ** | Subsidiaries of the Registrant |
| 23.1 | Consent of KPMG LLP, Independent Accountants | |
| 23.2 | Consent of KPMG, Independent Accountants | |
| 23.3 | * | Consent of Covington & Burling (included in Exhibit 5.1) |
| 24.1 | ** | Power of Attorney |
- *
- To be filed by Amendment
- **
- Previously Filed
- (b)
- Financial Statement Schedule
Schedules have been omitted because the information required to be set forth therein is not applicable or is shown in the Consolidated Financial Statements or Notes thereto.
The undersigned registrant hereby undertakes:
(1) That for purposes of determining any liability under the Securities Act, the information omitted from the form of this prospectus filed as part of this Registration Statement in reliance upon Rule 430A and contained in a form of prospectus filed by the Registrant pursuant to Rule 424(b)(1) or (4) or 497(h) under the Securities Act shall be deemed to be part of this Registration Statement as of the time it was declared effective.
(2) That for purposes of determining any liability under the Securities Act, each post-effective amendment that contains a form of prospectus shall be deemed to be a new
II-4
registration statement relating to the securities offered therein, and the offering of the securities at that time shall be deemed to be the initial bona fide offering thereof.
(3) Insofar as indemnification for liabilities arising under the Securities Act may be permitted to directors, officers and controlling persons of the Registrant pursuant to the provisions referenced in Item 15 of this Registration Statement or otherwise, the Registrant has been advised that in the opinion of the Securities and Exchange Commission this indemnification is against public policy as expressed in the Securities Act and is, therefore, unenforceable. In the event that a claim for indemnification against these liabilities (other than the payment by the Registrant of expenses incurred or paid by a director, officer or controlling person of the Registrant in the successful defense of any action, suit or proceeding) is asserted by a director, officer or controlling person in connection with the securities being registered, the Registrant will, unless in the opinion of its counsel the matter has been settled by controlling precedent, submit to a court of appropriate jurisdiction the question of whether the indemnification by it is against public policy as expressed in the Securities Act, and will be governed by the final adjudication of this issue.
(4) To provide to the Underwriters at the closing specified in the Underwriting Agreement certificates in the denomination and registered in the names required by the Underwriters to permit prompt delivery to each purchaser.
II-5
Pursuant to the requirements of the Securities Act of 1933, as amended, the Registrant has duly caused this Amendment to be signed on its behalf by the undersigned, thereunto duly authorized, in the city of Pleasanton, state of California, on February 21, 2003.
| ACCPAC INTERNATIONAL, INC. | |||
By: | /s/ DAVID M. HOOD David M. Hood President, Chief Executive Officer and Chairman of the Board of Directors | ||
Pursuant to the requirements of the Securities Act of 1933, this Registration Statement has been signed by the following persons in the capacities and on the dates indicated.
| Name | Title | Date | ||
|---|---|---|---|---|
| /s/ DAVID M. HOOD David M. Hood | President, Chief Executive Officer and Chairman of the Board of Directors (Principal Executive Officer) | February 21, 2003 | ||
/s/ DONNAT LETTMAN Donnat Lettman | Executive Vice President, Chief Operating Officer and Director | February 21, 2003 | ||
* Michael Hoberg | Senior Vice President, Chief Financial Officer (Principal Financial and Accounting Officer) | February 21, 2003 | ||
* Sidney Braginsky | Director | February 21, 2003 | ||
* David Giddings | Director | February 21, 2003 | ||
* William Rizzardi | Director | February 21, 2003 | ||
* Alfonse D'Amato | Director | February 21, 2003 | ||
* Bruce Blakeman | Director | February 21, 2003 |
*By: | /s/ DAVID M. HOOD David M. Hood Attorney-in-Fact |
II-6
| Exhibit Number | Exhibit Description | |
|---|---|---|
| 1.1 | * | Form of Underwriting Agreement |
| 3.1 | ** | Amended and Restated Certificate of Incorporation of the Registrant |
| 3.2 | ** | Amended and Restated Bylaws of the Registrant |
| 4.1 | * | Form of Common Stock Certificate of the Registrant |
| 4.2 | ** | Forms of Subscription and Registration Rights Agreement and Share Sale Agreement |
| 5.1 | * | Opinion of Covington & Burling |
| 10.1 | ** | Contribution Agreement between the Registrant and Computer Associates, dated January 7, 1998 |
| 10.2 | ** | Promissory Note, between the Registrant and Computer Associates dated January 7, 1998 |
| 10.3 | ** | Amended and Restated Real Estate Agreement between the Registrant and Computer Associates, dated October 1, 2001 |
| 10.4 | ** | Form of Indemnification Agreement |
| 10.5 | ** | 1998 Stock Incentive Plan of the Registrant |
| 10.6 | ** | 2002 Stock Incentive Plan of the Registrant |
| 10.7 | ** | 2002 Employee Stock Purchase Plan of the Registrant |
| 10.8 | ** | Computer Associates Year 2000 Employee Stock Purchase Plan (incorporated by reference to Exhibit A of Computer Associates' definitive Proxy Statement dated July 12, 1999) |
| 10.9 | ** | Office Lease between Registrant and Patrician Associates, Inc., dated June 5, 1998 |
| 10.10 | ** | Office Lease, as amended February 21, 2001, between Bentall Properties Ltd., Westminster Management Corp. and ACCPAC Canada Inc. |
| 10.11 | ** | Office Lease, as amended March 6, 2000, between Bentall Properties Ltd., Westminster Management Corp. and ACCPAC Canada Inc. |
| 10.12 | ** | Assignment and Assumption Agreement between the Registrant and Computer Associates dated July 14, 2000 |
| 10.13 | ** | Promissory Note, as amended November 13, 2002, between the Registrant and Computer Associates |
| 10.14 | ** | Assignment and Assumption Agreement between ACCPAC Australia Pacific, Inc. and Computer Associates Pty Limited dated August 15, 2000 |
| 10.15 | ** | Assignment and Assumption Agreement between ACCPAC Africa (Pty) Ltd. and Computer Associates Africa (Pty) Ltd. dated July 13, 2000 |
| 10.16 | ** | Price Book License Agreement between the Registrant and Computer Associates dated September 3, 2002 |
| 10.17 | ** | Product Transfer Agreement between the Registrant and Computer Associates dated January 1, 2000 |
| 10.18 | ** | Waiver, Consent and Agreement between the Registrant and Computer Associates, dated November 13, 2002 |
| 21.1 | ** | Subsidiaries of the Registrant |
| 23.1 | Consent of KPMG LLP, Independent Accountants | |
| 23.2 | Consent of KPMG, Independent Accountants | |
| 23.3 | * | Consent of Covington & Burling (included in Exhibit 5.1) |
| 24.1 | ** | Power of Attorney |
- *
- To be filed by Amendment
- **
- Previously Filed
TABLE OF CONTENTS
DEALER PROSPECTUS DELIVERY OBLIGATION
PROSPECTUS SUMMARY
ACCPAC International, Inc.
The Offering
Summary Consolidated Financial Data
RISK FACTORS
Risks Related to Our Business
Risks Relating to Computer Associates
Risks Related to the Offering
FORWARD-LOOKING STATEMENTS
MARKET AND INDUSTRY DATA
USE OF PROCEEDS
DIVIDEND POLICY
CAPITALIZATION
DILUTION
SELECTED CONSOLIDATED FINANCIAL DATA
MANAGEMENT'S DISCUSSION AND ANALYSIS OF FINANCIAL CONDITION AND RESULTS OF OPERATIONS
BUSINESS
MANAGEMENT
Summary Compensation Table
Option Grants in Fiscal 2002
Option Values at March 31, 2002 for Computer Associates' Stock
CERTAIN TRANSACTIONS
PRINCIPAL AND SELLING STOCKHOLDERS
DESCRIPTION OF CAPITAL STOCK
SHARES ELIGIBLE FOR FUTURE SALE
UNDERWRITING
LEGAL MATTERS
EXPERTS
WHERE YOU CAN FIND MORE INFORMATION
TRADEMARKS
ACCPAC International, Inc. and Subsidiaries Index to Consolidated Financial Statements
INDEPENDENT AUDITORS' REPORT
ACCPAC International, Inc. and Subsidiaries Consolidated Balance Sheets (In Thousands, Except Share and Per Share Amounts)
ACCPAC International, Inc. and Subsidiaries Consolidated Statements of Operations (In Thousands, Except Per Share Amounts)
ACCPAC International, Inc. and Subsidiaries Consolidated Statements of Stockholders' Equity (Deficit) and Comprehensive Income (Loss) (In Thousands)
ACCPAC International, Inc. and Subsidiaries Consolidated Statements of Cash Flows (In Thousands)
ACCPAC International, Inc. and Subsidiaries Notes to the Consolidated Financial Statements (Information for the Nine-Months Ended December 31, 2001 is Unaudited)
PRO FORMA FINANCIAL INFORMATION
ACCPAC International, Inc. Pro Forma Unaudited Combined Condensed Statements of Operations Year Ended March 31, 2002 (In Thousands, Except Per Share Amounts)
ACCPAC International, Inc. Pro Forma Unaudited Combined Condensed Statements of Operations Nine Months Ended December 31, 2002 (In Thousands, Except Per Share Amounts)
NOTES TO THE UNAUDITED PRO FORMA COMBINED CONDENSED FINANCIAL INFORMATION
INDEPENDENT AUDITORS' REPORT TO THE BOARD OF DIRECTORS AND SHAREHOLDERS OF EWARE LIMITED
eWare Limited and Subsidiaries Consolidated Profit and Loss Account
eWare Limited and Subsidiaries Consolidated Statement of Total Recognized Gains and Losses
eWare Limited and Subsidiaries Consolidated Balance Sheet
eWare Limited and Subsidiaries Consolidated Cash Flow Statement for the Period Ended December 18, 2002
eWare Limited and Subsidiaries Notes to the Consolidated Financial Statements
PART II INFORMATION NOT REQUIRED IN PROSPECTUS
- Item 13. Other Expenses of Issuance and Distribution
Item 14. Indemnification of Directors and Officers
Item 15. Recent Transfers of Unregistered Securities
Item 16. Exhibits and Financial Statement Schedules
Item 17. Undertakings
EXHIBIT INDEX