Exhibit 1
Denison Mines
2011 Annual Report
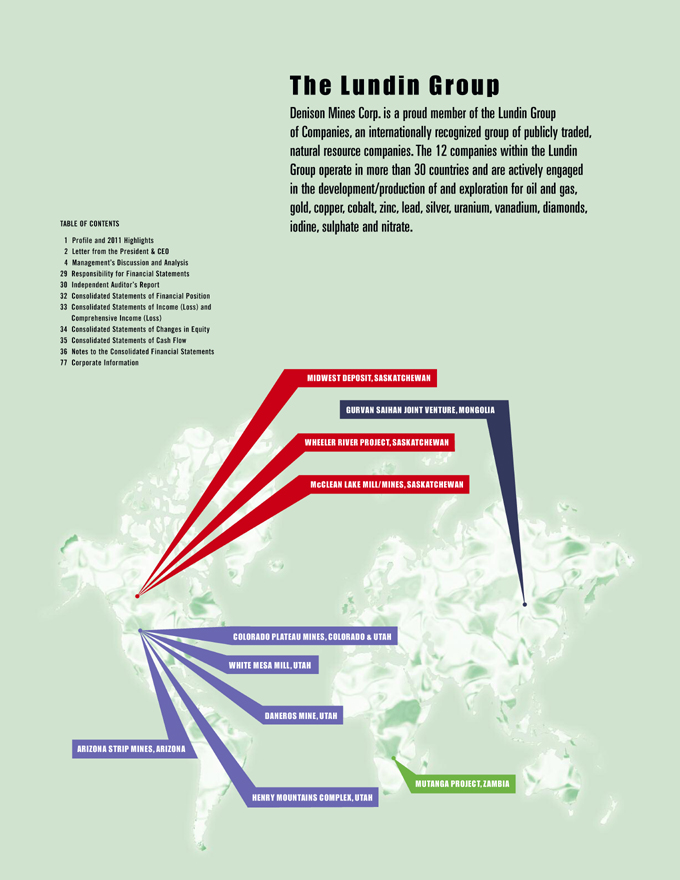
The Lundin Group
Denison Mines Corp. is a proud member of the Lundin Group of Companies, an internationally recognized group of publicly traded, natural resource companies. The 12 companies within the Lundin Group operate in more than 30 countries and are actively engaged in the development/production of and exploration for oil and gas, gold, copper, cobalt, zinc, lead, silver, uranium, vanadium, diamonds, iodine, sulphate and nitrate.
TABLE OF CONTENTS
1 | Profile and 2011 Highlights |
2 | Letter from the President & CEO |
4 | Management’s Discussion and Analysis |
29 | Responsibility for Financial Statements |
30 | Independent Auditor’s Report |
32 | Consolidated Statements of Financial Position |
33 | Consolidated Statements of Income (Loss) and Comprehensive Income (Loss) |
34 | Consolidated Statements of Changes in Equity |
35 | Consolidated Statements of Cash Flow |
36 | Notes to the Consolidated Financial Statements |
77 | Corporate Information |

 | Denison Mines Corp. (TSX: DML) (NYSE AMEX: DNN) is an intermediate uranium producer with production in the U.S., combined with a diversified development portfolio of projects in the U.S., Canada, Zambia and Mongolia. Denison’s assets include its 100% ownership of the White Mesa mill in Utah and its 22.5% ownership of the McClean Lake mill in Saskatchewan. The Company also produces vanadium as a co-product from some of its mines in Colorado and Utah.
Denison owns interests in world-class exploration projects in the Athabasca Basin in Saskatchewan, including its 60% owned flagship project at Wheeler River and in the southwestern United States, Mongolia and Zambia. |
Denison is the manager of Uranium Participation Corporation (TSX:U). Denison is also engaged in mine decommissioning and environmental services through its Denison Environmental Services (DES) division.

• In 2011, Denison continued to grow through exploration. At Wheeler River in Saskatchewan, our summer drill program was successful in expanding the potential estimated resources of the Phoenix Deposit with the discovery of the Zone A Extension. Denison also completed a successful two-phase drilling program at its wholly owned Mutanga project in Zambia, which culminated in the announcement of a new resource estimate prepared according to National Instrument 43-101 early in 2012. The 2011 drilling campaign added approximately 28 million pounds of inferred mineral resources to Denison’s current estimates at Mutanga project.
• Denison produced 1.0 million pounds of uranium and 1.3 million pounds of vanadium and sold 1.1 million pounds of uranium and 1.8 million pounds of vanadium at average prices of $58.04 per pound uranium and $6.41 per pound vanadium.
• During the year, Denison acquired White Canyon Uranium Limited. White Canyon’s key assets are well located in southeastern Utah, near Denison’s White Mesa mill. With this transaction, Denison acquired the producing Daneros uranium mine, the advanced Lark Royal project and the Thompson, Geitus, Blue Jay and Marcy Look exploration projects. The acquisition also gives Denison the strategic benefit of enhancing Denison’s production plans for the White Mesa mill. |  |
| • | Denison’s development plans at its Pinenut mine in Arizona progressed well in 2011. As Denison completes licencing requirements, production is expected to commence this year. Similarly, in Mongolia, Denison completed and submitted mining licence applications on four of the five Gurvan Saihan Joint Venture licence areas, bringing those projects closer to a production decision. |
| • | The tragic events in Japan that unfolded after the devastating earthquake and tsunami in March 2011 had an adverse impact on the uranium industry and made 2011 one of the most challenging years in recent times for Denison and its peers. Nonetheless, Denison has emerged from 2011 essentially debt-free and with a cash balance in excess of $53 million. |
Denison Mines Corp. Annual Report 2011 | 1
Letter from the President & CEO

Ron F. Hochstein
President and Chief Executive Officer
Dear Shareholders,
At this time last year, Japan had been hit by one of the strongest earthquakes in that country’s history and then suffered a subsequent tsunami of record proportions. These natural disasters resulted in mass destruction and led to the crisis at the Fukushima-Dachii nuclear power facility. Our hearts went out to the Japanese people as they struggled to recover – a recovery that is still going on.
At the beginning of 2011, the uranium market was strong with rising uranium prices and much optimism. However, the economic impact of the natural disasters in Japan was sudden and far reaching, perhaps felt nowhere as significantly as in the nuclear and uranium industries. Uranium producers faced uncertainty as governments reacted by reevaluating their nuclear power programs. Some countries promptly announced the shutdown of their nuclear power programs over the next several years while others announced a suspension of construction activities and extensive safety reviews. As a result, 2011 was a difficult year for Denison and its shareholders.
A year after the Japanese earthquake, the impact of the Fukushima incident is becoming better understood and the importance of nuclear power to provide carbon-free electricity to developed and developing nations throughout the world is returning, and bringing with it a brighter future for nuclear power and the uranium industry. Signs of a recovery are emerging in the uranium spot price. By the end of 2011, uranium spot prices had stabilized at about $52.00 per pound. Although 30% off 2011’s peak price of $73.00 per pound, the year end spot price was 10% higher than the 2010 average spot price. We believe that there will be a strengthening in the uranium spot price through 2012, particularly as the industry witnesses the end of the Russian-American Highly Enriched Uranium agreement in late 2013. With the end of this agreement, uranium currently available from the down blending of Russian nuclear warheads will no longer be available, taking about 18 to 24 million pounds of uranium out of annual supply.
DENISON IS ENCOURAGED BY ITS EXPLORATION
results at Wheeler River to date and believes that it has only scratched the surface of the potential of Wheeler River property.
Although the shutdown of some nuclear programs will have an impact on demand in the short term, the fundamentals of the uranium market are strong, long term, as the number of nuclear power reactors under construction, planned and proposed, is projected to be higher than it was in 2011 prior to the events in Japan. Along with all of Denison’s management team, I believe that the uranium market will recover.
With this firm belief, Denison’s focus was twofold in 2011. Our first goal was to increase and develop our mineral resource base so that Denison will be well positioned to react quickly to the market when it returns. Denison advanced this goal substantially last year in each of the jurisdictions where it carries on business.
In Canada, at the Wheeler River project where Denison has a 60% interest and is operator, drilling continued successfully to expand the potential resources of the Phoenix deposits, for which Denison announced inaugural mineral resource estimates late in 2010. Based on current estimates, Phoenix is the third highest grade deposit in the world behind Cameco Corporation’s Cigar Lake and McArthur River projects, which are both located nearby in the Athabasca Basin region of northern Saskatchewan. Our goal of resource expansion has continued during the 2012 drill winter program at Phoenix and will be pursued ambitiously during this summer’s drill program. In addition, drilling this summer will include the testing of other known targets near Phoenix to hopefully identify new deposits. Denison is encouraged by its exploration results at Wheeler River to date and believes that it has only scratched the surface of the potential of Wheeler River property.
2 | Denison Mines Corp. Annual Report 2011
In Zambia, at Denison’s wholly-owned Mutanga project, drilling during last year’s campaign followed up on an initial discovery in 2009 and has resulted in an increase of more than 100% in the total mineral resource estimates at the project. Resources at Mutanga now total 50.0 million pounds U3O8. While lower grade than deposits in other parts of the world, the deposits at Mutanga have the advantage of being near surface and therefore can be mined by less expensive open pit methods. In addition, the project is located near both transportation and power infrastructure and, most importantly, is permitted. In 2010, Denison was granted 25-year mining licences for the project, had its environmental plan approved and was issued the only radioactive materials licence for a mining project in Zambia. In 2012, a similar scale exploration program is planned, and we are striving to match our 2011 success.
In Mongolia last year, our Gurvan Saihan Joint Venture was advanced closer to development as mining licence applications were submitted on four of the five licence areas. On one of the licence areas called Ulziit, we also had a new discovery which we are very excited about. Denison also made progress in meeting new legislated ownership requirements by negotiating terms for the acquisition of one of its joint venture partner’s interests in the Gurvan Saihan Joint Venture to facilitate bringing Mongolia’s interest to the requisite level. Denison expects to close this transaction this year, thus clarifying the Company’s plans in this country. In 2012, Denison plans to follow up on each of these successes.
In the United States, our exploration programs near our Beaver and Pandora operating mines identified new mining targets which more than replaced the uranium produced from these two operations in the past year. At Arizona 1, we estimate that drilling at depths has extended the mine life by four to six months, and drilling is still ongoing.
As its second goal and significant accomplishment in 2011, Denison improved its U.S. operations, where all of Denison’s production came from last year. Improvement in the U.S. came largely through the optimization of mine production, the identification of operating efficiencies and better productivity. The acquisition of White Canyon Uranium Limited was also a big contributor to this success. White Canyon owned the Daneros mine which has been in operation since 2010. This mine is higher grade than Denison’s Colorado Plateau and Henry Mountain mines and is closer to Denison’s White Mesa mill, which all translates into lower operating costs. With the same goal in mind, Denison also advanced the development of the Pinenut mine on the Arizona Strip. Pinenut will be our second operating mine on the Arizona Strip. The mines on the Arizona strip are our lowest cost source of uranium mine production. However, even with this acquisition and the development of new ore sources, Denison knows that it will still need to focus more on operating costs in 2012 to ensure that it is ready to capitalize on a strong uranium market in the future.
WE HAVE STARTED 2012 WITH A STRONG CASH BALANCE,
which will provide Denison with the resources necessary to continue to grow through exploration and development this year.
In 2011, Denison produced approximately 1.0 million pounds U3O8, entirely from its White Mesa mill, and 1.3 million pounds of vanadium as V2O5. In Canada, the McClean Lake mill continued to be on stand-by. In 2012, Denison is projecting a 40% increase in our uranium production to 1.4 million pounds U3O8. Due to the types of ore and alternate feed expected to be processed at White Mesa combined with lower reagent costs, our production costs are expected to decline by about 30% to $33.50 per pound U3O8, net of vanadium credits. One downside to this ore mix is a decline in our projected vanadium production to 0.6 million pounds V2O5 in 2012.
On the financial front, we have started 2012 with a strong cash balance, which will provide Denison with the resources necessary to continue to grow through exploration and development this year.
On behalf of the board of directors, management and employees of Denison, I would like to thank you for your unwavering support. With your continued support in 2011, we have made good progress in positioning the Company to take full advantage of the uranium market as it signals its return.
Yours truly,
Ron F. Hochstein |
| President and Chief Executive Officer |
Denison Mines Corp. Annual Report 2011 | 3
MANAGEMENT’S DISCUSSION AND ANALYSIS
Year Ended December 31, 2011
(Expressed in U.S. dollars, unless otherwise noted)
INTRODUCTION
This Management’s Discussion and Analysis (“MD&A”) of Denison Mines Corp. and its subsidiary companies and joint ventures (collectively, “Denison” or the “Company”) provides a detailed analysis of the Company’s business and compares its financial results with those of the previous year. This MD&A is dated as of March 8, 2012 and should be read in conjunction with the Company’s audited consolidated financial statements and related notes for the year ended December 31, 2011. The audited consolidated financial statements are prepared in accordance with International Financial Reporting Standards (“IFRS”). All dollar amounts are expressed in U.S. dollars, unless otherwise noted.
Other continuous disclosure documents, including the Company’s press releases, quarterly and annual reports, Annual Information Form and Form 40-F are available through its filings with the securities regulatory authorities in Canada atwww.sedar.com and the United States atwww.sec.gov/edgar.shtml.
ADOPTION OF INTERNATIONAL FINANCIAL REPORTING STANDARDS
Our 2011 consolidated financial statements and other financial information have been prepared using IFRS. The Company has restated its 2010 comparative financial statements and other financial information following its IFRS accounting policies.
CAUTIONARY STATEMENT REGARDING FORWARD-LOOKING STATEMENTS
Certain information contained in this MD&A constitutes “forward-looking information”, within the meaning of the United States Private Securities Litigation Reform Act of 1995 and similar Canadian legislation concerning the business, operations and financial performance and condition of Denison.
Generally, these forward-looking statements can be identified by the use of forward-looking terminology such as “plans”, “expects” or “does not expect”, “is expected”, “budget”, “scheduled”, “estimates”, “forecasts”, “intends”, “anticipates” or “does not anticipate”, or “believes”, or variations of such words and phrases or state that certain actions, events or results “may”, “could”, “would”, “might” or “will be taken”, “occur”, “be achieved” or “has the potential to”.
Forward-looking statements are based on the opinions and estimates of management as of the date such statements are made, and they are subject to known and unknown risks, uncertainties and other factors that may cause the actual results, level of activity, performance or achievements of Denison to be materially different from those expressed or implied by such forward-looking statements. Denison believes that the expectations reflected in this forward-looking information are reasonable but no assurance can be given that these expectations will prove to be correct and such forward-looking information included in this MD&A should not be unduly relied upon. This information speaks only as of the date of this MD&A. In particular, this MD&A may contain forward-looking information pertaining to the following: the estimates of Denison’s mineral reserves and mineral resources; estimates regarding Denison’s uranium and vanadium production levels and sales volumes; capital expenditure programs, estimated production costs, exploration and development expenditures and reclamation costs; expectations of market prices and costs; supply and demand for uranium and vanadium; possible impacts of litigation and regulatory actions on Denison; exploration, development and expansion plans and objectives; Denison’s expectations regarding raising capital and adding to its mineral reserves and resources through acquisitions and development; and receipt of regulatory approvals, permits and licences and treatment under governmental regulatory regimes.
There can be no assurance that such statements will prove to be accurate, as Denison’s actual results and future events could differ materially from those anticipated in this forward-looking information as a result of those factors discussed in or referred to under the heading “Risk Factors” in Denison’s Annual Information Form dated March 28, 2011 available athttp://www.sedar.com, and in its Form 40-F available athttp://www.sec.gov/edgar.shtml, as well as the following: global financial conditions, the market price of Denison’s securities, volatility in market prices for uranium and vanadium; ability to access capital, changes in foreign currency exchange rates and interest rates; liabilities inherent in mining operations; uncertainties associated with estimating mineral reserves and resources and production; uncertainty as to reclamation and decommissioning liabilities; failure to obtain industry partner and other third party consents and approvals, when required; delays in obtaining permits and licences for development properties; competition for, among other things, capital, acquisitions of mineral reserves, undeveloped lands and skilled personnel; public resistance to the expansion of nuclear energy and uranium mining; uranium industry competition and international trade restrictions; incorrect assessments of the value of acquisitions; property title risk; geological, technical and processing problems; the ability of Denison to meet its obligations to its creditors; actions taken by regulatory authorities with respect to mining activities; the potential influence of or reliance upon its business partners, and the adequacy of insurance coverage.
4 | Denison Mines Corp. Annual Report 2011
MANAGEMENT’S DISCUSSION AND ANALYSIS
Year Ended December 31, 2011
Accordingly, readers should not place undue reliance on forward-looking statements. These factors are not, and should not be construed as being, exhaustive. Statements relating to “mineral reserves” or “mineral resources” are deemed to be forward-looking information, as they involve the implied assessment, based on certain estimates and assumptions that the mineral reserves and mineral resources described can be profitably produced in the future. The forward-looking information contained in this MD&A is expressly qualified by this cautionary statement. Denison does not undertake any obligation to publicly update or revise any forward-looking information after the date of this MD&A to conform such information to actual results or to changes in Denison’s expectations except as otherwise required by applicable legislation.
Cautionary Note to United States Investors Concerning Estimates of Measured, Indicated and Inferred Resources:This MD&A may use the terms “Measured”, “Indicated” and “Inferred” Resources. United States investors are advised that while such terms are recognized and required by Canadian regulations, the United States Securities and Exchange Commission does not recognize them. “Inferred Mineral Resources” have a great amount of uncertainty as to their existence, and as to their economic and legal feasibility. It cannot be assumed that all or any part of an Inferred Mineral Resource will ever be upgraded to a higher category. Under Canadian rules, estimates of Inferred Mineral Resources may not form the basis of feasibility or other economic studies.United States investors are cautioned not to assume that all or any part of Measured or Indicated Mineral Resources will ever be converted into Mineral Reserves. United States investors are also cautioned not to assume that all or any part of an Inferred Mineral Resource exists, or is economically or legally mineable.
2011 HIGHLIGHTS
| • | Denison’s 2011 production totaled 1,011,000 pounds uranium oxide (“U3O8”) and 1,290,000 pounds of vanadium blackflake (“V2O5”). |
| • | Uranium sales were 1,100,000 pounds U3O8 at an average price of $58.04 per pound. |
| • | Vanadium sales totaled 1,802,000 pounds V2O5 equivalent at an average price of $6.41 per pound. |
| • | Total revenue for the year was $96,800,000 and net loss was $70,869,000 after recording an impairment charge on the U.S. mining segment of $32,625,000. |
| • | At the end of 2011, the Company had 196,000 pounds U3O8 available for sale. Based on spot market prices at December 31, 2011, this inventory has a value of $10,136,000. |
| • | Denison is essentially debt-free and has a cash balance of $53.5 million. |
| • | During the year Denison acquired White Canyon Uranium Limited (“WCU”). WCU’s key assets are located in southeastern Utah, near Denison’s White Mesa mill. Its holdings comprise 100% interests in the Daneros uranium mine which is currently in production, the advanced Lark Royal project and the Thompson, Geitus, Blue Jay and Marcy Look exploration projects. |
| • | The Company continued development of its Pinenut mine in Arizona. Production is expected to commence in mid-2012. |
| • | The Company continued drilling at its 60% owned Wheeler River exploration property in Saskatchewan. The 2011 summer drill program focused primarily on Zone A and was very successful in expanding the potential estimated resources of the Phoenix deposit with the discovery of the “Zone A Extension”. |
| • | In Zambia, the Company completed a successful two-phase drilling program at its 100% owned Mutanga uranium project. Based on the results of this drilling, a new resource estimate for the Dibwe East deposit, compliant with National Instrument 43-101 (“NI 43-101”), was announced on February 27, 2012. The new mineral resource estimate is 28.2 million pounds inferred mineral resources, bringing the total mineral resource estimate for the Mutanga project to 2.0 million pounds U3O8 measured, 5.8 million pounds indicated and 42.1 million pounds inferred. |
| • | In Mongolia, mining licence applications were submitted on four of the five Gurvan Saihan Joint Venture licence areas. |
Denison Mines Corp. Annual Report 2011 | 5
MANAGEMENT’S DISCUSSION AND ANALYSIS
Year Ended December 31, 2011
ABOUT DENISON
Denison was formed by articles of amalgamation effective May 9, 1997 pursuant to the Business Corporations Act (Ontario) (the “OBCA”) and by articles of arrangement effective December 1, 2006. Denison is a reporting issuer in all of the Canadian provinces. Denison’s common shares are listed on the Toronto Stock Exchange (the “TSX”) under the symbol “DML” and on the NYSE Amex LLC (“Amex”) under the symbol “DNN”.
Denison is an intermediate uranium producer with production in the U.S. combined with a diversified development portfolio with projects in the U.S., Canada, Zambia and Mongolia. Denison’s assets include its 100% ownership of the White Mesa mill in Utah and its 22.5% ownership of the McClean Lake mill in Saskatchewan. The Company also produces vanadium as a co-product from some of its mines in Colorado and Utah. The Company also processes uranium-bearing waste materials, referred to as “alternate feed materials”, for the recovery of uranium, alone or in combination with other metals, at the Company’s White Mesa mill.
Denison owns interests in a portfolio of exploration projects, including the Wheeler River property, along with other properties in close proximity to the Company’s mills in the Athabasca Basin in Saskatchewan and in the Colorado Plateau, White Canyon, Henry Mountains and Arizona Strip regions of the southwestern United States.
Denison is the manager of Uranium Participation Corporation (“UPC”), a publicly traded company which invests in uranium oxide in concentrates and uranium hexafluoride. Denison is also engaged in mine decommissioning and environmental services through its Denison Environmental Services (“DES”) division.
Strategy
Denison intends to position itself as an important global uranium producer with annual uranium production of not less than 10 million pounds by 2020. This will take place through production from Denison’s currently operating mines and through its ongoing business development activities, including exploration and development of existing projects. Denison will also look to diversify its production geographically and evaluate opportunities to make in-situ uranium recovery a larger component of its production.
The Uranium Industry
Nuclear power capacity and power generation is growing, while uranium production is struggling to catch up after many years of low prices and limited exploration for new deposits which are required to support the growth of nuclear power and to replace depleting ore bodies. As a result, there is a tight long-term supply-demand balance which can be expected to continue for the foreseeable future, even after the effects of the Japanese nuclear incident are taken into account. Prices must rise to higher, sustained levels to support new mines that are required to meet increasing demand.
Uranium Demand
World net electricity consumption is expected to increase by 87% by 2035, according to the International Energy Outlook 2011 (the “IEO 2011”) reference case forecast. Total demand for electricity is projected to increase on average by 2.4% per year from 17.2 trillion kilowatt hours in 2009 to 31.7 trillion kilowatt hours in 2035. This increased demand is driven by economic and population growth, with China and India accounting for over half, and OECD countries making up less than one-fifth. As a result of high fossil fuel prices, energy security concerns, improved reactor designs and climate change concerns, new nuclear capacity is expected to be a significant part of meeting this growth in electricity demand.
As reported by the World Nuclear Association as of January 1, 2012, there are 434 nuclear reactors operable worldwide in 30 countries, generating 370.4 gigawatts of electricity and supplying 13.8% of the world’s electrical requirements. Of greater significance, 61 nuclear reactors are under construction in 13 countries with the principal drivers of this expansion being China, India, South Korea and Russia which have a total of 46 reactors under construction. China, in particular, has a very aggressive new build program underway. Ux Consulting Company, LLC (“UxCo”), in its “Uranium Market Outlook – Q4 2011”, estimated that, by 2025, there will be 573 nuclear reactors in operation worldwide, supplying 548.4 gigawatts. This would represent an increase of nearly 50% in nuclear capacity, with nine new countries joining the nuclear family. However, as a consequence of the Japanese nuclear incident, most countries, while declaring their support for nuclear power, have called for technical reviews of all safety and security systems of existing nuclear plants and those under construction and a review of the nuclear safety regulations governing the industry. A few countries, such as Germany and Switzerland have already announced that they will be suspending their nuclear programs. It is significant, however, that the governments of China, India, South Korea and Russia have all announced their intention to move ahead with their domestic nuclear plans, albeit following a careful safety review of their nuclear plants, according to UxCo. Some non-nuclear countries are continuing to move ahead with their plans, such as Saudi Arabia which plans to build up to 16 reactors and United Arab Emirates with contracts for four reactors. UxCo has estimated in its “Uranium Market Outlook – Q4 2011”, that uranium demand will grow from 177.5 million pounds of U3O8 in 2011 to 226.4 million pounds in 2020.
6 | Denison Mines Corp. Annual Report 2011
MANAGEMENT’S DISCUSSION AND ANALYSIS
Year Ended December 31, 2011
Primary Uranium Supply
Uranium supply is the biggest variable in the supply-demand equation. During the time that the accumulated inventories from over production in the 1970s were being drawn down, primary mine production accounted for only approximately 50% of demand. A number of new mines have been brought into production over the last few years while others are in various stages of development. However, production still only accounts for approximately 87% of demand and more mines are required to meet the increasing future demand and to replace mines that are being depleted.
UxCo has estimated in its “Uranium Market Outlook – Q4 2011” that existing mine production plus new planned and potential mine production will increase primary uranium supply from 141.4 million pounds in 2011 to 225.3 million pounds in 2020. One of the principal drivers for the increase in primary mine production is expected to be Kazakhstan, which is projected to increase production by about 28% between 2011 and 2020. In order to reach these estimated primary uranium supply levels, a number of large new mines, mainly in Africa, will also need to be developed and brought into production. However, prices will need to increase appreciably to support the additional higher cost production and significant capital expenditures required to meet these production forecasts.
Secondary Uranium Supply
Primary mine production currently supplies approximately 87% of demand. The balance of demand is supplied from secondary sources such as remaining excess commercial inventories, reprocessing of spent fuel, inventories held by governments and the downblending of highly enriched uranium (“HEU”) from nuclear weapons programs. By far, the most significant of the secondary supplies currently is the 18 to 24 million pounds per year being provided from the HEU downblending program. The HEU program is scheduled to terminate at the end of 2013. The supply gap created by this termination will need to be made up from new primary mine production.
Excess commercial inventories, which were once one of the major sources of secondary supplies during the period from the early 1970s to the early 2000s, have largely been consumed; however, some government inventories, particularly in the U.S. and Russia, remain. The disposition of these inventories may have a market impact over the next 10 to 20 years; although, the rate and timing of this material entering the market is uncertain.
Reprocessing of spent fuel is another source of secondary supply but is expected to satisfy only 3% to 4% of demand. Expansion of this secondary source would require major investments in facilities which could only be supported by a significant increase in long-term uranium prices.
UxCo expects that secondary sources of supply will fall from 45 million pounds to 19 million pounds per year from now to 2020.
Uranium Prices
Most of the countries that use nuclear-generated electricity do not have a sufficient domestic uranium supply to fuel their nuclear power reactors. Their electric utilities must secure their required uranium supply by entering into medium and long-term contracts with foreign uranium producers and other suppliers. These contracts usually provide for deliveries to begin two to four years after they are signed and provide for delivery from four to ten years thereafter. In awarding medium and long-term contracts, electric utilities consider, in addition to the commercial terms offered, the producer’s uranium reserves, record of performance and costs, which are important to the producer’s or supplier’s ability to fulfill long-term supply commitments. Prices are established by a number of methods, including base prices adjusted by inflation indices, reference prices (generally spot price indicators, but also long-term reference prices) and annual price negotiations. Contracts may also contain floor prices, ceiling prices and other negotiated provisions. Under these contracts, the actual price mechanisms are usually confidential. Electric utilities procure their remaining requirements through spot and near-term purchases from uranium producers and other suppliers, including other utilities holding excess inventory and governments.
While long-term demand is steadily growing, short-term demand is affected in large part by utilities’ uncovered requirements. To the extent that they have uncovered demand in the near term, they will purchase on the spot market which in turn affects the spot price. Currently, there is relatively little uncovered demand, so utility buying is primarily discretionary and price driven.
Historically, spot prices are more volatile than long-term prices. The spot price began 2011 at $62.50 rising to the low $70s prior to the nuclear incident in Japan, following which the spot price dropped to $49.00 in August and ended 2011 in the low $50s.
The long-term price ranged from $65.00 per pound U3O8 at the beginning of 2011, climbed to $73.00 prior to the nuclear incident, then steadily declined to $63.00 at the end of 2011. Long-term prices are driven more by production costs and future supply-demand forecasts than by customer inventories.
Denison Mines Corp. Annual Report 2011 | 7
MANAGEMENT’S DISCUSSION AND ANALYSIS
Year Ended December 31, 2011
Competition
Uranium production is international in scope and is characterized by a relatively small number of companies operating in only a few countries. Five producers marketed 61% of the estimated world production in 2011.
About 73% of the world’s production came from four countries, namely Kazakhstan, Canada, Australia and Niger. Kazakhstan passed Canada in 2009 as the largest producer, a role Canada had held for 17 years.
Marketing Uranium
Denison sells its uranium under a combination of long-term and spot contracts. The long-term contracts have a variety of pricing mechanisms, including fixed prices, base prices adjusted by inflation indices and/or spot price or long-term contract reference prices. Time of delivery during a year under long-term contracts is at the discretion of the customer, so the Company’s delivery obligations may vary markedly from quarter to quarter. Spot sales are priced at or near published industry spot prices.
In 2011, approximately 50% of Denison’s total sales volume was sold under long-term contracts, with the remainder sold in the spot market. The Company currently has three long-term contracts in place. One contract, the KEPCO Offtake Agreement, is for 20% of the Company’s annual U3O8 production from any production source (±10%) but not less than 350,000 pounds (±10%) per year from 2010 to 2015 inclusive. This agreement also provides for the purchase of 20% of production after 2015 subject to certain conditions. The second contract is for delivery of 1,100,000 pounds of U3O8 from U.S. or Canadian production over a period of six years beginning in 2011. The third contract is for a quantity which is equal to 20% of the production from the White Mesa mill during the years 2012 to 2017 inclusive, but not less than 200,000 pounds U3O8 per year.
Denison will continue to seek long-term contracts at prices sufficient to support the development of its mineral assets.
The Vanadium Market
Vanadium adds strength to high performance steels and strengthens titanium where strength combined with lightness is required for everything from golf clubs to aerospace applications. Demand for vanadium from the steel industry represents approximately 92% of the total demand, while the chemical and titanium alloy industries represent the other major consumers of vanadium with 4% each of the world demand. As the demand for these high strength, high performance steels increases and as new uses are developed for lightweight, high strength titanium, vanadium demand can be expected to increase at a faster rate than the growth of global steel production. The average vanadium content in steel in the developing countries is much lower than that in the developed countries and can be expected to increase, adding to the demand.
While demand is expected to grow over time, supply has the capacity to increase to meet this demand. Many primary producers from ore, in countries such as China, Russia and South Africa, were shut down due to low prices. Production from steel making slag had been cut back or halted. As demand increases and prices strengthen, some of these facilities can be expected to restart or increase production thus moderating any anticipated price increases.
Spot vanadium prices were relatively flat for most of the year staying at $6.50 per pound from mid-April to mid-December. Prices ranged from a high of $7.00 per pound in the first quarter to a low of $5.75 per pound at the end of the year.
While long-term demand can be expected to increase, short-term demand is expected to be relatively stable and prices should remain close if not slightly higher than their current level throughout 2012.
Vanadium Marketing
Denison sells its vanadium both as V2O5 and as ferrovanadium (“FeV”) through spot sales to industry end-users and to trading companies. Sales during 2011 were principally into the U.S. market as V2O5. However, efforts are continuing to expand the Company’s market into Europe, South America and the Far East.
8 | Denison Mines Corp. Annual Report 2011
MANAGEMENT’S DISCUSSION AND ANALYSIS
Year Ended December 31, 2011
SELECTED ANNUAL FINANCIAL INFORMATION
The following selected financial information was obtained directly from or calculated using the Company’s consolidated financial statements for the years ended December 31, 2011, December 31, 2010 and December 31, 2009.
| Three Months | ||||||||||||||||
| Ended | Year Ended | Year Ended | Year Ended | |||||||||||||
| December 31 | December 31 | December 31 | December 31 | |||||||||||||
(in thousands) | 2011 | 2011 | 2010 | 20091 | ||||||||||||
Results of Operations: | ||||||||||||||||
Total revenues | $ | 36,006 | $ | 96,800 | $ | 128,320 | $ | 79,170 | ||||||||
Net income (loss) | (65,537 | ) | (70,869 | ) | (5,346 | ) | (147,012 | ) | ||||||||
Basic earnings (loss) per share | (0.17 | ) | (0.19 | ) | (0.02 | ) | (0.51 | ) | ||||||||
Diluted earnings (loss) per share | (0.17 | ) | (0.19 | ) | (0.02 | ) | (0.51 | ) | ||||||||
| As at | As at | As at | ||||||||||
| December 31 | December 31 | January 1 | ||||||||||
| 2011 | 2010 | 2010 | ||||||||||
Financial Position: | ||||||||||||
Working capital | $ | 93,516 | $ | 133,837 | $ | 75,357 | ||||||
Long-term investments | 522 | 2,955 | 10,605 | |||||||||
Property, plant and equipment | 367,370 | 342,164 | 321,395 | |||||||||
Total assets | 504,486 | 523,003 | 447,306 | |||||||||
Total long-term liabilities | $ | 38,391 | $ | 38,598 | $ | 39,075 | ||||||
| 1 | As reported under Canadian GAAP |
RESULTS OF OPERATIONS
General
The Company recorded a net loss of $70,869,000 ($0.19 per share) for 2011 compared with net loss of $5,346,000 ($0.02 per share) for 2010.
Revenues
Uranium sales revenue for the fourth quarter was $28,938,000 from the sale of 550,000 pounds U3O8 at an average price of $52.61 per pound. Uranium sales for the same period in 2010 were 449,000 pounds U3O8 at an average price of $49.97 per pound resulting in revenue of $22,760,000. Uranium revenue in the fourth quarter of 2010 also included amortization of the fair value increment related to Denison Mines Inc. (“DMI”) sales contracts of $325,000.
Uranium sales revenue for the year ended December 31, 2011 totaled $63,841,000. Sales were 1,100,000 pounds U3O8 at an average price of $58.04 per pound. For the year ended December 31, 2010, uranium sales revenue was $87,978,000 from the sale of 1,839,000 pounds U3O8 at an average price of $47.67 per pound. Uranium revenue in 2010 also included amortization of the fair value increment related to DMI sales contracts of $325,000.
Denison Mines Corp. Annual Report 2011 | 9
MANAGEMENT’S DISCUSSION AND ANALYSIS
Year Ended December 31, 2011
During the fourth quarter the Company sold no V2O5. In the fourth quarter of 2010, the Company sold 1,032,000 pounds of V2O5 equivalent at an average price of $6.68 per pound resulting in sales revenue of $6,896,000.
During the year ended December 31, 2011, the Company sold 1,802,000 pounds of V2O5 equivalent at an average price of $6.41 per pound. Total vanadium sales revenue was $11,551,000. During the year ended December 31, 2010, the Company sold 2,407,000 pounds of V2O5 equivalent at an average price of $7.04 per pound. Total vanadium sales revenue was $16,934,000.
In 2010, Denison processed third party ore at its White Mesa mill under a toll milling agreement. Revenue from toll milling totaled $4,963,000. There was no toll milling revenue in 2011.
Revenue from the environmental services division for the three months and year ended December 31, 2011 was $3,995,000 and $16,190,000 compared to $4,221,000 and $15,492,000 in the same periods in 2010. Revenue from the management contract with UPC for the three months and year ended December 31, 2011 was $437,000 and $1,913,000 compared to $487,000 and $2,576,000 in the same periods in 2010.
Operating Expenses
Milling and Mining Expenses
The McClean Lake mill remained on stand-by for the entire year in 2011. Denison’s share of stand-by costs for the three months and year ended December 31, 2011 totaled $317,000 and $915,000, respectively.
The McClean Lake joint venture did not produce any U3O8 in 2011 and it produced 1,731,000 pounds U3O8 for the year ended December 31, 2010. Denison’s 22.5% share of production totaled 389,000 pounds for 2010. The feeding of ore to the McClean mill was completed in June 2010 and the mill was placed on stand-by in August of 2010.
On June 30, 2009, the Canadian Nuclear Safety Commission (“CNSC”) renewed the operating licence for the McClean Lake operation for a period of eight years to June 30, 2017. The Athabasca Regional Government (the “ARG”), which is comprised of three First Nations and four provincial communities from the Athabasca Basin, launched an application for a judicial review of CNSC’s decision to grant the McClean Lake operating licence. ARG challenged the legality of the licence renewal on the basis of issues related to the Federal and Provincial Governments’ duty to consult with Aboriginal people. The initial hearing on this matter was held on June 8, 2010 and the judge issued his decision in September 2010, dismissing the application. ARG appealed this decision. A hearing into this matter was held on March 5, 2012 and the Court unanimously dismissed ARG’s appeal. The ARG now has 60 days to seek leave to appeal to the Supreme Court of Canada. An adverse decision by the Court could have an impact on the timing of future production.
In December 2011, the Cigar Lake joint venture and the McClean Lake joint venture agreed to amend the toll milling agreement. Under the new milling arrangement, the McClean Lake operation is expected to process and package 100% of the uranium produced from the Cigar Lake mine. To accommodate the production of 18 million pounds U3O8 annually from the Cigar Lake joint venture, the plans are to expand the mill to an annual capacity of 22 million pounds from the current constructed capacity of 12 million pounds. All costs for the expansion of the McClean Lake mill are planned to be paid for by the Cigar Lake joint venture.
Uranium and vanadium production at the White Mesa mill for the three months and year ended December 31, 2011 and 2010 are shown below:
| Three Months | Three Months | Year | Year | |||||||||||||
| Ended | Ended | Ended | Ended | |||||||||||||
| December 31 | December 31 | December 31 | December 31 | |||||||||||||
(Pounds) | 2011 | 2010 | 2011 | 2010 | ||||||||||||
Uranium Production | 244,000 | 229,000 | 1,011,000 | 1,053,000 | ||||||||||||
Vanadium Production | — | 391,000 | 1,290,000 | 2,347,000 | ||||||||||||
10 | Denison Mines Corp. Annual Report 2011
MANAGEMENT’S DISCUSSION AND ANALYSIS
Year Ended December 31, 2011
As planned, conventional ore processing ceased at the end of June 2011 and resumed in November of 2011. Alternate feed processing continued throughout the year.
At December 31, 2011, a total of 91,000 tons of conventional ore was stockpiled at the mill containing approximately 616,000 pounds U3O8 and 1,385,000 pounds V2O5. The Company also had approximately 533,000 pounds U3O8 contained in alternate feed material stockpiled at the mill at December 31, 2011.
Production costs1 at White Mesa for the three months ended December 31, 2011 were $50.93 per pound U3 O8 and for the year ended December 31, 2011 were $47.60. Production costs were $39.30 per pound U3O8 in the three months ended December 31, 2010 and $38.46 for the year ended December 31, 2010. Production costs are higher than last year due to a change in mill feed sources and higher reagent costs, in particular sulphuric acid.
Inventory available for sale from U.S. production was 196,000 pounds U3O8 at December 31, 2011.
On November 16, 2009, as amended on February 1, 2010 and July 22, 2011, the Center for Biological Diversity, Grand Canyon Trust, Sierra Club, Kaibab Band of Paiute Indians and Havasupai Tribe (the “Plaintiffs”) filed a lawsuit in the U.S. District Court for the District of Arizona against the U.S. Secretary of the Interior and the U.S. Bureau of Land Management (“BLM”) (together, the “Defendants”) seeking an order declaring that the Defendants have violated environmental laws in relation to the Company’s Arizona 1 mine, by not requiring a new Plan of Operations in connection with the start of mining activities. The Plaintiffs are also claiming that, if a new Plan of Operations is not required, the Defendants failed to conduct a review of potential environmental impacts from the mine since the existing Plan of Operations for the mine was approved by BLM in 1988. The Plaintiffs further claim that all required permits have not been obtained for the mine under the Clean Air Act, and that, as a result, BLM failed to take all actions necessary to prevent unnecessary degradation of the public lands. The Plaintiffs are seeking an order declaring that the Defendants have violated these environmental laws in relation to the Arizona 1 mine, and an injunction directing operations to cease and stopping the Defendants from authorizing or allowing any further mining or exploration operations at the Arizona 1 mine until BLM complies with all applicable laws. On October 7, 2011, the District Court issued its final ruling in favour of BLM and Denison and against the Plaintiffs on all counts. On November 28, 2011, the Plaintiffs appealed the District Court’s ruling to the Ninth Circuit Court of Appeals, and on December 8, 2011 filed a motion in the District Court for preliminary injunction, pending appeal. That motion was denied by the District Court judge on January 11, 2012. On January 26, 2012, the Plaintiffs filed an emergency motion for an injunction pending appeal in the Court of Appeals and on February 24, 2012, the Court of Appeals denied the motion for injunction. If the Plaintiffs are successful on the appeal, the Company may be required to stop mining activities at the Arizona 1 mine pending resolution of this matter. Any required stoppage of mining could have a significant adverse impact on the Company.
On July 12, 2011, an Administrative Law Judge was appointed by the Executive Director of the Utah Department of Environmental Quality (“UDEQ”) to conduct an adjudicative proceeding relating to a Request for Agency Action before the Utah Air Quality Board, submitted by Uranium Watch and Living Rivers on November 4, 2010, as supplemented on March 17, 2011, March 23, 2011 and April 7, 2011. In their Request for Agency Action, Uranium Watch and Living Rivers allege certain deficiencies in the applications for approval and in the approvals granted in connection with radon emissions and monitoring at Denison’s La Sal mines complex, as well as certain deficiencies in Denison’s implementation of its radon monitoring program at the mine and in UDEQ’s regulation thereof. Uranium Watch and Living Rivers request a number of agency actions, including orders that certain approvals be withdrawn, that additional information and applications be submitted, that Denison cease operation of certain vents, mine portals and mine shafts that allegedly have not been properly approved, and that direct UDEQ to take certain actions to ensure compliance with applicable regulations. Denison believes that the Request for Agency Action, as supplemented, is without merit. Motions for summary dismissal of this action were filed by UDEQ and Denison in November 2011. On February 8, 2012, the Administrative Law judge issued a Memorandum and Recommended Order, in favour of UDEQ and Denison, recommending that the Utah Air Quality Board, the final arbiter in this matter, dismiss this action. The Utah Air Quality Board heard this matter on March 7, 2012 and affirmed the judge’s decision.
On July 28, 2011, the Southern Utah Wilderness Alliance filed a Notice of Appeal with the Interior Board of Land Appeals (“IBLA”) challenging BLM’s Finding of No Significant Impact (“FONSI”) for the Company’s recently acquired Daneros Mine project’s Environmental Assessment, requesting that IBLA set aside the FONSI and remand the Environmental Assessment to the BLM with instructions to prepare an Environmental Impact Statement or to revise the Environmental Assessment. Denison has been added as an intervenor in this action, and believes this challenge is without merit and should be dismissed. Responses were filed by BLM and Denison in early December 2011 and a decision from IBLA is pending at this time.
| 1 | Production costs include the costs of mining the ore fed to the mill in the period plus the costs of milling less a credit for vanadium produced in the period and excluding depreciation and amortization, which is a non-GAAP measure. |
Denison Mines Corp. Annual Report 2011 | 11
MANAGEMENT’S DISCUSSION AND ANALYSIS
Year Ended December 31, 2011
Other
Operating costs for the three months and year ended December 31, 2011 include recoveries of nil and $17,000, respectively, relating to the change in net realizable value provisions on the Company’s uranium and vanadium inventory. For the three months and year ended December 31, 2010 operating costs include recoveries of $46,000 and $13,195,000, respectively, relating to the change in net realizable value provisions of the Company’s uranium and vanadium inventory. Operating costs also include expenses relating to DES amounting to $3,682,000 for the three months and $15,342,000 for the year ended December 31, 2011 compared to $4,189,000 and $14,063,000, respectively, for the same periods in 2010.
Mineral Property Exploration
Denison is engaged in uranium exploration, as both operator and non-operator of joint ventures and its own properties in Canada, the U.S., Mongolia and Zambia. For the three months ended December 31, 2011 exploration expenditures totaled $1,270,000 and $13,828,000 for the year ended December 31, 2011 as compared to $1,569,000 and $7,619,000 for the three months and year ended December 31, 2010.
In the Athabasca Basin region of northern Saskatchewan, Denison is engaged in uranium exploration as part of the AREVA Resources Canada Inc. (“ARC”) operated McClean and Midwest joint ventures, as well as on 26 other exploration projects including the Company’s 60% owned Wheeler River project. Denison’s share of exploration spending on its Canadian properties totaled $519,000 for the three months ended December 31, 2011 and totaled $6,783,000 for the year ended December 31, 2011. For the three months ended December 31, 2010, Canadian exploration spending totaled $1,158,000 and totaled $6,039,000 for the year ended December 31, 2010.
The 2011 summer drill program focused primarily on Zone A and was very successful in potentially expanding the estimated resources of the Phoenix deposit with the discovery of the “Zone A Extension”. The Wheeler River Joint Venture has approved a CAD$6,800,000 budget for 2012 that will include 28,000 metres of drilling in approximately 60 holes. The program has begun with two drills currently active on site. The focus of the program will be: definition drilling in Zone A, in particular the Zone A Extension; definition drilling in Zone B; as well as, testing various regional targets identified based on historic drilling and geophysics.
Exploration expenditures of $106,000 for the three months and $678,000 for the year ended December 31, 2011 were made on the Company’s properties in the United States in the Colorado Plateau. Drilling of 68 holes totaling 15,833 metres was completed at the La Sal Complex in Utah. This drilling has increased the Company’s resources which can be developed in the near term from existing mine workings.
Exploration expenditures of $200,000 for the three months ended December 31, 2011 ($129,000 for the three months ended December 31, 2010) and of $3,971,000 for the year ended December 31, 2011 ($970,000 for the year ended December 31, 2010) were incurred in Mongolia on the Company’s joint venture properties. The other parties to the joint venture are currently the Mongolian government as to 15% and Geologorazvedka, a Russian entity, as to 15%. Under the Nuclear Energy Law, the Government of Mongolia’s position in the joint venture will increase from its current 15% interest to a 34% to 51% interest, depending on the amount of historic exploration that was funded by the Government of Mongolia, at no cost to the Government. This share interest will continue to be held by Mon-Atom LLC, the Mongolian State-owned uranium company. The Company and Mon-Atom are proceeding with restructuring the GSJV to meet the requirements of the Nuclear Energy Law, pending government reviews and authorizations. In November 2011, in preparation for this restructuring, the Company finalized terms for acquisition of the Russian participant’s share in the GSJV. Subject to receipt of required approvals, this 15% share interest will be acquired by the Company for nominal cash consideration and release of the Russian participant’s share of unfunded joint venture obligations.
Exploration expenditures of $445,000 and $2,396,000 for the three months and year ended December 31, 2011 were incurred on the Company’s Mutanga project in Zambia compared to $20,000 and $44,000 for the three months and year ended December 31, 2010. The Company completed Phase 2 of the 2011 drilling program. The Phase 2 drilling program was a total of approximately 9,600 metres aimed at further delineating and expanding the mineralization in Dibwe East. Denison prepared a new mineral resource estimate in the first quarter of 2012 for the Dibwe East deposit on the Mutanga project in accordance with the requirements of NI 43-101. The estimate increased the inferred resources at Mutanga by 28.2 million pounds. Total mineral resources estimates for the Mutanga project are now as follows:
| Tonnes | eU3O8 | Lbs. U3O8 | ||||||||||
Category | (millions) | (ppm) | (millions) | |||||||||
Measured | 1.9 | 481 | 2.0 | |||||||||
Indicated | 8.4 | 314 | 5.8 | |||||||||
|
|
|
|
|
| |||||||
Measured & Indicated | 10.3 | 345 | 7.8 | |||||||||
Inferred | 68.5 | 279 | 42.1 | |||||||||
|
|
|
|
|
| |||||||
| • | The resources have been prepared in accordance with NI 43-101. |
| • | Based on a cut-off grade of 100 ppm eU3O8. |
12 | Denison Mines Corp. Annual Report 2011
MANAGEMENT’S DISCUSSION AND ANALYSIS
Year Ended December 31, 2011
General and Administrative
General and administrative expenses totaled $3,829,000 for the three months ended December 31, 2011 compared with $5,492,000 for the three months ended December 31, 2010. For the year ended December 31, 2011, general and administrative expenses totaled $17,538,000 compared to $16,143,000 for the same period in 2010. General and administrative expenses consist primarily of payroll and related expenses for personnel, contract and professional services and other overhead expenditures. The increased expenditures in 2011 result from costs related to the acquisition of WCU of $1,425,000 and an increase in stock compensation expense.
Impairment of Goodwill
Denison evaluates the carrying amount of goodwill annually to determine whether events or changes in circumstances indicate whether such carrying amount has become impaired. Denison’s goodwill amount arises from the acquisition of WCU in 2011 and was allocated to the United States mining segment. Denison examined the fair value of the assets and liabilities of the U.S. mining segment at December 31, 2011. The Company used a fair value less costs to sell model to determine the recoverable amount for the CGU. The determination of fair market value was based on discounted cash flow analysis for production assets using consensus expectations for future uranium prices ranging from $54.00 to $81.00 per pound and discounted using a cumulative annual 2% inflation rate, operating and capital costs and a post-tax discount rate of 9.0%. Exploration properties were valued at estimated market value. Based on this analysis, the Company determined the fair values have decreased and, as a result, determined that an impairment charge of $32,625,000 should be made and charged to operations in the fourth quarter.
Other Income and Expenses
Other income (expense) totaled ($10,561,000) for the three months ended December 31, 2011 compared with ($7,571,000) for the three months ended December 31, 2010. For the year ended December 31, 2011, other income (expense) totaled ($1,519,000) compared to $1,930,000 for the same period in 2010. This consists primarily of foreign exchange gains and losses, and investment disposal gains. Foreign exchange losses totaled $1,390,000 for the year ended December 31, 2011 compared to $11,926,000 for the year ended December 31, 2010. Other income also included a uranium sales contract termination fee of $11,000,000 in 2010.
ACQUISITION OF WHITE CANYON URANIUM LIMITED
On June 17, 2011, Denison’s offer to acquire all of the outstanding shares of WCU closed with 96.98% of shares outstanding accepting the offer. Compulsory acquisition proceedings to acquire the remaining shares of WCU were completed in early August, 2011.
Denison’s cash offer of AUD$0.24 per WCU share has resulted in a total purchase price of $61,027,000 (AUD$57,163,000). Consideration for the initial 96.98% interest was paid on July 1, 2011 and payment for the remaining shares was made in early August 2011.
WCU’s key assets are located in southeastern Utah, near Denison’s White Mesa mill. Its holdings comprise 100% interests in the Daneros producing mine, the advanced Lark Royal project and the Thompson, Geitus, Blue Jay and Marcy Look exploration projects. WCU commenced production of uranium ore in December 2009 from its 100% owned Daneros uranium mine.
OUTLOOK FOR 2012
Production
Denison’s uranium production from its 100% owned White Mesa mill, located in Blanding Utah, is expected to increase over 40% from 2011 production, to an estimated 1.4 million pounds U3O8 from conventional ore and alternate feed sources. In 2012, approximately 900,000 pounds are expected to be produced from ore delivered from the Company’s Beaver, Pandora, Daneros and Arizona 1 mines, while the remainder will be produced from alternate feed. Ore production from the Company’s Pinenut mine, located in north central Arizona, is expected to begin in mid-2012. Vanadium production is projected to be approximately 600,000 pounds V2O5. The decrease in vanadium production compared to 2011 is because the mill is planned to process only non-vanadium ores from Arizona 1 and Daneros, until late 2012. There will be no production from the McClean Lake mill in the Athabasca Basin in Canada, as that mill remains on stand-by in anticipation of resuming operations in 2013 to process Cigar Lake ores.
Production costs2 are expected to average approximately $33.50 per pound of U3 O8 net of vanadium credits, excluding sales royalties and mine stand-by expenditures. The anticipated decline in operating cost, as compared to 2011, is due to the different types of ore that the White Mesa mill is expected to process in 2012 combined with an expected decline in the price of key reagents. Sustaining capital expenditures at the mines and mill facilities are estimated at $15.3 million.
| 2 | Production costs include the costs of mining the ore fed to the mill in the period plus the costs of milling less a credit for vanadium produced in the period and excluding depreciation and amortization, which is a non-GAAP measure. |
Denison Mines Corp. Annual Report 2011 | 13
MANAGEMENT’S DISCUSSION AND ANALYSIS
Year Ended December 31, 2011
Sales
Uranium sales are forecasted to be approximately 1.6 million pounds of U3O8 of which 810,000 pounds is expected to be sold into long-term contracts and the remainder will be sold on the spot market. Vanadium sales are projected to be 500,000 pounds V2O5 in 2012.
Business Development
In 2012 Denison plans to continue to aggressively pursue its exploration and development projects in Canada, the U.S., Mongolia and Zambia. Total expenditures on development and exploration projects in 2012 are estimated at $25.4 million.
In Canada, Denison will manage or participate in eight exploration programs, of which Wheeler River will continue to be the primary focus. The total budget for these programs is CAD$11.7 million of which Denison’s share is CAD$7.8 million. At Wheeler River, a 28,000 metre winter and summer drill program and geophysical surveys are planned at a total cost of CAD$6.8 million (Denison’s share CAD$4.1 million). Exploration work will also be carried out on the Moore Lake, Murphy Lake, Bell Lake, Ahenakew Lake, South Dufferin, McClean Lake and Wolly projects at a budgeted cost of CAD$4.9 million (Denison’s share CAD$3.7 million).
In the United States, drilling is planned on the La Sal complex to expand resources at the Beaver and Pandora mines and on certain of its other properties. The total planned cost of the U.S. exploration program is $1.2 million. In addition to the drilling, the Company plans on preparing mineral resource estimates in accordance with NI 43-101 for the Redd Block area in the La Sal Complex and the Daneros operation in 2012.
In Canada and the U.S., a total of $5.4 million is budgeted to be spent by Denison on development stage projects in 2012. In the United States, development of the Canyon mine is anticipated to move forward late in the first quarter, with the start of shaft sinking planned to begin late 2012. Denison expects to advance permitting for the EZ1/EZ2 deposits in Arizona and the Redd Block mine located west of the Beaver mine in Utah. The cost of these programs is estimated at $4.8 million. In Canada, the McClean North underground development feasibility study is expected to be advanced to include the Sue D and Caribou deposits, along with continued evaluation and approval of the Environmental Assessment for the Midwest development project. Both of these projects are operated by AREVA Resources Canada Inc.
In Zambia, the Company plans to follow up on its successful 2011 drill program on its 100% owned Mutanga project. In April, a 15,000 metre exploration drill program will begin, which will focus on several targets that have been identified near the existing resources. The Zambian program will total an estimated $7.1 million.
In Mongolia, a $4.1 million exploration and development program is projected, contingent upon receipt of the mining licences in mid-2012. Included in this budget is a $1.6 million, 17,500 metre exploration program focused on the Ulziit and Urt Tsav 2011 discoveries. The development activities will include design of the pilot plant and infrastructure.
SUMMARY OF QUARTERLY FINANCIAL RESULTS
| 2011 | 2011 | 2011 | 2011 | |||||||||||||
(in thousands) | Q4 | Q3 | Q2 | Q1 | ||||||||||||
Total revenues | $ | 36,006 | $ | 17,033 | $ | 16,993 | $ | 26,768 | ||||||||
Net income (loss) | (65,537 | ) | 15,484 | (13,749 | ) | (7,067 | ) | |||||||||
Basic and diluted earnings (loss) per share | (0.17 | ) | 0.04 | (0.04 | ) | (0.02 | ) | |||||||||
| 2010 | 2010 | 2010 | 2010 | |||||||||||||
(in thousands) | Q4 | Q3 | Q2 | Q1 | ||||||||||||
Total revenues | $ | 39,232 | $ | 39,883 | $ | 27,230 | $ | 21,975 | ||||||||
Net income (loss) | (9,394 | ) | (5,517 | ) | 16,744 | (7,179 | ) | |||||||||
Basic and diluted earnings (loss) per share | (0.03 | ) | (0.02 | ) | 0.05 | (0.02 | ) | |||||||||
14 | Denison Mines Corp. Annual Report 2011
MANAGEMENT’S DISCUSSION AND ANALYSIS
Year Ended December 31, 2011
LIQUIDITY AND CAPITAL RESOURCES
Cash and cash equivalents were $53,515,000 at December 31, 2011 compared with $97,554,000 at December 31, 2010. The decrease of $44,039,000 was due primarily to cash used in operations of $19,983,000, the acquisition of WCU totaling $59,704,000, and expenditures on property, plant and equipment totaling $24,274,000, offset by common share issues totaling $62,442,000.
Net cash used in operating activities of $19,983,000 during the year ended December 31, 2011 is comprised of net loss for the period adjusted for non-cash items and for changes in working capital items. Significant changes in working capital items during the period include a decrease in accounts payable and accrued liabilities of $5,667,000, an increase of $23,304,000 in inventories and a decrease of $6,758,000 in trade and other receivables.
Net cash used in investing activities was $85,744,000 consisting primarily of the acquisition of WCU totaling $59,704,000 (net of cash acquired), expenditures on property, plant and equipment of $24,274,000 and an increase in restricted cash of $3,349,000.
Net cash from financing activities totaled $62,261,000 consisting primarily of $62,442,000 from the issue of common shares less $181,000 net repayment of debt obligations.
In total, these sources and uses of cash resulted in a net cash outflow after the effect of foreign exchange of $44,039,000 during the period.
On June 30, 2011 the Company put in place a revolving term credit facility (the “Credit Facility”) for up to $35,000,000. The amount of the Credit Facility available is the lesser of $35,000,000 and a “borrowing base” which is determined quarterly based on a percentage of accounts receivable and inventory. The current borrowing base is $32,554,000.
The Credit Facility contains a covenant to maintain a certain level of tangible net worth, which must be greater than or equal to the sum of $425,000,000 plus an amount equal to (i) 50% of each equity issue from and including June 30, 2011 and (ii) 50% of positive net income in each fiscal quarter from and including June 30, 2011.
The Credit Facility terminates on June 29, 2012. There is no debt outstanding under this facility; however $9,536,000 of the line was used as collateral for certain letters of credit at December 31, 2011.
The Company has provided an unlimited full recourse guarantee and a pledge of all of the shares of Denison Mines Inc. (“DMI”). DMI has provided a first-priority security interest in all present and future personal property and an assignment of its rights and interests under all material agreements relative to the McClean Lake and Midwest projects. In addition, each of the Company’s material U.S. subsidiaries has provided an unlimited full recourse guarantee secured by a pledge of all of its shares and a first-priority security interest in all of its present and future personal property. The Credit Facility is subject to a standby fee of 1%.
OFF-BALANCE SHEET ARRANGEMENTS
The Company does not have any off-balance sheet arrangements.
Denison Mines Corp. Annual Report 2011 | 15
MANAGEMENT’S DISCUSSION AND ANALYSIS
Year Ended December 31, 2011
TRANSACTIONS WITH RELATED PARTIES
The Company is a party to a management services agreement with UPC. Under the terms of the agreement, the Company will receive the following fees from UPC: a) a commission of 1.5% of the gross value of any purchases or sales of uranium completed at the request of the Board of Directors of UPC; b) a minimum annual management fee of CAD$400,000 (plus reasonable out-of-pocket expenses) plus an additional fee of 0.3% per annum based upon UPC’s net asset value between CAD$100,000,000 and CAD$200,000,000 and 0.2% per annum based upon UPC’s net asset value in excess of CAD$200,000,000; c) a fee of CAD$200,000 upon the completion of each equity financing where proceeds to UPC exceed CAD$20,000,000; d) a fee of CAD$200,000 for each transaction or arrangement (other than the purchase or sale of uranium) of business where the gross value of such transaction exceeds CAD$20,000,000 (“an initiative”); e) an annual fee up to a maximum of CAD$200,000, at the discretion of the Board of Directors of UPC, for ongoing maintenance or work associated with an initiative; and f) a fee equal to 1.5% of the gross value of any uranium held by UPC prior to the completion of any acquisition of at least 90% of the common shares of UPC.
The following transactions were incurred with UPC for the periods noted below:
| Three Months | Three Months | Year | Year | |||||||||||||
| Ended | Ended | Ended | Ended | |||||||||||||
| December 31 | December 31 | December 31 | December 31 | |||||||||||||
(in thousands) | 2011 | 2010 | 2011 | 2010 | ||||||||||||
Revenue | ||||||||||||||||
Management fees | $ | 437 | $ | 487 | $ | 1,913 | $ | 1,614 | ||||||||
Commission and transaction fees | — | — | — | 962 | ||||||||||||
|
|
|
|
|
|
|
| |||||||||
Total | $ | 437 | $ | 487 | $ | 1,913 | $ | 2,576 | ||||||||
|
|
|
|
|
|
|
| |||||||||
At December 31, 2011, accounts receivable includes $226,000 (2010 – $281,000) due from UPC with respect to the fees indicated above.
In November 2010, the Company entered into uranium concentrates loan agreement with UPC which entitled the Company to borrow 150,000 pounds of U3O8 from UPC. The U3O8 loan was subject to a loan fee and required collateral in the form of an irrevocable standby letter of credit. The uranium loaned was to be repaid by February 3, 2011 or a later date agreed to by both parties. On December 24, 2010, the Company issued a letter of credit in favour of UPC in the amount of $10,065,000 as collateral for the U3O8 loan. On January 3, 2011, the Company borrowed 150,000 pounds of U3O8 from UPC. On February 3, 2011, the repayment date for the U3O8 loan was amended to April 4, 2011 and the letter of credit was increased to $12,045,000. The uranium loaned was returned on March 30, 2011. In 2011, the Company incurred and paid $91,000 of loan fees under the agreement and the standby letter of credit has been cancelled.
The Company has incurred management and administrative service fees of $176,000 (2010: $82,000) with a company owned by the Chairman of the Company which provides corporate development, office premises, secretarial and other services. At December 31, 2011, an amount of $nil (2010: $nil) was due to this company.
Korea Electric Power Corporation (“KEPCO”)
In June 2009, Denison completed definitive agreements with KEPCO. The agreements included a long-term offtake agreement which provides for the delivery to KEPCO of 20% of Denison’s annual U3O8 production (±10%) but not less than 350,000 pounds (±10%) per year from 2010 to 2015 inclusive. The agreement also provides for the purchase of 20% of production after 2015 subject to certain conditions. KEPCO also purchased 58,000,000 common shares of Denison representing approximately 17% of the issued and outstanding capital as at the June 2009 share purchase. Pursuant to a strategic relationship agreement, KEPCO is entitled to subscribe for additional common shares in Denison’s future share offerings. KEPCO also has the right to require Denison to nominate two persons designated by KEPCO to Denison’s board of directors if KEPCO holds at least a 15% share interest in Denison (or one director if KEPCO’s share interest is between 5% and 15%). Currently, KEPCO’s interest in Denison is approximately 15.08%. Under the strategic relationship agreement, two representatives from KEPCO have been appointed to Denison’s board of directors.
OUTSTANDING SHARE DATA
At March 8, 2012, there were 384,660,915 common shares issued and outstanding and 7,387,914 stock options outstanding to purchase a total of 7,387,914 common shares for a total of 392,048,829 common shares on a fully diluted basis.
16 | Denison Mines Corp. Annual Report 2011
MANAGEMENT’S DISCUSSION AND ANALYSIS
Year Ended December 31, 2011
CONTROLS AND PROCEDURES
The Company carried out an evaluation, under the supervision and with the participation of its management, including the President and Chief Executive Officer and the Chief Financial Officer, of the effectiveness of the design and operation of the Company’s “disclosure controls and procedures” (as defined in the Exchange Act Rule 13a-15(e)) as of the end of the period covered by this report. Based upon that evaluation, the President and Chief Executive Officer and the Chief Financial Officer concluded that the Company’s disclosure controls and procedures are effective.
The Company’s management is responsible for establishing and maintaining an adequate system of internal control over financial reporting. Management conducted an evaluation of the effectiveness of internal control over financial reporting based on theInternal Control – Integrated Frameworkissued by the Committee of Sponsoring Organizations of the Treadway Commission. Based on this evaluation, management concluded that the Company’s internal control over financial reporting was effective as of December 31, 2011.
There has not been any change in the Company’s internal control over financial reporting that occurred during the Company’s fourth fiscal quarter of 2011 that has materially affected, or is reasonably likely to materially affect, the Company’s internal control over financial reporting.
CRITICAL ACCOUNTING ESTIMATES AND JUDGMENTS
The preparation of consolidated financial statements in accordance with IFRS requires the use of certain critical accounting estimates and judgments that affect the amounts reported. It also requires management to exercise judgment in applying the Company’s accounting policies. These judgments and estimates are based on management’s best knowledge of the relevant facts and circumstances taking into account previous experience. Although the Company regularly reviews the estimates and judgments made that affect these financial statements, actual results may be materially different.
Significant estimates and judgments made by management relate to:
(a) Depreciation and Amortization of Property, Plant and Equipment
Property, plant and equipment comprise a large component of the Company’s assets and, as such, the depreciation and amortization of those assets have a significant effect on the Company’s financial statements. Depreciation and amortization of property, plant and equipment used in production is calculated on a straight line basis or a unit of production basis as appropriate.
Plant and equipment assets depreciated using a straight line basis require estimates of residual values and allocate the cost of an asset to production cost evenly over the asset’s useful life defined as a period of time. Plant and equipment assets depreciated using a units of production basis require estimates of residual values and allocate the cost of an asset to production cost based on current period production in proportion to total anticipated production from the facility. In certain instances, the total anticipated production from a facility will require making estimates about future toll milling volumes.
Mineral property assets are amortized using a units of production basis that allocates the cost of the asset to production cost based on the current period’s mill feed as a proportion of the total estimated resources in the related ore body. The process of making these estimates requires significant judgment in evaluating and assessing available geological, geophysical, engineering and economic data, projected rates of production, estimated commodity price forecasts and the timing of future expenditures, all of which are, by their very nature, subject to interpretation and uncertainty.
Changes in these estimates may materially impact the carrying value of the Company’s property, plant and equipment and the recorded amount of depletion and depreciation.
(b) Valuation of Long-lived Assets
The Company undertakes a review of the carrying values of mining properties and related expenditures whenever events or changes in circumstances indicate that their carrying values may exceed their estimated net recoverable amounts determined by reference to estimated future operating results and discounted net cash flows. An impairment loss is recognized when the carrying value of those assets is not recoverable. In undertaking this review, management of the Company is required to make significant estimates of, amongst other things, future production and sale volumes, forecast commodity prices, future operating and capital costs and reclamation costs to the end of the mine’s life. These estimates are subject to various risks and uncertainties, which may ultimately have an effect on the expected recoverability of the carrying values of the mining properties and related expenditures.
The Company reviews goodwill at least annually. The Company has estimated the fair value of operating segments to which goodwill is allocated using discounted cash flow models that require assumptions about future cash flows, expenditures and an assumed discount rate. Changes in these estimates could have a material impact on the carrying value of the goodwill.
Denison Mines Corp. Annual Report 2011 | 17
MANAGEMENT’S DISCUSSION AND ANALYSIS
Year Ended December 31, 2011
(c) Inventory
The Company values its concentrate, work in process and ore stockpile inventories at the lower of cost or net realizable value at the end of the reporting period. Costs represent the average cost, and include direct labour and materials costs, mine site overhead, plant and equipment depreciation, mineral property amortization and stockpile depletion. Net realizable value is based on estimated future commodity prices and estimated costs required to convert work in process and ore stockpile inventories into saleable form. These estimates are subject to change from period-to-period that may materially impact the carrying value of the Company’s inventories resulting in inventory write-downs and recoveries.
(d) Deferred Tax Assets and Liabilities
Deferred tax assets and liabilities are recognized for the future tax consequences attributable to differences between the financial statement carrying amounts of existing assets and liabilities and their respective tax bases. Deferred tax assets and liabilities are measured using enacted or substantially enacted tax rates expected to apply when the differences are expected to be recovered or settled. The determination of the ability of the Company to utilize tax loss carry forwards to offset deferred tax liabilities requires management to exercise judgment and make certain assumptions about the future performance of the Company. Management is required to assess whether it is “probable” that the Company will benefit from these prior losses and other deferred tax assets. Changes in economic conditions, commodity prices and other factors could result in revisions to the estimates of the benefits to be realized or the timing of utilizing the losses.
(e) Business Combinations
Management uses judgment in applying the acquisition method of accounting for business combinations and in determining fair values of the identifiable assets and liabilities acquired. The value placed on the acquired assets and liabilities, including identifiable intangible assets, will have an effect on the amount of goodwill that the Company may record on an acquisition. Changes in economic conditions, commodity prices and other factors between the date that an acquisition is announced and when it finally is consummated can have a material difference on the allocation used to record a preliminary purchase price allocation versus the final purchase price allocation which can take up to one year after acquisition to complete.
(f) Reclamation Obligations
Asset retirement obligations are recorded as a liability when the asset is initially constructed. Denison has accrued its best estimate of the ongoing reclamation liability in connection with the decommissioned Elliot Lake mine site and is currently accruing its best estimate of its share of the cost to decommission its other mining and milling properties in accordance with existing laws, contracts and other policies. The estimate of future costs involves a number of estimates relating to timing, type of costs, mine closure plans, and review of potential methods and technical advancements. Furthermore, due to uncertainties concerning environmental remediation, the ultimate cost of the Company’s decommissioning liability could differ from amounts provided. The estimate of the Company’s obligation is subject to change due to amendments to applicable laws and regulations and as new information concerning the Company’s operations becomes available. The Company is not able to determine the impact on its financial position, if any, of environmental laws and regulations that may be enacted in the future.
NEW ACCOUNTING PRONOUNCEMENTS
The Company is currently evaluating the impact of the following pronouncements and has not yet determined the impact of the following pronouncements or whether to early adopt any of the new requirements:
(a) International Financial Reporting Standard 7, Financial Instruments – Disclosure (“IFRS 7”)
IFRS 7 was amended to provide guidelines on the eligibility criteria for offsetting assets and liabilities as a single net amount in the balance sheet. This amendment is effective for annual periods beginning on or after January 1, 2013.
18 | Denison Mines Corp. Annual Report 2011
MANAGEMENT’S DISCUSSION AND ANALYSIS
Year Ended December 31, 2011
(b) International Financial Reporting Standard 9, Financial Instruments (“IFRS 9”)
IFRS 9 was issued in November 2009 and contained requirements for financial assets. This standard addresses classification and measurement of financial assets and replaces the multiple category and measurement models in IAS 39 for debt instruments with a new mixed measurement model having only two categories: amortized cost and fair value through profit or loss. IFRS 9 also replaces the models for measuring equity instruments, and such instruments are either recognized at fair value through profit or loss or at fair value through other comprehensive income. Where such equity instruments are measured at fair value through other comprehensive income, dividends are recognized in profit or loss to the extent not clearly representing a return of investment; however, other gains and losses (including impairments) associated with such instruments remain in accumulated comprehensive income indefinitely.
Requirements for financial liabilities were added in October 2010 and they largely carried forward existing requirements in IAS 39, Financial Instruments – Recognition and Measurement, except that fair value changes due to credit risk for liabilities designated at fair value through profit and loss would generally be recorded in other comprehensive income.
This standard is required to be applied for accounting periods beginning on or after January 1, 2015, with earlier adoption permitted.
(c) International Financial Reporting Standard 10, Consolidated Financial Statements (“IFRS 10”)
IFRS 10 was issued in May 2011 and it establishes principles for the presentation and preparation of consolidated financial statements when an entity controls one or more other entities. IFRS 10 requires an entity to consolidate an investee when it is exposed, or has rights, to variable returns from its involvement with the investee and has the ability to affect those returns through its power over the investee. Under existing IFRS, consolidation is required when an entity has the power to govern the financial and operating policies of an entity so as to obtain benefits from its activities. IFRS 10 replaces the consolidation requirements in SIC-12 Consolidation—Special Purpose Entities and IAS 27 Consolidated and Separate Financial Statements.
This standard is effective for annual periods beginning on or after January 1, 2013. Earlier application is permitted.
(d) International Financial Reporting Standard 11, Joint Arrangements (“IFRS 11”)
IFRS 11 was issued in May 2011 and it provides for a more realistic reflection of joint arrangements by focusing on the rights and obligations of the arrangement, rather than its legal form. IFRS 11 requires the venture to classify its interest in a joint arrangement as a joint venture or a joint operation. Joint ventures will be accounted for using the equity method of accounting whereas for a joint operation the venture will recognize its share of the assets, liabilities, revenue and expenses of the joint operation. Under existing IFRS, entities have the choice to proportionately consolidate or equity account for interests in joint ventures. The standard addresses inconsistencies in the reporting of joint arrangements by requiring a single method to account for interests in jointly controlled entities. IFRS 11 supersedes IAS 31 Interests in Joint Ventures and SIC-13 Jointly Controlled Entities – Non-Monetary Contributions by Ventures.
The standard is effective for annual periods beginning on or after January 1, 2013. Earlier application is permitted.
(e) International Financial Reporting Standard 12, Disclosure of Interest in Other Entities (“IFRS 12”)
IFRS 12 was issued in May 2011 and it is a new and comprehensive standard on disclosure requirements for all forms of interests in other entities, including subsidiaries, joint arrangements, associates and unconsolidated structured entities. The standard carries forward existing disclosures and also introduces significant additional disclosure requirements that address the nature of, and risks associated with, an entity’s interest in other entities.
The standard is effective for annual periods beginning on or after January 1, 2013. Earlier application is permitted.
(f) International Financial Reporting Standard 13, Fair Value Measurement (“IFRS 13”)
IFRS 13 was issued in May 2011 and establishes new guidance on fair value measurement and disclosure requirements for IFRS and completes a major project to improve the convergence of IFRS and U.S. GAAP. The new standard clarifies that fair value is the price that would be received to sell an asset, or paid to transfer a liability in an orderly transaction between market participants, at the measurement date.
The standard is effective for annual periods beginning on or after January 1, 2013. Earlier application is permitted.
Denison Mines Corp. Annual Report 2011 | 19
MANAGEMENT’S DISCUSSION AND ANALYSIS
Year Ended December 31, 2011
| (g) | International Accounting Standard 1, Presentation of Financial Statements (“IAS 1”) |
IAS 1 was amended to require entities to group items within other comprehensive income based on an assessment of whether such items may or may not be reclassified to profit or loss at a subsequent date. This standard is effective for annual periods beginning on or after July 1, 2012. Earlier application is permitted.
| (h) | International Accounting Standard 19, Post-Employment Benefits (“IAS 19”) |
IAS 19 was amended to eliminate an entity’s option to defer the recognition of certain gains and losses related to post-employment benefits and require re-measurement of associated assets and liabilities in other comprehensive income. This amendment is effective for annual periods beginning on or after January 1, 2013. Earlier application is permitted.
| (i) | International Accounting Standard 28, Investments in Associates (“IAS 28”) |
IAS 28 was amended to include joint ventures in its scope and to address the changes in IFRS 10 to 13. This amendment is effective for annual periods beginning on or after January 1, 2013. Earlier adoption is permitted.
| (j) | International Accounting Standard 32, Financial Instruments – Presentation (“IAS 32”) |
IAS 32 was amended to clarify the criteria that should be considered in determining whether an entity has a legally enforceable right of set off in respect of its financial instruments. Amendments to IAS 32 are applicable to annual periods beginning on or after January 1, 2014 with retrospective application required. Earlier application is permitted.
CONTRACTUAL OBLIGATIONS
At December 31, 2011, the Company had reclamation liabilities of $21,576,000 consisting of $7,140,000 for U.S. mill and mine obligations, $11,800,000 for Elliot Lake and $2,636,000 for the McClean Lake and Midwest joint ventures.
In addition, the Company’s contractual obligations at December 31, 2011 are as follows:
(in thousands) | Total | 1 Year | 2–3 Years | 4–5 Years | After 5 Years | |||||||||||||||
Debt obligations | $ | 221 | 111 | 110 | — | — | ||||||||||||||
Operating lease and other obligations | $ | 13,898 | 7,610 | 5,517 | 755 | 16 | ||||||||||||||
|
|
|
|
|
|
|
|
|
| |||||||||||
ENVIRONMENTAL RESPONSIBILITY
The Company periodically reviews the anticipated costs of decommissioning and reclaiming its mill and mine sites as part of its environmental planning process. Further, the Company formally reviews the mill’s reclamation estimate annually with applicable regulatory authorities. The mill and mine reclamation estimates at December 31, 2011 are $21,576,000 which are expected to be sufficient to cover the projected future costs for reclamation of the mill and mine operations. However, there can be no assurance that the ultimate cost of such reclamation obligations will not exceed the estimated liability contained in the Company’s financial statements.
The Company has posted bonds, letters of credit and trust funds as security for these liabilities. At December 31, 2011, the amount of these restricted cash and investments and line of credit collateralizing the Company’s reclamation obligations was $36,329,000.
The Company has detected some chloroform contamination at the White Mesa mill site that appears to have resulted from the operation of a temporary laboratory facility that was located at the site prior to and during the construction of the mill facility, and from septic drain fields that were used for laboratory and sanitary wastes prior to construction of the mill’s tailings cells. In April 2003, the Company commenced an interim remedial program of pumping the chloroform contaminated water from the groundwater to the mill’s tailings cells. This will enable the Company to begin clean up of the contaminated areas and to take a further step towards resolution of this outstanding issue. Pumping from the wells continued in 2011. Denison is continuing to work with the State of Utah to develop a long-term Corrective Action Plan. A draft of the Corrective Action Plan was submitted by Denison and is currently being reviewed by the State. While the investigations to date indicate that this chloroform contamination appears to be contained in a manageable area, the scope and costs of final remediation have not yet been determined and could be significant.
20 | Denison Mines Corp. Annual Report 2011
MANAGEMENT’S DISCUSSION AND ANALYSIS
Year Ended December 31, 2011
Elevated concentrations of nitrate and chloride were observed in some monitoring wells at the mill site in 2008 a number of which are upgradient of the mill’s tailings cells. Pursuant to a Stipulated Consent Agreement with UDEQ, the Company retained INTERA, Inc., an independent professional engineering firm, to investigate these elevated concentrations and to prepare a Contamination Investigation Report for submittal to UDEQ. The investigation was completed in 2009 and the Contamination Investigation Report was submitted to UDEQ in January 2010. INTERA concluded in the Report that: (1) the nitrate and chloride are co-extensive and appear to originally come from the same source; and (2) the source is upgradient of the mill property and is not the result of mill activities. UDEQ reviewed the Report, and has concluded that further investigations were required before it can determine the source of the contamination and the responsibility for clean up.
Such investigations were performed in 2010 and 2011, but were considered to be inconclusive by UDEQ. As a result, after over two years of investigation, it has been determined that there are site conditions that make it difficult to ascertain the source(s) of contamination at the site, and that it has therefore not been possible to date to determine the source(s), causes(s), attribution, magnitudes of contribution, and proportion(s) of the local nitrate and chloride in groundwater. For those reasons, UDEQ has decided that it cannot eliminate mill activities as a potential cause, either in full or in part, of the contamination. The Company and UDEQ have agreed that resources will be better spent in developing a Corrective Action Plan, rather than continuing with further investigations as to the source(s) and attribution of the groundwater contamination. Pursuant to a revised Stipulated Consent Agreement, the Company submitted to UDEQ in November 2011 a draft Corrective Action Plan for remediation of the contamination, which involves a program of pumping the nitrate contaminated groundwater to the mill’s tailings cells, similar to the chloroform remedial program. UDEQ is currently reviewing the proposed Corrective Action Plan. Although the contamination appears to be contained in a manageable area, the scope and costs of final remediation have not yet been determined and, if determined to be the responsibility of the Company, could be significant.
RESEARCH AND DEVELOPMENT
The Company does not have a formal research and development program. Process development efforts expended in connection with processing alternate feeds are included as a cost of processing. Process development efforts expended in the evaluation of potential alternate feed materials that are not ultimately processed at the mill are included in mill overhead costs. The Company does not rely on patents or technological licences in any significant way in the conduct of its business.
RISK FACTORS
There are a number of factors that could negatively affect Denison’s business and the value of Denison’s common shares, including the factors listed below. The following information pertains to the outlook and conditions currently known to Denison that could have a material impact on the financial condition of Denison. This information, by its nature, is not all inclusive. It is not a guarantee that other factors will not affect Denison in the future.
Current Global Financial Conditions
Current global financial conditions have been subject to increased volatility and numerous financial institutions have either gone into bankruptcy or have had to be rescued by governmental authorities. Access to public financing has been negatively impacted by both sub-prime mortgages and the liquidity crisis affecting the asset-backed commercial paper market and the effect of these events on Canadian and global credit markets. These factors may impact the ability of Denison to obtain equity or debt financing in the future and, if obtained, on terms favorable to Denison. If these increased levels of volatility and market turmoil continue, Denison’s operations could be adversely impacted and the trading price of the common shares could continue to be adversely affected.
Denison Mines Corp. Annual Report 2011 | 21
MANAGEMENT’S DISCUSSION AND ANALYSIS
Year Ended December 31, 2011
Market Price of Shares
Securities of mining companies have experienced substantial volatility in the past, often based on factors unrelated to the financial performance or prospects of the companies involved. These factors include macroeconomic conditions in North America and globally, and market perceptions of the attractiveness of particular industries. The price of Denison’s securities is also likely to be significantly affected by short-term changes in commodity prices, other mineral prices, currency exchange fluctuation, or in its financial condition or results of operations as reflected in its periodic earnings reports. Other factors unrelated to the performance of Denison that may have an effect on the price of the securities of Denison include the following: the extent of analytical coverage available to investors concerning the business of Denison may be limited if investment banks with research capabilities do not follow Denison’s securities; lessening in trading volume and general market interest in Denison’s securities may affect an investor’s ability to trade significant numbers of securities of Denison; the size of Denison’s public float and its inclusion in market indices may limit the ability of some institutions to invest in Denison’s securities; and a substantial decline in the price of the securities of Denison that persists for a significant period of time could cause Denison’s securities to be delisted from an exchange, further reducing market liquidity. If an active market for Denison’s securities does not continue, the liquidity of an investor’s investment may be limited and the price of the securities of the Company may decline. If an active market does not exist, investors may lose their entire investment in the Company. As a result of any of these factors, the market price of the securities of Denison at any given point in time may not accurately reflect the long-term value of Denison. Securities class-action litigation often has been brought against companies following periods of volatility in the market price of their securities. Denison may in the future be the target of similar litigation. Securities litigation could result in substantial costs and damages and divert management’s attention and resources.
Dilution from Further Equity Financing
If Denison raises additional funding by issuing additional equity securities, such financing may substantially dilute the interests of shareholders of Denison and reduce the value of their investment.
Volatility and Sensitivity to Market Prices
Because the majority of Denison’s revenues is derived from the sale of uranium and vanadium, Denison’s net earnings and operating cash flow are closely related and sensitive to fluctuations in the long-term and short-term market price of U3O8 and V2O5. Among other factors, these prices also affect the value of Denison’s reserves and the market price of Denison’s common shares. Historically, these prices have fluctuated and have been and will continue to be affected by numerous factors beyond Denison’s control.
With respect to uranium, such factors include, among others: demand for nuclear power, political and economic conditions in uranium producing and consuming countries, reprocessing of used reactor fuel and the re-enrichment of depleted uranium tails, sales of excess civilian and military inventories (including from the dismantling of nuclear weapons) by governments and industry participants, uranium supply, including the supply from other secondary sources and production levels and costs of production. With respect to vanadium, such factors include, among others: demand for steel, political and economic conditions in vanadium producing and consuming countries, world production levels and costs of production.
Although Denison employs various pricing mechanisms within its sales contracts to manage its exposure to price fluctuations, there can be no assurance that such a program will be successful.
Ability to Maintain Obligations Under Credit Facility and Other Debt
Denison is required to satisfy certain financial covenants in order to maintain its good standing under the Credit Facility. Denison may from time to time enter into other arrangements to borrow money in order to fund its operations and expansion plans, and such arrangements may include covenants that have similar obligations or that restrict its business in some way. Events may occur in the future, including events out of Denison’s control, that would cause Denison to fail to satisfy its obligations under the Credit Facility or other debt instruments. In such circumstances, the amounts drawn under Denison’s debt agreements may become due and payable before the agreed maturity date, and Denison may not have the financial resources to repay such amounts when due. The Credit Facility is secured by DMI’s main properties by a pledge of the shares of DMI, and by the property of Denison’s material U.S. subsidiaries. If Denison were to default on its obligations under the Credit Facility or other secured debt instruments in the future, the lender(s) under such debt instruments could enforce their security and seize significant portions of Denison’s assets.
22 | Denison Mines Corp. Annual Report 2011
MANAGEMENT’S DISCUSSION AND ANALYSIS
Year Ended December 31, 2011
Public Acceptance of Nuclear Energy and Competition from Other Energy Sources
Growth of the uranium and nuclear power industry will depend upon continued and increased acceptance of nuclear technology as a means of generating electricity. Because of unique political, technological and environmental factors that affect the nuclear industry, the industry is subject to public opinion risks that could have an adverse impact on the demand for nuclear power and increase the regulation of the nuclear power industry. Nuclear energy competes with other sources of energy, including oil, natural gas, coal and hydroelectricity. These other energy sources are to some extent interchangeable with nuclear energy, particularly over the longer term. Sustained lower prices of oil, natural gas, coal and hydroelectricity may result in lower demand for uranium concentrates. Technical advancements in renewable and other alternate forms of energy, such as wind and solar power, could make these forms of energy more commercially viable and put additional pressure on the demand for uranium concentrates.
Uranium Industry Competition and International Trade Restrictions
The international uranium industry, including the supply of uranium concentrates, is competitive. Denison markets uranium in direct competition with supplies available from a relatively small number of uranium mining companies, from excess inventories, including inventories made available from decommissioning of nuclear weapons, from reprocessed uranium and plutonium, from used reactor fuel, and from the use of excess Russian enrichment capacity to re-enrich depleted uranium tails held by European enrichers in the form of UF6. The supply of uranium from Russia and from certain republics of the former Soviet Union is, to some extent, impeded by a number of international trade agreements and policies. These agreements and any similar future agreements, governmental policies or trade restrictions are beyond the control of Denison and may affect the supply of uranium available in the United States and Europe, which are the largest markets for uranium in the world.
Competition for Properties
Significant competition exists for the limited supply of mineral lands available for acquisition. Many participants in the mining business include large, established companies with long operating histories. The Company may be at a disadvantage in acquiring new properties as many mining companies have greater financial resources and more technical staff. Accordingly, there can be no assurance that the Company will be able to compete successfully to acquire new properties or that any such acquired assets would yield reserves or result in commercial mining operations.
Replacement of Mineral Reserves and Resources
Denison’s mineral reserves and resources at its McClean Lake, Midwest, Wheeler River, Arizona Strip, Colorado Plateau, Henry Mountains, White Canyon, GSJV, Mutanga and Dibwe projects are Denison’s sources of uranium concentrates. Unless other reserves and resources are discovered or extensions to existing ore bodies are found, Denison’s sources of production for uranium concentrates will decrease over time as its current reserves and resources are depleted. There can be no assurance that Denison’s future exploration, development and acquisition efforts will be successful in replenishing its reserves and resources. In addition, while Denison believes that many of its properties will eventually be put into production, there can be no assurance that they will be, or that they will be able to replace production.
Imprecision of Mineral Reserve and Resource Estimates
Mineral reserve and resource figures are estimates, and no assurances can be given that the estimated levels of uranium and vanadium will be produced or that Denison will receive the prices assumed in determining its reserves and resources. Such estimates are expressions of judgment based on knowledge, mining experience, analysis of drilling results and industry practices. Valid estimates made at a given time may significantly change when new information becomes available. While Denison believes that the reserve and resource estimates included are well established and reflect management’s best estimates, by their nature, reserve and resource estimates are imprecise and depend, to a certain extent, upon statistical inferences which may ultimately prove unreliable. Furthermore, market price fluctuations, as well as increased capital or production costs or reduced recovery rates, may render ore reserves and resources containing lower grades of mineralization uneconomic and may ultimately result in a restatement of reserves and resources. The evaluation of reserves or resources is always influenced by economic and technological factors, which may change over time.
Denison Mines Corp. Annual Report 2011 | 23
MANAGEMENT’S DISCUSSION AND ANALYSIS
Year Ended December 31, 2011
Decommissioning and Reclamation
As owner and operator of the White Mesa mill and numerous uranium and uranium/vanadium mines located in the United States and as part owner of the McClean Lake mill, McClean Lake mines, the Midwest uranium project and certain exploration properties, and for so long as the Company remains an owner thereof, the Company is obligated to eventually reclaim or participate in the reclamation of such properties. Most, but not all, of the Company’s reclamation obligations are bonded, and cash and other assets of the Company have been reserved to secure this bonded amount. Although the Company’s financial statements record a liability for the asset retirement obligation, and the bonding requirements are generally periodically reviewed by applicable regulatory authorities, there can be no assurance or guarantee that the ultimate cost of such reclamation obligations will not exceed the estimated liability contained on the Company’s financial statements.
Decommissioning plans for the Company’s properties have been filed with applicable regulatory authorities. These regulatory authorities have accepted the decommissioning plans in concept, not upon a detailed performance forecast, which has not yet been generated. As Denison’s properties approach or go into decommissioning, further regulatory review of the decommissioning plans may result in additional decommissioning requirements, associated costs and the requirement to provide additional financial assurances. It is not possible to predict what level of decommissioning and reclamation (and financial assurances relating thereto) may be required in the future by regulatory authorities.
Technical Innovation and Obsolescence
Requirements for Denison’s products and services may be affected by technological changes in nuclear reactors, enrichment and used uranium fuel reprocessing. These technological changes could reduce the demand for uranium or reduce the value of Denison’s environmental services to potential customers. In addition, Denison’s competitors may adopt technological advancements that give them an advantage over Denison.
Property Title Risk
The Company has investigated its rights to explore and exploit all of its material properties and, to the best of its knowledge, those rights are in good standing. However, no assurance can be given that such rights will not be revoked, or significantly altered, to its detriment. There can also be no assurance that the Company’s rights will not be challenged or impugned by third parties, including the local governments, and in Canada, by First Nations and Métis.
The validity of unpatented mining claims on U.S. public lands is sometimes difficult to confirm and may be contested. Due to the extensive requirements and associated expense required to obtain and maintain mining rights on U.S. public lands, Denison’s U.S. properties are subject to various title uncertainties which are common to the industry or the geographic location of such claims, with the attendant risk that there may be defects in its title. In addition, the Secretary of the Interior has withdrawn certain lands around the Grand Canyon National Park from location and entry under the mining laws. All of Denison’s material Arizona Strip properties are located on these withdrawn lands. No new mining claims may be filed on the lands and no new plans of operations may be approved, other than plans of operations on mining claims that were valid at the time of withdrawal and that remain valid at the time of plan approval. Whether or not a mining claim is valid must be determined by a mineral examination conducted by BLM. The mineral examination, which involves an economic evaluation of a project, must demonstrate the existence of a locatable mineral resource and that the resource constitutes the discovery of a valuable mineral deposit. Denison believes that all of its material Arizona Strip projects are on valid mining claims that would withstand a mineral examination, and that, as a result, none of its material Arizona Strip projects would be significantly impacted by the withdrawal. Further, certain of those projects have approved plans of operations which, absent modification, would not require a mineral examination. However, there can be no guarantee that the mineral examinations on Denison’s Arizona Strip properties would not result in one or more of Denison’s mining claims being considered invalid, which could prevent a project from proceeding.
There is also a risk that Denison’s title to, or interest in, its properties outside the United States may be subject to defects or challenges. This may be true particularly in countries outside North America, where there may be less developed legal systems or where ownership interests may become subject to political interference or changes in laws. If such defects cover a material portion of Denison’s property, they could materially and adversely affect Denison’s results of operations and financial condition, its reported mineral reserves and resources or its long-term business prospects.
24 | Denison Mines Corp. Annual Report 2011
MANAGEMENT’S DISCUSSION AND ANALYSIS
Year Ended December 31, 2011
Production Estimates
Denison prepares estimates of future production for particular operations. No assurance can be given that production estimates will be achieved. Failure to achieve production estimates could have an adverse impact on Denison’s future cash flows, earnings, results of operations and financial condition. These production estimates are based on, among other things, the following factors: the accuracy of reserve estimates; the accuracy of assumptions regarding ground conditions and physical characteristics of ores, such as hardness and presence or absence of particular metallurgical characteristics; and the accuracy of estimated rates and costs of mining and processing and assumptions as to future commodity prices.
Denison’s actual production may vary from estimates for a variety of reasons, including, among others: actual ore mined varying from estimates of grade, tonnage, dilution and metallurgical and other characteristics; short-term operating factors relating to the ore reserves, such as the need for sequential development of ore bodies and the processing of new or different ore grades; risk and hazards associated with mining; natural phenomena, such as inclement weather conditions, underground floods, earthquakes, pit wall failures and cave-ins; and unexpected labour shortages or strikes and varying conditions in the commodity markets.
Mining and Insurance
Denison’s business is capital intensive and subject to a number of risks and hazards, including environmental pollution, accidents or spills, industrial and transportation accidents, labour disputes, changes in the regulatory environment, natural phenomena (such as inclement weather conditions, earthquakes, pit wall failures and cave-ins) and encountering unusual or unexpected geological conditions. Many of the foregoing risks and hazards could result in damage to, or destruction of, Denison’s mineral properties or processing facilities, personal injury or death, environmental damage, delays in or interruption of or cessation of production from Denison’s mines or processing facilities or in its exploration or development activities, delay in or inability to receive regulatory approvals to transport its uranium concentrates, or costs, monetary losses and potential legal liability and adverse governmental action. In addition, due to the radioactive nature of the materials handled in uranium mining and processing, additional costs and risks are incurred by Denison on a regular and ongoing basis.
Although Denison maintains insurance to cover some of these risks and hazards in amounts it believes to be reasonable, such insurance may not provide adequate coverage in the event of certain circumstances. No assurance can be given that such insurance will continue to be available or it will be available at economically feasible premiums or that it will provide sufficient coverage for losses related to these or other risks and hazards.
Denison may be subject to liability or sustain loss for certain risks and hazards against which it cannot insure or which it may reasonably elect not to insure because of the cost. This lack of insurance coverage could result in material economic harm to Denison.
Dependence on Issuance of Licence Amendments and Renewals
The Company maintains regulatory licences in order to operate its mills at White Mesa and McClean Lake, all of which are subject to renewal from time to time and are required in order for the Company to operate in compliance with applicable laws and regulations. In addition, depending on the Company’s business requirements, it may be necessary or desirable to seek amendments to one or more of its licences from time to time. While the Company has been successful in renewing its licences on a timely basis in the past and in obtaining such amendments as have been necessary or desirable, there can be no assurance that such licence renewals and amendments will be issued by applicable regulatory authorities on a timely basis or at all in the future.
Nature of Exploration and Development
Exploration for and development of mineral properties is speculative, and involves significant uncertainties and financial risks that even a combination of careful evaluation, experience and knowledge may not eliminate. While the discovery of an ore body may result in substantial rewards, few properties which are explored are commercially mineable or ultimately developed into producing mines. Major expenses may be required to establish reserves by drilling, constructing mining and processing facilities at a site, developing metallurgical processes and extracting uranium from ore. It is impossible to ensure that the current exploration and development programs of Denison will result in profitable commercial mining operations or that current production at existing mining operations will be replaced with new reserves.
Denison’s ability to sustain or increase its present levels of uranium production is dependent in part on the successful development of new ore bodies and/or expansion of existing mining operations. The economic feasibility of development projects is based upon many factors, including, among others: the accuracy of reserve estimates; metallurgical recoveries; capital and operating costs of such projects; government regulations relating to prices, taxes, royalties, infrastructure, land tenure, land use, importing and exporting, and environmental protection; and uranium prices, which are historically cyclical. Development projects are also subject to the successful completion of engineering studies, issuance of necessary governmental permits and availability of adequate financing.
Denison Mines Corp. Annual Report 2011 | 25
MANAGEMENT’S DISCUSSION AND ANALYSIS
Year Ended December 31, 2011
Development projects have no operating history upon which to base estimates of future cash flow. Denison’s estimates of reserves and resources and cash operating costs are, to a large extent, based upon detailed geological and engineering analysis. Denison also conducts feasibility studies which derive estimates of capital and operating costs based upon many factors, including, among others: anticipated tonnage and grades of ore to be mined and processed; the configuration of the ore body; ground and mining conditions; expected recovery rates of the uranium from the ore; and alternate mining methods.
It is possible that actual costs and economic returns of current and new mining operations may differ materially from Denison’s best estimates. It is not unusual in the mining industry for new mining operations to experience unexpected problems during the start-up phase, take much longer than originally anticipated to bring into a producing phase, and to require more capital than anticipated.
Governmental Regulation and Policy Risks
The Company’s mining and milling operations and exploration activities, as well as the transportation and handling of the products produced are subject to extensive regulation by state, provincial and federal governments. Such regulations relate to production, development, exploration, exports, imports, taxes and royalties, labour standards, occupational health, waste disposal, protection and remediation of the environment, mine decommissioning and reclamation, mine safety, toxic substances, transportation safety and emergency response, and other matters. Compliance with such laws and regulations has increased the costs of exploring, drilling, developing, constructing, operating and closing Denison’s mines and processing facilities. It is possible that, in the future, the costs, delays and other effects associated with such laws and regulations may impact Denison’s decision as to whether to operate existing mines, or, with respect to exploration and development properties, whether to proceed with exploration or development, or that such laws and regulations may result in Denison incurring significant costs to remediate or decommission properties that do not comply with applicable environmental standards at such time. Denison expends significant financial and managerial resources to comply with such laws and regulations. Denison anticipates it will have to continue to do so as the historic trend toward stricter government regulation may continue. Because legal requirements are frequently changing and subject to interpretation, Denison is unable to predict the ultimate cost of compliance with these requirements or their effect on operations. Furthermore, future changes in governments, regulations and policies, such as those affecting Denison’s mining operations and uranium transport could materially and adversely affect Denison’s results of operations and financial condition in a particular period or its long-term business prospects.
Failure to comply with applicable laws, regulations and permitting requirements may result in enforcement actions. These actions may result in orders issued by regulatory or judicial authorities causing operations to cease or be curtailed, and may include corrective measures requiring capital expenditures, installation of additional equipment or remedial actions. Companies engaged in uranium exploration operations may be required to compensate others who suffer loss or damage by reason of such activities and may have civil or criminal fines or penalties imposed for violations of applicable laws or regulations.
Worldwide demand for uranium is directly tied to the demand for electricity produced by the nuclear power industry, which is also subject to extensive government regulation and policies. The development of mines and related facilities is contingent upon governmental approvals that are complex and time consuming to obtain and which, depending upon the location of the project, involve multiple governmental agencies. The duration and success of such approvals are subject to many variables outside Denison’s control. Any significant delays in obtaining or renewing such permits or licences in the future could have a material adverse effect on Denison. In addition, the international marketing of uranium is subject to governmental policies and certain trade restrictions, such as those imposed by the suspension agreement between the United States and Russia and the agreement between the United States and Russia related to the supply of Russian HEU into the United States. Changes in these policies and restrictions may adversely impact Denison’s business.
Operations in Foreign Jurisdictions
The Company owns uranium properties directly and through joint venture interests and is undertaking uranium development programs in Mongolia and Zambia. As with any foreign operation, these international properties and interests are subject to certain risks, such as the possibility of adverse political and economic developments, foreign currency controls and fluctuations, as well as risks of war and civil disturbances. Other events may limit or disrupt activities on these properties, restrict the movement of funds, result in a deprivation of contract rights or the taking of property or an interest therein by nationalization or expropriation without fair compensation, increases in taxation or the placing of limits on repatriations of earnings. No assurance can be given that current policies of Mongolia or Zambia or the political situations within these countries will not change so as to adversely affect the value or continued viability of the Company’s interest in these assets. As an example, in July 2009, the Parliament of Mongolia enacted the Nuclear Energy Law, which granted authority to the Mongolian Nuclear Energy Agency and created a framework for all aspects of uranium resource development in Mongolia.
There are a number of provisions under the Nuclear Energy Law that will significantly affect the GSJV, in which Denison holds a 70% interest, including restrictions on the ability of a licensee to transfer its licences or interests in its uranium properties, and the ability of the Government of Mongolia to hold a 34% to 51% interest in each uranium property, depending on the amount of historic exploration on the property that was funded by the Government of Mongolia, in each uranium property at no cost to the Government. The Company is currently in the process of restructuring the GSJV to meet the requirements of the Nuclear Energy Law, pending government reviews and authorizations. In November 2011, in preparation for this restructuring, the Company finalized terms for acquisition of the Russian participant’s share in the GSJV. See RESULTS OF OPERATIONS – Mineral Property Exploration.
In addition, the Company may become involved in a dispute with respect to one of its foreign operations and may become subject to the exclusive jurisdiction of a foreign court or may find that it is not successful in subjecting foreign persons to the jurisdiction of the courts in Canada. The Company may also be precluded from enforcing its rights with respect to a government entity because of the doctrine of sovereign immunity.
26 | Denison Mines Corp. Annual Report 2011
MANAGEMENT’S DISCUSSION AND ANALYSIS
Year Ended December 31, 2011
Environmental, Health and Safety Risks
Denison has expended significant financial and managerial resources to comply with environmental protection laws, regulations and permitting requirements in each jurisdiction where it operates, and anticipates that it will be required to continue to do so in the future as the historical trend toward stricter environmental regulation may continue. The uranium industry is subject to, not only the worker health, safety and environmental risks associated with all mining businesses, including potential liabilities to third parties for environmental damage, but also to additional risks uniquely associated with uranium mining and processing. The possibility of more stringent regulations exists in the areas of worker health and safety, the disposition of wastes, the decommissioning and reclamation of mining and processing sites, and other environmental matters each of which could have a material adverse effect on the costs or the viability of a particular project.
Denison’s facilities operate under various operating and environmental permits, licences and approvals that contain conditions that must be met, and Denison’s right to continue operating its facilities is, in a number of instances, dependent upon compliance with such conditions. Failure to meet any such condition could have a material adverse effect on Denison’s financial condition or results of operations.
Although the Company believes its operations are in compliance, in all material respects, with all relevant permits, licences and regulations involving worker health and safety as well as the environment, there can be no assurance regarding continued compliance or ability of the Company to meet stricter environmental regulation, which may also require the expenditure of significant additional financial and managerial resources.
Mining companies are often targets of actions by non-governmental organizations and environmental groups in the countries in which they operate. Such organizations and groups may take actions in the future to disrupt Denison’s operations. They may also apply pressure to local, regional and national government officials to take actions which are adverse to Denison’s operations. Such actions could have an adverse effect on Denison’s ability to produce and sell its products, and on its financial position and results.
Aboriginal Title and Consultation Issues
First Nations and Métis title claims as well as related consultation issues may impact Denison’s ability and that of its joint venture partners to pursue exploration, development and mining at its Saskatchewan properties. Pursuant to historical treaties, First Nations bands in Northern Saskatchewan ceded title to most traditional lands but continue to assert title to the minerals within the lands. Managing relations with the local native bands is a matter of paramount importance to Denison. There may be no assurance however that title claims as well as related consultation issues will not arise on or with respect to the Company’s properties.
Credit Risk
Denison’s sales of uranium and vanadium products and its environmental services expose Denison to the risk of non-payment. Denison manages this risk by monitoring the credit worthiness of its customers and requiring pre-payment or other forms of payment security from customers with an unacceptable level of credit risk. Although Denison seeks to manage its credit risk exposure, there can be no assurance that Denison will be successful, and it is possible that some of Denison’s customers could fail to pay for the uranium or vanadium purchased or the environmental services provided.
Currency Fluctuations
Most of Denison’s revenue is denominated in U.S. dollars; however, its operating costs are incurred in the currencies of the United States, Canada, Mongolia and Zambia. Consequently, changes in the relative value of the different currencies affect Denison’s earnings and cash flows.
Capital Intensive Industry; Uncertainty of Funding
The exploration and development of mineral properties and the ongoing operation of mines requires a substantial amount of capital and may depend on Denison’s ability to obtain financing through joint ventures, debt financing, equity financing or other means. General market conditions, volatile uranium and vanadium markets, a claim against the Company, a significant disruption to the Company’s business or operations or other factors may make it difficult to secure financing necessary for the expansion of mining activities or to take advantage of opportunities for acquisitions. There is no assurance that the Company will be successful in obtaining required financing as and when needed on acceptable terms.
Dependence on Key Personnel and Qualified and Experienced Employees
Denison’s success will largely depend on the efforts and abilities of certain senior officers and key employees. Certain of these individuals have significant experience in the uranium industry. The number of individuals with significant experience in this industry is small. While Denison does not foresee any reason why such officers and key employees will not remain with Denison, if for any reason they do not, Denison could be adversely affected. Denison has not purchased key man life insurance for any of these individuals.
Denison’s success will also depend on the availability of qualified and experienced employees to work in Denison’s operations and Denison’s ability to attract and retain such employees. The number of individuals with relevant mining and operational experience in this industry is small.
Denison Mines Corp. Annual Report 2011 | 27
MANAGEMENT’S DISCUSSION AND ANALYSIS
Year Ended December 31, 2011
Disclosure and Internal Controls
Internal controls over financial reporting are procedures designed to provide reasonable assurance that transactions are properly authorized, assets are safeguarded against unauthorized or improper use, and transactions are properly recorded and reported. Disclosure controls and procedures are designed to ensure that information required to be disclosed by a company in reports filed with securities regulatory agencies is recorded, processed, summarized and reported on a timely basis and is accumulated and communicated to a company’s management, including its chief executive officer and chief financial officer, as appropriate, to allow timely decisions regarding required disclosure. A control system, no matter how well designed and operated, can provide only reasonable, not absolute, assurance with respect to the reliability of reporting, including financial reporting and financial statement preparation.
Potential Influence of KEPCO
As at the date hereof, KEPCO holds indirectly a large shareholding in Denison and is contractually entitled to board representation. Provided KEPCO holds over 15% of Denison’s common shares, it is entitled to nominate two directors for election to the Board at any shareholder meeting, and as long as it holds between 5% and 15% of Denison’s common shares, it will be entitled to appoint one director. KEPCO’s shareholding level gives it significant influence on decisions to be made by shareholders of Denison, and its right to nominate directors may give KEPCO significant influence on decisions made by Denison’s Board. Although KEPCO’s director nominees will be subject to duties under the OBCA to act in the best interests of Denison as a whole, KEPCO’s director nominees are likely to be employees of KEPCO and may give special attention to KEPCO’s interests as an indirect shareholder. The interests of KEPCO as an indirect shareholder of Denison may not always be consistent with the interests of Denison’s other shareholders, including, as a result of, its business relationship with Denison.
The KEPCO strategic relationship agreement also includes provisions that will provide KEPCO with a right of first offer for certain asset sales and the right to be approached to participate in certain potential acquisitions. The right of first offer and participation right of KEPCO may negatively affect Denison’s ability or willingness to entertain certain business opportunities, or the attractiveness of Denison as a potential party for certain business transactions. KEPCO’s large shareholding block may also make Denison less attractive to third parties considering an acquisition of Denison if those third parties are not able to negotiate terms with KEPCO to support such an acquisition.
Conflicts of Interest
Some of the directors of Denison are also directors of other companies that are similarly engaged in the business of acquiring, exploring and developing natural resource properties. Such associations may give rise to conflicts of interest from time to time. In particular, one of the consequences will be that corporate opportunities presented to a director of Denison may be offered to another company or companies with which the director is associated, and may not be presented or made available to Denison. The directors of Denison are required by law to act honestly and in good faith with a view to the best interests of Denison, to disclose any interest which they may have in any project or opportunity of Denison, and to abstain from voting on such matter. Conflicts of interest that arise will be subject to and governed by the procedures prescribed in the Company’s Code of Ethics and by the OBCA.
Reliance on ARC as Operator
As ARC is the operator and majority owner of the McClean Lake and Midwest properties in Saskatchewan, Canada, Denison is and will be, to a certain extent, dependent on ARC for the nature and timing of activities related to these properties and may be unable to direct or control such activities.
Labour Relations
Both the McClean Lake mill and the Midwest properties employ unionized workers who work under collective agreements. ARC, as the operator of both of these projects, is responsible for all dealings with unionized employees. ARC may not be successful in its attempts to renegotiate the collective agreements, which may impact mill and mining operations. Any lengthy work stoppages may have a material adverse impact on the Company’s future cash flows, earnings, results of operations and financial condition.
Indemnities
As part of its reorganization in 2004, DMI acquired from Denison Energy Inc. all of Denison Energy’s mining and environmental services assets and agreed to assume all debts, liabilities and obligations relating to such assets before the date of the reorganization. In addition, DMI agreed to provide certain indemnities in favour of Denison Energy for certain claims and losses relating to matters with respect to Denison Energy’s mining business prior to the date of the arrangement, to breaches by DMI of certain of its agreements, covenants, representations and warranties in the agreements governing such reorganization, and to damages caused by breaches by DMI of its representations and warranties in certain agreements related to such arrangement. Denison cannot predict the outcome or the ultimate impact of any legal or regulatory proceeding against Denison or affecting the business of Denison and cannot predict the potential liabilities associated with the indemnities provided in favour of Denison Energy. Consequently, there can be no assurance that the legal or regulatory proceedings referred herein or any such proceedings that may arise in the future will be resolved without a material adverse effect on the business, financial condition, results of operation or cash flows of Denison.
QUALIFIED PERSON
The disclosure of scientific and technical information regarding Denison’s properties in the MD&A was prepared by or under the supervision of Lawson Forand, P. Geo., the Company’s Exploration Manager Saskatchewan, and Terry Wetz, P.E., the Company’s Director of Project Development, who are Qualified Persons in accordance with the requirements of NI 43-101.
28 | Denison Mines Corp. Annual Report 2011
RESPONSIBILITY FOR FINANCIAL STATEMENTS
The Company’s management is responsible for the integrity and fairness of presentation of these consolidated financial statements. The consolidated financial statements have been prepared by management, in accordance with International Financial Reporting Standards as issued by the International Accounting Standards Board, for review by the Audit Committee and approval by the Board of Directors.
The preparation of financial statements requires the selection of appropriate accounting policies in accordance with International Financial Reporting Standards and the use of estimates and judgments by management to present fairly and consistently the consolidated financial position of the Company. Estimates are necessary when transactions affecting the current period cannot be finalized with certainty until future information becomes available. In making certain material estimates, the Company’s management has relied on the judgment of independent specialists.
The Company’s management has developed and maintains a system of internal accounting controls to ensure, on a reasonable and cost-effective basis, that the financial information is timely reported and is accurate and reliable in all material respects and that the Company’s assets are appropriately accounted for and adequately safeguarded.
The consolidated financial statements have been audited by PricewaterhouseCoopers LLP, our independent auditor. Its report outlines the scope of its examination and expresses its opinions on the consolidated financial statements and internal control over financial reporting.
 |  | |
Ron F. Hochstein | James R. Anderson | |
President and Chief Executive Officer | Executive Vice-President and | |
| Chief Financial Officer | ||
March 8, 2012 | ||
MANAGEMENT’S REPORT ON INTERNAL CONTROL OVER FINANCIAL REPORTING
The Company’s management is responsible for establishing and maintaining adequate internal control over financial reporting. Management conducted an evaluation of the effectiveness of internal control over financial reporting based on theInternal Control –Integrated Frameworkissued by the Committee of Sponsoring Organizations of the Treadway Commission. Based on this evaluation, management concluded that the Company’s internal control over financial reporting was effective as at December 31, 2011.
The effectiveness of the Company’s internal control over financial reporting as at December 31, 2011 has been audited by PricewaterhouseCoopers LLP, our independent auditor, as stated in its report which appears herein.
CHANGES TO INTERNAL CONTROL OVER FINANCIAL REPORTING
There has not been any change in the Company’s internal control over financial reporting that occurred during 2011 that has materially affected, or is reasonably likely to materially affect, the Company’s internal control over financial reporting.
Denison Mines Corp. Annual Report 2011 | 29
INDEPENDENT AUDITOR’S REPORT
To the Shareholders of Denison Mines Corp.
We have completed integrated audits of the consolidated financial statements of Denison Mines Corp. and its subsidiaries for 2011 and 2010 and their internal control over financial reporting as at December 31, 2011. Our opinions, based on our audits, are presented below.
Report on the consolidated financial statements
We have audited the accompanying consolidated financial statements of Denison Mines Corp., which comprise the consolidated statements of financial position as at December 31, 2011, December 31, 2010 and January 1, 2010 and the consolidated statements of income (loss) and comprehensive income (loss), and consolidated statements of changes in equity, and consolidated statements of cash flow for the years ended December 31, 2011 and 2010, and the related notes, which comprise a summary of significant accounting policies and other explanatory information.
Management’s responsibility for the consolidated financial statements
Management is responsible for the preparation and fair presentation of these consolidated financial statements in accordance with International Financial Reporting Standards (IFRS) as issued by the International Accounting Standards Board (IASB) and for such internal control as management determines is necessary to enable the preparation of consolidated financial statements that are free from material misstatement, whether due to fraud or error.
Auditor’s responsibility
Our responsibility is to express an opinion on these consolidated financial statements based on our audits. We conducted our audits in accordance with Canadian generally accepted auditing standards (GAAS) and the standards of the Public Company Accounting Oversight Board (PCAOB) (United States). Those standards require that we plan and perform an audit to obtain reasonable assurance whether the consolidated financial statements are free from material misstatement. Canadian GAAS also require that we comply with ethical requirements.
An audit involves performing procedures to obtain audit evidence, on a test basis, about the amounts and disclosures in the consolidated financial statements. The procedures selected depend on the auditor’s judgment, including the assessment of the risks of material misstatement of the consolidated financial statements, whether due to fraud or error. In making those risk assessments, the auditor considers internal control relevant to the company’s preparation and fair presentation of the consolidated financial statements in order to design audit procedures that are appropriate in the circumstances.
An audit also includes evaluating the appropriateness of accounting policies used and the reasonableness of accounting estimates made by management, as well as evaluating the overall presentation of the consolidated financial statements.
We believe that the audit evidence we have obtained in our audits is sufficient and appropriate to provide a basis for our audit opinion on the consolidated financial statements.
Opinion
In our opinion, the consolidated financial statements present fairly, in all material respects, the financial position of Denison Mines Corp. as at December 31, 2011, December 31, 2010 and January 1, 2010 and its financial performance and its cash flows for the years ended December 31, 2011 and 2010 in accordance with IFRS as issued by the IASB.
Report on internal control over financial reporting
We have also audited Denison Mines Corp.’s internal control over financial reporting as at December 31, 2011, based on criteria established in Internal Control – Integrated Framework, issued by the Committee of Sponsoring Organizations of the Treadway Commission (COSO).
Management’s responsibility for internal control over financial reporting
Management is responsible for maintaining effective internal control over financial reporting and for its assessment of the effectiveness of internal control over financial reporting, included in the accompanying Management’s Report on Internal Control over Financial Reporting.
Auditor’s responsibility
Our responsibility is to express an opinion on the Company’s internal control over financial reporting based on our audit. We conducted our audit of internal control over financial reporting in accordance with the standards of the PCAOB (United States). Those standards require that we plan and perform the audit to obtain reasonable assurance about whether effective internal control over financial reporting was maintained in all material respects.
An audit of internal control over financial reporting includes obtaining an understanding of internal control over financial reporting, assessing the risk that a material weakness exists, testing and evaluating the design and operating effectiveness of internal control based on the assessed risk, and performing such other procedures as we consider necessary in the circumstances.
We believe that our audit provides a reasonable basis for our opinion on the Company’s internal control over financial reporting.
30 | Denison Mines Corp. Annual Report 2011
INDEPENDENT AUDITOR’S REPORT
Definition of internal control over financial reporting
A company’s internal control over financial reporting is a process designed to provide reasonable assurance regarding the reliability of financial reporting and the preparation of financial statements for external purposes in accordance with Canadian generally accepted accounting principles (GAAP). A company’s internal control over financial reporting includes those policies and procedures that (i) pertain to the maintenance of records that, in reasonable detail, accurately and fairly reflect the transactions and dispositions of the assets of the company; (ii) provide reasonable assurance that transactions are recorded as necessary to permit preparation of financial statements in accordance with Canadian GAAP, and that receipts and expenditures of the company are being made only in accordance with authorizations of management and directors of the company; and (iii) provide reasonable assurance regarding prevention or timely detection of unauthorized acquisition, use, or disposition of the company’s assets that could have a material effect on the financial statements.
Inherent limitations
Because of its inherent limitations, internal control over financial reporting may not prevent or detect misstatements. Also, projections of any evaluation of effectiveness to future periods are subject to the risk that controls may become inadequate because of changes in conditions or that the degree of compliance with the policies or procedures may deteriorate.
Opinion
In our opinion, Denison Mines Corp. and its subsidiaries maintained, in all material respects, effective internal control over financial reporting as at December 31, 2011 based on criteria established in Internal Control – Integrated Framework issued by COSO.

Chartered Accountants, Licensed Public Accountants
Toronto, Ontario
March 8, 2012
Denison Mines Corp. Annual Report 2011 | 31
CONSOLIDATED STATEMENTS OF FINANCIAL POSITION
(Expressed in thousands of U.S. dollars except for per share amounts)
| At December 31 | At December 31 | At January 1 | ||||||||||
| 2011 | 2010 | 2010 | ||||||||||
ASSETS | ||||||||||||
Current | ||||||||||||
Cash and cash equivalents (note 7) | $ | 53,515 | $ | 97,554 | $ | 19,804 | ||||||
Trade and other receivables (note 8) | 12,652 | 20,236 | 13,773 | |||||||||
Inventories (note 9) | 36,106 | 29,133 | 52,216 | |||||||||
Prepaid expenses and other | 2,534 | 1,910 | 1,604 | |||||||||
|
|
|
|
|
| |||||||
| 104,807 | 148,833 | 87,397 | ||||||||||
Non-Current | ||||||||||||
Inventories – ore in stockpiles (note 9) | 2,156 | 2,204 | 1,530 | |||||||||
Investments (note 10) | 522 | 2,955 | 10,605 | |||||||||
Prepaid expenses and other | — | 107 | 287 | |||||||||
Restricted cash and investments (note 11) | 26,793 | 22,946 | 21,656 | |||||||||
Property, plant and equipment (note 12) | 367,370 | 342,164 | 321,395 | |||||||||
Intangibles (note 13) | 2,838 | 3,794 | 4,436 | |||||||||
|
|
|
|
|
| |||||||
Total assets | $ | 504,486 | $ | 523,003 | $ | 447,306 | ||||||
|
|
|
|
|
| |||||||
LIABILITIES | ||||||||||||
Current | ||||||||||||
Accounts payable and accrued liabilities | $ | 9,272 | $ | 13,753 | $ | 9,726 | ||||||
Current portion of long-term liabilities: | ||||||||||||
Deferred revenue | 893 | — | — | |||||||||
Post-employment benefits (note 15) | 393 | 402 | 380 | |||||||||
Reclamation obligations (note 16) | 622 | 641 | 752 | |||||||||
Debt obligations (note 17) | 111 | 200 | 869 | |||||||||
Other liabilities (note 18) | — | — | 313 | |||||||||
|
|
|
|
|
| |||||||
| 11,291 | 14,996 | 12,040 | ||||||||||
Non-Current | ||||||||||||
Deferred revenue | — | 3,339 | 3,187 | |||||||||
Post-employment benefits (note 15) | 3,498 | 3,617 | 3,426 | |||||||||
Reclamation obligations (note 16) | 20,954 | 16,924 | 17,154 | |||||||||
Debt obligations (note 17) | 110 | 205 | 195 | |||||||||
Other liabilities (note 18) | 1,082 | 1,105 | 1,051 | |||||||||
Deferred income tax liability (note 19) | 12,747 | 13,408 | 14,062 | |||||||||
|
|
|
|
|
| |||||||
Total liabilities | 49,682 | 53,594 | 51,115 | |||||||||
|
|
|
|
|
| |||||||
EQUITY | ||||||||||||
Share capital (note 20) | 974,312 | 911,681 | 850,336 | |||||||||
Share purchase warrants (note 21) | — | 5,830 | 5,830 | |||||||||
Contributed surplus (note 22) | 49,171 | 41,658 | 39,922 | |||||||||
Deficit | (579,696 | ) | (508,827 | ) | (503,481 | ) | ||||||
Accumulated other comprehensive income (note 23) | 11,017 | 19,067 | 3,584 | |||||||||
|
|
|
|
|
| |||||||
Total equity | 454,804 | 469,409 | 396,191 | |||||||||
|
|
|
|
|
| |||||||
Total liabilities and equity | $ | 504,486 | $ | 523,003 | $ | 447,306 | ||||||
|
|
|
|
|
| |||||||
Issued and outstanding common shares (note 20) | 384,660,915 | 366,200,665 | 339,720,415 | |||||||||
|
|
|
|
|
| |||||||
| Commitments and contingencies (note 28) | ||||||||||||
The accompanying notes are an integral part of the consolidated financial statements
On behalf of the Board of Directors:
|  | |||||
Ron F. Hochstein | Catherine J.G. Stefan | |||||
Director | Director | |||||
32 | Denison Mines Corp. Annual Report 2011
CONSOLIDATED STATEMENTS OF INCOME (LOSS) AND COMPREHENSIVE INCOME (LOSS)
(Expressed in thousands of U.S. dollars except for share and per share amounts)
| Year Ended | ||||||||
| December 31 2011 | December 31 2010 | |||||||
REVENUES(note 25) | $ | 96,800 | $ | 128,320 | ||||
|
|
|
| |||||
EXPENSES | ||||||||
Operating expenses (note 24) | (103,160 | ) | (111,768 | ) | ||||
Mineral property exploration | (13,828 | ) | (7,619 | ) | ||||
General and administrative (note 22) | (17,538 | ) | (16,143 | ) | ||||
Goodwill impairment (note 14) | (32,625 | ) | — | |||||
Other income (expense) (note 24) | (1,519 | ) | 1,930 | |||||
|
|
|
| |||||
| (168,670 | ) | (133,600 | ) | |||||
|
|
|
| |||||
Loss before finance charges | (71,870 | ) | (5,280 | ) | ||||
Finance income (expense) (note 24) | (38 | ) | (942 | ) | ||||
|
|
|
| |||||
Loss before taxes | (71,908 | ) | (6,222 | ) | ||||
Income tax recovery (expense) (note 19): | ||||||||
Current | (57 | ) | (355 | ) | ||||
Deferred | 1,096 | 1,231 | ||||||
|
|
|
| |||||
Net loss for the period | $ | (70,869 | ) | $ | (5,346 | ) | ||
|
|
|
| |||||
Comprehensive income (loss): | ||||||||
Unrealized gain (loss) on investments-net of tax | (1,413 | ) | (2,490 | ) | ||||
Foreign currency translation change | (6,637 | ) | 17,973 | |||||
|
|
|
| |||||
Comprehensive income (loss) for the period | $ | (78,919 | ) | $ | 10,137 | |||
|
|
|
| |||||
Net loss per share: | ||||||||
Basic | $ | (0.19 | ) | $ | (0.02 | ) | ||
Diluted | $ | (0.19 | ) | $ | (0.02 | ) | ||
|
|
|
| |||||
Weighted-average number of shares outstanding (in thousands): | ||||||||
Basic | 380,838 | 340,826 | ||||||
Diluted | 381,108 | 340,835 | ||||||
|
|
|
| |||||
The accompanying notes are an integral part of the consolidated financial statements
Denison Mines Corp. Annual Report 2011 | 33
CONSOLIDATED STATEMENTS OF CHANGES IN EQUITY
(Expressed in thousands of U.S. dollars)
| Year Ended | ||||||||
| December 31 2011 | December 31 2010 | |||||||
Share capital | ||||||||
Balance–beginning of period | 911,681 | 850,336 | ||||||
Share issues – net of issue costs | 62,114 | 61,091 | ||||||
Employee share option exercises – cash | 328 | 159 | ||||||
Employee share option exercises – non-cash | 189 | 95 | ||||||
|
|
|
| |||||
Balance – end of period | 974,312 | 911,681 | ||||||
|
|
|
| |||||
Share purchase warrants | ||||||||
Balance – beginning of period | 5,830 | 5,830 | ||||||
Warrant expiries | (5,830 | ) | — | |||||
|
|
|
| |||||
Balance – end of period | — | 5,830 | ||||||
|
|
|
| |||||
Contributed surplus | ||||||||
Balance – beginning of period | 41,658 | 39,922 | ||||||
Stock-based compensation expense | 3,333 | 1,831 | ||||||
Employee share option exercises – non-cash | (189 | ) | (95 | ) | ||||
Warrant expiries | 5,830 | — | ||||||
Warrant expiries – tax effect | (1,461 | ) | — | |||||
|
|
|
| |||||
Balance – end of period | 49,171 | 41,658 | ||||||
|
|
|
| |||||
Deficit | ||||||||
Balance – beginning of period | (508,827 | ) | (503,481 | ) | ||||
Net loss | (70,869 | ) | (5,346 | ) | ||||
|
|
|
| |||||
Balance – end of period | (579,696 | ) | (508,827 | ) | ||||
|
|
|
| |||||
Accumulated other comprehensive income | ||||||||
Balance – beginning of period | 19,067 | 3,584 | ||||||
Unrealized gain (loss) on investments | (1,413 | ) | (2,490 | ) | ||||
Foreign currency translation change | (6,637 | ) | 17,973 | |||||
|
|
|
| |||||
Balance – end of period | 11,017 | 19,067 | ||||||
|
|
|
| |||||
Total Equity | ||||||||
Balance – beginning of period | $ | 469,409 | $ | 396,191 | ||||
|
|
|
| |||||
Balance – end of period | $ | 454,804 | $ | 469,409 | ||||
|
|
|
| |||||
The accompanying notes are an integral part of the consolidated financial statements
34 | Denison Mines Corp. Annual Report 2011
CONSOLIDATED STATEMENTS OF CASH FLOW
(Expressed in thousands of U.S. dollars)
| Year Ended | ||||||||
| December 31 2011 | December 31 2010 | |||||||
CASH PROVIDED BY (USED IN): | ||||||||
OPERATING ACTIVITIES | ||||||||
Net loss for the period | $ | (70,869 | ) | $ | (5,346 | ) | ||
Items not affecting cash: | ||||||||
Depletion, depreciation, amortization and accretion | 39,979 | 49,067 | ||||||
Investments impairment | 896 | 181 | ||||||
Goodwill impairment | 32,625 | — | ||||||
Stock-based compensation | 3,333 | 1,831 | ||||||
Losses (gains) on asset disposals | 191 | (3,431 | ) | |||||
Losses (gains) on restricted investments | (401 | ) | (207 | ) | ||||
Non-cash inventory adjustments | 373 | (12,636 | ) | |||||
Deferred income tax expense (recovery) | (1,096 | ) | (1,231 | ) | ||||
Foreign exchange | 1,390 | 11,926 | ||||||
Change in non-cash working capital items (note 24): | (26,404 | ) | (4,696 | ) | ||||
|
|
|
| |||||
Net cash provided by (used in) operating activities | (19,983 | ) | 35,458 | |||||
|
|
|
| |||||
INVESTING ACTIVITIES | ||||||||
Acquisition of a business, net of cash and cash equivalents acquired (note 6) | (59,704 | ) | — | |||||
Decrease (increase) in notes receivable | 803 | (880 | ) | |||||
Purchase of investments | — | (17 | ) | |||||
Proceeds on sale of investments | — | 8,118 | ||||||
Expenditures on property, plant and equipment | (24,274 | ) | (27,217 | ) | ||||
Proceeds on sale of property, plant and equipment | 780 | 1,566 | ||||||
Decrease (increase) in restricted cash and investments | (3,349 | ) | (949 | ) | ||||
|
|
|
| |||||
Net cash provided by (used in) investing activities | (85,744 | ) | (19,379 | ) | ||||
|
|
|
| |||||
FINANCING ACTIVITIES | ||||||||
Increase (decrease) in debt obligations | (181 | ) | (685 | ) | ||||
Issuance of common shares for: | ||||||||
New share issues | 62,114 | 61,091 | ||||||
Exercise of stock options | 328 | 159 | ||||||
|
|
|
| |||||
Net cash provided by (used in) financing activities | 62,261 | 60,565 | ||||||
|
|
|
| |||||
Increase (decrease) in cash and cash equivalents | (43,466 | ) | 76,644 | |||||
Foreign exchange effect on cash and cash equivalents | (573 | ) | 1,106 | |||||
Cash and cash equivalents, beginning of period | 97,554 | 19,804 | ||||||
|
|
|
| |||||
Cash and cash equivalents, end of period | $ | 53,515 | $ | 97,554 | ||||
|
|
|
| |||||
Supplemental cash flow disclosure: | ||||||||
Interest paid | 82 | 27 | ||||||
Income taxes paid (recovered) | $ | 80 | $ | (1,363 | ) | |||
|
|
|
| |||||
The accompanying notes are an integral part of the consolidated financial statements
Denison Mines Corp. Annual Report 2011 | 35
NOTES TO THE CONSOLIDATED FINANCIAL STATEMENTS
For the years ended December 31, 2011 and 2010
(Expressed in U.S. dollars, except for shares and per share amounts)
| 1. | NATURE OF OPERATIONS |
Denison Mines Corp. and its subsidiary companies and joint ventures (collectively, the “Company”) are engaged in uranium mining and related activities, including acquisition, exploration and development of uranium bearing properties, extraction, processing and selling of uranium. The environmental services division of the Company provides mine decommissioning and decommissioned site monitoring services for third parties.
The Company has a 100% interest in the White Mesa mill located in Utah, United States and a 22.5% interest in the McClean Lake mill located in the Athabasca Basin of Saskatchewan, Canada. The Company has interests in a number of nearby mines at both locations, as well as interests in development and exploration projects located in Canada, the United States, Mongolia and Zambia, some of which are operated through joint ventures and joint arrangements. Uranium, the Company’s primary product, is produced in the form of uranium oxide concentrates (“U3O8”) and sold to various customers around the world for further processing. Vanadium, a co-product of some of the Company’s mines is also produced and is in the form of vanadium pentoxide (“V2O5”). The Company is also in the business of processing uranium bearing waste materials, referred to as “alternate feed materials”.
Denison Mines Inc. (“DMI”), a subsidiary of DMC, is the manager of Uranium Participation Corporation (“UPC”), a publicly-listed investment holding company formed to invest substantially all of its assets in U3O8 and uranium hexafluoride (“UF6”). The Company has no ownership interest in UPC but receives various fees for management services and commissions from the purchase and sale of U3O8 and UF6 by UPC.
Denison Mines Corp. (“DMC”) is incorporated under the Business Corporations Act (Ontario) (“OBCA”) and domiciled in Canada. The address of its registered head office is 595 Bay Street, Suite 402, Toronto, Ontario, Canada, M5G 2C2.
References to “2011” and “2010” refer to the year ended December 31, 2011 and the year ended December 31, 2010, respectively.
| 2. | BASIS OF PRESENTATION AND ADOPTION OF IFRS |
The Company prepares its financial statements in accordance with Canadian generally accepted accounting principles as defined in the Handbook of the Canadian Institute of Chartered Accountants (“CICA Handbook”). In 2010, the CICA Handbook was revised to incorporate International Financial Reporting Standards (“IFRS”) as issued by the International Accounting Standards Board (“IASB”) and to require publicly accountable enterprises to apply these standards effective for years beginning on or after January 1, 2011. Accordingly, these are the Company’s first annual consolidated financial statements prepared in accordance with IFRS as issued by the IASB. In these financial statements, the term “CGAAP” refers to Canadian GAAP before the adoption of IFRS.
The consolidated financial statements have been prepared in compliance with IFRS. Subject to certain transition elections and exceptions noted in note 5, the Company has consistently applied the accounting policies used in the preparation of its opening IFRS statement of financial position at January 1, 2010 throughout all periods presented, as if these policies had always been in effect. Note 5 discloses the impact of the transition to IFRS on the Company’s reported financial position, financial performance and cash flows, including the nature and effect of significant changes in accounting policies from those used in the Company’s consolidated financial statements for the year ended December 31, 2010 prepared under CGAAP
The Company’s presentation currency is U.S. dollars.
These financial statements were approved by the board of directors for issue on March 8, 2012.
| 3. | SIGNIFICANT ACCOUNTING POLICIES |
The significant accounting policies used in the preparation of these consolidated financial statements are described below:
(a) Consolidation
The financial statements of the Company consolidate the accounts of DMC and its subsidiaries. Subsidiaries are those entities which DMC controls by having the power to govern the financial and operating policies. The existence and effect of potential voting rights that are currently exercisable or convertible are considered when assessing whether DMC controls another entity. Subsidiaries are fully consolidated from the date on which control is obtained by DMC and are de-consolidated from the date that control ceases. Intercompany transactions, balances and unrealized gains and losses from intercompany transactions are eliminated.
Non-controlling interests represent equity interests in subsidiaries owned by outside parties. The share of net assets of subsidiaries attributable to non-controlling interests is presented as a component of equity. Their share of net income and comprehensive income is recognized directly in equity. Changes in the parent company’s ownership interest in subsidiaries that do not result in a loss of control are accounted for as equity transactions.
The Company has various interests in development and exploration projects which are held through option or joint agreements. These have been classified as joint ownership interests under IFRS. These joint ownership interests have been accounted for using the undivided interest method.
36 | Denison Mines Corp. Annual Report 2011
NOTES TO THE CONSOLIDATED FINANCIAL STATEMENTS
(b) Foreign currency translation
| (i) | Functional and presentation currency |
Items included in the financial statements of each entity in the DMC group are measured using the currency of the primary economic environment in which the entity operates (“the functional currency”). Primary and secondary indicators are used to determine the functional currency (primary indicators have priority over secondary indicators). Primary indicators include the currency that mainly influences sales prices and the currency that mainly influences labour, material and other costs. Secondary indicators include the currency in which funds from financing activities are generated and the currency in which receipts from operating activities are usually retained. For our Canadian, U.S., Zambian and Mongolian entities, the local currency has been determined to be the functional currency.
The consolidated financial statements are presented in U.S. dollars, unless otherwise stated.
The financial statements of entities that have a functional currency different from the presentation currency of DMC (“foreign operations”) are translated into U.S. dollars as follows: assets and liabilities – at the closing rate at the date of the statement of financial position, and income and expenses – at the average rate of the period (as this is considered a reasonable approximation to actual rates). All resulting changes are recognized in other comprehensive incomes as cumulative translation adjustments.
When an entity disposes of its entire interest in a foreign operation, or loses control, joint control, or significant influence over a foreign operation, the foreign currency gains or losses accumulated in other comprehensive income related to the foreign operation are recognized in profit or loss. If an entity disposes of part of an interest in another entity which remains a subsidiary, a proportionate amount of foreign currency gains or losses accumulated in other comprehensive income related to the subsidiary is reallocated between controlling and non-controlling interests.
| (ii) | Transactions and balances |
Foreign currency transactions are translated into an entity’s functional currency using the exchange rates prevailing at the dates of the transactions. Generally, foreign exchange gains and losses resulting from the settlement of foreign currency transactions and from the translation at year-end exchange rates of monetary assets and liabilities denominated in currencies other than an operation’s functional currency are recognized in the statement of income.
(c) Business combinations
A business combination is defined as an acquisition of assets and liabilities that constitute a business. A business consists of inputs, including non-current assets, and processes, including operational processes, that when applied to those inputs, have the ability to create outputs that provide a return to the Company and its shareholders. A business also includes those assets and liabilities that do not necessarily have all the inputs and processes required to produce outputs, but can be integrated with the inputs and processes of the Company to create outputs.
Business combinations are accounted for using the acquisition method whereby identifiable assets acquired and liabilities assumed, including contingent liabilities, are recorded at 100% of their acquisition-date fair values. The acquisition date is the date the Company acquires control over the acquiree. The Company considers all relevant facts and circumstances in determining the acquisition date.
Acquisition related costs, other than costs to issue debt or equity securities of the acquirer, including investment banking fees, legal fees, accounting fees, valuation fees and other professional or consulting fees are expensed as incurred.
If the initial accounting for a business combination is incomplete by the end of the reporting period in which the combination occurs, the Company reports in its financial statements provisional amounts for the items for which the accounting is incomplete. During the measurement period, the Company will retrospectively adjust the provisional amounts recognized at the acquisition date to reflect new information obtained about facts and circumstances that existed as of the acquisition date and, if known, would have affected the measurement of the amounts recognized as of that date. The maximum length of time for the measurement period is one year from the acquisition date.
(d) Cash and cash equivalents
Cash and cash equivalents include cash on hand, deposits held with banks, and other short-term highly liquid investments with original maturities of three months or less which are subject to an insignificant risk of changes in value.
(e) Financial instruments
Financial assets and financial liabilities are recognized when the Company becomes a party to the contractual provisions of the financial instrument. Financial assets are derecognized when the rights to receive cash flows from the assets have expired or have been transferred and the Company has transferred substantially all risks and rewards of ownership. Financial liabilities are derecognized when the obligation specified in the contract is discharged, cancelled or expires.
Denison Mines Corp. Annual Report 2011 | 37
NOTES TO THE CONSOLIDATED FINANCIAL STATEMENTS
At initial recognition, the Company classifies its financial instruments in the following categories:
| (i) | Financial assets and liabilities at fair value through profit or loss (“FVPL”) |
A financial asset or liability is classified in this category if acquired principally for the purpose of selling or repurchasing in the short-term. Financial instruments in this category are recognized initially and subsequently at fair value. Transaction costs are expensed in the consolidated statement of income. Gains and losses arising from changes in fair value are presented in the consolidated statement of income in the period in which they arise.
| (ii) | Available-for-sale investments |
Available-for-sale investments are recognized initially at fair value plus transaction costs and are subsequently carried at fair value. Gains or losses arising from re-measurement are recognized in other comprehensive income. When an available-for-sale investment is sold or impaired, the accumulated gains or losses are moved from accumulated other comprehensive income to the statement of income.
| (iii) | Held-to-maturity investments |
Held-to-maturity investments are non-derivative financial assets with fixed or determinable payments and fixed maturities that are intended to be held to maturity. Held-to-maturity investments are initially recognized at fair value plus transaction costs and subsequently measured at amortized cost using the effective interest method less a provision for impairment.
| (iv) | Loans and receivables |
Loans and receivables are non-derivative financial assets with fixed or determinable payments that are not quoted in an active market. Loans and receivables are initially recognized at the amount expected to be received, less a discount (when material) to reduce the loans and receivables to fair value. Subsequently, loans and receivables are measured at amortized cost using the effective interest method less a provision for impairment.
| (v) | Financial liabilities at amortized cost |
Financial liabilities are initially recognized at the amount required to be paid, less a discount (when material) to reduce the financial liabilities to fair value. Subsequently, financial liabilities are measured at amortized cost using the effective interest method.
The Company has designated its financial assets and liabilities as follows:
| • | A portion of “Restricted cash and investments” are classified as FVPL and any period change in fair value is recorded through the results from operations while the remaining amount is classified as held-to-maturity investments. |
| • | “Cash and cash equivalents” and “Trade and other receivables” are classified as loans and receivables and are measured at amortized cost using the effective interest rate method. Interest income is recorded in net income, as applicable. |
| • | The Company’s current holdings of equity instruments in “Investments” are classified as available-for-sale and any period change in fair value is recorded through other comprehensive income. When the investment’s value becomes impaired, the loss is recognized in the results of operations in the period of impairment. |
| • | “Accounts payable and accrued liabilities” and “Debt obligations” are classified as other financial liabilities and are measured at amortized cost using the effective interest rate method. Interest expense is recorded in other income, as applicable. |
(f) Impairment of financial assets
At each reporting date, the Company assesses whether there is objective evidence that a financial asset (other than a financial asset classified as fair value through profit and loss) is impaired. Objective evidence of an impairment loss includes: i) significant financial difficulty of the obligor; ii) delinquencies in interest or principal payments; iii) increased probability that the borrower will enter bankruptcy or other financial reorganization; and iv) in the case of equity securities, a significant or prolonged decline in the fair value of the security below its cost.
If such evidence exists, the Company recognizes an impairment loss, as follows:
| (i) | Financial assets carried at amortized cost: The loss is the difference between the amortized cost of the loan or receivable and the present value of the estimated future cash flows, discounted using the instrument’s original effective interest rate. The carrying amount of the asset is reduced by this amount either directly or indirectly through the use of an allowance account. |
| (ii) | Available-for-sale financial assets: The impairment loss is the difference between the original cost of the asset and its fair value at the measurement date, less any impairment losses previously recognized in the statement of income. This amount represents the cumulative loss in accumulated other comprehensive income that is reclassified to net income. |
(g) Inventories
Expenditures, including depreciation, depletion and amortization of production assets, incurred in the mining and processing activities that will result in the future concentrate production are deferred and accumulated as ore in stockpiles and in-process and concentrate inventories. These amounts are carried at the lower of average costs or net realizable value (“NRV”). NRV is the difference between the estimated future concentrate price (net of selling costs) and estimated costs to complete production into a saleable form.
38 | Denison Mines Corp. Annual Report 2011
NOTES TO THE CONSOLIDATED FINANCIAL STATEMENTS
Stockpiles are comprised of coarse ore that has been extracted from the mine and is available for further processing. Mining production costs are added to the stockpile as incurred and removed from the stockpile based upon the average cost per ton or tonne of ore produced from mines considered to be in commercial production. The current portion of ore in stockpiles represents the amount expected to be processed in the next twelve months.
In-process and concentrate inventories include the cost of the ore removed from the stockpile, a pro-rata share of the amortization of the associated mineral property, as well as production costs incurred to process the ore into a saleable product. Processing costs typically include labour, chemical reagents and directly attributable mill overhead expenditures. Items are valued according to the first-in first-out method (FIFO) or at weighted average cost, depending on the type of inventory or work-in-process.
Materials and other supplies held for use in the production of inventories are carried at average cost and are not written down below that cost if the finished products in which they will be incorporated are expected to be sold at or above cost. However, when a decline in the price of concentrates indicates that the cost of the finished products exceeds net realizable value, the materials are written down to net realizable value. In such circumstances, the replacement cost of the materials may be the best available measure of their net realizable value.
(h) Property, plant and equipment
Property, plant and equipment are recorded at acquisition or production cost and carried net of depreciation and impairments. Cost includes expenditures that are directly attributable to the acquisition of the asset. Subsequent costs are included in the asset’s carrying amount or recognized as a separate asset, as appropriate, only when it is probable that future economic benefits associated with the item will flow to the Company and the cost can be measured reliably. The carrying amount of a replaced asset is derecognized when replaced. Repairs and maintenance costs are charged to the statement of income during the period in which they are incurred.
Depreciation is calculated on a straight line or unit of production basis as appropriate. Where a straight line methodology is used, the assets are depreciated to their estimated residual value over an estimated useful life which ranges from three to twenty years depending upon the asset type. Where a unit of production methodology is used, the assets are depreciated to their estimated residual value over the useful life defined by management’s best estimate of recoverable reserves and resources in the current mine plan. When assets are retired or sold, the resulting gains or losses are reflected in current earnings as a component of other income or expense. The Company allocates the amount initially recognized in respect of an item of property, plant and equipment to its significant parts and depreciates separately each such part. Residual values, method of depreciation and useful lives of the assets are reviewed at least annually and adjusted if appropriate.
Where straight line depreciation is utilized, the range of useful lives for various asset classes is generally as follows:
• Buildings | 15-20 years | |||
| • Production machinery and equipment | 5–7 years | |||
• Other | 3–5 years |
(i) Mineral property acquisition, exploration and development costs
Costs relating to the acquisition of acquired mineral rights and acquired exploration rights are capitalized.
Exploration and evaluation expenditures are expensed as incurred on mineral properties not sufficiently advanced. At the point in time that a mineral property is considered to be sufficiently advanced, it is classified as a development mineral property and all further expenditures for the current year and subsequent years are capitalized as incurred. These costs will include costs of maintaining the site until commercial production, costs to initially delineate the ore body, costs for shaft sinking and access, lateral development, drift development and infrastructure development. Such costs represent the net expenditures incurred and capitalized as at the balance sheet date and do not necessarily reflect present or future values.
Once a development mineral property goes into commercial production, the property is classified as “Producing” and the accumulated costs are amortized over the estimated recoverable resources in the current mine plan using a unit of production basis. Commercial production occurs when a property is substantially complete and ready for its intended use.
(j) Intangible assets
| (i) | Identifiable intangible assets |
The Company’s identifiable intangible assets are stated at cost less accumulated amortization. These assets are capitalized and amortized on a straight line basis in the statement of income over the period of their expected useful lives. The useful lives of the assets are reviewed at least annually and adjusted if appropriate.
| (ii) | Goodwill |
Goodwill represents the excess of the cost of an acquisition over the fair value of the Company’s share of the identifiable net assets of the acquired subsidiary at the date of acquisition. Goodwill is carried at cost less accumulated impairment losses. Impairment losses are recognized in the statement of income when recognized. Goodwill is allocated to each cash generating unit (“CGU”) or group of CGUs that are expected to benefit from the related business combination. Gains and losses on the disposal of an entity include the carrying amount of goodwill relating to the entity sold.
Denison Mines Corp. Annual Report 2011 | 39
NOTES TO THE CONSOLIDATED FINANCIAL STATEMENTS
(k) Impairment of non-financial assets
Property, plant and equipment and intangible assets are tested for impairment when events or changes in circumstances indicate that the carrying amount may not be recoverable. For the purpose of measuring recoverable amounts, assets are grouped at the lowest levels for which there are separately identifiable cash flows or CGUs. The recoverable amount is the higher of an asset’s fair value less costs to sell and value in use (being the present value of the expected future cash flows of the relevant asset or CGU, as determined by management). An impairment loss is recognized for the amount by which the CGU’s carrying amount exceeds its recoverable amount.
Goodwill is reviewed for impairment annually or at any time if an indicator of impairment exists.
(l) Employee benefits
| (i) | Post-employment benefit obligations |
The Company assumed the obligation of a predecessor company to provide life insurance, supplemental health care and dental benefits, excluding pensions, to its former Canadian employees who retired from active service prior to 1997. The estimated cost of providing these benefits was actuarially determined using the projected benefits method and is recorded on the balance sheet at its estimated present value. The interest cost on this unfunded liability is being accreted over the remaining lives of this retiree group. Unamortized experience gains and losses are being amortized on a straight line basis over the average life expectancy remaining of this retiree group.
| (ii) | Stock-based compensation |
The Company uses a fair value-based method of accounting for stock options to employees, including directors, and to non-employees. The fair value is determined using the Black-Scholes option pricing model on the date of the grant. The cost is recognized on a straight line graded method basis, adjusted for expected forfeitures, over the applicable vesting period as an increase in stock-based compensation expense and the contributed surplus account. When such stock options are exercised, the proceeds received by the Company, together with the respective amount from contributed surplus, are credited to share capital.
| (iii) | Termination benefits |
The Company recognizes termination benefits when it is demonstrably committed to either terminating the employment of current employees according to a detailed formal plan without possibility of withdrawal, or providing benefits as a result of an offer made to encourage voluntary termination. Benefits falling due more than twelve months after the end of the reporting period are discounted to their present value.
(m) Reclamation provisions
Reclamation provisions, any legal and constructive obligation related to the retirement of tangible long-lived assets, are recognized when such obligations are incurred, if a reasonable estimate of the value can be determined. These obligations are measured initially at the present value of expected cash flows using a pre-tax discount rate reflecting risks specific to the liability and the resulting costs are capitalized and added to the carrying value of the related assets. In subsequent periods, the liability is adjusted for the accretion of the discount and the expense is recorded in the income statement. Changes in the amount or timing of the underlying future cash flows or changes in the discount rate are immediately recognized as an increase or decrease in the carrying amounts of the related assets and liability. These costs are amortized to the results of operations over the life of the asset. Reductions in the amount of the liability are first applied against the amount of the net reclamation asset on the books with any excess value being recorded in the statement of operations.
The Company’s activities are subject to numerous governmental laws and regulations. Estimates of future reclamation liabilities for asset decommissioning and site restoration are recognized in the period when such liabilities are incurred. These estimates are updated on a periodic basis and are subject to changing laws, regulatory requirements, changing technology and other factors which will be recognized when appropriate. Liabilities related to site restoration include long-term treatment and monitoring costs and incorporate total expected costs net of recoveries. Expenditures incurred to dismantle facilities, restore and monitor closed resource properties are charged against the related reclamation and remediation liability.
(n) Provisions
Provisions for restructuring costs and legal claims, where applicable, are recognized in liabilities when the Company has a present legal or constructive obligation as a result of past events, it is probable that an outflow of resources will be required to settle the obligation, and the amount can be reliably estimated. Provisions are measured at management’s best estimate of the expenditure required to settle the obligation at the end of the reporting period, and are discounted to present value where the effect is material. The Company performs evaluations to identify onerous contracts and, where applicable, records provisions for such contracts.
(o) Current and deferred income tax
Income taxes are accounted for using the liability method of accounting for deferred income taxes. Under this method, the tax currently payable is based on taxable income for the period. Taxable income differs from income as reported in the consolidated statement of income (loss) because it excludes items of income or expense that are taxable or deductible in other periods and it further excludes items that are never taxable or deductible. The Company’s liability for current tax is calculated using tax rates that have been enacted or substantively enacted by the balance sheet date.
40 | Denison Mines Corp. Annual Report 2011
NOTES TO THE CONSOLIDATED FINANCIAL STATEMENTS
Deferred income tax assets and liabilities are recognized based on temporary differences between the financial statement carrying values of the existing assets and liabilities and their respective income tax bases used in the computation of taxable income. Deferred tax liabilities are generally recognized for all taxable temporary differences and deferred tax assets are recognized to the extent that it is probable that taxable income will be available against which deductible temporary differences can be utilized. Such assets and liabilities are not recognized if the temporary difference arises from goodwill or from the initial recognition (other than in a business combination) of other assets and liabilities in a transaction that affects neither the taxable income nor the accounting income. Deferred tax liabilities are recognized for taxable temporary differences arising on investments in subsidiaries and investments, and interests in joint ventures, except where the Company is able to control the reversal of the temporary differences and it is probable that the temporary differences will not reverse in the forseeable future. Deferred tax assets are recognized to the extent that taxable income will be available against which the deductible temporary differences can be utilized. The carrying amount of deferred tax assets is reviewed at each balance sheet date and reduced to the extent that it is no longer probable that sufficient taxable earnings will be available to allow all or part of the asset to be recovered.
Deferred tax is calculated at the tax rates that are expected to apply in the period when the liability is settled or the asset realized, based on tax rates and tax laws that have been enacted or substantively enacted by the balance sheet date. Deferred tax is charged or credited to income, except when it relates to items charged or credited directly to equity, in which case the deferred tax is also dealt with in equity.
Income tax assets and liabilities are offset when there is a legally enforceable right to offset the assets and liabilities and when they relate to income taxes levied by the same tax authority on either the same taxable entity or different taxable entities where there is an intention to settle the balance on a net basis.
(p) Flow-through common shares
The Company’s Canadian exploration activities have been financed in part through the issuance of flow-through common shares whereby the tax benefits of the eligible exploration expenditures incurred under this arrangement are renounced to the subscribers. The proceeds from issuing flow-through shares are allocated between the offering of shares and the sale of tax benefits. The allocation is based on the difference (“premium”) between the quoted price of the Company’s existing shares and the amount the investor pays for the actual flow-through shares. A liability is recognized for the premium, and is extinguished when the tax effect of the temporary differences, resulting from the renunciation, is recorded – with the difference between the liability and the value of the tax assets renounced being recorded as a deferred tax expense. The tax effect of the renunciation is recorded at the time the Company makes the renunciation – which may differ from the effective date of renunciation. If the flow-through shares are not issued at a premium, a liability is not established, and on renunciation the full value of the tax assets renounced is recorded as a deferred tax expense.
(q) Revenue recognition
Revenue from the sale of mineral concentrates is recognized when it is probable that the economic benefits will flow to the Company and delivery has occurred, the sales price and costs incurred with respect to the transaction can be measured reliably and collectability is reasonably assured. For uranium, revenue is typically recognized when delivery is evidenced by book transfer at the applicable uranium storage facility. For vanadium related products, revenue is typically recognized at the time of shipment to the customer.
Revenue from toll milling services is recognized as material is processed in accordance with the specifics of the applicable toll milling agreement. Revenue and unbilled accounts receivable are recorded as related costs are incurred using billing formulas included in the applicable toll milling agreement.
Revenue from alternate feed process milling is recognized as material is processed, in accordance with the specifics of the applicable processing agreement. In general, the Company collects a recycling fee for receipt of the material and/or receives the proceeds from the sale of any uranium concentrate and other metals produced. Deferred revenues represent processing proceeds received on delivery of materials but in advance of the required processing activity.
Revenue on environmental service contracts is recognized using the percentage of completion method, whereby sales, earnings and unbilled accounts receivable are recorded as related costs are incurred. Earnings rates are adjusted periodically as a result of revisions to projected contract revenues and estimated costs of completion. Losses, if any, are recognized fully when first anticipated. Revenues from engineering services are recognized as the services are provided in accordance with customer agreements.
Management fees from UPC are recognized as management services are provided under the contract on a monthly basis. Commission revenue earned on acquisition or sale of U3O8 and UF6 on behalf of UPC (or other parties where Denison acts as an agent) is recognized on the date when title passes.
(r) Borrowing costs
Borrowing costs attributable to the acquisition, construction or production of qualifying assets are added to the cost of those assets, until such time as the assets are substantially ready for their intended use. All other borrowing costs are recognized as interest expense in the statement of income in the period in which they are incurred.
(s) Earnings (loss) per share
Basic earnings per share (“EPS”) is calculated by dividing the net income (loss) for the period attributable to equity owners of DMC by the weighted average number of common shares outstanding during the period.
Denison Mines Corp. Annual Report 2011 | 41
NOTES TO THE CONSOLIDATED FINANCIAL STATEMENTS
Diluted EPS is calculated by adjusting the weighted average number of common shares outstanding for dilutive instruments. The number of shares included with respect to options, warrants and similar instruments is computed using the treasury stock method. DMC’s potentially dilutive common shares comprise stock options granted to employees and warrants.
(t) Accounting standards issued but not yet applied
The Company is currently evaluating the impact of the following pronouncements and has not yet determined the impact of the following pronouncements or whether to early adopt any of the new requirements:
| (i) | International Financial Reporting Standard 7, Financial Instruments – Disclosure (“IFRS 7”) |
IFRS 7 was amended to provide guidelines on the eligibility criteria for offsetting assets and liabilities as a single net amount in the balance sheet. This amendment is effective for annual periods beginning on or after January 1, 2013.
| (ii) | International Financial Reporting Standard 9, Financial Instruments (“IFRS 9”) |
IFRS 9 was issued in November 2009 and contained requirements for financial assets. This standard addresses classification and measurement of financial assets and replaces the multiple category and measurement models in IAS 39 for debt instruments with a new mixed measurement model having only two categories: amortized cost and fair value through profit or loss. IFRS 9 also replaces the models for measuring equity instruments, and such instruments are either recognized at fair value through profit or loss or at fair value through other comprehensive income. Where such equity instruments are measured at fair value through other comprehensive income, dividends are recognized in profit or loss to the extent not clearly representing a return of investment; however, other gains and losses (including impairments) associated with such instruments remain in accumulated comprehensive income indefinitely.
Requirements for financial liabilities were added in October 2010 and they largely carried forward existing requirements in IAS 39, Financial Instruments – Recognition and Measurement, except that fair value changes due to credit risk for liabilities designated at fair value through profit and loss would generally be recorded in other comprehensive income.
This standard is required to be applied for accounting periods beginning on or after January 1, 2015, with earlier adoption permitted.
| (iii) | International Financial Reporting Standard 10, Consolidated Financial Statements (“IFRS 10”) |
IFRS 10 was issued in May 2011 and it establishes principles for the presentation and preparation of consolidated financial statements when an entity controls one or more other entities. IFRS 10 requires an entity to consolidate an investee when it is exposed, or has rights, to variable returns from its involvement with the investee and has the ability to affect those returns through its power over the investee. Under existing IFRS, consolidation is required when an entity has the power to govern the financial and operating policies of an entity so as to obtain benefits from its activities. IFRS 10 replaces the consolidation requirements in SIC-12 Consolidation – Special Purpose Entities and IAS 27 Consolidated and Separate Financial Statements. This standard is effective for annual periods beginning on or after January 1, 2013. Earlier application is permitted.
| (iv) | International Financial Reporting Standard 11, Joint Arrangements (“IFRS 11”) |
IFRS 11 was issued in May 2011 and it provides for a more realistic reflection of joint arrangements by focusing on the rights and obligations of the arrangement, rather than its legal form. IFRS 11 requires the venture to classify its interest in a joint arrangement as a joint venture or a joint operation. Joint ventures will be accounted for using the equity method of accounting whereas for a joint operation the venture will recognize its share of the assets, liabilities, revenue and expenses of the joint operation. Under existing IFRS, entities have the choice to proportionately consolidate or equity account for interests in joint ventures. The standard addresses inconsistencies in the reporting of joint arrangements by requiring a single method to account for interests in jointly controlled entities. IFRS 11 supersedes IAS 31 Interests in Joint Ventures and SIC-13 Jointly Controlled Entities – Non-Monetary Contributions by Ventures. The standard is effective for annual periods beginning on or after January 1, 2013. Earlier application is permitted.
| (v) | International Financial Reporting Standard 12, Disclosure of Interest in Other Entities (“IFRS 12”) |
IFRS 12 was issued in May 2011 and it is a new and comprehensive standard on disclosure requirements for all forms of interests in other entities, including subsidiaries, joint arrangements, associates and unconsolidated structured entities. The standard carries forward existing disclosures and also introduces significant additional disclosure requirements that address the nature of, and risks associated with, an entity’s interest in other entities. The standard is effective for annual periods beginning on or after January 1, 2013. Earlier application is permitted.
| (vi) | International Financial Reporting Standard 13, Fair Value Measurement (“IFRS 13”) |
IFRS 13 was issued in May 2011 and it establishes new guidance on fair value measurement and disclosure requirements for IFRS and completes a major project to improve the convergence of IFRS and U.S. GAAP. The new standard clarifies that fair value is the price that would be received to sell an asset, or paid to transfer a liability in an orderly transaction between market participants, at the measurement date. The standard is effective for annual periods beginning on or after January 1, 2013. Earlier application is permitted.
42 | Denison Mines Corp. Annual Report 2011
NOTES TO THE CONSOLIDATED FINANCIAL STATEMENTS
| (vii) | International Accounting Standard 1, Presentation of Financial Statements (“IAS 1”) |
IAS 1 was amended to require entities to group items within other comprehensive income based on an assessment of whether such items may or may not be reclassified to profit or loss at a subsequent date. This standard is effective for annual periods beginning on or after July 1, 2012. Earlier application is permitted.
| (viii) | International Accounting Standard 19, Post-Employment Benefits (“IAS 19”) |
IAS 19 was amended to eliminate an entity’s option to defer the recognition of certain gains and losses related to post-employment benefits and require re-measurement of associated assets and liabilities in other comprehensive income. This amendment is effective for annual periods beginning on or after January 1, 2013. Earlier application is permitted.
| (ix) | International Accounting Standard 28, Investments in Associates (“IAS 28”) |
IAS 28 was amended to include joint ventures in its scope and to address the changes in IFRS 10 to 13. This amendment is effective for annual periods beginning on or after January 1, 2013. Earlier adoption is permitted.
| (x) | International Accounting Standard 32, Financial Instruments – Presentation (“IAS 32”) |
IAS 32 was amended to clarify the criteria that should be considered in determining whether an entity has a legally enforceable right of set off in respect of its financial instruments. Amendments to IAS 32 are applicable to annual periods beginning on or after January 1, 2014 with retrospective application required. Earlier application is permitted.
| 4. | CRITICAL ACCOUNTING ESTIMATES AND JUDGMENTS |
The preparation of consolidated financial statements in accordance with IFRS requires the use of certain critical accounting estimates and judgments that affect the amounts reported. It also requires management to exercise judgment in applying the Company’s accounting policies. These judgments and estimates are based on management’s best knowledge of the relevant facts and circumstances taking into account previous experience. Although the Company regularly reviews the estimates and judgments made that affect these financial statements, actual results may be materially different.
Significant estimates and judgments made by management relate to:
(a) Depreciation and Amortization of Property, Plant and Equipment
Property, plant and equipment comprise a large component of the Company’s assets and, as such, the depreciation and amortization of those assets have a significant effect on the Company’s financial statements. Depreciation and amortization of property, plant and equipment used in production is calculated on a straight line basis or a unit of production basis as appropriate.
Plant and equipment assets depreciated using a straight line basis require estimates of residual values and allocate the cost of an asset to production cost evenly over the asset’s useful life defined as a period of time. Plant and equipment assets depreciated using a units of production basis require estimates of residual values and allocate the cost of an asset to production cost based on current period production in proportion to total anticipated production from the facility. In certain instances, the total anticipated production from a facility will require making estimates about future toll milling volumes.
Mineral property assets are amortized using a units of production basis that allocates the cost of the asset to production cost based on the current period’s mill feed as a proportion of the total estimated resources in the related ore body. The process of making these estimates requires significant judgment in evaluating and assessing available geological, geophysical, engineering and economic data, projected rates of production, estimated commodity price forecasts and the timing of future expenditures, all of which are, by their very nature, subject to interpretation and uncertainty.
Changes in these estimates may materially impact the carrying value of the Company’s property, plant and equipment and the recorded amount of depletion and depreciation.
(b) Valuation of Long-lived Assets
The Company undertakes a review of the carrying values of mining properties and related expenditures whenever events or changes in circumstances indicate that their carrying values may exceed their estimated net recoverable amounts determined by reference to estimated future operating results and discounted net cash flows. An impairment loss is recognized when the carrying value of those assets is not recoverable. In undertaking this review, management of the Company is required to make significant estimates of, amongst other things, future production and sale volumes, forecast commodity prices, future operating and capital costs and reclamation costs to the end of the mine’s life. These estimates are subject to various risks and uncertainties, which may ultimately have an effect on the expected recoverability of the carrying values of the mining properties and related expenditures.
The Company reviews goodwill at least annually. The Company has estimated the fair value of operating segments to which goodwill is allocated using discounted cash flow models that require assumptions about future cash flows, expenditures and an assumed discount rate. Changes in these estimates could have a material impact on the carrying value of the goodwill.
Denison Mines Corp. Annual Report 2011 | 43
NOTES TO THE CONSOLIDATED FINANCIAL STATEMENTS
(c) Inventory
The Company values its concentrate, work in process and ore stockpile inventories at the lower of cost or net realizable value at the end of the reporting period. Costs represent the average cost, and include direct labour and materials costs, mine site overhead, plant and equipment depreciation, mineral property amortization and stockpile depletion. Net realizable value is based on estimated future commodity prices and estimated costs required to convert work in process and ore stockpile inventories into saleable form. These estimates are subject to change from period-to-period that may materially impact the carrying value of the Company’s inventories resulting in inventory write-downs and recoveries.
(d) Deferred Tax Assets and Liabilities
Deferred tax assets and liabilities are recognized for the future tax consequences attributable to differences between the financial statement carrying amounts of existing assets and liabilities and their respective tax bases. Deferred tax assets and liabilities are measured using enacted or substantially enacted tax rates expected to apply when the differences are expected to be recovered or settled. The determination of the ability of the Company to utilize tax loss carry forwards to offset deferred tax liabilities requires management to exercise judgment and make certain assumptions about the future performance of the Company. Management is required to assess whether it is “probable” that the Company will benefit from these prior losses and other deferred tax assets. Changes in economic conditions, commodity prices and other factors could result in revisions to the estimates of the benefits to be realized or the timing of utilizing the losses.
(e) Business Combinations
Management uses judgment in applying the acquisition method of accounting for business combinations and in determining fair values of the identifiable assets and liabilities acquired. The value placed on the acquired assets and liabilities, including identifiable intangible assets, will have an effect on the amount of goodwill that the Company may record on an acquisition. Changes in economic conditions, commodity prices and other factors between the date that an acquisition is announced and when it finally is consummated can have a material difference on the allocation used to record a preliminary purchase price allocation versus the final purchase price allocation which can take up to one year after acquisition to complete.
(f) Reclamation Obligations
Asset retirement obligations are recorded as a liability when the asset is initially constructed. Denison has accrued its best estimate of the ongoing reclamation liability in connection with the decommissioned Elliot Lake mine site and is currently accruing its best estimate of its share of the cost to decommission its other mining and milling properties in accordance with existing laws, contracts and other policies. The estimate of future costs involves a number of estimates relating to timing, type of costs, mine closure plans, and review of potential methods and technical advancements. Furthermore, due to uncertainties concerning environmental remediation, the ultimate cost of the Company’s decommissioning liability could differ from amounts provided. The estimate of the Company’s obligation is subject to change due to amendments to applicable laws and regulations and as new information concerning the Company’s operations becomes available. The Company is not able to determine the impact on its financial position, if any, of environmental laws and regulations that may be enacted in the future.
| 5. | TRANSITION TO IFRS |
These are the first annual financial statements issued by the Company that will comply with IFRS. These financial statements were prepared as described in note 2, including the application of IFRS 1, First time adoption of International Reporting Financial Standards (“IFRS 1”). IFRS 1 sets out the procedures that the Company must follow when it adopts IFRS for the first time as the basis for preparing its consolidated financial statements.
IFRS 1 also requires that comparative financial information be provided. As a result, the first date at which the Company has applied IFRS was January 1, 2010 (the “Transition Date”). IFRS 1 requires first-time adopters to retrospectively apply all effective IFRS standards as of the reporting date, December 31, 2011. The standard also permits a number of optional and mandatory exemptions from full retrospective application.
The Company is required to use the following mandatory exemptions as follows:
| • | Estimates cannot be created or revised using hindsight. The estimates previously made by the Company under CGAAP were not revised for the application of IFRS except where necessary to reflect any difference in accounting policies. |
| • | For non-controlling interests, IFRS 1 lists specific requirements of IAS 27 Consolidated and Separate Financial Statements which are applied prospectively. |
The Company has elected to use the following optional exemptions and has made the following adjustments to transition from CGAAP to IFRS:
(a) Business combinations
The Company elected to apply IFRS relating to business combinations prospectively from January 1, 2010. As such, CGAAP balances relating to business combinations entered into before that date have been carried forward.
44 | Denison Mines Corp. Annual Report 2011
NOTES TO THE CONSOLIDATED FINANCIAL STATEMENTS
(b) Cumulative translation adjustment
The Company has elected to reset the cumulative translation adjustment (“CTA”) account, which includes gains and losses arising from the translation of foreign operations, to zero at the date of transition to IFRS as an alternative to calculating the retrospective cumulative translation adjustments required to be in compliance with the principles of IAS 21 for the periods prior to transition.
(c) Impairment testing under IAS 36 and IFRS 1 elections
In accordance with IAS 36, the Company performed impairment tests of its Canadian and United States CGUs which includes inventories, mineral properties, plant and equipment, goodwill and reclamation liabilities. The Company estimated fair values using a combination of a discounted cash flow model using the fair value less cost to sell basis (at a post tax discount rate of 10%) and independent valuations to determine the recoverable amount of these CGUs. The recoverable amounts determined for both CGUs were less than the carrying amounts. For the Canadian CGU, the carrying value of the mineral properties and plant and equipment were reduced to estimated fair value and, as a result, the carrying value of goodwill was fully written off. For the United States CGU, the carrying values of the plant and equipment and mineral properties were reduced to estimated fair value.
IFRS 1 allows an entity to elect to measure an item of property, plant and equipment at the date of transition to IFRS at its fair value and use that fair value as its deemed cost at that date. The first time adopter may elect to use a previous CGAAP revaluation of an item of property, plant and equipment at, or before, the date of transition to IFRS as deemed cost at the date of the revaluation, if the revaluation was, at the date of the revaluation, broadly comparable to fair value. The Company has elected to take the lower of cost or fair value of certain of its property, plant and equipment as deemed cost based on appraisal reports prepared by independent third party valuators.
The Company wrote down the carrying value of its Zambian mineral properties to its fair value in the 2009 fiscal year as part of its impairment assessment under CGAAP. The fair value was calculated using most recent comparable transactions at such point in time. This fair value has been used as the ‘deemed cost’ going forward upon transition to IFRS. The impact of this is that no reversal of impairment loss previously taken would be required even if there was an increase in fair value in subsequent periods. There are no other significant assets in the Zambian CGU.
As a result of the transition to IFRS and the reduction of the carrying amounts of plant and equipment and mineral properties, management recognized the related decrease in deferred tax liability as of January 1, 2010.
A summary of the impairment charges recorded by each CGU on January 1, 2010, by asset class, is as follows:
| Canadian | United States | |||||||||||
| Mining | Mining | |||||||||||
(in thousands) | Segment | Segment | Total | |||||||||
Property, plant and equipment | ||||||||||||
Plant and equipment | $ | 13,009 | $ | 927 | $ | 13,936 | ||||||
Mineral properties | 252,267 | 59,645 | 311,912 | |||||||||
Goodwill | 51,028 | — | 51,028 | |||||||||
|
|
|
|
|
| |||||||
Transitional impairment loss – pre tax | $ | 316,304 | $ | 60,572 | $ | 376,876 | ||||||
|
|
|
|
|
| |||||||
The Company amortizes its mineral property assets using a units of production basis and includes that amount in the valuation of work in progress and concentrate inventories. Since the value of the Company’s mineral property assets is less under IFRS than CGAAP, the amount amortized to inventory is also less. As a result the carrying value of inventory also tends to be less to reflect the lower mineral property amortization cost.
The lower carrying values for the Company’s inventory under IFRS also result in lower net realizable value adjustments being recorded in a particular period when compared to CGAAP.
(d) Adoption of IFRS 6 for exploration and evaluation expenditures
The Company has elected to adopt the provisions of IFRS 6 which allow the Company to continue with the current accounting policies regarding the accounting for exploration and evaluation expenditures, with the exception of capitalizing a portion of its exploration spending. Under CGAAP, the Company capitalized a portion of its exploration spending as a component of its carrying value of mineral properties.
Under IFRS, this practice has been discontinued and mineral property exploration expense has increased accordingly. This adjustment has impacted the cash flow split between operating and investing activities for IFRS when compared to CGAAP.
(e) Change in foreign exchange translation methodology
Under CGAAP, the Company used the temporal method of foreign exchange translation for its fully-integrated subsidiaries. This included its Zambian and Australian subsidiaries. Under the temporal method, non-monetary assets were converted to the presentation currency using historical foreign exchange rates and the resulting difference between the translation of the balance sheet and income statement was recorded in the statement of operations.
Denison Mines Corp. Annual Report 2011 | 45
NOTES TO THE CONSOLIDATED FINANCIAL STATEMENTS
Under IFRS, the temporal method is not recognized and translation occurs using the equivalent of the current rate method under CGAAP. Under this method, all assets and liabilities are treated as monetary and translated to the presentation currency using the foreign exchange rate at the end of the reporting period. Differences between the translation of the balance sheet and the statement of operations are accumulated in an account in equity. The change in translation methodology has resulted in some significant changes in the presentation currency amounts for the Company’s Zambian subsidiary and has also resulted in the reversal of translation foreign exchange income / expense in the statement of operations.
(f) Acquisition of OmegaCorp Limited
The Company completed the acquisition of OmegaCorp Limited in 2007 under which it acquired its Zambian subsidiary. Under CGAAP at the time, the Company treated the transaction as an asset acquisition and was required to gross-up the Mutanga project mineral property value and the deferred tax liability by an equal and offsetting amount. In 2009, the Company impaired the value of the Mutanga project to its fair value at the time. As at January 1, 2010, a portion of the deferred tax liability associated with the initial acquisition of the Mutanga project in 2007 still remained under CGAAP. This remaining deferred tax liability has been reversed on the transition to IFRS as IAS 12 does not permit the recognition of a deferred tax liability on the initial recognition of an asset in a transaction that is not a business combination.
(g) Flow-through share accounting
Under CGAAP, the Company would record the gross proceeds relating to flow through shares to share capital at the time of issuance. It would then record a charge (reduction) to share capital at the time the tax benefits of the flow-through shares were renounced to the subscribers. The charge was calculated by multiplying the amount of the renounced tax benefits (which are equal to the proceeds of the flow-through share issue) by the effective tax rate at the time. The offset would go to the deferred tax liability to reflect the fact that the Company could no longer use the tax attributes for its benefit.
Under IFRS, the proceeds from issuing flow-through shares are allocated between the offering of shares and the sale of tax benefits. The allocation is based on the difference (“premium”) between the quoted price of the Company’s existing shares, at the date of closing, and the amount the investor pays for the actual flow-through shares. A liability is recognized for the premium, and is extinguished when the tax effect of the temporary differences, resulting from the renunciation, is recorded. The difference between the liability and the value of the tax assets renounced is recorded as a deferred tax expense. There is no subsequent reduction in share capital.
(h) Other transitional items
The income statement has been adjusted for the following additional items not discussed above:
| • | Depreciation expense – increase due to componentization adjustments on assets at the McClean Lake and White Mesa mills; |
| • | Reclamation asset amortization and liability adjustments – upon transition, the Company impaired the value of its reclamation assets to nil. As a result, any resulting amortization has been reversed. The change in the net asset value of the reclamation assets has also impacted the amount of the liability adjustment recorded under CGAAP at December 31, 2010; and |
| • | Gain / loss on asset disposals – the Company has reversed plant and equipment impairment charges recorded in fiscal 2010 and recalculated the gain / loss on plant and equipment disposals as a result of having adjusted carrying values for its plant and equipment assets. |
In preparing its IFRS balance sheets for fiscal 2010, the Company has adjusted amounts previously reported in financial statements prepared in accordance with CGAAP. An explanation of how the transition from CGAAP to IFRS has affected the Company’s balance sheets is set out in the following tables and notes that accompany the tables:
46 | Denison Mines Corp. Annual Report 2011
NOTES TO THE CONSOLIDATED FINANCIAL STATEMENTS
| a) | Reconciliation of Consolidated Balance Sheets from CGAAP to IFRS: |
| As at January 1, 2010 | ||||||||||||||||
| Canadian | IFRS | |||||||||||||||
(in thousands) | Table | GAAP | ADJUST | GAAP | ||||||||||||
ASSETS | ||||||||||||||||
Current | ||||||||||||||||
Cash and cash equivalents | $ | 19,804 | $ | — | $ | 19,804 | ||||||||||
Trade and other receivables | 13,773 | — | 13,773 | |||||||||||||
Inventories | A | 52,216 | — | 52,216 | ||||||||||||
Prepaid expenses and other | B | 1,607 | (3 | ) | 1,604 | |||||||||||
|
|
|
|
|
|
|
| |||||||||
| 87,400 | (3 | ) | 87,397 | |||||||||||||
|
|
|
|
|
|
|
| |||||||||
Non-Current | ||||||||||||||||
Inventories – ore in stockpiles | 1,530 | — | 1,530 | |||||||||||||
Investments | 10,605 | — | 10,605 | |||||||||||||
Prepaid expenses and other | 287 | — | 287 | |||||||||||||
Restricted cash and investments | 21,656 | — | 21,656 | |||||||||||||
Property, plant and equipment | C | 691,039 | (369,644 | ) | 321,395 | |||||||||||
Intangibles | 4,436 | — | 4,436 | |||||||||||||
Goodwill | D | 51,028 | (51,028 | ) | — | |||||||||||
|
|
|
|
|
|
|
| |||||||||
Total assets | $ | 867,981 | (420,675 | ) | $ | 447,306 | ||||||||||
|
|
|
|
|
|
|
| |||||||||
LIABILITIES | ||||||||||||||||
Current | ||||||||||||||||
Accounts payable and accrued liabilities | E | $ | 9,508 | $ | 218 | $ | 9,726 | |||||||||
Current portion of long-term liabilities: | ||||||||||||||||
Post-employment benefits | 380 | — | 380 | |||||||||||||
Reclamation obligations | 752 | — | 752 | |||||||||||||
Debt obligations | 869 | — | 869 | |||||||||||||
Other liabilities | 313 | — | 313 | |||||||||||||
|
|
|
|
|
|
|
| |||||||||
| 11,822 | 218 | 12,040 | ||||||||||||||
|
|
|
|
|
|
|
| |||||||||
Non-Current | ||||||||||||||||
Deferred revenue | 3,187 | — | 3,187 | |||||||||||||
Post-employment benefits | 3,426 | — | 3,426 | |||||||||||||
Reclamation obligations | 17,154 | — | 17,154 | |||||||||||||
Debt obligations | 195 | — | 195 | |||||||||||||
Other liabilities | 1,051 | — | 1,051 | |||||||||||||
Deferred income tax liability | F | 102,918 | (88,856 | ) | 14,062 | |||||||||||
|
|
|
|
|
|
|
| |||||||||
Total liabilities | 139,753 | (88,638 | ) | 51,115 | ||||||||||||
|
|
|
|
|
|
|
| |||||||||
EQUITY | ||||||||||||||||
Share capital | G | 849,488 | 848 | 850,336 | ||||||||||||
Share purchase warrants | 5,830 | — | 5,830 | |||||||||||||
Contributed surplus | 39,922 | — | 39,922 | |||||||||||||
Deficit | ||||||||||||||||
Opening | H | (242,494 | ) | (260,987 | ) | (503,481 | ) | |||||||||
Accumulated other comprehensive income | ||||||||||||||||
Opening | I | 75,482 | (71,898 | ) | 3,584 | |||||||||||
|
|
|
|
|
|
|
| |||||||||
Total equity | 728,228 | (332,037 | ) | 396,191 | ||||||||||||
|
|
|
|
|
|
|
| |||||||||
Total liabilities and equity | $ | 867,981 | $ | (420,675 | ) | $ | 447,306 | |||||||||
|
|
|
|
|
|
|
| |||||||||
Denison Mines Corp. Annual Report 2011 | 47
NOTES TO THE CONSOLIDATED FINANCIAL STATEMENTS
| As at December 31, 2010 | ||||||||||||||||
| Canadian | IFRS | |||||||||||||||
(in thousands) | Table | GAAP | ADJUST | GAAP | ||||||||||||
ASSETS | ||||||||||||||||
Current | ||||||||||||||||
Cash and cash equivalents | $ | 97,554 | $ | — | $ | 97,554 | ||||||||||
Trade and other receivables | 20,236 | — | 20,236 | |||||||||||||
Inventories | A | 32,387 | (3,254 | ) | 29,133 | |||||||||||
Prepaid expenses and other | B | 1,917 | (7 | ) | 1,910 | |||||||||||
|
|
|
|
|
|
|
| |||||||||
| 152,094 | (3,261 | ) | 148,833 | |||||||||||||
|
|
|
|
|
|
|
| |||||||||
Non-Current | ||||||||||||||||
Inventories —ore in stockpiles | 2,204 | — | 2,204 | |||||||||||||
Investments | 2,955 | — | 2,955 | |||||||||||||
Prepaid expenses and other | 104 | 3 | 107 | |||||||||||||
Restricted cash and investments | 22,946 | — | 22,946 | |||||||||||||
Property, plant and equipment | C | 714,458 | (372,294 | ) | 342,164 | |||||||||||
Intangibles | 3,794 | — | 3,794 | |||||||||||||
Goodwill | D | 53,919 | (53,919 | ) | — | |||||||||||
|
|
|
|
|
|
|
| |||||||||
Total assets | $ | 952,474 | (429,471 | ) | $ | 523,003 | ||||||||||
|
|
|
|
|
|
|
| |||||||||
LIABILITIES | ||||||||||||||||
Current | ||||||||||||||||
Accounts payable and accrued liabilities | E | $ | 13,753 | $ | — | $ | 13,753 | |||||||||
Current portion of long-term liabilities: | ||||||||||||||||
Post-employment benefits | 402 | — | 402 | |||||||||||||
Reclamation obligations | 641 | — | 641 | |||||||||||||
Debt obligations | 200 | — | 200 | |||||||||||||
Other liabilities | — | — | — | |||||||||||||
|
|
|
|
|
|
|
| |||||||||
| 14,996 | — | 14,996 | ||||||||||||||
|
|
|
|
|
|
|
| |||||||||
Non-Current | ||||||||||||||||
Deferred revenue | 3,339 | — | 3,339 | |||||||||||||
Post-employment benefits | 3,617 | — | 3,617 | |||||||||||||
Reclamation obligations | 16,924 | — | 16,924 | |||||||||||||
Debt obligations | 205 | — | 205 | |||||||||||||
Other liabilities | 1,105 | — | 1,105 | |||||||||||||
Deferred income tax liability | F | 106,183 | (92,775 | ) | 13,408 | |||||||||||
|
|
|
|
|
|
|
| |||||||||
Total liabilities | 146,369 | (92,775 | ) | 53,594 | ||||||||||||
|
|
|
|
|
|
|
| |||||||||
EQUITY | ||||||||||||||||
Share capital | G | 910,484 | 1,197 | 911,681 | ||||||||||||
Share purchase warrants | 5,830 | — | 5,830 | |||||||||||||
Contributed surplus | 41,658 | — | 41,658 | |||||||||||||
Deficit | ||||||||||||||||
Opening | H | (242,494 | ) | (260,987 | ) | (503,481 | ) | |||||||||
Net income (loss) | J | (14,235 | ) | 8,889 | (5,346 | ) | ||||||||||
Accumulated other comprehensive income | ||||||||||||||||
Opening | I | 75,482 | (71,898 | ) | 3,584 | |||||||||||
Comprehensive income (loss) | J | 29,380 | (13,897 | ) | 15,483 | |||||||||||
|
|
|
|
|
|
|
| |||||||||
Total equity | 806,105 | (336,696 | ) | 469,409 | ||||||||||||
|
|
|
|
|
|
|
| |||||||||
Total liabilities and equity | $ | 952,474 | $ | (429,471 | ) | $ | 523,003 | |||||||||
|
|
|
|
|
|
|
| |||||||||
48 | Denison Mines Corp. Annual Report 2011
NOTES TO THE CONSOLIDATED FINANCIAL STATEMENTS
| b) | Reconciliation Tables of Consolidated Balance Sheet Line Items from CGAAP to IFRS: |
Table A—Inventories —current
(in thousands) | Notes | January 1 2010 | December 31 2010 | |||||||||
Balance —CGAAP | $ | 52,216 | $ | 32,387 | ||||||||
Change in absorption | 5c | — | (14,948 | ) | ||||||||
Change in cost of goods sold | 5c | — | 11,690 | |||||||||
Change in NRV provisions | 5c | — | 4 | |||||||||
|
|
|
|
|
| |||||||
Balance —IFRS | $ | 52,216 | $ | 29,133 | ||||||||
|
|
|
|
|
| |||||||
Table B —Prepaid expenses and other | ||||||||||||
(in thousands) | Notes | January 1 2010 | December 31 2010 | |||||||||
Balance —CGAAP | $ | 1,607 | $ | 1,917 | ||||||||
Translation methodology | 5e | (3 | ) | (7 | ) | |||||||
|
|
|
|
|
| |||||||
Balance —IFRS | $ | 1,604 | $ | 1,910 | ||||||||
|
|
|
|
|
| |||||||
Table C —Property, plant and equipment | ||||||||||||
(in thousands) | Notes | January 1 2010 | December 31 2010 | |||||||||
Balance —CGAAP | $ | 691,039 | $ | 714,458 | ||||||||
Transition impairment | 5c | (325,848 | ) | (340,875 | ) | |||||||
Change in translation methodology | 5e | (43,795 | ) | (47,084 | ) | |||||||
Change in depreciation, amortization | 5c,h | — | 14,718 | |||||||||
Change in exploration absorption | 5d | — | (96 | ) | ||||||||
Change in disposals and other | 5h | (1 | ) | 1,043 | ||||||||
|
|
|
|
|
| |||||||
Balance —IFRS | $ | 321,395 | $ | 342,164 | ||||||||
|
|
|
|
|
| |||||||
Table D —Goodwill | ||||||||||||
(in thousands) | Notes | January 1 2010 | December 31 2010 | |||||||||
Balance —CGAAP | $ | 51,028 | $ | 53,919 | ||||||||
Transition impairment | 5c | (51,028 | ) | (53,919 | ) | |||||||
|
|
|
|
|
| |||||||
Balance —IFRS | $ | — | $ | — | ||||||||
|
|
|
|
|
| |||||||
Table E —Accounts payable and accrued liabilities | ||||||||||||
(in thousands) | Notes | January 1 2010 | December 31 2010 | |||||||||
Balance —CGAAP | $ | 9,508 | $ | 13,753 | ||||||||
Flow-through share premium liability | 5g | 218 | — | |||||||||
|
|
|
|
|
| |||||||
Balance —IFRS | $ | 9,726 | $ | 13,753 | ||||||||
|
|
|
|
|
| |||||||
Denison Mines Corp. Annual Report 2011 | 49
NOTES TO THE CONSOLIDATED FINANCIAL STATEMENTS
Table F — Deferred tax liability
| $000,000 | $000,000 | $000,000 | ||||||||||
(in thousands) | Notes | January 1 2010 | December 31 2010 | |||||||||
Balance — CGAAP | $ | 102,918 | $ | 106,183 | ||||||||
Transition impairment — tax effect | 5c | (70,701 | ) | (74,706 | ) | |||||||
Acquisition tax liability un-wind | 5f | (20,218 | ) | (19,433 | ) | |||||||
Other adjustments | 2,063 | 1,364 | ||||||||||
|
|
|
|
|
| |||||||
Balance – IFRS | $ | 14,062 | $ | 13,408 | ||||||||
|
|
|
|
|
| |||||||
Table G — Share capital
| $000,000 | $000,000 | $000,000 | ||||||||||
(in thousands) | Notes | January 1 2010 | December 31 2010 | |||||||||
Balance — CGAAP | $ | 849,488 | $ | 910,484 | ||||||||
Flow-through shares — life-to-date adjustment on transition | 5g | 848 | 848 | |||||||||
Reverse flow-through share renunciation recorded under Canadian GAAP | 5g | — | 349 | |||||||||
|
|
|
|
|
| |||||||
Balance — IFRS | $ | 850,336 | $ | 911,681 | ||||||||
|
|
|
|
|
| |||||||
Table H — Deficit — opening
| $000,000 | $000,000 | $000,000 | ||||||||||
(in thousands) | Notes | January 1 2010 | December 31 2010 | |||||||||
Balance — CGAAP | $ | (242,494 | ) | $ | (242,494 | ) | ||||||
Transition impairments | ||||||||||||
Property, plant and equipment | 5c | (325,848 | ) | (325,848 | ) | |||||||
Goodwill | 5c | (51,028 | ) | (51,028 | ) | |||||||
Deferred tax | 5c | 70,701 | 70,701 | |||||||||
Translation methodology | ||||||||||||
Prepaids and other current assets | 5e | (3 | ) | (3 | ) | |||||||
Property, plant and equipment | 5e | (43,795 | ) | (43,795 | ) | |||||||
Acquisition tax liability un-wind | 5f | 20,218 | 20,218 | |||||||||
Flow-through share adjustments | 5g | (1,067 | ) | (1,067 | ) | |||||||
Other | (2,063 | ) | (2,063 | ) | ||||||||
Reset of cumulative translation account | 5b | 71,898 | 71,898 | |||||||||
|
|
|
|
|
| |||||||
Balance — IFRS | $ | (503,481 | ) | $ | (503,481 | ) | ||||||
|
|
|
|
|
| |||||||
Table I — Accumulated other comprehensive income (loss) — opening
| $000,000 | $000,000 | $000,000 | ||||||||||
(in thousands) | Notes | January 1 2010 | December 31 2010 | |||||||||
Balance — CGAAP | $ | 75,482 | $ | 75,482 | ||||||||
Reclass CTA to retained earnings on transition | 5b | (71,898 | ) | (71,898 | ) | |||||||
|
|
|
|
|
| |||||||
Balance — IFRS | $ | 3,584 | $ | 3,584 | ||||||||
|
|
|
|
|
| |||||||
50 | Denison Mines Corp. Annual Report 2011
NOTES TO THE CONSOLIDATED FINANCIAL STATEMENTS
Table J — Net income (loss) and Comprehensive income (loss)
| $000,000 | $000,000 | |||||||
(in thousands) | Notes | Twelve months December 31 2010 | ||||||
Net income (loss) — CGAAP | $ | (14,235 | ) | |||||
Operations | ||||||||
Depreciation expense | 5c,h | (1,820 | ) | |||||
Mineral property amortization | 5c | 16,082 | ||||||
Concentrate absorption change | 5c | (14,658 | ) | |||||
COGS change | 5c | 11,422 | ||||||
NRV provision changes | 5c | (18 | ) | |||||
Reclamation asset amortization | 5h | 174 | ||||||
Reclamation liability adjustment | 5h | 330 | ||||||
Exploration | ||||||||
Exploration absorption | 5d | (92 | ) | |||||
Other expense (income) | ||||||||
Gain/loss on asset disposals | 5h | 692 | ||||||
Foreign exchange — translational | 5e | (3,923 | ) | |||||
Taxes | ||||||||
Future taxes | 700 | |||||||
|
|
|
| |||||
Net income (loss) — IFRS | $ | (5,346 | ) | |||||
|
|
|
| |||||
Comprehensive income (loss) — CGAAP | 15,145 | |||||||
Change in net income (loss) | 8,889 | |||||||
Change in foreign currency translation | (13,897 | ) | ||||||
|
|
|
| |||||
Comprehensive income (loss) — IFRS | $ | 10,137 | ||||||
|
|
|
| |||||
Table K — Consolidated Statement of Cash Flow adjustments
| $000,000 | $000,000 | |||||||
(in thousands) | Notes | Twelve months December 31 2010 | ||||||
Net cash provided by (used in) operating activities: | ||||||||
Under CGAAP | $ | 35,551 | ||||||
Change in exploration absorption | 5d | (93 | ) | |||||
|
|
|
| |||||
Under IFRS | $ | 35,458 | ||||||
|
|
|
| |||||
Net cash provided by (used in) investing activities: | ||||||||
Under CGAAP | $ | (19,472 | ) | |||||
Change in exploration absorption | 5d | 93 | ||||||
|
|
|
| |||||
Under IFRS | $ | (19,379 | ) | |||||
|
|
|
| |||||
Denison Mines Corp. Annual Report 2011 | 51
NOTES TO THE CONSOLIDATED FINANCIAL STATEMENTS
| 6. | ACQUISITION OF WHITE CANYON URANIUM LIMITED |
On June 17, 2011, DMC’s offer to acquire all of the outstanding shares of White Canyon Uranium Limited (“WCU”) closed with 96.98% of shares outstanding accepting the offer. Compulsory acquisition proceedings to acquire the remaining shares of WCU were initiated on June 20, 2011 and were completed in early August 2011.
DMC’s cash offer of AUD$0.24 per WCU share resulted in a total purchase price of $61,027,000 (AUD$57,163,000).
As a result of the acquisition, the Company acquired WCU’s key assets located in southeastern Utah, near Denison’s White Mesa mill. Its holdings comprise 100% interests in the Daneros producing mine, the Lark Royal advanced project and the Thompson, Geitus, Blue Jay and Marcy Look exploration projects. WCU commenced production of uranium ore in December 2009 from its 100% owned Daneros uranium mine.
This transaction has been accounted for as a business combination with DMC as the acquirer and WCU’s results of operations have been consolidated with those of Denison commencing as at the acquisition date. The following table summarizes the consideration paid for WCU, the fair value of assets acquired and liabilities assumed at the acquisition date. Fair values recorded in the interim condensed consolidated financial statements of the Company for the period ended June 30, 2011 were determined on a provisional basis. These fair values have been finalized as follows:
| WCU Fair Value as at June 17, 2011 | ||||||||||||
(in thousands) | Provisional Basis | Adjustments | Final Basis | |||||||||
Cash and cash equivalents | $ | 1,323 | $ | — | $ | 1,323 | ||||||
Trade and other receivables | 158 | — | 158 | |||||||||
Inventories | ||||||||||||
Ore in stockpiles | 3,715 | (4 | ) | 3,711 | ||||||||
Uranium concentrates and work in progress | 584 | — | 584 | |||||||||
Prepaid expenses and other | 42 | — | 42 | |||||||||
Restricted cash and investments | 147 | — | 147 | |||||||||
Property, plant and equipment | ||||||||||||
Plant and equipment | 26 | — | 26 | |||||||||
Mineral properties | 57,095 | (33,179 | ) | 23,916 | ||||||||
Goodwill | 12,350 | 20,275 | 32,625 | |||||||||
|
|
|
|
|
| |||||||
Total assets | 75,440 | (12,908 | ) | 62,532 | ||||||||
|
|
|
|
|
| |||||||
Accounts payable and accrued liabilities | 1,982 | 7 | 1,989 | |||||||||
Reclamation obligations | 81 | — | 81 | |||||||||
Deferred income tax liability | 12,350 | (12,915 | ) | (565 | ) | |||||||
|
|
|
|
|
| |||||||
Total liabilities | 14,413 | (12,908 | ) | 1,505 | ||||||||
|
|
|
|
|
| |||||||
Total cash consideration | $ | 61,027 | $ | — | $ | 61,027 | ||||||
|
|
|
|
|
| |||||||
WCU’s identifiable assets and liabilities were measured at their individual fair values as at June 17, 2011, the acquisition date. In arriving at the final fair values, management has made assumptions, estimates and assessments based on fair value information available at or around June 17, 2011. The adjustments recorded have resulted in a decrease in mineral properties of $33,179,000 and an increase in goodwill of $20,275,000 from the amounts previously reported. The reduced mineral property fair value is attributable to the following factors: a) reduced consensus estimates for uranium prices and reduced market valuations for U.S uranium companies when comparing the provisional fair value models with the final fair value models as a result of the Fukushima nuclear incident in Japan in March 2011; and b) reduced resource estimates on the exploration projects acquired.
During 2011, the Company recorded an impairment charge of $32,625,000 related to the goodwill recognized in the WCU acquisition (see note 14).
52 | Denison Mines Corp. Annual Report 2011
NOTES TO THE CONSOLIDATED FINANCIAL STATEMENTS
The consolidated statement of income (loss) for 2011 includes revenue of $nil and net loss of $33,637,000 (including the goodwill impairment charge noted above) with respect to the former operations of WCU. The Company includes the results of WCU as part of its U.S. mining segment.
The total transaction costs incurred by Denison relating to the acquisition, and included in general and administrative expenses for 2011 amounted to $1,425,000.
The following unaudited pro forma summary presents DMC’s consolidated results as if WCU had been acquired on January 1, 2011. The pro forma information is provided for comparative purposes only and does not necessarily reflect the actual results that would have occurred, nor is it necessarily indicative of future results of operations of the combined companies.
(in thousands) | Revenue | Net income (loss) | ||||||
As reported for the period | $ | 96,800 | $ | (70,869 | ) | |||
Adjustments to revenue(1) | 7,142 | — | ||||||
Adjustments to net income (loss)(2) | — | (9,529 | ) | |||||
|
|
|
| |||||
Pro forma amounts for the period | $ | 103,942 | $ | (80,398 | ) | |||
|
|
|
| |||||
| (1) | Revenue adjustments include WCU’s revenue for the six month period ended June 30, 2011 adjusted to eliminate revenue transactions between the Denison and the WCU corporate groups. |
| (2) | Net income (loss) adjustments include revenue adjustments above, WCU’s net income (loss) for the six month period ended June 30, 2011 and the following additional items: a) adjustments to WCU’s financial results to conform to Denison’s policy of expensing exploration; and b) adjustments to WCU’s financial results to conform to Denison’s policy of translating intercompany advances. |
| 7. | CASH AND CASH EQUIVALENTS |
The cash and cash equivalent balance consists of:
(in thousands) | At December 31 2011 | At December 31 2010 | At January 1 2010 | |||||||||
Cash | $ | 24,999 | $ | 46,846 | $ | 19,804 | ||||||
Cash equivalents | 28,516 | 50,708 | — | |||||||||
|
|
|
|
|
| |||||||
| $ | 53,515 | $ | 97,554 | $ | 19,804 | |||||||
|
|
|
|
|
| |||||||
| 8. | TRADE AND OTHER RECEIVABLES |
The trade and other receivables balance consists of:
(in thousands) | At December 31 2011 | At December 31 2010 | At January 1 2010 | |||||||||
Trade receivables — mineral concentrate sales | $ | 7,762 | $ | 5,631 | $ | 9,422 | ||||||
Trade receivables — other | 3,746 | 6,903 | 2,114 | |||||||||
Receivables in joint ownership arrangements | 346 | 375 | 928 | |||||||||
Sales tax receivables | 279 | 228 | 1,127 | |||||||||
Sundry receivables | 446 | 6,242 | 182 | |||||||||
Notes and lease receivables | 73 | 857 | — | |||||||||
|
|
|
|
|
| |||||||
| $ | 12,652 | $ | 20,236 | $ | 13,773 | |||||||
|
|
|
|
|
| |||||||
Denison Mines Corp. Annual Report 2011 | 53
NOTES TO THE CONSOLIDATED FINANCIAL STATEMENTS
| 9. | INVENTORIES |
The inventories balance consists of:
(in thousands) | At December 31 2011 | At December 31 2010 | At January 1 2010 | |||||||||
Uranium concentrates and work in progress(1) | $ | 14,676 | $ | 6,707 | $ | 19,921 | ||||||
Vanadium concentrates and work in progress(2) | 18 | 4,198 | 442 | |||||||||
Inventory of ore in stockpiles | 17,515 | 14,772 | 28,366 | |||||||||
Mine and mill supplies | 6,053 | 5,660 | 5,017 | |||||||||
|
|
|
|
|
| |||||||
| $ | 38,262 | $ | 31,337 | $ | 53,746 | |||||||
|
|
|
|
|
| |||||||
Inventories — by duration: | ||||||||||||
Current | $ | 36,106 | $ | 29,133 | $ | 52,216 | ||||||
Long-term — ore in stockpiles | 2,156 | 2,204 | 1,530 | |||||||||
|
|
|
|
|
| |||||||
| $ | 38,262 | $ | 31,337 | $ | 53,746 | |||||||
|
|
|
|
|
| |||||||
| (1) | The uranium concentrates and work in progress inventory is presented net of a provision of $nil as at December 31, 2011, $nil as at December 31, 2010 and $5,910,000 as at January 1, 2010. |
| (2) | The vanadium concentrates and work in progress inventory is presented net of a provision of $nil as at December 31, 2011, $17,000 as at December 31, 2010 and $7,302,000 as at January 1, 2010. |
Operating expenses include recoveries of $17,000 and $13,195,000 relating to the net realizable value of the Company’s uranium and vanadium inventories for the years ended December 2011 and December 2010, respectively.
Long-term ore in stockpile inventory represents an estimate of the amount of ore on the stockpile in excess of the next twelve months of planned mill production.
| 10. | INVESTMENTS |
The investments balance consists of:
(in thousands) | At December 31 2011 | At December 31 2010 | At January 1 2010 | |||||||||
Investments: | ||||||||||||
Available-for-sale securities at fair value | $ | 522 | $ | 2,955 | $ | 10,605 | ||||||
|
|
|
|
|
| |||||||
| $ | 522 | $ | 2,955 | $ | 10,605 | |||||||
|
|
|
|
|
| |||||||
At December 31 2011, investments consist of equity instruments in publicly traded companies at a fair value of $522,000 (December 31, 2010: $2,955,000 and January 1, 2010: $10,605,000).
Investment Sales, Purchases and Impairments
During 2010, the Company sold equity interests for cash consideration of $8,118,000. The resulting gain of $3,333,000 has been included in other income (expense) in the consolidated statements of operations (see note 24).
During 2010, the Company acquired additional equity interests at a cost of $17,000.
During 2011 and 2010, the Company recorded investment impairment charges of $896,000 and $181,000, respectively. The resulting loss has been included in other income (expense) in the consolidated statements of operations (see note 24).
54 | Denison Mines Corp. Annual Report 2011
NOTES TO THE CONSOLIDATED FINANCIAL STATEMENTS
| 11. | RESTRICTED CASH AND INVESTMENTS |
The Company has certain restricted cash and investments deposited to collateralize its reclamation obligations. The restricted cash and investments balance consists of:
(in thousands) | At December 31 2011 | At December 31 2010 | At January 1 2010 | |||||||||
Cash | $ | 1 | $ | 504 | $ | 23 | ||||||
Cash equivalents | 2,512 | 6,459 | 3,066 | |||||||||
Investments | 24,280 | 15,983 | 18,567 | |||||||||
|
|
|
|
|
| |||||||
| $ | 26,793 | $ | 22,946 | $ | 21,656 | |||||||
|
|
|
|
|
| |||||||
Restricted cash and investments — by item: | ||||||||||||
U.S. mill and mine reclamation | $ | 24,651 | $ | 20,315 | $ | 19,564 | ||||||
Elliot Lake reclamation trust fund | 2,142 | 2,631 | 2,092 | |||||||||
|
|
|
|
|
| |||||||
| $ | 26,793 | $ | 22,946 | $ | 21,656 | |||||||
|
|
|
|
|
| |||||||
U.S. Mill and Mine Reclamation
The Company has cash, cash equivalents and fixed income securities as collateral for various bonds posted in favour of the State of Utah, the applicable state regulatory agencies in Colorado and Arizona and the U.S. Bureau of Land Management for estimated reclamation costs associated with the White Mesa mill and U.S. mining properties. In 2011, the Company deposited an additional $3,200,000 into its collateral account (2010: $nil).
Elliot Lake Reclamation Trust Fund
The Company has the obligation to maintain its decommissioned Elliot Lake uranium mine pursuant to a Reclamation Funding Agreement effective December 21, 1995 (“Agreement”) with the Governments of Canada and Ontario. The Agreement, as further amended in February 1999, requires the Company to maintain funds in the Reclamation Trust Fund equal to estimated reclamation spending for the succeeding six calendar years, less interest expected to accrue on the funds during the period. Withdrawals from this Reclamation Trust Fund can only be made with the approval of the Governments of Canada and Ontario to fund Elliot Lake monitoring and site restoration costs. In 2011, the Company deposited an additional $706,000 (CAD$695,000) into the Elliot Lake Reclamation Trust Fund and withdrew $1,175,000 (CAD$1,163,000). In 2010, the Company deposited an additional $1,313,000 (CAD$1,358,000) into the Elliot Lake Reclamation Trust Fund and withdrew $918,000 (CAD$950,000).
| 12. | PROPERTY, PLANT AND EQUIPMENT |
The property, plant and equipment balance consists of:
(in thousands) | At December 31 2011 | At December 31 2010 | At January 1 2010 | |||||||||
Plant and equipment: | ||||||||||||
Cost | $ | 191,067 | $ | 171,782 | $ | 161,794 | ||||||
Construction-in-progress | 7,183 | 21,375 | 11,860 | |||||||||
Accumulated depreciation | (53,804 | ) | (43,314 | ) | (31,092 | ) | ||||||
|
|
|
|
|
| |||||||
Net book value | $ | 144,446 | $ | 149,843 | $ | 142,562 | ||||||
|
|
|
|
|
| |||||||
Mineral properties: | ||||||||||||
Cost | $ | 230,403 | $ | 193,727 | $ | 178,833 | ||||||
Accumulated amortization | (7,479 | ) | (1,406 | ) | — | |||||||
|
|
|
|
|
| |||||||
Net book value | $ | 222,924 | $ | 192,321 | $ | 178,833 | ||||||
|
|
|
|
|
| |||||||
Net book value | $ | 367,370 | $ | 342,164 | $ | 321,395 | ||||||
|
|
|
|
|
| |||||||
Denison Mines Corp. Annual Report 2011 | 55
NOTES TO THE CONSOLIDATED FINANCIAL STATEMENTS
The property, plant and equipment continuity summary is as follows:
(in thousands) | Cost | Accumulated Amortization / Depreciation | Net Book Value | |||||||||
Plant and equipment: | ||||||||||||
Balance — January 1, 2010 | $ | 173,654 | $ | (31,092 | ) | $ | 142,562 | |||||
Additions | 16,566 | — | 16,566 | |||||||||
Depreciation | — | (13,150 | ) | (13,150 | ) | |||||||
Disposals | (2,932 | ) | 1,466 | (1,466 | ) | |||||||
Transfers | (3 | ) | 3 | — | ||||||||
Reclamation adjustment | 778 | — | 778 | |||||||||
Foreign exchange | 5,094 | (541 | ) | 4,553 | ||||||||
|
|
|
|
|
| |||||||
Balance — December 31, 2010 | $ | 193,157 | $ | (43,314 | ) | $ | 149,843 | |||||
|
|
|
|
|
| |||||||
Additions | 8,297 | — | 8,297 | |||||||||
Amortization | — | (72 | ) | (72 | ) | |||||||
Business acquisition (note 6) | 70 | (44 | ) | 26 | ||||||||
Depreciation | — | (11,876 | ) | (11,876 | ) | |||||||
Disposals | (2,102 | ) | 1,131 | (971 | ) | |||||||
Reclamation adjustment | 1,046 | 60 | 1,106 | |||||||||
Foreign exchange | (2,218 | ) | 311 | (1,907 | ) | |||||||
|
|
|
|
|
| |||||||
Balance — December 31, 2011 | $ | 198,250 | $ | (53,804 | ) | $ | 144,446 | |||||
|
|
|
|
|
| |||||||
Mineral properties: | ||||||||||||
Balance — January 1, 2010 | $ | 178,833 | $ | — | $ | 178,833 | ||||||
Additions | 14,249 | — | 14,249 | |||||||||
Amortization | — | (1,397 | ) | (1,397 | ) | |||||||
Foreign exchange | 645 | (9 | ) | 636 | ||||||||
|
|
|
|
|
| |||||||
Balance — December 31, 2010 | $ | 193,727 | $ | (1,406 | ) | $ | 192,321 | |||||
|
|
|
|
|
| |||||||
Additions | 19,429 | — | 19,429 | |||||||||
Amortization | — | (6,078 | ) | (6,078 | ) | |||||||
Business acquisition (note 6) | 23,916 | — | 23,916 | |||||||||
Foreign exchange | (6,669 | ) | 5 | (6,664 | ) | |||||||
|
|
|
|
|
| |||||||
Balance — December 31, 2011 | $ | 230,403 | $ | (7,479 | ) | $ | 222,924 | |||||
|
|
|
|
|
| |||||||
Plant and Equipment – Mining
The Company has a 100% interest in the White Mesa mill located in Utah and mines located in Arizona, Colorado and Utah. Mined ore from these mines is processed at the White Mesa mill.
The Company has a 22.5% interest in the McClean Lake mill and mines located in the Athabasca Basin of Saskatchewan, Canada. The mill is currently on stand-by and is scheduled to remain so into 2013. A toll milling agreement has been signed with the participants in the Cigar Lake joint venture that provides for the processing of the future output of the Cigar Lake mine at the McClean Lake mill, for which the owners of the McClean Lake mill will receive a toll milling fee and other benefits. In determining the amortization rate for the McClean Lake mill, the amount to be amortized has been adjusted to reflect Denison’s expected share of future toll milling mill feed.
56 | Denison Mines Corp. Annual Report 2011
NOTES TO THE CONSOLIDATED FINANCIAL STATEMENTS
Plant and Equipment — Services and Other
The environmental services division of the Company provides mine decommissioning and decommissioned site monitoring services for third parties.
Mineral Properties
The Company has various interests in development and exploration projects located in Canada, the U.S., Mongolia and Zambia which are held directly or through option or joint venture agreements. Amounts spent on development projects are capitalized as mineral property assets. Exploration projects are expensed.
The most significant of the Company’s mineral property interests are as follows:
Canada
The Company has a 22.5% interest in the McClean Lake project and a 25.17% interest in the Midwest project located in the Athabasca Basin of Saskatchewan, Canada. These projects are in the development stage.
Other significant mineral property interests that the Company has in Canada, also located in the Athabasca Basin, but which are not yet in the development stage include:
| a) | Wheeler River — the Company has a 60% interest in the project; |
| b) | Moore Lake — the Company has a 75% interest in the project subject to a 2.5% net smelter return royalty; |
| c) | Wolly – the Company has a 22.5% interest in the project; and |
| d) | Park Creek – In the first quarter of 2006, the Company entered into an option agreement to earn up to a 75% interest in the project. The Company is required to incur exploration expenditures of CAD$2,800,000 over three years to earn an initial 49% interest and a further CAD$3,000,000 over six years to earn an additional 26% interest. As at December 31, 2011, the Company has incurred a total of CAD$4,219,000 towards the option and has earned a 49% ownership interest in the project under the phase-in ownership provisions of the agreement. |
United States
The Company has 100% interests in various mines in the Colorado Plateau, Arizona Strip, Henry Mountain and White Canyon mining districts located in Colorado, Arizona and Utah which are either in operations, development or on stand-by.
In June 2011, the Company acquired certain uranium deposits located in the White Canyon district in Utah in conjunction with its purchase of WCU (see note 6).
Mongolia
The Company currently has a 70% interest in and is the managing partner of the Gurvan Saihan Joint Venture company (“GSJV”) in Mongolia. The other parties to the GSJV are the Mongolian government and Geologorazvedka, a Russian entity, both with a 15% interest. The results of the GSJV have been 100% consolidated in these financial statements since the Company exercises control and its partners in the GSJV both have carried interests at this time.
Under the Nuclear Energy Law of Mongolia, the Mongolian participant in the GSJV is required to hold a 34% to 51% interest in the GSJV, depending on the amount of historic exploration that was funded by the government of Mongolia, to be acquired at no cost to the Mongolian participant. This interest will be held by Mon-Atom LLC, the Mongolian state-owned uranium company.
The Company and Mon-Atom are proceeding with restructuring the GSJV to meet the requirements of the Nuclear Energy Law, pending government reviews and authorizations. In November 2011, the Company finalized terms for the acquisition of the Russian participant’s share in the GSJV in preparation for this restructuring. Subject to receipt of the required approvals, this 15% share interest will be acquired by the Company for cash consideration of $727,000 and the release of the Russian participant’s share of unfunded joint venture obligations. The final restructuring of the GSJV will result in the Company having its 70% interest reduced. It is expected that the restructuring will be completed in 2012.
Zambia
The Company has a 100% interest in the Mutanga project located in Zambia.
Denison Mines Corp. Annual Report 2011 | 57
NOTES TO THE CONSOLIDATED FINANCIAL STATEMENTS
| 13. | INTANGIBLES |
The intangibles balance consists of:
(in thousands) | December 31 2011 | December 31 2010 | January 1 2010 | |||||||||
Cost | $ | 7,276 | $ | 7,439 | $ | 7,041 | ||||||
Accumulated amortization | (4,438 | ) | (3,645 | ) | (2,605 | ) | ||||||
|
|
|
|
|
| |||||||
Net book value | $ | 2,838 | $ | 3,794 | $ | 4,436 | ||||||
|
|
|
|
|
| |||||||
Net book value — by item: | ||||||||||||
UPC management services agreement | 2,838 | 3,794 | 4,436 | |||||||||
|
|
|
|
|
| |||||||
Net book value | $ | 2,838 | $ | 3,794 | $ | 4,436 | ||||||
|
|
|
|
|
| |||||||
The intangibles continuity summary is as follows:
(in thousands) | Cost | Accumulated Amortization | Net Book Value | |||||||||
Balance — January 1, 2010 | $ | 7,041 | $ | (2,605 | ) | $ | 4,436 | |||||
Amortization | — | (862 | ) | (862 | ) | |||||||
Foreign exchange | 398 | (178 | ) | 220 | ||||||||
|
|
|
|
|
| |||||||
Balance — December 31, 2010 | $ | 7,439 | $ | (3,645 | ) | $ | 3,794 | |||||
|
|
|
|
|
| |||||||
Amortization | — | (898 | ) | (898 | ) | |||||||
Foreign exchange | (163 | ) | 105 | (58 | ) | |||||||
|
|
|
|
|
| |||||||
Balance — December 31, 2011 | $ | 7,276 | $ | (4,438 | ) | $ | 2,838 | |||||
|
|
|
|
|
| |||||||
UPC Management Services Agreement
The UPC management services agreement is associated with the acquisition of DMI in 2006. The contract is being amortized over its eight year estimated useful life.
| 14. | GOODWILL |
The goodwill continuity summary is as follows:
(in thousands) | December 31 2011 | December 31 2010 | ||||||
Balance – beginning of period | $ | — | $ | — | ||||
Business acquisition (note 6) | 32,625 | — | ||||||
Impairment charge | (32,625 | ) | — | |||||
|
|
|
| |||||
Balance – end of period | $ | — | $ | — | ||||
|
|
|
| |||||
Goodwill – by business unit: | ||||||||
U.S. mining segment | $ | — | $ | — | ||||
|
|
|
| |||||
The Company’s acquisition of WCU in 2011 was accounted for using the purchase method (see note 6). The excess of the purchase price over the fair value of the net assets acquired has been recorded as goodwill. The goodwill was allocated to the Company’s U.S. mining segment.
Goodwill Impairment
The Company performs an impairment test annually or more frequently if there are impairment indicators for the carrying amounts of its CGUs. Where a CGU has goodwill allocated to it, the goodwill in that CGU must be tested annually for impairment.
In performing the CGU impairment test for the U.S. mining segment in 2011, the Company concluded that the recoverable amount of the CGU was lower than its carrying value. As a result, the Company has recognized an impairment loss of $32,625,000 which it has fully allocated to goodwill. The Company used a fair value less costs to sell cash flow model to determine the recoverable amount for the CGU. The future net cash flow model included estimates for commodity prices, recoverable reserves and resources, operating costs and capital costs.
58 | Denison Mines Corp. Annual Report 2011
NOTES TO THE CONSOLIDATED FINANCIAL STATEMENTS
Nominal uranium spot price projections used in the cash flow projection are within the range of current market consensus observed during the fourth quarter of 2011 and ranged from $54.00 to $81.00 per pound. All of these prices were discounted using a cumulative annual 2% inflation rate. The post tax discount rate used in the model was 9%.
| 15. | POST-EMPLOYMENT BENEFITS |
The Company provides post-employment benefits for former Canadian employees who retired on immediate pension prior to 1997. The post-employment benefits provided include life insurance and medical and dental benefits as set out in the applicable group policies but does not include pensions. No post-employment benefits are provided to employees outside the employee group referenced above. The post-employment benefit plan is not funded.
The effective date of the most recent actuarial valuation of the accrued benefit obligation is December 31, 2011. The amount accrued is based on estimates provided by the plan administrator which are based on past experience, limits on coverage as set out in the applicable group policies and assumptions about future cost trends. The significant assumptions used in the valuation are listed below:
| • | Discount rate of 3.65%; |
| • | Medical cost trend rates at 7.00% per annum initially, grading down to 4.50% per annum over 20 years and remaining at 4.50% per annum thereafter; and |
| • | Dental cost trend rates at 4.00% per annum for the first ten years, 3.50% per annum for the following ten years and 3.0% per annum thereafter. |
The post-employment benefits balance consists of:
(in thousands) | December 31 2011 | December 31 2010 | January 1 2010 | |||||||||
Accrued benefit obligation | $ | 3,685 | $ | 3,820 | $ | 3,594 | ||||||
Unamortized experience gain | 206 | 199 | 212 | |||||||||
|
|
|
|
|
| |||||||
| $ | 3,891 | $ | 4,019 | $ | 3,806 | |||||||
|
|
|
|
|
| |||||||
Post-employment benefits liability-by duration: | ||||||||||||
Current | $ | 393 | $ | 402 | $ | 380 | ||||||
Non-current | 3,498 | 3,617 | 3,426 | |||||||||
|
|
|
|
|
| |||||||
| $ | 3,891 | $ | 4,019 | $ | 3,806 | |||||||
|
|
|
|
|
| |||||||
The post-employment benefits continuity summary is as follows:
| $000,000 | ||||
(in thousands) | ||||
Balance — January 1, 2010 | $ | 3,806 | ||
Benefits paid | (266 | ) | ||
Interest cost | 286 | |||
Amortization of experience gain | (24 | ) | ||
Foreign exchange | 217 | |||
|
| |||
Balance — December 31, 2010 | $ | 4,019 | ||
|
| |||
Benefits paid | (304 | ) | ||
Interest cost | 285 | |||
Amortization of experience gain | (23 | ) | ||
Foreign exchange | (86 | ) | ||
|
| |||
Balance — December 31, 2011 | $ | 3,891 | ||
|
| |||
The unamortized experience gain is being amortized on a straight line basis over the average life expectancy of the retiree group of 9.5 years as per the December 31, 2011 actuarial valuation.
Denison Mines Corp. Annual Report 2011 | 59
NOTES TO THE CONSOLIDATED FINANCIAL STATEMENTS
| 16. | RECLAMATION OBLIGATIONS |
The reclamation obligations balance consists of:
(in thousands) | At December 31 2011 | At December 31 2010 | At January 1 2010 | |||||||||
Reclamation liability — by location: | ||||||||||||
U.S. Mill and Mines | $ | 7,140 | $ | 6,383 | $ | 8,609 | ||||||
Elliot Lake | 11,800 | 9,451 | 8,155 | |||||||||
McClean and Midwest Joint Ventures | 2,636 | 1,731 | 1,142 | |||||||||
|
|
|
|
|
| |||||||
| $ | 21,576 | $ | 17,565 | $ | 17,906 | |||||||
|
|
|
|
|
| |||||||
Reclamation and remediation liability — by duration: | ||||||||||||
Current | 622 | 641 | 752 | |||||||||
Non-current | 20,954 | 16,924 | 17,154 | |||||||||
|
|
|
|
|
| |||||||
| $ | 21,576 | $ | 17,565 | $ | 17,906 | |||||||
|
|
|
|
|
| |||||||
The reclamation obligations continuity summary is as follows:
| $000,000 | ||||
(in thousands) | ||||
Balance — January 1, 2010 | $ | 17,906 | ||
Accretion | 1,309 | |||
Expenditures incurred | (1,249 | ) | ||
Liability adjustments-income statement | (1,721 | ) | ||
Liability adjustments-balance sheet | 778 | |||
Foreign exchange | 542 | |||
|
| |||
Balance — December 31, 2010 | $ | 17,565 | ||
|
| |||
Accretion | 1,169 | |||
Business acquisition (see note 6) | 81 | |||
Expenditures incurred | (812 | ) | ||
Liability adjustments-income statement | 2,690 | |||
Liability adjustments-balance sheet | 1,106 | |||
Foreign exchange | (223 | ) | ||
|
| |||
Balance — December 31, 2011 | $ | 21,576 | ||
|
| |||
Site Restoration: U.S. Mill and Mines
The decommissioning and reclamation of the White Mesa mill and U.S. mines are subject to legal and regulatory requirements. Estimates of the costs of reclamation are reviewed periodically by the applicable regulatory authorities. The above accrual represents the Company’s best estimate of the present value of future reclamation costs, discounted at rates ranging from 4.98% to 5.67% (2010: 6.19% to 7.17%). As at December 31, 2011, the undiscounted amount of estimated future reclamation costs is $23,082,000 (December 31, 2010: $22,318,000). Reclamation costs are expected to be incurred between 2012 and 2040.
Site Restoration: Elliot Lake
The Elliot Lake uranium mine was closed in 1992 and capital works to decommission this site were completed in 1997. The remaining provision is for the estimated cost of monitoring the Tailings Management Areas at the Company and Stanrock sites and for treatment of water discharged from these areas. The Company conducts its activities at both sites pursuant to decommissioning licences issued by the Canadian Nuclear Safety Commission. The above accrual represents the Company’s best estimate of the present value of the total future reclamation cost based on assumptions as to levels of treatment, which will be required in the future, discounted at 5.41% (2010: 6.48%). As at December 31, 2011, the undiscounted amount of estimated future reclamation costs is $26,990,000 (CAD$27,448,000) (December 31, 2010: $26,497,000 (CAD$26,355,000)).
Spending on restoration activities at the Elliot Lake site is funded from monies in the Elliot Lake Reclamation Trust fund (see note 11).
60 | Denison Mines Corp. Annual Report 2011
NOTES TO THE CONSOLIDATED FINANCIAL STATEMENTS
Site Restoration: McClean Lake Joint Venture and Midwest Joint Venture
The McClean Lake and Midwest operations are subject to environmental regulations as set out by the Saskatchewan government and the Canadian Nuclear Safety Commission. Cost estimates of the estimated future decommissioning and reclamation activities are prepared periodically and filed with the applicable regulatory authorities for approval. The above accrual represents the Company’s best estimate of the present value of the future reclamation cost contemplated in these cost estimates discounted at 5.41% (2010: 6.48%). As at December 31, 2011, the undiscounted amount of estimated future reclamation costs is $9,105,000 (CAD$9,260,000) (2010: $9,125,000 (CAD$9,076,000)). Reclamation costs are expected to be incurred between 2025 and 2052.
Under the Mineral Industry Environmental Protection Regulations (1996), the Company is required to provide its pro-rata share of financial assurances to the Province. As at December 31, 2011, the Company has provided irrevocable standby letters of credit, from a chartered bank, in favour of Saskatchewan Environment, totalling CAD$9,698,000.
| 17. | DEBT OBLIGATIONS |
The debt obligations balance consists of:
(in thousands) | At December 31 2011 | At December 31 2010 | At January 1 2010 | |||||||||
Notes payable and other financing | $ | 221 | $ | 405 | $ | 1,064 | ||||||
|
|
|
|
|
| |||||||
| $ | 221 | $ | 405 | $ | 1,064 | |||||||
|
|
|
|
|
| |||||||
Debt obligations, by duration: | ||||||||||||
Current | 111 | 200 | 869 | |||||||||
Non-current | 110 | 205 | 195 | |||||||||
|
|
|
|
|
| |||||||
| $ | 221 | $ | 405 | $ | 1,064 | |||||||
|
|
|
|
|
| |||||||
Revolving Line of Credit
In June 2011, the Company entered into a revolving term credit facility (the “facility”) with the Bank of Nova Scotia for up to $35,000,000. The amount of the facility available is the lesser of $35,000,000 and a “borrowing base” amount which is determined quarterly and is based on a percentage of accounts receivable and inventory. At December 31, 2011, the amount of the facility available is $32,554,000. The maturity date of the facility is June 29, 2012. This facility replaced a previously existing $60,000,000 revolving term facility.
The facility contains one financial covenant based on maintaining a certain level of tangible net worth. It also has a defined working capital borrowing base calculation that sets limits on the amount of borrowings that the Company can have drawn under the facility at any given time. As at December 31, 2011, the Company was in compliance with its facility covenants.
DMC has provided an unlimited full recourse guarantee and a pledge of all of the shares of DMI. DMI has provided a first-priority security interest in all present and future personal property and an assignment of its rights and interests under all material agreements relative to the McClean Lake and Midwest projects. In addition, each of DMC’s material U.S. subsidiaries has provided an unlimited full recourse guarantee secured by a pledge of all of its shares and a first-priority security interest in all of its present and future personal property.
Interest payable under the facility is bankers acceptance or LIBOR rate plus a margin or prime rate plus a margin. The facility is subject to stand-by fees.
As at December 31, 2011, the Company has no outstanding borrowings under the facility (December 31, 2010 and January 1, 2010 – $nil). At December 31, 2011, approximately $9,536,000 of the facility is being utilized as collateral for certain letters of credit and is not available to draw upon (December 31, 2010 – $19,816,000). During 2011, the Company did not incur any interest under the facility.
The Company has deferred $98,000 (CAD$99,000) of incremental costs associated with the set-up of the facility. These costs are being amortized over the one year term of the facility. The unamortized portion of the asset is included in “prepaid expenses and other” on the consolidated balance sheet.
Scheduled Debt Obligation Maturities
The table below represents currently scheduled maturities of debt obligations over the next three years when it will be paid in full:
(in thousands) | ||||
2012 | $ | 111 | ||
2013 | 90 | |||
2014 | 20 | |||
|
| |||
| $ | 221 | |||
|
| |||
Denison Mines Corp. Annual Report 2011 | 61
NOTES TO THE CONSOLIDATED FINANCIAL STATEMENTS
| 18. | OTHER LIABILITIES |
The other liabilities balance consists of:
(in thousands) | At December 31 2011 | At December 31 2010 | At January 1 2010 | |||||||||
Unamortized fair value of toll milling contracts | $ | 982 | $ | 1,005 | $ | 951 | ||||||
Unamortized fair value of sales contracts | — | — | 313 | |||||||||
Other | 100 | 100 | 100 | |||||||||
|
|
|
|
|
| |||||||
| $ | 1,082 | $ | 1,105 | $ | 1,364 | |||||||
|
|
|
|
|
| |||||||
Other liabilities – by duration: | ||||||||||||
Current | — | — | 313 | |||||||||
Non-current | 1,082 | 1,105 | 1,051 | |||||||||
|
|
|
|
|
| |||||||
| $ | 1,082 | $ | 1,105 | $ | 1,364 | |||||||
|
|
|
|
|
| |||||||
Unamortized fair values of sales contracts are amortized to revenue as deliveries under the applicable contracts are made.
| 19. | INCOME TAXES |
The income tax recovery (expense) balance consists of:
(in thousands) | 2011 | 2010 | ||||||
Current income tax: | ||||||||
Based on taxable income for the period | — | — | ||||||
Prior period (under) over provision | (57 | ) | (355 | ) | ||||
|
|
|
| |||||
| (57 | ) | (355 | ) | |||||
|
|
|
| |||||
Deferred income tax: | ||||||||
Origination/reversal of temporary differences | 1,130 | (1,854 | ) | |||||
Tax benefit – previously unrecognized tax assets | 1,668 | 359 | ||||||
Write off on reorganization of WCU subsidiary | (565 | ) | — | |||||
Prior year (under) over provision | (1,137 | ) | 2,726 | |||||
|
|
|
| |||||
| 1,096 | 1,231 | |||||||
|
|
|
| |||||
Income tax recovery (expense) | $ | 1,039 | $ | 876 | ||||
|
|
|
| |||||
The Company operates in multiple industries and jurisdictions, and the related income is subject to varying rates of taxation. The combined Canadian tax rate reflects the federal and provincial tax rates in effect in Ontario, Canada for each applicable year. A reconciliation of the combined Canadian tax rate to the Company’s effective rate of income tax is as follows:
(in thousands) | 2011 | 2010 | ||||||
Income (loss) before taxes | $ | (71,908 | ) | $ | (6,222 | ) | ||
Combined Canadian tax rate(1) | 28.25 | % | 31.00 | % | ||||
|
|
|
| |||||
Income tax recovery (expense) at combined rate | 20,314 | 1,927 | ||||||
Difference in foreign tax rates | 4,867 | (3,202 | ) | |||||
Non-deductible amounts | (17,133 | ) | (4,602 | ) | ||||
Non-taxable amounts | 665 | 1,939 | ||||||
Previously unrecognized future tax assets | 1,668 | 359 | ||||||
Renunciation of tax attributes – flow-through shares | (1,080 | ) | (138 | ) | ||||
Change in deferred tax assets not recognized | (7,410 | ) | 309 | |||||
Prior year (under) over provision | (1,193 | ) | 2,373 | |||||
Other | 341 | 1,911 | ||||||
|
|
|
| |||||
Income tax recovery (expense) | $ | 1,039 | $ | 876 | ||||
|
|
|
| |||||
| (1) | The combined Canadian federal / provincial tax rate declined in 2011 to reflect: a) a 1.5% decrease in the federal tax rate from 18.0% to 16.5% effective January 1, 2011; and b) a 0.5% decrease in the Ontario tax rate from 12.0% to 11.5% effective July 1, 2011. |
62 | Denison Mines Corp. Annual Report 2011
NOTES TO THE CONSOLIDATED FINANCIAL STATEMENTS
The deferred income tax assets (liabilities) balance reported on the balance sheet is comprised of the temporary differences as presented below:
(in thousands) | December 31 2011 | December 31 2010 | January 1 2010 | |||||||||
Deferred income tax assets: | ||||||||||||
Property, plant and equipment | $ | 390 | $ | 924 | $ | 1,178 | ||||||
Deferred revenue | 373 | 1,378 | — | |||||||||
Post-employment benefits | 1,048 | 1,081 | 1,015 | |||||||||
Reclamation obligations | 6,879 | 5,643 | 2,478 | |||||||||
Other long-term liabilities | 265 | 270 | 367 | |||||||||
Tax loss carry forwards | 22,414 | 12,480 | — | |||||||||
Other | 3,984 | 3,038 | 2,560 | |||||||||
|
|
|
|
|
| |||||||
Deferred income tax assets – gross | 35,353 | 24,814 | 7,598 | |||||||||
Set-off against deferred income tax liabilities | (35,353 | ) | (24,814 | ) | (7,598 | ) | ||||||
|
|
|
|
|
| |||||||
Deferred income tax assets – per balance sheet | $ | — | $ | — | $ | — | ||||||
|
|
|
|
|
| |||||||
Deferred income tax liabilities: | ||||||||||||
Inventory | $ | (1,848 | ) | $ | (2,706 | ) | $ | (918 | ) | |||
Investments | (19 | ) | (188 | ) | (143 | ) | ||||||
Property, plant and equipment | (43,978 | ) | (32,427 | ) | (17,728 | ) | ||||||
Intangibles | (764 | ) | (1,021 | ) | (1,182 | ) | ||||||
Other | (1,491 | ) | (1,880 | ) | (1,689 | ) | ||||||
|
|
|
|
|
| |||||||
Deferred income tax liabilities – gross | (48,100 | ) | (38,222 | ) | (21,660 | ) | ||||||
Set-off of deferred income tax assets | 35,353 | 24,814 | 7,598 | |||||||||
|
|
|
|
|
| |||||||
Deferred income tax liabilities – per balance sheet | $ | (12,747 | ) | $ | (13,408 | ) | $ | (14,062 | ) | |||
|
|
|
|
|
| |||||||
The deferred income tax liability continuity summary is as follows:
(in thousands) | ||||
Balance – January 1, 2010 | $ | (14,062 | ) | |
Recognized in profit/loss | 1,231 | |||
Recognized in OCI | 383 | |||
Other, including foreign exchange gain/loss | (960 | ) | ||
|
| |||
Balance – December 31, 2010 | $ | (13,408 | ) | |
|
| |||
Recognized in profit/loss | 1,096 | |||
Recognized in OCI | 129 | |||
Recognized in equity | (1,461 | ) | ||
Acquired in business combination (note 6) | 565 | |||
Other, including foreign exchange gain/loss | 332 | |||
|
| |||
Balance – December 31, 2011 | $ | (12,747 | ) | |
|
| |||
Denison Mines Corp. Annual Report 2011 | 63
NOTES TO THE CONSOLIDATED FINANCIAL STATEMENTS
Management believes that it is not probable that sufficient taxable profit will be available in future years to allow the benefit of the following deferred tax assets to be utilized:
(in thousands) | December 31 2011 | December 31 2010 | January 1 2010 | |||||||||
Deferred income tax assets not recognized | ||||||||||||
Inventories | $ | — | $ | — | $ | 2,500 | ||||||
Deferred revenue | — | — | 1,302 | |||||||||
Investments | 177 | — | 772 | |||||||||
Property, plant and equipment | 8,386 | 8,209 | 6,487 | |||||||||
Reclamation obligations | — | — | 3,517 | |||||||||
Tax losses | 55,690 | 46,147 | 41,313 | |||||||||
Tax credits | 681 | 545 | 875 | |||||||||
Other deductible temporary differences | 7,517 | 6,185 | 4,629 | |||||||||
|
|
|
|
|
| |||||||
Deferred income tax assets not recognized | $ | 72,451 | $ | 61,086 | $ | 61,395 | ||||||
|
|
|
|
|
| |||||||
A geographic split of the Company’s tax losses and tax credits not recognized and the associated expiry dates of those losses and credits is as follows:
(in thousands) | Expiry Date | December 31 2011 | December 31 2010 | January 1 2010 | ||||||||||||
Tax losses – gross | ||||||||||||||||
Australia | Unlimited | $ | 5,664 | $ | 485 | 249 | ||||||||||
Canada | 2028–2031 | 42,468 | 38,337 | 21,215 | ||||||||||||
Mongolia | 2018–2019 | 436 | 504 | 417 | ||||||||||||
United States | 2026–2031 | 150,281 | 113,709 | 83,406 | ||||||||||||
Zambia | 2012–2021 | 8,963 | 5,813 | 5,618 | ||||||||||||
|
|
|
|
|
|
|
| |||||||||
Tax losses – gross | 207,812 | 158,848 | 110,905 | |||||||||||||
Tax benefit at tax rate of 25%–41.84% | 78,104 | 58,627 | 41,313 | |||||||||||||
Set-off against deferred tax liabilities | (22,414 | ) | (12,480 | ) | — | |||||||||||
|
|
|
|
|
|
|
| |||||||||
Total tax loss assets not recognized | 55,690 | 46,147 | 41,313 | |||||||||||||
|
|
|
|
|
|
|
| |||||||||
Tax credits | ||||||||||||||||
Canada | 2028–2031 | 681 | 545 | 536 | ||||||||||||
USA | Unlimited | — | — | 339 | ||||||||||||
|
|
|
|
|
|
|
| |||||||||
Total tax credit assets not recognized | $ | 681 | $ | 545 | $ | 875 | ||||||||||
|
|
|
|
|
|
|
| |||||||||
64 | Denison Mines Corp. Annual Report 2011
NOTES TO THE CONSOLIDATED FINANCIAL STATEMENTS
| 20. | SHARE CAPITAL |
Denison is authorized to issue an unlimited number of common shares without par value. A continuity summary of the issued and outstanding common shares and the associated dollar amounts is presented below:
(in thousands except share amounts) | Number of Common Shares | |||||||
Balance at January 1, 2010 | 339,720,415 | $ | 850,336 | |||||
|
|
|
| |||||
Issued for cash: | ||||||||
New issue gross proceeds | 26,400,000 | 64,769 | ||||||
New issue gross issue costs | — | (3,678 | ) | |||||
Exercise of stock options | 80,250 | 159 | ||||||
Fair value of stock options exercised | — | 95 | ||||||
|
|
|
| |||||
| 26,480,250 | 61,345 | |||||||
|
|
|
| |||||
Balance at December 31, 2010 | 366,200,665 | $ | 911,681 | |||||
|
|
|
| |||||
Issued for cash: | ||||||||
New issue gross proceeds | 18,300,000 | 66,024 | ||||||
New issue gross issue costs | — | (3,910 | ) | |||||
Exercise of stock options | 160,250 | 328 | ||||||
Fair value of stock options exercised | — | 189 | ||||||
|
|
|
| |||||
| 18,460,250 | 62,631 | |||||||
|
|
|
| |||||
Balance at December 31, 2011 | 384,660,915 | $ | 974,312 | |||||
|
|
|
| |||||
New Issues
In December 2010, the Company completed a private placement of 25,000,000 special warrants at a price of CAD$2.45 per special warrant for gross proceeds of $60,613,000 (CAD$61,250,000). Each special warrant entitled the holder to receive one common share of the Company within three days after the issuance of a final prospectus receipt by the applicable securities regulatory authorities. The final prospectus receipt was received by the Company on December 20, 2010 and, accordingly, all special warrants were converted into common shares.
In December 2010, the Company completed a private placement of 1,400,000 flow-through special warrants at a price of CAD$3.00 per flow-through special warrant for gross proceeds of $4,156,000 (CAD$4,200,000). Each flow-through special warrant entitled the holder to receive one flow-through common share of the Company within three days after the issuance of a final prospectus receipt by the applicable securities regulatory authorities. The final prospectus receipt was received by the Company on December 20, 2010 and, accordingly, all flow-through special warrants were converted into flow-through common shares.
In March 2011, the Company closed a public offering of 18,300,000 common shares at a price of CAD$3.55 per share for gross proceeds of $66,024,000 (CAD$64,965,000).
Flow-Through Share Issues
The Company finances a portion of its exploration programs through the use of flow-through share issuances. Income tax deductions relating to these expenditures are claimable by the investors and not by the Company.
In 2011, the Company has fully met its CAD$4,200,000 December 2010 flow-through share obligation. The Company renounced the income tax benefit of this issue to its subscribers in February 2011.
Denison Mines Corp. Annual Report 2011 | 65
NOTES TO THE CONSOLIDATED FINANCIAL STATEMENTS
| 21. | SHARE PURCHASE WARRANTS |
A continuity summary of the issued and outstanding share purchase warrants in terms of common shares of the Company and the associated dollar amounts is presented below:
(in thousands except share amounts) | Number of Common Shares Issuable |
| ||||||
Balance at January 1 and December 31, 2010 | 6,408,000 | $ | 5,830 | |||||
Warrants expired – March 2006 Series(1) | (6,408,000 | ) | (5,830 | ) | ||||
|
|
|
| |||||
Balance at December 31, 2011 | — | $ | — | |||||
|
|
|
| |||||
| (1) | The March 2006 series had an effective exercise price of CAD$10.42 per issuable share (CAD$30.00 per warrant adjusted for the 2.88 exchange ratio associated with the Denison and IUC merger) and expired on March 1, 2011. |
| 22. | STOCK OPTIONS |
The Company’s stock-based compensation plan (the “Plan”) provides for the granting of stock options up to 10% of the issued and outstanding common shares at the time of grant, subject to a maximum of 20 million common shares. As at December 31, 2011, an aggregate of 13,440,700 options have been granted (less cancellations) since the Plan’s inception in 1997.
Under the Plan, all stock options are granted at the discretion of the Company’s board of directors, including any vesting provisions if applicable. The term of any stock option granted may not exceed ten years and the exercise price may not be lower than the closing price of the Company’s shares on the last trading day immediately preceding the date of grant. In general, stock options granted under the Plan have five year terms and vesting periods up to thirty months.
A continuity summary of the stock options of the Company granted under the Plan is presented below:
| Number of Common Shares | Weighted- Average Exercise Price per Share (CAD$) | |||||||
Stock options outstanding – beginning of period | 6,286,089 | $ | 2.61 | |||||
Granted | 1,939,000 | 3.15 | ||||||
Exercised(1) | (160,250 | ) | 2.04 | |||||
Forfeitures | (510,600 | ) | 2.81 | |||||
Expiries | (89,825 | ) | 6.71 | |||||
|
|
|
| |||||
Stock options outstanding – end of period | 7,464,414 | $ | 2.70 | |||||
|
|
|
| |||||
Stock options exercisable – end of period | 5,476,914 | $ | 2.60 | |||||
|
|
|
| |||||
| (1) | The weighted average share price at the date of exercise was CAD$3.53. |
66 | Denison Mines Corp. Annual Report 2011
NOTES TO THE CONSOLIDATED FINANCIAL STATEMENTS
A summary of the Company’s stock options outstanding at December 31, 2011 is presented below:
Range of Exercise Prices per Share (CAD$) | Weighted- Average Remaining Contractual Life (Years) | Number of Common Shares | Weighted- Average Exercise Price per Share (CAD$) | |||||||||
Stock options outstanding | ||||||||||||
$1.37 to $2.49 | 2.48 | 4,769,876 | $ | 1.99 | ||||||||
$2.50 to $4.99 | 4.13 | 1,855,199 | 3.21 | |||||||||
$5.00 to $7.49 | 3.55 | 759,339 | 5.37 | |||||||||
$7.50 to $8.50 | 1.38 | 80,000 | 7.95 | |||||||||
|
|
|
|
|
| |||||||
Stock options outstanding – end of period | 2.98 | 7,464,414 | $ | 2.70 | ||||||||
|
|
|
|
|
| |||||||
Options outstanding at December 31, 2011 expire between February 2013 and October 2016.
The fair value of each option granted is estimated on the date of grant using the Black-Scholes option pricing model. The following table outlines the range of assumptions used in the model to determine the fair value of options granted:
| 2011 | 2010 | |||||||
Risk-free interest rate | 1.56%–2.34% | 2.48%–2.49% | ||||||
Expected stock price volatility | 90.7%–92.4% | 87.4%–90.1% | ||||||
Expected life | 3.7 years | 3.7–3.8 years | ||||||
Estimated forfeiture rate | 5.1% | 5.4% | ||||||
Expected dividend yield | — | — | ||||||
Fair value per share under options granted | CAD$0.99 – CAD$2.04 | CAD$0.88 – CAD$0.90 | ||||||
|
|
|
| |||||
Stock-based compensation is included as a component of general and administrative expense in the statement of income and is $3,333,000 for the year ended December 31, 2011 and $1,831,000 for the year ended December 31, 2010.
The fair values of stock options with vesting provisions are amortized on a straight line graded method basis as stock-based compensation expense over the applicable vesting periods. At December 31, 2011, the Company had an additional $1,259,000 in stock-based compensation expense to be recognized periodically to August 2013.
| 23. | ACCUMULATED OTHER COMPREHENSIVE INCOME |
The accumulated other comprehensive income balance consists of:
(in thousands) | At December 31 2011 | At December 31 2010 | At January 1 2010 | |||||||||
Cumulative foreign currency translation | $ | 11,336 | $ | 17,973 | $ | — | ||||||
Unrealized gains (losses) on investments | ||||||||||||
Gross | (319 | ) | 1,223 | 4,096 | ||||||||
Tax effect | — | (129 | ) | (512 | ) | |||||||
|
|
|
|
|
| |||||||
| $ | 11,017 | $ | 19,067 | $ | 3,584 | |||||||
|
|
|
|
|
| |||||||
Denison Mines Corp. Annual Report 2011 | 67
NOTES TO THE CONSOLIDATED FINANCIAL STATEMENTS
| 24. | SUPPLEMENTAL FINANCIAL INFORMATION |
The components of operating expenses are as follows:
| Year Ended | ||||||||
(in thousands) | December 31 2011 | December 31 2010 | ||||||
Cost of goods and services sold: | ||||||||
COGS – mineral concentrates | $ | (75,978 | ) | $ | (99,738 | ) | ||
Operating overheads: | ||||||||
Mining, other development expense | (43,822 | ) | (31,517 | ) | ||||
Milling, conversion expense | (61,372 | ) | (51,873 | ) | ||||
Mill feed cost: | ||||||||
– Stockpile depletion | (25,260 | ) | (29,723 | ) | ||||
– Mineral property amortization | (6,078 | ) | (1,397 | ) | ||||
Less absorption: | ||||||||
– Stockpiles, mineral properties | 42,936 | 30,202 | ||||||
– Concentrates | 87,425 | 76,740 | ||||||
Cost of services | (16,240 | ) | (14,926 | ) | ||||
Inventory – non-cash adjustments | (373 | ) | 12,636 | |||||
|
|
|
| |||||
Cost of goods and services sold | (98,762 | ) | (109,596 | ) | ||||
Reclamation obligations | ||||||||
Asset amortization | (72 | ) | — | |||||
Liability adjustments | (2,690 | ) | 1,721 | |||||
Post-employment benefits | ||||||||
Experience gain amortization | 23 | 24 | ||||||
Selling expenses | (1,547 | ) | (1,592 | ) | ||||
Sales royalties and capital taxes | (112 | ) | (2,325 | ) | ||||
|
|
|
| |||||
Operating expenses | $ | (103,160 | ) | $ | (111,768 | ) | ||
|
|
|
| |||||
The components of other income (expense) are as follows:
| Year Ended | ||||||||
(in thousands) | December 31 2011 | December 31 2010 | ||||||
Gains (losses) on: | ||||||||
Foreign exchange | $ | (1,390 | ) | $ | (11,926 | ) | ||
Disposal of property, plant and equipment | (191 | ) | 98 | |||||
Investment disposals | — | 3,333 | ||||||
Investment other than temporary losses | (896 | ) | (181 | ) | ||||
Restricted cash and investments – fair value change | 401 | 207 | ||||||
Contract settlement fee income(1) | — | 11,000 | ||||||
Other | 557 | (601 | ) | |||||
|
|
|
| |||||
Other income (expense) | $ | (1,519 | ) | $ | 1,930 | |||
|
|
|
| |||||
| (1) | In June 2010, the Company agreed to terminate one of its sales contracts in exchange for a termination fee of $11,000,000. The fee was payable in two instalments – $6,000,000 in June 2010 and $5,000,000 in March 2011. Both instalment payments have been received. |
68 | Denison Mines Corp. Annual Report 2011
NOTES TO THE CONSOLIDATED FINANCIAL STATEMENTS
The components of finance income (expense) are as follows:
| 00000000000 | 00000000000 | |||||||
| Year Ended | ||||||||
(in thousands) | December 31 2011 | December 31 2010 | ||||||
Interest income | $ | 1,498 | $ | 680 | ||||
Interest expense | (82 | ) | (27 | ) | ||||
Accretion expense – reclamation obligations | (1,169 | ) | (1,309 | ) | ||||
Accretion expense – post-employment benefits | (285 | ) | (286 | ) | ||||
|
|
|
| |||||
Finance income (expense) | $ | (38 | ) | $ | (942 | ) | ||
|
|
|
| |||||
A summary of depreciation expense recognized in the statement of operations is as follows:
| 00000000000 | 00000000000 | |||||||
| Year Ended | ||||||||
(in thousands) | December 31 2011 | December 31 2010 | ||||||
Operating expenses: | ||||||||
Mining, other development expense | $ | (5,554 | ) | $ | (5,588 | ) | ||
Milling, conversion expense | (5,613 | ) | (6,801 | ) | ||||
Cost of services | (411 | ) | (373 | ) | ||||
Mineral property exploration | (121 | ) | (202 | ) | ||||
General and administrative | (177 | ) | (186 | ) | ||||
|
|
|
| |||||
Depreciation expense – gross | $ | (11,876 | ) | $ | (13,150 | ) | ||
|
|
|
| |||||
A summary of employee benefits expense recognized in the statement of operations is as follows:
| 00000000000 | 00000000000 | |||||||
| Year Ended | ||||||||
(in thousands) | December 31 2011 | December 31 2010 | ||||||
Salaries and short-term employee benefits | $ | (32,162 | ) | $ | (31,910 | ) | ||
Share-based compensation | (3,333 | ) | (1,831 | ) | ||||
|
|
|
| |||||
Employee benefits expense | $ | (35,495 | ) | $ | (33,741 | ) | ||
|
|
|
| |||||
The change in non-cash working capital items in the consolidated statements of cash flows is as follows:
| 00000000000 | 00000000000 | |||||||
| Year Ended | ||||||||
(in thousands) | December 31 2011 | December 31 2010 | ||||||
Change in non-cash working capital items: | ||||||||
Trade and other receivables | $ | 6,758 | $ | (5,176 | ) | |||
Inventories | (23,304 | ) | (1,877 | ) | ||||
Prepaid expenses and other assets | (629 | ) | (283 | ) | ||||
Accounts payable and accrued liabilities | (5,667 | ) | 4,003 | |||||
Post-employment benefits | (304 | ) | (266 | ) | ||||
Reclamation obligations | (812 | ) | (1,249 | ) | ||||
Deferred revenue | (2,446 | ) | 152 | |||||
|
|
|
| |||||
Change in non-cash working capital items | $ | (26,404 | ) | $ | (4,696 | ) | ||
|
|
|
| |||||
Denison Mines Corp. Annual Report 2011 | 69
NOTES TO THE CONSOLIDATED FINANCIAL STATEMENTS
| 25. | SEGMENTED INFORMATION |
Business Segments
The Company operates in two primary segments – the Mining segment and the Services and Other segment. The Mining segment, which has been further subdivided by major geographic regions, includes activities related to exploration, evaluation and development, mining, milling and the sale of mineral concentrates. The Services and Other segment includes the results of the Company’s environmental services business, management fees and commission income earned from UPC and other customers and general corporate expenses not allocated to the other segments.
For the year ended December 31, 2011, business segment results were as follows:
(in thousands) | Canada Mining | U.S. Mining | Asia Mining | Africa Mining | Services and Other | Total | ||||||||||||||||||
Statement of Operations: | ||||||||||||||||||||||||
Revenues | 7,693 | 70,818 | — | — | 18,289 | 96,800 | ||||||||||||||||||
|
|
|
|
|
|
|
|
|
|
|
| |||||||||||||
Expenses: | ||||||||||||||||||||||||
Operating expenses | (10,618 | ) | (76,444 | ) | — | (32 | ) | (16,266 | ) | (103,160 | ) | |||||||||||||
Mineral property exploration | (6,783 | ) | (678 | ) | (3,971 | ) | (2,396 | ) | — | (13,828 | ) | |||||||||||||
General and administrative | — | (4,679 | ) | (891 | ) | (1,035 | ) | (10,933 | ) | (17,538 | ) | |||||||||||||
Goodwill impairment | — | (32,625 | ) | — | — | — | (32,625 | ) | ||||||||||||||||
|
|
|
|
|
|
|
|
|
|
|
| |||||||||||||
| (17,401 | ) | (114,226 | ) | (4,862 | ) | (3,463 | ) | (27,199 | ) | (167,151 | ) | |||||||||||||
|
|
|
|
|
|
|
|
|
|
|
| |||||||||||||
Segment income (loss) | (9,708 | ) | (43,408 | ) | (4,862 | ) | (3,463 | ) | (8,910 | ) | (70,351 | ) | ||||||||||||
|
|
|
|
|
|
|
|
|
|
|
| |||||||||||||
Revenues—supplemental: | ||||||||||||||||||||||||
Uranium concentrates | 7,693 | 56,148 | — | — | — | 63,841 | ||||||||||||||||||
Vanadium concentrates | — | 11,551 | — | — | — | 11,551 | ||||||||||||||||||
Environmental services | — | — | — | — | 16,190 | 16,190 | ||||||||||||||||||
Management fees and commissions | — | — | — | — | 2,099 | 2,099 | ||||||||||||||||||
Alternate feed processing and other | — | 3,119 | — | — | — | 3,119 | ||||||||||||||||||
|
|
|
|
|
|
|
|
|
|
|
| |||||||||||||
| 7,693 | 70,818 | — | — | 18,289 | 96,800 | |||||||||||||||||||
|
|
|
|
|
|
|
|
|
|
|
| |||||||||||||
Capital additions: | ||||||||||||||||||||||||
Property, plant and equipment | 732 | 23,450 | 610 | 1,650 | 1,284 | 27,726 | ||||||||||||||||||
|
|
|
|
|
|
|
|
|
|
|
| |||||||||||||
Long-lived assets: | ||||||||||||||||||||||||
Plant and equipment | ||||||||||||||||||||||||
Cost | 90,048 | 101,905 | 485 | 968 | 4,844 | 198,250 | ||||||||||||||||||
Accumulated depreciation | (8,676 | ) | (41,964 | ) | (388 | ) | (630 | ) | (2,146 | ) | (53,804 | ) | ||||||||||||
Mineral properties | 72,094 | 64,633 | 8,222 | 77,975 | — | 222,924 | ||||||||||||||||||
Intangibles | — | — | — | — | 2,838 | 2,838 | ||||||||||||||||||
|
|
|
|
|
|
|
|
|
|
|
| |||||||||||||
| 153,466 | 124,574 | 8,319 | 78,313 | 5,536 | 370,208 | |||||||||||||||||||
|
|
|
|
|
|
|
|
|
|
|
| |||||||||||||
70 | Denison Mines Corp. Annual Report 2011
NOTES TO THE CONSOLIDATED FINANCIAL STATEMENTS
For the year ended December 31, 2010, business segment results were as follows:
(in thousands) | Canada Mining | U.S. Mining | Asia Mining | Africa Mining | Services and Other | Total | ||||||||||||||||||
Statement of Operations: | ||||||||||||||||||||||||
Revenues | 32,820 | 77,432 | — | — | 18,068 | 128,320 | ||||||||||||||||||
|
|
|
|
|
|
|
|
|
|
|
| |||||||||||||
Expenses: | ||||||||||||||||||||||||
Operating expenses | (31,877 | ) | (64,892 | ) | — | — | (14,999 | ) | (111,768 | ) | ||||||||||||||
Mineral property exploration | (6,039 | ) | (566 | ) | (970 | ) | (44 | ) | — | (7,619 | ) | |||||||||||||
General and administrative | — | (4,832 | ) | (1,035 | ) | (1,071 | ) | (9,205 | ) | (16,143 | ) | |||||||||||||
|
|
|
|
|
|
|
|
|
|
|
| |||||||||||||
| (37,916 | ) | (70,290 | ) | (2,005 | ) | (1,115 | ) | (24,204 | ) | (135,530 | ) | |||||||||||||
|
|
|
|
|
|
|
|
|
|
|
| |||||||||||||
Segment income (loss) | (5,096 | ) | 7,142 | (2,005 | ) | (1,115 | ) | (6,136 | ) | (7,210 | ) | |||||||||||||
|
|
|
|
|
|
|
|
|
|
|
| |||||||||||||
Revenues—supplemental: | ||||||||||||||||||||||||
Uranium concentrates | 32,820 | 55,158 | — | — | — | 87,978 | ||||||||||||||||||
Vanadium concentrates | — | 16,934 | — | — | — | 16,934 | ||||||||||||||||||
Environmental services | — | — | — | — | 15,492 | 15,492 | ||||||||||||||||||
Management fees and commissions | — | — | — | — | 2,576 | 2,576 | ||||||||||||||||||
Alternate feed processing and other | — | 5,340 | — | — | — | 5,340 | ||||||||||||||||||
|
|
|
|
|
|
|
|
|
|
|
| |||||||||||||
| 32,820 | 77,432 | — | — | 18,068 | 128,320 | |||||||||||||||||||
|
|
|
|
|
|
|
|
|
|
|
| |||||||||||||
Capital additions: | ||||||||||||||||||||||||
Property, plant and equipment | 872 | 26,929 | 550 | 1,353 | 1,111 | 30,815 | ||||||||||||||||||
|
|
|
|
|
|
|
|
|
|
|
| |||||||||||||
Long-lived assets: | ||||||||||||||||||||||||
Plant and equipment | ||||||||||||||||||||||||
Cost | 91,687 | 96,076 | 533 | 749 | 4,112 | 193,157 | ||||||||||||||||||
Accumulated depreciation | (8,773 | ) | (31,693 | ) | (381 | ) | (467 | ) | (2,000 | ) | (43,314 | ) | ||||||||||||
Mineral properties | 73,087 | 29,981 | 8,581 | 80,672 | — | 192,321 | ||||||||||||||||||
Intangibles | — | — | — | — | 3,794 | 3,794 | ||||||||||||||||||
|
|
|
|
|
|
|
|
|
|
|
| |||||||||||||
| 156,001 | 94,364 | 8,733 | 80,954 | 5,906 | 345,958 | |||||||||||||||||||
|
|
|
|
|
|
|
|
|
|
|
| |||||||||||||
Revenue Concentration
The Company’s business is such that, at any given time, it sells its uranium and vanadium concentrates to and enters into process milling arrangements and other services with a relatively small number of customers. During 2011, four customers from the mining segment and one customer from the services and other segment accounted for approximately 69% of total revenues consisting of 23%, 13%, 11%, 11% and 11% individually. During 2010, three customers from the mining segment accounted for approximately 35% of total revenues consisting of 15%, 10% and 10% individually.
Denison Mines Corp. Annual Report 2011 | 71
NOTES TO THE CONSOLIDATED FINANCIAL STATEMENTS
| 26. | RELATED PARTY TRANSACTIONS |
Uranium Participation Corporation
The Company is a party to a management services agreement with UPC. Under the terms of the agreement, the Company receives the following fees from UPC: a) a commission of 1.5% of the gross value of any purchases or sales of uranium completed at the request of the Board of Directors of UPC; b) a minimum annual management fee of CAD$400,000 (plus reasonable out-of-pocket expenses) plus an additional fee of 0.3% per annum based upon UPC’s net asset value between CAD$100,000,000 and CAD$200,000,000 and 0.2% per annum based upon UPC’s net asset value in excess of CAD$200,000,000; c) a fee of CAD$200,000 upon the completion of each equity financing where proceeds to UPC exceed CAD$20,000,000; d) a fee of CAD$200,000 for each transaction or arrangement (other than the purchase or sale of uranium) of business where the gross value of such transaction exceeds CAD$20,000,000 (“an initiative”); e) an annual fee up to a maximum of CAD$200,000, at the discretion of the Board of Directors of UPC, for on-going maintenance or work associated with an initiative; and f) a fee equal to 1.5% of the gross value of any uranium held by UPC prior to the completion of any acquisition of at least 90% of the common shares of UPC.
In accordance with the management services agreement, all uranium investments owned by UPC are held in accounts with conversion facilities in the name of DMI as manager for and on behalf of UPC.
From time to time, the Company has also provided temporary revolving credit facilities to UPC which generate interest and stand-by fee income and sold uranium concentrates to UPC.
The following transactions were incurred with UPC for the periods noted:
| Year Ended | ||||||||
(in thousands) | December 31 2011 | December 31 2010 | ||||||
Revenue: | ||||||||
Management fees | $ | 1,913 | $ | 1,614 | ||||
Commission and transaction fees | — | 962 | ||||||
|
|
|
| |||||
| $ | 1,913 | $ | 2,576 | |||||
|
|
|
| |||||
At December 31, 2011, accounts receivable includes $226,000 (December 31, 2010: $281,000) due from UPC with respect to the fees and transactions indicated above.
On January 3, 2011, the Company borrowed 150,000 pounds of U3O8 from UPC pursuant to a uranium concentrate loan agreement between the parties. As collateral for the loan, the Company issued an irrevocable stand-by letter of credit in favour of UPC in the amount of $12,045,000. On March 30, 2011, the Company repaid 150,000 pounds of U3O8 to UPC. Loan fees incurred by the Company under the agreement were $91,000. In 2011, the loan fees have been paid and the irrevocable stand-by letter of credit has been cancelled.
Korea Electric Power Corporation (“KEPCO”)
In June 2009, Denison completed definitive agreements with KEPCO. The agreements included a long-term offtake agreement which provides for the delivery to KEPCO of 20% of Denison’s annual U3O8 production (±10%) but not less than 350,000 pounds (±10%) per year from 2010 to 2015 inclusive. This agreement also provides for the purchase of 20% of production after 2015 subject to certain conditions. KEPCO also purchased 58,000,000 common shares of Denison representing approximately 17% of the issued and outstanding capital as at June 2009. Pursuant to a strategic relationship agreement, KEPCO is entitled to subscribe for additional common shares in Denison’s future share offerings and require Denison to nominate two persons designated by KEPCO to Denison’s board of directors if KEPCO holds at least a 15% share interest in Denison (or one director if KEPCO’s share interest is between 5% and 15%). Currently, KEPCO’s interest in Denison has dropped to approximately 15.08%. Under the strategic relationship agreement, two representatives from KEPCO have been appointed to Denison’s board of directors.
Other
During 2011, the Company has incurred management and administrative service fees and other expenses of $176,000 (2010: $82,000) with a company owned by the Chairman of the Company which provides corporate development, office premises, secretarial and other services. At December 31, 2011, an amount of $nil (December 31, 2010: $nil) was due to this company.
In December 2010, the Company agreed to make a donation of $658,000 to the Lundin Foundation, a not-for-profit organization with a common director. The Lundin Foundation has programs in Zambia, Mongolia as well as many other countries. The donation was made in February 2011.
Compensation of Key Management Personnel
Key management personnel are those persons having authority and responsibility for planning, directing and controlling the activities of the Company, directly or indirectly. Key management personnel includes the Company’s executive officers, vice-presidents and members of its board of directors.
72 | Denison Mines Corp. Annual Report 2011
NOTES TO THE CONSOLIDATED FINANCIAL STATEMENTS
The following compensation was awarded to key management personnel:
| $2,2100000 | $2,2100000 | |||||||
| Year Ended | ||||||||
(in thousands) | December 31 2011 | December 31 2010 | ||||||
Salaries and short-term employee benefits | $ | 2,210 | $ | 2,855 | ||||
Share-based compensation | 1,872 | 690 | ||||||
Termination benefits | — | 150 | ||||||
|
|
|
| |||||
Key management personnel compensation | $ | 4,082 | $ | 3,695 | ||||
|
|
|
| |||||
| 27. | CAPITAL MANAGEMENT AND FINANCIAL RISK |
Capital Management
The Company’s capital includes cash and cash equivalents and debt obligations. The Company’s primary objective with respect to its capital management is to ensure that it has sufficient capital to maintain its ongoing operations, to provide returns for shareholders and benefits for other stakeholders and to pursue growth opportunities.
Planning, annual budgeting and controls over major investment decisions are the primary tools used to manage the Company’s capital. The Company’s cash is managed centrally and disbursed to the various regions via a system of cash call requests which are reviewed by the key decision makers.
The Company manages its capital by review of the following measure:
| Year Ended | ||||||||
(in thousands) | At December 31 2011 | At December 31 2010 | ||||||
Net cash: | ||||||||
Cash and cash equivalents | $ | 53,515 | $ | 97,554 | ||||
Debt obligations – current | (111 | ) | (200 | ) | ||||
Debt obligations – long term | (110 | ) | (205 | ) | ||||
|
|
|
| |||||
Net cash | 53,294 | 97,149 | ||||||
|
|
|
| |||||
Financial Risk
The Company examines the various financial risks to which it is exposed and assesses the impact and likelihood of those risks. These risks may include credit risk, liquidity risk, currency risk, interest rate risk and price risk.
(a) Credit Risk
Credit risk is the risk of loss due to a counterparty’s inability to meet its obligations under a financial instrument that will result in a financial loss to the Company. The Company believes that the carrying amount its cash and cash equivalents, trade and other receivables and restricted cash and investments represents its maximum credit exposure.
The maximum exposure to credit risk at the reporting dates is as follows:
| 4000000000 | 4000000000 | |||||||
(in thousands) | 2011 | 2010 | ||||||
Cash and cash equivalents | $ | 53,515 | $ | 97,554 | ||||
Trade and other receivables | 12,652 | 20,236 | ||||||
Restricted cash and investments | 26,793 | 22,946 | ||||||
|
|
|
| |||||
| $ | 92,960 | $ | 140,736 | |||||
|
|
|
| |||||
The Company limits cash and cash equivalent and restricted cash and investment risk by dealing with credit worthy financial institutions.
Typically, the majority of the Company’s trade and other receivables balance is related to the sale of mineral concentrates. These sales typically occur to a small number of customers who are credit worthy and with whom the Company has established a relationship with through its past dealings.
Denison Mines Corp. Annual Report 2011 | 73
NOTES TO THE CONSOLIDATED FINANCIAL STATEMENTS
(b) Liquidity Risk
Liquidity risk is the risk that the Company will encounter difficulties in meeting obligations associated with its financial liabilities. The Company has in place a planning and budgeting process to help determine the funds required to support the Company’s normal operating requirements on an ongoing basis. The Company ensures that there is sufficient committed capital to meet its short-term business requirements, taking into account its anticipated cash flows from operations, its holdings of cash and cash equivalents and its access to credit facilities, if required.
The maturities of the Company’s financial liabilities are as follows:
| $9,272 | $9,272 | |||||||
(in thousands) | Within 1 Year | 1 to 5 Years | ||||||
Accounts payable and accrued liabilities | $ | 9,272 | $ | — | ||||
Debt obligations (Note 13) | 111 | 110 | ||||||
|
|
|
| |||||
| $ | 9,383 | $ | 110 | |||||
|
|
|
| |||||
(c) Currency Risk
Foreign exchange risk is the risk that the fair value of future cash flows of a financial instrument will fluctuate because of changes in foreign exchange rates. The Company operates internationally and is exposed to foreign exchange risk arising from various currency exposures. The Company’s mineral concentrate revenues are denominated in U.S. dollars while a number of its subsidiaries incur operating and capital costs denominated in local currencies. Foreign exchange risk also arises from assets and liabilities that are denominated in a currency that is not the functional currency for the relevant subsidiary company.
Currently, the Company does not have any foreign exchange hedge programs in place and manages its operational foreign exchange requirements through spot purchases in the foreign exchange markets.
The impact of the U.S. dollar strengthening by 10% at December 31, 2011 against the Company’s foreign currencies, with all other variables held constant, is as follows:
| Dec. 31, 2011 | Sensitivity | Change in | ||||||||||
(in thousands except foreign exchange rates) | Foreign Ex- Change Rate | Foreign Ex- Change Rate | net income (loss) | |||||||||
Currency risk | ||||||||||||
Canadian dollar (“CAD”) | 1.0170 | 1.1187 | $ | 17,582 | ||||||||
Zambian kwacha (“ZMK”) | 5,186.72 | 5,705.39 | 484 | |||||||||
Mongolian tugrog (“MNT”) | 1,380.07 | 1,518.08 | 769 | |||||||||
|
|
|
|
|
| |||||||
| $ | 18,835 | |||||||||||
|
|
|
|
|
| |||||||
(d) Interest Rate Risk
Interest rate risk is the risk that the fair value or future cash flows of a financial instrument will fluctuate because of changes in market interest rates. The Company is exposed to interest rate risk on its liabilities through its outstanding borrowings and on its assets through its investments in debt instruments. The Company monitors its exposure to interest rates and has not entered into any derivative contracts to manage this risk.
(e) Price Risk
The Company is exposed to equity price risk as a result of holding equity investments in other exploration and mining companies. The Company does not actively trade these investments. The sensitivity analysis below has been determined based on the exposure to equity price risk at December 31, 2011:
| $52 | $52 | |||||||
(in thousands) | Change in net income (loss) | Change in comprehensive income (loss) | ||||||
Equity price risk | ||||||||
10% increase in equity prices | $ | — | $ | 52 | ||||
|
|
|
| |||||
74 | Denison Mines Corp. Annual Report 2011
NOTES TO THE CONSOLIDATED FINANCIAL STATEMENTS
The Company is also exposed to commodity price risk on the commodities it produces and sells. The impact on income (loss) before tax from a 10% increase in the spot prices at December 31, 2011, with all other variables held constant, is as follows:
(in thousands except commodity prices) | Dec. 31, 2011 USD$ spot price per lb | Sensitivity USD$ spot price per lb increase | Change in pre-tax net income (loss) | |||||||||
Commodity price risk | ||||||||||||
Uranium | 51.75 | 5.175 | $ | 4,040 | ||||||||
Vanadium | 5.75 | 0.575 | 1,005 | |||||||||
|
|
|
|
|
| |||||||
| $ | 5,045 | |||||||||||
|
|
|
|
|
| |||||||
Fair Value of Financial Instruments
IFRS requires disclosures about the inputs to fair value measurements, including their classification within a hierarchy that prioritizes the inputs to fair value measurement. The three levels of the fair value hierarchy are:
| • | Level 1 – Unadjusted quoted prices in active markets for identical assets or liabilities; |
| • | Level 2 – Inputs other than quoted prices that are observable for the asset or liability either directly or indirectly; and |
| • | Level 3 – Inputs that are not based on observable market data. |
The fair value of financial instruments which trade in active markets (such as available-for-sale securities) is based on quoted market prices at the balance sheet date. The quoted marked price used to value financial assets held by the Company is the current bid price.
Except as otherwise disclosed, the fair values of cash and cash equivalents, trade and other receivables, accounts payable and accrued liabilities, restricted cash and cash equivalents and debt obligations approximate their carrying values as a result of the short-term nature of the instruments, or the variable interest rate associated with the instruments, or the fixed interest rate of the instruments being similar to market rates.
The following table illustrates the classification of the Company’s financial assets within the fair value hierarchy as at December 31, 2011:
Financial | Fair | December 31, 2011 | ||||||||||||||
(in thousands) | Fair Value | Carrying Value | ||||||||||||||
Financial Assets: | ||||||||||||||||
Cash and equivalents | Category D | $ | 53,515 | $ | 53,515 | |||||||||||
Trade and other receivables | Category D | 12,652 | 12,652 | |||||||||||||
Investments | ||||||||||||||||
Equity instruments | Category B | Level 1 | 522 | 522 | ||||||||||||
Restricted cash and equivalents | ||||||||||||||||
Elliot Lake reclamation trust fund | Category C | 2,142 | 2,142 | |||||||||||||
U.S. mill and mine reclamation | Category A | Level 1 | 24,651 | 24,651 | ||||||||||||
|
|
|
|
|
|
|
| |||||||||
| $ | 93,482 | $ | 93,482 | |||||||||||||
|
|
|
|
|
|
|
| |||||||||
Financial Liabilities: | ||||||||||||||||
Account payable and accrued liabilities | Category E | 9,272 | 9,272 | |||||||||||||
Debt obligations | Category E | 221 | 221 | |||||||||||||
|
|
|
|
|
|
|
| |||||||||
| $ | 9,493 | $ | 9,493 | |||||||||||||
|
|
|
|
|
|
|
| |||||||||
| (1) | Financial instrument designations are as follows: Category A=Financial assets and liabilities at fair value through profit and loss; Category B=Available-for-sale investments; Category C=Held-to-maturity investments; Category D=Loans and receivables; and Category E=Financial liabilities at amortized cost. |
Denison Mines Corp. Annual Report 2011 | 75
NOTES TO THE CONSOLIDATED FINANCIAL STATEMENTS
| 28. | COMMITMENTS AND CONTINGENCIES |
General Legal Matters
The Company is involved, from time to time, in various legal actions and claims in the ordinary course of business. In the opinion of management, the aggregate amount of any potential liability is not expected to have a material adverse effect on the Company’s financial position or results.
Third Party Indemnities
The Company has agreed to indemnify Calfrac Well Services against any future liabilities it may incur related to the assets or liabilities transferred to the Company on March 8, 2004.
Performance Bonds and Letters of Credit
In conjunction with various contracts, reclamation and other performance obligations, the Company may be required to issue performance bonds and letters of credit as security to creditors to guarantee the Company’s performance. Any potential payments which might become due under these items would be related to the Company’s non-performance under the applicable contract. As at December 31, 2011, the Company had outstanding bonds and letters of credit of $33,062,000 of which $24,651,000 is collateralized by restricted cash and investments (see note 11) and $9,536,000 is collateralized by a reduction in the Company’s line of credit limit available for general corporate purposes (see note 16 and 17).
Others
The Company has committed to payments under various operating leases and other commitments. The future minimum payments are as follows:
(in thousands) | ||||
2012 | $ | 7,610 | ||
2013 | 3,629 | |||
2014 | 1,888 | |||
2015 | 597 | |||
2016 | 158 | |||
2017 and thereafter | 16 | |||
|
| |||
| $ | 13,898 | |||
|
| |||
76 | Denison Mines Corp. Annual Report 2011
Corporate Information
Offices | ||||||
Head Office | ||||||
Denison Mines Corp. | ||||||
Atrium on Bay | ||||||
Board Of Directors | 595 Bay Street, Suite 402 | |||||
Toronto, Ontario M5G 2C2 | ||||||
Joo-Ok Chang | Telephone: 416-979-1991 | |||||
Seoul, Korea | Officers | Facsimile: 416-979-5893 | ||||
John H. Craig | Lukas H. Lundin | Website: www.denisonmines.com | ||||
Ontario, Canada | Chairman | Denison Mines Corp. | ||||
W. Robert Dengler | Ron F. Hochstein | 885 West Georgia Street, Suite 2000 | Stock Exchange Listings | |||
Ontario, Canada | President and | Vancouver, British Columbia V6C 3E8 | The Toronto Stock Exchange (TSX) | |||
Brian D. Edgar | Chief Executive Officer | Telephone: 604-689-7842 | Trading Symbol: DML | |||
British Columbia, Canada | James R. Anderson | Toll Free: 1-888-689-7842 | NYSE Amex LLC | |||
Executive Vice President and | Facsimile: 604-689-4250 | Trading Symbol: DNN | ||||
Ron F. Hochstein | Chief Financial Officer | Denison Mines Corp. | ||||
British Columbia, Canada | 230 – 22nd Street East, Suite 200 | SHARE REGISTRAR AND | ||||
Harold R. Roberts | TRANSFER AGENT | |||||
Tae-Wan Kim | Executive Vice President, | Saskatoon, Saskatchewan S7K 0E9 | Computershare Investor Services Inc. | |||
Seoul, Korea | U.S. Operations | Telephone: 306-652-8200 | 100 University Avenue, 9th Floor | |||
Lukas H. Lundin | Facsimile: 306-652-8202 | Toronto, Ontario M5J 2Y1 | ||||
Philip G. Buck | ||||||
British Columbia, Canada | Vice President, U.S. Mining | Denison Environmental | Telephone: 1-800-564-6253 | |||
William A. Rand | Donald C. Campbell | Services | AUDITOR | |||
British Columbia, Canada | Vice President, Commercial | 1 Horne Walk, Suite 200 | PricewaterhouseCoopers LLP | |||
Catherine J.G. Stefan | Elliot Lake, Ontario P5A 2A5 | PwC Tower | ||||
Ontario, Canada | David C. Frydenlund | Telephone: 705-848-9191 | 18 York Street, Suite 2600 | |||
Vice President, U.S. Legal | Facsimile: 705-848-5814 | Toronto, Ontario M5J 0B2 | ||||
and Regulatory Affairs & | Website: | Telephone: 416-863-1133 | ||||
Corporate Secretary | www.denisonenvironmental.com | ADDITIONAL INFORMATION | ||||
Curt D. Steel | Denison Mines (USA) Corp. | Further information about Denison | ||||
Vice President, | 1050 Seventeenth Street, Suite 950 | is available by contacting Investor | ||||
Sales and Marketing | Denver, Colorado 80265 | Relations at the head office listed | ||||
Sheila Colman | Telephone: 303-628-7798 | above or by email to: | ||||
Canadian Counsel & | Facsimile: 303-389-4125 | info@denisonmines.com | ||||
Assistant Corporate Secretary | Denison Mines Mongolia XXK | |||||
Michael J. Schoonderwoerd | Str. Olympia 8, Shuren Building | |||||
Controller | Sukhbaatar District | |||||
Ulaanbaatar 13, Mongolia | ||||||
Telephone: +976-11-330502 | ||||||
Facsimile: +976-11-318660 | ||||||
Denison Mines Zambia Limited | ||||||
Plot 230 Kasangula Road | ||||||
Roma, Lusaka, Zambia | ||||||
Telephone: +260-211-294-292 | ||||||
Facsimile: +260-211-294-296 | ||||||

Denison Mines Corp.
Atrium on Bay
595 Bay Street Suite 402
Toronto Ontario M5G 2C2
T 416 979 1991 F 416 979 5893
www.denisonmines.com
TSX: DML