EXHIBIT 99.3
Filed by August Technology Corporation
Pursuant to Rule 14a-12 Under the Securities Exchange Act of 1934
Subject Company: August Technology Corporation
Commission File No. 000-30637
Powerpoint Presentation to Employees of
August Technology Corporation
on June 28, 2005
Additional Information and Where to Find It
In connection with the proposed transaction, a registration statement of Rudolph Technologies, Inc., which will include a joint proxy statement of Rudolph and August, and other materials, will be filed with the SEC. WE URGE INVESTORS TO READ THE REGISTRATION STATEMENT AND JOINT PROXY STATEMENT AND THESE OTHER MATERIALS CAREFULLY WHEN THEY BECOME AVAILABLE BECAUSE THEY WILL CONTAIN IMPORTANT INFORMATION ABOUT RUDOLPH, AUGUST AND THE PROPOSED TRANSACTION. Investors will be able to obtain free copies of the registration statement and joint proxy statement (when available) as well as other filed documents containing information about Rudolph and August at http://www.sec.gov, the SEC’s website. Free copies of Rudolph’s SEC filings may also be obtained at http://www.rudolphtech.com, and free copies of August’s SEC filings may be obtained from August’s website at http://www.augusttech.com.
Participants in the Solicitation
Rudolph, August and their respective executive officers and directors may be deemed, under SEC rules, to be participants in the solicitation of proxies from Rudolph’s stockholders or August’s shareholders with respect to the proposed transaction. Information regarding the officers and directors of Rudolph is included in its definitive proxy statement for its 2005 Annual Meeting filed with the SEC on April 22, 2005. Information regarding the officers and directors of August is included in its definitive proxy statement for its 2005 Annual Meeting filed with the SEC on April 29, 2005. More detailed information regarding the identity of potential participants, and their direct or indirect interests, by securities holdings or otherwise, will be set forth in the registration statement and joint proxy statement and other materials to be filed with the SEC in connection with the proposed transaction.
Exhibit 99.3

Link to searchable text of slide shown above
Link to searchable text of slide shown above
Link to searchable text of slide shown above

Link to searchable text of slide shown above

Link to searchable text of slide shown above

Link to searchable text of slide shown above
Link to searchable text of slide shown above
Link to searchable text of slide shown above
Link to searchable text of slide shown above
Link to searchable text of slide shown above
Link to searchable text of slide shown above
Link to searchable text of slide shown above
Link to searchable text of slide shown above
Link to searchable text of slide shown above
Link to searchable text of slide shown above

Link to searchable text of slide shown above
Link to searchable text of slide shown above

Link to searchable text of slide shown above
Link to searchable text of slide shown above

Link to searchable text of slide shown above
Link to searchable text of slide shown above

Link to searchable text of slide shown above
Link to searchable text of slide shown above

Link to searchable text of slide shown above
Link to searchable text of slide shown above
Link to searchable text of slide shown above
Link to searchable text of slide shown above

Link to searchable text of slide shown above
Link to searchable text of slide shown above
Link to searchable text of slide shown above
Link to searchable text of slide shown above
Link to searchable text of slide shown above

Link to searchable text of slide shown above
Link to searchable text of slide shown above

Link to searchable text of slide shown above
Link to searchable text of slide shown above
Link to searchable text of slide shown above

Link to searchable text of slide shown above
Link to searchable text of slide shown above
Searchable text section of graphics shown above
The New Rudolph
…Creating A New Market Leader
[LOGO] | [LOGO] |
1
Safe Harbor Statement
The following material contains forward-looking statements relating to at least the following matters: industry projections and the company’s long term operating model. Other forward-looking statements may be preceded by words such as “expects”, “anticipates”, and “intends”. These forward-looking statements are based on our current expectations and projections. However, they are subject to various risks and uncertainties that could cause actual results to differ materially from those projected in such statements, including the following: cyclicality of the semiconductor industry, customer concentration, introduction of new products by our competitors, and sole or limited sources of supply. Other risks and uncertainties are detailed in our Annual Report on Form 10-K dated March 15, 2004 filed with the Securities and Exchange Commission (SEC).
2
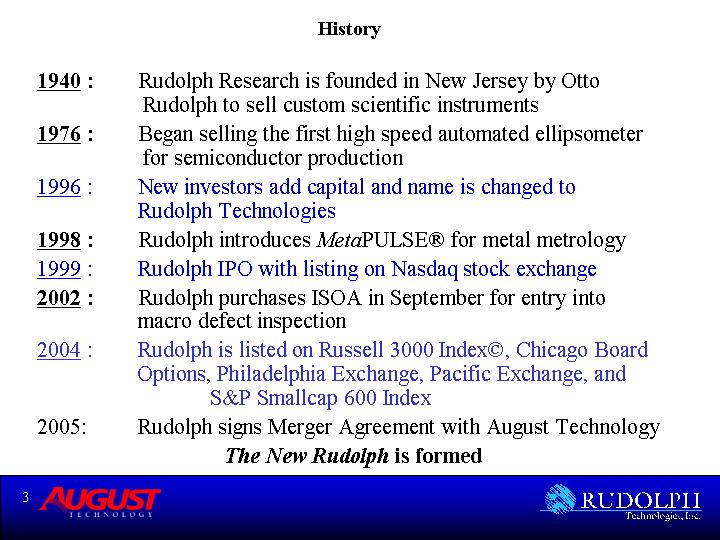
History
1940 : |
| Rudolph Research is founded in New Jersey by Otto Rudolph to sell custom scientific instruments |
|
|
|
1976 : |
| Began selling the first high speed automated ellipsometer for semiconductor production |
|
|
|
1996 : |
| New investors add capital and name is changed to Rudolph Technologies |
|
|
|
1998 : |
| Rudolph introduces MetaPULSE® for metal metrology |
|
|
|
1999 : |
| Rudolph IPO with listing on Nasdaq stock exchange |
|
|
|
2002 : |
| Rudolph purchases ISOA in September for entry into macro defect inspection |
|
|
|
2004 : |
| Rudolph is listed on Russell 3000 Index©, Chicago Board Options, Philadelphia Exchange, Pacific Exchange, and S&P Smallcap 600 Index |
|
|
|
2005: |
| Rudolph signs Merger Agreement with August Technology |
The New Rudolph is formed
3
[GRAPHIC] |
| [GRAPHIC] |
Flanders, New Jersey |
| Ledgewood, New Jersey |
|
|
|
[GRAPHIC] |
| [GRAPHIC] |
Mt. Arlington, New Jersey |
| Richardson, Texas |
4
Core Technologies
[GRAPHIC] |
| Sonar |
| [GRAPHIC] |
Ellipsometry |
| [GRAPHIC] |
| Reflectometry |
|
|
|
|
|
|
| Macro Defect Detection |
|
|
|
| [GRAPHIC] |
|
|
5
Rudolph’s Metrology & Inspection Family
[GRAPHIC]
Yield Enhancement Systems™ for sub-90 nm semiconductor production
6
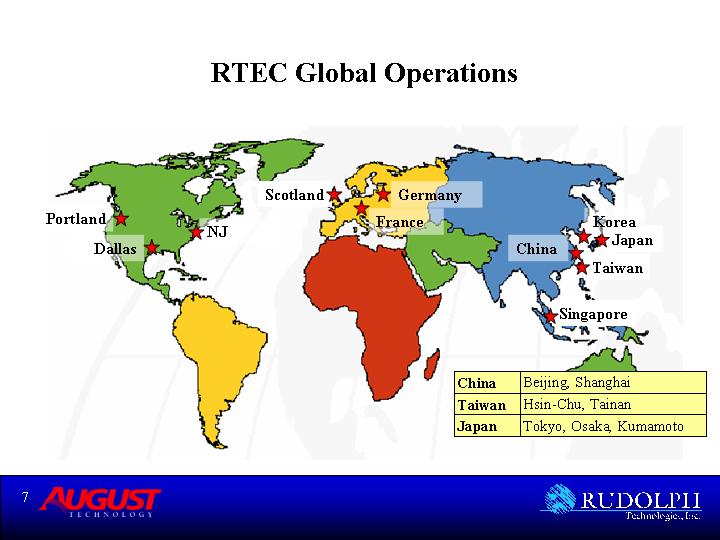
RTEC Global Operations
[GRAPHIC]
7
The New Rudolph
…Creating A New Market Leader
8
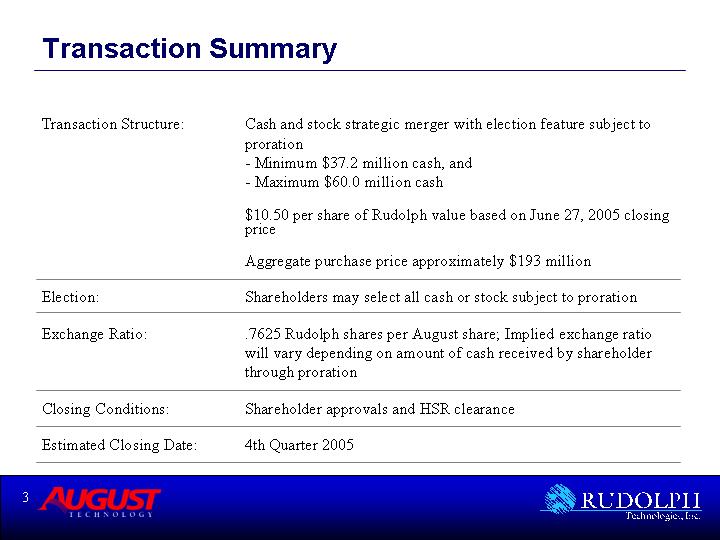
Transaction Summary
Transaction Structure: |
| Merger: stock-for-stock exchange and cash component (consideration to include minimum cash amount of $37.2 million, maximum cash amount $60 million |
|
|
|
|
| $10.50 stock/cash equivalent based on June 27, 2005 closing price |
|
|
|
|
| Aggregate purchase price approximately $193 million |
|
|
|
Exchange Ratio: |
| .7625 August shares, however actual exchange ratio depends on the amount of cash received by the shareholder |
|
|
|
Election |
| Shareholders may select all cash or stock subject to proration |
|
|
|
Accounting: |
| Purchase accounting |
|
|
|
Closing Conditions: |
| Standard governmental and corporate regulatory approvals |
|
|
|
Estimated Closing Date: |
| 4th Quarter 2005 |
9
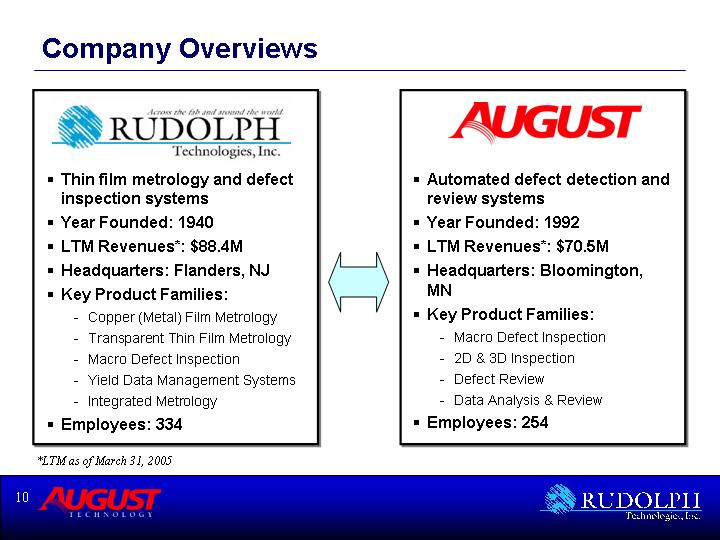
Company Overviews
[LOGO] |
| [LOGO] | ||||
|
|
|
| |||
• | Thin film metrology and defect inspection systems |
| • | Automated defect detection and review systems | ||
|
|
|
|
|
| |
• | Year Founded: 1940 |
| • | Year Founded: 1992 | ||
|
|
|
|
|
| |
• | LTM Revenues*: $88.4M |
| • | LTM Revenues*: $70.5M | ||
|
|
|
|
|
| |
• | Headquarters: Flanders, NJ |
| • | Headquarters: Bloomington, MN | ||
|
|
|
|
|
| |
• | Key Product Families: | [GRAPHIC] | • | Key Product Families: | ||
|
|
|
|
|
| |
| • | Copper (Metal) Film Metrology |
|
| • | Macro Defect Inspection |
|
|
|
|
|
|
|
| • | Transparent Thin Film Metrology |
|
| • | 2D & 3D Inspection |
|
|
|
|
|
|
|
| • | Macro Defect Inspection |
|
| • | Defect Review |
|
|
|
|
|
|
|
| • | Yield Data Management Systems |
|
| • | Data Analysis & Review |
|
|
|
|
|
| |
| • | Integrated Metrology |
|
|
| |
|
|
|
|
|
| |
• | Employees: 334 |
| • | Employees: 254 | ||
*LTM as of March 31, 2005
10
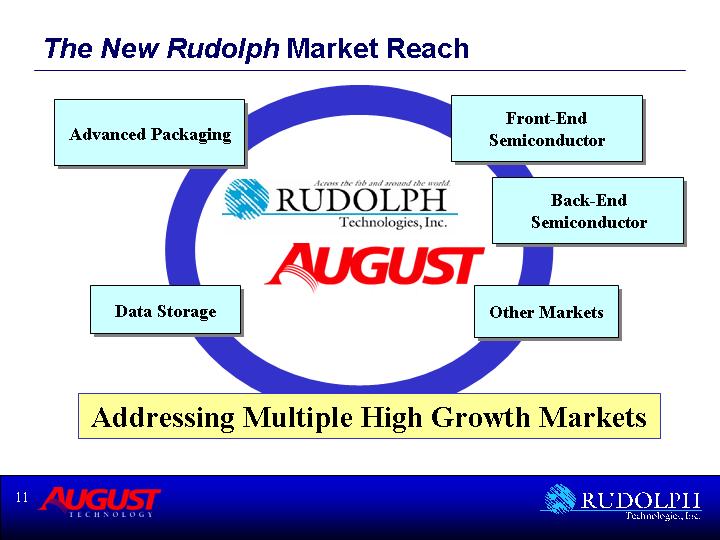
The New Rudolph Market Reach
Advanced Packaging |
| Front-End |
|
|
|
| [LOGO] | Back-End |
|
|
|
Data Storage |
| Other Markets |
|
|
|
Addressing Multiple High Growth Markets | ||
11
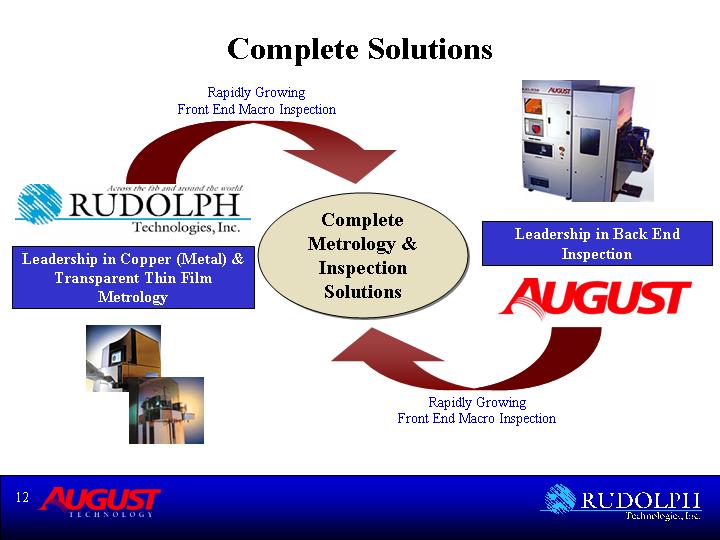
Complete Solutions
Rapidly Growing |
|
|
[GRAPHIC] |
| [GRAPHIC] |
|
|
|
[LOGO] |
|
|
|
|
|
Leadership in Copper (Metal) & | Complete | Leadership in Back End |
|
|
|
|
| [LOGO] |
|
|
|
[GRAPHIC] |
| [GRAPHIC] |
|
| Rapidly Growing |
12
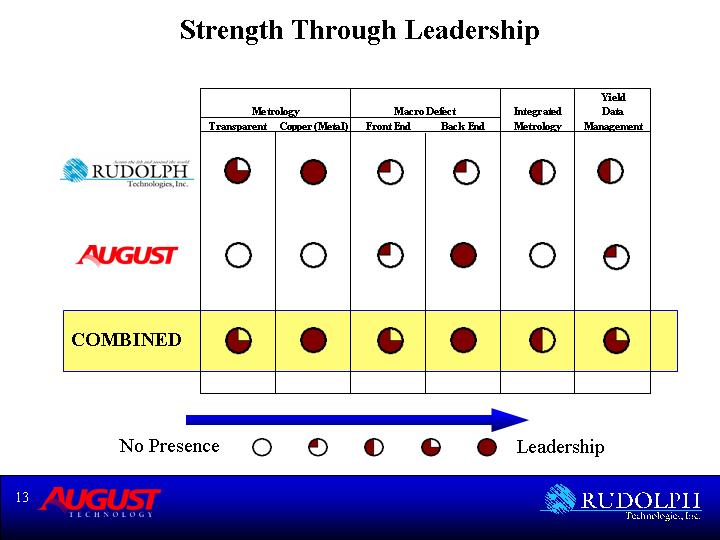
Strength Through Leadership
Strengthening Competencies
|
|
|
|
|
|
|
|
|
|
|
| Yield |
|
|
| Metrology |
| Macro Defect |
| Integrated |
| Data |
| ||||
|
| Transparent |
| Copper (Metal) |
| Front End |
| Back End |
| Metrology |
| Management |
|
|
|
|
|
|
|
|
|
|
|
|
|
|
|
[LOGO] |
| [GRAPHIC] |
| [GRAPHIC] |
| [GRAPHIC] |
| [GRAPHIC] |
| [GRAPHIC] |
| [GRAPHIC] |
|
|
|
|
|
|
|
|
|
|
|
|
|
|
|
[LOGO] |
| [GRAPHIC] |
| [GRAPHIC] |
| [GRAPHIC] |
| [GRAPHIC] |
| [GRAPHIC] |
| [GRAPHIC] |
|
|
|
|
|
|
|
|
|
|
|
|
|
|
|
COMBINED |
| [GRAPHIC] |
| [GRAPHIC] |
| [GRAPHIC] |
| [GRAPHIC] |
| [GRAPHIC] |
| [GRAPHIC] |
|
No Presence |
| [GRAPHIC] |
| [GRAPHIC] |
| [GRAPHIC] |
| [GRAPHIC] |
| [GRAPHIC] |
| Leadership |
|
13
SAFE HARBOR STATEMENT
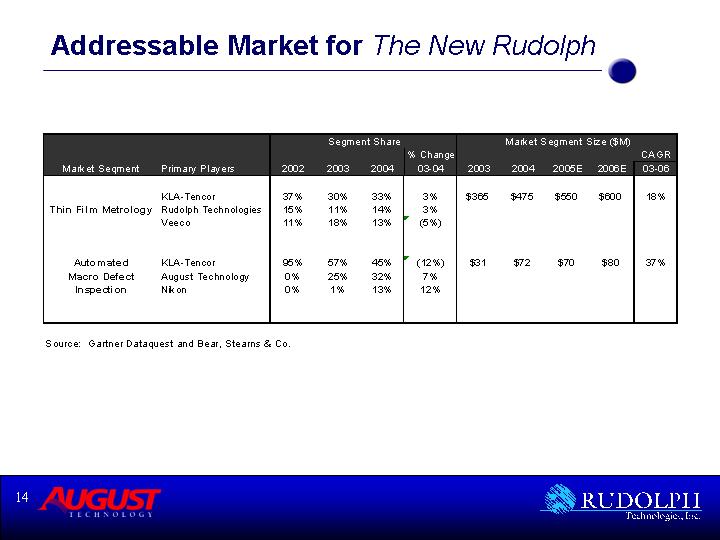
Addressable Market for |
| The New Rudolph |
|
|
|
| Segment Share |
| % Change |
| Market Segment Size ($M) |
| CAGR |
| ||||||||||||||
Market Seqment |
| Primary Players |
| 2002 |
| 2003 |
| 2004 |
| 03-04 |
| 2003 |
| 2004 |
| 2005E |
| 2006E |
| 03-06 |
| ||||
|
|
|
|
|
|
|
|
|
|
|
|
|
|
|
|
|
|
|
|
|
| ||||
|
| KLA-Tencor |
| 37 | % | 30 | % | 33 | % | 3 | % | $ | 365 |
| $ | 475 |
| $ | 550 |
| $ | 600 |
| 18 | % |
Thin Film Metrology |
| Rudolph Technologies |
| 15 | % | 11 | % | 14 | % | 3 | % |
|
|
|
|
|
|
|
|
|
| ||||
|
| Veeco |
| 11 | % | 18 | % | 13 | % | (5 | )% |
|
|
|
|
|
|
|
|
|
| ||||
|
|
|
|
|
|
|
|
|
|
|
|
|
|
|
|
|
|
|
|
|
| ||||
|
|
|
|
|
|
|
|
|
|
|
|
|
|
|
|
|
|
|
|
|
| ||||
Automated |
| KLA-Tencor |
| 95 | % | 57 | % | 45 | % | (12 | )% | $ | 31 |
| $ | 72 |
| $ | 70 |
| $ | 80 |
| 37 | % |
Macro Defect |
| August Technology |
| 0 | % | 25 | % | 32 | % | 7 | % |
|
|
|
|
|
|
|
|
|
| ||||
Inspection |
| Nikon |
| 0 | % | 1 | % | 13 | % | 12 | % |
|
|
|
|
|
|
|
|
|
| ||||
Source: Gartner Dataquest and Bear, Stearns & Co.
14
The New Rudolph Mission
Planned profitable growth
Be a clear leader in metrology and inspection with “best-of-breed” solutions in our chosen niches and be the overall #2 pure-play process control supplier
be a desired stock investment
15
Goals for The New Rudolph
• For our Customers – Continued market leadership in inspection and metrology providing them with an ever-expanding suite of products and services
• For our employees - Foster opportunities for personal and professional growth and successfully integrate cultures from 2 great franchises
• For our Shareholders
• Planned profitable growth by creating compelling value propositions for our customers
• Being a desired investment by enhancing shareholder value through consistently strong financial performance.
16
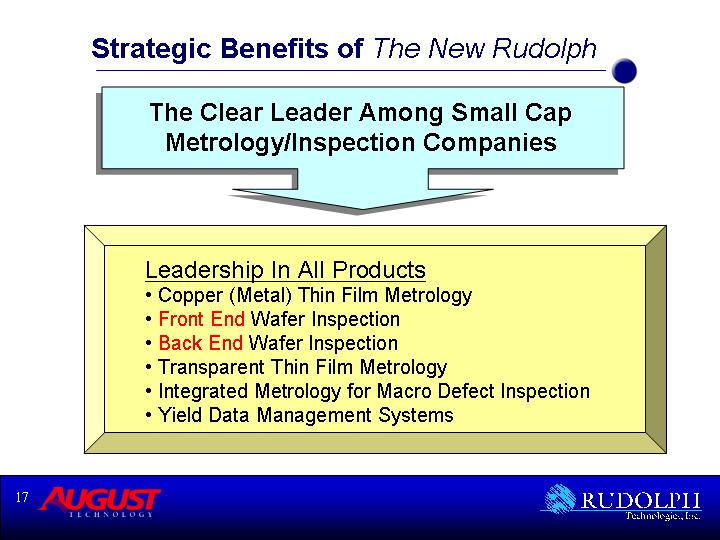
Strategic Benefits of The New Rudolph
The Clear Leader Among Small Cap
Metrology/Inspection Companies
Leadership In All Products
• Copper (Metal) Thin Film Metrology
• Front End Wafer Inspection
• Back End Wafer Inspection
• Transparent Thin Film Metrology
• Integrated Metrology for Macro Defect Inspection
• Yield Data Management Systems
17
Financial Benefits of The New Rudolph
A Tremendous Opportunity to Achieve Key
Financial Benefits
• Strong revenue synergy potential
• Improved financial position
• Pro Forma TTM revenues of $160 M – CRITICAL MASS
• Gross Margin leverage to > 50%
• Accretive Transaction
18
To Be A Market Leader The New Rudolph will
• Be a leading provider of macro-defect inspection and thin film metrology systems
• Create a one-stop resource for device manufacturers providing best-of-breed front-end and back-end solutions
• Drive to growth rates in excess of peers
• Expand our suite of products and services
19
To Create Value The New Rudolph will
• Capitalize on Cross-Selling Opportunities
• Expand Geographical Reach
• Establish Economies of Scale
• Become an Industry Consolidator
20
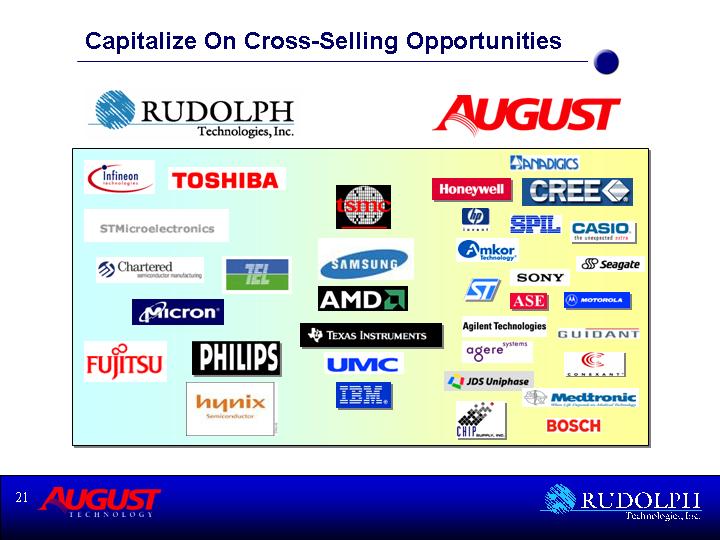
Capitalize On Cross-Selling Opportunities
[GRAPHIC]
21
Expand Geographic Reach
The New Rudolph
[CHART]
22
The New Rudolph will Deliver Results by
• Realizing Cost Savings & Reducing Operating Expenses
• Using its Strong Balance Sheet
• Growth Thru Increased Sales
23
Realizing Cost Savings
• Reduce unnecessary duplicative expenses
• Technology development
• Platform development (stages and automation)
• Software and process control systems
• Sales and service infrastructure
• Expenses of being a public company
• Marketing and management expenses
• Reduce operating costs
• Savings of $10 million over time in duplicative expenses
• Create operating leverage
• Supply chain leverage
24
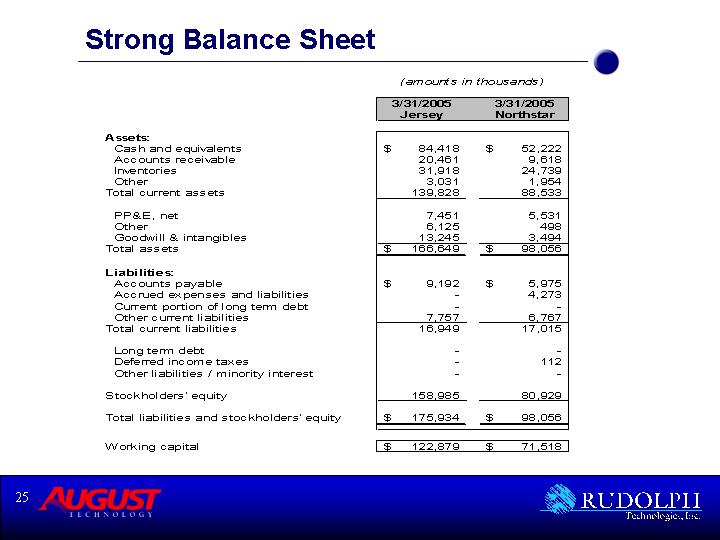
Strong Balance Sheet
|
| (amounts in thousands) |
| ||||
|
| 3/31/2005 |
| 3/31/2005 |
| ||
|
|
|
|
|
| ||
Assets: |
|
|
|
|
| ||
Cash and equivalents |
| $ | 84,418 |
| $ | 52,222 |
|
Accounts receivable |
| 20,461 |
| 9,618 |
| ||
Inventories |
| 31,918 |
| 24,739 |
| ||
Other |
| 3,031 |
| 1,954 |
| ||
Total current assets |
| 139,828 |
| 88,533 |
| ||
|
|
|
|
|
| ||
PP&E, net |
| 7,451 |
| 5,531 |
| ||
Other |
| 6,125 |
| 498 |
| ||
Goodwill & intangibles |
| 13,245 |
| 3,494 |
| ||
Total assets |
| $ | 166,649 |
| $ | 98,056 |
|
|
|
|
|
|
| ||
Liabilities: |
|
|
|
|
| ||
Accounts payable |
| $ | 9,192 |
| $ | 5,975 |
|
Accrued expenses and liabilities |
| — |
| 4,273 |
| ||
Current portion of long term debt |
| — |
| — |
| ||
Other current liabilities |
| 7,757 |
| 6,767 |
| ||
Total current liabilities |
| 16,949 |
| 17,015 |
| ||
|
|
|
|
|
| ||
Long term debt |
| — |
| — |
| ||
Deferred income taxes |
| — |
| 112 |
| ||
Other liabilities / minority interest |
| — |
| — |
| ||
|
|
|
|
|
| ||
Stockholders’ equity |
| 158,985 |
| 80,929 |
| ||
|
|
|
|
|
| ||
Total liabilities and stockholders’ equity |
| $ | 175,934 |
| $ | 98,056 |
|
|
|
|
|
|
| ||
Working capital |
| $ | 122,879 |
| $ | 71,518 |
|
25
New Opportunities For Employees
• Promote job security
• Strive for smooth and seamless transition
• Create an environment that supports employee growth and upward job mobility.
• Establish an environment that fosters open employee collaboration
• Support technological innovation
• Sustain legacy technology
26
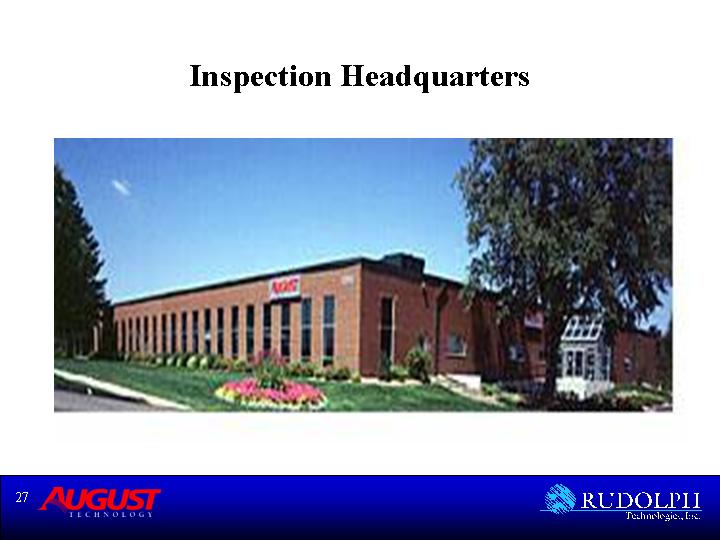
Inspection Headquarters
[GRAPHIC]
27
Clear Centers of Excellence in The New Rudolph
Corporate Headquarters | ||
| ||
Inspection Headquarters |
| Metrology Headquarters |
| ||
Data Analysis and Review | ||
28
Summary Of The New Rudolph
• 1 + 1 = 3 in the inspection business
• Critical Mass – it makes a difference to our customers
• Market leadership by creating value for our customers
• Personal growth for our employees worldwide
• Consistently strong financial performance
29
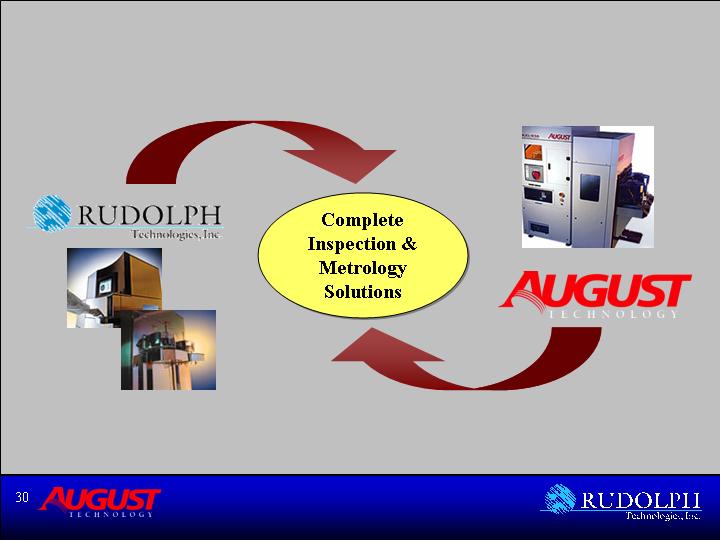
[GRAPHIC] |
|
|
[LOGO] | Complete Inspection & Metrology Solutions | [GRAPHIC] |
|
| [LOGO] |
[GRAPHIC] |
| [GRAPHIC] |
30
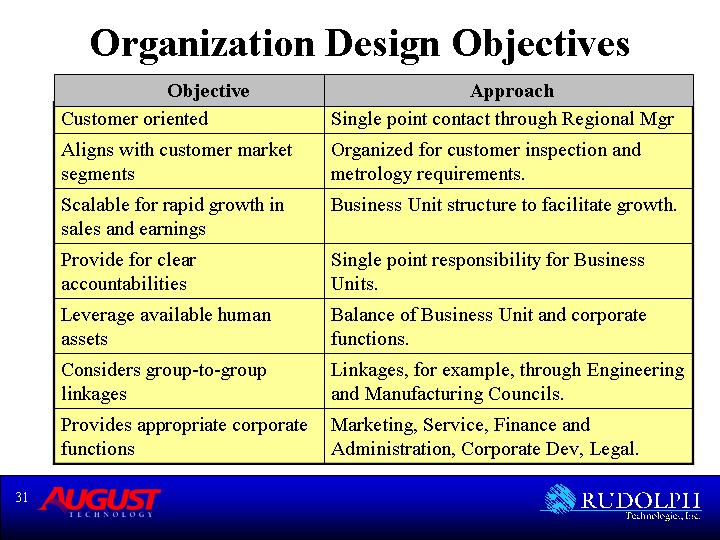
Organization Design Objectives
Objective |
| Approach |
|
|
|
Customer oriented |
| Single point contact through Regional Mgr |
|
|
|
Aligns with customer market segments |
| Organized for customer inspection and metrology requirements. |
|
|
|
Scalable for rapid growth in sales and earnings |
| Business Unit structure to facilitate growth. |
|
|
|
Provide for clear accountabilities |
| Single point responsibility for Business Units. |
|
|
|
Leverage available human assets |
| Balance of Business Unit and corporate functions. |
|
|
|
Considers group-to-group linkages |
| Linkages, for example, through Engineering and Manufacturing Councils. |
|
|
|
Provides appropriate corporate functions |
| Marketing, Service, Finance and Administration, Corporate Dev, Legal. |
31
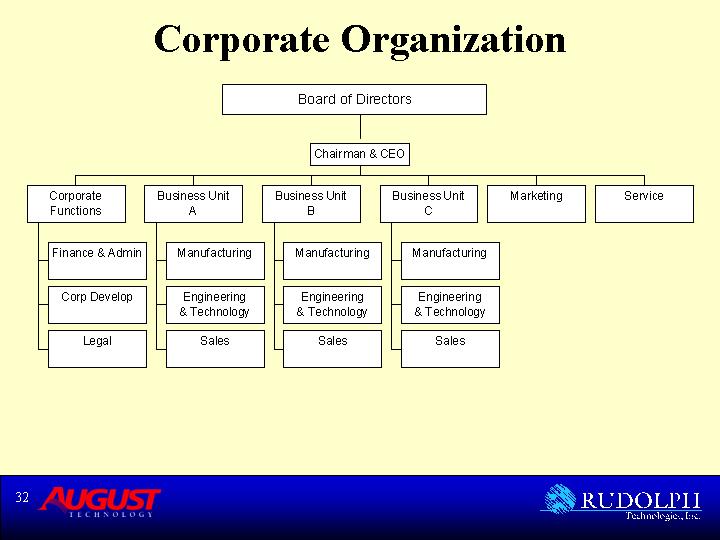
Corporate Organization
|
| Board of Directors |
|
|
|
|
|
|
|
|
|
|
| Chairman & CEO |
|
|
|
|
|
|
|
|
|
Corporate Functions | Business Unit A | Business Unit B | Business Unit C | Marketing | Service |
|
|
|
|
|
|
Finance & Admin | Manufacturing | Manufacturing | Manufacturing |
|
|
|
|
|
|
|
|
Corp Develop | Engineering & Technology | Engineering & | Engineering & Technology |
|
|
|
|
|
|
|
|
Legal | Sales | Sales | Sales |
|
|
32
Organization & Integration
• |
| Corporate Structure: Business Units (Inspection, Metrology and Decision Software) supported by corporate functions (Marketing, Customer Support, Finance and Administration, Corporate Development, Legal). |
|
|
|
|
|
|
|
• |
| Sales: Sales management and support provided by the respective Business Units to the regional organizations. |
| Business Unit Function |
|
|
|
| |
• |
| Engineering & Technology: Engineering and Technology services to be provided by the Business Unit organizations, with coordination through Engineering and Technology Councils. |
| |
|
|
|
| |
• |
| Manufacturing: Inspection and Decision Software manufacturing to continue Minnesota. Metrology manufacturing to continue in New Jersey. Activities to be coordinated through a Manufacturing Council. |
|
33
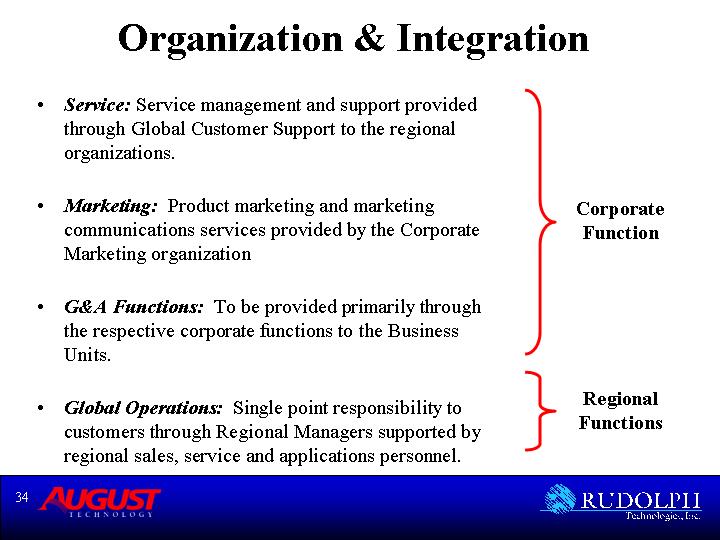
Organization & Integration
• |
| Service: Service management and support provided through Global Customer Support to the regional organizations. | Corporate Function | |
|
|
| ||
• |
| Marketing: Product marketing and marketing communications services provided by the Corporate Marketing organization | ||
|
|
| ||
• |
| G&A Functions: To be provided primarily through the respective corporate functions to the Business Units. | ||
|
|
|
| |
• |
| Global Operations: Single point responsibility to customers through Regional Managers supported by regional sales, service and applications personnel. | Regional Functions | |
34
Corporate Organization
|
| Chairman & CEO |
|
|
|
|
|
|
|
|
|
Corporate | Metrology BU | Inspection BU | DA&R BU | Corp. Mktg | Cust. Support |
|
|
|
|
|
|
SBC (1) J. O’Dell | Met Mfg J. Kurdock | Insp Mfg J. Nelson | DA&R Mfg | Marketing, Insp Product Mgrs | Service, Insp |
|
|
|
|
|
|
Corp Develop | Met Eng | Insp Eng M. Plisinski | DA&R Eng | Marketing, Met | Other |
|
|
|
|
|
|
Finance & Admin | MP PG Owner G. Tas | Insp CTO C. Watkins | DA&R CTO | Other |
|
|
|
|
|
|
|
Legal R. Koch | Trans PG Owner | Global Sales, Insp | DA&R Sales |
|
|
|
|
|
|
|
|
| Int Sales, Met | Strat Bus Fellow |
|
|
|
|
|
|
|
|
|
| Dom Sales, Met |
|
|
|
|
|
|
|
|
|
|
| Key Acct - Alpha |
|
|
|
|
Notes
1. J. O’Dell as a member of the Strategic Business Council.
2. Cross BU activities coordinated through councils; for example a Technology Council including respective CTO functions or equivalents.
35
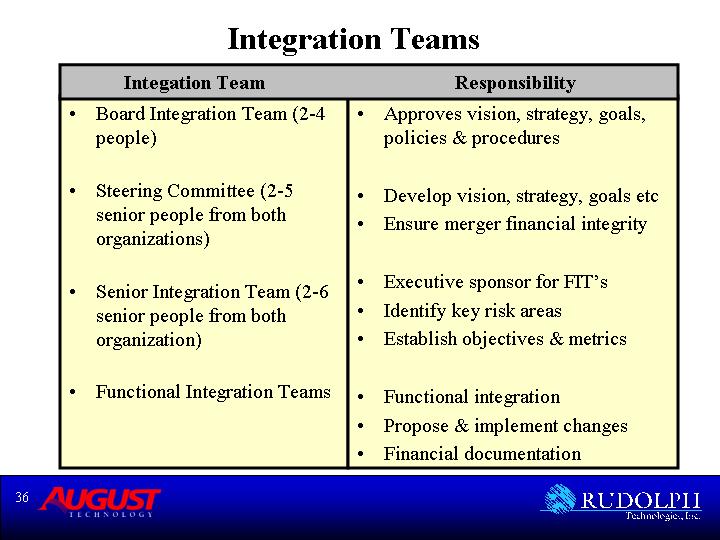
Integration Teams
Integation Team |
| Responsibility | ||
• | Board Integration Team (2-4 people) |
| • | Approves vision, strategy, goals, policies & procedures |
|
|
| ||
• | Steering Committee (2-5 senior people from both |
| • | Develop vision, strategy, goals etc |
| organizations) |
| • | Ensure merger financial integrity |
|
|
|
|
|
• | Senior Integration Team (2-6 senior people from both |
| • | Executive sponsor for FIT’s |
| organization) |
| • | Identify key risk areas |
|
|
| • | Establish objectives & metrics |
|
|
| ||
• | Functional Integration Teams |
| • | Functional integration |
|
|
| • | Propose & implement changes |
|
|
| • | Financial documentation |
36
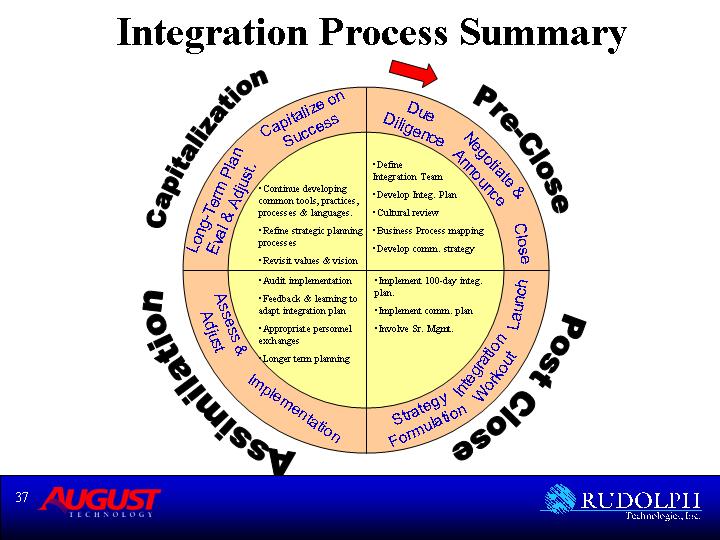
Integration Process Summary
Capitalization |
| Pre-Close |
| Post Close |
| Assimilation |
Long-Term Plan Eval & Adjust. |
| Due Diligence |
| Strategy Formulation |
| Assess & Adjust |
|
|
|
|
|
|
|
•Continue developing common tools, practices, processes & languages. |
| •Define Integration Team |
| •Implement 100-day integ. plan. |
| •Audit implementation |
37
Integration Timeline
PHASE |
| 2005 |
| 2006 |
| 2007 |
|
|
|
|
|
|
|
|
|
1. Pre-Close |
|
|
|
|
|
|
|
|
|
|
|
|
|
|
|
2. Post Close |
|
|
|
|
|
|
|
|
|
|
|
|
|
|
|
3. Assimilation |
|
|
|
|
|
|
|
|
|
|
|
|
|
|
|
4. Capitalize |
|
|
|
|
|
|
|
38
Thank You
39