QuickLinks -- Click here to rapidly navigate through this document
The Company
Simon Property Group, Inc. ("SPG") (NYSE:SPG) is a self-administered and self-managed real estate investment trust ("REIT"). Simon Property Group, L.P. (the "Operating Partnership") is a subsidiary partnership of SPG. Shares of SPG are paired with beneficial interests in shares of stock of SPG Realty Consultants, Inc. ("SRC", and together with SPG, the "Company"). The Company and the Operating Partnership (collectively the "Simon Group") are engaged primarily in the ownership, operation, management, leasing, acquisition, expansion and development of real estate properties, primarily regional malls and community shopping centers.
At March 31, 2002, the Company, directly or through the Operating Partnership, owned or had an interest in 251 properties which consisted of regional malls, community shopping centers, and specialty and mixed-use properties containing an aggregate of 186.8 million square feet of gross leasable area (GLA) in 36 states and eight assets in Europe and Canada.
On January 13, 2002, the Company announced a joint agreement with The Rouse Company and Westfield America Trust to purchase the assets of Rodamco North America N.V. (RNA) for $5.3 billion. The transaction was completed on May 3, 2002. The portfolio acquired by the Company consists primarily of interests in 13 high-quality, highly-productive regional malls in the United States, as well as ownership interests in other real estate assets. The Company's share of the RNA purchase price was approximately $1.59 billion, including the assumption of $579 million of property-level debt and preferred stock.
This package was prepared to provide (1) ownership information, (2) certain operational information, and (3) debt information as of March 31, 2002, for the Company and the Operating Partnership.
Certain statements contained in this Supplemental Package may constitute "forward-looking statements" made pursuant to the safe harbor provisions of the Private Securities Litigation Reform Act of 1995. Readers are cautioned that forward-looking statements involve risks and uncertainties, which may affect the business and prospects of the Company and the Operating Partnership. We direct you to the Company's various filings with the Securities and Exchange Commission including Form 10-K and Form 10-Q for a detailed discussion of risks and uncertainties.
We hope you find this Supplemental Package beneficial. Any questions, comments or suggestions should be directed to: Shelly J. Doran, Vice President of Investor Relations-Simon Property Group, P.O. Box 7033, Indianapolis, IN 46207. Telephone: (317) 685-7330; e-mail: sdoran@simon.com
5
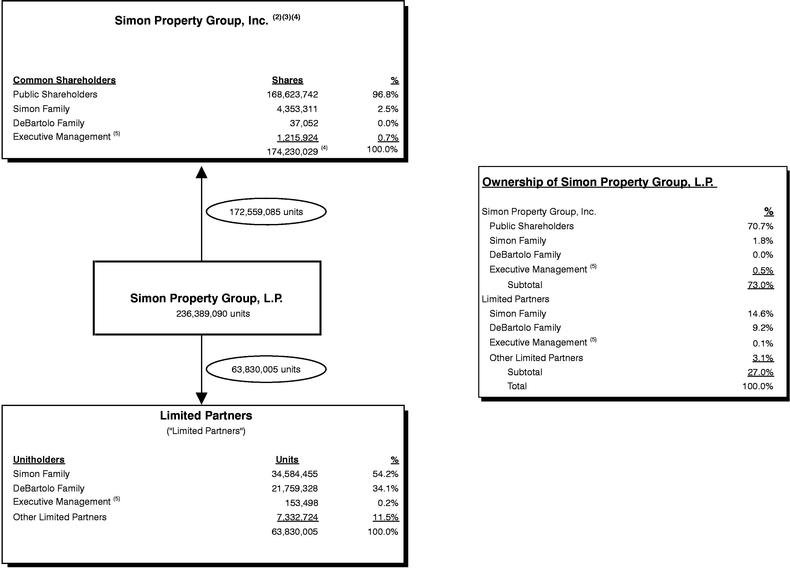
Simon Property Group Economic Ownership Structure(1)
March 31, 2002
- (1)
- Schedule excludes preferred stock (see "Preferred Stock/Units Outstanding") and units not convertible into common stock.
- (2)
- Managing general partner of Simon Property Group, L.P.
- (3)
- Shares of Simon Property Group, Inc. ("SPG") are paired with beneficial interests in shares of stock of SPG Realty Consultants, Inc.
- (4)
- The number of outstanding shares of common stock of SPG exceeds the number of Simon Property Group, L.P. units owned by SPG by 1,670,944. This is the result of the direct ownership of Ocean County Mall by SPG, partially offset by units issued to SPG in exchange for Northshore Mall.
- (5)
- Executive management excludes Simon family members.
6
SIMON PROPERTY GROUP
Changes in Common Shares and Unit Ownership
For the Period from December 31, 2001 through March 31, 2002
| | Operating Partnership Units(1) | Company Common Shares(2) | ||
|---|---|---|---|---|
| Number Outstanding at December 31, 2001 | 63,930,350 | 173,806,306 | ||
Issuance of Stock for Stock Option Exercises | — | 323,723 | ||
Conversion of Units into Common Stock | (100,000 | ) | 100,000 | |
Conversion of Units into Cash | (345 | ) | — | |
Number Outstanding at March 31, 2002 | 63,830,005 | 174,230,029 |
Total Common Shares and Units Outstanding at March 31, 2002:
238,060,034(2)
| Details for Diluted Common Shares Outstanding: | |||
Company Common Shares Outstanding at March 31, 2002 | 174,230,029 | ||
Number of Common Shares Issuable Assuming Conversion of: | |||
Series A Preferred 6.5% Convertible(3) | 1,893,651 | ||
| Series B Preferred 6.5% Convertible(3) | 12,490,773 | ||
Net Number of Common Shares Issuable Assuming Exercise of Stock Options(4) | 582,718 | ||
Diluted Common Shares Outstanding at March 31, 2002 | 189,197,171 | ||
Fully Diluted Common Shares and Units Outstanding at March 31, 2002:
253,027,176
- (1)
- Excludes units owned by the Company (shown here as Company Common Shares) and units not convertible into common shares.
- (2)
- Excludes preferred units relating to preferred stock outstanding (see Schedule of Preferred Stock Outstanding).
- (3)
- Conversion terms provided in footnotes (1) and (2) on page 8 of this document.
- (4)
- Based upon the weighted average stock price for the first quarter of 2002.
7
SIMON PROPERTY GROUP
Preferred Stock/Units Outstanding
As of March 31, 2002
($ in 000's)
| Issuer | Description | Number of Shares/Units | Per Share Liquidation Preference | Aggregate Liquidation Preference | Ticker Symbol | |||||||
|---|---|---|---|---|---|---|---|---|---|---|---|---|
| Preferred Shares: | ||||||||||||
| Convertible | ||||||||||||
| Simon Property Group, Inc. | Series A Preferred 6.5% Convertible(1) | 49,839 | $ | 1,000 | $ | 49,839 | N/A | |||||
| Simon Property Group, Inc. | Series B Preferred 6.5% Convertible(2) | 4,830,057 | $ | 100 | $ | 483,006 | SPGPrB | |||||
Perpetual | ||||||||||||
| Simon Property Group, Inc. | Series E Preferred 8% Cumulative Redeemable(3) | 1,000,000 | $ | 25 | $ | 25,000 | N/A | |||||
| Simon Property Group, Inc. | Series F Preferred 83/4% Perpetual(4) | 8,000,000 | $ | 25 | $ | 200,000 | SPGPrF | |||||
| Simon Property Group, Inc. | Series G Preferred 7.89% Perpetual(5) | 3,000,000 | $ | 50 | $ | 150,000 | SPGPrG | |||||
Preferred Units: | ||||||||||||
| Simon Property Group, L.P. | Series C 7% Cumulative Convertible Preferred(6) | 2,600,895 | $ | 28 | $ | 72,825 | N/A | |||||
| Simon Property Group, L.P. | Series D 8% Cumulative Redeemable Preferred(7) | 2,600,895 | $ | 30 | $ | 78,027 | N/A | |||||
- (1)
- Assumed in connection with the CPI merger. Each share is convertible into a number of shares of common stock obtained by dividing $1,000 by $26.319 (conversion price), which is subject to adjustment as outlined below. The stock is not redeemable, except as needed to maintain or bring the direct or indirect ownership of the capital stock of the Company into conformity with the requirements of Section 856(a)(6) of the Code.
- (2)
- Issued as part of the consideration for the CPI merger. Each share is convertible into a number of shares of common stock of the Company obtained by dividing $100 by $38.669 (the conversion price), which is subject to adjustment as outlined below. The Company may redeem the stock on or after September 24, 2003 at a price beginning at 105% of the liquidation preference plus accrued dividends and declining to 100% of the liquidation preference plus accrued dividends any time on or after September 24, 2008. The shares are traded on the New York Stock Exchange. The closing price on March 31, 2002, was $88.60 per share.(The conversion prices of the Series A and Series B Convertible Preferred Stock are subject to adjustment by the Company in connection with certain events.)
- (3)
- Issued in connection with the acquisition of Mall of America. Simon Property Group, Inc. Series E Preferred 8% Cumulative Redeemable Stock is not redeemable prior to August 27, 2004.
- (4)
- Represent securities issued to holders of substantially identical securities of SPG Properties, Inc., a former subsidiary of SPG which was merged into SPG effective July 1, 2001. The shares are redeemable on or after September 29, 2006. The shares are not convertible into any other securities of SPG. The shares are traded on the New York Stock Exchange. The closing price on March 31, 2002, was $25.40 per share.
- (5)
- Represent securities issued to holders of substantially identical securities of SPG Properties, Inc., a former subsidiary of SPG which was merged into SPG effective July 1, 2001. The Cumulative Step-Up Premium Rate Preferred Stock was issued at 7.89%. The shares are redeemable after September 30, 2007. Beginning October 1, 2012, the rate increases to 9.89%. The shares are not convertible into any other securities of SPG. The shares are traded on the New York Stock Exchange. The closing price on March 31, 2002 was $47.90 per share.
- (6)
- Issued in connection with the New England Development acquisition. Each unit/share is convertible into 0.75676 shares of common stock on or after August 27, 2004 if certain conditions are met. Each unit/share is not redeemable prior to August 27, 2009.
- (7)
- Issued in connection with the New England Development acquisition. Each unit/share is not redeemable prior to August 27, 2009.
8
SIMON PROPERTY GROUP
Reconciliation of Income to Funds From Operations (FFO)
As of March 31, 2002
Unaudited
(Amounts in thousands, except per share data)
| | | Three Monds Ended March 31, | ||||||||
|---|---|---|---|---|---|---|---|---|---|---|
| The Operating Partnership | ||||||||||
| 2002 | 2001 | |||||||||
| Income before extraordinary items and cumulative effect of accounting change(1)(2) | $ | 60,425 | $ | 63,775 | ||||||
Plus: | Depreciation and amortization from combined consolidated properties | 110,358 | 106,166 | |||||||
Plus: | Simon's share of depreciation and amortization from unconsolidated entities | 36,343 | 31,257 | |||||||
Plus: | MerchantWired impairment charge and other net of tax benefit | 4,178 | — | |||||||
Less: | Gain on sales of real estate | — | (2,711 | ) | ||||||
Less: | Minority interest portion of depreciation, amortization and extraordinary items | (1,995 | ) | (1,487 | ) | |||||
Less: | Preferred distributions (including those of subsidiary) | (19,334 | ) | (19,431 | ) | |||||
FFO of the Simon Portfolio | $ | 189,975 | $ | 177,569 | ||||||
| Percent Increase | 7.0 | % | ||||||||
FFO of the Simon Portfolio | $ | 189,975 | $ | 177,569 | ||||||
FFO Allocable to the LP Unitholders | (51,095 | ) | (48,803 | ) | ||||||
| Basic FFO Allocable to the Companies | $ | 138,880 | $ | 128,766 | ||||||
| Impact of Series A and B Preferred Stock Conversion & Option Exercise(3) | 9,506 | 9,281 | ||||||||
| Diluted FFO Allocable to the Companies | $ | 148,386 | $ | 138,047 | ||||||
| Basic Weighted Average Paired Shares Outstanding | 173,946 | 172,001 | ||||||||
| Effect of Stock Options | 582 | 177 | ||||||||
| Impact of Series A Preferred 6.5% Convertible | 1,894 | 1,940 | ||||||||
| Impact of Series B Preferred 6.5% Convertible | 12,491 | 12,491 | ||||||||
| Diluted Weighted Average Number of Equivalent Paired Shares | 188,913 | 186,609 | ||||||||
| Basic FFO per Paired Share: | ||||||||||
| Basic FFO Allocable to the Companies | $ | 138,880 | $ | 128,766 | ||||||
| Basic Weighted Average Paired Shares Outstanding | 173,946 | 172,001 | ||||||||
| Basic FFO per Paired Share | $ | 0.80 | $ | 0.75 | ||||||
| Percent Increase | 6.7 | % | ||||||||
Diluted FFO per Paired Share: | ||||||||||
| Diluted FFO Allocable to the Companies | $ | 148,386 | $ | 138,047 | ||||||
| Diluted Weighted Average Number of Equivalent Paired Shares | 188,913 | 186,609 | ||||||||
| Diluted FFO per Paired Share | $ | 0.79 | $ | 0.74 | ||||||
| Percent Increase | 6.8 | % | ||||||||
- (1)
- Includes gains on land sales of $8.6 million and $1.2 million for the three months ended March 31, 2002 and 2001, respectively
- (2)
- Includes straight-line adjustments to minimum rent of $1.3 million and $4.3 million for the three months ended March 31, 2002 and 2001, respectively.
- (3)
- Includes dividends of Series A and B Preferred Stock as well as increased allocation of FFO to the Company as a result of assumed increase in the number of common shares outstanding.
9
SIMON PROPERTY GROUP
Selected Financial Information
As of March 31, 2002
Unaudited
(In thousands, except as noted)
| | As of or for the Three Months Ended March 31, | | ||||||||
|---|---|---|---|---|---|---|---|---|---|---|
| | % Change | |||||||||
| | 2002 | 2001 | ||||||||
| Financial Highlights of the Company | ||||||||||
| Total Revenue—Consolidated Properties | $ | 494,947 | $ | 490,676 | 0.9 | % | ||||
| Total EBITDA of the Simon Group Portfolio(5) | $ | 523,707 | (6) | $ | 514,751 | 1.7 | % | |||
| Simon Group's Share of EBITDA(5) | $ | 392,491 | (6) | $ | 390,685 | 0.5 | % | |||
| Net Income Available to Common Shareholders | $ | 30,006 | (6) | $ | 30,939 | -3.0 | % | |||
| Basic Net Income per Paired Share | $ | 0.17 | (6) | $ | 0.19 | -10.5 | % | |||
| Diluted Net Income per Paired Share | $ | 0.17 | (6) | $ | 0.18 | -5.6 | % | |||
| FFO of the Simon Portfolio | $ | 189,975 | $ | 177,569 | 7.0 | % | ||||
| Basic FFO Allocable to the Companies | $ | 138,880 | $ | 128,766 | 7.9 | % | ||||
| Diluted FFO Allocable to the Companies | $ | 148,386 | $ | 138,047 | 7.5 | % | ||||
| Basic FFO per Paired Share | $ | 0.80 | $ | 0.75 | 6.7 | % | ||||
| Diluted FFO per Paired Share | $ | 0.79 | $ | 0.74 | 6.8 | % | ||||
| Distributions per Paired Share | $ | 0.5250 | $ | 0.5050 | 4.0 | % | ||||
| Operational Statistics | ||||||||||
| Occupancy at End of Period: | ||||||||||
| Regional Malls(1) | 90.9 | % | 90.2 | % | 0.7 | % | ||||
| Community Shopping Centers(2) | 88.8 | % | 90.7 | % | -1.9 | % | ||||
| Average Base Rent per Square Foot: | ||||||||||
| Regional Malls(1) | $ | 29.51 | $ | 28.60 | 3.2 | % | ||||
| Community Shopping Centers(2) | $ | 9.86 | $ | 9.54 | 3.4 | % | ||||
| Releasing Spread, Regional Malls: | ||||||||||
| Opening Base Rent per Square Foot | $ | 37.64 | $ | 35.06 | 7.4 | % | ||||
| Closing Base Rent per Square Foot | $ | 31.04 | $ | 28.95 | 7.2 | % | ||||
| Releasing Spread per Square Foot | $ | 6.60 | $ | 6.11 | 8.0 | % | ||||
| Percentage Increase | 21.3 | % | 21.1 | % | 0.2 | % | ||||
| Regional Malls: | ||||||||||
| Total Tenant Sales Volume, in millions(3)(4) | $ | 3,644 | $ | 3,658 | -0.4 | % | ||||
| Comparable Sales per Square Foot(4) | $ | 383 | $ | 389 | -1.5 | % | ||||
| Total Sales per Square Foot(4) | $ | 377 | $ | 381 | -1.0 | % | ||||
| Number of U.S. Properties Open at End of Period | 251 | 250 | 0.4 | % | ||||||
| Total U.S. GLA at End of Period, in millions of square feet | 186.8 | 184.9 | 1.0 | % | ||||||
- (1)
- Includes mall and freestanding stores.
- (2)
- Includes all Owned GLA.
- (3)
- Represents only those tenants who report sales.
- (4)
- Based upon the standard definition of sales for regional malls adopted by the International Council of Shopping Centers which includes only mall and freestanding stores less than 10,000 square feet.
- (5)
- Excludes technology initiatives.
- (6)
- Includes a currency hedge expense of $5.4 million, or $0.02 per share, related to the RNA acquisition.
10
SIMON PROPERTY GROUP
Selected Financial Information
As of March 31, 2002
Unaudited
(In thousands, except as noted)
| | March 31, 2002 | March 31, 2001 | ||
|---|---|---|---|---|
| Equity Information | ||||
| Limited Partner Units Outstanding at End of Period | 63,830 | 64,933 | ||
| Paired Shares Outstanding at End of Period | 174,230 | 172,436 | ||
| Total Common Shares and Units Outstanding at End of Period | 238,060 | 237,368 | ||
| Basic Weighted Average Paired Shares Outstanding(1) | 173,946 | 172,001 | ||
| Diluted Weighted Average Number of Equivalent Paired Shares(1) | 188,913 | 186,609 |
March 31, 2002 | December 31, 2001 | |||||
|---|---|---|---|---|---|---|
| Debt Information | ||||||
| Consolidated Debt | $ | 8,812,130 | $ | 8,841,378 | ||
| Simon Group's Share of Joint Venture Debt | $ | 2,420,480 | $ | 2,392,523 | ||
| Debt-to-Market Capitalization | ||||||
| Common Stock Price at End of Period | $ | 32.63 | $ | 29.33 | ||
| Equity Market Capitalization(2) | $ | 8,779,625 | $ | 7,968,576 | ||
| Total Consolidated Capitalization | $ | 17,591,755 | $ | 16,809,954 | ||
| Total Capitalization—Including Simon Group's Share of JV Debt | $ | 20,012,235 | $ | 19,202,477 | ||
- (1)
- For purposes of computing FFO per share.
- (2)
- Market value of Common Stock, Units and all issues of Preferred Stock of SPG.
11
SIMON PROPERTY GROUP
Portfolio GLA, Occupancy & Rent Data
As of March 31, 2002
| Type of Property | GLA-Sq. Ft. | Total Owned GLA | % of Owned GLA | % of Owned GLA Which is Leased | Avg. Annualized Base Rent Per Leased Sq. Ft. of Owned GLA | |||||||
|---|---|---|---|---|---|---|---|---|---|---|---|---|
| Regional Malls | ||||||||||||
| —Anchor | 98,330,736 | 29,946,687 | 27.0 | % | 95.9 | % | $ | 4.00 | ||||
—Mall Store | 56,670,267 | 56,622,371 | 51.0 | % | 90.8 | % | $ | 30.23 | ||||
| —Freestanding | 3,758,543 | 1,971,133 | 1.7 | % | 92.1 | % | $ | 10.26 | ||||
| Subtotal | 60,428,810 | 58,593,504 | 52.7 | % | 90.9 | % | $ | 29.51 | ||||
Regional Mall Total | 158,759,546 | 88,540,191 | 79.7 | % | 92.6 | % | ||||||
Community Shopping Centers | ||||||||||||
| —Anchor | 12,116,092 | 7,544,794 | 6.8 | % | 90.1 | % | $ | 7.98 | ||||
| —Mall Store | 4,216,033 | 4,130,275 | 3.7 | % | 83.9 | % | 13.86 | |||||
| —Freestanding | 763,260 | 307,649 | .3 | % | 90.1 | % | 8.59 | |||||
| Community Ctr. Total | 17,095,385 | 11,982,718 | 10.8 | % | 88.8 | % | $ | 9.86 | ||||
Office Portion of Mixed-Use Properties | 2,558,306 | 2,558,306 | 2.3 | % | 81.9 | % | $ | 19.01 | ||||
Value-Oriented Super-Regional Malls | 6,614,738 | 6,481,882 | 5.8 | % | 93.3 | % | $ | 17.71 | ||||
Other | 1,801,264 | 1,569,315 | 1.4 | % | ||||||||
GRAND TOTAL | 186,829,239 | 111,132,412 | 100.00 | % | ||||||||
| Occupancy History | |||||
|---|---|---|---|---|---|
| As of | Regional Malls(1) | Community Shopping Centers(2) | |||
| 3/31/02 | 90.9 | % | 88.8 | % | |
| 3/31/01 | 90.2 | % | 90.7 | % | |
| 12/31/01 | 91.9 | % | 90.0 | % | |
| 12/31/00 | 91.8 | % | 91.5 | % | |
| 12/31/99 | 90.6 | % | 88.6 | % | |
| 12/31/98 | 90.0 | % | 91.4 | % | |
| 12/31/97 | 87.3 | % | 91.3 | % | |
- (1)
- Includes mall and freestanding stores.
- (2)
- Includes all Owned GLA.
12
SIMON PROPERTY GROUP
Rent Information
As of March 31, 2002
Average Base Rent
| As of | Mall & Freestanding Stores at Regional Malls | % Change | Community Shopping Centers | % Change | |||||||
|---|---|---|---|---|---|---|---|---|---|---|---|
| 3/31/02 | $ | 29.51 | 3.2 | % | $ | 9.86 | 3.4 | % | |||
| 3/31/01 | 28.60 | — | 9.54 | — | |||||||
| 12/31/01 | $ | 29.28 | 3.4 | % | $ | 9.83 | 5.0 | % | |||
| 12/31/00 | 28.31 | 3.6 | 9.36 | 12.0 | |||||||
| 12/31/99 | 27.33 | 6.3 | 8.36 | 8.9 | |||||||
| 12/31/98 | 25.70 | 8.7 | 7.68 | 3.2 | |||||||
| 12/31/97 | 23.65 | 14.4 | 7.44 | (2.7 | ) | ||||||
Rental Rates
| | Base Rent(1) | | | |||||||||
|---|---|---|---|---|---|---|---|---|---|---|---|---|
| | Amount of Change | |||||||||||
| Year | Store Openings During Period | Store Closings During Period | ||||||||||
| Dollar | Percentage | |||||||||||
| Regional Malls: | ||||||||||||
| 2002 (YTD) | $ | 37.64 | $ | 31.04 | $ | 6.60 | 21.3 | % | ||||
| 2001 | $ | 34.88 | $ | 29.10 | $ | 5.78 | 19.9 | % | ||||
| 2000 | 35.13 | 29.24 | 5.89 | 20.1 | ||||||||
| 1999 | 31.25 | 24.55 | 6.70 | 27.3 | ||||||||
| 1998 | 27.33 | 23.63 | 3.70 | 15.7 | ||||||||
| 1997 | 29.66 | 21.26 | 8.40 | 39.5 | ||||||||
Community Shopping Centers: | ||||||||||||
| 2002 (YTD) | $ | 9.17 | $ | 12.56 | $ | (3.39 | ) | (27.0 | )% | |||
| 2001 | $ | 12.79 | $ | 9.30 | $ | 3.49 | 37.5 | % | ||||
| 2000 | 14.21 | 11.51 | 2.70 | 23.5 | ||||||||
| 1999 | 10.26 | 7.44 | 2.82 | 37.9 | ||||||||
| 1998 | 10.43 | 10.95 | (0.52 | ) | (4.7 | ) | ||||||
| 1997 | 8.63 | 9.44 | (0.81 | ) | (8.6 | ) | ||||||
- (1)
- Represents the average base rent in effect during the period for those tenants who signed leases as compared to the average base rent in effect during the period for those tenants whose leases terminated or expired.
13
SIMON PROPERTY GROUP
Lease Expirations(1)
As of March 31, 2002
| Year | Number of Leases Expiring | Square Feet | Avg. Base Rent per Square Foot at 3/31/02 | ||||
|---|---|---|---|---|---|---|---|
| Regional Malls—Mall Stores & Freestanding | |||||||
2002 (4/1 - 12/31) | 958 | 1,381,830 | $ | 30.08 | |||
| 2003 | 1,940 | 4,637,679 | $ | 30.37 | |||
| 2004 | 1,875 | 4,669,878 | $ | 30.45 | |||
| 2005 | 1,764 | 5,285,790 | $ | 29.66 | |||
| 2006 | 1,813 | 4,968,548 | $ | 30.86 | |||
| 2007 | 1,515 | 4,559,759 | $ | 31.94 | |||
| 2008 | 1,336 | 4,567,782 | $ | 31.40 | |||
| 2009 | 1,328 | 4,308,449 | $ | 29.48 | |||
| 2010 | 1,539 | 4,655,616 | $ | 33.52 | |||
| 2011 | 1,390 | 4,374,160 | $ | 31.38 | |||
| 2012 | 698 | 2,666,552 | $ | 30.27 | |||
| 2013 and Thereafter | 203 | 3,185,436 | $ | 18.41 | |||
Regional Malls—Anchor Tenants | |||||||
2002 (4/1 - 12/31) | 3 | 318,473 | $ | 2.24 | |||
| 2003 | 14 | 1,624,771 | $ | 2.22 | |||
| 2004 | 25 | 2,441,245 | $ | 3.27 | |||
| 2005 | 24 | 2,958,181 | $ | 2.25 | |||
| 2006 | 25 | 3,120,697 | $ | 2.85 | |||
| 2007 | 18 | 2,007,133 | $ | 2.11 | |||
| 2008 | 19 | 2,202,952 | $ | 3.87 | |||
| 2009 | 16 | 1,986,791 | $ | 2.82 | |||
| 2010 | 14 | 1,392,776 | $ | 4.01 | |||
| 2011 | 13 | 1,355,999 | $ | 4.77 | |||
| 2012 | 17 | 2,160,513 | $ | 4.94 | |||
| 2013 and Thereafter | 58 | 6,840,652 | $ | 6.18 | |||
Community Centers—Mall Stores & Freestanding | |||||||
2002 (4/1 - 12/31) | 100 | 153,950 | $ | 12.71 | |||
| 2003 | 158 | 523,532 | $ | 12.57 | |||
| 2004 | 163 | 504,472 | $ | 13.74 | |||
| 2005 | 186 | 619,097 | $ | 14.66 | |||
| 2006 | 138 | 532,743 | $ | 14.23 | |||
| 2007 | 69 | 369,004 | $ | 11.64 | |||
| 2008 | 16 | 110,761 | $ | 14.53 | |||
| 2009 | 12 | 58,396 | $ | 18.65 | |||
| 2010 | 26 | 212,470 | $ | 13.71 | |||
| 2011 | 29 | 189,267 | $ | 14.60 | |||
| 2012 | 11 | 71,957 | $ | 15.61 | |||
| 2013 and Thereafter | 11 | 160,727 | $ | 6.21 | |||
- (1)
- Does not consider the impact of options to renew that may be contained in leases.
14
SIMON PROPERTY GROUP
Lease Expirations(1)
As of March 31, 2002
| Year | Number of Leases Expiring | Square Feet | Avg. Base Rent per Square Foot at 3/31/02 | ||||
|---|---|---|---|---|---|---|---|
| Community Centers—Anchor Tenants | |||||||
2002 (4/1 - 12/31) | 3 | 79,942 | $ | 7.78 | |||
| 2003 | 12 | 339,033 | $ | 6.62 | |||
| 2004 | 9 | 305,410 | $ | 5.90 | |||
| 2005 | 15 | 606,858 | $ | 6.41 | |||
| 2006 | 16 | 661,891 | $ | 5.67 | |||
| 2007 | 16 | 607,159 | $ | 5.89 | |||
| 2008 | 9 | 237,172 | $ | 11.00 | |||
| 2009 | 13 | 530,990 | $ | 7.27 | |||
| 2010 | 19 | 719,935 | $ | 9.61 | |||
| 2011 | 7 | 162,359 | $ | 12.15 | |||
| 2012 | 10 | 478,851 | $ | 8.86 | |||
| 2013 and Thereafter | 36 | 1,866,181 | $ | 9.16 | |||
- (1)
- Does not consider the impact of options to renew that may be contained in leases.
15
SIMON PROPERTY GROUP
SPG's Share of Total Debt Amortization and Maturities by Year
As of March 31, 2002
(In thousands)
| Year | | SPG's Share of Secured Consolidated Debt | SPG's Share of Unsecured Consolidated Debt | SPG's Share of Unconsolidated Joint Venture Debt | SPG's Share of Total Debt | ||||||||||
|---|---|---|---|---|---|---|---|---|---|---|---|---|---|---|---|
| 2002 | 1 | 135,793 | 0 | 64,123 | 199,916 | ||||||||||
| 2003 | 2 | 577,306 | 993,000 | 245,142 | 1,815,448 | ||||||||||
| 2004 | 3 | 709,371 | 965,026 | 217,026 | 1,891,423 | ||||||||||
| 2005 | 4 | 215,511 | 660,000 | 355,655 | 1,231,166 | ||||||||||
| 2006 | 5 | 284,504 | 550,000 | 336,146 | 1,170,650 | ||||||||||
| 2007 | 6 | 275,230 | 930,000 | 145,805 | 1,351,035 | ||||||||||
| 2008 | 7 | 95,720 | 200,000 | 397,460 | 693,180 | ||||||||||
| 2009 | 8 | 338,447 | 450,000 | 65,059 | 853,506 | ||||||||||
| 2010 | 9 | 106,279 | 0 | 303,157 | 409,436 | ||||||||||
| 2011 | 10 | 365,958 | 200,000 | 158,298 | 724,256 | ||||||||||
| Thereafter | 102,996 | 525,000 | 126,914 | 754,910 | |||||||||||
| Subtotal Face Amounts | $ | 3,207,115 | $ | 5,473,026 | $ | 2,414,785 | $ | 11,094,926 | |||||||
| Premiums and Discounts on Indebtedness, Net | (8,844 | ) | (12,514 | ) | 5,696 | (15,662 | ) | ||||||||
| SPG's Share of Total Indebtedness | $ | 3,198,271 | $ | 5,460,512 | $ | 2,420,481 | $ | 11,079,264 | |||||||
16
SIMON PROPERTY GROUP
Summary of Indebtedness
As of March 31, 2002
(In thousands)
| | Total Indebtedness | SPG's Share of Indebtedness | Weighted Avg. Interest Rate | Weighted Avg. Years to Maturity | ||||||
|---|---|---|---|---|---|---|---|---|---|---|
| Consolidated Indebtedness | ||||||||||
Mortgage Debt | ||||||||||
| Fixed Rate(1) | 2,488,404 | 2,350,366 | 7.36 | % | 6.0 | |||||
| Other Hedged Debt | 197,000 | 185,250 | 4.44 | % | 3.4 | |||||
| Floating Rate Debt | 675,219 | 671,500 | 3.15 | % | 2.3 | |||||
| Total Mortgage Debt | 3,360,623 | 3,207,115 | 6.31 | % | 5.1 | |||||
Unsecured Debt | ||||||||||
| Fixed Rate | 4,818,200 | 4,818,200 | 6.99 | % | 5.3 | |||||
| Floating Rate Debt | 171,826 | 171,826 | 2.52 | % | 2.0 | |||||
| Subtotal | 4,990,026 | 4,990,026 | 6.84 | % | 5.1 | |||||
Revolving Corporate Credit Facility | 278,000 | 278,000 | 2.53 | % | 1.4 | |||||
| Revolving Corporate Credit Facility (Hedged) | 140,000 | 140,000 | 2.53 | % | 1.4 | |||||
| Unsecured Term Loan | 65,000 | 65,000 | 2.68 | % | 1.4 | |||||
| Total Unsecured Debt | 5,473,026 | 5,473,026 | 6.46 | % | 4.9 | |||||
Net Discount—Fixed Rate | (15,876 | ) | (15,715 | ) | N/A | N/A | ||||
| Fair Value Interest Rate Swaps | (5,643 | ) | (5,643 | ) | N/A | N/A | ||||
| Consolidated Mortgages and Other Indebtedness | 8,812,130 | 8,658,783 | 6.40 | % | 4.9 | |||||
Joint Venture Indebtedness | ||||||||||
| Mortgage Debt | ||||||||||
| Fixed Rate | 4,166,906 | 1,805,794 | 7.37 | % | 6.3 | |||||
| Other Hedged Debt | 897,900 | 343,319 | 2.83 | % | 2.6 | |||||
| Floating Rate Debt | 663,687 | 262,477 | 3.44 | % | 1.9 | |||||
| Total Mortgage Debt | 5,728,493 | 2,411,590 | 6.30 | % | 5.3 | |||||
Unsecured Floating Rate Debt | 6,500 | 3,194 | 4.13 | % | 1.3 | |||||
| Total Unsecured Debt | 6,500 | 3,194 | 4.13 | % | 1.3 | |||||
Net Premium—Variable Rate | 11,372 | 5,696 | N/A | N/A | ||||||
| Joint Venture Mortgages and Other Indebtedness | 5,746,365 | 2,420,480 | 6.30 | % | 5.3 | |||||
SPG's Share of Total Indebtedness | 11,079,263 | 6.38 | % | 5.0 | ||||||
- (1)
- Includes $162,984 of variable rate debt, of which $126,953 is SPG's share, that is effectively fixed to maturity through the use of interest rate hedges.
17
SIMON PROPERTY GROUP
Summary of Indebtedness By Maturity
As of March 31, 2002
(In thousands)
| Property Name | | Maturity Date | Interest Rate | Total Indebtedness | SPG's Share of Indebtedness | Weighted Avg Interest Rate by Year | |||||||||
|---|---|---|---|---|---|---|---|---|---|---|---|---|---|---|---|
| Consolidated Indebtedness | |||||||||||||||
| Fixed Rate Mortgage Debt: | |||||||||||||||
| North Riverside Park Plaza—1 | 09/01/02 | 9.38 | % | 3,685 | 3,685 | ||||||||||
| North Riverside Park Plaza—2 | 09/01/02 | 10.00 | % | 3,308 | 3,308 | ||||||||||
| South Park Mall—3 | (7) | 09/15/02 | 7.01 | % | 2,000 | 2,000 | |||||||||
| Hutchinson Mall—2 | (8) | 09/15/02 | 6.81 | % | 4,400 | 4,400 | |||||||||
| Hutchinson Mall—1 | (8) | 11/01/02 | 8.44 | % | 11,019 | 11,019 | |||||||||
| Palm Beach Mall | 12/15/02 | 7.50 | % | 46,737 | 46,737 | ||||||||||
| Subtotal 2002 | 71,149 | 71,149 | 7.80 | % | |||||||||||
Principal Mutual Mortgages—Pool 1 | (1),(7) | 03/15/03 | 6.66 | % | 76,950 | 76,950 | |||||||||
| Principal Mutual Mortgages—Pool 2 | (1),(8) | 03/15/03 | 6.62 | % | 109,207 | 109,207 | |||||||||
| South Park Mall | (7) | 06/15/03 | 7.25 | % | 23,462 | 23,462 | |||||||||
| Century III Mall | 07/01/03 | 6.78 | % | 66,000 | 66,000 | ||||||||||
| Miami International Mall | 12/21/03 | 6.91 | % | 44,501 | 26,701 | ||||||||||
| Subtotal 2003 | 320,120 | 302,320 | 6.74 | % | |||||||||||
Battlefield Mall—1 | 01/01/04 | 7.50 | % | 44,691 | 44,691 | ||||||||||
| Battlefield Mall—2 | 01/01/04 | 6.81 | % | 43,373 | 43,373 | ||||||||||
| Forum Phase I—Class A-2 | 05/15/04 | 6.19 | % | 44,386 | 26,632 | ||||||||||
| Forum Phase II—Class A-2 | 05/15/04 | 6.19 | % | 40,614 | 22,338 | ||||||||||
| Forum Phase I—Class A-1 | 05/15/04 | 7.13 | % | 46,996 | 28,198 | ||||||||||
| Forum Phase II—Class A-1 | 05/15/04 | 7.13 | % | 43,004 | 23,652 | ||||||||||
| CMBS Loan—Fixed Component | (10) | 12/15/04 | 7.31 | % | 174,682 | 174,682 | |||||||||
| CMBS Loan—Variable Component | (4),(10) | 12/15/04 | 6.20 | % | 49,784 | 49,784 | |||||||||
| Subtotal 2004 | 487,530 | 413,349 | 6.99 | % | |||||||||||
Tippecanoe Mall—1 | 01/01/05 | 8.45 | % | 43,500 | 43,500 | ||||||||||
| Tippecanoe Mall—2 | 01/01/05 | 6.81 | % | 15,424 | 15,424 | ||||||||||
| Melbourne Square | 02/01/05 | 7.42 | % | 37,673 | 37,673 | ||||||||||
| Cielo Vista Mall—2 | 11/01/05 | 8.13 | % | 1,184 | 1,184 | ||||||||||
| Subtotal 2005 | 97,781 | 97,781 | 7.79 | % | |||||||||||
Treasure Coast Square—1 | 01/01/06 | 7.42 | % | 50,417 | 50,417 | ||||||||||
| Treasure Coast Square—2 | 01/01/06 | 8.06 | % | 11,756 | 11,756 | ||||||||||
| Gulf View Square | 10/01/06 | 8.25 | % | 35,601 | 35,601 | ||||||||||
| Paddock Mall | 10/01/06 | 8.25 | % | 28,315 | 28,315 | ||||||||||
| Subtotal 2006 | 126,089 | 126,089 | 7.90 | % | |||||||||||
Cielo Vista Mall—1 | (3) | 05/01/07 | 9.38 | % | 52,712 | 52,712 | |||||||||
| Cielo Vista Mall—3 | (3) | 05/01/07 | 6.76 | % | 37,541 | 37,541 | |||||||||
| Lakeline Mall | 05/01/07 | 7.65 | % | 70,275 | 70,275 | ||||||||||
| McCain Mall—1 | (3) | 05/01/07 | 9.38 | % | 24,613 | 24,613 | |||||||||
| McCain Mall—2 | (3) | 05/01/07 | 6.76 | % | 17,328 | 17,328 | |||||||||
| Valle Vista Mall—1 | (3) | 05/01/07 | 9.38 | % | 32,599 | 32,599 | |||||||||
| Valle Vista Mall—2 | (3) | 05/01/07 | 6.81 | % | 7,704 | 7,704 | |||||||||
| University Park Mall | 10/01/07 | 7.43 | % | 59,500 | 35,700 | ||||||||||
| Subtotal 2007 | 302,272 | 278,472 | 8.10 | % | |||||||||||
Arsenal Mall—1 | 09/28/08 | 6.75 | % | 33,739 | 33,739 | ||||||||||
| Subtotal 2008 | 33,739 | 33,739 | 6.75 | % | |||||||||||
18
College Mall—1 | (2) | 01/01/09 | 7.00 | % | 39,177 | 39,177 | |||||||||
| College Mall—2 | (2) | 01/01/09 | 6.67 | % | 11,565 | 11,565 | |||||||||
| Greenwood Park Mall—1 | (2) | 01/01/09 | 7.00 | % | 32,812 | 32,812 | |||||||||
| Greenwood Park Mall—2 | (2) | 01/01/09 | 6.76 | % | 59,750 | 59,750 | |||||||||
| Towne East Square—1 | (2) | 01/01/09 | 7.00 | % | 51,795 | 51,795 | |||||||||
| Towne East Square—2 | (2) | 01/01/09 | 6.81 | % | 24,100 | 24,100 | |||||||||
| Bloomingdale Court | 10/01/09 | 7.78 | % | 29,259 | 29,259 | ||||||||||
| Forest Plaza | 10/01/09 | 7.78 | % | 16,048 | 16,048 | ||||||||||
| Lake View Plaza | 10/01/09 | 7.78 | % | 21,332 | 21,332 | ||||||||||
| Lakeline Plaza | 10/01/09 | 7.78 | % | 23,387 | 23,387 | ||||||||||
| Lincoln Crossing | 10/01/09 | 7.78 | % | 3,231 | 3,231 | ||||||||||
| Matteson Plaza | 10/01/09 | 7.78 | % | 9,394 | 9,394 | ||||||||||
| Muncie Plaza | 10/01/09 | 7.78 | % | 8,122 | 8,122 | ||||||||||
| Regency Plaza | 10/01/09 | 7.78 | % | 4,403 | 4,403 | ||||||||||
| St. Charles Towne Plaza | 10/01/09 | 7.78 | % | 28,182 | 28,182 | ||||||||||
| West Ridge Plaza | 10/01/09 | 7.78 | % | 5,676 | 5,676 | ||||||||||
| White Oaks Plaza | 10/01/09 | 7.78 | % | 17,321 | 17,321 | ||||||||||
| Subtotal 2009 | 385,554 | 385,554 | 7.28 | % | |||||||||||
Trolley Square | 08/01/10 | 9.03 | % | 29,490 | 26,541 | ||||||||||
| Crystal River | 11/11/10 | 7.63 | % | 16,120 | 16,120 | ||||||||||
| Biltmore Square | 12/11/10 | 7.95 | % | 26,000 | 17,342 | ||||||||||
| Port Charlotte Town Center | 12/11/10 | 7.98 | % | 53,250 | 42,600 | ||||||||||
| Subtotal 2010 | 124,860 | 102,603 | 8.19 | % | |||||||||||
Ingram Park Mall | (9) | 08/11/11 | 6.99 | % | 83,852 | 83,852 | |||||||||
| Knoxville Center | (9) | 08/11/11 | 6.99 | % | 63,498 | 63,498 | |||||||||
| Northlake Mall | (9) | 08/11/11 | 6.99 | % | 73,252 | 73,252 | |||||||||
| Towne West Square | (9) | 08/11/11 | 6.99 | % | 54,889 | 54,889 | |||||||||
| Tacomaa Mall | 09/28/11 | 7.00 | % | 134,440 | 134,440 | ||||||||||
| Subtotal 2011 | 409,931 | 409,931 | 6.99 | % | |||||||||||
Chesapeake Center | 05/15/15 | 8.44 | % | 6,563 | 6,563 | ||||||||||
| Grove at Lakeland Square, The | 05/15/15 | 8.44 | % | 3,750 | 3,750 | ||||||||||
| Terrace at Florida Mall, The | 05/15/15 | 8.44 | % | 4,688 | 4,688 | ||||||||||
| Subtotal 2015 | 15,001 | 15,001 | 8.44 | % | |||||||||||
Arsenal Mall—2 | 05/15/16 | 8.20 | % | 2,022 | 2,022 | ||||||||||
| Subtotal 2016 | 2,022 | 2,022 | 8.20 | % | |||||||||||
Sunland Park Mall | 01/01/26 | 8.63 | % | 38,139 | 38,139 | ||||||||||
| Subtotal 2026 | 38,139 | 38,139 | 8.63 | % | |||||||||||
Keystone at the Crossing | 07/01/27 | 7.85 | % | 61,971 | 61,971 | ||||||||||
| Subtotal 2027 | 61,971 | 61,971 | 7.85 | % | |||||||||||
Other | 4/20/05 | 7.60 | % | 12,246 | 12,246 | ||||||||||
| Total Consolidated Fixed Rate Mortgage Debt | 2,488,404 | 2,350,366 | 7.36 | % | |||||||||||
19
Variable Rate Mortgage Debt: | |||||||||||||||
| Randall Park Mall—1 | (11) | 12/11/01 | 8.35 | % | 35,000 | 35,000 | |||||||||
| Randall Park Mall—2 | (11) | 12/11/01 | 6.88 | % | 5,000 | 5,000 | |||||||||
| Subtotal 2001 | 40,000 | 40,000 | 8.17 | % | |||||||||||
Bowie Mall—1 | (5) | 12/14/02 | 3.38 | % | 1,294 | 1,294 | |||||||||
| Subtotal 2002 | 1,294 | 1,294 | 3.38 | % | |||||||||||
Raleigh Springs Mall | 02/23/03 | 3.53 | % | 11,000 | 11,000 | ||||||||||
| Richmond Towne Square | (1) | 07/15/03 | 2.88 | % | 58,646 | 58,646 | |||||||||
| Shops @ Mission Viejo | (1) | 08/31/03 | 2.93 | % | 148,073 | 148,073 | |||||||||
| Arboretum | (1) | 11/30/03 | 3.38 | % | 34,000 | 34,000 | |||||||||
| Subtotal 2003 | 251,719 | 251,719 | 3.00 | % | |||||||||||
| Jefferson Valley Mall | (1) | 01/11/04 | 3.13 | % | 60,000 | 60,000 | |||||||||
| North East Mall | (1) | 05/21/04 | 3.25 | % | 149,007 | 149,007 | |||||||||
| Waterford Lakes | 08/16/04 | 3.28 | % | 67,296 | 67,296 | ||||||||||
| Subtotal 2004 | 276,303 | 276,303 | 3.23 | % | |||||||||||
| Brunswick Square | (1) | 06/12/05 | 3.38 | % | 45,000 | 45,000 | |||||||||
| Bowie Mall—2 | (1),(5) | 12/14/05 | 3.38 | % | 52,340 | 52,340 | |||||||||
| Subtotal 2005 | 97,340 | 97,340 | 3.38 | % | |||||||||||
| Chesapeake Square | (1) | 07/01/06 | 4.63 | % | 47,000 | 35,250 | |||||||||
| Riverway | (1) | 10/01/06 | 3.03 | % | 110,000 | 110,000 | |||||||||
| Subtotal 2006 | 157,000 | 145,250 | 3.42 | % | |||||||||||
| White Oaks Mall | (1) | 02/25/08 | 2.98 | % | 48,563 | 44,844 | |||||||||
| Subtotal 2008 | 48,563 | 44,844 | 2.98 | % | |||||||||||
| Total Variable Rate Mortgage Debt | 872,219 | 856,750 | 3.43 | % | |||||||||||
| Total Consolidated Mortgage Debt | 3,360,623 | 3,207,115 | 6.31 | % | |||||||||||
| Fixed Rate Unsecured Debt: | |||||||||||||||
| Retail Property Trust (Bonds) | 04/01/03 | 7.05 | % | 100,000 | 100,000 | ||||||||||
| Simon Property Group, LP (Bonds) | 06/15/03 | 6.63 | % | 375,000 | 375,000 | ||||||||||
| Simon Property Group, LP (PATS) | 11/15/03 | 6.75 | % | 100,000 | 100,000 | ||||||||||
| Subtotal 2003 | 575,000 | 575,000 | 6.72 | % | |||||||||||
| Shopping Center Associates (Bonds) | 01/15/04 | 6.75 | % | 150,000 | 150,000 | ||||||||||
| Simon Property Group, LP (Bonds) | 02/09/04 | 6.75 | % | 300,000 | 300,000 | ||||||||||
| Simon ERE Facility | (1) | 07/31/04 | 7.75 | % | 28,200 | 28,200 | |||||||||
| Simon Property Group, LP (Bonds) | 07/15/04 | 6.75 | % | 100,000 | 100,000 | ||||||||||
| Retail Property Trust (Bonds) | 08/15/04 | 7.75 | % | 150,000 | 150,000 | ||||||||||
| Subtotal 2004 | 728,200 | 728,200 | 6.99 | % | |||||||||||
| Shopping Center Associates (Bonds) | 05/15/05 | 7.63 | % | 110,000 | 110,000 | ||||||||||
| Simon Property Group, LP (Bonds) | 06/15/05 | 6.75 | % | 300,000 | 300,000 | ||||||||||
| Simon Property Group, LP (Medium Term Notes) | 06/24/05 | 7.13 | % | 100,000 | 100,000 | ||||||||||
| Simon Property Group, LP (Bonds) | 10/27/05 | 6.88 | % | 150,000 | 150,000 | ||||||||||
| Subtotal 2005 | 660,000 | 660,000 | 6.98 | % | |||||||||||
20
Simon Property Group, LP (Bonds) | 01/20/06 | 7.38 | % | 300,000 | 300,000 | ||||||||||
| Simon Property Group, LP (Bonds) | 11/15/06 | 6.88 | % | 250,000 | 250,000 | ||||||||||
| Subtotal 2006 | 550,000 | 550,000 | 7.15 | % | |||||||||||
| Simon Property Group, LP (Medium Term Notes) | 09/20/07 | 7.13 | % | 180,000 | 180,000 | ||||||||||
| Simon Property Group, LP (Bonds) | 11/15/07 | 6.38 | % | 750,000 | 750,000 | ||||||||||
| Subtotal 2007 | 930,000 | 930,000 | 6.52 | % | |||||||||||
| Simon Property Group, LP (MOPPRS) | 06/15/08 | 7.00 | % | 200,000 | 200,000 | ||||||||||
| Subtotal 2008 | 200,000 | 200,000 | 7.00 | % | |||||||||||
| Simon Property Group, LP (Bonds) | 02/09/09 | 7.13 | % | 300,000 | 300,000 | ||||||||||
| Simon Property Group, LP (Bonds) | 07/15/09 | 7.00 | % | 150,000 | 150,000 | ||||||||||
| Subtotal 2009 | 450,000 | 450,000 | 7.08 | % | |||||||||||
| Simon Property Group, LP (Bonds) | 01/20/11 | 7.75 | % | 200,000 | 200,000 | ||||||||||
| Subtotal 2011 | 200,000 | 200,000 | 7.75 | % | |||||||||||
| Retail Property Trust (Bonds) | 09/01/13 | 7.18 | % | 75,000 | 75,000 | ||||||||||
| Subtotal 2013 | 75,000 | 75,000 | 7.18 | % | |||||||||||
| Retail Property Trust (Bonds) | 03/15/16 | 7.88 | % | 250,000 | 250,000 | ||||||||||
| Subtotal 2016 | 250,000 | 250,000 | 7.88 | % | |||||||||||
| Simon Property Group, LP (Bonds) | 06/15/18 | 7.38 | % | 200,000 | 200,000 | ||||||||||
| Subtotal 2018 | 200,000 | 200,000 | 7.38 | % | |||||||||||
| Total Unsecured Fixed Rate Debt | 4,818,200 | 4,818,200 | 6.99 | % | |||||||||||
| Variable Rate Unsecured Debt: | |||||||||||||||
| Corporate Revolving Credit Facility | (12) | 08/25/03 | 2.53 | % | 418,000 | 418,000 | |||||||||
| �� | Subtotal 2003 | 418,000 | 418,000 | 2.53 | % | ||||||||||
Simon Property Group, LP (Term Loan) | (1) | 02/28/04 | 2.53 | % | 150,000 | 150,000 | |||||||||
| Simon Property Group, LP (Term Loan) | (1) | 03/15/04 | 2.68 | % | 65,000 | 65,000 | |||||||||
| Simon ERE Facility | (1) | 07/31/04 | 2.48 | % | 21,826 | 21,826 | |||||||||
| Subtotal 2004 | 236,826 | 236,826 | 2.57 | % | |||||||||||
Total Unsecured Variable Rate Debt | 654,826 | 654,826 | 2.54 | % | |||||||||||
| Total Unsecured Debt | 5,473,026 | 5,473,026 | 6.46 | % | |||||||||||
| Net Discount on Fixed-Rate Indebtedness | (15,876 | ) | (15,715 | ) | N/A | ||||||||||
| Fair Value Interest Rate Swaps | (5,643 | ) | (5,643 | ) | N/A | ||||||||||
Total Consolidated Debt | 8,812,130 | 8,658,783 | 6.40 | % | |||||||||||
21
| JointVenture Indebtedness | |||||||||||||||
Fixed Rate Mortgage Debt: | |||||||||||||||
Crystal Mall | 02/01/03 | 8.66 | % | 46,461 | 34,645 | ||||||||||
| Avenues, The | 05/15/03 | 8.36 | % | 54,977 | 13,744 | ||||||||||
| Subtotal 2003 | 101,438 | 48,390 | 8.57 | % | |||||||||||
Solomon Pond | 02/01/04 | 7.83 | % | 93,732 | 46,058 | ||||||||||
| Northshore Mall | 05/14/04 | 9.05 | % | 161,000 | 79,111 | ||||||||||
| Indian River Commons | 11/01/04 | 7.58 | % | 8,289 | 4,145 | ||||||||||
| Indian River Mall | 11/01/04 | 7.58 | % | 45,993 | 22,997 | ||||||||||
| Subtotal 2004 | 309,014 | 152,310 | 8.42 | % | |||||||||||
Westchester, The—1 | 09/01/05 | 8.74 | % | 147,671 | 59,068 | ||||||||||
| Westchester, The—2 | 09/01/05 | 7.20 | % | 52,348 | 20,939 | ||||||||||
| Subtotal 2005 | 200,019 | 80,008 | 8.34 | % | |||||||||||
Cobblestone Court | 01/01/06 | 7.64 | % | 6,179 | 2,163 | ||||||||||
| Crystal Court | 01/01/06 | 7.64 | % | 3,569 | 1,249 | ||||||||||
| Fairfax Court | 01/01/06 | 7.64 | % | 10,319 | 2,709 | ||||||||||
| Gaitway Plaza | 01/01/06 | 7.64 | % | 7,349 | 1,715 | ||||||||||
| Plaza at Buckland Hills, The | 01/01/06 | 7.64 | % | 17,679 | 6,055 | ||||||||||
| Ridgewood Court | 01/01/06 | 7.64 | % | 7,979 | 2,793 | ||||||||||
| Royal Eagle Plaza | 01/01/06 | 7.64 | % | 7,920 | 2,772 | ||||||||||
| Village Park Plaza | 01/01/06 | 7.64 | % | 8,959 | 3,136 | ||||||||||
| West Town Corners | 01/01/06 | 7.64 | % | 10,329 | 2,411 | ||||||||||
| Westland Park Plaza | 01/01/06 | 7.64 | % | 4,950 | 1,155 | ||||||||||
| Willow Knolls Court | 01/01/06 | 7.64 | % | 6,489 | 2,271 | ||||||||||
| Yards Plaza, The | 01/01/06 | 7.64 | % | 8,270 | 2,895 | ||||||||||
| CMBS Loan—Fixed Component (IBM) | (6) | 05/15/06 | 7.41 | % | 300,000 | 150,000 | |||||||||
| CMBS Loan—Fixed Component—2 (IBM) | (6) | 05/15/06 | 8.13 | % | 57,100 | 28,550 | |||||||||
| Great Northeast Plaza | 06/01/06 | 9.04 | % | 17,123 | 8,562 | ||||||||||
| Smith Haven Mall | 06/01/06 | 7.86 | % | 115,000 | 28,750 | ||||||||||
| Mall of Georgia Crossing | 06/09/06 | 7.25 | % | 34,036 | 17,018 | ||||||||||
| Greendale Mall | 11/01/06 | 8.23 | % | 41,312 | 20,300 | ||||||||||
| Subtotal 2006 | 664,562 | 284,501 | 7.65 | % | |||||||||||
Town Center at Cobb—1 | 04/01/07 | 7.54 | % | 48,896 | 24,448 | ||||||||||
| Town Center at Cobb—2 | 04/01/07 | 7.25 | % | 64,068 | 32,034 | ||||||||||
| Gwinnett Place—1 | 04/01/07 | 7.54 | % | 38,378 | 19,189 | ||||||||||
| Gwinnett Place—2 | 04/01/07 | 7.25 | % | 84,186 | 42,093 | ||||||||||
| Mall at Rockingham | 08/01/07 | 7.88 | % | 98,650 | 24,237 | ||||||||||
| Subtotal 2007 | 334,178 | 142,001 | 7.45 | % | |||||||||||
22
Metrocenter | 02/28/08 | 8.45 | % | 29,748 | 14,874 | ||||||||||
| Aventura Mall—A | 04/06/08 | 6.55 | % | 141,000 | 47,000 | ||||||||||
| Aventura Mall—B | 04/06/08 | 6.60 | % | 25,400 | 8,467 | ||||||||||
| Aventura Mall—C | 04/06/08 | 6.89 | % | 33,600 | 11,200 | ||||||||||
| West Town Mall | 05/01/08 | 6.90 | % | 76,000 | 38,000 | ||||||||||
| Mall of New Hampshire—1 | 10/01/08 | 6.96 | % | 102,531 | 50,381 | ||||||||||
| Mall of New Hampshire—2 | 10/01/08 | 8.53 | % | 8,357 | 4,106 | ||||||||||
| Grapevine Mills—1 | 10/01/08 | 6.47 | % | 155,000 | 58,125 | ||||||||||
| Fashion Valley Mall—1 | 10/11/08 | 6.49 | % | 170,000 | 85,000 | ||||||||||
| Fashion Valley Mall—2 | 10/11/08 | 6.58 | % | 29,124 | 14,562 | ||||||||||
| Ontario Mills—2 | 11/02/08 | 6.75 | % | 140,259 | 35,065 | ||||||||||
| Source, The | 11/06/08 | 6.65 | % | 124,000 | 31,000 | ||||||||||
| Grapevine Mills—2 | 11/05/08 | 8.39 | % | 14,382 | 5,393 | ||||||||||
| Ontario Mills—3 | 12/05/08 | 8.00 | % | 10,419 | 2,605 | ||||||||||
| Subtotal 2008 | 1,059,820 | 405,778 | 6.77 | % | |||||||||||
Apple Blossom Mall | 09/10/09 | 7.99 | % | 40,209 | 19,758 | ||||||||||
| Auburn Mall | 09/10/09 | 7.99 | % | 47,073 | 23,130 | ||||||||||
| European Assets—Fixed Components | 12/13/09 | 6.37 | % | 32,719 | 10,558 | ||||||||||
| Ontario Mills—1 | 12/28/09 | 6.00 | % | 3,345 | 836 | ||||||||||
| Subtotal 2009 | 123,346 | 54,283 | 7.65 | % | |||||||||||
Mall of Georgia | 07/01/10 | 7.09 | % | 200,000 | 100,000 | ||||||||||
| Coral Square | 10/01/10 | 8.00 | % | 90,000 | 45,000 | ||||||||||
| Arizona Mills | 10/05/10 | 7.90 | % | 144,582 | 38,048 | ||||||||||
| Florida Mall, The | 11/13/10 | 7.55 | % | 267,188 | 133,594 | ||||||||||
| Subtotal 2010 | 701,770 | 316,642 | 7.51 | % | |||||||||||
Atrium at Chestnut Hill | 03/11/11 | 6.89 | % | 48,689 | 23,925 | ||||||||||
| Cape Cod Mall | 03/11/11 | 6.80 | % | 99,042 | 48,667 | ||||||||||
| Highland Mall | 06/30/11 | 6.83 | % | 70,639 | 35,320 | ||||||||||
| Fashion Centre Pentagon Retail | 09/11/11 | 6.63 | % | 166,136 | 70,608 | ||||||||||
| Subtotal 2011 | 384,506 | 178,519 | 6.75 | % | |||||||||||
Dadeland Mall | 01/31/12 | 6.75 | % | 199,753 | 99,877 | ||||||||||
| Square One | 03/11/12 | 6.73 | % | 95,000 | 46,681 | ||||||||||
| Subtotal 2012 | 294,753 | 146,557 | 6.74 | % | |||||||||||
Total Joint Venture Fixed Rate Mortgage Debt | 4,173,406 | 1,808,988 | 7.37 | % | |||||||||||
Variable Rate Mortgage Debt: | |||||||||||||||
| Shops at Sunset Place, The | 06/30/02 | 3.03 | % | 113,829 | 42,686 | ||||||||||
| Montreal Forum | 07/31/02 | 6.50 | % | 34,460 | 12,276 | ||||||||||
| Subtotal 2002 | 148,289 | 54,962 | 3.80 | % | |||||||||||
CMBS Loan—Floating Component (IBM) | (6) | 05/15/03 | 2.38 | % | 184,500 | 92,250 | |||||||||
| Liberty Tree Mall | (1) | 10/01/03 | 3.38 | % | 45,797 | 22,504 | |||||||||
| Concord Mills | (1) | 12/02/03 | 3.23 | % | 179,864 | 67,449 | |||||||||
| Subtotal 2003 | 410,161 | 182,203 | 2.82 | % | |||||||||||
23
Circle Centre Mall—1 | (1) | 01/31/04 | 2.32 | % | 60,000 | 8,802 | |||||||||
| Circle Centre Mall—2 | (1) | 01/31/04 | 3.38 | % | 7,500 | 1,100 | |||||||||
| Orlando Premium Outlets | 02/12/04 | 3.18 | % | 59,103 | 29,552 | ||||||||||
| Fashion Centre Pentagon Office | (1) | 09/10/04 | 3.38 | % | 33,000 | 14,025 | |||||||||
| Subtotal 2004 | 159,603 | 53,479 | 3.09 | % | |||||||||||
Mall of America | (1) | 03/10/05 | 2.41 | % | 312,000 | 85,800 | |||||||||
| Emerald Square Mall—1 | (1) | 04/01/05 | 3.18 | % | 129,400 | 63,584 | |||||||||
| Emerald Square Mall—2 | (1) | 04/01/05 | 4.93 | % | 15,600 | 7,665 | |||||||||
| Arundel Mills | (1) | 04/30/05 | 3.28 | % | 174,247 | 65,343 | |||||||||
| Northfield Square | (1) | 04/30/05 | 4.38 | % | 37,000 | 11,692 | |||||||||
| Seminole Towne Center | (1) | 07/01/05 | 4.38 | % | 70,500 | 31,725 | |||||||||
| Subtotal 2005 | 738,747 | 265,809 | 3.20 | % | |||||||||||
CMBS Loan—Floating Component—2 (IBM) | (6) | 05/15/06 | 2.25 | % | 81,400 | 40,700 | |||||||||
| Subtotal 2006 | 81,400 | 40,700 | 2.25 | % | |||||||||||
European Assets—Variable Components | 08/10/09 | 5.76 | % | 16,887 | 5,449 | ||||||||||
| Subtotal 2009 | 16,887 | 5,449 | 5.76 | % | |||||||||||
| Total Joint Venture Variable Rate Mortgage Debt | 1,555,087 | 602,602 | 3.09 | % | |||||||||||
Unsecured Debt: | |||||||||||||||
Mayflower Realty Credit Facility | (1) | 07/12/03 | 4.13 | % | 6,500 | 3,194 | |||||||||
| Subtotal 2003 | 6,500 | 3,194 | 4.13 | % | |||||||||||
| Total Unsecured Debt | 6,500 | 3,194 | 4.13 | % | |||||||||||
| Net Premium on JV Variable-Rate Indebtedness | 11,372 | 5,696 | |||||||||||||
Total Joint Venture Debt | 5,746,365 | 2,420,480 | 6.30 | % | |||||||||||
SPG's Share of Total Indebtedness | 14,558,495 | 11,079,263 | 6.38 | % | |||||||||||
Footnotes:
- (1)
- Includes applicable extensions available at Simon Group's option.
- (2)
- This Pool is secured by cross-collateralized and cross-defaulted mortgages encumbering these three Properties.
- (3)
- This Pool is secured by cross-collateralized and cross-defaulted mortgages encumbering these three Properties.
- (4)
- Through an interest rate protection agreement, effectively fixed at an all-in rate of 6.2%.
- (5)
- These Notes are cross-collateralized.
- (6)
- These Commercial Mortgage Notes are secured by cross-collateralized mortgages encumbering thirteen Properties. A weighted average rate is used.
24
- (7)
- This Principal Mutual Pool 1 loan is secured by cross-collateralized and cross-defaulted mortgages encumbering four of the Properties (Anderson, Forest Village Park, Longview, and South Park). A weighted average rate is used for these Pool 1 Properties.
- (8)
- This property is a component of Pool 2 with Principal Mutual. The loan is secured by cross-collateralized and cross-defaulted mortgages encumbering six of the Properties (Eastland, Hutchinson, Markland, Midland, North Towne Square and Forest Mall).
- (9)
- These four notes are cross-collateralized.
- (10)
- These notes are secured by cross-collateralized and cross-defaulted mortgages encumbering seven Properties.
- (11)
- Simon Group is currently in process of disposing of asset.
- (12)
- Subsequent to March 31, 2002, Simon Group refinanced its Corporate Revolving Credit Facility, with essentially the same terms, extending its maturity date to April 16, 2005 with the option to exercise a one-year extension available at Simon Group's option.
25
SIMON PROPERTY GROUP
Summary of Variable Rate Debt and Interest Rate Protection Agreements
As of March 31, 2002
(In thousands)
| Property Name | Maturity Date | Principal Balance 03/31/02 | SPG Ownership % | SPG's Share of Loan Balance | Interest Rate(1) 03/31/02 | Terms of Variable Rate | Terms of Interest Rate Protection Agreement | |||||||
|---|---|---|---|---|---|---|---|---|---|---|---|---|---|---|
| Consolidated Indebtedness: | ||||||||||||||
| Variable Rate Debt Effectively Fixed to Maturity: | ||||||||||||||
| Forum Phase I—Class A-2 | 05/15/04 | 44,386 | 60.00 | % | 26,632 | 6.190 | % | LIBOR + 0.300% | Through an interest rate protection agreement, effectively fixed at an all-in-rate of 6.19%. | |||||
| Forum Phase II—Class A-2 | 05/15/04 | 40,614 | 55.00 | % | 22,338 | 6.190 | % | LIBOR + 0.300% | Through an interest rate protection agreement, effectively fixed at an all-in-rate of 6.19%. | |||||
| Simon ERE Facility—Swap component | 07/31/04 | 28,200 | 100.00 | % | 28,200 | 7.750 | % | EURIBOR + 0.600% | Through a cross-currency swap, effectively fixed notional amount and EURIBOR to equate to a USD notional amount at a USD rate of 7.75%. | |||||
| CMBS Loan—Variable Component | 12/15/04 | 49,784 | 100.00 | % | 49,784 | 6.200 | % | LIBOR + 0.405% | Through an interest rate protection agreement, effectively fixed at an all-in-rate of 6.2%. | |||||
| 162,984 | 126,953 | |||||||||||||
| Other Hedged Debt: | ||||||||||||||
| Randall Park Mall—1 | 12/11/01 | 35,000 | 100.00 | % | 35,000 | 8.350 | % | LIBOR + 3.100% | LIBOR Capped at a rate of 6.40% through maturity. Embedded floor is set at 5.25% | |||||
| Randall Park Mall—2 | 12/11/01 | 5,000 | 100.00 | % | 5,000 | 6.879 | % | LIBOR + 5.000% | LIBOR Capped at a rate of 6.40% through maturity. Embedded floor is set at 5.25% | |||||
| Unsecured Revolving Credit Facility—(1.25B—capped) | 09/21/51 | 140,000 | 100.00 | % | 140,000 | 2.529 | % | LIBOR + 0.650% | LIBOR Capped at a rate subject to an 11.53% LIBOR cap on $90M and a 16.77% LIBOR cap on $50M | |||||
| Chesapeake Square | 07/01/06 | 47,000 | 75.00 | % | 35,250 | 4.629 | % | LIBOR + 2.750% | LIBOR Capped at a rate of 6.50% through July 1, 2004. | |||||
| Riverway | 10/01/06 | 110,000 | 100.00 | % | 110,000 | 3.029 | % | LIBOR + 1.150% | LIBOR Capped at a rate of 8.10% through August 1, 2003. | |||||
| 337,000 | 325,250 | |||||||||||||
| Floating Rate Debt: | ||||||||||||||
| Bowie Mall—1 | 12/14/02 | 1,294 | 100.00 | % | 1,294 | 3.379 | % | LIBOR + 1.500% | ||||||
| Raleigh Springs Mall | 02/23/03 | 11,000 | 100.00 | % | 11,000 | 3.529 | % | LIBOR + 1.650% | ||||||
| Richmond Towne Square | 07/15/03 | 58,646 | 100.00 | % | 58,646 | 2.879 | % | LIBOR + 1.000% | ||||||
| Unsecured Revolving Credit Facility | 08/25/03 | 278,000 | 100.00 | % | 278,000 | 2.529 | % | LIBOR + 0.650% | ||||||
| Shops @ Mission Viejo | 08/31/03 | 148,073 | 100.00 | % | 148,073 | 2.929 | % | LIBOR + 1.050% | ||||||
| Arboretum | 11/30/03 | 34,000 | 100.00 | % | 34,000 | 3.379 | % | LIBOR + 1.500% | ||||||
| Jefferson Valley Mall | 01/11/04 | 60,000 | 100.00 | % | 60,000 | 3.129 | % | LIBOR + 1.250% | ||||||
| SPG, L.P. Unsecured Term Loan—4 | 02/28/04 | 150,000 | 100.00 | % | 150,000 | 2.529 | % | LIBOR + 0.650% | ||||||
| SPG, L.P. Unsecured Term Loan—3 | 03/15/04 | 65,000 | 100.00 | % | 65,000 | 2.679 | % | LIBOR + 0.800% | ||||||
| North East Mall | 05/21/04 | 149,007 | 100.00 | % | 149,007 | 3.254 | % | LIBOR + 1.375% | ||||||
| Simon ERE Facility—Variable component | 07/31/04 | 21,826 | 100.00 | % | 21,826 | 2.479 | % | EURIBOR + 0.600% | ||||||
| Waterford Lakes | 08/16/04 | 67,296 | 100.00 | % | 67,296 | 3.279 | % | LIBOR + 1.400% | ||||||
| Brunswick Square | 06/12/05 | 45,000 | 100.00 | % | 45,000 | 3.379 | % | LIBOR + 1.500% | ||||||
| Bowie Mall—2 | 12/14/05 | 52,340 | 100.00 | % | 52,340 | 3.379 | % | LIBOR + 1.500% | ||||||
| White Oaks Mall | 02/25/08 | 48,563 | 92.34 | % | 44,844 | 2.979 | % | LIBOR + 1.100% | ||||||
| 1,190,045 | 1,186,326 | |||||||||||||
26
SIMON PROPERTY GROUP
Summary of Variable Rate Debt and Interest Rate Protection Agreements
As of March 31, 2002
(In thousands)
| Property Name | Maturity Date | Principal Balance 03/31/02 | SPG Ownership % | SPG's Share of Loan Balance | Interest Rate(1) 03/31/02 | Terms of Variable Rate | Terms of Interest Rate Protection Agreement | |||||||
|---|---|---|---|---|---|---|---|---|---|---|---|---|---|---|
| Joint Venture Indebtedness: | ||||||||||||||
| Other Hedged Debt: | ||||||||||||||
| CMBS Loan—Floating Component (IBM) | 05/15/03 | 184,500 | 50.00 | % | 92,250 | 2.375 | % | LIBOR + 0.4965%(2) | LIBOR Capped at 11.53% through maturity.(3) | |||||
| Circle Centre Mall—1 | 01/31/04 | 60,000 | 14.67 | % | 8,802 | 2.319 | % | LIBOR + 0.440% | LIBOR Capped at 8.81% through January 31, 2003. | |||||
| Circle Centre Mall—2 | 01/31/04 | 7,500 | 14.67 | % | 1,100 | 3.379 | % | LIBOR + 1.500% | LIBOR Capped at 7.75% through January 31, 2003. | |||||
| Emerald Square Mall—1 | 04/01/05 | 129,400 | 49.14 | % | 63,584 | 3.179 | % | LIBOR + 1.300% | LIBOR Capped at 7.70% through March 31, 2003. | |||||
| Emerald Square Mall—2 | 04/01/05 | 15,600 | 49.14 | % | 7,665 | 4.929 | % | LIBOR + 3.050% | LIBOR Capped at 7.95% through March 31, 2003. | |||||
| Mall of America | 04/30/05 | 312,000 | 27.50 | % | 85,800 | 2.414 | % | LIBOR + 0.5348% | LIBOR Capped at 8.7157% through March 12, 2003. | |||||
| Northfield Square | 07/01/05 | 37,000 | 31.60 | % | 11,692 | 4.379 | % | LIBOR + 2.500% | LIBOR Capped at 8.50% through April 30, 2003, embedded. | |||||
| Seminole Towne Center | 05/15/06 | 70,500 | 45.00 | % | 31,725 | 4.379 | % | LIBOR + 2.500% | LIBOR Capped at 8% through July 1, 2003. | |||||
| CMBS Loan—Floating Component—2 (IBM) | 07/01/05 | 81,400 | 50.00 | % | 40,700 | 2.248 | % | LIBOR + 0.3695%(2) | LIBOR Capped at 11.83% through maturity. | |||||
| 897,900 | 343,319 | |||||||||||||
| Floating Rate Debt: | ||||||||||||||
| Shops at Sunset Place, The | 06/30/02 | 113,829 | 37.50 | % | 42,686 | 3.029 | % | LIBOR + 1.150% | ||||||
| Montreal Forum | 07/31/02 | 34,460 | 35.63 | % | 12,276 | 6.500 | % | Canadian Prime + 1.75% | ||||||
| Mayflower Realty Credit Facility | 07/12/03 | 6,500 | 49.14 | % | 3,194 | 4.129 | % | LIBOR + 2.250% | ||||||
| Liberty Tree Mall | 10/01/03 | 45,797 | 49.14 | % | 22,504 | 3.379 | % | LIBOR + 1.500% | ||||||
| Concord Mills | 12/02/03 | 179,864 | 37.50 | % | 67,449 | 3.229 | % | LIBOR + 1.350% | ||||||
| Orlando Premium Outlets | 02/12/04 | 59,103 | 50.00 | % | 29,552 | 3.179 | % | LIBOR + 1.300% | ||||||
| Fashion Centre Pentagon Office | 09/10/04 | 33,000 | 42.50 | % | 14,025 | 3.379 | % | LIBOR + 1.500% | ||||||
| Arundel Mills | 04/30/05 | 174,247 | 37.50 | % | 65,343 | 3.279 | % | LIBOR + 1.400% | ||||||
| European Assets—Variable Components | 08/10/09 | 16,887 | 32.27 | % | 5,449 | 5.764 | % | EURIBOR + 2.4165%(2) | ||||||
| 663,687 | 262,477 | |||||||||||||
Footnotes:
- (1)
- LIBOR based on 1.8788%.
- (2)
- Represents the weighted average spread.
- (3)
- Represents the weighted average cap rate.
27
SIMON PROPERTY GROUP
Significant Renovation/Expansion Activities
As of March 31, 2002
| Mall/ Location | Simon Group's Ownership Percentage | Actual/ Projected Opening | Projected Cost (in millions) (1) | GLA Before Renov/Expan (sq. ft.) | New or Incremental GLA (sq. ft.) | ||||||
|---|---|---|---|---|---|---|---|---|---|---|---|
| Projects Under Construction | |||||||||||
The Galleria (renovation) Houston, TX | 31 | % | 7/02 | $ | 25 | 1,825,000 | — | ||||
Project Description: | Mall renovation | ||||||||||
The Galleria (expansion) Houston, TX | 31 | % | 3/03 | $ | 119 | 1,825,000 | 700,000 | ||||
Project Description: | Addition of Nordstrom, Foley's and small shops with complete mall renovation | ||||||||||
SouthPark Charlotte, NC | 100 | % | Spring 2004 | $ | 100 | 1,094,000 | 263,000 | ||||
Project Description: | Addition of Nordstrom, 60,000 sq. ft. expansion of Hecht's, 50,000 sq. ft. of small shops, Cheesecake Factory, Maggianos & an additional anchor pad | ||||||||||
Florida Mall Orlando, FL | 50 | % | 9/02 | $ | 50 | 1,632,000 | 198,000 | ||||
Project Description: | Addition of Nordstrom, Lord & Taylor and small shop expansion | ||||||||||
Dadeland Mall Miami, FL | 50 | % | 11/02 | $ | 25 | 1,405,000 | — | ||||
Project Description: | Mall renovation | ||||||||||
Barton Creek Square Austin, TX | 100 | % | 8/03 | $ | 24 | 1,418,000 | 16,000 | ||||
Project Description: | Addition of Nordstrom and 40,000 sq. ft. of small shops in the former Montgomery Ward location | ||||||||||
Bay Park Square Green Bay, WI | 100 | % | 10/03 | $ | 21 | 668,000 | 52,000 | ||||
Project Description: | Addition of Younkers and 60,000 sq. ft. of small shops in the former Montgomery Ward location | ||||||||||
- (1)
- Total Projected Cost reflects net development costs and does not reflect SPG's share. Total Projected Cost also includes soft costs such as architecture and engineering fees, tenant costs (allowances/leasing commissions), development, legal and other fees, marketing costs, cost of capital, and other related costs.
28
SIMON PROPERTY GROUP
Capital Expenditures
For the Three Months Ended March 31, 2002
(In millions)
| | | Joint Venture Properties | |||||||
|---|---|---|---|---|---|---|---|---|---|
| | Consolidated Properties | Total | Simon's Share | ||||||
| New Developments | $ | 3.4 | $ | 26.4 | $ | 8.8 | |||
| Renovations and Expansions | 11.0 | 13.5 | 6.3 | ||||||
| Tenant Allowances | 8.9 | 2.4 | 1.0 | ||||||
| Operational Capital Expenditures at Properties | 1.5 | 1.3 | .6 | ||||||
| Totals | $ | 24.8 | $ | 43.6 | $ | 16.7 | |||
29
SIMON PROPERTY GROUP
Property Listing (sorted by state)
As of March 31, 2002
| | | | | | Gross Leasable Area | |||||||||
|---|---|---|---|---|---|---|---|---|---|---|---|---|---|---|
| Property Name | State | City | Type | Ownership | Total | Anchor | Mall & Freestanding* | |||||||
| Retail and Mixed-Use Projects: | ||||||||||||||
Arizona Mills | AZ | Tempe | Mills | 26.3% | 1,227,442 | 342,456 | 884,986 | |||||||
| Metrocenter | AZ | Phoenix | Mall | 50.0% | 1,367,030 | 876,027 | 491,003 | |||||||
| Southgate Mall | AZ | Yuma | Mall | 100.0% | 321,564 | 252,264 | 69,300 | |||||||
McCain Mall | AR | N. Little Rock | Mall | 100.0% | 777,079 | 554,156 | 222,923 | |||||||
| University Mall | AR | Little Rock | Mall | 100.0% | 565,335 | 412,761 | 152,574 | |||||||
Brea Mall | CA | Brea | Mall | 100.0% | 1,304,307 | 874,802 | 429,505 | |||||||
| Fashion Valley Mall | CA | San Diego | Mall | 50.0% | 1,710,009 | 1,053,305 | 656,704 | |||||||
| Laguna Hills Mall | CA | Laguna Hills | Mall | 100.0% | 867,129 | 536,500 | 330,629 | |||||||
| Ontario Mills | CA | Ontario | Mills | 25.0% | 1,587,638 | 470,298 | 1,117,340 | |||||||
| Santa Rosa Plaza | CA | Santa Rosa | Mall | 100.0% | 696,411 | 428,258 | 268,153 | |||||||
| Shops at Mission Viejo | CA | Mission Viejo | Mall | 100.0% | 1,147,954 | 677,215 | 470,739 | |||||||
| Westminster Mall | CA | Westminster | Mall | 100.0% | 1,042,866 | 541,939 | 500,927 | |||||||
Aurora Mall | CO | Aurora | Mall | 100.0% | 1,014,059 | 566,015 | 448,044 | |||||||
| Mesa Mall | CO | Grand Junction | Mall | 50.0% | 856,222 | 425,817 | 430,405 | |||||||
Crystal Mall | CT | Waterford | Mall | 74.6% | 793,402 | 442,311 | 351,091 | |||||||
| Plaza at Buckland Hills | CT | Manchester | Comm Cnt | 35.0% | 334,487 | 252,179 | 82,308 | |||||||
Aventura Mall | FL | Miami Beach | Mall | 33.3% | 1,898,799 | 1,242,098 | 656,701 | |||||||
| Avenues, The | FL | Jacksonville | Mall | 25.0% | 1,112,607 | 754,956 | 357,651 | |||||||
| Boynton Beach Mall | FL | Boynton Beach | Mall | 100.0% | 1,184,620 | 885,101 | 299,519 | |||||||
| Coral Square | FL | Coral Springs | Mall | 50.0% | 945,493 | 648,144 | 297,349 | |||||||
| Cordova Mall | FL | Pensacola | Mall | 100.0% | 870,324 | 507,073 | 363,251 | |||||||
| Crystal River Mall | FL | Crystal River | Mall | 100.0% | 423,941 | 302,495 | 121,446 | |||||||
| Dadeland Mall | FL | North Miami Beach | Mall | 50.0% | 1,405,390 | 1,062,072 | 343,318 | |||||||
| DeSoto Square | FL | Bradenton | Mall | 100.0% | 689,044 | 435,467 | 253,577 | |||||||
| Edison Mall | FL | Fort Myers | Mall | 100.0% | 1,042,622 | 742,667 | 299,955 | |||||||
| Florida Mall, The | FL | Orlando | Mall | 50.0% | 1,632,231 | 1,045,085 | 587,146 | |||||||
| Gaitway Plaza | FL | Ocala | Comm Cnt | 23.3% | 229,972 | 163,610 | 66,362 | |||||||
| Grove @ Lakeland Square | FL | Lakeland | Comm Cnt | 100.0% | 215,591 | 142,317 | 73,274 | |||||||
| Gulf View Square | FL | Port Richey | Mall | 100.0% | 804,268 | 568,882 | 235,386 | |||||||
| Highland Lakes Center | FL | Orlando | Comm Cnt | 100.0% | 478,014 | 372,316 | 105,698 | |||||||
| Indian River Commons | FL | Vero Beach | Comm Cnt | 50.0% | 264,681 | 254,965 | 9,716 | |||||||
| Indian River Mall | FL | Vero Beach | Mall | 50.0% | 747,997 | 445,552 | 302,445 | |||||||
| Lake Square Mall | FL | Leesburg | Mall | 50.0% | 560,796 | 296,037 | 264,759 | |||||||
| Melbourne Square | FL | Melbourne | Mall | 100.0% | 729,378 | 471,173 | 258,205 | |||||||
| Miami International Mall | FL | South Miami | Mall | 60.0% | 973,008 | 683,308 | 289,700 | |||||||
| Orange Park Mall | FL | Orange Park | Mall | 100.0% | 925,253 | 534,180 | 391,073 | |||||||
| Orlando Premium Outlets | FL | Orlando | Mall | 50.0% | 427,765 | 0 | 427,765 | |||||||
| Paddock Mall | FL | Ocala | Mall | 100.0% | 559,837 | 387,378 | 172,459 | |||||||
| Palm Beach Mall | FL | West Palm Beach | Mall | 100.0% | 1,094,509 | 749,288 | 345,221 | |||||||
| Port Charlotte Town Center | FL | Port Charlotte | Mall | 80.0% | 780,623 | 458,554 | 322,069 | |||||||
| Royal Eagle Plaza | FL | Coral Springs | Comm Cnt | 35.0% | 199,053 | 124,479 | 74,574 | |||||||
| Seminole Towne Center | FL | Sanford | Mall | 45.0% | 1,153,560 | 768,798 | 384,762 | |||||||
| Terrace @ the Florida Mall | FL | Orlando | Comm Cnt | 100.0% | 329,362 | 281,831 | 47,531 | |||||||
| The Shops @ Sunset Place | FL | Miami | Mall | 37.5% | 503,801 | 0 | 503,801 | |||||||
| Town Center at Boca Raton | FL | Boca Raton | Mall | 100.0% | 1,554,951 | 1,061,076 | 493,875 | |||||||
30
| Treasure Coast Square | FL | Jensen Beach | Mall | 100.0% | 872,349 | 511,372 | 360,977 | |||||||
| Tyrone Square | FL | St. Petersburg | Mall | 100.0% | 1,128,965 | 748,269 | 380,696 | |||||||
| University Mall | FL | Pensacola | Mall | 100.0% | 707,534 | 478,449 | 229,085 | |||||||
| Waterford Lakes Town Center | FL | Orlando | Comm Cnt | 100.0% | 817,973 | 501,197 | 316,776 | |||||||
| West Town Corners | FL | Altamonte Springs | Comm Cnt | 23.3% | 385,026 | 263,782 | 121,244 | |||||||
| Westland Park Plaza | FL | Jacksonville | Comm Cnt | 23.3% | 163,154 | 123,548 | 39,606 | |||||||
Gwinnett Place | GA | Duluth (Atlanta) | Mall | 50.0% | 1,276,468 | 843,609 | 432,859 | |||||||
| Lenox Square | GA | Atlanta | Mall | 100.0% | 1,480,632 | 821,356 | 659,276 | |||||||
| Mall of Georgia | GA | Buford (Atlanta) | Mall | 50.0% | 1,785,693 | 989,590 | 796,103 | |||||||
| Mall of Georgia Crossing | GA | Buford (Atlanta) | Comm Cnt | 50.0% | 440,612 | 357,726 | 82,886 | |||||||
| Northlake Mall | GA | Atlanta | Mall | 100.0% | 961,979 | 665,745 | 296,234 | |||||||
| Phipps Plaza | GA | Atlanta | Mall | 100.0% | 821,027 | 472,385 | 348,642 | |||||||
| Town Center at Cobb | GA | Kennesaw (Atlanta) | Mall | 50.0% | 1,272,909 | 851,346 | 421,563 | |||||||
Alton Square | IL | Alton | Mall | 100.0% | 639,076 | 426,315 | 212,761 | |||||||
| Bloomingdale Court | IL | Bloomingdale | Comm Cnt | 100.0% | 598,762 | 425,886 | 172,876 | |||||||
| Bridgeview Court | IL | Bridgeview | Comm Cnt | 100.0% | 273,678 | 216,491 | 57,187 | |||||||
| Countryside Plaza | IL | Countryside | Comm Cnt | 100.0% | 435,608 | 290,216 | 145,392 | |||||||
| Crystal Court | IL | Crystal Lake | Comm Cnt | 35.0% | 278,971 | 201,993 | 76,978 | |||||||
| Forest Plaza | IL | Rockford | Comm Cnt | 100.0% | 429,250 | 325,170 | 104,080 | |||||||
| Fox River Plaza | IL | Elgin | Comm Cnt | 100.0% | 322,997 | 276,096 | 46,901 | |||||||
| Lake Plaza | IL | Waukegan | Comm Cnt | 100.0% | 215,498 | 170,789 | 44,709 | |||||||
| Lake View Plaza | IL | Orland Park | Comm Cnt | 100.0% | 381,906 | 281,054 | 100,852 | |||||||
| Lincoln Crossing | IL | O'Fallon | Comm Cnt | 100.0% | 161,337 | 134,935 | 26,402 | |||||||
| Lincolnwood Town Center | IL | Lincolnwood | Mall | 100.0% | 422,106 | 220,830 | 201,276 | |||||||
| Machesney Park Mall | IL | Rockford | Mall | 100.0% | 554,975 | 312,920 | 242,055 | |||||||
| Matteson Plaza | IL | Matteson | Comm Cnt | 100.0% | 275,455 | 230,885 | 44,570 | |||||||
| North Ridge Plaza | IL | Joliet | Comm Cnt | 100.0% | 305,070 | 190,323 | 114,747 | |||||||
| North Riverside Park Plaza | IL | North Riverside | Comm Cnt | 100.0% | 119,608 | 58,587 | 61,021 | |||||||
| Northfield Square Mall | IL | Bourbonnais | Mall | 31.6% | 558,377 | 310,994 | 247,383 | |||||||
| Northwoods Mall | IL | Peoria | Mall | 100.0% | 695,501 | 472,969 | 222,532 | |||||||
| Orland Square | IL | Orland Park | Mall | 100.0% | 1,217,507 | 773,295 | 444,212 | |||||||
| River Oaks Center | IL | Calumet City | Mall | 100.0% | 1,362,404 | 834,588 | 527,816 | |||||||
| SouthPark Mall | IL | Moline | Mall | 50.0% | 1,033,056 | 578,056 | 455,000 | |||||||
| White Oaks Mall | IL | Springfield | Mall | 77.0% | 951,377 | 601,708 | 349,669 | |||||||
| White Oaks Plaza | IL | Springfield | Comm Cnt | 100.0% | 400,303 | 275,703 | 124,600 | |||||||
| Willow Knolls Court | IL | Peoria | Comm Cnt | 35.0% | 382,377 | 309,440 | 72,937 | |||||||
| Yards Plaza, The | IL | Chicago | Comm Cnt | 35.0% | 272,452 | 228,813 | 43,639 | |||||||
Brightwood Plaza | IN | Indianapolis | Comm Cnt | 100.0% | 38,493 | 0 | 38,493 | |||||||
| Castleton Square | IN | Indianapolis | Mall | 100.0% | 1,460,947 | 1,082,021 | 378,926 | |||||||
| Circle Centre | IN | Indianapolis | Mall | 14.7% | 795,291 | 350,000 | 445,291 | |||||||
| College Mall | IN | Bloomington | Mall | 100.0% | 706,885 | 439,766 | 267,119 | |||||||
| Eastland Convenience Center | IN | Evansville | Comm Cnt | 50.0% | 173,069 | 60,000 | 113,069 | |||||||
| Eastland Mall | IN | Evansville | Mall | 50.0% | 898,827 | 532,955 | 365,872 | |||||||
| Fashion Mall at Keystone | IN | Indianapolis | Mall | 100.0% | 655,166 | 249,721 | 405,445 | |||||||
| Greenwood Park Mall | IN | Greenwood | Mall | 100.0% | 1,328,038 | 898,928 | 429,110 | |||||||
| Greenwood Plus | IN | Greenwood | Comm Cnt | 100.0% | 165,481 | 134,141 | 31,340 | |||||||
| Griffith Park Plaza | IN | Griffith | Comm Cnt | 100.0% | 274,230 | 175,595 | 98,635 | |||||||
| Keystone Shoppes | IN | Indianapolis | Comm Cnt | 100.0% | 29,140 | 0 | 29,140 | |||||||
| Lafayette Square | IN | Indianapolis | Mall | 100.0% | 1,215,048 | 937,223 | 277,825 | |||||||
| Markland Mall | IN | Kokomo | Mall | 100.0% | 393,009 | 252,444 | 140,565 | |||||||
| Markland Plaza | IN | Kokomo | Comm Cnt | 100.0% | 95,996 | 29,957 | 66,039 |
31
| Mounds Mall | IN | Anderson | Mall | 100.0% | 404,353 | 277,256 | 127,097 | |||||||
| Mounds Mall Cinema | IN | Anderson | Comm Cnt | 100.0% | 7,500 | 7,500 | 0 | |||||||
| Muncie Mall | IN | Muncie | Mall | 100.0% | 656,721 | 435,756 | 220,965 | |||||||
| Muncie Plaza | IN | Muncie | Comm Cnt | 100.0% | 172,651 | 145,456 | 27,195 | |||||||
| New Castle Plaza | IN | New Castle | Comm Cnt | 100.0% | 91,648 | 24,912 | 66,736 | |||||||
| Northwood Plaza | IN | Fort Wayne | Comm Cnt | 100.0% | 204,372 | 130,003 | 74,369 | |||||||
| Richmond Square | IN | Richmond | Mall | 100.0% | 391,217 | 260,562 | 130,655 | |||||||
| Teal Plaza | IN | Lafayette | Comm Cnt | 100.0% | 101,087 | 98,337 | 2,750 | |||||||
| Tippecanoe Mall | IN | Lafayette | Mall | 100.0% | 860,902 | 568,373 | 292,529 | |||||||
| Tippecanoe Plaza | IN | Lafayette | Comm Cnt | 100.0% | 94,598 | 85,811 | 8,787 | |||||||
| University Center | IN | Mishawaka | Comm Cnt | 60.0% | 150,548 | 104,359 | 46,189 | |||||||
| University Park Mall | IN | Mishawaka | Mall | 60.0% | 941,112 | 622,508 | 318,604 | |||||||
| Village Park Plaza | IN | Carmel | Comm Cnt | 35.0% | 528,200 | 414,027 | 114,173 | |||||||
| Wabash Village | IN | West Lafayette | Comm Cnt | 100.0% | 124,536 | 109,388 | 15,148 | |||||||
| Washington Plaza | IN | Indianapolis | Comm Cnt | 100.0% | 50,107 | 21,500 | 28,607 | |||||||
| Washington Square | IN | Indianapolis | Mall | 100.0% | 1,139,791 | 832,326 | 307,465 | |||||||
Lindale Mall | IA | Cedar Rapids | Mall | 50.0% | 691,623 | 305,563 | 386,060 | |||||||
| NorthPark Mall | IA | Davenport | Mall | 50.0% | 1,057,084 | 651,533 | 405,551 | |||||||
| Southern Hills Mall | IA | Sioux City | Mall | 50.0% | 748,695 | 313,577 | 435,118 | |||||||
| SouthRidge Mall | IA | Des Moines | Mall | 50.0% | 1,008,088 | 497,806 | 510,282 | |||||||
| Wood Plaza | IA | Fort Dodge | Comm Cnt | 100.0% | 96,195 | 36,202 | 59,993 | |||||||
Hutchinson Mall | KS | Hutchinson | Mall | 100.0% | 525,672 | 277,665 | 248,007 | |||||||
| Towne East Square | KS | Wichita | Mall | 100.0% | 1,092,111 | 662,313 | 429,798 | |||||||
| Towne West Square | KS | Wichita | Mall | 100.0% | 965,794 | 628,971 | 336,823 | |||||||
| West Ridge Mall | KS | Topeka | Mall | 100.0% | 1,040,521 | 716,811 | 323,710 | |||||||
| West Ridge Plaza | KS | Topeka | Comm Cnt | 100.0% | 237,858 | 182,161 | 55,697 | |||||||
| Wichita | KS | Wichita | Comm Cnt | 100.0% | 370,181 | 205,938 | 164,243 | |||||||
Park Plaza | KY | Hopkinsville | Comm Cnt | 100.0% | 115,024 | 82,398 | 32,626 | |||||||
New Orleans Centre | LA | New Orleans | Mixed | 100.0% | 1,031,353 | 331,831 | 699,522 | |||||||
| Prien Lake Mall | LA | Lake Charles | Mall | 100.0% | 811,862 | 631,762 | 180,100 | |||||||
| South Park Mall | LA | Shreveport | Mall | 100.0% | 857,885 | 618,915 | 238,970 | |||||||
Arundel Mills | MD | Anne Arundel | Mills | 37.5% | 1,183,588 | 379,775 | 803,813 | |||||||
| Bowie Town Center | MD | Bowie | Mall | 100.0% | 664,299 | 338,567 | 325,732 | |||||||
| Forest Village Park Mall | MD | Forestville | Mall | 100.0% | 418,440 | 242,666 | 175,774 | |||||||
| Glen Burnie | MD | Glen Burnie | Comm Cnt | 100.0% | 455,291 | 347,591 | 107,700 | |||||||
| St. Charles Towne Center | MD | Waldorf | Mall | 100.0% | 1,044,159 | 640,797 | 403,362 | |||||||
| St. Charles Towne Plaza | MD | Waldorf | Comm Cnt | 100.0% | 404,907 | 291,705 | 113,202 | |||||||
Arsenal Mall | MA | Watertown | Mall | 100.0% | 501,827 | 191,395 | 310,432 | |||||||
| (Boston) | ||||||||||||||
| Atrium Mall | MA | Chestnut Hill | Mall | 49.1% | 209,378 | 0 | 209,378 | |||||||
| (Boston) | ||||||||||||||
| Auburn Mall | MA | Auburn (Boston) | Mall | 49.1% | 597,533 | 417,620 | 179,913 | |||||||
| Burlington Mall | MA | Burlington | Mall | 100.0% | 1,253,094 | 836,236 | 416,858 | |||||||
| (Boston) | ||||||||||||||
| Cape Cod Mall | MA | Hyannis | Mall | 49.1% | 723,846 | 420,199 | 303,647 | |||||||
| Emerald Square | MA | North Attleboro | Mall | 49.1% | 1,022,573 | 647,372 | 375,201 | |||||||
| (Boston) | ||||||||||||||
| Greendale Mall | MA | Worcester (Boston) | Mall | 49.1% | 434,713 | 132,634 | 302,079 | |||||||
| Liberty Tree Mall | MA | Danvers (Boston) | Mall | 49.1% | 856,981 | 498,000 | 358,981 | |||||||
| Northshore Mall | MA | Peabody (Boston) | Mall | 49.1% | 1,684,602 | 989,277 | 695,325 | |||||||
| Solomon Pond Mall | MA | Marlborough | Mall | 49.1% | 880,829 | 506,591 | 374,238 | |||||||
| (Boston) |
32
| South Shore Plaza | MA | Braintree (Boston) | Mall | 100.0% | 1,438,320 | 847,603 | 590,717 | |||||||
| Square One Mall | MA | Saugus (Boston) | Mall | 49.1% | 865,291 | 540,101 | 325,190 | |||||||
Mall of America | MN | Bloomington | Mall | 50.0% | 2,778,902 | 1,220,305 | 1,558,597 | |||||||
| Miller Hill Mall | MN | Duluth | Mall | 100.0% | 807,125 | 429,508 | 377,617 | |||||||
Ridgewood Court | MS | Jackson | Comm Cnt | 35.0% | 240,662 | 185,939 | 54,723 | |||||||
Battlefield Mall | MO | Springfield | Mall | 100.0% | 1,184,924 | 770,111 | 414,813 | |||||||
| Independence Center | MO | Independence | Mall | 100.0% | 1,022,939 | 499,284 | 523,655 | |||||||
| Regency Plaza | MO | St. Charles | Comm Cnt | 100.0% | 287,526 | 210,627 | 76,899 | |||||||
Crossroads Mall | NE | Omaha | Mall | 100.0% | 858,610 | 609,669 | 248,941 | |||||||
Forum Shops at Caesars | NV | Las Vegas | Mall | 60.0% | 482,367 | 0 | 482,367 | |||||||
Mall of New Hampshire | NH | Manchester | Mall | 49.1% | 806,237 | 444,889 | 361,348 | |||||||
| Mall at Rockingham Park | NH | Salem | Mall | 24.6% | 1,020,591 | 638,111 | 382,480 | |||||||
Bergen Mall | NJ | Paramus (NYC) | Mall | 100.0% | 900,129 | 453,260 | 446,869 | |||||||
| Brunswick Square | NJ | Brunswick (NYC) | Mall | 100.0% | 771,451 | 467,626 | 303,825 | |||||||
| Livingston Mall | NJ | Livingston (NYC) | Mall | 100.0% | 986,056 | 616,128 | 369,928 | |||||||
| Menlo Park Mall | NJ | Edison (NYC) | Mall | 100.0% | 1,297,044 | 587,591 | 709,453 | |||||||
| Ocean County Mall | NJ | Toms River | Mall | 100.0% | 872,396 | 596,500 | 275,896 | |||||||
| Rockaway Convenience Ctr | NJ | Rockaway (NYC) | Comm Cnt | 100.0% | 135,626 | 20,929 | 114,697 | |||||||
| Rockaway Townsquare | NJ | Rockaway (NYC) | Mall | 100.0% | 1,247,110 | 786,626 | 460,484 | |||||||
Cottonwood Mall | NM | Albuquerque | Mall | 100.0% | 1,041,157 | 631,556 | 409,601 | |||||||
Chautauqua Mall | NY | Lakewood | Mall | 100.0% | 431,160 | 213,320 | 217,840 | |||||||
| Cobblestone Court | NY | Victor | Comm Cnt | 35.0% | 265,493 | 206,680 | 58,813 | |||||||
| Eastern Hills Mall | NY | Williamsville | Mall | 100.0% | 993,971 | 713,070 | 280,901 | |||||||
| Jefferson Valley Mall | NY | Yorktown Heights | Mall | 100.0% | 587,458 | 310,095 | 277,363 | |||||||
| Nanuet Mall | NY | Nanuet (NYC) | Mall | 100.0% | 915,122 | 583,711 | 331,411 | |||||||
| Roosevelt Field | NY | Garden City (NYC) | Mall | 100.0% | 2,178,121 | 1,430,425 | 747,696 | |||||||
| Smith Haven Mall | NY | Lake Grove (NYC) | Mall | 25.0% | 1,363,395 | 902,595 | 460,800 | |||||||
| Source, The | NY | Westbury (NYC) | Mall | 25.0% | 728,584 | 210,798 | 517,786 | |||||||
| Walt Whitman Mall | NY | Huntington Station | Mall | 98.3% | 1,027,872 | 742,214 | 285,658 | |||||||
| (NYC) | ||||||||||||||
| Westchester, The | NY | White Plains (NYC) | Mall | 40.0% | 826,806 | 349,393 | 477,413 | |||||||
Biltmore Square | NC | Asheville | Mall | 66.7% | 494,278 | 242,576 | 251,702 | |||||||
| Concord Mills | NC | Concord (Charlotte) | Mills | 37.5% | 1,247,394 | 433,278 | 814,116 | |||||||
Boardman Plaza | OH | Youngstown | Comm Cnt | 100.0% | 641,025 | 375,502 | 265,523 | |||||||
| Great Lakes Mall | OH | Mentor | Mall | 100.0% | 1,314,961 | 879,300 | 435,661 | |||||||
| Great Lakes Plaza | OH | Mentor | Comm Cnt | 100.0% | 164,104 | 142,229 | 21,875 | |||||||
| Lima Center | OH | Lima | Comm Cnt | 100.0% | 201,154 | 153,860 | 47,294 | |||||||
| Lima Mall | OH | Lima | Mall | 100.0% | 746,063 | 541,861 | 204,202 | |||||||
| North Towne Square | OH | Toledo | Mall | 100.0% | 748,014 | 480,230 | 267,784 | |||||||
| Northland Plaza | OH | Columbus | Comm Cnt | 100.0% | 209,534 | 118,304 | 91,230 | |||||||
| Randall Park Mall | OH | North Randall | Mall | 100.0% | 1,563,288 | 1,126,240 | 437,048 | |||||||
| Richmond Town Square | OH | Richmond Heights | Mall | 100.0% | 1,020,819 | 685,251 | 335,568 | |||||||
| Southern Park Mall | OH | Boardman | Mall | 100.0% | 1,197,396 | 811,858 | 385,538 | |||||||
| Summit Mall | OH | Akron | Mall | 100.0% | 763,492 | 432,936 | 330,556 | |||||||
| Upper Valley Mall | OH | Springfield | Mall | 100.0% | 750,629 | 479,418 | 271,211 | |||||||
| Woodville Mall | OH | Northwood | Mall | 100.0% | 772,394 | 518,792 | 253,602 | |||||||
Eastland Mall | OK | Tulsa | Mall | 100.0% | 706,449 | 452,877 | 253,572 | |||||||
| Eastland Plaza | OK | Tulsa | Comm Cnt | 100.0% | 188,229 | 152,451 | 35,778 |
33
| Heritage Park Mall | OK | Midwest City | Mall | 100.0% | 605,036 | 382,700 | 222,336 | |||||||
Century III Mall | PA | West Mifflin | Mall | 100.0% | 1,284,358 | 725,360 | 558,998 | |||||||
| Cheltenham Square | PA | Philadelphia | Mall | 100.0% | 636,755 | 364,106 | 272,649 | |||||||
| Granite Run Mall | PA | Media | Mall | 50.0% | 1,047,442 | 500,809 | 546,633 | |||||||
| Great Northeast Plaza | PA | Philadelphia | Comm Cnt | 50.0% | 298,242 | 240,525 | 57,717 | |||||||
| Ross Park Mall | PA | Pittsburgh | Mall | 100.0% | 1,276,176 | 827,015 | 449,161 | |||||||
| South Hills Village | PA | Pittsburgh | Mall | 100.0% | 1,113,230 | 655,987 | 457,243 | |||||||
Anderson Mall | SC | Anderson | Mall | 100.0% | 623,708 | 404,394 | 219,314 | |||||||
| Charles Towne Square | SC | Charleston | Comm Cnt | 100.0% | 199,693 | 199,693 | 0 | |||||||
| Haywood Mall | SC | Greenville | Mall | 100.0% | 1,244,399 | 913,633 | 330,766 | |||||||
Empire East | SD | Sioux Falls | Comm Cnt | 50.0% | 250,081 | 192,766 | 57,315 | |||||||
| Empire Mall | SD | Sioux Falls | Mall | 50.0% | 1,058,636 | 497,341 | 561,295 | |||||||
| Rushmore Mall | SD | Rapid City | Mall | 50.0% | 835,224 | 470,660 | 364,564 | |||||||
Knoxville Center | TN | Knoxville | Mall | 100.0% | 981,333 | 597,028 | 384,305 | |||||||
| Knoxville Commons | TN | Knoxville | Comm Cnt | 100.0% | 180,463 | 91,483 | 88,980 | |||||||
| Oak Court Mall | TN | Memphis | Mall | 100.0% | 853,473 | 535,000 | 318,473 | |||||||
| Raleigh Springs Mall | TN | Memphis | Mall | 100.0% | 918,010 | 691,230 | 226,780 | |||||||
| West Town Mall | TN | Knoxville | Mall | 50.0% | 1,334,042 | 878,311 | 455,731 | |||||||
Amigoland Mall | TX | Brownsville | Mall | 100.0% | 556,596 | 332,773 | 223,823 | |||||||
| Arboretum, The | TX | Austin | Comm Cnt | 100.0% | 212,166 | 60,873 | 151,293 | |||||||
| Barton Creek Square | TX | Austin | Mall | 100.0% | 1,249,270 | 777,266 | 472,004 | |||||||
| Broadway Square | TX | Tyler | Mall | 100.0% | 617,215 | 427,730 | 189,485 | |||||||
| Celina Plaza | TX | El Paso | Comm Cnt | 100.0% | 32,622 | 23,927 | 8,695 | |||||||
| Cielo Vista Mall | TX | El Paso | Mall | 100.0% | 1,191,824 | 793,716 | 398,108 | |||||||
| Grapevine Mills | TX | Grapevine | Mills | 37.5% | 1,368,676 | 393,386 | 975,290 | |||||||
| Highland Mall | TX | Austin | Mall | 50.0% | 1,090,685 | 732,000 | 358,685 | |||||||
| Ingram Park Mall | TX | San Antonio | Mall | 100.0% | 1,129,998 | 751,704 | 378,294 | |||||||
| Ingram Plaza | TX | San Antonio | Comm Cnt | 100.0% | 111,518 | 0 | 111,518 | |||||||
| Irving Mall | TX | Irving | Mall | 100.0% | 1,124,115 | 740,284 | 383,831 | |||||||
| La Plaza Mall | TX | McAllen | Mall | 100.0% | 1,214,965 | 788,896 | 426,069 | |||||||
| Lakeline Mall | TX | Austin | Mall | 100.0% | 1,100,256 | 745,179 | 355,077 | |||||||
| Lakeline Plaza | TX | Austin | Comm Cnt | 100.0% | 344,693 | 275,321 | 69,372 | |||||||
| Longview Mall | TX | Longview | Mall | 100.0% | 613,849 | 402,843 | 211,006 | |||||||
| Mainland Crossing | TX | Texas City | Comm Cnt | 80.0% | 390,987 | 306,158 | 84,829 | |||||||
| Midland Park Mall | TX | Midland | Mall | 100.0% | 619,214 | 339,113 | 280,101 | |||||||
| North East Mall | TX | Hurst | Mall | 100.0% | 1,705,322 | 1,348,279 | 357,043 | |||||||
| Richardson Square Mall | TX | Richardson | Mall | 100.0% | 738,209 | 454,881 | 283,328 | |||||||
| Rolling Oaks Mall | TX | San Antonio | Mall | 100.0% | 737,761 | 460,857 | 276,904 | |||||||
| Shops at North East Mall | TX | Hurst | Comm Cnt | 100.0% | 364,534 | 265,559 | 98,975 | |||||||
| Sunland Park Mall | TX | El Paso | Mall | 100.0% | 919,235 | 575,837 | 343,398 | |||||||
| Valle Vista Mall | TX | Harlingen | Mall | 100.0% | 656,623 | 389,781 | 266,842 | |||||||
| Windsor Park | TX | San Antonio | Mall | 100.0% | 1,052,344 | 668,141 | 384,203 | |||||||
Trolley Square | UT | Salt Lake City | Mall | 90.0% | 220,297 | 0 | 220,297 | |||||||
Apple Blossom Mall | VA | Winchester | Mall | 49.1% | 443,149 | 229,011 | 214,138 | |||||||
| Charlottesville Fashion Sq. | VA | Charlottesville | Mall | 100.0% | 571,527 | 381,153 | 190,374 | |||||||
| Chesapeake Center | VA | Chesapeake | Comm Cnt | 100.0% | 299,604 | 219,462 | 80,142 | |||||||
| Chesapeake Square | VA | Chesapeake | Mall | 75.0% | 797,156 | 524,463 | 272,693 | |||||||
| Fairfax Court | VA | Fairfax | Comm Cnt | 26.3% | 249,297 | 168,683 | 80,614 | |||||||
| Fashion Centre at Pentagon | VA | Arlington | Mixed | 50.0% | 991,468 | 472,729 | 518,739 | |||||||
| Martinsville Plaza | VA | Martinsville | Comm Cnt | 100.0% | 102,105 | 60,000 | 42,105 | |||||||
| Valley Mall | VA | Harrisonburg | Mall | 50.0% | 504,923 | 307,798 | 197,125 |
34
| Virginia Center Commons | VA | Glen Allen | Mall | 100.0% | 786,891 | 506,639 | 280,252 | |||||||
Columbia Center | WA | Kennewick | Mall | 100.0% | 745,511 | 408,052 | 337,459 | |||||||
| Northgate Mall | WA | Seattle | Mall | 100.0% | 1,012,186 | 688,391 | 323,795 | |||||||
| Tacoma Mall | WA | Tacoma | Mall | 100.0% | 1,263,688 | 924,045 | 339,643 | |||||||
Bay Park Square | WI | Green Bay | Mall | 100.0% | 668,160 | 465,150 | 203,010 | |||||||
| Forest Mall | WI | Fond Du Lac | Mall | 100.0% | 501,556 | 327,260 | 174,296 | |||||||
| Memorial Mall | WI | Sheboygan | Mall | 100.0% | 348,534 | 233,308 | 115,226 | |||||||
| Memorial Plaza | WI | Sheboygan | Comm Cnt | 100.0% | 131,499 | 103,974 | 27,525 | |||||||
Office Buildings: | ||||||||||||||
O'Hare International Center | IL | Rosemont | Office | 100.0% | 512,318 | 0 | 512,318 | |||||||
| Riverway | IL | Rosemont | Office | 100.0% | 817,359 | 0 | 817,359 | |||||||
Totals | 186,829,239 | 113,664,621 | 73,164,618 |
- *
- Primarily retail space, but does includes office space at the following properties:
Arsenal Mall—approx. 106,000 sq. ft.
Greendale Mall—approx. 120,000 sq. ft.
Menlo Park Mall—approx. 46,000 sq. ft.
Oak Court Mall—approx. 130,000 sq. ft.
River Oaks Mall—approx. 101,000 sq. ft.
Fashion Centre at Pentagon—approx. 169,000 sq. ft.
New Orleans Centre—approx. 488,000 sq. ft.
35
SIMON PROPERTY GROUP Overview
SIMON PROPERTY GROUP Portfolio GLA, Occupancy & Rent Data As of March 31, 2002
SIMON PROPERTY GROUP Rent Information As of March 31, 2002
SIMON PROPERTY GROUP SPG's Share of Total Debt Amortization and Maturities by Year As of March 31, 2002 (In thousands)
SIMON PROPERTY GROUP Significant Renovation/Expansion Activities As of March 31, 2002
SIMON PROPERTY GROUP Capital Expenditures For the Three Months Ended March 31, 2002 (In millions)
SIMON PROPERTY GROUP Property Listing (sorted by state) As of March 31, 2002