QuickLinks -- Click here to rapidly navigate through this document
Exhibit 99.1
SIMON PROPERTY GROUP
Overview
The Company
Simon Property Group, Inc. ("SPG") (NYSE:SPG) is a self-administered and self-managed real estate investment trust ("REIT"). Simon Property Group, L.P. (the "Operating Partnership") is a subsidiary partnership of SPG. Shares of SPG are paired with beneficial interests in shares of stock of SPG Realty Consultants, Inc. ("SRC", and together with SPG, the "Company"). The Company and the Operating Partnership (collectively the "Simon Group") are engaged primarily in the ownership, operation, management, leasing, acquisition, expansion and development of real estate properties, primarily regional malls and community shopping centers.
At June 30, 2002, the Company, directly or through the Operating Partnership, owned or had an interest in 251 properties which consisted of regional malls, community shopping centers, and specialty and mixed-use properties containing an aggregate of 187 million square feet of gross leasable area (GLA) in 36 states and eight assets in Europe and Canada.
On January 13, 2002, the Company announced a joint agreement with The Rouse Company and Westfield America Trust to purchase the assets of Rodamco North America N.V. (Rodamco) for $5.3 billion. The transaction was completed on May 3, 2002. The portfolio acquired by the Company consists primarily of interests in 13 high-quality, highly productive regional malls in the United States, as well as ownership interests in other real estate assets. The Company's share of the gross Rodamco consideration was approximately $1.6 billion, including the assumption of $579 million of property-level debt and preferred stock.
This package was prepared to provide (1) ownership information, (2) certain operational information, and (3) balance sheet information as of June 30, 2002, for the Company and the Operating Partnership. To enhance our financial and operational disclosures, we have added several items to this supplemental package including: balance sheet and income statement data, analysis of other income and expense, EBITDA composition and asset mix, top tenants, and construction-in-progress.
Certain statements contained in this Supplemental Package may constitute "forward-looking statements" made pursuant to the safe harbor provisions of the Private Securities Litigation Reform Act of 1995. Readers are cautioned that forward-looking statements involve risks and uncertainties, which may affect the business and prospects of the Company and the Operating Partnership. We direct you to the Company's various filings with the Securities and Exchange Commission including Form 10-K and Form 10-Q for a detailed discussion of risks and uncertainties.
We hope you find this Supplemental Package beneficial. Any questions, comments or suggestions should be directed to: Shelly J. Doran, Vice President of Investor Relations-Simon Property Group, P.O. Box 7033, Indianapolis, IN 46207. Telephone: (317) 685-7330; e-mail: sdoran@simon.com
5
SIMON PROPERTY GROUP
Overview
Reporting Calendar
Quarterly results for the remainder of the year will be announced according to the following approximate schedule:
| Third Quarter | | October 31, 2002 |
| Fourth Quarter and Year-End | | Early February 2003 |
Stock Information
Simon Property Group, Inc. common stock and three issues of preferred stock are traded on the New York Stock Exchange under the following symbols:
| Common Stock | | SPG |
| 6.5% Series B Convertible Preferred | | SPGPrB |
| 8.75% Series F Cumulative Preferred | | SPGPrF |
| 7.89% Series G Cumulative Preferred | | SPGPrG |
Corporate Ratings
| Standard & Poor's | | BBB+ (stable outlook) |
| Moody's | | Baa1 (stable outlook) |
6
SIMON PROPERTY GROUP
Overview
Corporate Governance Statement by David Simon, Chief Executive Officer
Over the past several months, there has been significant discussion in the public markets regarding the integrity of periodic reporting processes and the involvement of senior executives in those processes. One of the outgrowths of this situation is the recent SEC directive requiring the CEO and CFO of each major U.S. public company to attest to his or her personal knowledge of the accuracy of the public financial information contained in their companies' SEC filings.
Let me say this emphatically, it is "normal course of business" here at Simon for all material items and transactions to be discussed at length among all members of senior management and reviewed with our Board. One of the hallmarks of our reporting procedures at Simon Property Group is the ongoing involvement in the financial reporting processes and detailed review of results by the chief accounting officer, chief financial officer, chief operating officer and me.
The SEC's directive is not completely new for us. If you look back at the SPG annual reports for recent years, you will find that we have been doing a similar validation as our "Report of Management." Steve Sterrett and I have signed this report each and every year since 1997 and will continue to do so in the future.
Our company may have its roots in an entrepreneurial real estate environment, but I assure you that we operate as a public company, not a private one. We have a very involved Board and a finance-savvy Audit Committee. We have in place well-developed policies and procedures within our organization. Be assured that we will continue to keep abreast of all new requirements of the applicable governing bodies and take the actions necessary as these rules and regulations are put forth. As requirements are finalized, we will develop, with our Board's input and assistance, appropriate policies and procedures to assure compliance.
Highlights of Simon Property Group's current corporate governance policies are as follows:
- •
- Board of Directors—a majority of the Company's directors have always been independent (under the standards established by our corporate charter)
- •
- All audit committee and compensation committee members are independent directors
- •
- Directors are elected annually—it is not a staggered Board
- •
- There is no "poison pill" in the corporate charter
- •
- Our stock option plans do not allow for repricing of options
- •
- Effective in January of 2002, we changed our accounting policy for stock options and will now record the value of stock options granted as compensation expense.
We are closely monitoring pending proposals to require changes in standards for corporate governance. To the extent that our policies and procedures do not comply with the standards ultimately adopted, we will promptly modify our policies and procedures to ensure compliance.
7
Simon Property Group Economic Ownership Structure(1)
June 30, 2002
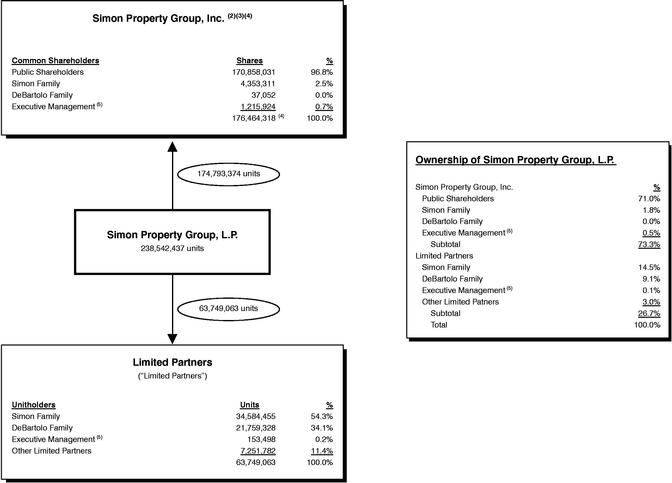
- (1)
- Schedule excludes preferred stock (see "Preferred Stock/Units Outstanding") and units not convertible into common stock.
- (2)
- Managing general partner of Simon Property Group, L.P.
- (3)
- Shares of Simon Property Group, Inc. ("SPG") are paired with beneficial interests in shares of stock of SPG Realty Consultants, Inc.
- (4)
- The number of outstanding shares of common stock of SPG exceeds the number of Simon Property Group, L.P. units owned by SPG by 1,670,944. This is the result of the direct ownership of Ocean County Mall by SPG, partially offset by units issued to SPG in exchange for Northshore Mall.
- (5)
- Executive management excludes Simon family members.
8
SIMON PROPERTY GROUP
Changes in Common Shares and Unit Ownership
For the Period from December 31, 2001 through June 30, 2002
| | Operating
Partnership
Units(1)
| | Company
Common Shares(2)
| |
|---|
| Number Outstanding at December 31, 2001 | | 63,930,350 | | 173,806,306 | |
Issuance of Stock for Stock Option Exercises |
|
— |
|
584,823 |
|
Conversion of Series A Preferred Shares into Common Stock |
|
— |
|
1,912,335 |
|
Conversion of Units into Common Stock |
|
(173,442 |
) |
173,442 |
|
Conversion of Units into Cash |
|
(7,845 |
) |
— |
|
Restricted Stock Forfeitures |
|
— |
|
(12,588 |
) |
Number Outstanding at June 30, 2002 |
|
63,749,063 |
|
176,464,318 |
|
Total Common Shares and Units Outstanding at June 30, 2002:
240,213,381(2)
| Details for Diluted Common Shares Outstanding: | | |
Company Common Shares Outstanding at June 30, 2002 |
|
176,464,318 |
Number of Common Shares Issuable Assuming Conversion of: |
|
|
| |
Series A Preferred 6.5% Convertible(3) |
|
684 |
| |
Series B Preferred 6.5% Convertible(3) |
|
12,490,773 |
Net Number of Common Shares Issuable Assuming Exercise of Stock Options(4) |
|
616,054 |
Diluted Common Shares Outstanding at June 30, 2002 |
|
189,571,829 |
Fully Diluted Common Shares and Units Outstanding at June 30, 2002:
253,320,892
- (1)
- Excludes units owned by the Company (shown here as Company Common Shares) and units not convertible into common shares.
- (2)
- Excludes preferred units relating to preferred stock outstanding (see Schedule of Preferred Stock Outstanding).
- (3)
- Conversion terms provided in footnotes (1) and (2) on page 42 of this document.
- (4)
- Based upon the weighted average stock price for the first six months of 2002.
9
SIMON PROPERTY GROUP
Selected Financial Information
As of June 30, 2002
Unaudited
(In thousands, except as noted)
| | As of or for the
Three Months Ended
June 30,
| | As of or for the
Six Months Ended
June 30,
| |
|---|
| | 2002
| | 2001
| | 2002
| | 2001
| |
|---|
| Financial Highlights of the Company | | | | | | | | | | | | | |
| Total Revenue—Consolidated Properties | | $ | 517,480 | | $ | 488,270 | | $ | 1,012,427 | | $ | 978,946 | |
| Total EBITDA of the Simon Group Portfolio(5) | | $ | 560,019 | | $ | 517,913 | | $ | 1,083,726 | | $ | 1,032,664 | |
| Simon Group's Share of EBITDA(5) | | $ | 424,690 | | $ | 390,882 | | $ | 817,181 | | $ | 781,567 | |
| Net Income Available to Common Shareholders | | $ | 173,170 | | $ | 36,746 | | $ | 203,176 | (6) | $ | 67,685 | |
| Basic Net Income per Paired Share | | $ | 0.99 | | $ | 0.21 | | $ | 1.17 | (6) | $ | 0.39 | |
| Diluted Net Income per Paired Share | | $ | 0.97 | | $ | 0.21 | | $ | 1.16 | (6) | $ | 0.39 | |
| FFO of the Simon Portfolio | | $ | 216,059 | | $ | 189,195 | | $ | 406,034 | | $ | 366,764 | |
| Basic FFO Allocable to the Companies | | $ | 158,074 | | $ | 137,530 | | $ | 296,955 | | $ | 266,293 | |
| Diluted FFO Allocable to the Companies | | $ | 167,892 | | $ | 146,997 | | $ | 316,253 | | $ | 285,038 | |
| Basic FFO per Paired Share | | $ | 0.91 | | $ | 0.80 | | $ | 1.70 | | $ | 1.55 | |
| Diluted FFO per Paired Share | | $ | 0.89 | | $ | 0.79 | | $ | 1.67 | | $ | 1.53 | |
| Distributions per Paired Share | | $ | 0.550 | | $ | 0.525 | | $ | 1.075 | | $ | 1.050 | |
| Operational Statistics | | | | | | | | | | | | | |
| Occupancy at End of Period: | | | | | | | | | | | | | |
| | Regional Malls(1) | | | | | | | | | 91.5 | % | | 90.3 | % |
| | Community Shopping Centers(2) | | | | | | | | | 87.9 | % | | 87.9 | % |
| Average Base Rent per Square Foot: | | | | | | | | | | | | | |
| | Regional Malls(1) | | | | | | | | $ | 30.03 | | $ | 28.84 | |
| | Community Shopping Centers(2) | | | | | | | | $ | 10.00 | | $ | 9.72 | |
| Releasing Spread, Regional Malls: | | | | | | | | | | | | | |
| | Opening Base Rent per Square Foot | | | | | | | | $ | 39.59 | | $ | 36.41 | |
| | Closing Base Rent per Square Foot | | | | | | | | $ | 32.20 | | $ | 28.25 | |
| | Releasing Spread per Square Foot | | | | | | | | $ | 7.39 | | $ | 8.16 | |
| | Percentage Increase | | | | | | | | | 23.0 | % | | 28.9 | % |
| Regional Malls: | | | | | | | | | | | | | |
| | Total Tenant Sales Volume, in millions(3)(4) | | | | | | | | $ | 7,823 | | $ | 7,370 | |
| | Comparable Sales per Square Foot(4) | | | | | | | | $ | 390 | | $ | 388 | |
| | Total Sales per Square Foot(4) | | | | | | | | $ | 384 | | $ | 380 | |
| Number of U.S. Properties Open at End of Period | | | | | | | | | 251 | | | 250 | |
Total U.S. GLA at End of Period
(in millions of square feet) | | | | | | | | | 187.0 | | | 184.9 | |
- (1)
- Includes mall and freestanding stores.
- (2)
- Owned GLA, including anchors.
- (3)
- Represents only those tenants who report sales.
- (4)
- Based upon the standard definition of sales for regional malls adopted by the International Council of Shopping Centers which includes only mall and freestanding stores less than 10,000 square feet.
- (5)
- Excludes technology initiatives.
- (6)
- Includes net gains from the sale of real estate of $170.3 million, or $0.67 per share.
10
SIMON PROPERTY GROUP
Selected Financial Information
As of June 30, 2002
Unaudited
(In thousands, except as noted)
| | June 30,
2002
| | December 31,
2001
|
|---|
| Equity Information | | | | | | |
| Limited Partner Units Outstanding at End of Period | | | 63,749 | | | 63,930 |
| Paired Shares Outstanding at End of Period | | | 176,464 | | | 173,806 |
| | |
| |
|
| Total Common Shares and Units Outstanding at End of Period | | | 240,213 | | | 237,736 |
| | |
| |
|
| Basic Weighted Average Paired Shares Outstanding(1) | | | 174,192 | | | 172,669 |
| Diluted Weighted Average Number of Equivalent Paired Shares(1) | | | 189,151 | | | 187,430 |
| Debt Information | | | | | | |
| Consolidated Debt | | $ | 9,597,064 | | $ | 8,841,378 |
| Simon Group's Share of Joint Venture Debt | | $ | 2,293,998 | | $ | 2,392,523 |
| Debt-to-Market Capitalization | | | | | | |
| Common Stock Price at End of Period | | $ | 36.84 | | $ | 29.33 |
| Equity Market Capitalization(2) | | $ | 9,848,226 | | $ | 7,968,576 |
| Total Consolidated Capitalization | | $ | 19,445,290 | | $ | 16,809,954 |
| Total Capitalization—Including Simon Group's Share of JV Debt | | $ | 21,739,288 | | $ | 19,202,477 |
| | As of or for the
Six Months Ended
June 30,
|
|---|
|
|
2002
|
|
2001
|
|---|
| Miscellaneous Balance Sheet Data | | | | | | |
| Interest Capitalized during the Period: | | | | | | |
| | Consolidated Properties | | $ | 1,512 | | $ | 5,726 |
| | Joint Venture Properties | | $ | 1,305 | | $ | 336 |
| | Simon Group's Share of Joint Venture Properties | | $ | 641 | | $ | 158 |
- (1)
- For purposes of computing FFO per share.
- (2)
- Market value of Common Stock, Units and all issues of Preferred Stock of SPG.
11
On this and the following page, we present balance sheet and income statement data intended to report the Company's economic ownership of the entire SPG portfolio. While these statements were not prepared in accordance with GAAP, we believe that they do reflect SPG's proportionate economic ownership of each asset in the SPG portfolio.
Simon Property Group, Inc. and SPG Realty Consultants, Inc.
Balance Sheets—Including Pro-Rata Share of Real Estate Joint Ventures
As of June 30, 2002
| | Consolidated
| | Minority
Interest
| | SPG's
Share of
Real Estate
Joint Ventures
| | Total
| |
|---|
| ASSETS: | | | | | | | | | | | | | |
| | Investment properties, at cost | | $ | 13,742,228 | | | (144,210 | ) | $ | 4,443,738 | | $ | 18,041,756 | |
| | | Less—accumulated depreciation | | | 2,011,324 | | | (42,937 | ) | | 514,625 | | | 2,483,012 | |
| | |
| |
| |
| |
| |
| | | | 11,730,904 | | | (101,273 | ) | | 3,929,113 | | | 15,558,744 | |
| | Cash and cash equivalents | | | 223,253 | | | (24,261 | ) | | 79,981 | | | 278,973 | |
| | Tenant receivables and accrued revenue, net | | | 252,686 | | | (16,345 | ) | | 63,411 | | | 299,752 | |
| | Notes and advances receivable from Management Company and affiliates | | | 131,549 | | | — | | | — | | | 131,549 | |
| | Investment in unconsolidated entities, at equity | | | 1,799,793 | | | — | | | (1,711,348 | ) | | 88,445 | |
| | Goodwill, net | | | 37,212 | | | — | | | — | | | 37,212 | |
| | Deferred costs and other assets, net | | | 322,480 | | | (55,952 | ) | | 71,397 | | | 337,925 | |
| | Minority interest, net | | | 14,358 | | | (14,358 | ) | | — | | | — | |
| | |
| |
| |
| |
| |
| | | | Total assets | | $ | 14,512,235 | | $ | (212,189 | ) | $ | 2,432,554 | | $ | 16,732,600 | |
| | |
| |
| |
| |
| |
| LIABILITIES: | | | | | | | | | | | | | |
| | Mortgages and other indebtedness | | $ | 9,597,064 | | $ | (147,011 | ) | $ | 2,293,998 | | $ | 11,744,051 | |
| | Accounts payable and accrued expenses | | | 492,032 | | | (62,179 | ) | | 94,835 | | | 524,688 | |
| | Cash distributions and losses in partnerships and joint ventures, at equity | | | 25,883 | | | — | | | — | | | 25,883 | |
| | Accrued dividends | | | 17,641 | | | — | | | — | | | 17,641 | |
| | Other liabilities | | | 150,567 | | | (2,999 | ) | | 43,721 | | | 191,289 | |
| | |
| |
| |
| |
| |
| | | | Total liabilities | | | 10,283,187 | | | (212,189 | ) | | 2,432,554 | | | 12,503,552 | |
| | |
| |
| |
| |
| |
| LIMITED PARTNERS' INTEREST IN THE OPERATING PARTNERSHIPS | | | 837,074 | | | — | | | — | | | 837,074 | |
| LIMITED PARTNERS' PREFERRED INTEREST IN THE SPG OPERATING PARTNERSHIP | | | 150,852 | | | — | | | — | | | 150,852 | |
| SHAREHOLDERS' EQUITY: | | | | | | | | | | | | | |
| | CAPITAL STOCK OF SIMON PROPERTY GROUP, INC. (750,000,000 total shares authorized, $.0001 par value, 237,996,000 shares of excess common stock): | | | | | | | | | | | | | |
| | All series of preferred stock, 100,000,000 shares authorized, 16,830,075 and 16,879,896 issued and outstanding, respectively. Liquidation values $858,024 and $907,845, respectively | | | 814,041 | | | — | | | — | | | 814,041 | |
| | Common stock, $.0001 par value, 400,000,000 shares authorized, 175,358,873 and 172,700,861 issued
and outstanding, respectively | | | 17 | | | — | | | — | | | 17 | |
| | Class B common stock, $.0001 par value, 12,000,000 shares authorized, 3,200,000 issued and outstanding | | | 1 | | | — | | | — | | | 1 | |
| | Class C common stock, $.0001 par value, 4,000 shares authorized, issued and outstanding | | | — | | | — | | | — | | | — | |
| | CAPITAL STOCK OF SPG REALTY CONSULTANTS, INC.: | | | | | | | | | | | | | |
| | | Common stock, $.0001 par value, 7,500,000 shares authorized, 1,785,629 and 1,759,049 issued and outstanding, respectively | | | — | | | — | | | — | | | — | |
| | Capital in excess of par value | | | 3,414,286 | | | — | | | — | | | 3,414,286 | |
| | Accumulated deficit | | | (912,150 | ) | | — | | | — | | | (912,150 | ) |
| | Accumulated other comprehensive income | | | (7,286 | ) | | — | | | — | | | (7,286 | ) |
| | Unamortized restricted stock award | | | (15,269 | ) | | — | | | — | | | (15,269 | ) |
| | Common stock held in treasury at cost, 2,098,555 shares | | | (52,518 | ) | | — | | | — | | | (52,518 | ) |
| | |
| |
| |
| |
| |
| | | | Total shareholders' equity | | | 3,241,122 | | | — | | | — | | | 3,241,122 | |
| | |
| |
| |
| |
| |
| | | $ | 14,512,235 | | $ | (212,189 | ) | $ | 2,432,554 | | $ | 16,732,600 | |
| | |
| |
| |
| |
| |
12
Simon Property Group, Inc. and SPG Realty Consultants, Inc.
Statements of Operations—Including Pro-Rata Share of Real Estate Joint Ventures
For Six Months Ended June 30, 2002
| | Consolidated
| | Minority Interest
| | SPG's
Share of
Real Estate
Joint Ventures
| | Total
| |
|---|
| REVENUE: | | | | | | | | | | | | | |
| | Minimum rent | | $ | 629,877 | | | (13,598 | ) | | 183,975 | | $ | 800,254 | |
| | Overage rent | | | 15,222 | | | (670 | ) | | 3,553 | | | 18,105 | |
| | Tenant reimbursements | | | 307,754 | | | (5,267 | ) | | 88,884 | | | 391,371 | |
| | Other income | | | 59,574 | | | (789 | ) | | 9,082 | | | 67,867 | |
| | |
| |
| |
| |
| |
| | | | Total revenue | | | 1,012,427 | | | (20,324 | ) | | 285,494 | | | 1,277,597 | |
| | |
| |
| |
| |
| |
| EXPENSES: | | | | | | | | | | | | | |
| | Property operating | | | 175,414 | | | (3,002 | ) | | 47,486 | | | 219,898 | |
| | Depreciation and amortization | | | 227,187 | | | (3,838 | ) | | 68,962 | | | 292,311 | |
| | Real estate taxes | | | 105,225 | | | (987 | ) | | 28,912 | | | 133,150 | |
| | Repairs and maintenance | | | 35,526 | | | (1,016 | ) | | 12,488 | | | 46,998 | |
| | Advertising and promotion | | | 23,639 | | | (513 | ) | | 6,919 | | | 30,045 | |
| | Provision for credit losses | | | 4,712 | | | (28 | ) | | 960 | | | 5,644 | |
| | Other | | | 17,838 | | | (1,618 | ) | | 7,213 | | | 23,433 | |
| | |
| |
| |
| |
| |
| | | | Total operating expenses | | | 589,541 | | | (11,002 | ) | | 172,940 | | | 751,479 | |
| | |
| |
| |
| |
| |
| OPERATING INCOME | | | 422,886 | | | (9,322 | ) | | 112,554 | | | 526,118 | |
| Interest Expense | | | 298,497 | | | (4,764 | ) | | 77,233 | | | 370,966 | |
| | |
| |
| |
| |
| |
| Income before minority interest | | | 124,389 | | | (4,558 | ) | | 35,321 | | | 155,152 | |
| Minority interest | | | (4,558 | ) | | 4,558 | | | — | | | — | |
| Gain on sales of assets and partnership interests, net | | | 170,307 | | | — | | | — | | | 170,307 | |
| | |
| |
| |
| |
| |
| Income before unconsolidated entities | | | 290,138 | | | — | | | 35,321 | | | 325,459 | |
| Loss from MerchantWired, LLC | | | (32,742 | ) | | | | | | | | (32,742 | ) |
| Income (Loss) from unconsolidated entities | | | 43,250 | | | — | | | (35,321 | ) | | 7,929 | (a) |
| | |
| |
| |
| |
| |
| Income before extraordinary items, and cumulative effect of accounting change | | | 300,646 | | | — | | | — | | | 300,646 | |
| Extraordinary items | | | 16,139 | | | | | | — | | | 16,139 | |
| Cumulative effect of accounting change | | | — | | | — | | | | | | — | |
| | |
| |
| |
| |
| |
| Income before allocation to limited partners | | | 316,785 | | | — | | | — | | | 316,785 | |
| LESS: | | | | | | | | | | | | | |
| | Limited partners' interest in the Operating Partnerships | | | 75,104 | | | — | | | — | | | 75,104 | |
| | Preferred distributions of the SPG Operating Partnership | | | 5,670 | | | — | | | — | | | 5,670 | |
| | |
| |
| |
| |
| |
| NET INCOME | | | 236,011 | | | — | | | — | | | 236,011 | |
| Preferred dividends | | | (32,835 | ) | | — | | | — | | | (32,835 | ) |
| | |
| |
| |
| |
| |
| NET INCOME AVAILABLE TO COMMON SHAREHOLDERS | | $ | 203,176 | | $ | — | | $ | — | | $ | 203,176 | |
| | |
| |
| |
| |
| |
| RECONCILIATION TO FFO: | | | | | | | | | | | | | |
| Income before extraordinary items, and cumulative effect of accounting change ("IBEC") | | | 300,646 | | | | | | | | | 300,646 | |
| | Less: | | | | | | | | | | | | | |
| | | Joint Venture IBEC | | | (35,321 | ) | | | | | 35,321 | | | — | |
| | | Minority Interest IBEC | | | 4,558 | | | (4,558 | ) | | | | | — | |
| | |
| |
| |
| |
| |
| | IBEC | | | 269,883 | | | (4,558 | ) | | 35,321 | | | 300,646 | |
| | Plus: | | | | | | | | | | | | | |
| | | Depreciation and amortization from combined consolidated properties | | | 226,445 | | | | | | | | | 226,445 | |
| | | Our share of depreciation and amortization from unconsolidated affiliates | | | 4,485 | | | | | | 68,804 | | | 73,289 | |
| | | Gain on sale of real estate | | | (170,307 | ) | | | | | | | | (170,307 | ) |
| | | Our share of impairment charge and writeoff from MerchantWired LLC, net of tax benefit | | | 26,695 | | | | | | | | | 26,695 | |
| | Less: | | | | | | | | | | | | | |
| | | Management Company gain on sale of real estate | | | (8,400 | ) | | | | | | | | (8,400 | ) |
| | | Minority interest portion of depreciation and amortization and extraordinary items | | | | | | (3,829 | ) | | | | | (3,829 | ) |
| | | Preferred distributions (Including those of subdisiaries) | | | (38,505 | ) | | | | | | | | (38,505 | ) |
| | |
| |
| |
| |
| |
| | Our FFO | | | 310,296 | | | (8,387 | ) | | 104,125 | | | 406,034 | |
| | |
| |
| |
| |
| |
| | | % of Total FFO: | | | 76.42 | % | | -2.07 | % | | 25.64 | % | | 100.00 | % |
- (a)
- Total Income(Loss) from Unconsolidated entities relates to income(loss) from the Management Company
Basis of Presentation:The consolidated amounts shown above are prepared on a consistent basis with the consolidated financial statements prepared by the Companies and included in their combined periodic filings.
The Real Estate Joint Ventures column was derived on a property by property basis by applying the same percentage interests used to arrive at our share of net income during the period and applying them to all financial statement line items of each property. A similar calculation was performed for minority interests.
13
SIMON PROPERTY GROUP
Analysis of Consolidated Other Income and Other Expense
As of June 30, 2002
(In thousands)
| | For the Three Months
Ended June 30,
| | For the Six Months
Ended June 30,
| |
|---|
| | 2002
| | 2001
| | 2002
| | 2001
| |
|---|
| Other Income | | | | | | | | | | | | | |
Interest Income |
|
$ |
5,953 |
|
$ |
7,175 |
|
$ |
11,799 |
|
$ |
15,030 |
|
| Lease Settlement Income | | | 1,520 | | | 5,602 | | | 6,903 | | | 7,335 | |
| Gains (Losses) on Land Sales | | | 8,108 | | | 1,229 | | | 15,975 | | | 2,420 | |
| SBV/SBN Revenues (2) | | | 3,288 | | | 3,882 | | | 7,391 | | | 13,972 | |
| Income from Hedging Activity | | | 7,840 | | | — | | | 7,840 | | | — | |
| Kimsward Fee | | | — | | | 5,708 | (1) | | — | | | 5,708 | (1) |
| Other | | | 5,368 | | | 3,709 | | | 9,666 | | | 7,988 | |
| | |
| |
| |
| |
| |
Totals |
|
$ |
32,077 |
|
$ |
27,305 |
|
$ |
59,574 |
|
$ |
52,453 |
|
| | |
| |
| |
| |
| |
Other Expense |
|
|
|
|
|
|
|
|
|
|
|
|
|
Ground Rent |
|
$ |
3,528 |
|
$ |
3,214 |
|
$ |
6,811 |
|
$ |
6,706 |
|
| Professional Fees | | | 1,440 | | | 1,362 | | | 2,906 | | | 3,041 | |
| Costs/Losses from Hedging Activity | | | (4,684 | ) | | — | | | 750 | | | — | |
| Agostinelli Litigation Settlement Costs | | | 2,035 | | | — | | | 3,035 | | | — | |
| Other | | | 2,524 | | | 2,185 | | | 4,336 | | | 3,799 | |
| | |
| |
| |
| |
| |
Totals |
|
$ |
4,843 |
|
$ |
6,761 |
|
$ |
17,838 |
|
$ |
13,546 |
|
| | |
| |
| |
| |
| |
- (1)
- Additional income of $18 million relating to the Kimsward transaction was recorded in the Management Company.
- (2)
- Additional SBV and SBN revenues are recorded in consolidated minimum rent, on joint venture properties, and in the Management Company.
14
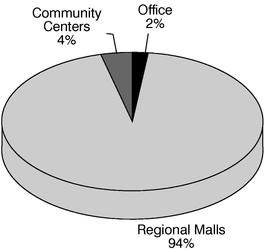
SIMON PROPERTY GROUP
EBITDA Composition and Asset Mix
For the Six Months Ended June 30, 2002
Geographic Diversification of
Regional Mall Portfolio(1)
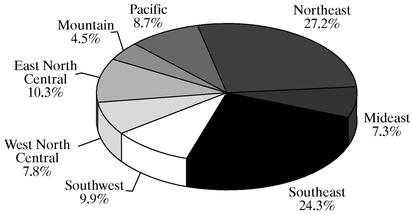
Asset Mix of Portfolio
- (1)
- Based on total EBITDA
Northeast - PA, NY, VT, NH, ME, MA, NJ, CT and RI
Mideast - KY, WV, MD, DE, VA, NC and SC
Southeast - TN, MS, AL, GA and FL
Southwest - TX, OK, LA and AR
West North Central - ND, SD, NE, KS, MN, IA and MO
East North Central - WI, MI, OH, IN and IL
Mountain - NV, AZ, NM, UT, CO, ID, MT and WY
Pacific - CA, OR and WA
15
SIMON PROPERTY GROUP
Portfolio GLA, Occupancy & Rent Data
As of June 30, 2002
Type of Property
| | GLA-Sq. Ft.
| | Total
Owned GLA
| | % of
Total
Owned GLA
| | % of Owned
GLA Which
is Leased
| | Avg. Annualized
Base Rent Per
Leased Sq. Ft.
of Owned GLA
|
|---|
| Regional Malls | | | | | | | | | | | |
| —Anchor | | 101,971,022 | | 30,062,145 | | 27.9 | % | 96.2 | % | $ | 4.06 |
—Mall Store |
|
58,836,537 |
|
58,788,641 |
|
54.5 |
% |
91.6 |
% |
$ |
30.73 |
| —Freestanding | | 3,925,926 | | 2,012,985 | | 1.9 | % | 89.3 | % | $ | 10.10 |
| | |
| |
| |
| | | | | |
| | Subtotal | | 62,762,463 | | 60,801,626 | | 56.4 | % | 91.5 | % | $ | 30.03 |
Regional Mall Total |
|
164,733,485 |
|
90,863,771 |
|
84.3 |
% |
93.1 |
% |
|
|
Community Shopping Centers |
|
|
|
|
|
|
|
|
|
|
|
| —Anchor | | 12,051,681 | | 7,480,383 | | 6.9 | % | 88.5 | % | $ | 8.07 |
| —Mall Store | | 4,303,923 | | 4,218,165 | | 3.9 | % | 83.5 | % | $ | 14.00 |
| —Freestanding | | 832,080 | | 376,469 | | .4 | % | 93.1 | % | $ | 7.45 |
| | |
| |
| |
| | | | | |
| Community Ctr. Total | | 17,187,684 | | 12,075,017 | | 11.2 | % | 87.9 | % | $ | 10.00 |
Office Portion of Mixed-Use Properties |
|
3,403,499 |
|
3,403,499 |
|
3.1 |
% |
82.8 |
% |
$ |
24.76 |
Other(1) |
|
1,705,661 |
|
1,473,120 |
|
1.4 |
% |
|
|
|
|
GRAND TOTAL |
|
187,030,329 |
|
107,815,407 |
|
100.00 |
% |
|
|
|
|
Occupancy History
| |
|---|
As of
| | Regional Malls(2)
| | Community
Shopping Centers(3)
| |
|---|
| 6/30/02 | | 91.5 | % | 87.9 | % |
| 6/30/01 | | 90.3 | % | 87.9 | % |
| 12/31/01 | | 91.9 | % | 90.0 | % |
| 12/31/00 | | 91.8 | % | 91.5 | % |
| 12/31/99 | | 90.6 | % | 88.6 | % |
| 12/31/98 | | 90.0 | % | 91.4 | % |
| 12/31/97 | | 87.3 | % | 91.3 | % |
- (1)
- Assets held for sale
- (2)
- Includes mall and freestanding stores.
- (3)
- Owned GLA, including anchors.
16
SIMON PROPERTY GROUP
Rent Information
As of June 30, 2002
Average Base Rent
As of
| | Mall & Freestanding
Stores at
Regional Malls
| | %
Change
| | Community Shopping
Centers
| | %
Change
| |
|---|
| 6/30/02 | | $ | 30.03 | | 4.1 | % | $ | 10.00 | | 2.9 | % |
| 6/30/01 | | | 28.84 | | 4.4 | % | | 9.72 | | 6.6 | % |
| 12/31/01 | | $ | 29.28 | | 3.4 | % | $ | 9.83 | | 5.0 | % |
| 12/31/00 | | | 28.31 | | 3.6 | | | 9.36 | | 12.0 | |
| 12/31/99 | | | 27.33 | | 6.3 | | | 8.36 | | 8.9 | |
| 12/31/98 | | | 25.70 | | 8.7 | | | 7.68 | | 3.2 | |
| 12/31/97 | | | 23.65 | | 14.4 | | | 7.44 | | (2.7 | ) |
Rental Rates
| | Base Rent(1)
| |
| |
| |
|---|
| | Amount of Change
| |
|---|
Year
| | Store Openings
During Period
| | Store Closings
During Period
| |
|---|
| | Dollar
| | Percentage
| |
|---|
| Regional Malls: | | | | | | | | | | | | |
| 2002 (YTD) | | $ | 39.59 | | $ | 32.20 | | $ | 7.39 | | 23.0 | % |
| 2001 | | $ | 34.88 | | $ | 29.10 | | $ | 5.78 | | 19.9 | % |
| 2000 | | | 35.13 | | | 29.24 | | | 5.89 | | 20.1 | |
| 1999 | | | 31.25 | | | 24.55 | | | 6.70 | | 27.3 | |
| 1998 | | | 27.33 | | | 23.63 | | | 3.70 | | 15.7 | |
| 1997 | | | 29.66 | | | 21.26 | | | 8.40 | | 39.5 | |
Community Shopping Centers: |
|
|
|
|
|
|
|
|
|
|
|
|
| 2002 (YTD) | | $ | 9.99 | | $ | 9.10 | | $ | .89 | | 9.8 | % |
| 2001 | | $ | 12.79 | | $ | 9.30 | | $ | 3.49 | | 37.5 | % |
| 2000 | | | 14.21 | | | 11.51 | | | 2.70 | | 23.5 | |
| 1999 | | | 10.26 | | | 7.44 | | | 2.82 | | 37.9 | |
| 1998 | | | 10.43 | | | 10.95 | | | (0.52 | ) | (4.7 | ) |
| 1997 | | | 8.63 | | | 9.44 | | | (0.81 | ) | (8.6 | ) |
- (1)
- Represents the average base rent in effect during the period for those tenants who signed leases as compared to the average base rent in effect during the period for those tenants whose leases terminated or expired.
17
SIMON PROPERTY GROUP
Lease Expirations(1)
As of June 30, 2002
Year
| | Number of
Leases Expiring
| | Square
Feet
| | Expiring
Avg. Base Rent
per Square Foot
|
|---|
| Regional Malls—Mall Stores & Freestanding | | | | | |
2002 (7/1 - 12/31) |
|
739 |
|
884,164 |
|
$ |
32.75 |
| 2003 | | 2,002 | | 4,737,574 | | $ | 30.77 |
| 2004 | | 1,932 | | 4,811,724 | | $ | 30.48 |
| 2005 | | 1,816 | | 5,341,548 | | $ | 30.14 |
| 2006 | | 1,868 | | 5,297,451 | | $ | 30.15 |
| 2007 | | 1,713 | | 4,951,100 | | $ | 32.41 |
| 2008 | | 1,436 | | 4,816,562 | | $ | 31.86 |
| 2009 | | 1,424 | | 4,536,527 | | $ | 29.96 |
| 2010 | | 1,560 | | 4,706,395 | | $ | 33.82 |
| 2011 | | 1,435 | | 4,513,129 | | $ | 31.67 |
| 2012 | | 870 | | 3,131,864 | | $ | 31.59 |
| 2013 and Thereafter | | 203 | | 3,185,436 | | $ | 18.41 |
Regional Malls—Anchor Tenants |
|
|
|
|
|
|
|
2002 (7/1 - 12/31) |
|
2 |
|
261,359 |
|
$ |
2.27 |
| 2003 | | 14 | | 1,596,896 | | $ | 2.56 |
| 2004 | | 24 | | 2,366,762 | | $ | 3.47 |
| 2005 | | 24 | | 2,958,181 | | $ | 2.25 |
| 2006 | | 24 | | 2,969,543 | | $ | 2.55 |
| 2007 | | 17 | | 1,843,647 | | $ | 2.12 |
| 2008 | | 21 | | 2,471,752 | | $ | 3.78 |
| 2009 | | 16 | | 1,986,791 | | $ | 2.82 |
| 2010 | | 14 | | 1,392,776 | | $ | 4.01 |
| 2011 | | 14 | | 1,474,515 | | $ | 4.98 |
| 2012 | | 17 | | 2,160,513 | | $ | 4.94 |
| 2013 and Thereafter | | 58 | | 6,840,652 | | $ | 6.18 |
Community Centers—Mall Stores & Freestanding |
|
|
|
|
|
|
|
2002 (7/1 - 12/31) |
|
80 |
|
104,763 |
|
$ |
12.38 |
| 2003 | | 156 | | 519,173 | | $ | 12.71 |
| 2004 | | 169 | | 524,164 | | $ | 13.78 |
| 2005 | | 202 | | 646,874 | | $ | 14.82 |
| 2006 | | 138 | | 527,557 | | $ | 14.25 |
| 2007 | | 93 | | 436,096 | | $ | 12.08 |
| 2008 | | 21 | | 153,181 | | $ | 11.61 |
| 2009 | | 13 | | 92,996 | | $ | 12.63 |
| 2010 | | 27 | | 218,607 | | $ | 13.74 |
| 2011 | | 29 | | 189,267 | | $ | 14.60 |
| 2012 | | 15 | | 90,135 | | $ | 16.27 |
| 2013 and Thereafter | | 11 | | 160,727 | | $ | 6.21 |
- (1)
- Does not consider the impact of options to renew that may be contained in leases.
18
SIMON PROPERTY GROUP
Lease Expirations(1)
As of June 30, 2002
Year
| | Number of
Leases Expiring
| | Square
Feet
| | Expiring
Avg. Base Rent
per Square Foot
|
|---|
| Community Centers—Anchor Tenants | | | | | | | |
2002 (7/1 - 12/31) |
|
3 |
|
79,942 |
|
$ |
7.78 |
| 2003 | | 12 | | 339,033 | | $ | 6.62 |
| 2004 | | 9 | | 305,410 | | $ | 5.90 |
| 2005 | | 13 | | 423,319 | | $ | 8.28 |
| 2006 | | 16 | | 661,891 | | $ | 5.67 |
| 2007 | | 16 | | 607,159 | | $ | 5.71 |
| 2008 | | 9 | | 237,172 | | $ | 11.00 |
| 2009 | | 13 | | 530,990 | | $ | 7.27 |
| 2010 | | 18 | | 694,835 | | $ | 9.23 |
| 2011 | | 7 | | 162,359 | | $ | 11.97 |
| 2012 | | 10 | | 478,851 | | $ | 8.86 |
| 2013 and Thereafter | | 36 | | 1,866,181 | | $ | 9.16 |
- (1)
- Does not consider the impact of options to renew that may be contained in leases.
19
SIMON PROPERTY GROUP
Top Regional Mall Tenants
As of June 30, 2002
(Square Feet in 000's)
Top 15 In-Line Retail Tenants (sorted by percentage of total base minimum rent)
Tenant
| | Number
of
Stores
| | Square
Feet
| | Percent of
Total
Sq. Ft.
| | Percent of
Total Base
Min. Rent
| |
|---|
| Limited | | 585 | | 4,128 | | 2.2 | % | 5.3 | % |
| The Gap, Inc. | | 352 | | 3,621 | | 1.9 | % | 3.1 | % |
| Foot Locker | | 419 | | 1,634 | | 0.9 | % | 2.4 | % |
| Zale Corporation | | 439 | | 477 | | 0.3 | % | 1.9 | % |
| Luxottica Group S.P.A | | 344 | | 596 | | 0.3 | % | 1.3 | % |
| Abercrombie & Fitch | | 109 | | 825 | | 0.4 | % | 1.1 | % |
| Best Buy Company | | 173 | | 713 | | 0.4 | % | 1.0 | % |
| Hallmark Cards | | 211 | | 687 | | 0.4 | % | 1.0 | % |
| Trans World Entertainment | | 119 | | 679 | | 0.4 | % | 0.9 | % |
| Charming Shoppes | | 131 | | 791 | | 0.4 | % | 0.8 | % |
| The Wet Seal, Inc. | | 136 | | 535 | | 0.3 | % | 0.8 | % |
| Barnes & Noble, Inc. | | 143 | | 706 | | 0.4 | % | 0.7 | % |
| Borders Group | | 119 | | 571 | | 0.3 | % | 0.7 | % |
| American Eagle Outfitters, Inc. | | 112 | | 539 | | 0.3 | % | 0.7 | % |
| KB Consolidated | | 142 | | 529 | | 0.3 | % | 0.7 | % |
Top 15 Anchors (sorted by percentage of total square footage)
Tenant
| | Number
of
Stores
| | Square
Feet
| | Percent of
Total
Sq. Ft.
| | Percent of
Total Base
Min. Rent
| |
|---|
| Sears | | 134 | | 20,230 | | 10.8 | % | 0.5 | % |
| Federated Dept. Stores | | 90 | | 17,614 | | 9.4 | % | 0.9 | % |
| J.C. Penney Co., Inc. | | 120 | | 17,069 | | 9.1 | % | 1.2 | % |
| Dillard's Dept. Stores | | 87 | | 12,688 | | 6.8 | % | 0.2 | % |
| The May Dept. Stores | | 85 | | 12,300 | | 6.6 | % | 0.3 | % |
| Saks Incorporated | | 42 | | 4,845 | | 2.6 | % | 1.1 | % |
| Target Corporation | | 27 | | 3,149 | | 1.7 | % | 0.0 | % |
| Nordstrom, Inc. | | 14 | | 2,611 | | 1.4 | % | 0.1 | % |
| Belk, Inc. | | 15 | | 1,680 | | 0.9 | % | 0.1 | % |
| Elder-Beerman Stores | | 6 | | 504 | | 0.3 | % | 0.1 | % |
| Boscov's Department Stores, Inc. | | 3 | | 496 | | 0.3 | % | 0.1 | % |
| Kohl's Dept. Stores | | 7 | | 613 | | 0.3 | % | 0.0 | % |
| Neiman Marcus Group | | 4 | | 562 | | 0.3 | % | 0.0 | % |
| TJX Companies, Inc. | | 7 | | 286 | | 0.2 | % | 0.2 | % |
| Burlington Coat Factory | | 4 | | 354 | | 0.2 | % | 0.1 | % |
20
SIMON PROPERTY GROUP
Property Listing (sorted by state)
As of June 30, 2002
| |
| |
| |
| |
| | Gross Leasable Area
| |
|---|
Property Name
| | State
| | City
| | Type
| | Ownership
| | Total
| | Anchor
| | Mall &
Freestanding
| |
|---|
| Regional Malls: | | | | | | | | | | | | | | | |
McCain Mall |
|
AR |
|
N. Little Rock |
|
Mall |
|
100.0% |
|
777,179 |
|
554,156 |
|
223,023 |
|
| University Mall | | AR | | Little Rock | | Mall | | 100.0% | | 565,094 | | 412,761 | | 152,333 | |
Metrocenter |
|
AZ |
|
Phoenix |
|
Mall |
|
50.0% |
|
1,367,120 |
|
876,027 |
|
491,093 |
|
| Southgate Mall | | AZ | | Yuma | | Mall | | 100.0% | | 321,574 | | 252,264 | | 69,310 | |
Brea Mall |
|
CA |
|
Brea |
|
Mall |
|
100.0% |
|
1,314,534 |
|
874,802 |
|
439,732 |
|
| Fashion Valley Mall | | CA | | San Diego | | Mall | | 50.0% | | 1,710,009 | | 1,053,305 | | 656,704 | |
| Laguna Hills Mall | | CA | | Laguna Hills | | Mall | | 100.0% | | 867,129 | | 536,500 | | 330,629 | |
| Santa Rosa Plaza | | CA | | Santa Rosa | | Mall | | 100.0% | | 696,579 | | 428,258 | | 268,321 | |
| Shops at Mission Viejo | | CA | | Mission Viejo | | Mall | | 100.0% | | 1,148,795 | | 677,215 | | 471,580 | |
| Westminster Mall | | CA | | Westminster | | Mall | | 100.0% | | 1,044,523 | | 541,939 | | 502,584 | |
Aurora Mall |
|
CO |
|
Aurora |
|
Mall |
|
100.0% |
|
1,014,059 |
|
566,015 |
|
448,044 |
|
| Mesa Mall | | CO | | Grand Junction | | Mall | | 50.0% | | 856,222 | | 425,817 | | 430,405 | |
Crystal Mall |
|
CT |
|
Waterford |
|
Mall |
|
74.6% |
|
793,452 |
|
442,311 |
|
351,141 |
|
Aventura Mall |
|
FL |
|
Miami Beach |
|
Mall |
|
33.3% |
|
1,899,444 |
|
1,242,098 |
|
657,346 |
|
| Avenues, The | | FL | | Jacksonville | | Mall | | 25.0% | | 1,110,154 | | 754,956 | | 355,198 | |
| Boynton Beach Mall | | FL | | Boynton Beach | | Mall | | 100.0% | | 1,184,740 | | 885,101 | | 299,639 | |
| Coral Square | | FL | | Coral Springs | | Mall | | 97.2% | | 943,991 | | 648,144 | | 295,847 | |
| Cordova Mall | | FL | | Pensacola | | Mall | | 100.0% | | 870,444 | | 507,073 | | 363,371 | |
| Crystal River Mall | | FL | | Crystal River | | Mall | | 100.0% | | 423,942 | | 302,495 | | 121,447 | |
| Dadeland Mall | | FL | | North Miami Beach | | Mall | | 50.0% | | 1,405,600 | | 1,062,072 | | 343,528 | |
| DeSoto Square | | FL | | Bradenton | | Mall | | 100.0% | | 690,720 | | 435,467 | | 255,253 | |
| Edison Mall | | FL | | Fort Myers | | Mall | | 100.0% | | 1,042,643 | | 742,667 | | 299,976 | |
| Florida Mall, The | | FL | | Orlando | | Mall | | 50.0% | | 1,632,083 | | 1,045,085 | | 586,998 | |
| Gulf View Square | | FL | | Port Richey | | Mall | | 100.0% | | 804,273 | | 568,882 | | 235,391 | |
| Indian River Mall | | FL | | Vero Beach | | Mall | | 50.0% | | 747,997 | | 445,552 | | 302,445 | |
| Lake Square Mall | | FL | | Leesburg | | Mall | | 50.0% | | 561,292 | | 296,033 | | 265,259 | |
| Melbourne Square | | FL | | Melbourne | | Mall | | 100.0% | | 729,381 | | 471,173 | | 258,208 | |
| Miami International Mall | | FL | | South Miami | | Mall | | 47.8% | | 973,051 | | 683,308 | | 289,743 | |
| Orange Park Mall | | FL | | Orange Park (Jacksonville) | | Mall | | 100.0% | | 925,500 | | 534,180 | | 391,320 | |
| Paddock Mall | | FL | | Ocala | | Mall | | 100.0% | | 559,940 | | 387,378 | | 172,562 | |
| Palm Beach Mall | | FL | | West Palm Beach | | Mall | | 100.0% | | 1,092,633 | | 749,288 | | 343,345 | |
| Port Charlotte Town Center | | FL | | Port Charlotte | | Mall | | 80.0% | | 780,768 | | 458,554 | | 322,214 | |
| Seminole Towne Center | | FL | | Sanford (Orlando) | | Mall | | 45.0% | | 1,153,628 | | 768,798 | | 384,830 | |
| The Shops @ Sunset Place | | FL | | Miami | | Mall | | 37.5% | | 503,658 | | — | | 503,658 | |
| Town Center at Boca Raton | | FL | | Boca Raton | | Mall | | 100.0% | | 1,555,261 | | 1,061,076 | | 494,185 | |
| Treasure Coast Square | | FL | | Jensen Beach | | Mall | | 100.0% | | 871,883 | | 511,372 | | 360,511 | |
| Tyrone Square | | FL | | St. Petersburg | | Mall | | 100.0% | | 1,127,754 | | 748,269 | | 379,485 | |
| University Mall | | FL | | Pensacola | | Mall | | 100.0% | | 707,514 | | 478,449 | | 229,065 | |
Gwinnett Place |
|
GA |
|
Duluth (Atlanta) |
|
Mall |
|
50.0% |
|
1,276,483 |
|
843,609 |
|
432,874 |
|
| Lenox Square | | GA | | Atlanta | | Mall | | 100.0% | | 1,480,157 | | 821,356 | | 658,801 | |
| Mall of Georgia | | GA | | Buford (Atlanta) | | Mall | | 50.0% | | 1,785,676 | | 989,590 | | 796,086 | |
| Northlake Mall | | GA | | Atlanta | | Mall | | 100.0% | | 961,999 | | 665,745 | | 296,254 | |
| Phipps Plaza | | GA | | Atlanta | | Mall | | 100.0% | | 821,027 | | 472,385 | | 348,642 | |
| Town Center at Cobb | | GA | | Kennesaw (Atlanta) | | Mall | | 50.0% | | 1,273,016 | | 851,346 | | 421,670 | |
21
Lindale Mall |
|
IA |
|
Cedar Rapids |
|
Mall |
|
50.0% |
|
691,623 |
|
305,563 |
|
386,060 |
|
| NorthPark Mall | | IA | | Davenport | | Mall | | 50.0% | | 1,057,126 | | 651,533 | | 405,593 | |
| Southern Hills Mall | | IA | | Sioux City | | Mall | | 50.0% | | 748,695 | | 313,577 | | 435,118 | |
| SouthRidge Mall | | IA | | Des Moines | | Mall | | 50.0% | | 1,008,088 | | 497,806 | | 510,282 | |
Alton Square |
|
IL |
|
Alton |
|
Mall |
|
100.0% |
|
639,220 |
|
426,315 |
|
212,905 |
|
| Lincolnwood Town Center | | IL | | Lincolnwood | | Mall | | 100.0% | | 422,256 | | 220,830 | | 201,426 | |
| Machesney Park Mall | | IL | | Rockford | | Mall | | 100.0% | | 554,975 | | 312,920 | | 242,055 | |
| Northfield Square Mall | | IL | | Bourbonnais | | Mall | | 31.6% | | 558,191 | | 310,994 | | 247,197 | |
| Northwoods Mall | | IL | | Peoria | | Mall | | 100.0% | | 695,502 | | 472,969 | | 222,533 | |
| Orland Square | | IL | | Orland Park | | Mall | | 100.0% | | 1,216,487 | | 773,295 | | 443,192 | |
| River Oaks Center | | IL | | Calumet City | | Mall | | 100.0% | | 1,362,393 | | 834,588 | | 527,805 | (1) |
| SouthPark Mall | | IL | | Moline | | Mall | | 50.0% | | 1,031,137 | | 578,056 | | 453,081 | |
| White Oaks Mall | | IL | | Springfield | | Mall | | 77.0% | | 951,365 | | 601,708 | | 349,657 | |
Castleton Square |
|
IN |
|
Indianapolis |
|
Mall |
|
100.0% |
|
1,461,141 |
|
1,082,021 |
|
379,120 |
|
| Circle Centre | | IN | | Indianapolis | | Mall | | 14.7% | | 792,673 | | 350,000 | | 442,673 | |
| College Mall | | IN | | Bloomington | | Mall | | 100.0% | | 706,885 | | 439,766 | | 267,119 | |
| Eastland Mall | | IN | | Evansville | | Mall | | 50.0% | | 898,479 | | 532,955 | | 365,524 | |
| Fashion Mall at Keystone | | IN | | Indianapolis | | Mall | | 100.0% | | 655,394 | | 249,721 | | 405,673 | (1) |
| Greenwood Park Mall | | IN | | Greenwood | | Mall | | 100.0% | | 1,328,186 | | 898,928 | | 429,258 | |
| Lafayette Square | | IN | | Indianapolis | | Mall | | 100.0% | | 1,215,048 | | 937,223 | | 277,825 | |
| Markland Mall | | IN | | Kokomo | | Mall | | 100.0% | | 393,009 | | 252,444 | | 140,565 | |
| Mounds Mall | | IN | | Anderson | | Mall | | 100.0% | | 404,353 | | 277,256 | | 127,097 | |
| Muncie Mall | | IN | | Muncie | | Mall | | 100.0% | | 656,709 | | 435,756 | | 220,953 | |
| Richmond Square | | IN | | Richmond | | Mall | | 100.0% | | 391,217 | | 260,562 | | 130,655 | |
| Tippecanoe Mall | | IN | | Lafayette | | Mall | | 100.0% | | 859,333 | | 568,373 | | 290,960 | |
| University Park Mall | | IN | | Mishawaka | | Mall | | 60.0% | | 941,904 | | 622,508 | | 319,396 | |
| Washington Square | | IN | | Indianapolis | | Mall | | 100.0% | | 1,139,821 | | 832,326 | | 307,495 | |
Hutchinson Mall |
|
KS |
|
Hutchinson |
|
Mall |
|
100.0% |
|
525,672 |
|
277,665 |
|
248,007 |
|
| Towne East Square | | KS | | Wichita | | Mall | | 100.0% | | 1,216,051 | | 788,281 | | 427,770 | |
| Towne West Square | | KS | | Wichita | | Mall | | 100.0% | | 965,780 | | 628,971 | | 336,809 | |
| West Ridge Mall | | KS | | Topeka | | Mall | | 100.0% | | 1,040,323 | | 716,811 | | 323,512 | |
Prien Lake Mall |
|
LA |
|
Lake Charles |
|
Mall |
|
100.0% |
|
812,001 |
|
631,762 |
|
180,239 |
|
| South Park Mall | | LA | | Shreveport | | Mall | | 100.0% | | 857,546 | | 618,915 | | 238,631 | |
Arsenal Mall |
|
MA |
|
Watertown (Boston) |
|
Mall |
|
100.0% |
|
501,838 |
|
191,395 |
|
310,443 |
(1) |
| Atrium Mall | | MA | | Chestnut Hill (Boston) | | Mall | | 49.1% | | 209,378 | | — | | 209,378 | |
| Auburn Mall | | MA | | Auburn (Boston) | | Mall | | 49.1% | | 597,521 | | 417,620 | | 179,901 | |
| Burlington Mall | | MA | | Burlington (Boston) | | Mall | | 100.0% | | 1,253,120 | | 836,236 | | 416,884 | |
| Cape Cod Mall | | MA | | Hyannis | | Mall | | 49.1% | | 723,846 | | 420,199 | | 303,647 | |
| Emerald Square | | MA | | North Attleboro | | Mall | | 49.1% | | 1,022,564 | | 647,372 | | 375,192 | |
| Greendale Mall | | MA | | Worcester (Boston) | | Mall | | 49.1% | | 432,004 | | 132,634 | | 299,370 | (1) |
| Liberty Tree Mall | | MA | | Danvers (Boston) | | Mall | | 49.1% | | 856,842 | | 498,000 | | 358,842 | |
| Mall at Chestnut Hill, The | | MA | | Newton (Boston) | | Mall | | 47.2% | | 478,141 | | 297,253 | | 180,888 | |
| Northshore Mall | | MA | | Peabody (Boston) | | Mall | | 49.1% | | 1,684,621 | | 989,277 | | 695,344 | |
| Solomon Pond Mall | | MA | | Marlborough | | Mall | | 49.1% | | 880,923 | | 506,591 | | 374,332 | |
| South Shore Plaza | | MA | | Braintree (Boston) | | Mall | | 100.0% | | 1,438,298 | | 847,603 | | 590,695 | |
| Square One Mall | | MA | | Saugus (Boston) | | Mall | | 49.1% | | 865,291 | | 540,101 | | 325,190 | |
Bowie Town Center |
|
MD |
|
Bowie (Washington, D.C.) |
|
Mall |
|
100.0% |
|
664,299 |
|
338,567 |
|
325,732 |
|
| Forest Village Park Mall | | MD | | Forestville (Washington, D.C.) | | Mall | | 100.0% | | 417,182 | | 242,666 | | 174,516 | |
| St. Charles Towne Center | | MD | | Waldorf (Washington, D.C.) | | Mall | | 100.0% | | 1,044,875 | | 640,797 | | 404,078 | |
22
Mall of America |
|
MN |
|
Bloomington (Minneapolis) |
|
Mall |
|
50.0% |
|
2,778,892 |
|
1,220,305 |
|
1,558,587 |
|
| Maplewood Mall | | MN | | Minneapolis | | Mall | | 100.0% | | 907,904 | | 578,060 | | 329,844 | |
| Miller Hill Mall | | MN | | Duluth | | Mall | | 100.0% | | 807,125 | | 429,508 | | 377,617 | |
Battlefield Mall |
|
MO |
|
Springfield |
|
Mall |
|
100.0% |
|
1,184,669 |
|
770,111 |
|
414,558 |
|
| Independence Center | | MO | | Independence | | Mall | | 100.0% | | 1,022,303 | | 499,284 | | 523,019 | |
Biltmore Square |
|
NC |
|
Asheville |
|
Mall |
|
66.7% |
|
494,236 |
|
242,576 |
|
251,660 |
|
| SouthPark Mall | | NC | | Charlotte | | Mall | | 100.0% | | 1,094,259 | | 789,342 | | 304,917 | |
Crossroads Mall |
|
NE |
|
Omaha |
|
Mall |
|
100.0% |
|
858,610 |
|
609,669 |
|
248,941 |
|
Mall at Rockingham Park |
|
NH |
|
Salem |
|
Mall |
|
24.6% |
|
1,020,594 |
|
638,111 |
|
382,483 |
|
| Mall of New Hampshire | | NH | | Manchester | | Mall | | 49.1% | | 806,239 | | 444,889 | | 361,350 | |
| Pheasant Lane Mall | | NH | | Nashua | | Mall | | 100.0% | | 968,768 | | 656,535 | | 312,233 | |
Bergen Mall |
|
NJ |
|
Paramus(NYC) |
|
Mall |
|
100.0% |
|
900,439 |
|
453,260 |
|
447,179 |
|
| Brunswick Square | | NJ | | Brunswick (NYC) | | Mall | | 100.0% | | 771,630 | | 467,626 | | 304,004 | |
| Livingston Mall | | NJ | | Livingston (NYC) | | Mall | | 100.0% | | 986,051 | | 616,128 | | 369,923 | |
| Menlo Park Mall | | NJ | | Edison (NYC) | | Mall | | 100.0% | | 1,309,483 | | 587,591 | | 721,892 | (1) |
| Ocean County Mall | | NJ | | Toms River | | Mall | | 100.0% | | 872,373 | | 596,500 | | 275,873 | |
| Rockaway Townsquare | | NJ | | Rockaway (NYC) | | Mall | | 100.0% | | 1,247,279 | | 786,626 | | 460,653 | |
Cottonwood Mall |
|
NM |
|
Albuquerque |
|
Mall |
|
100.0% |
|
1,041,157 |
|
631,556 |
|
409,601 |
|
Forum Shops at Caesars |
|
NV |
|
Las Vegas |
|
Mall |
|
60.0% |
|
483,859 |
|
— |
|
483,859 |
|
Chautauqua Mall |
|
NY |
|
Lakewood |
|
Mall |
|
100.0% |
|
431,160 |
|
213,320 |
|
217,840 |
|
| Eastern Hills Mall | | NY | | Williamsville (Buffalo) | | Mall | | 100.0% | | 993,821 | | 713,070 | | 280,751 | |
| Jefferson Valley Mall | | NY | | Yorktown Heights | | Mall | | 100.0% | | 587,496 | | 310,095 | | 277,401 | |
| Nanuet Mall | | NY | | Nanuet (NYC) | | Mall | | 100.0% | | 915,491 | | 583,711 | | 331,780 | |
| Roosevelt Field | | NY | | Garden City (NYC) | | Mall | | 100.0% | | 2,178,387 | | 1,430,425 | | 747,962 | |
| Smith Haven Mall | | NY | | Lake Grove (NYC) | | Mall | | 25.0% | | 1,361,407 | | 902,595 | | 458,812 | |
| Source, The | | NY | | Westbury (NYC) | | Mall | | 25.0% | | 728,584 | | 210,798 | | 517,786 | |
| Walt Whitman Mall | | NY | | Huntington Station | | Mall | | 98.3% | | 1,017,510 | | 742,214 | | 275,296 | |
| Westchester, The | | NY | | White Plains (NYC) | | Mall | | 40.0% | | 826,798 | | 349,393 | | 477,405 | |
Great Lakes Mall |
|
OH |
|
Mentor (Cleveland) |
|
Mall |
|
100.0% |
|
1,314,984 |
|
879,300 |
|
435,684 |
|
| Lima Mall | | OH | | Lima | | Mall | | 100.0% | | 745,903 | | 541,861 | | 204,042 | |
| North Towne Square | | OH | | Toledo | | Mall | | 100.0% | | 747,688 | | 480,230 | | 267,458 | |
| Richmond Town Square | | OH | | Richmond Heights (Cleveland) | | Mall | | 100.0% | | 1,020,789 | | 685,251 | | 335,538 | |
| Southern Park Mall | | OH | | Boardman | | Mall | | 100.0% | | 1,197,336 | | 811,858 | | 385,478 | |
| Summit Mall | | OH | | Akron | | Mall | | 100.0% | | 763,492 | | 432,936 | | 330,556 | |
| Upper Valley Mall | | OH | | Springfield | | Mall | | 100.0% | | 750,634 | | 479,418 | | 271,216 | |
| Woodville Mall | | OH | | Northwood | | Mall | | 100.0% | | 772,394 | | 518,792 | | 253,602 | |
Eastland Mall |
|
OK |
|
Tulsa |
|
Mall |
|
100.0% |
|
706,555 |
|
452,877 |
|
253,678 |
|
| Heritage Park Mall | | OK | | Midwest City | | Mall | | 100.0% | | 604,886 | | 382,700 | | 222,186 | |
| Penn Square Mall | | OK | | Oklahoma City | | Mall | | 94.4% | | 1,076,124 | | 689,818 | | 386,306 | |
| Woodland Hills Mall | | OK | | Tulsa | | Mall | | 47.2% | | 1,091,510 | | 709,447 | | 382,063 | |
Century III Mall |
|
PA |
|
West Mifflin (Pittsburgh) |
|
Mall |
|
100.0% |
|
1,284,483 |
|
725,360 |
|
559,123 |
|
| Cheltenham Square | | PA | | Philadelphia | | Mall | | 100.0% | | 636,947 | | 364,106 | | 272,841 | |
| Granite Run Mall | | PA | | Media (Philadelphia) | | Mall | | 50.0% | | 1,047,449 | | 500,809 | | 546,640 | |
| Ross Park Mall | | PA | | Pittsburgh | | Mall | | 100.0% | | 1,276,333 | | 827,015 | | 449,318 | |
| South Hills Village | | PA | | Pittsburgh | | Mall | | 100.0% | | 1,113,010 | | 655,987 | | 457,023 | |
23
Anderson Mall |
|
SC |
|
Anderson |
|
Mall |
|
100.0% |
|
624,049 |
|
404,394 |
|
219,655 |
|
| Haywood Mall | | SC | | Greenville | | Mall | | 100.0% | | 1,244,341 | | 913,633 | | 330,708 | |
Empire Mall |
|
SD |
|
Sioux Falls |
|
Mall |
|
50.0% |
|
1,058,636 |
|
497,341 |
|
561,295 |
|
| Rushmore Mall | | SD | | Rapid City | | Mall | | 50.0% | | 835,224 | | 470,660 | | 364,564 | |
Knoxville Center |
|
TN |
|
Knoxville |
|
Mall |
|
100.0% |
|
981,333 |
|
597,028 |
|
384,305 |
|
| Oak Court Mall | | TN | | Memphis | | Mall | | 100.0% | | 851,851 | | 535,000 | | 316,851 | (1) |
| Raleigh Springs Mall | | TN | | Memphis | | Mall | | 100.0% | | 918,010 | | 691,230 | | 226,780 | |
| West Town Mall | | TN | | Knoxville | | Mall | | 50.0% | | 1,334,042 | | 878,311 | | 455,731 | |
| Wolfchase Galleria | | TN | | Memphis | | Mall | | 94.4% | | 1,266,224 | | 761,648 | | 504,576 | |
Amigoland Mall |
|
TX |
|
Brownsville |
|
Mall |
|
100.0% |
|
556,597 |
|
332,773 |
|
223,824 |
|
| Barton Creek Square | | TX | | Austin | | Mall | | 100.0% | | 1,244,049 | | 777,266 | | 466,783 | |
| Broadway Square | | TX | | Tyler | | Mall | | 100.0% | | 618,054 | | 427,730 | | 190,324 | |
| Cielo Vista Mall | | TX | | El Paso | | Mall | | 100.0% | | 1,191,812 | | 793,716 | | 398,096 | |
| Highland Mall | | TX | | Austin | | Mall | | 50.0% | | 1,090,685 | | 732,000 | | 358,685 | |
| Houston Galleria | | TX | | Houston | | Mall | | 31.5% | | 1,755,647 | | 753,616 | | 1,002,031 | |
| Ingram Park Mall | | TX | | San Antonio | | Mall | | 100.0% | | 1,129,097 | | 751,704 | | 377,393 | |
| Irving Mall | | TX | | Irving | | Mall | | 100.0% | | 1,123,961 | | 726,574 | | 397,387 | |
| La Plaza Mall | | TX | | McAllen | | Mall | | 100.0% | | 1,214,965 | | 788,896 | | 426,069 | |
| Lakeline Mall | | TX | | Austin | | Mall | | 100.0% | | 1,100,405 | | 745,179 | | 355,226 | |
| Longview Mall | | TX | | Longview | | Mall | | 100.0% | | 613,849 | | 402,843 | | 211,006 | |
| Midland Park Mall | | TX | | Midland | | Mall | | 100.0% | | 619,214 | | 339,113 | | 280,101 | |
| North East Mall | | TX | | Hurst (Ft. Worth) | | Mall | | 100.0% | | 1,705,422 | | 1,348,279 | | 357,143 | |
| Richardson Square Mall | | TX | | Richardson (Dallas) | | Mall | | 100.0% | | 738,209 | | 454,881 | | 283,328 | |
| Rolling Oaks Mall | | TX | | San Antonio | | Mall | | 100.0% | | 738,036 | | 460,857 | | 277,179 | |
| Sunland Park Mall | | TX | | El Paso | | Mall | | 100.0% | | 919,235 | | 575,837 | | 343,398 | |
| Valle Vista Mall | | TX | | Harlingen | | Mall | | 100.0% | | 656,623 | | 389,781 | | 266,842 | |
Trolley Square |
|
UT |
|
Salt Lake City |
|
Mall |
|
90.0% |
|
221,982 |
|
— |
|
221,982 |
|
Apple Blossom Mall |
|
VA |
|
Winchester |
|
Mall |
|
49.1% |
|
443,183 |
|
229,011 |
|
214,172 |
|
| Charlottesville Fashion Sq. | | VA | | Charlottesville | | Mall | | 100.0% | | 571,999 | | 381,153 | | 190,846 | |
| Chesapeake Square | | VA | | Chesapeake | | Mall | | 75.0% | | 797,155 | | 524,463 | | 272,692 | |
| Valley Mall | | VA | | Harrisonburg | | Mall | | 50.0% | | 504,924 | | 307,798 | | 197,126 | |
| Virginia Center Commons | | VA | | Glen Allen (Richmond) | | Mall | | 100.0% | | 786,745 | | 506,639 | | 280,106 | |
Columbia Center |
|
WA |
|
Kennewick |
|
Mall |
|
100.0% |
|
741,310 |
|
408,052 |
|
333,258 |
|
| Northgate Mall | | WA | | Seattle | | Mall | | 100.0% | | 1,012,189 | | 688,391 | | 323,798 | |
| Tacoma Mall | | WA | | Tacoma | | Mall | | 100.0% | | 1,262,628 | | 924,045 | | 338,583 | |
Bay Park Square |
|
WI |
|
Green Bay |
|
Mall |
|
100.0% |
|
668,254 |
|
447,508 |
|
220,746 |
|
| Forest Mall | | WI | | Fond Du Lac | | Mall | | 100.0% | | 501,396 | | 327,260 | | 174,136 | |
| Memorial Mall | | WI | | Sheboygan | | Mall | | 100.0% | | 348,543 | | 233,308 | | 115,235 | |
| Regional Malls Subtotal | | | | | | | | | | 164,379,166 | | 101,460,561 | | 62,918,605 | |
Community Centers: |
|
|
|
|
|
|
|
|
|
|
|
|
|
|
|
Plaza at Buckland Hills |
|
CT |
|
Manchester |
|
Comm Cnt |
|
35.0% |
|
334,487 |
|
252,179 |
|
82,308 |
|
Gaitway Plaza |
|
FL |
|
Ocala |
|
Comm Cnt |
|
23.3% |
|
229,972 |
|
155,721 |
|
74,251 |
|
| Grove @ Lakeland Square | | FL | | Lakeland | | Comm Cnt | | 100.0% | | 215,591 | | 142,317 | | 73,274 | |
| Highland Lakes Center | | FL | | Orlando | | Comm Cnt | | 100.0% | | 478,014 | | 372,316 | | 105,698 | |
| Indian River Commons | | FL | | Vero Beach | | Comm Cnt | | 50.0% | | 263,492 | | 233,969 | | 29,523 | |
| Royal Eagle Plaza | | FL | | Coral Springs | | Comm Cnt | | 35.0% | | 199,030 | | 124,479 | | 74,551 | |
| Terrace @ the Florida Mall | | FL | | Orlando | | Comm Cnt | | 100.0% | | 329,362 | | 281,831 | | 47,531 | |
| Waterford Lakes Town Center | | FL | | Orlando | | Comm Cnt | | 100.0% | | 817,973 | | 501,197 | | 316,776 | |
24
| West Town Corners | | FL | | Altamonte Springs | | Comm Cnt | | 23.3% | | 385,026 | | 263,782 | | 121,244 | |
| Westland Park Plaza | | FL | | Jacksonville | | Comm Cnt | | 23.3% | | 163,154 | | 123,548 | | 39,606 | |
Mall of Georgia Crossing |
|
GA |
|
Buford (Atlanta) |
|
Comm Cnt |
|
50.0% |
|
440,612 |
|
357,726 |
|
82,886 |
|
Bloomingdale Court |
|
IL |
|
Bloomingdale |
|
Comm Cnt |
|
100.0% |
|
598,762 |
|
425,886 |
|
172,876 |
|
| Bridgeview Court | | IL | | Bridgeview | | Comm Cnt | | 100.0% | | 273,678 | | 216,491 | | 57,187 | |
| Countryside Plaza | | IL | | Countryside | | Comm Cnt | | 100.0% | | 435,608 | | 290,216 | | 145,392 | |
| Crystal Court | | IL | | Crystal Lake | | Comm Cnt | | 35.0% | | 278,971 | | 201,993 | | 76,978 | |
| Forest Plaza | | IL | | Rockford | | Comm Cnt | | 100.0% | | 429,250 | | 325,170 | | 104,080 | |
| Fox River Plaza | | IL | | Elgin | | Comm Cnt | | 100.0% | | 322,997 | | 276,096 | | 46,901 | |
| Lake Plaza | | IL | | Waukegan | | Comm Cnt | | 100.0% | | 215,498 | | 170,789 | | 44,709 | |
| Lake View Plaza | | IL | | Orland Park | | Comm Cnt | | 100.0% | | 371,480 | | 270,628 | | 100,852 | |
| Lincoln Crossing | | IL | | O'Fallon | | Comm Cnt | | 100.0% | | 161,337 | | 134,935 | | 26,402 | |
| Matteson Plaza | | IL | | Matteson | | Comm Cnt | | 100.0% | | 275,455 | | 230,885 | | 44,570 | |
| North Ridge Plaza | | IL | | Joliet | | Comm Cnt | | 100.0% | | 305,070 | | 190,323 | | 114,747 | |
| North Riverside Park Plaza | | IL | | North Riverside | | Comm Cnt | | 100.0% | | 119,608 | | 58,587 | | 61,021 | |
| White Oaks Plaza | | IL | | Springfield | | Comm Cnt | | 100.0% | | 400,303 | | 275,703 | | 124,600 | |
| Willow Knolls Court | | IL | | Peoria | | Comm Cnt | | 35.0% | | 382,377 | | 309,440 | | 72,937 | |
| Yards Plaza, The | | IL | | Chicago | | Comm Cnt | | 35.0% | | 272,452 | | 228,813 | | 43,639 | |
Brightwood Plaza |
|
IN |
|
Indianapolis |
|
Comm Cnt |
|
100.0% |
|
38,493 |
|
— |
|
38,493 |
|
| Eastland Convenience Center | | IN | | Evansville | | Comm Cnt | | 50.0% | | 173,069 | | 60,000 | | 113,069 | |
| Greenwood Plus | | IN | | Greenwood | | Comm Cnt | | 100.0% | | 165,481 | | 134,141 | | 31,340 | |
| Griffith Park Plaza | | IN | | Griffith | | Comm Cnt | | 100.0% | | 274,230 | | 175,595 | | 98,635 | |
| Keystone Shoppes | | IN | | Indianapolis | | Comm Cnt | | 100.0% | | 29,140 | | — | | 29,140 | |
| Markland Plaza | | IN | | Kokomo | | Comm Cnt | | 100.0% | | 95,996 | | 29,957 | | 66,039 | |
| Mounds Mall Cinema | | IN | | Anderson | | Comm Cnt | | 100.0% | | 7,500 | | 7,500 | | — | |
| Muncie Plaza | | IN | | Muncie | | Comm Cnt | | 100.0% | | 172,651 | | 145,456 | | 27,195 | |
| New Castle Plaza | | IN | | New Castle | | Comm Cnt | | 100.0% | | 91,648 | | 24,912 | | 66,736 | |
| Northwood Plaza | | IN | | Fort Wayne | | Comm Cnt | | 100.0% | | 204,372 | | 130,003 | | 74,369 | |
| Teal Plaza | | IN | | Lafayette | | Comm Cnt | | 100.0% | | 101,087 | | 98,337 | | 2,750 | |
| Tippecanoe Plaza | | IN | | Lafayette | | Comm Cnt | | 100.0% | | 94,598 | | 85,811 | | 8,787 | |
| University Center | | IN | | Mishawaka | | Comm Cnt | | 60.0% | | 150,548 | | 104,359 | | 46,189 | |
| Village Park Plaza | | IN | | Carmel | | Comm Cnt | | 35.0% | | 528,241 | | 414,027 | | 114,214 | |
| Wabash Village | | IN | | West Lafayette | | Comm Cnt | | 100.0% | | 124,536 | | 109,388 | | 15,148 | |
| Washington Plaza | | IN | | Indianapolis | | Comm Cnt | | 100.0% | | 50,107 | | 21,500 | | 28,607 | |
West Ridge Plaza |
|
KS |
|
Topeka |
|
Comm Cnt |
|
100.0% |
|
237,858 |
|
182,161 |
|
55,697 |
|
| Wichita | | KS | | Wichita | | Comm Cnt | | 100.0% | | 370,181 | | 205,938 | | 164,243 | |
Park Plaza |
|
KY |
|
Hopkinsville |
|
Comm Cnt |
|
100.0% |
|
115,024 |
|
82,398 |
|
32,626 |
|
Glen Burnie |
|
MD |
|
Glen Burnie |
|
Comm Cnt |
|
100.0% |
|
455,886 |
|
347,591 |
|
108,295 |
|
| St. Charles Towne Plaza | | MD | | Waldorf | | Comm Cnt | | 100.0% | | 404,907 | | 291,705 | | 113,202 | |
Regency Plaza |
|
MO |
|
St. Charles |
|
Comm Cnt |
|
100.0% |
|
287,526 |
|
210,627 |
|
76,899 |
|
Ridgewood Court |
|
MS |
|
Jackson |
|
Comm Cnt |
|
35.0% |
|
240,662 |
|
185,939 |
|
54,723 |
|
Rockaway Convenience Ctr |
|
NJ |
|
Rockaway (NYC) |
|
Comm Cnt |
|
100.0% |
|
135,626 |
|
20,929 |
|
114,697 |
|
Cobblestone Court |
|
NY |
|
Victor |
|
Comm Cnt |
|
35.0% |
|
265,493 |
|
206,680 |
|
58,813 |
|
Boardman Plaza |
|
OH |
|
Youngstown |
|
Comm Cnt |
|
100.0% |
|
641,025 |
|
375,502 |
|
265,523 |
|
| Great Lakes Plaza | | OH | | Mentor | | Comm Cnt | | 100.0% | | 164,104 | | 142,229 | | 21,875 | |
| Lima Center | | OH | | Lima | | Comm Cnt | | 100.0% | | 201,154 | | 153,860 | | 47,294 | |
| Northland Plaza | | OH | | Columbus | | Comm Cnt | | 100.0% | | 209,534 | | 118,304 | | 91,230 | |
Eastland Plaza |
|
OK |
|
Tulsa |
|
Comm Cnt |
|
100.0% |
|
188,229 |
|
152,451 |
|
35,778 |
|
25
Great Northeast Plaza |
|
PA |
|
Philadelphia |
|
Comm Cnt |
|
50.0% |
|
298,242 |
|
240,525 |
|
57,717 |
|
Charles Towne Square |
|
SC |
|
Charleston |
|
Comm Cnt |
|
100.0% |
|
199,693 |
|
199,693 |
|
— |
|
Empire East |
|
SD |
|
Sioux Falls |
|
Comm Cnt |
|
50.0% |
|
250,081 |
|
192,766 |
|
57,315 |
|
Knoxville Commons |
|
TN |
|
Knoxville |
|
Comm Cnt |
|
100.0% |
|
180,463 |
|
91,483 |
|
88,980 |
|
Arboretum, The |
|
TX |
|
Austin |
|
Comm Cnt |
|
100.0% |
|
212,133 |
|
35,773 |
|
176,360 |
|
| Celina Plaza | | TX | | El Paso | | Comm Cnt | | 100.0% | | 32,622 | | 23,927 | | 8,695 | |
| Ingram Plaza | | TX | | San Antonio | | Comm Cnt | | 100.0% | | 111,518 | | — | | 111,518 | |
| Lakeline Plaza | | TX | | Austin | | Comm Cnt | | 100.0% | | 344,693 | | 275,321 | | 69,372 | |
| Mainland Crossing | | TX | | Texas City | | Comm Cnt | | 80.0% | | 390,987 | | 306,158 | | 84,829 | |
| Shops at North East Mall | | TX | | Hurst | | Comm Cnt | | 100.0% | | 364,534 | | 265,559 | | 98,975 | |
Chesapeake Center |
|
VA |
|
Chesapeake |
|
Comm Cnt |
|
100.0% |
|
299,604 |
|
219,462 |
|
80,142 |
|
| Fairfax Court | | VA | | Fairfax | | Comm Cnt | | 26.3% | | 249,297 | | 168,683 | | 80,614 | |
| Martinsville Plaza | | VA | | Martinsville | | Comm Cnt | | 100.0% | | 102,105 | | 60,000 | | 42,105 | |
Memorial Plaza |
|
WI |
|
Sheboygan |
|
Comm Cnt |
|
100.0% |
|
131,499 |
|
103,974 |
|
27,525 |
|
Community Centers Subtotal |
|
|
|
|
|
|
|
|
|
18,085,936 |
|
12,815,644 |
|
5,270,292 |
|
Mixed-Used: |
|
|
|
|
|
|
|
|
|
|
|
|
|
|
|
New Orleans Centre |
|
LA |
|
New Orleans |
|
Mixed |
|
100.0% |
|
1,031,353 |
|
331,831 |
|
699,522 |
(1) |
Copley Place |
|
MA |
|
Boston |
|
Mall |
|
98.2% |
(2) |
1,212,741 |
|
104,332 |
|
1,108,409 |
(1) |
Fashion Centre at Pentagon |
|
VA |
|
Arlington (Washington, D.C.) |
|
Mixed |
|
50.0% |
|
991,468 |
|
472,729 |
|
518,739 |
(1) |
Mixed-Used Subtotal |
|
|
|
|
|
|
|
|
|
3,235,562 |
|
908,892 |
|
2,326,670 |
|
Office: |
|
|
|
|
|
|
|
|
|
|
|
|
|
|
|
O'Hare International Center |
|
IL |
|
Rosemont (Chicago) |
|
Office |
|
100.0% |
|
512,318 |
|
— |
|
512,318 |
(3) |
| Riverway | | IL | | Rosemont (Chicago) | | Office | | 100.0% | | 817,347 | | — | | 817,347 | (4) |
Office Subtotal |
|
|
|
|
|
|
|
|
|
1,329,665 |
|
— |
|
1,329,665 |
|
Total Portfolio |
|
|
|
|
|
|
|
|
|
187,030,329 |
|
115,185,097 |
|
71,845,232 |
|
- (1)
- Office space included as follows:
River Oaks Mall—approx. 101,000 sq. ft.
Fashion Mall at Keystone—approx. 30,000 sq. ft.
Arsenal Mall—approx. 106,000 sq. ft.
Greendale Mall—approx. 120,000 sq. ft.
Menlo Park Mall—approx. 46,000 sq. ft.
Oak Court Mall—approx. 128,000 sq. ft.
New Orleans Centre—approx. 562,000 sq. ft.
Copley Place—approx. 847,000 sq. ft.
Fashion Centre at Pentagon—approx. 169,000 sq. ft.
- (2)
- Ownership increased from 31.5% to 98.2% on 7/19/02.
- (3)
- Includes approximately 13,000 sq. ft. of retail space.
- (4)
- Includes approximately 23,000 sq. ft. of retail space.
26
SIMON PROPERTY GROUP
Capital Expenditures
For the Six Months Ended June 30, 2002
(In millions)
| |
| | Unconsolidated Entities
| |
|---|
| | Consolidated
Properties
| | Total
| | Simon's
Share
| |
|---|
| New Developments | | $ | 2.9 | | $ | 40.6 | (1) | $ | 19.0 | (1) |
| Renovations and Expansions | | | 33.0 | | | 42.0 | | | 17.0 | |
| Tenant Allowances | | | 26.9 | | | 6.2 | | | 2.5 | |
| Operational Capital Expenditures at Properties: | | | | | | | | | | |
| | CAM Expenditures(2) | | | 6.2 | | | 1.7 | | | .7 | |
| | Non-CAM Expenditures | | | 5.3 | | | 2.8 | | | 1.3 | |
| | Telecommunications Cabling Infrastructure | | | 16.3 | | | 2.9 | | | 2.9 | |
| | |
| |
| |
| |
| Totals | | $ | 90.6 | | $ | 96.2 | | 43.4
| |
| Plus (Less): Conversion from Accrual to Cash Basis | | 3.6
| | 12.2
| | | | |
| Capital Expenditures(3) | | 94.2
| | 108.4
| | | | |
- (1)
- Does not include the Company's European initiatives (total cost of $72.5 million, SPG's share of $23.4 million).
- (2)
- Expenditure included in the pool of expenses allocated to tenants as Common Area Maintenance or CAM.
- (3)
- Agrees with the line item "Capital expenditures" on the Combined Statements of Cash Flows for the consolidated properties. No statement of cash flows is prepared for the joint venture properties as this is not required by the SEC or GAAP; however, the above reconciliation was completed in the same manner as the reconciliation for the consolidated properties.
27
SIMON PROPERTY GROUP
Development Activity
As of June 30, 2002
Mall/
Location
| | Project Description
| | SPG's
Ownership
Percentage
| | Opening
| | Projected
Cost
(in millions)
(1)
| | SPG's
Share of
Project Cost
| | Stabilized
Rate of
Return
| |
|---|
| New Development Projects Under Construction | | | | | | | | | | | | | |
Las Vegas Premium Outlets
Las Vegas, NV |
|
435,000 sf premium outlet center |
|
50 |
% |
8/03 |
|
$ |
88 |
|
$ |
44 |
|
12 |
% |
Significant Renovation/Expansion Projects Under Construction |
|
|
|
|
|
|
|
|
|
|
|
|
|
Barton Creek Square
Austin, TX |
|
Addition of Nordstrom (145,000 sf) and small shops (40,000 sf) in the former Montgomery Ward location |
|
100 |
% |
8/03 |
|
$ |
24 |
|
$ |
24 |
|
10 |
% |
Bay Park Square
Green Bay, WI |
|
Addition of Younkers (140,000 sf) and small shops (67,000 sf) in the former Montgomery Ward location |
|
100 |
% |
10/03 |
|
$ |
19 |
|
$ |
19 |
|
11 |
% |
Dadeland Mall
Miami, FL |
|
Expansion of Lord & Taylor (71,000 sf); remodel of Lord & Taylor, Saks Fifth Avenue and Burdines; mall renovation |
|
50 |
% |
11/02 (renov)
11/03 (expan) |
|
$ |
29 |
|
$ |
14.5 |
|
10 |
% |
Florida Mall
Orlando, FL |
|
Dillard's and JCPenney expansions, food court renovation (completed 1998); new Burdine's, small shop expansion and mall renovation (completed 1999); addition of Nordstrom (167,000 sf), small shops (30,000 sf), and new and expanded Lord & Taylor in former Parisian building (20,000 sf) |
|
50 |
% |
9/02 |
|
$ |
133 |
|
$ |
66.5 |
|
8 |
% |
The Galleria
Houston, TX |
|
Mall renovation, addition of Nordstrom (218,000 sf), Foley's (250,000 sf), small shops (228,000 sf) and two parking decks |
|
31 |
% |
3/03 |
|
$ |
144 |
|
$ |
45 |
|
10 |
% |
SouthPark
Charlotte, NC |
|
Addition of Nordstrom (153,000 sf) and an additional anchor pad, Hecht's expansion (60,000 sf) and renovation, Belk's expansion (46,000 sf) and renovation, addition of small shops (50,000 sf), three new parking decks and Cheesecake Factory and Maggiano's |
|
100 |
% |
Spring 2004 |
|
$ |
100 |
(2) |
$ |
100 |
(2) |
8 |
% |
Other Renovation Projects Under Construction |
|
|
|
|
|
|
|
|
|
|
|
|
|
Anderson Mall
Anderson, SC |
|
|
|
|
|
|
|
|
|
|
|
|
|
|
|
Charlottesville Fashion Square
Charlottesville, VA |
|
|
|
|
|
|
|
|
|
|
|
|
|
|
|
Jefferson Valley Mall
Yorktown Heights, NY |
|
|
|
|
|
|
|
|
|
|
|
|
|
|
|
SPG's Share of Project Cost = $19.4 million
Stabilized Rate of Return = 14% |
|
|
|
|
|
|
|
|
|
|
|
|
|
- (1)
- Total Projected Cost reflects net development costs. Total Projected Cost also includes soft costs such as architecture and engineering fees, tenant costs (allowances/leasing commissions), development, legal and other fees, marketing costs, cost of capital, and other related costs.
- (2)
- Projected cost is subject to change as project scope has not been finalized.
28
SIMON PROPERTY GROUP
Land Held for Future Development and Construction-in-Progress
As of June 30, 2002
(In millions)
| |
| | Unconsolidated Entities
| |
|---|
| | Consolidated
Properties
| | Total
| | Simon's
Share
| |
|---|
| Land Held for Future Development | | $ | 28.4 | | $ | 25.1 | | $ | 12.6 | |
Construction-in-Progress |
|
|
|
|
|
|
|
|
|
|
Las Vegas Premium Outlets |
|
|
— |
|
$ |
30.4 |
|
$ |
15.2 |
|
Barton Creek Square |
|
$ |
11.3 |
|
|
— |
|
|
— |
|
Bay Park Square |
|
|
8.2 |
|
|
— |
|
|
— |
|
Dadeland Mall |
|
|
— |
|
|
17.0 |
|
|
8.5 |
|
Florida Mall |
|
|
— |
|
|
36.4 |
|
|
18.2 |
|
The Galleria |
|
|
— |
|
|
67.3 |
|
|
20.9 |
|
SouthPark |
|
|
49.7 |
|
|
— |
|
|
— |
|
Renovation projects under construction (Anderson Mall, Charlottesville Fashion Square and Jefferson Valley Mall) |
|
|
5.1 |
|
|
— |
|
|
— |
|
All other projects |
|
|
32.9 |
|
|
8.1 |
|
|
2.5 |
|
Total Construction-in-Progress |
|
$ |
107.2 |
|
$ |
159.2 |
(1) |
$ |
65.3 |
(1) |
- (1)
- Does not include the Company's European initiatives (total balance of $91.4 million; SPG's share of $29.5 million)
29
SIMON PROPERTY GROUP
SPG's Share of Total Debt Amortization and Maturities by Year
As of June 30, 2002
(In thousands)
Year
| |
| | SPG's Share of
Secured
Consolidated
Debt
| | SPG's Share of
Unsecured
Consolidated
Debt
| | SPG's Share of
Unconsolidated
Joint Venture
Debt
| | SPG's Share of
Total
Debt
|
|---|
| 2002 | | | | | 85,976 | | | 0 | | | 62,691 | | | 148,667 |
| 2003 | | 1 | | | 552,695 | | | 1,000,000 | (1) | | 196,207 | | | 1,748,901 |
| 2004 | | 2 | | | 703,237 | | | 969,535 | | | 188,226 | | | 1,860,998 |
| 2005 | | 3 | | | 220,315 | | | 660,000 | | | 367,493 | | | 1,247,808 |
| 2006 | | 4 | | | 287,729 | | | 1,173,000 | | | 336,126 | | | 1,796,855 |
| 2007 | | 5 | | | 344,169 | | | 930,000 | | | 201,261 | | | 1,475,430 |
| 2008 | | 6 | | | 97,987 | | | 200,000 | | | 299,837 | | | 597,824 |
| 2009 | | 7 | | | 401,824 | | | 450,000 | | | 83,957 | | | 935,781 |
| 2010 | | 8 | | | 185,399 | | | 0 | | | 249,931 | | | 435,330 |
| 2011 | | 9 | | | 365,660 | | | 200,000 | | | 176,122 | | | 741,782 |
| 2012 | | 10 | | | 3,124 | | | 0 | | | 126,914 | | | 130,038 |
| Thereafter | | | | | 93,535 | | | 525,000 | | | 0 | | | 618,535 |
| | | | |
| |
| |
| |
|
| Subtotal Face Amounts | | | | $ | 3,341,650 | | $ | 6,107,535 | | $ | 2,288,765 | | $ | 11,737,949 |
| | | | |
| |
| |
| |
|
| Premiums and Discounts on Indebtedness, Net | | | | | 10,789 | | | (9,920 | ) | | 5,233 | | | 6,102 |
| | | | |
| |
| |
| |
|
| SPG's Share of Total Indebtedness | | | | $ | 3,352,439 | | $ | 6,097,615 | | $ | 2,293,998 | | $ | 11,744,051 |
| | | | |
| |
| |
| |
|
- (1)
- $322 million was repaid on the unsecured bridge facility on 7/1/02 with proceeds from a 9 million share common stock offering.
30
SIMON PROPERTY GROUP
Summary of Indebtedness
As of June 30, 2002
(In thousands)
| | Total
Indebtedness
| | SPG's
Share of
Indebtedness
| | Weighted Avg.
Interest Rate
| | Weighted
Average Years
to Maturity
|
|---|
| Consolidated Indebtedness | | | | | | | | |
| |
Mortgage Debt |
|
|
|
|
|
|
|
|
| | | Fixed Rate(1) | | 2,662,849 | | 2,531,936 | | 7.39 | % | 5.9 |
| | | Other Hedged Debt | | 157,000 | | 145,250 | | 3.38 | % | 4.2 |
| | | Floating Rate Debt | | 668,183 | | 664,464 | | 3.11 | % | 2.1 |
| | |
| |
| |
| |
|
| | Total Mortgage Debt | | 3,488,032 | | 3,341,650 | | 6.36 | % | 5.0 |
| |
Unsecured Debt |
|
|
|
|
|
|
|
|
| | | Fixed Rate | | 4,818,200 | | 4,818,200 | | 6.99 | % | 5.1 |
| | | Floating Rate Debt | | 176,335 | | 176,335 | | 2.48 | % | 1.7 |
| | |
| |
| |
| |
|
| | Subtotal | | 4,994,535 | | 4,994,535 | | 6.83 | % | 4.9 |
| | |
Revolving Corporate Credit Facility |
|
483,073 |
|
483,073 |
|
2.49 |
% |
3.8 |
| | | Revolving Corporate Credit Facility (Hedged) | | 139,927 | | 139,927 | | 2.49 | % | 3.8 |
| | | Unsecured Bridge Facility | | 425,000 | | 425,000 | | 2.49 | % | 0.8 |
| | | Unsecured Term Loan | | 65,000 | | 65,000 | | 2.64 | % | 1.7 |
| | |
| |
| |
| |
|
| | Total Unsecured Debt | | 6,107,535 | | 6,107,535 | | 6.04 | % | 4.5 |
| |
Net Discount—Fixed Rate |
|
(671 |
) |
(1,299 |
) |
N/A |
|
N/A |
| | Fair Value Interest Rate Swaps | | 2,168 | | 2,168 | | N/A | | N/A |
| | |
| |
| |
| |
|
| Consolidated Mortgages and Other Indebtedness | | 9,597,064 | | 9,450,054 | | 6.15 | % | 4.7 |
| | |
| |
| |
| |
|
Joint Venture Indebtedness |
|
|
|
|
|
|
|
|
| | Mortgage Debt | | | | | | | | |
| | | Fixed Rate | | 4,226,790 | | 1,834,238 | | 7.39 | % | 5.7 |
| | | Other Hedged Debt | | 897,900 | | 343,319 | | 2.79 | % | 2.4 |
| | | Floating Rate Debt | | 278,211 | | 108,014 | | 3.85 | % | 1.8 |
| | |
| |
| |
| |
|
| | Total Mortgage Debt | | 5,402,901 | | 2,285,571 | | 6.53 | % | 5.0 |
| |
Unsecured Floating Rate Debt |
|
6,500 |
|
3,194 |
|
4.34 |
% |
3.0 |
| | |
| |
| |
| |
|
| | Total Unsecured Debt | | 6,500 | | 3,194 | | 4.34 | % | 3.0 |
| |
Net Premium—Fixed Rate |
|
10,437 |
|
5,233 |
|
N/A |
|
N/A |
| | |
| |
| |
| |
|
| Joint Venture Mortgages and Other Indebtedness | | 5,419,838 | | 2,293,998 | | 6.53 | % | 5.1 |
| | |
| |
| |
| |
|
SPG's Share of Total Indebtedness |
|
|
|
11,744,051 |
|
6.23 |
% |
4.8 |
| | | | |
| |
| |
|
- (1)
- Includes $162,765 of variable rate debt, of which $126,734 is SPG's share, that is effectively fixed to maturity through the use of interest rate hedges.
31
SIMON PROPERTY GROUP
Summary of Indebtedness By Maturity
As of June 30, 2002
(In thousands)
Property Name
| |
| | Maturity
Date
| | Interest
Rate
| | Total
Indebtedness
| | SPG's
Share of
Indebtedness
| | Weighted Avg
Interest Rate
by Year
| |
|---|
| Consolidated Indebtedness | | | | | | | | | | | | | |
| Fixed Rate Mortgage Debt: | | | | | | | | | | | | | |
| | North Riverside Park Plaza—1 | | | | 09/01/02 | | 9.38 | % | 3,658 | | 3,658 | | | |
| | North Riverside Park Plaza—2 | | | | 09/01/02 | | 10.00 | % | 3,285 | | 3,285 | | | |
| | South Park Mall (LA)—3 | | (7) | | 09/15/02 | | 7.01 | % | 2,000 | | 2,000 | | | |
| | Hutchinson Mall—2 | | (8) | | 09/15/02 | | 6.81 | % | 4,372 | | 4,372 | | | |
| | Hutchinson Mall—1 | | (8) | | 11/01/02 | | 8.44 | % | 10,974 | | 10,974 | | | |
| | Palm Beach Mall | | | | 12/15/02 | | 7.50 | % | 46,410 | | 46,410 | | | |
| | | | | | | | |
| |
| | | |
| | | Subtotal 2002 | | | | | | | | 70,699 | | 70,699 | | 7.80 | % |
| |
Principal Mutual Mortgages—Pool 1 |
|
(1),(7) |
|
03/15/03 |
|
6.66 |
% |
76,950 |
|
76,950 |
|
|
|
| | Principal Mutual Mortgages—Pool 2 | | (1),(8) | | 03/15/03 | | 6.62 | % | 108,488 | | 108,488 | | | |
| | South Park Mall (LA) | | (7) | | 06/15/03 | | 7.25 | % | 23,350 | | 23,350 | | | |
| | Century III Mall | | | | 07/01/03 | | 6.78 | % | 66,000 | | 66,000 | | | |
| | | | | | | | |
| |
| | | |
| | | Subtotal 2003 | | | | | | | | 274,788 | | 274,788 | | 6.72 | % |
| |
Battlefield Mall—1 |
|
|
|
01/01/04 |
|
7.50 |
% |
44,335 |
|
44,335 |
|
|
|
| | Battlefield Mall—2 | | | | 01/01/04 | | 6.81 | % | 43,229 | | 43,229 | | | |
| | Forum Phase I—Class A-2 | | | | 05/15/04 | | 6.19 | % | 44,386 | | 26,632 | | | |
| | Forum Phase II—Class A-2 | | | | 05/15/04 | | 6.19 | % | 40,614 | | 22,338 | | | |
| | Forum Phase I—Class A-1 | | | | 05/15/04 | | 7.13 | % | 46,996 | | 28,198 | | | |
| | Forum Phase II—Class A-1 | | | | 05/15/04 | | 7.13 | % | 43,004 | | 23,652 | | | |
| | CMBS Loan—Fixed (encumbers 7 Properties) | | (10) | | 12/15/04 | | 7.31 | % | 174,359 | | 174,359 | | | |
| | CMBS Loan—Variable (encumbers 7 Properties) | | (4),(10) | | 12/15/04 | | 6.20 | % | 49,565 | | 49,565 | | | |
| | | | | | | | |
| |
| | | |
| | | Subtotal 2004 | | | | | | | | 486,488 | | 412,307 | | 6.99 | % |
| |
Tippecanoe Mall—1 |
|
|
|
01/01/05 |
|
8.45 |
% |
43,256 |
|
43,256 |
|
|
|
| | Tippecanoe Mall—2 | | | | 01/01/05 | | 6.81 | % | 15,373 | | 15,373 | | | |
| | Melbourne Square | | | | 02/01/05 | | 7.42 | % | 37,527 | | 37,527 | | | |
| | Cielo Vista Mall—2 | | | | 11/01/05 | | 8.13 | % | 1,116 | | 1,116 | | | |
| | | | | | | | |
| |
| | | |
| | | Subtotal 2005 | | | | | | | | 97,272 | | 97,272 | | 7.79 | % |
| |
Treasure Coast Square—1 |
|
|
|
01/01/06 |
|
7.42 |
% |
50,254 |
|
50,254 |
|
|
|
| | Treasure Coast Square—2 | | | | 01/01/06 | | 8.06 | % | 11,736 | | 11,736 | | | |
| | Gulf View Square | | | | 10/01/06 | | 8.25 | % | 35,421 | | 35,421 | | | |
| | Paddock Mall | | | | 10/01/06 | | 8.25 | % | 28,171 | | 28,171 | | | |
| | | | | | | | |
| |
| | | |
| | | Subtotal 2006 | | | | | | | | 125,582 | | 125,582 | | 7.90 | % |
| | Cielo Vista Mall—1 | | (3) | | 05/01/07 | | 9.38 | % | 52,488 | | 52,488 | | | |
| | Cielo Vista Mall—3 | | (3) | | 05/01/07 | | 6.76 | % | 37,415 | | 37,415 | | | |
| | Lakeline Mall | | | | 05/01/07 | | 7.65 | % | 70,042 | | 70,042 | | | |
| | McCain Mall—1 | | (3) | | 05/01/07 | | 9.38 | % | 24,509 | | 24,509 | | | |
| | McCain Mall—2 | | (3) | | 05/01/07 | | 6.76 | % | 17,270 | | 17,270 | | | |
| | Valle Vista Mall—1 | | (3) | | 05/01/07 | | 9.38 | % | 32,461 | | 32,461 | | | |
| | Valle Vista Mall—2 | | (3) | | 05/01/07 | | 6.81 | % | 7,678 | | 7,678 | | | |
| | Wolfchase Galleria | | | | 06/01/07 | | 7.80 | % | 75,996 | | 71,813 | | | |
| | University Park Mall | | | | 10/01/07 | | 7.43 | % | 59,500 | | 35,700 | | | |
| | | | | | | | |
| |
| | | |
| | | Subtotal 2007 | | | | | | | | 377,359 | | 349,376 | | 8.04 | % |
Arsenal Mall—1 |
|
|
|
09/28/08 |
|
6.75 |
% |
33,639 |
|
33,639 |
|
|
|
| | | | | | | | |
| |
| | | |
| | | Subtotal 2008 | | | | | | | | 33,639 | | 33,639 | | 6.75 | % |
College Mall—1 |
|
(2) |
|
01/01/09 |
|
7.00 |
% |
38,884 |
|
38,884 |
|
|
|
| College Mall—2 | | (2) | | 01/01/09 | | 6.76 | % | 11,526 | | 11,526 | | | |
32
| |
Greenwood Park Mall—1 |
|
(2) |
|
01/01/09 |
|
7.00 |
% |
32,567 |
|
32,567 |
|
|
|
| | Greenwood Park Mall—2 | | (2) | | 01/01/09 | | 6.76 | % | 59,551 | | 59,551 | | | |
| | Towne East Square—1 | | (2) | | 01/01/09 | | 7.00 | % | 51,407 | | 51,407 | | | |
| | Towne East Square—2 | | (2) | | 01/01/09 | | 6.81 | % | 24,020 | | 24,020 | | | |
| | Penn Square Mall | | | | 03/01/09 | | 7.03 | % | 72,622 | | 68,625 | | | |
| | Bloomingdale Court | | (11) | | 10/01/09 | | 7.78 | % | 29,183 | | 29,183 | | | |
| | Forest Plaza | | (11) | | 10/01/09 | | 7.78 | % | 16,006 | | 16,006 | | | |
| | Lake View Plaza | | (11) | | 10/01/09 | | 7.78 | % | 21,276 | | 21,276 | | | |
| | Lakeline Plaza | | (11) | | 10/01/09 | | 7.78 | % | 23,327 | | 23,327 | | | |
| | Lincoln Crossing | | (11) | | 10/01/09 | | 7.78 | % | 3,222 | | 3,222 | | | |
| | Matteson Plaza | | (11) | | 10/01/09 | | 7.78 | % | 9,370 | | 9,370 | | | |
| | Muncie Plaza | | (11) | | 10/01/09 | | 7.78 | % | 8,100 | | 8,100 | | | |
| | Regency Plaza | | (11) | | 10/01/09 | | 7.78 | % | 4,391 | | 4,391 | | | |
| | St. Charles Towne Plaza | | (11) | | 10/01/09 | | 7.78 | % | 28,109 | | 28,109 | | | |
| | West Ridge Plaza | | (11) | | 10/01/09 | | 7.78 | % | 5,661 | | 5,661 | | | |
| | White Oaks Plaza | | (11) | | 10/01/09 | | 7.78 | % | 17,276 | | 17,276 | | | |
| | | | | | | | |
| |
| | | |
| | | Subtotal 2009 | | | | | | | | 456,498 | | 452,501 | | 7.24 | % |
| |
Trolley Square |
|
|
|
08/01/10 |
|
9.03 |
% |
29,420 |
|
26,478 |
|
|
|
| | Coral Square | | | | 10/01/10 | | 8.00 | % | 90,000 | | 87,498 | | | |
| | Crystal River | | | | 11/11/10 | | 7.63 | % | 16,088 | | 16,088 | | | |
| | Biltmore Square | | | | 12/11/10 | | 7.95 | % | 26,000 | | 17,342 | | | |
| | Port Charlotte Town Center | | | | 12/11/10 | | 7.98 | % | 53,250 | | 42,600 | | | |
| | | | | | | | |
| |
| | | |
| | | Subtotal 2010 | | | | | | | | 214,758 | | 190,006 | | 8.10 | % |
| |
Ingram Park Mall |
|
(9) |
|
08/11/11 |
|
6.99 |
% |
83,668 |
|
83,668 |
|
|
|
| | Knoxville Center | | (9) | | 08/11/11 | | 6.99 | % | 63,358 | | 63,358 | | | |
| | Northlake Mall | | (9) | | 08/11/11 | | 6.99 | % | 73,091 | | 73,091 | | | |
| | Towne West Square | | (9) | | 08/11/11 | | 6.99 | % | 54,768 | | 54,768 | | | |
| | Tacoma Mall | | | | 09/28/11 | | 7.00 | % | 134,096 | | 134,096 | | | |
| | | | | | | | |
| |
| | | |
| | | Subtotal 2011 | | | | | | | | 408,981 | | 408,981 | | 6.99 | % |
| |
Chesapeake Center |
|
|
|
05/15/15 |
|
8.44 |
% |
6,563 |
|
6,563 |
|
|
|
| | Grove at Lakeland Square, The | | | | 05/15/15 | | 8.44 | % | 3,750 | | 3,750 | | | |
| | Terrace at Florida Mall, The | | | | 05/15/15 | | 8.44 | % | 4,688 | | 4,688 | | | |
| | | | | | | | |
| |
| | | |
| | | Subtotal 2015 | | | | | | | | 15,001 | | 15,001 | | 8.44 | % |
| |
Arsenal Mall—2 |
|
|
|
05/15/16 |
|
8.20 |
% |
1,991 |
|
1,991 |
|
|
|
| | | | | | | | |
| |
| | | |
| | | Subtotal 2016 | | | | | | | | 1,991 | | 1,991 | | 8.20 | % |
| |
Sunland Park Mall |
|
|
|
01/01/26 |
|
8.63 |
% |
38,017 |
|
38,017 |
|
|
|
| | | | | | | | |
| |
| | | |
| | | Subtotal 2026 | | | | | | | | 38,017 | | 38,017 | | 8.63 | % |
| |
Keystone at the Crossing |
|
|
|
07/01/27 |
|
7.85 |
% |
61,776 |
|
61,776 |
|
|
|
| | | | | | | | |
| |
| | | |
| | | Subtotal 2027 | | | | | | | | 61,776 | | 61,776 | | 7.85 | % |
| | | | | | | | |
| |
| |
| |
| | Total Consolidated Fixed Rate Mortgage Debt | | | | | | | | 2,662,849 | | 2,531,936 | | 7.39 | % |
| | | | | | | | |
| |
| |
| |
33
| Variable Rate Mortgage Debt: | | | | | | | | | | | | | |
| | Bowie Mall—1 | | (5) | | 12/14/02 | | 3.34 | % | 1,294 | | 1,294 | | | |
| | | | | | | | |
| |
| | | |
| | | Subtotal 2002 | | | | | | | | 1,294 | | 1,294 | | 3.34 | % |
| | Raleigh Springs Mall | | | | 02/23/03 | | 3.49 | % | 11,000 | | 11,000 | | | |
| | Richmond Towne Square | | (1) | | 07/15/03 | | 2.84 | % | 57,853 | | 57,853 | | | |
| | Shops @ Mission Viejo | | | | 08/31/03 | | 2.89 | % | 148,073 | | 148,073 | | | |
| | Arboretum | | (1) | | 11/30/03 | | 3.34 | % | 34,000 | | 34,000 | | | |
| | | | | | | | |
| |
| | | |
| | | Subtotal 2003 | | | | | | | | 250,926 | | 250,926 | | 2.96 | % |
| |
Jefferson Valley Mall |
|
(1) |
|
01/11/04 |
|
3.09 |
% |
60,000 |
|
60,000 |
|
|
|
| | North East Mall | | (1) | | 05/21/04 | | 3.21 | % | 140,000 | | 140,000 | | | |
| | Waterford Lakes | | | | 08/16/04 | | 3.24 | % | 67,736 | | 67,736 | | | |
| | | | | | | | |
| |
| | | |
| | | Subtotal 2004 | | | | | | | | 267,736 | | 267,736 | | 3.19 | % |
| |
Brunswick Square |
|
(1) |
|
06/12/05 |
|
3.34 |
% |
45,000 |
|
45,000 |
|
|
|
| | Bowie Mall—2 | | (1),(5) | | 12/14/05 | | 3.34 | % | 54,664 | | 54,664 | | | |
| | | | | | | | |
| |
| | | |
| | | Subtotal 2005 | | | | | | | | 99,664 | | 99,664 | | 3.34 | % |
| |
Chesapeake Square |
|
(1) |
|
07/01/06 |
|
4.59 |
% |
47,000 |
|
35,250 |
|
|
|
| | Riverway | | (1) | | 10/01/06 | | 2.99 | % | 110,000 | | 110,000 | | | |
| | | | | | | | |
| |
| | | |
| | | Subtotal 2006 | | | | | | | | 157,000 | | 145,250 | | 3.38 | % |
| |
White Oaks Mall |
|
(1) |
|
02/25/08 |
|
2.94 |
% |
48,563 |
|
44,844 |
|
|
|
| | | | | | | | |
| |
| | | |
| | | Subtotal 2008 | | | | | | | | 48,563 | | 44,844 | | 2.94 | % |
| | | | | | | | |
| |
| |
| |
| | Total Variable Rate Mortgage Debt | | | | | | | | 825,183 | | 809,714 | | 3.16 | % |
| | | | | | | | |
| |
| |
| |
| | Total Consolidated Mortgage Debt | | | | | | | | 3,488,032 | | 3,341,650 | | 6.36 | % |
| | | | | | | | |
| |
| |
| |
| Fixed Rate Unsecured Debt: | | | | | | | | | | | | | |
| | Retail Property Trust (Bonds) | | | | 04/01/03 | | 7.05 | % | 100,000 | | 100,000 | | | |
| | Simon Property Group, LP (Bonds) | | | | 06/15/03 | | 6.63 | % | 375,000 | | 375,000 | | | |
| | Simon Property Group, LP (PATS) | | | | 11/15/03 | | 6.75 | % | 100,000 | | 100,000 | | | |
| | | | | | | | |
| |
| | | |
| | | Subtotal 2003 | | | | | | | | 575,000 | | 575,000 | | 6.72 | % |
| | Shopping Center Associates (Bonds) | | | | 01/15/04 | | 6.75 | % | 150,000 | | 150,000 | | | |
| | Simon Property Group, LP (Bonds) | | | | 02/09/04 | | 6.75 | % | 300,000 | | 300,000 | | | |
| | Simon ERE Facility | | (1) | | 07/31/04 | | 7.75 | % | 28,200 | | 28,200 | | | |
| | Simon Property Group, LP (Bonds) | | | | 07/15/04 | | 6.75 | % | 100,000 | | 100,000 | | | |
| | Retail Property Trust (Bonds) | | | | 08/15/04 | | 7.75 | % | 150,000 | | 150,000 | | | |
| | | | | | | | |
| |
| | | |
| | | Subtotal 2004 | | | | | | | | 728,200 | | 728,200 | | 6.99 | % |
| | Shopping Center Associates (Bonds) | | | | 05/15/05 | | 7.63 | % | 110,000 | | 110,000 | | | |
| | Simon Property Group, LP (Bonds) | | | | 06/15/05 | | 6.75 | % | 300,000 | | 300,000 | | | |
| | Simon Property Group, LP (Medium Term Notes) | | | | 06/24/05 | | 7.13 | % | 100,000 | | 100,000 | | | |
| | Simon Property Group, LP (Bonds) | | | | 10/27/05 | | 6.88 | % | 150,000 | | 150,000 | | | |
| | | | | | | | |
| |
| | | |
| | | Subtotal 2005 | | | | | | | | 660,000 | | 660,000 | | 6.98 | % |
34
| |
Simon Property Group, LP (Bonds) |
|
|
|
01/20/06 |
|
7.38 |
% |
300,000 |
|
300,000 |
|
|
|
| | Simon Property Group, LP (Bonds) | | | | 11/15/06 | | 6.88 | % | 250,000 | | 250,000 | | | |
| | | | | | | | |
| |
| | | |
| | | Subtotal 2006 | | | | | | | | 550,000 | | 550,000 | | 7.15 | % |
| | Simon Property Group, LP (Medium Term Notes) | | | | 09/20/07 | | 7.13 | % | 180,000 | | 180,000 | | | |
| | Simon Property Group, LP (Bonds) | | | | 11/15/07 | | 6.38 | % | 750,000 | | 750,000 | | | |
| | | | | | | | |
| |
| | | |
| | | Subtotal 2007 | | | | | | | | 930,000 | | 930,000 | | 6.52 | % |
| | Simon Property Group, LP (MOPPRS) | | | | 06/15/08 | | 7.00 | % | 200,000 | | 200,000 | | | |
| | | | | | | | |
| |
| | | |
| | | Subtotal 2008 | | | | | | | | 200,000 | | 200,000 | | 7.00 | % |
| | Simon Property Group, LP (Bonds) | | | | 02/09/09 | | 7.13 | % | 300,000 | | 300,000 | | | |
| | Simon Property Group, LP (Bonds) | | | | 07/15/09 | | 7.00 | % | 150,000 | | 150,000 | | | |
| | | | | | | | |
| |
| | | |
| | | Subtotal 2009 | | | | | | | | 450,000 | | 450,000 | | 7.08 | % |
| | Simon Property Group, LP (Bonds) | | | | 01/20/11 | | 7.75 | % | 200,000 | | 200,000 | | | |
| | | | | | | | |
| |
| | | |
| | | Subtotal 2011 | | | | | | | | 200,000 | | 200,000 | | 7.75 | % |
| | Retail Property Trust (Bonds) | | | | 09/01/13 | | 7.18 | % | 75,000 | | 75,000 | | | |
| | | | | | | | |
| |
| | | |
| | | Subtotal 2013 | | | | | | | | 75,000 | | 75,000 | | 7.18 | % |
| | Retail Property Trust (Bonds) | | | | 03/15/16 | | 7.88 | % | 250,000 | | 250,000 | | | |
| | | | | | | | |
| |
| | | |
| | | Subtotal 2016 | | | | | | | | 250,000 | | 250,000 | | 7.88 | % |
| | Simon Property Group, LP (Bonds) | | | | 06/15/18 | | 7.38 | % | 200,000 | | 200,000 | | | |
| | | | | | | | |
| |
| | | |
| | | Subtotal 2018 | | | | | | | | 200,000 | | 200,000 | | 7.38 | % |
| | | | | | | | |
| |
| | | |
| | Total Unsecured Fixed Rate Debt | | | | | | | | 4,818,200 | | 4,818,200 | | 6.99 | % |
| | | | | | | | |
| |
| | | |
| Variable Rate Unsecured Debt: | | | | | | | | | | | | | |
| | Unsecured Bridge Facility | | | | 04/29/03 | | 2.49 | % | 425,000 | | 425,000 | | | |
| | | | | | | | |
| |
| | | |
| | | Subtotal 2003 | | | | | | | | 425,000 | | 425,000 | | 2.49 | % |
| | Simon Property Group, LP (Term Loan) | | (1) | | 02/28/04 | | 2.49 | % | 150,000 | | 150,000 | | | |
| | Simon Property Group, LP (Term Loan) | | (1) | | 03/15/04 | | 2.64 | % | 65,000 | | 65,000 | | | |
| | Simon ERE Facility | | (1) | | 07/31/04 | | 2.44 | % | 26,335 | | 26,335 | | | |
| | | | | | | | |
| |
| | | |
| | | Subtotal 2004 | | | | | | | | 241,335 | | 241,335 | | 2.52 | % |
| | Corporate Revolving Credit Facility | | (1) | | 04/16/06 | | 2.49 | % | 623,000 | | 623,000 | | | |
| | | | | | | | |
| |
| | | |
| | | Subtotal 2006 | | | | | | | | 623,000 | | 623,000 | | 2.49 | % |
| | | | | | | | |
| |
| | | |
| | Total Unsecured Variable Rate Debt | | | | | | | | 1,289,335 | | 1,289,335 | | 2.50 | % |
| | | | | | | | |
| |
| | | |
| | Total Unsecured Debt | | | | | | | | 6,107,535 | | 6,107,535 | | 6.04 | % |
| | | | | | | | |
| |
| | | |
| | Net Discount on Fixed-Rate Indebtedness | | | | | | | | (671 | ) | (1,299 | ) | N/A | |
| | Fair Value Interest Rate Swaps | | | | | | | | 2,168 | | 2,168 | | N/A | |
| | Total Consolidated Debt | | | | | | | | 9,597,064 | | 9,450,054 | | 6.15 | % |
35
Joint Venture Indebtedness |
|
|
|
|
|
|
|
|
|
|
|
|
|
| Fixed Rate Mortgage Debt: | | | | | | | | | | | | | |
| | Crystal Mall | | | | 02/01/03 | | 8.66 | % | 46,118 | | 34,390 | | | |
| | Avenues, The | | | | 05/15/03 | | 8.36 | % | 54,746 | | 13,687 | | | |
| | Miami International Mall | | | | 12/21/03 | | 6.91 | % | 44,329 | | 21,179 | | | |
| | | | | | | | |
| |
| | | |
| | | Subtotal 2003 | | | | | | | | 145,193 | | 69,255 | | 8.07 | % |
| | Solomon Pond | | | | 02/01/04 | | 7.83 | % | 93,423 | | 45,906 | | | |
| | Northshore Mall | | | | 05/14/04 | | 9.05 | % | 161,000 | | 79,111 | | | |
| | Indian River Commons | | | | 11/01/04 | | 7.58 | % | 8,268 | | 4,134 | | | |
| | Indian River Mall | | | | 11/01/04 | | 7.58 | % | 45,879 | | 22,940 | | | |
| | | | | | | | |
| |
| | | |
| | | Subtotal 2004 | | | | | | | | 308,570 | | 152,091 | | 8.42 | % |
| | Westchester, The—1 | | | | 09/01/05 | | 8.74 | % | 147,276 | | 58,910 | | | |
| | Westchester, The—2 | | | | 09/01/05 | | 7.20 | % | 52,190 | | 20,876 | | | |
| | Houston Galleria | | | | 12/01/05 | | 7.93 | % | 240,545 | | 75,736 | | | |
| | | | | | | | |
| |
| | | |
| | | Subtotal 2005 | | | | | | | | 440,011 | | 155,522 | | 8.14 | % |
| | Cobblestone Court | | | | 01/01/06 | | 7.64 | % | 6,179 | | 2,163 | | | |
| | Crystal Court | | | | 01/01/06 | | 7.64 | % | 3,569 | | 1,249 | | | |
| | Fairfax Court | | | | 01/01/06 | | 7.64 | % | 10,319 | | 2,709 | | | |
| | Gaitway Plaza | | | | 01/01/06 | | 7.64 | % | 7,349 | | 1,715 | | | |
| | Plaza at Buckland Hills, The | | | | 01/01/06 | | 7.64 | % | 17,679 | | 6,055 | | | |
| | Ridgewood Court | | | | 01/01/06 | | 7.64 | % | 7,979 | | 2,793 | | | |
| | Royal Eagle Plaza | | | | 01/01/06 | | 7.64 | % | 7,920 | | 2,772 | | | |
| | Village Park Plaza | | | | 01/01/06 | | 7.64 | % | 8,959 | | 3,136 | | | |
| | West Town Corners | | | | 01/01/06 | | 7.64 | % | 10,329 | | 2,411 | | | |
| | Westland Park Plaza | | | | 01/01/06 | | 7.64 | % | 4,950 | | 1,155 | | | |
| | Willow Knolls Court | | | | 01/01/06 | | 7.64 | % | 6,489 | | 2,271 | | | |
| | Yards Plaza, The | | | | 01/01/06 | | 7.64 | % | 8,270 | | 2,895 | | | |
| | CMBS Loan—1 Fixed (encumbers 13 Properties) | | (6) | | 05/15/06 | | 7.41 | % | 300,000 | | 150,000 | | | |
| | CMBS Loan—2 Fixed (encumbers 13 Properties) | | (6) | | 05/15/06 | | 8.13 | % | 57,100 | | 28,550 | | | |
| | Great Northeast Plaza | | | | 06/01/06 | | 9.04 | % | 17,073 | | 8,537 | | | |
| | Smith Haven Mall | | | | 06/01/06 | | 7.86 | % | 115,000 | | 28,750 | | | |
| | Mall of Georgia Crossing | | | | 06/09/06 | | 7.25 | % | 33,952 | | 16,976 | | | |
| | Greendale Mall | | | | 11/01/06 | | 8.23 | % | 41,246 | | 20,267 | | | |
| | | | | | | | |
| |
| | | |
| | | Subtotal 2006 | | | | | | | | 664,362 | | 284,402 | | 7.65 | % |
| | River Ridge Mall | | | | 01/01/07 | | 8.05 | % | 23,199 | | 2,660 | | | |
| | Town Center at Cobb—1 | | | | 04/01/07 | | 7.54 | % | 48,730 | | 24,365 | | | |
| | Town Center at Cobb—2 | | | | 04/01/07 | | 7.25 | % | 63,909 | | 31,955 | | | |
| | Gwinnett Place—1 | | | | 04/01/07 | | 7.54 | % | 38,248 | | 19,124 | | | |
| | Gwinnett Place—2 | | | | 04/01/07 | | 7.25 | % | 83,978 | | 41,989 | | | |
| | Copely Place | | | | 08/01/07 | | 7.44 | % | 184,816 | | 58,179 | | | |
| | Mall at Rockingham | | | | 08/01/07 | | 7.88 | % | 98,432 | | 24,184 | | | |
| | | | | | | | |
| |
| | | |
| | | Subtotal 2007 | | | | | | | | 541,312 | | 202,456 | | 7.45 | % |
| | Metrocenter | | | | 02/28/08 | | 8.45 | % | 29,618 | | 14,809 | | | |
| | Aventura Mall—A | | | | 04/06/08 | | 6.55 | % | 141,000 | | 47,000 | | | |
| | Aventura Mall—B | | | | 04/06/08 | | 6.60 | % | 25,400 | | 8,467 | | | |
| | Aventura Mall—C | | | | 04/06/08 | | 6.89 | % | 33,600 | | 11,200 | | | |
| | West Town Mall | | | | 05/01/08 | | 6.90 | % | 76,000 | | 38,000 | | | |
| | Mall of New Hampshire—1 | | | | 10/01/08 | | 6.96 | % | 102,265 | | 50,250 | | | |
36
| |
Mall of New Hampshire—2 |
|
|
|
10/01/08 |
|
8.53 |
% |
8,336 |
|
4,096 |
|
|
|
| | Fashion Valley Mall—1 | | | | 10/11/08 | | 6.49 | % | 169,513 | | 84,757 | | | |
| | Fashion Valley Mall—2 | | | | 10/11/08 | | 6.58 | % | 29,124 | | 14,562 | | | |
| | Source, The | | | | 11/06/08 | | 6.65 | % | 124,000 | | 31,000 | | | |
| | | | | | | | |
| |
| | | |
| | | Subtotal 2008 | | | | | | | | 738,856 | | 304,141 | | 6.79 | % |
| | Woodland Hills Mall | | | | 01/01/09 | | 7.00 | % | 86,923 | | 41,069 | | | |
| | Apple Blossom Mall | | | | 09/10/09 | | 7.99 | % | 40,128 | | 19,718 | | | |
| | Auburn Mall | | | | 09/10/09 | | 7.99 | % | 46,978 | | 23,084 | | | |
| | | | | | | | |
| |
| | | |
| | | Subtotal 2009 | | | | | | | | 174,029 | | 83,871 | | 7.51 | % |
| | Mall at Chestnut Hill | | | | 01/01/10 | | 8.45 | % | 14,924 | | 7,047 | | | |
| | Mall of Georgia | | | | 07/01/10 | | 7.09 | % | 200,000 | | 100,000 | | | |
| | Florida Mall, The | | | | 11/13/10 | | 7.55 | % | 266,648 | | 133,324 | | | |
| | | | | | | | |
| |
| | | |
| | | Subtotal 2010 | | | | | | | | 481,572 | | 240,371 | | 7.39 | % |
| | Atrium at Chestnut Hill | | | | 03/11/11 | | 6.89 | % | 48,576 | | 23,869 | | | |
| | Cape Cod Mall | | | | 03/11/11 | | 6.80 | % | 98,806 | | 48,551 | | | |
| | European Assets—Fixed Components | | | | 04/01/11 | | 6.52 | % | 55,236 | | 17,825 | | | |
| | Highland Mall | | | | 06/30/11 | | 6.83 | % | 70,438 | | 35,219 | | | |
| | Fashion Centre Pentagon Retail | | | | 09/11/11 | | 6.63 | % | 165,737 | | 70,438 | | | |
| | | | | | | | |
| |
| | | |
| | | Subtotal 2011 | | | | | | | | 438,793 | | 195,902 | | 6.73 | % |
| | Dadeland Mall | | | | 01/31/12 | | 6.75 | % | 199,304 | | 99,652 | | | |
| | Square One | | | | 03/11/12 | | 6.73 | % | 94,788 | | 46,576 | | | |
| | | | | | | | |
| |
| | | |
| | | Subtotal 2012 | | | | | | | | 294,092 | | 146,228 | | 6.74 | % |
| | | | | | | | |
| |
| |
| |
| | Total Joint Venture Fixed Rate Mortgage Debt | | | | | | | | 4,226,790 | | 1,834,238 | | 7.39 | % |
| | | | | | | | |
| |
| |
| |
| Variable Rate Mortgage Debt: | | | | | | | | | | | | | |
| | Montreal Forum | | | | 07/31/02 | | 6.00 | % | 36,145 | | 12,877 | | | |
| | Shops at Sunset Place, The | | | | 08/14/02 | | 2.99 | % | 113,829 | | 42,686 | | | |
| | | | | | | | |
| |
| | | |
| | | Subtotal 2002 | | | | | | | | 149,974 | | 55,563 | | 3.69 | % |
| | CMBS Loan—1 Floating (encumbers 13 Properties) | | (6) | | 05/15/03 | | 2.34 | % | 184,500 | | 92,250 | | | |
| | Liberty Tree Mall | | (1) | | 10/01/03 | | 3.34 | % | 45,610 | | 22,412 | | | |
| | | | | | | | |
| |
| | | |
| | | Subtotal 2003 | | | | | | | | 230,110 | | 114,662 | | 2.53 | % |
| | Circle Centre Mall—1 | | (1) | | 01/31/04 | | 2.28 | % | 60,000 | | 8,802 | | | |
| | Circle Centre Mall—2 | | (1) | | 01/31/04 | | 3.34 | % | 7,500 | | 1,100 | | | |
| | Fashion Centre Pentagon Office | | (1) | | 09/10/04 | | 3.34 | % | 33,000 | | 14,025 | | | |
| | | | | | | | |
| |
| | | |
| | | Subtotal 2004 | | | | | | | | 100,500 | | 23,927 | | 2.95 | % |
| | Mall of America | | (1) | | 03/10/05 | | 2.37 | % | 312,000 | | 85,800 | | | |
| | Emerald Square Mall—1 | | (1) | | 04/01/05 | | 3.14 | % | 129,400 | | 63,584 | | | |
| | Emerald Square Mall—2 | | (1) | | 04/01/05 | | 4.89 | % | 15,600 | | 7,665 | | | |
| | Northfield Square | | (1) | | 04/30/05 | | 4.34 | % | 37,000 | | 11,692 | | | |
| | Seminole Towne Center | | (1) | | 07/01/05 | | 4.34 | % | 70,500 | | 31,725 | | | |
| | | | | | | | |
| |
| | | |
| | | Subtotal 2005 | | | | | | | | 564,500 | | 200,466 | | 3.14 | % |
| | CMBS Loan—2 Floating (encumbers 13 Properties) | | (6) | | 05/15/06 | | 2.21 | % | 81,400 | | 40,700 | | | |
| | | | | | | | |
| |
| | | |
| | | Subtotal 2006 | | | | | | | | 81,400 | | 40,700 | | 2.21 | % |
37
| |
European Assets—Variable Components |
|
|
|
03/28/10 |
|
5.48 |
% |
49,627 |
|
16,015 |
|
|
|
| | | | | | | | |
| |
| | | |
| | | Subtotal 2010 | | | | | | | | 49,627 | | 16,015 | | 5.48 | % |
| | | | | | | | |
| |
| | | |
| | Total Joint Venture Variable Rate Mortgage Debt | | | | | | | | 1,176,111 | | 451,332 | | 3.04 | % |
| | | | | | | | |
| |
| | | |
| Unsecured Debt: | | | | | | | | | | | | | |
| | Mayflower Realty Credit Facility | | (1) | | 07/12/05 | | 4.34 | % | 6,500 | | 3,194 | | | |
| | | | | | | | |
| |
| | | |
| | | Subtotal 2003 | | | | | | | | 6,500 | | 3,194 | | 4.34 | % |
| | | | | | | | |
| |
| |
| |
| | Total Unsecured Debt | | | | | | | | 6,500 | | 3,194 | | 4.34 | % |
| | | | | | | | |
| |
| |
| |
| | Net Premium on JV Fixed-Rate Indebtedness | | | | | | | | 10,437 | | 5,233 | | | |
| | Total Joint Venture Debt | | | | | | | | 5,419,838 | | 2,293,998 | | 6.53 | % |
| | | | | | | | |
| |
| |
| |
| | SPG's Share of Total Indebtedness | | | | | | | | | | 11,744,051 | | 6.23 | % |
| | | | | | | | | | |
| |
| |
Footnotes:
- (1)
- Includes applicable extensions available at Simon Group's option.
- (2)
- This Pool is secured by cross-collateralized and cross-defaulted mortgages encumbering these three Properties.
- (3)
- This Pool is secured by cross-collateralized and cross-defaulted mortgages encumbering these three Properties.
- (4)
- Through an interest rate protection agreement, effectively fixed at an all-in rate of 6.2%.
- (5)
- These Notes are cross-collateralized.
- (6)
- These Commercial Mortgage Notes are secured by cross-collateralized mortgages encumbering thirteen of the Properties (Eastland Mall, Southern Hills Mall, Lindale Mall, Southridge Mall, Granite Run Mall, Lake Square Mall, Northpark Mall, Southpark Mall, Valley Mall, Mesa Mall, Empire Mall, Empire East Mall and Rushmore Mall. A weighted average rate is used.
- (7)
- This Principal Mutual Pool 1 loan is secured by cross-collateralized and cross-defaulted mortgages encumbering four of the Properties (Anderson, Forest Village Park, Longview, and South Park). A weighted average rate is used for these Pool 1 Properties.
- (8)
- This property is a component of Pool 2 with Principal Mutual. The loan is secured by cross-collateralized and cross-defaulted mortgages encumbering six of the Properties (Eastland, Hutchinson, Markland, Midland, North Towne Square and Forest Mall).
- (9)
- These four notes are cross-collateralized.
- (10)
- These notes are secured by cross-collateralized and cross-defaulted mortgages encumbering seven of the Properties (West Ridge Mall, Bay Park Square, Boardman Plaza, Cheltenham Square, DeSoto Square, Upper Valley Mall and Washington Square.
- (11)
- These notes are cross-collateralized.
38
SIMON PROPERTY GROUP
Unencumbered Assets
As of June 30, 2002
Property Name
| | City
| | State
|
|---|
| Regional Malls: | | | | |
University Mall |
|
Little Rock |
|
AR |
Southgate Mall |
|
Yuma |
|
AZ |
Brea Mall |
|
Brea |
|
CA |
| Laguna Hills Mall | | Laguna Hills | | CA |
| Santa Rosa Plaza | | Santa Rosa | | CA |
| Westminster Mall | | Westminster | | CA |
Aurora Mall |
|
Aurora |
|
CO |
Boynton Beach Mall |
|
Boynton Beach |
|
FL |
| Cordova Mall | | Pensacola | | FL |
| Edison Mall | | Fort Meyers | | FL |
| Orange Park Mall | | Orange Park | | FL |
| Town Center at Boca Raton | | Boca Raton | | FL |
| Tyrone Square | | St. Petersburg | | FL |
| University Mall | | Pensacola | | FL |
Lenox Square |
|
Atlanta |
|
GA |
| Phipps Plaza | | Atlanta | | GA |
Alton Square |
|
Alton |
|
IL |
| Lincolnwood Town Center | | Lincolnwood | | IL |
| Machesney Park Mall | | Rockford | | IL |
| Northwoods Shopping Center | | Peoria | | IL |
| Orland Square | | Orland Park | | IL |
| River Oaks Center | | Calumet City | | IL |
Castleton Square Mall |
|
Indianapolis |
|
IN |
| Lafayette Square | | Indianapolis | | IN |
| Mounds Mall | | Anderson | | IN |
| Muncie Mall | | Muncie | | IN |
| Richmond Square | | Richmond | | IN |
Prien Lake Mall |
|
Lake Charles |
|
LA |
Burlington Mall |
|
Burlington |
|
MA |
| South Shore Plaza | | Braintree (Boston) | | MA |
St. Charles Towne Center |
|
Waldorf |
|
MD |
Maplewood Mall |
|
Minneapolis |
|
MN |
| Miller Hill Mall | | Duluth | | MN |
Independence Center |
|
Independence |
|
MO |
SouthPark Mall |
|
Charlotte |
|
NC |
Crossroads Mall |
|
Omaha |
|
NE |
39
Pheasant Lane |
|
Nashua |
|
NH |
Bergen Mall |
|
Paramus (NYC) |
|
NJ |
| Livingston Mall | | Livingston (NYC) | | NJ |
| Menlo Park Mall | | Edison (NYC) | | NJ |
| Ocean County Mall | | Toms River | | NJ |
| Rockaway Townsquare | | Rockaway (NYC) | | NJ |
Cottonwood Mall |
|
Albuquerque |
|
NM |
Chautauqua Mall |
|
Lakewood |
|
NY |
| Eastern Hills Mall | | Williamsville | | NY |
| Nanuet Mall | | Nanuet (NYC) | | NY |
| Roosevelt Field | | Garden City (NYC) | | NY |
| Walt Whitman Mall | | Huntington Station | | NY |
Great Lakes Mall |
|
Mentor |
|
OH |
| Lima Mall | | Lima | | OH |
| Southern Park Mall | | Boardman | | OH |
| Summit Mall | | Akron | | OH |
| Woodville Mall | | Northwood | | OH |
Heritage Park Mall |
|
Midwest City |
|
OK |
Ross Park Mall |
|
Pittsburgh |
|
PA |
| South Hills Village | | Pittsburgh | | PA |
Haywood Mall |
|
Greenville |
|
SC |
Oak Court Mall |
|
Memphis |
|
TN |
Amigoland Mall |
|
Brownsville |
|
TX |
| Barton Creek Square | | Austin | | TX |
| Broadway Square | | Tyler | | TX |
| Irving Mall | | Irving | | TX |
| La Plaza Mall | | McAllen | | TX |
| Richardson Square Mall | | Richardson | | TX |
| Rolling Oaks Mall | | San Antonio | | TX |
Charlottesville Fashion Square |
|
Charlottesville |
|
VA |
| Virginia Center Commons | | Glen Allen | | VA |
Columbia Center |
|
Kennewick |
|
WA |
| Northgate Mall | | Seattle | | WA |
Memorial Mall |
|
Sheboygan |
|
WI |
Community Centers: |
|
|
|
|
Highland Lakes Center |
|
Orlando |
|
FL |
Bridgeview Court |
|
Bridgeview |
|
IL |
| Countryside Plaza | | Countryside | | IL |
| Fox River Plaza | | Elgin | | IL |
| Lake Plaza | | Waukegan | | IL |
| North Ridge Plaza | | Joliet | | IL |
Brightwood Plaza |
|
Indianapolis |
|
IN |
40
| Greenwood Plus | | Greenwood | | IN |
| Griffith Park Plaza | | Griffith | | IN |
| Markland Plaza | | Kokomo | | IN |
| Mounds Mall Cinema | | Anderson | | IN |
| New Castle Plaza | | New Castle | | IN |
| Northwood Plaza | | Fort Wayne | | IN |
| Teal Plaza | | Lafayette | | IN |
| Tippecanoe Plaza | | Lafayette | | IN |
| University Center | | Mishawaka | | IN |
| Wabash Village | | West Lafayette | | IN |
| Washington Plaza | | Indianapolis | | IN |
Wichita |
|
Wichita |
|
KS |
Park Plaza |
|
Hopkinsville |
|
KY |
Glen Burnie |
|
Glen Burnie |
|
MD |
Rockaway Convenience Center |
|
Rockaway (NYC) |
|
NJ |
Great Lakes Plaza |
|
Mentor |
|
OH |
| Lima Center | | Lima | | OH |
| Northland Plaza | | Columbus | | OH |
Eastland Plaza |
|
Tulsa |
|
OK |
Charles Towne Square |
|
Charleston |
|
SC |
Knoxville Commons |
|
Knoxville |
|
TN |
Celina Plaza |
|
El Paso |
|
TX |
| Ingram Plaza | | San Antonio | | TX |
| Mainland Crossing | | Texas City | | TX |
Martinsville Plaza |
|
Martinsville |
|
VA |
Memorial Plaza |
|
Sheboygan |
|
WI |
Mixed-Used: |
|
|
|
|
| New Orleans Centre | | New Orleans | | LA |
Office: |
|
|
|
|
| O'Hare International Center | | Rosemont | | IL |
41
SIMON PROPERTY GROUP
Preferred Stock/Units Outstanding
As of June 30, 2002
Issuer
| | Description
| | Number of
Shares/Units
| | Per Share
Liquidation
Preference
| | Aggregate
Liquidation
Preference
(in 000's)
| | Ticker
Symbol
|
|---|
| Preferred Shares: | | | | | | | | | | | | |
| Convertible | | | | | | | | | | | | |
| Simon Property Group, Inc. | | Series A Preferred
6.5% Convertible(1) | | 18 | | $ | 1,000 | | $ | 18 | | N/A |
| Simon Property Group, Inc. | | Series B Preferred
6.5% Convertible(2) | | 4,830,057 | | $ | 100 | | $ | 483,006 | | SPGPrB |
Perpetual |
|
|
|
|
|
|
|
|
|
|
|
|
| Simon Property Group, Inc. | | Series E Preferred 8%
Cumulative Redeemable(3) | | 1,000,000 | | $ | 25 | | $ | 25,000 | | N/A |
| Simon Property Group, Inc. | | Series F Preferred
83/4% Perpetual(4) | | 8,000,000 | | $ | 25 | | $ | 200,000 | | SPGPrF |
| Simon Property Group, Inc. | | Series G Preferred
7.89% Perpetual(5) | | 3,000,000 | | $ | 50 | | $ | 150,000 | | SPGPrG |
| Preferred Units: | | | | | | | | | | | | |
| Simon Property Group, L.P. | | Series C 7%
Cumulative Convertible Preferred(6) | | 2,600,895 | | $ | 28 | | $ | 72,825 | | N/A |
| Simon Property Group, L.P. | | Series D 8%
Cumulative Redeemable Preferred(7) | | 2,600,895 | | $ | 30 | | $ | 78,027 | | N/A |
- (1)
- Assumed in connection with the CPI merger. Each share is convertible into a number of shares of common stock obtained by dividing $1,000 by $26.319 (conversion price), which is subject to adjustment as outlined below. The stock is not redeemable, except as needed to maintain or bring the direct or indirect ownership of the capital stock of the Company into conformity with the requirements of Section 856(a)(6) of the Code.
- (2)
- Issued as part of the consideration for the CPI merger. Each share is convertible into a number of shares of common stock of the Company obtained by dividing $100 by $38.669 (the conversion price), which is subject to adjustment as outlined below. The Company may redeem the stock on or after September 24, 2003 at a price beginning at 105% of the liquidation preference plus accrued dividends and declining to 100% of the liquidation preference plus accrued dividends any time on or after September 24, 2008. The shares are traded on the New York Stock Exchange. The closing price on June 28, 2002, was $96.00 per share.(The conversion prices of the Series A and Series B Convertible Preferred Stock are subject to adjustment by the Company in connection with certain events.)
- (3)
- Issued in connection with the acquisition of Mall of America. Simon Property Group, Inc. Series E Preferred 8% Cumulative Redeemable Stock is not redeemable prior to August 27, 2004.
- (4)
- Represent securities issued to holders of substantially identical securities of SPG Properties, Inc., a former subsidiary of SPG which was merged into SPG effective July 1, 2001. The shares are redeemable on or after September 29, 2006. The shares are not convertible into any other securities of SPG. The shares are traded on the New York Stock Exchange. The closing price on June 28, 2002, was $26.21 per share.
- (5)
- Represent securities issued to holders of substantially identical securities of SPG Properties, Inc., a former subsidiary of SPG which was merged into SPG effective July 1, 2001. The Cumulative Step-Up Premium Rate Preferred Stock was issued at 7.89%. The shares are redeemable after September 30, 2007. Beginning October 1, 2012, the rate increases to 9.89%. The shares are not convertible into any other securities of SPG. The shares are traded on the New York Stock Exchange. The closing price on June 28, 2002 was $49.99 per share.
- (6)
- Issued in connection with the New England Development acquisition. Each unit/share is convertible into 0.75676 shares of common stock on or after August 27, 2004 if certain conditions are met. Each unit/share is not redeemable prior to August 27, 2009.
- (7)
- Issued in connection with the New England Development acquisition. Each unit/share is not redeemable prior to August 27, 2009.
42
QuickLinks
SIMON PROPERTY GROUP OverviewSIMON PROPERTY GROUP OverviewSIMON PROPERTY GROUP OverviewTotal Common Shares and Units Outstanding at June 30, 2002: 240,213,381(2)Fully Diluted Common Shares and Units Outstanding at June 30, 2002: 253,320,892SIMON PROPERTY GROUP Selected Financial Information As of June 30, 2002 Unaudited (In thousands, except as noted)SIMON PROPERTY GROUP Selected Financial Information As of June 30, 2002 Unaudited (In thousands, except as noted)Simon Property Group, Inc. and SPG Realty Consultants, Inc. Balance Sheets—Including Pro-Rata Share of Real Estate Joint Ventures As of June 30, 2002Simon Property Group, Inc. and SPG Realty Consultants, Inc. Statements of Operations—Including Pro-Rata Share of Real Estate Joint Ventures For Six Months Ended June 30, 2002SIMON PROPERTY GROUP Analysis of Consolidated Other Income and Other Expense As of June 30, 2002 (In thousands)SIMON PROPERTY GROUP EBITDA Composition and Asset Mix For the Six Months Ended June 30, 2002Geographic Diversification of Regional Mall Portfolio(1)Asset Mix of PortfolioSIMON PROPERTY GROUP Portfolio GLA, Occupancy & Rent Data As of June 30, 2002SIMON PROPERTY GROUP Rent Information As of June 30, 2002SIMON PROPERTY GROUP Property Listing (sorted by state) As of June 30, 2002SIMON PROPERTY GROUP Capital Expenditures For the Six Months Ended June 30, 2002 (In millions)SIMON PROPERTY GROUP Development Activity As of June 30, 2002SIMON PROPERTY GROUP Land Held for Future Development and Construction-in-Progress As of June 30, 2002 (In millions)SIMON PROPERTY GROUP SPG's Share of Total Debt Amortization and Maturities by Year As of June 30, 2002 (In thousands)SIMON PROPERTY GROUP Unencumbered Assets As of June 30, 2002