QuickLinks -- Click here to rapidly navigate through this document
Exhibit 99.1
SIMON PROPERTY GROUP
Overview
The Company
Simon Property Group, Inc. (the "Company") (NYSE:SPG) is a self-administered and self-managed real estate investment trust ("REIT"). Simon Property Group, L.P. (the "Operating Partnership") is a subsidiary partnership of the Company. The Company and the Operating Partnership (collectively the "Simon Group") are engaged primarily in the ownership, operation, management, leasing, acquisition, expansion and development of real estate properties, primarily regional malls and community shopping centers.
At December 31, 2003, the Company, directly or through the Operating Partnership, owned or had an interest in 246 properties which consisted of regional malls, community shopping centers and office and mixed-use properties (mixed-use properties include a combination of retail, office space or hotel components) containing an aggregate of 190 million square feet of gross leasable area (GLA) in 37 states and Canada, as well as ownership interests in other real estate assets in North America. The Company holds interests in 47 assets in Europe (in France, Italy, Poland and Portugal).
On January 1, 2003, the Operating Partnership acquired the remaining equity interests of M.S. Management Associates, Inc. ("MSM"). MSM provides management, leasing and other services for certain of the Company's properties. The interests acquired consist of 95% of the voting common stock of MSM and approximately 3% of the economic interests of MSM. MSM is now a wholly owned taxable REIT subsidiary of the Operating Partnership.
In November 2003, the Company announced that it had completed a series of transactions which increased its ownership interest in Kravco Investments, L.P. (now renamed Kravco Simon Investments, L.P.), a Philadelphia-based owner of six regional malls and its affiliated property management company. These transactions increased the Company's ownership in Kravco Simon Investments, L.P. to approximately 80% and in the management company to approximately 50%. Members of the family of one of the original founders of the Kravco companies own the remaining interest. Total consideration for the purchases was approximately $293 million including the assumption of its pro rata share of mortgage indebtedness. The Operating Partnership issued approximately $107.4 million of perpetual preferred operating partnership units as part of the consideration.
On December 30, 2003, the Company announced the closing of its joint venture with Rinascente Group. Gallerie Commerciali Italia S.p.A. ("GCI") was created for the ownership, management and development of shopping malls in Italy. The Rinascente Group contributed certain of its existing shopping center assets and development opportunities to GCI, and then sold 49% of the new company to an affiliate of the Company. The initial value of GCI is approximately Euro 860 million. The Company's equity investment was approximately Euro 187 million, which was funded through additional borrowings. The portfolio consists of 38 shopping centers currently open and operating, comprising approximately six million square feet (including hypermarket and certain small shop space not owned by GCI). GCI has several projects under construction and in predevelopment that could add up to six million additional square feet over the next five years.
This package was prepared to provide (1) ownership information, (2) certain operational information, and (3) balance sheet information as of December 31, 2003, for the Company and the Operating Partnership.
Certain statements contained in this Supplemental Package may constitute "forward-looking statements" made pursuant to the safe harbor provisions of the Private Securities Litigation Reform Act of 1995. Readers are cautioned that forward-looking statements involve risks and uncertainties,
5
which may affect the business and prospects of the Company and the Operating Partnership. We direct you to the Company's various filings with the Securities and Exchange Commission including Form 10-K and Form 10-Q for a detailed discussion of risks and uncertainties.
We hope you find this Supplemental Package beneficial. Any questions, comments or suggestions should be directed to: Shelly J. Doran, Vice President of Investor Relations-Simon Property Group, P.O. Box 7033, Indianapolis, IN 46207. Telephone: (317) 685-7330; e-mail: sdoran@simon.com
Reporting Calendar
Results for the next three quarters will be announced according to the following approximate schedule:
| First Quarter 2004 | | Early May 2004 |
| Second Quarter 2004 | | Late July 2004 |
| Third Quarter 2004 | | Late October 2004 |
Stock Information
Simon Property Group common stock and two issues of preferred stock are traded on the New York Stock Exchange under the following symbols:
| Common Stock | | SPG |
| 8.75% Series F Cumulative Preferred | | SPGPrF |
| 7.89% Series G Cumulative Preferred | | SPGPrG |
Credit Ratings
| Standard & Poor's | | | | |
| | Corporate | | BBB+ | | (Stable) |
| | Senior Unsecured | | BBB | | (Stable) |
| | Preferred Stock | | BBB- | | (Stable) |
| Moody's | | | | |
| | Senior Unsecured | | Baa2 | | (Stable) |
| | Preferred Stock | | Baa3 | | (Stable) |
6
Simon Property Group Ownership Structure(1)
December 31, 2003
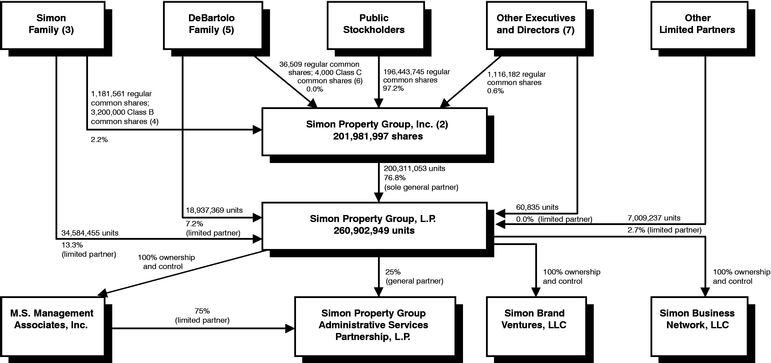
- (1)
- Schedule excludes preferred stock (see "Preferred Stock/Units Outstanding") and units not convertible into common stock.
- (2)
- The number of outstanding shares of common stock of Simon Property exceeds the number of Operating Partnership units owned by Simon Property by 1,670,944. This is the result of the direct ownership of Ocean County Mall by Simon Property, partially offset by units issued to Simon Property in exchange for the contribution of interests in Northshore Mall.
- (3)
- Consists of Melvin Simon, Herbert Simon, David Simon, and/or trusts established for the benefit of members of the Simon family and Melvin Simon & Associates, Inc.
- (4)
- Holders of Class B common stock are entitled to elect 4 of the 13 members of the Board of Directors and also have voting rights with regular common stock.
- (5)
- Consists of NID Corporation, directly or indirectly, members of the DeBartolo family, including Edward J. DeBartolo, Jr. and M. Denise DeBartolo York, or trusts established for the benefit of members of the DeBartolo family or entities in which the foregoing persons hold interests.
- (6)
- Holders of Class C common stock are entitled to elect 2 of the 13 members of the Board of Directors and also have voting rights with regular common stock.
- (7)
- Other executives and directors includes directors and executive officers of Simon Property, other than Simon and DeBartolo family members.
7
SIMON PROPERTY GROUP
Changes in Common Shares and Unit Ownership
For the Period from December 31, 2002 through December 31, 2003
| | Operating
Partnership
Units(1)
| | Company Common Shares(2)
|
|---|
| Number Outstanding at December 31, 2002 | | 63,746,013 | | 185,543,540 |
Issuance of Stock for Stock Option Exercises |
|
— |
|
733,616 |
Conversion of Series B Preferred Stock |
|
— |
|
12,443,195 |
Conversion of Units into Common Stock |
|
(2,880,811 |
) |
2,880,811 |
Conversion of Units into Cash |
|
(274,633 |
) |
— |
Restricted Stock Awards (Stock Incentive Program), Net |
|
— |
|
380,835 |
Other |
|
1,327 |
|
— |
Number Outstanding at December 31, 2003 |
|
60,591,896 |
|
201,981,997 |
Total Common Shares and Units Outstanding at December 31, 2003:
262,573,893(2)
Details for Diluted Common Shares Outstanding:
| Company Common Shares Outstanding at December 31, 2003 | | 201,981,997 |
Number of Common Shares Issuable Assuming Conversion of: |
|
|
| |
Series C Preferred 7% Cumulative Convertible Units(3) |
|
1,968,254 |
Net Number of Common Shares Issuable Assuming Exercise of Stock Options(4) |
|
935,050 |
Diluted Common Shares Outstanding at December 31, 2003 |
|
204,885,301 |
Fully Diluted Common Shares and Units Outstanding at December 31, 2003:
265,477,197
- (1)
- Excludes units owned by the Company (shown here as Company Common Shares) and units not convertible into common shares.
- (2)
- Excludes preferred units relating to preferred stock outstanding (see Schedule of Preferred Stock Outstanding on page 51.
- (3)
- Conversion terms provided in footnote (4) on page 51 of this document.
- (4)
- Based upon the weighted average stock price for the quarter ended December 31, 2003.
8
SIMON PROPERTY GROUP
Selected Financial Information
As of December 31, 2003
Unaudited
(In thousands, except as noted)
| | As of or for the
Three Months Ended
December 31,
| | As of or for the
Twelve Months Ended
December 31,
| |
|---|
| | 2003
| | 2002
| | 2003
| | 2002
| |
|---|
| Financial Highlights of the Company | | | | | | | | | | | | | |
| Total Revenue—Consolidated Properties | | $ | 659,861 | | $ | 606,103 | | $ | 2,313,653 | | $ | 2,124,152 | |
| Net Income Available to Common Shareholders | | $ | 165,424 | | $ | 96,308 | (6) | $ | 313,577 | | $ | 358,387 | (6) |
| Basic Earnings per Common Share | | $ | 0.86 | | $ | 0.52 | (6) | $ | 1.65 | | $ | 1.99 | (6) |
| Diluted Earnings per Common Share | | $ | 0.83 | | $ | 0.52 | (6) | $ | 1.65 | | $ | 1.99 | (6) |
| FFO of the Simon Portfolio | | $ | 333,253 | | $ | 304,707 | (7) | $ | 1,041,105 | | $ | 936,356 | (7) |
| Basic FFO Allocable to the Company | | $ | 253,097 | | $ | 226,245 | (7) | $ | 787,467 | | $ | 691,004 | (7) |
| Diluted FFO Allocable to the Company | | $ | 258,376 | | $ | 236,432 | (7) | $ | 822,169 | | $ | 729,171 | (7) |
| Basic FFO per Share | | $ | 1.31 | | $ | 1.22 | (7) | $ | 4.16 | | $ | 3.84 | (7) |
| Diluted FFO per Share | | $ | 1.26 | | $ | 1.19 | (7) | $ | 4.04 | | $ | 3.76 | (7) |
| Distributions per Share | | $ | 0.60 | | $ | 0.55 | | $ | 2.40 | | $ | 2.18 | |
Operational Statistics for U.S. Properties |
|
|
|
|
|
|
|
|
|
|
|
|
|
| Occupancy at End of Period: | | | | | | | | | | | | | |
| | Regional Malls(1) | | | | | | | | | 92.4 | % | | 92.7 | % |
| | Community Shopping Centers(2) | | | | | | | | | 90.2 | % | | 86.9 | % |
Average Base Rent per Square Foot: |
|
|
|
|
|
|
|
|
|
|
|
|
|
| | Regional Malls(1) | | | | | | | | $ | 32.26 | | $ | 30.70 | |
| | Community Shopping Centers(2) | | | | | | | | $ | 10.59 | | $ | 10.12 | |
Releasing Spread, Regional Malls: |
|
|
|
|
|
|
|
|
|
|
|
|
|
| | Lease Signings Base Rent per Square Foot | | | | | | | | $ | 41.28 | | $ | 40.35 | |
| | Store Closings/Lease Expirations Base Rent per Square Foot | | | | | | | | $ | 32.99 | | $ | 32.58 | |
| | Releasing Spread per Square Foot | | | | | | | | $ | 8.29 | | $ | 7.77 | |
| | Percentage Increase | | | | | | | | | 25.1 | % | | 23.8 | % |
Regional Malls: |
|
|
|
|
|
|
|
|
|
|
|
|
|
| | Total Tenant Sales Volume, in millions(3)(4) | | | | | | | | $ | 19,486 | | $ | 17,971 | |
| | Comparable Sales per Square Foot(4) | | | | | | | | $ | 402 | | $ | 391 | |
| | Total Sales per Square Foot(4) | | | | | | | | $ | 401 | | $ | 386 | |
Number of U.S. Properties Open at End of Period |
|
|
|
|
|
|
|
|
245 |
|
|
246 |
|
| Number of Canadian Properties Open at End of Period | | | | | | | | | 1 | | | 1 | |
| | | | | | | | |
| |
| |
| Number of North American Properties Open at End of Period(5) | | | | | | | | | 246 | | | 247 | |
| | | | | | | | |
| |
| |
9
| Total U.S. GLA at End of Period (in millions of square feet) | | | | | | | | | 190.0 | | | 184.5 | |
| Total Canadian GLA at End of Period (in millions of square feet) | | | | | | | | | 0.2 | | | 0.2 | |
| | | | | | | | |
| |
| |
| Total North American GLA at End of Period (in millions of square feet) | | | | | | | | | 190.2 | | | 184.7 | |
| | | | | | | | |
| |
| |
| Operational Statistics for European Properties | | | | | | | | |
| Occupancy at End of Period: | | | | | | 99.3 | % | N/A |
| Number of European Properties Open at End of Period | | | | | | 47.0 | | N/A |
| Total European GLA at End of Period (in millions of square feet) | | | | | | 8.9 | | N/A |
- (1)
- Includes mall and freestanding stores
- (2)
- Includes all Owned GLA.
- (3)
- Represents only those tenants who report sales.
- (4)
- Based upon the standard definition of sales for regional malls adopted by the International Council of Shopping Centers which includes only mall and freestanding stores less than 10,000 square feet.
(5) |
|
Number of North American Properties at 12/31/02 |
|
247 |
| | | Add: New Developments Opened | | 1 |
| | | Add: Properties Acquired | | 11 |
| | | Less: Properties Sold | | -13 |
| | | | |
|
| | | Number of North American Properties at 12/31/03 | | 246 |
| | | | |
|
- (6)
- Includes our share of gains on land sales of $18.3 million and $11.1 million for the three months ended December 31, 2003 and 2002, respectively and $42.0 million and $39.4 million for the twelve months ended December 31, 2003 and 2002, respectively.
- (7)
- FFO for the quarter ended December 31, 2002 has been restated for the adoption of SFAS 141 and SFAS 142 to reflect the fair market value of leases from acquisitions, increasing FFO by $5.0 million or $0.02 per share. FFO for the twelve months ended December 31, 2002, has been restated for: the recording of fair market value of leases from acquisitions (increasing FFO by $5.0 million); the Company's gains on debt-related transactions previously reported as extraordinary under GAAP (increasing FFO by a net $14.3 million) and the Company's share of impairment of technology assets (reducing FFO by a net $26.7 million). The impact of the restatements for the year on a per share diluted basis was a net decrease of $0.03.
10
| | December 31,
2003
| | December 31,
2002
|
|---|
| Shareholders' Equity Information | | | | | | |
| Limited Partner Units Outstanding at End of Period | | | 60,592 | | | 63,746 |
| Shares Outstanding at End of Period | | | 201,982 | | | 185,544 |
| | |
| |
|
| Total Common Shares and Units Outstanding at End of Period | | | 262,574 | | | 249,290 |
| | |
| |
|
| Weighted Average Shares Outstanding—Basic(1) | | | 189,475 | | | 179,910 |
| Weighted Average Shares Outstanding—Diluted(1) | | | 203,468 | | | 193,992 |
Debt Information |
|
|
|
|
|
|
| Consolidated Debt | | $ | 10,266,388 | | $ | 9,546,081 |
| Simon Group's Share of Joint Venture Debt | | $ | 2,739,630 | | $ | 2,279,609 |
Debt-to-Market Capitalization |
|
|
|
|
|
|
| Common Stock Price at End of Period | | $ | 46.34 | | $ | 34.07 |
| Equity Market Capitalization(2) | | $ | 12,834,007 | | $ | 9,483,358 |
| Total Consolidated Capitalization | | $ | 23,100,395 | | $ | 19,029,439 |
| Total Capitalization—Including Simon Group's Share of JV Debt | | $ | 25,840,025 | | $ | 21,309,048 |
|
|
As of or for the
Twelve Months Ended
December 31,
|
|---|
| | 2003
| | 2002
|
|---|
| Miscellaneous Balance Sheet Data | | | | | | |
| Interest Capitalized during the Period: | | | | | | |
| | Consolidated Properties | | $ | 10,668 | | $ | 4,250 |
| | Joint Venture Properties | | $ | 1,334 | | $ | 3,308 |
| | Simon Group's Share of Joint Venture Properties | | $ | 567 | | $ | 1,524 |
- (1)
- For purposes of computing FFO per share
- (2)
- Market value of Common Stock, Units and all issues of Preferred Stock of the Company.
11
On the following three pages, we present balance sheet and income statement data intended to report the Company's economic ownership of the entire Simon Group portfolio. While these combined statements were not prepared in accordance with GAAP, we believe they reflect the Company's proportionate economic ownership of each asset in the Simon Group portfolio.
Basis of Presentation: The consolidated amounts shown are prepared on a consistent basis with the consolidated financial statements prepared by the Company. The Real Estate Joint Ventures column was derived on a property by property basis by applying the same percentage interests used to arrive at our share of net income during the period and applying them to all financial statement line items of each property. A similar calculation was performed for minority interests.
12
Simon Property Group, Inc.
Pro-Rata Balance Sheet
As of December 31, 2003
| | Consolidated
| | Minority
Interest
| | The Company's
Consolidated
Share
| | Real Estate
Joint Ventures
| | Total
Company's
Share
| |
|---|
| ASSETS: | | | | | | | | | | | | | | | | |
| | Investment properties, at cost | | $ | 14,971,823 | | | (128,816 | ) | | 14,843,007 | | $ | 5,159,821 | | $ | 20,002,828 | |
| | Less—accumulated depreciation | | | 2,556,578 | | | (37,935 | ) | | 2,518,643 | | | 710,907 | | | 3,229,550 | |
| | |
| |
| |
| |
| |
| |
| | | | 12,415,245 | | | (90,881 | ) | | 12,324,364 | | | 4,448,914 | | | 16,773,278 | |
| | Cash and cash equivalents | | | 535,623 | | | (9,970 | ) | | 525,653 | | | 121,263 | | | 646,916 | |
| | Tenant receivables and accrued revenue, net | | | 305,200 | | | (3,421 | ) | | 301,779 | | | 97,555 | | | 399,334 | |
| | Notes and advances receivable from Management Company and affiliates | | | — | | | — | | | — | | | — | | | — | |
| | Investment in unconsolidated entities, at equity | | | 1,811,773 | | | — | | | 1,811,773 | | | (1,811,773 | ) | | — | |
| | Deferred costs, other assets, intangibles and minority interest, net | | | 616,880 | | | (47,431 | ) | | 569,449 | | | 3,783 | | | 573,232 | |
| | |
| |
| |
| |
| |
| |
| | | Total assets | | $ | 15,684,721 | | $ | (151,703 | ) | $ | 15,533,018 | | $ | 2,859,742 | | $ | 18,392,760 | |
| | |
| |
| |
| |
| |
| |
| LIABILITIES: | | | | | | | | | | | | | | | | |
| | Mortgages and other indebtedness | | $ | 10,266,388 | | $ | (125,262 | ) | $ | 10,141,126 | | $ | 2,739,630 | | $ | 12,880,756 | |
| | Accounts payable and accrued expenses | | | 667,610 | | | (5,866 | ) | | 661,744 | | | 107,324 | | | 769,068 | |
| | Cash distributions and losses in partnerships and joint ventures, at equity | | | 14,412 | | | — | | | 14,412 | | | (14,412 | ) | | — | |
| | Other liabilities, minority interest and accrued dividends | | | 280,414 | | | (20,575 | ) | | 259,839 | | | 27,200 | | | 287,039 | |
| | |
| |
| |
| |
| |
| |
| | | Total liabilities | | | 11,228,824 | | | (151,703 | ) | | 11,077,121 | | | 2,859,742 | | | 13,936,863 | |
| | |
| |
| |
| |
| |
| |
| LIMITED PARTNERS' INTEREST IN THE OPERATING PARTNERSHIP | | | 859,050 | | | — | | | 859,050 | | | — | | | 859,050 | |
| LIMITED PARTNERS' PREFERRED INTEREST IN THE OPERATING PARTNERSHIP | | | 258,220 | | | — | | | 258,220 | | | — | | | 258,220 | |
| SHAREHOLDERS' EQUITY: | | | | | | | | | | | | | | | | |
| | CAPITAL STOCK OF SIMON PROPERTY GROUP, INC. (750,000,000 total shares authorized, $.0001 par value, 237,996,000 shares of excess common stock): | | | | | | | | | | | | | | | | |
| | All series of preferred stock, 100,000,000 shares authorized, 12,078,012 and 16,830,057 issued and outstanding, respectively. Liquidation values $376,950 and $858,006, respectively. | | | 367,483 | | | — | | | 367,483 | | | — | | | 367,483 | |
| | Common stock, $.0001 par value, 400,000,000 shares authorized, 200,876,552 and 184,438,095 issued and outstanding, respectively | | | 20 | | | — | | | 20 | | | — | | | 20 | |
| | Class B common stock, $.0001 par value, 12,000,000 shares authorized, 3,200,000 issued and outstanding | | | 1 | | | — | | | 1 | | | — | | | 1 | |
| | Class C common stock, $.0001 par value, 4,000 shares authorized, issued and outstanding | | | — | | | — | | | — | | | — | | | — | |
| | Capital in excess of par value | | | 4,121,332 | | | — | | | 4,121,332 | | | — | | | 4,121,332 | |
| | Accumulated deficit | | | (1,097,317 | ) | | — | | | (1,097,317 | ) | | — | | | (1,097,317 | ) |
| | Accumulated other comprehensive income | | | 12,586 | | | — | | | 12,586 | | | — | | | 12,586 | |
| | Unamortized restricted stock award | | | (12,960 | ) | | — | | | (12,960 | ) | | — | | | (12,960 | ) |
| | Common stock held in treasury at cost, 2,098,555 shares | | | (52,518 | ) | | — | | | (52,518 | ) | | — | | | (52,518 | ) |
| | |
| |
| |
| |
| |
| |
| | | Total shareholders' equity | | | 3,338,627 | | | — | | | 3,338,627 | | | — | | | 3,338,627 | |
| | |
| |
| |
| |
| |
| |
| | | $ | 15,684,721 | | $ | (151,703 | ) | $ | 15,533,018 | | $ | 2,859,742 | | $ | 18,392,760 | |
| | |
| |
| |
| |
| |
| |
13
Simon Property Group, Inc.
Pro-Rata Statement of Operations
For three months ended December 31, 2003
| | Consolidated
| | Minority
Interest
| | The Company's
Consolidated
Share
| | Real Estate
Joint Ventures
| | Total
| |
|---|
| REVENUE: | | | | | | | | | | | | | | | |
| | Minimum rent | | $ | 381,759 | | | (3,765 | ) | 377,994 | | | 101,532 | | $ | 479,526 | |
| | Overage rent | | | 23,433 | | | (169 | ) | 23,264 | | | 6,946 | | | 30,210 | |
| | Tenant reimbursements | | | 175,196 | | | (1,950 | ) | 173,246 | | | 48,977 | | | 222,223 | |
| | Management fees and other revenues | | | 19,090 | | | 0 | | 19,090 | | | 0 | | | 19,090 | |
| | Other income | | | 60,383 | | | (2,688 | ) | 57,695 | | | 10,867 | | | 68,562 | |
| | |
| |
| |
| |
| |
| |
| | | Total revenue | | | 659,861 | | | (8,572 | ) | 651,289 | | | 168,322 | | | 819,611 | |
| | |
| |
| |
| |
| |
| |
| EXPENSES: | | | | | | | | | | | | | | | |
| | Property operating | | | 83,192 | | | (1,228 | ) | 81,964 | | | 30,052 | | | 112,016 | |
| | Depreciation and amortization | | | 127,545 | | | (897 | ) | 126,648 | | | 39,491 | | | 166,139 | |
| | Real estate taxes | | | 53,224 | | | (438 | ) | 52,786 | | | 13,420 | | | 66,206 | |
| | Repairs and maintenance | | | 23,421 | | | (310 | ) | 23,111 | | | 7,538 | | | 30,649 | |
| | Advertising and promotion | | | 23,804 | | | (227 | ) | 23,577 | | | 7,475 | | | 31,052 | |
| | Provision for credit losses | | | 3,651 | | | (33 | ) | 3,618 | | | 178 | | | 3,796 | |
| | Home and regional office | | | 23,534 | | | 0 | | 23,534 | | | 0 | | | 23,534 | |
| | General & administrative | | | 3,975 | | | 0 | | 3,975 | | | 0 | | | 3,975 | |
| | Costs related to withdrawn tender offer | | | 81 | | | 0 | | 81 | | | 0 | | | 81 | |
| | Other | | | 9,682 | | | (284 | ) | 9,398 | | | 4,984 | | | 14,382 | |
| | |
| |
| |
| |
| |
| |
| | | Total operating expenses | | | 352,109 | | | (3,417 | ) | 348,692 | | | 103,138 | | | 451,830 | |
| | |
| |
| |
| |
| |
| |
| OPERATING INCOME | | | 307,752 | | | (5,155 | ) | 302,597 | | | 65,184 | | | 367,781 | |
| Interest expense | | | 151,016 | | | (1,185 | ) | 149,831 | | | 36,528 | | | 186,359 | |
| | |
| |
| |
| |
| |
| |
| Income before minority interest | | | 156,736 | | | (3,970 | ) | 152,766 | | | 28,656 | | | 181,422 | |
| Minority interest | | | (3,970 | ) | | 3,970 | | 0 | | | — | | | — | |
| Gain (loss) on sales of assets and other, net | | | (24 | ) | | — | | (24 | ) | | — | | | (24 | ) |
| Income tax expense of taxable REIT subsidiaries | | | (1,147 | ) | | — | | (1,147 | ) | | | | | (1,147 | ) |
| | |
| |
| |
| |
| |
| |
| Income before unconsolidated entities | | | 151,595 | | | — | | 151,595 | | | 28,656 | | | 180,251 | |
| Income from other unconsolidated entities | | | 28,656 | | | — | | 28,656 | | | (28,656 | ) | | — | |
| | |
| |
| |
| |
| |
| |
| Income from continuing operations | | | 180,251 | | | — | | 180,251 | | | — | | | 180,251 | |
| | Results of operations from discontinued operations | | | 1,755 | | | | | 1,755 | | | — | | | 1,755 | |
| | Gain on disposal or sale of discontinued operations | | | 48,086 | | | — | | 48,086 | | | — | | | 48,086 | |
| | |
| |
| |
| |
| |
| |
| Income before allocation to limited partners | | | 230,092 | | | — | | 230,092 | | | — | | | 230,092 | |
| LESS: | | | | | | | | | | | | | | | |
| | Limited partners' interest in the Operating Partnership | | | 53,039 | | | — | | 53,039 | | | — | | | 53,039 | |
| | Preferred distributions of the Operating Partnership | | | 3,539 | | | — | | 3,539 | | | — | | | 3,539 | |
| | |
| |
| |
| |
| |
| |
| NET INCOME | | | 173,514 | | | — | | 173,514 | | | | | | 173,514 | |
| Preferred dividends | | | (8,090 | ) | | — | | (8,090 | ) | | — | | | (8,090 | ) |
| | |
| |
| |
| |
| |
| |
| NET INCOME AVAILABLE TO COMMON SHAREHOLDERS | | $ | 165,424 | | $ | — | | 165,424 | | $ | — | | $ | 165,424 | |
| | |
| |
| |
| |
| |
| |
| RECONCILIATION TO FFO: | | | | | | | | | | | | | | | |
| Net Income | | | | | | | | 173,514 | | | | | | 173,514 | |
| | Less: | | | | | | | | | | | | | | | |
| | | Joint Venture Net Income | | | | | | | | (28,656 | ) | | 28,656 | | | — | |
| | | | | | | | |
| |
| |
| |
| | Net Income | | | | | | | | 144,858 | | | 28,656 | | | 173,514 | |
| | Plus: | | | | | | | | | | | | | | | |
| | | Limited Partners' interest in the Operating Partnership and Preferred distributions of the Operating Partnership | | | | | | | | 56,578 | | | | | | 56,578 | |
| | | Depreciation and amortization from combined consolidated properties and discontinued operations | | | | | | | | 124,830 | | | | | | 124,830 | |
| | | Our share of depreciation and amortization from unconsolidated affiliates | | | | | | | | — | | | 38,907 | | | 38,907 | |
| | | Loss on sale of real estate and discontinued operations | | | | | | | | (48,062 | ) | | | | | (48,062 | ) |
| | Less: | | | | | | | | | | | | | | | |
| | | Minority interest portion of depreciation and amortization | | | | | | | | (885 | ) | | | | | (885 | ) |
| | | Preferred distributions and dividends | | | | | | | | (11,629 | ) | | | | | (11,629 | ) |
| | | | | | | | |
| |
| |
| |
| Our FFO | | | | | | | | 265,690 | | | 67,563 | | | 333,253 | |
| | | | | | | | |
| |
| |
| |
| | % of Total FFO: | | | | | | | | 79.73 | % | | 20.27 | % | | 100.00 | % |
14
Simon Property Group, Inc.
Pro-Rata Statement of Operations
For twelve months ended December 31, 2003
| | Consolidated
| | Minority Interest
| | The Company's
Consolidated Share
| | Real Estate
Joint Ventures
| | Total
Company's Share
| |
|---|
| REVENUE: | | | | | | | | | | | | | | | | |
| | Minimum rent | | $ | 1,375,407 | | | (14,246 | ) | | 1,361,161 | | | 383,123 | | $ | 1,744,284 | |
| | Overage rent | | | 47,991 | | | (667 | ) | | 47,324 | | | 13,078 | | | 60,402 | |
| | Tenant reimbursements | | | 674,854 | | | (6,394 | ) | | 668,460 | | | 190,921 | | | 859,381 | |
| | Management fees and other revenues | | | 78,292 | | | 0 | | | 78,292 | | | 0 | | | 78,292 | |
| | Other income | | | 137,109 | | | (3,164 | ) | | 133,945 | | | 55,623 | | | 189,568 | |
| | |
| |
| |
| |
| |
| |
| | | Total revenue | | | 2,313,653 | | | (24,471 | ) | | 2,289,182 | | | 642,745 | | | 2,931,927 | |
| | |
| |
| |
| |
| |
| |
EXPENSES: |
|
|
|
|
|
|
|
|
|
|
|
|
|
|
|
|
| | Property operating | | | 327,819 | | | (4,319 | ) | | 323,500 | | | 109,289 | | | 432,789 | |
| | Depreciation and amortization | | | 498,136 | | | (3,563 | ) | | 494,573 | | | 148,605 | | | 643,178 | |
| | Real estate taxes | | | 219,274 | | | (1,494 | ) | | 217,780 | | | 56,837 | | | 274,617 | |
| | Repairs and maintenance | | | 84,623 | | | (971 | ) | | 83,652 | | | 29,902 | | | 113,554 | |
| | Advertising and promotion | | | 61,765 | | | (654 | ) | | 61,111 | | | 19,982 | | | 81,093 | |
| | Provision for credit losses | | | 14,253 | | | (250 | ) | | 14,003 | | | 3,665 | | | 17,668 | |
| | Home and regional office costs | | | 80,105 | | | 0 | | | 80,105 | | | 0 | | | 80,105 | |
| | General & administrative | | | 15,083 | | | 0 | | | 15,083 | | | 0 | | | 15,083 | |
| | Costs related to withdrawn tender offer | | | 10,581 | | | 0 | | | 10,581 | | | 0 | | | 10,581 | |
| | Other | | | 27,229 | | | (1,272 | ) | | 25,957 | | | 29,454 | | | 55,411 | |
| | |
| |
| |
| |
| |
| |
| | | Total operating expenses | | | 1,338,868 | | | (12,523 | ) | | 1,326,345 | | | 397,734 | | | 1,724,079 | |
| | |
| |
| |
| |
| |
| |
OPERATING INCOME |
|
|
974,785 |
|
|
(11,948 |
) |
|
962,837 |
|
|
245,011 |
|
|
1,207,848 |
|
| Interest expense | | | 602,510 | | | (4,671 | ) | | 597,839 | | | 145,366 | | | 743,205 | |
| | |
| |
| |
| |
| |
| |
| Income before minority interest | | | 372,275 | | | (7,277 | ) | | 364,998 | | | 99,645 | | | 464,643 | |
| Minority interest | | | (7,277 | ) | | 7,277 | | | — | | | — | | | — | |
| Gain (loss) on sales of assets and other, net | | | (5,146 | ) | | — | | | (5,146 | ) | | — | | | (5,146 | ) |
| Income tax expense of taxable REIT subsidiaries | | | (7,597 | ) | | — | | | (7,597 | ) | | — | | | (7,597 | ) |
| | |
| |
| |
| |
| |
| |
| Income before unconsolidated entities | | | 352,255 | | | — | | | 352,255 | | | 99,645 | | | 451,900 | |
| Income from other unconsolidated entities | | | 99,645 | | | — | | | 99,645 | | | (99,645 | ) | | — | |
| | |
| |
| |
| |
| |
| |
| Income from continuing operations | | | 451,900 | | | — | | | 451,900 | | | — | | | 451,900 | |
| Results of operations from discontinued operations | | | 7,421 | | | | | | 7,421 | | | — | | | 7,421 | |
| Gain on disposal or sale of discontinued operations | | | 22,394 | | | — | | | 22,394 | | | — | | | 22,394 | |
| | |
| |
| |
| |
| |
| |
| Income before allocation to limited partners | | | 481,715 | | | — | | | 481,715 | | | — | | | 481,715 | |
LESS: |
|
|
|
|
|
|
|
|
|
|
|
|
|
|
|
|
| | Limited partners' interest in the Operating Partnership | | | 100,956 | | | — | | | 100,956 | | | — | | | 100,956 | |
| | Preferred distributions of the Operating Partnership | | | 12,044 | | | — | | | 12,044 | | | | | | 12,044 | |
| | |
| |
| |
| |
| |
| |
NET INCOME |
|
|
368,715 |
|
|
— |
|
|
368,715 |
|
|
— |
|
|
368,715 |
|
| Preferred dividends | | | (55,138 | ) | | — | | | (55,138 | ) | | — | | | (55,138 | ) |
| | |
| |
| |
| |
| |
| |
NET INCOME AVAILABLE TO COMMON SHAREHOLDERS |
|
$ |
313,577 |
|
$ |
— |
|
$ |
313,577 |
|
$ |
— |
|
$ |
313,577 |
|
| | |
| |
| |
| |
| |
| |
RECONCILIATION TO FFO: |
|
|
|
|
|
|
|
|
|
|
|
|
|
|
|
|
| Net Income | | | | | | | | | 368,715 | | | | | | 368,715 | |
| | Less: | | | | | | | | | | | | | | | | |
| | | Joint Venture Net Income | | | | | | | | | (99,645 | ) | | 99,645 | | | — | |
| | | | | | | | |
| |
| |
| |
| | Net Income | | | | | | | | | 269,070 | | | 99,645 | | | 368,715 | |
| | Plus: | | | | | | | | | | | | | | | | |
| | | Limited Partners' interest in the Operating Partnership and Preferred distributions of the Operating Partnership | | | | | | | | | 113,000 | | | | | | 113,000 | |
| | | Depreciation and amortization from combined consolidated properties and discontinued operations | | | | | | | | | 499,737 | | | | | | 499,737 | |
| | | Our share of depreciation and amortization from unconsolidated affiliates | | | | | | | | | — | | | 147,629 | | | 147,629 | |
| | | Loss on sale of real estate and discontinued operations | | | | | | | | | (17,248 | ) | | | | | (17,248 | ) |
| | Less: | | | | | | | | | | | | | | | | |
| | | Minority interest portion of depreciation and amortization | | | | | | | | | (3,546 | ) | | | | | (3,546 | ) |
| | | Preferred distributions and dividends | | | | | | | | | (67,182 | ) | | | | | (67,182 | ) |
| | | | | | | | |
| |
| |
| |
| | Our FFO | | | | | | | | | 793,831 | | | 247,274 | | | 1,041,105 | |
| | | | | | | | |
| |
| |
| |
| | | % of Total FFO: | | | | | | | | | 76.25 | % | | 23.75 | % | | 100.00 | % |
15
SIMON PROPERTY GROUP
Reconciliation of NOI to Net Income
As of December 31, 2003
Industry practice is to evaluate real estate properties on an unleveraged basis. NOI is a standard industry performance measure which is defined as operating income plus depreciation and amortization and impairment charges on investment properties, each calculated in accordance with accounting principles generally accepted in the United States ("GAAP"). We consider NOI to be a key measure of our operating performance that is not specifically defined GAAP. We believe that NOI is helpful to investors because it is a widely recognized measure of the performance of REITs and provides a relevant basis for comparison among REITs. We also use NOI internally to measure the operating performance of our portfolio.
However, you should understand that NOI:
- •
- does not represent cash flow from operations as defined by GAAP,
- •
- should not be considered as an alternative to net income determined in accordance with GAAP as a measure of operating performance,
- •
- is not an alternative to cash flows as a measure of liquidity, and
- •
- is not indicative of cash flows from operating, investing and financing activities.
The Reconciliation of NOI to Net Income provides "Total NOI of the Simon Group Portfolio" and reconciles the amounts to net income, which we believe is the most directly comparable GAAP financial measure. The Computation of Comparable Property NOI Growth provides the increase in the comparable regional mall and mixed-use NOI for the twelve months ended December 31, 2003.
| | For the three months ended December 31,
| | For the twelve months ended
December 31,
| |
|---|
| | 2003
| | 2002
| | 2003
| | 2002
| |
|---|
| | (in thousands)
| |
|---|
| Reconciliation of NOI of consolidated Properties: | | | | | | | | | | | | | |
| Net Income | | $ | 173,514 | | $ | 111,991 | | $ | 368,715 | | $ | 422,588 | |
| Add: Preferred distributions of the Operating Partnership | | | 3,539 | | | 2,835 | | | 12,044 | | | 11,340 | |
| Limited partners' interest in the Operating Partnership | | | 53,039 | | | 33,109 | | | 100,956 | | | 127,727 | |
| Discontinued operations—Results of operations and loss on disposal or sale, net | | | (49,841 | ) | | (6,020 | ) | | (29,815 | ) | | (16,507 | ) |
| Income tax expense of taxable REIT subsidiaries | | | 1,147 | | | — | | | 7,597 | | | — | |
| Minority interest | | | 3,970 | | | 4,129 | | | 7,277 | | | 10,498 | |
| Interest Expense | | | 151,016 | | | 152,078 | | | 602,510 | | | 599,266 | |
| Income from unconsolidated entities | | | (28,656 | ) | | (26,628 | ) | | (99,645 | ) | | (60,069 | ) |
| Gains on sales of assets and other and gains from debt related transactions, net | | | 24 | | | 8,382 | | | 5,146 | | | (176,587 | ) |
| | |
| |
| |
| |
| |
| Operating Income | | | 307,752 | | | 279,876 | | | 974,785 | | | 918,256 | |
| Depreciation and amortization expense | | | 127,545 | | | 123,832 | | | 498,136 | | | 467,395 | |
| | |
| |
| |
| |
| |
| NOI of consolidated Properties | | $ | 435,297 | | $ | 403,708 | | $ | 1,472,921 | | $ | 1,385,651 | |
| | |
| |
| |
| |
| |
Reconciliation of NOI of unconsolidated entities: |
|
|
|
|
|
|
|
|
|
|
|
|
|
| Net Income | | $ | 98,312 | | $ | 83,532 | | $ | 316,595 | | $ | 255,491 | |
| Add: Minority interest | | | 115 | | | 362 | | | 654 | | | 751 | |
| Interest Expense | | | 93,752 | | | 89,316 | | | 364,740 | | | 337,119 | |
| Discontinued operations—Results of operations and loss on disposal or sale, net | | | — | | | (700 | ) | | (1,295 | ) | | (16,063 | ) |
| Income from unconsolidated entities | | | (1,184 | ) | | (3,222 | ) | | (8,393 | ) | | (3,062 | ) |
| | |
| |
| |
| |
| |
| Operating Income | | | 190,995 | | | 169,288 | | | 672,301 | | | 574,236 | |
| Depreciation and amortization expense | | | 75,932 | | | 63,658 | | | 272,746 | | | 234,264 | |
| | |
| |
| |
| |
| |
| NOI of unconsolidated entities | | $ | 266,927 | | $ | 232,946 | | $ | 945,047 | | $ | 808,500 | |
| | |
| |
| |
| |
| |
| Total consolidated and unconsolidated NOI from continuing operations | | $ | 702,224 | | $ | 636,654 | | $ | 2,417,968 | | $ | 2,194,151 | |
| | |
| |
| |
| |
| |
| Adjustments to NOI: | | | | | | | | | | | | | |
NOI of discontinued consolidated and unconsolidated Properties |
|
|
2,704 |
|
|
10,824 |
|
|
21,000 |
|
|
101,197 |
|
| | |
| |
| |
| |
| |
| Total NOI of the Simon Group Portfolio | | $ | 704,928 | | $ | 647,478 | | $ | 2,438,968 | | $ | 2,295,348 | |
| | |
| |
| |
| |
| |
| Increase in NOI from prior period | | | 8.9% | | | 3.9% | | | 6.3% | | | 7.2% | |
Less: Joint venture partner's share of NOI |
|
|
170,250 |
|
|
137,556 |
|
|
571,520 |
|
|
530,282 |
|
| | |
| |
| |
| |
| |
| Simon Group's Share of NOI | | $ | 543,678 | | $ | 509,922 | | $ | 1,867,448 | | $ | 1,765,066 | |
| | |
| |
| |
| |
| |
| Increase in Simon Group's Share of NOI from prior period | | | 4.9% | | | 8.5% | | | 5.8% | | | 9.8% | |
16
SIMON PROPERTY GROUP
Computation of Comparable Property NOI Growth
As of December 31, 2003
| | For the Three Months Ended
December 31,
| | For the Twelve Months Ended
December 31,
| |
|---|
| | 2003
| | 2002
| | 2003
| | 2002
| |
|---|
| | (in thousands)
| |
|---|
| Total NOI of the Simon Group Portfolio | | $ | 704,928 | | $ | 647,478 | | $ | 2,438,968 | | $ | 2,295,348 | |
| | |
| |
| |
| |
| |
| Reconciliation of NOI of Simon Group Portfolio to NOI of Regional Malls and Mixed-Use Properties: | | | | | | | | | | | | | |
| | NOI of non-Regional Mall and Mixed-Use Activities including Home and Regional Office cost allocations | | $ | (51,098 | ) | $ | (37,356 | ) | $ | (179,117 | ) | $ | (162,158 | ) |
| | |
| |
| |
| |
| |
| NOI from Regional Malls and Mixed-Use Properties | | $ | 653,830 | | $ | 610,122 | | $ | 2,259,851 | | $ | 2,133,190 | |
| | |
| |
| |
| |
| |
Adjustments to NOI from Regional Malls and Mixed-Use |
|
|
|
|
|
|
|
|
|
|
| Properties for non-comparable activity: | | | | | | | | | | | | | |
| | NOI of acquired, redeveloped, and newly opened Regional Malls and Mixed-Use Properties | | $ | (80,878 | ) | $ | (49,281 | ) | $ | (210,176 | ) | $ | (111,794 | ) |
| | NOI of disposed Regional Malls and Mixed-Use Properties | | | (2,515 | ) | | (7,757 | ) | | (14,754 | ) | | (33,186 | ) |
| | Other Non-Regional Mall and Mixed-Use activities | | | | | | | | | | | | | |
| | | Costs related to withdrawn tender offer | | | — | | | — | | | 10,500 | | | — | |
| | | One-time gain related to our energy business | | | — | | | — | | | — | | | (8,655 | ) |
| | | Impact of hedges related to Rodamco acquisition | | | — | | | — | | | — | | | (7,840 | ) |
| | | Litigation settlement | | | — | | | 2 | | | — | | | 3,987 | |
| | | Corporate and other | | | (38 | ) | | 3,586 | | | (905 | ) | | (363 | ) |
| | |
| |
| |
| |
| |
| Comparable NOI of Regional Malls and Mixed-Use Properties | | $ | 570,399 | | $ | 556,672 | | $ | 2,044,516 | | $ | 1,975,339 | |
| | |
| |
| |
| |
| |
Increase in Comparable Regional Mall and
Mixed-Use NOI from prior period |
|
|
2.5% |
|
|
|
|
|
3.5% |
|
|
|
|
| | |
| | | | |
| | | | |
17
SIMON PROPERTY GROUP
Analysis of Other Income and Other Expense
As of December 31, 2003
(In thousands)
| | For the Three
Months Ended
December 31,
| | For the Twelve
Months Ended
December 31,
|
|---|
| | 2003
| | 2002
| | 2003
| | 2002
|
|---|
| Consolidated Properties | | | | | | | | | | | | |
Other Income |
|
|
|
|
|
|
|
|
|
|
|
|
Interest Income |
|
$ |
5,091 |
|
$ |
5,363 |
|
$ |
17,392 |
|
$ |
23,911 |
| Lease Settlement Income | | | 5,791 | | | 3,825 | | | 14,724 | | | 16,917 |
| Gains on Land Sales and Income from the Sale of Net Leases | | | 20,776 | | | 11,133 | | | 34,352 | | | 36,388 |
| Simon Brand Ventures/Simon Business Network Revenues(1) | | | 24,812 | | | 16,565 | | | 54,713 | | | 37,825 |
| Income from Hedging Activity(2) | | | — | | | — | | | — | | | 7,840 |
| Other | | | 3,913 | | | 1,040 | | | 15,928 | | | 13,862 |
| | |
| |
| |
| |
|
| Totals | | $ | 60,383 | | $ | 37,926 | | $ | 137,109 | | $ | 136,743 |
| | |
| |
| |
| |
|
Other Expense |
|
|
|
|
|
|
|
|
|
|
|
|
Ground Rent |
|
$ |
5,098 |
|
$ |
3,121 |
|
$ |
15,781 |
|
$ |
11,788 |
| Professional Fees | | | 2,578 | | | 1,975 | | | 5,766 | | | 5,704 |
| Simon Brand Ventures/Simon Business Network Revenues | | | 692 | | | 411 | | | 1,375 | | | 668 |
| Costs of Hedging Activity(2) | | | — | | | 106 | | | — | | | 856 |
| Agostinelli Litigation Settlement Costs | | | — | | | — | | | — | | | 3,072 |
| Other | | | 1,315 | | | 3,705 | | | 4,307 | | | 7,460 |
| | |
| |
| |
| |
|
| Totals | | $ | 9,683 | | $ | 9,318 | | $ | 27,229 | | $ | 29,548 |
| | |
| |
| |
| |
|
- (1)
- Additional Simon Brand Ventures and Simon Business Network revenues are recorded in minimum rent.
- (2)
- Income and costs associated with hedging transactions to manage the Company's exposure to fluctuations in the Euro currency as a result of the acquisition of Rodamco North America in 2002.
18
SIMON PROPERTY GROUP
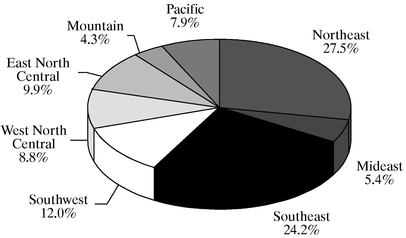
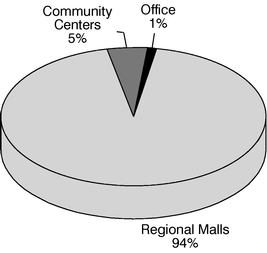
NOI Composition
For the Twelve Months Ended December 31, 2003
U.S. Geographic Diversification of
Regional Mall Portfolio(1)
U.S. Asset Mix of Portfolio
- (1)
- Northeast—PA, NY, VT, NH, ME, MA, NJ, CT and RI
Mideast—KY, WV, MD, DE, VA, NC and SC
Southeast—TN, MS, AL, GA and FL
Southwest—TX, OK, LA and AR
West North Central—ND, SD, NE, KS, MN, IA and MO
East North Central—WI, MI, OH, IN and IL
Mountain—NV, AZ, NM, UT, CO, ID, MT and WY
Pacific—CA, OR and WA
19
SIMON PROPERTY GROUP
Portfolio GLA, Occupancy & Rent Data—U.S. Portfolio
As of December 31, 2003
Type of Property
| | GLA-Sq. Ft.
| | Total
Owned GLA
| | % of
Owned GLA
| | % of Owned
GLA Which
is Leased
| | Average
Base Rent
Per Square Foot
|
|---|
| U.S. Properties: | | | | | | | | | | | |
Regional Malls |
|
|
|
|
|
|
|
|
|
|
|
| —Anchor | | 104,517,942 | | 29,984,651 | | 27.7 | % | 97.0 | % | $ | 4.15 |
| —Mall Store | | 60,507,152 | | 60,454,778 | | 55.9 | % | 92.5 | % | $ | 32.96 |
| —Freestanding | | 4,064,900 | | 2,039,940 | | 1.9 | % | 90.0 | % | $ | 10.67 |
| | |
| |
| |
| | | | | |
| | Subtotal | | 64,572,052 | | 62,494,718 | | 57.8 | % | 92.4 | % | $ | 32.26 |
Regional Mall Total |
|
169,089,994 |
|
92,479,369 |
|
85.5 |
% |
93.9 |
% |
|
|
Community Shopping Centers |
|
|
|
|
|
|
|
|
|
|
|
| —Anchor | | 12,665,953 | | 7,963,787 | | 7.3 | % | 88.9 | % | $ | 8.82 |
| —Mall Store | | 4,364,418 | | 4,281,591 | | 4.0 | % | 92.0 | % | $ | 13.78 |
| —Freestanding | | 910,592 | | 454,713 | | .4 | % | 97.4 | % | $ | 8.00 |
| | |
| |
| |
| | | | | |
| Community Ctr. Total | | 17,940,963 | | 12,700,091 | | 11.7 | % | 90.2 | % | $ | 10.59 |
Office Portion of Mixed-Use Properties |
|
2,983,355 |
|
2,983,355 |
|
2.8 |
% |
82.8 |
% |
$ |
26.04 |
Subtotal U.S. Properties |
|
190,014,312 |
|
108,162,815 |
|
100.00 |
% |
|
|
|
|
Canadian Property |
|
246,972 |
|
|
|
|
|
|
|
|
|
| | |
| | | | | | | | | |
Total North American Properties |
|
190,261,284 |
|
|
|
|
|
|
|
|
|
| | |
| | | | | | | | | |
U.S. Occupancy History
| |
|---|
As of
| | Regional Malls(1)
| | Community
Shopping Centers(2)
| |
|---|
| 12/31/03 | | 92.4 | % | 90.2 | % |
| 12/31/02 | | 92.7 | % | 86.9 | % |
| 12/31/01 | | 91.9 | % | 90.0 | % |
| 12/31/00 | | 91.8 | % | 91.5 | % |
| 12/31/99 | | 90.6 | % | 88.6 | % |
- (1)
- Includes mall and freestanding stores.
- (2)
- Includes all Owned GLA.
20
SIMON PROPERTY GROUP
Rent Information—U.S. Portfolio
As of December 31, 2003
Average Base Rent
Per Square Foot
As of
| | Mall &
Freestanding
Stores at
Regional Malls
| | %
Change
| | Community
Shopping
Centers
| | %
Change
| |
|---|
| 12/31/03 | | $ | 32.26 | | 5.1 | % | $ | 10.59 | | 4.6 | % |
| 12/31/02 | | | 30.70 | | 4.8 | | | 10.12 | | 3.0 | |
| 12/31/01 | | | 29.28 | | 3.4 | | | 9.83 | | 5.0 | |
| 12/31/00 | | | 28.31 | | 3.6 | | | 9.36 | | 12.0 | |
| 12/31/99 | | | 27.33 | | 6.3 | | | 8.36 | | 8.9 | |
Rental Rates
| | Average Base Rent(1)
| | Amount of Change
| |
|---|
Year
| | Lease Signings
During Period
| | Store Closings/
Lease Expirations
During Period
| | $
Change
| | %
Change
| |
|---|
| Regional Malls: | | | | | | | | | | | | |
2003 |
|
$ |
41.28 |
|
$ |
32.99 |
|
$ |
8.29 |
|
25.1 |
% |
| 2002 | | | 40.35 | | | 32.58 | | | 7.77 | | 23.8 | |
| 2001 | | | 34.88 | | | 29.10 | | | 5.78 | | 19.9 | |
| 2000 | | | 35.13 | | | 29.24 | | | 5.89 | | 20.1 | |
| 1999 | | | 31.25 | | | 24.55 | | | 6.70 | | 27.3 | |
Community Shopping Centers: |
|
|
|
|
|
|
|
|
|
|
|
|
2003 |
|
$ |
12.38 |
|
$ |
10.48 |
|
$ |
1.90 |
|
18.1 |
% |
| 2002 | | | 10.19 | | | 8.39 | | | 1.80 | | 21.5 | % |
| 2001 | | | 12.79 | | | 9.30 | | | 3.49 | | 37.5 | |
| 2000 | | | 14.21 | | | 11.51 | | | 2.70 | | 23.5 | |
| 1999 | | | 10.26 | | | 7.44 | | | 2.82 | | 37.9 | |
- (1)
- Represents the average base rent in effect during the period for those tenants who signed leases as compared to the average base rent in effect during the period for those tenants whose leases terminated or expired.
21
SIMON PROPERTY GROUP
Lease Expirations(1)—U.S. Portfolio
As of December 31, 2003
Year
| | Number of
Leases Expiring
| | Square
Feet
| | Avg. Base Rent
per Square Foot
at 12/31/03
|
|---|
| Regional Malls—Mall Stores & Freestanding | | | | | | | |
2004 |
|
2,160 |
|
4,841,815 |
|
$ |
32.15 |
| 2005 | | 2,207 | | 5,921,390 | | $ | 31.43 |
| 2006 | | 2,131 | | 5,626,305 | | $ | 32.93 |
| 2007 | | 2,160 | | 5,560,293 | | $ | 33.12 |
| 2008 | | 1,806 | | 5,556,826 | | $ | 33.32 |
| 2009 | | 1,572 | | 5,033,038 | | $ | 31.48 |
| 2010 | | 1,627 | | 4,810,383 | | $ | 34.98 |
| 2011 | | 1,480 | | 4,531,324 | | $ | 33.34 |
| 2012 | | 1,221 | | 4,103,243 | | $ | 35.35 |
| 2013 | | 1,217 | | 3,834,174 | | $ | 38.84 |
| 2014 | | 566 | | 2,116,645 | | $ | 33.86 |
| 2015 and Thereafter | | 121 | | 2,084,572 | | $ | 18.57 |
Regional Malls—Anchor Tenants |
|
|
|
|
|
|
|
2004 |
|
18 |
|
1,713,808 |
|
$ |
3.68 |
| 2005 | | 24 | | 3,237,545 | | $ | 2.09 |
| 2006 | | 23 | | 2,773,361 | | $ | 2.72 |
| 2007 | | 17 | | 1,755,266 | | $ | 2.17 |
| 2008 | | 27 | | 3,232,033 | | $ | 3.71 |
| 2009 | | 21 | | 2,230,028 | | $ | 3.13 |
| 2010 | | 16 | | 1,625,148 | | $ | 3.70 |
| 2011 | | 12 | | 1,164,969 | | $ | 5.42 |
| 2012 | | 18 | | 2,151,362 | | $ | 4.83 |
| 2013 | | 10 | | 1,638,346 | | $ | 6.86 |
| 2014 | | 12 | | 1,114,832 | | $ | 7.88 |
| 2015 and Thereafter | | 44 | | 5,340,461 | | $ | 5.41 |
Community Centers—Mall Stores & Freestanding |
|
|
|
|
|
|
|
2004 |
|
154 |
|
372,806 |
|
$ |
13.98 |
| 2005 | | 218 | | 688,448 | | $ | 14.89 |
| 2006 | | 191 | | 651,588 | | $ | 13.99 |
| 2007 | | 131 | | 559,020 | | $ | 13.09 |
| 2008 | | 123 | | 559,219 | | $ | 12.89 |
| 2009 | | 44 | | 218,313 | | $ | 12.13 |
| 2010 | | 36 | | 275,098 | | $ | 14.02 |
| 2011 | | 32 | | 224,727 | | $ | 14.97 |
| 2012 | | 20 | | 129,945 | | $ | 15.40 |
| 2013 | | 15 | | 178,311 | | $ | 9.16 |
| 2014 | | 5 | | 25,473 | | $ | 11.09 |
| 2015 and Thereafter | | 6 | | 88,139 | | $ | 11.98 |
- (1)
- Does not consider the impact of options to renew that may be contained in leases.
22
SIMON PROPERTY GROUP
Lease Expirations(1)—U.S. Portfolio
As of December 31, 2003
Year
| | Number of
Leases Expiring
| | Square
Feet
| | Avg. Base Rent
per Square Foot
at 12/31/03
|
|---|
| Community Centers—Anchor Tenants | | | | | | | |
2004 |
|
4 |
|
167,935 |
|
$ |
4.73 |
| 2005 | | 10 | | 303,133 | | $ | 8.45 |
| 2006 | | 18 | | 681,919 | | $ | 6.39 |
| 2007 | | 16 | | 606,264 | | $ | 6.48 |
| 2008 | | 15 | | 357,214 | | $ | 10.51 |
| 2009 | | 17 | | 652,637 | | $ | 6.97 |
| 2010 | | 19 | | 706,068 | | $ | 9.83 |
| 2011 | | 7 | | 366,209 | | $ | 11.81 |
| 2012 | | 8 | | 396,764 | | $ | 8.91 |
| 2013 | | 12 | | 354,507 | | $ | 10.04 |
| 2014 | | 10 | | 374,697 | | $ | 8.34 |
| 2015 and Thereafter | | 35 | | 1,881,570 | | $ | 9.79 |
- (1)
- Does not consider the impact of options to renew that may be contained in leases.
23
SIMON PROPERTY GROUP
Top Regional Mall Tenants—U.S. Portfolio
As of December 31, 2003
(Square Feet in 000's)
Top 15 In-Line Retail Tenants (sorted by percentage of total base minimum rent)
Tenant
| | Number
of
Stores
| | Square
Feet
| | Percent of
Total
Sq. Ft.
| | Percent of
Total Base
Min. Rent
| |
|---|
| Limited Brands, Inc. | | 583 | | 3,637 | | 1.9 | % | 4.6 | % |
| The Gap, Inc. | | 365 | | 3,773 | | 2.0 | % | 3.2 | % |
| Foot Locker, Inc. | | 396 | | 1,596 | | 0.8 | % | 2.2 | % |
| Zale Corporation | | 434 | | 487 | | 0.3 | % | 1.8 | % |
| Abercrombie & Fitch Co. | | 137 | | 1,017 | | 0.5 | % | 1.3 | % |
| Luxottica Group S.P.A | | 367 | | 644 | | 0.3 | % | 1.3 | % |
| Sterling Jewelers, Inc. | | 204 | | 290 | | 0.2 | % | 1.1 | % |
| Hallmark Cards, Inc. | | 215 | | 710 | | 0.4 | % | 0.9 | % |
| Trans World Entertainment Corp. | | 118 | | 726 | | 0.4 | % | 0.9 | % |
| American Eagle Outfitters, Inc. | | 129 | | 667 | | 0.4 | % | 0.9 | % |
| The Musicland Group, Inc. | | 144 | | 598 | | 0.3 | % | 0.9 | % |
| Retail Brand Alliance, Inc. | | 105 | | 576 | | 0.3 | % | 0.8 | % |
| Williams-Sonoma Stores, Inc. | | 87 | | 597 | | 0.3 | % | 0.8 | % |
| The Wet Seal, Inc. | | 139 | | 532 | | 0.3 | % | 0.8 | % |
| Ann Taylor, Inc. | | 89 | | 487 | | 0.3 | % | 0.8 | % |
Top 15 Anchors (sorted by percentage of total square footage)
Tenant
| | Number
of
Stores
| | Square
Feet
| | Percent of
Total
Sq. Ft.
| | Percent of
Total Base
Min. Rent
| |
|---|
| Sears Roebuck & Co. | | 135 | | 20,615 | | 10.8 | % | 0.5 | % |
| Federated Department Stores | | 100 | | 19,382 | | 10.2 | % | 0.7 | % |
| J.C. Penney Co., Inc. | | 117 | | 16,861 | | 8.9 | % | 1.0 | % |
| The May Department Stores | | 93 | | 13,786 | | 7.3 | % | 0.2 | % |
| Dillard's Department Stores | | 82 | | 12,094 | | 6.4 | % | 0.2 | % |
| Saks Incorporated | | 41 | | 4,758 | | 2.5 | % | 1.1 | % |
| Nordstrom, Inc. | | 19 | | 3,485 | | 1.8 | % | 0.1 | % |
| Target Corporation | | 26 | | 3,118 | | 1.6 | % | 0.1 | % |
| Belk, Inc. | | 15 | | 1,747 | | 0.9 | % | 0.1 | % |
| The Neiman Marcus Group, Inc. | | 7 | | 926 | | 0.5 | % | 0.1 | % |
| Kohl's Department Stores | | 6 | | 562 | | 0.3 | % | 0.0 | % |
| Von Maur, Inc. | | 7 | | 592 | | 0.3 | % | 0.0 | % |
| Boscov's Department Stores, Inc. | | 3 | | 521 | | 0.3 | % | 0.1 | % |
| The Bon-Ton Stores, Inc. | | 6 | | 497 | | 0.3 | % | 0.1 | % |
| Burlington Coat Factory, Inc. | | 3 | | 314 | | 0.2 | % | 0.1 | % |
24
SIMON PROPERTY GROUP
2003 Regional Mall Anchor/Big Box Openings—U.S. Portfolio
Property Name
| | Location
| | New
Tenant
| | Former
Tenant
|
|---|
Barton Creek Square |
|
Austin, TX |
|
Nordstrom |
|
Montgomery Ward |
Bay Park Square |
|
Green Bay, WI |
|
Younkers |
|
Montgomery Ward |
Century III Mall |
|
Pittsburgh, PA |
|
Steve & Barry's |
|
TJ Maxx |
Fashion Mall at Keystone |
|
Indianapolis, IN |
|
Saks Fifth Avenue |
|
Jacobson's |
Greendale Mall |
|
Worchester, MA |
|
Family Fitness |
|
Lechmere |
The Galleria |
|
Houston, TX |
|
Nordstrom
Foley's |
|
—
— |
Lenox Square |
|
Atlanta, GA |
|
Bloomingdale's |
|
Macy's |
Lincolnwood Town Center |
|
Lincolnwood, IL |
|
Kohl's |
|
JCPenney |
Menlo Park Mall |
|
Edison, NJ |
|
Cheesecake Factory
Barnes & Noble
Benihana |
|
—
—
— |
NorthPark Mall |
|
Davenport, IA |
|
Dillard's |
|
Montgomery Ward |
Prien Lake Mall |
|
Lake Charles, LA |
|
Foley's |
|
Montgomery Ward |
Roosevelt Field Mall |
|
Garden City, NY |
|
Galyan's |
|
Stern's |
Square One Mall |
|
Saugus, MA |
|
Best Buy
Gold's Gym |
|
Service Merchandise
Service Merchandise |
Southern Hills Mall |
|
Sioux City, IA |
|
Sheel's Sporting Goods |
|
— |
St. Charles Towne Center |
|
Waldorf, MD |
|
Dick's Sporting Goods |
|
Montgomery Ward |
Town Center at Cobb |
|
Kennesaw, GA |
|
Rich's Furniture |
|
Macy's |
Towne West Square |
|
Wichita, KS |
|
Dick's Sporting Goods |
|
Service Merchandise |
Walt Whitman Mall |
|
Huntington Station, NY |
|
Organized Living |
|
RKO Theater |
25
SIMON PROPERTY GROUP
2004 Projected Regional Mall Anchor/Big Box Openings—U.S. Portfolio
Property Name
| | Location
| | New
Tenant
| | Former
Tenant
|
|---|
Bangor Mall |
|
Bangor, ME |
|
Dick's Sporting Goods |
|
Porteus |
Battlefield Mall |
|
Springfield, MO |
|
Steve & Barry's |
|
Battlefield Cinema |
College Mall |
|
Bloomington, IN |
|
Target |
|
JCPenney |
Cordova Mall |
|
Pensacola, FL |
|
Cost Plus World Market |
|
Montgomery Ward |
Dadeland Mall |
|
Miami, FL |
|
Nordstrom |
|
Lord & Taylor |
Greenwood Park Mall |
|
Greenwood, IN |
|
Dick's Sporting Goods |
|
Service Merchandise |
Gulfview Square |
|
New Port Richey, FL |
|
Best Buy
Linens N' Things |
|
Dillard's
Dillard's |
Irving Mall |
|
Irving, TX |
|
Burlington Coat Factory
Circuit City |
|
JCPenney
Food court & small shops |
North East Mall |
|
Hurst, TX |
|
Rave Theater |
|
Montgomery Ward |
Prien Lakes Mall |
|
Lake Charles, LA |
|
Cinemark Theater |
|
White House |
Rolling Oaks |
|
San Antonio, TX |
|
JCPenney
San Antonio Skate Park |
|
—
Regal Cinema |
Roosevelt Field |
|
Garden City, NY |
|
Bloomingdale's Furniture
and Bedding |
|
Stern's |
Southern Hills Mall |
|
Sioux City, IA |
|
JCPenney |
|
— |
SouthPark Mall |
|
Moline, IL |
|
Dillard's |
|
Montgomery Ward |
SouthPark Mall |
|
Charlotte, NC |
|
Nordstrom
Galyan's |
|
—
Sears |
Sunland Mall |
|
El Paso, TX |
|
Foley's |
|
JCPenney |
Tippecanoe Mall |
|
Lafayette, IN |
|
Dick's Sporting Goods
H.H. Gregg |
|
Lazarus
Lazarus |
Washington Square |
|
Indianapolis, IN |
|
Burlington Coat Factory
Kerasotes Theater |
|
JCPenney
— |
White Oaks Mall |
|
Springfield, IL |
|
Dick's Sporting Goods |
|
Montgomery Ward |
26
SIMON PROPERTY GROUP
2005 Projected Regional Mall Anchor/Big Box Openings—U.S. Portfolio
Property Name
| | Location
| | New
Tenant
| | Former
Tenant
|
|---|
College Mall |
|
Bloomington, IN |
|
Dick's Sporting Goods |
|
Lazarus |
Phipps Plaza |
|
Atlanta, GA |
|
Nordstrom |
|
Lord & Taylor |
Town Center at Boca Raton |
|
Boca Raton, FL |
|
Neiman Marcus |
|
Lord & Taylor |
Washington Square |
|
Indianapolis, IN |
|
Dick's Sporting Goods |
|
Lazarus |
27
SIMON PROPERTY GROUP
Property Listing—North American Assets
As of December 31, 2003
| |
| |
| |
| | Gross Leasable Area
| |
|---|
Property Name
| | State
| | City
| | Legal
Ownership
| | Total
| | Anchor
| | Mall & Freestanding
| |
|---|
| UNITED STATES: | | | | | | | | | | | | | |
| Regional Malls | | | | | | | | | | | | | |
| McCain Mall | | AR | | N. Little Rock | | 100.0 | % | 776,462 | | 554,156 | | 222,306 | |
| University Mall | | AR | | Little Rock | | 100.0 | % | 565,953 | | 412,761 | | 153,192 | |
Metrocenter |
|
AZ |
|
Phoenix |
|
50.0 |
% |
1,391,855 |
|
876,027 |
|
515,828 |
|
| Southgate Mall | | AZ | | Yuma | | 100.0 | % | 321,574 | | 252,264 | | 69,310 | |
Brea Mall |
|
CA |
|
Brea |
|
100.0 |
% |
1,315,928 |
|
874,802 |
|
441,126 |
|
| Fashion Valley Mall | | CA | | San Diego | | 50.0 | % | 1,707,218 | | 1,053,305 | | 653,913 | |
| Laguna Hills Mall | | CA | | Laguna Hills
(Orange County) | | 100.0 | % | 867,633 | | 536,500 | | 331,133 | |
| Santa Rosa Plaza | | CA | | Santa Rosa | | 100.0 | % | 698,745 | | 428,258 | | 270,487 | |
| Shops at Mission Viejo | | CA | | Mission Viejo
(Orange County) | | 100.0 | % | 1,149,914 | | 677,215 | | 472,699 | |
| Westminster Mall | | CA | | Westminster
(Orange County) | | 100.0 | % | 1,220,472 | | 716,939 | | 503,533 | |
| Stanford Shopping Center | | CA | | Palo Alto (San Francisco) | | 100.0 | % | 1,371,612 | | 849,153 | | 522,459 | |
Aurora Mall |
|
CO |
|
Aurora (Denver) |
|
100.0 |
% |
1,014,396 |
|
566,015 |
|
448,381 |
|
| Mesa Mall | | CO | | Grand Junction | | 50.0 | % | 861,558 | | 425,817 | | 435,741 | |
Crystal Mall |
|
CT |
|
Waterford |
|
74.6 |
% |
793,736 |
|
442,311 |
|
351,425 |
|
Aventura Mall |
|
FL |
|
Miami Beach |
|
33.3 |
% |
1,904,049 |
|
1,242,098 |
|
661,951 |
|
| Avenues, The | | FL | | Jacksonville | | 25.0% | (9) | 1,117,299 | | 754,956 | | 362,343 | |
| Boynton Beach Mall | | FL | | Boynton Beach | | 100.0 | % | 1,183,725 | | 883,720 | | 300,005 | |
| Coral Square | | FL | | Coral Springs
(Miami-Ft. Lauderdale) | | 97.2 | % | 944,763 | | 648,144 | | 296,619 | |
| Cordova Mall | | FL | | Pensacola | | 100.0 | % | 833,826 | | 488,263 | | 345,563 | |
| Crystal River Mall | | FL | | Crystal River | | 100.0 | % | 424,293 | | 302,495 | | 121,798 | |
| Dadeland Mall | | FL | | N. Miami Beach | | 50.0 | % | 1,396,476 | | 1,062,072 | | 334,404 | |
| DeSoto Square | | FL | | Bradenton | | 100.0 | % | 691,243 | | 435,467 | | 255,776 | |
| Edison Mall | | FL | | Fort Myers | | 100.0 | % | 1,042,072 | | 742,667 | | 299,405 | |
| Florida Mall, The | | FL | | Orlando | | 50.0 | % | 1,847,663 | | 1,232,416 | | 615,247 | |
| Gulf View Square | | FL | | Port Richey (Tampa-St. Pete) | | 100.0 | % | 695,864 | | 461,852 | | 234,012 | |
| Indian River Mall | | FL | | Vero Beach | | 50.0 | % | 748,008 | | 445,552 | | 302,456 | |
| Lake Square Mall | | FL | | Leesburg | | 50.0 | % | 560,967 | | 296,037 | | 264,930 | |
| Melbourne Square | | FL | | Melbourne | | 100.0 | % | 729,409 | | 471,173 | | 258,236 | |
| Miami International Mall | | FL | | S. Miami | | 47.8 | % | 1,074,099 | | 783,308 | | 290,791 | |
| Orange Park Mall | | FL | | Orange Park | | 100.0 | % | 924,355 | | 534,180 | | 390,175 | |
| Paddock Mall | | FL | | Ocala | | 100.0 | % | 560,164 | | 387,378 | | 172,786 | |
| Palm Beach Mall | | FL | | West Palm Beach | | 100.0 | % | 1,085,229 | | 749,288 | | 335,941 | |
| Port Charlotte Town Center | | FL | | Port Charlotte | | 80.0% | (5) | 780,482 | | 458,554 | | 321,928 | |
| Seminole Towne Center | | FL | | Sanford | | 45.0% | (9) | 1,153,600 | | 768,798 | | 384,802 | |
| The Shops @ Sunset Place | | FL | | Miami | | 37.5 | % | 500,143 | | — | | 500,143 | |
| Town Center at Boca Raton | | FL | | Boca Raton | | 100.0 | % | 1,555,323 | | 1,061,076 | | 494,247 | |
| Treasure Coast Square | | FL | | Jensen Beach | | 100.0 | % | 869,569 | | 511,372 | | 358,197 | |
| Tyrone Square | | FL | | St. Petersburg
(Tampa-St. Pete) | | 100.0 | % | 1,128,281 | | 748,269 | | 380,012 | |
| University Mall | | FL | | Pensacola | | 100.0 | % | 707,028 | | 478,449 | | 228,579 | |
Gwinnett Place |
|
GA |
|
Duluth (Atlanta) |
|
50.0 |
% |
1,277,180 |
|
843,609 |
|
433,571 |
|
| Lenox Square | | GA | | Atlanta | | 100.0 | % | 1,484,223 | | 821,356 | | 662,867 | |
| Mall of Georgia | | GA | | Mill Creek (Atlanta) | | 50.0% | (10) | 1,785,171 | | 989,590 | | 795,581 | |
| Northlake Mall | | GA | | Atlanta | | 100.0 | % | 962,147 | | 665,745 | | 296,402 | |
| Phipps Plaza | | GA | | Atlanta | | 100.0 | % | 821,316 | | 472,385 | | 348,931 | |
| Town Center at Cobb | | GA | | Kennesaw (Atlanta) | | 50.0 | % | 1,272,453 | | 851,346 | | 421,107 | |
Lindale Mall |
|
IA |
|
Cedar Rapids |
|
50.0 |
% |
690,955 |
|
305,563 |
|
385,392 |
|
| NorthPark Mall | | IA | | Davenport | | 50.0 | % | 1,077,953 | | 651,533 | | 426,420 | |
| Southern Hills Mall | | IA | | Sioux City | | 50.0 | % | 801,556 | | 372,937 | | 428,619 | |
| SouthRidge Mall | | IA | | Des Moines | | 50.0 | % | 1,002,538 | | 497,806 | | 504,732 | |
Alton Square |
|
IL |
|
Alton (St. Louis) |
|
100.0 |
% |
639,061 |
|
426,315 |
|
212,746 |
|
| Lincolnwood Town Center | | IL | | Lincolnwood (Chicago) | | 100.0 | % | 421,875 | | 220,830 | | 201,045 | |
| Northfield Square Mall | | IL | | Bourbonnais (Chicago) | | 31.6% | (10) | 558,369 | | 310,994 | | 247,375 | |
| Northwoods Mall | | IL | | Peoria | | 100.0 | % | 695,384 | | 472,969 | | 222,415 | |
28
| Orland Square | | IL | | Orland Park (Chicago) | | 100.0 | % | 1,206,943 | | 773,295 | | 433,648 | |
| River Oaks Center | | IL | | Calumet City (Chicago) | | 100.0 | % | 1,378,811 | | 834,588 | | 544,223 | (1) |
| SouthPark Mall | | IL | | Moline | | 50.0 | % | 1,026,053 | | 578,056 | | 447,997 | |
| White Oaks Mall | | IL | | Springfield | | 77.5 | % | 949,205 | | 601,708 | | 347,497 | |
Castleton Square |
|
IN |
|
Indianapolis |
|
100.0 |
% |
1,472,185 |
|
1,105,913 |
|
366,272 |
|
| Circle Centre | | IN | | Indianapolis | | 14.7 | % | 791,116 | | 350,000 | | 441,116 | |
| College Mall | | IN | | Bloomington | | 100.0 | % | 705,772 | | 439,766 | | 266,006 | |
| Eastland Mall | | IN | | Evansville | | 50.0 | % | 898,601 | | 532,955 | | 365,646 | |
| Fashion Mall at Keystone | | IN | | Indianapolis | | 100.0 | % | 658,399 | | 249,721 | | 408,678 | (1) |
| Greenwood Park Mall | | IN | | Greenwood | | 100.0 | % | 1,311,639 | | 898,928 | | 412,711 | |
| Lafayette Square | | IN | | Indianapolis | | 100.0 | % | 1,209,314 | | 937,223 | | 272,091 | |
| Markland Mall | | IN | | Kokomo | | 100.0 | % | 413,164 | | 273,094 | | 140,070 | |
| Muncie Mall | | IN | | Muncie | | 100.0 | % | 654,742 | | 435,756 | | 218,986 | |
| Tippecanoe Mall | | IN | | Lafayette | | 100.0 | % | 859,526 | | 568,373 | | 291,153 | |
| University Park Mall | | IN | | Mishawaka | | 60.0 | % | 942,823 | | 622,508 | | 320,315 | |
| Washington Square | | IN | | Indianapolis | | 100.0 | % | 1,014,238 | | 706,174 | | 308,064 | |
Hutchinson Mall |
|
KS |
|
Hutchinson |
|
100.0 |
% |
525,368 |
|
277,665 |
|
247,703 |
|
| Towne East Square | | KS | | Wichita | | 100.0 | % | 1,179,109 | | 779,490 | | 399,619 | |
| Towne West Square | | KS | | Wichita | | 100.0 | % | 955,331 | | 619,269 | | 336,062 | |
| West Ridge Mall | | KS | | Topeka | | 100.0 | % | 1,026,813 | | 716,811 | | 310,002 | |
Prien Lake Mall |
|
LA |
|
Lake Charles |
|
100.0 |
% |
810,693 |
|
631,762 |
|
178,931 |
|
Arsenal Mall |
|
MA |
|
Watertown (Boston) |
|
100.0 |
% |
501,871 |
|
191,395 |
|
310,476 |
(1) |
| Atrium Mall | | MA | | Chestnut Hill (Boston) | | 49.1 | % | 205,477 | | — | | 205,477 | |
| Auburn Mall | | MA | | Auburn (Boston) | | 49.1 | % | 592,252 | | 417,620 | | 174,632 | |
| Burlington Mall | | MA | | Burlington (Boston) | | 100.0 | % | 1,254,083 | | 836,236 | | 417,847 | |
| Cape Cod Mall | | MA | | Hyannis | | 49.1 | % | 723,773 | | 420,199 | | 303,574 | |
| Emerald Square | | MA | | North Attleboro | | 49.1 | % | 1,022,521 | | 647,372 | | 375,149 | |
| Greendale Mall | | MA | | Worcester (Boston) | | 49.1 | % | 431,296 | | 132,634 | | 298,662 | (1) |
| Liberty Tree Mall | | MA | | Danvers (Boston) | | 49.1 | % | 857,018 | | 498,000 | | 359,018 | |
| Mall at Chestnut Hill, The | | MA | | Newton (Boston) | | 47.2 | % | 478,185 | | 297,253 | | 180,932 | |
| Northshore Mall | | MA | | Peabody (Boston) | | 49.1 | % | 1,684,718 | | 989,277 | | 695,441 | |
| Solomon Pond Mall | | MA | | Marlborough (Boston) | | 49.1 | % | 912,597 | | 538,843 | | 373,754 | |
| South Shore Plaza | | MA | | Braintree (Boston) | | 100.0 | % | 1,461,640 | | 847,603 | | 614,037 | |
| Square One Mall | | MA | | Saugus (Boston) | | 49.1 | % | 864,694 | | 540,101 | | 324,593 | |
Bangor Mall |
|
ME |
|
Bangor |
|
32.6% |
(6) |
653,882 |
|
417,757 |
|
236,125 |
|
Bowie Town Center |
|
MD |
|
Bowie (Washington, DC) |
|
100.0 |
% |
664,251 |
|
338,567 |
|
325,684 |
|
| St. Charles Towne Center | | MD | | Waldorf (Washington, D.C.) | | 100.0 | % | 985,609 | | 631,602 | | 354,007 | |
Mall of America |
|
MN |
|
Bloomington
(Minneapolis-St. Paul) |
|
27.5% |
(4) |
2,779,242 |
|
1,220,305 |
|
1,558,937 |
|
| Maplewood Mall | | MN | | Minneapolis | | 100.0 | % | 908,397 | | 578,060 | | 330,337 | |
| Miller Hill Mall | | MN | | Duluth | | 100.0 | % | 805,419 | | 429,508 | | 375,911 | |
Battlefield Mall |
|
MO |
|
Springfield |
|
100.0 |
% |
1,175,968 |
|
770,111 |
|
405,857 |
|
| Independence Center | | MO | | Independence (Kansas City) | | 100.0 | % | 1,022,056 | | 499,284 | | 522,772 | |
Biltmore Square |
|
NC |
|
Asheville |
|
100.0 |
% |
493,948 |
|
242,576 |
|
251,372 |
|
| SouthPark Mall | | NC | | Charlotte | | 100.0 | % | 1,189,358 | | 857,254 | | 332,104 | |
Crossroads Mall |
|
NE |
|
Omaha |
|
100.0 |
% |
858,583 |
|
609,669 |
|
248,914 |
|
Mall at Rockingham Park |
|
NH |
|
Salem (Boston) |
|
24.6 |
% |
1,020,221 |
|
638,111 |
|
382,110 |
|
| Mall of New Hampshire | | NH | | Manchester (Boston) | | 49.1 | % | 806,494 | | 444,889 | | 361,605 | |
| Pheasant Lane Mall | | NH | | Nashua (Boston) | | 100.0% | (8) | 988,894 | | 675,759 | | 313,135 | |
Brunswick Square |
|
NJ |
|
East Brunswick (New York) |
|
100.0 |
% |
772,981 |
|
467,626 |
|
305,355 |
|
| Livingston Mall | | NJ | | Livingston (New York) | | 100.0 | % | 985,577 | | 616,128 | | 369,449 | |
| Menlo Park Mall | | NJ | | Edison (New York) | | 100.0 | % | 1,283,702 | | 527,591 | | 756,111 | (1) |
| Ocean County Mall | | NJ | | Toms River (New York) | | 100.0 | % | 897,001 | | 620,755 | | 276,246 | |
| Quaker Bridge Mall | | NJ | | Lawrenceville | | 39.6% | (6) | 1,109,807 | | 686,760 | | 423,047 | |
| Rockaway Townsquare | | NJ | | Rockaway (New York) | | 100.0 | % | 1,248,323 | | 786,626 | | 461,697 | |
Cottonwood Mall |
|
NM |
|
Albuquerque |
|
100.0 |
% |
1,041,299 |
|
631,556 |
|
409,743 |
|
Forum Shops at Caesars |
|
NV |
|
Las Vegas |
|
100.0 |
% |
483,838 |
|
— |
|
483,838 |
|
| Las Vegas Premium Outlet | | NV | | Las Vegas | | 50.0 | % | 432,478 | | — | | 432,478 | |
Chautauqua Mall |
|
NY |
|
Lakewood |
|
100.0 |
% |
432,334 |
|
213,320 |
|
219,014 |
|
29
Jefferson Valley Mall |
|
NY |
|
Yorktown Heights
(New York) |
|
100.0 |
% |
587,150 |
|
310,095 |
|
277,055 |
|
| Nanuet Mall | | NY | | Nanuet (New York) | | 100.0 | % | 915,626 | | 583,711 | | 331,915 | |
| Roosevelt Field | | NY | | Garden City (New York) | | 100.0 | % | 2,180,526 | | 1,430,425 | | 750,101 | |
| Smith Haven Mall | | NY | | Lake Grove (New York) | | 25.0 | % | 1,357,995 | | 902,595 | | 455,400 | |
| Source, The | | NY | | Westbury (New York) | | 25.5 | % | 729,152 | | 210,798 | | 518,354 | |
| Walt Whitman Mall | | NY | | Huntington Station
(New York) | | 100.0 | % | 1,034,747 | | 742,214 | | 292,533 | |
| Westchester, The | | NY | | White Plains (New York) | | 40.0 | % | 824,419 | | 349,393 | | 475,026 | |
Great Lakes Mall |
|
OH |
|
Mentor (Cleveland) |
|
100.0 |
% |
1,301,340 |
|
879,300 |
|
422,040 |
|
| Lima Mall | | OH | | Lima | | 100.0 | % | 745,099 | | 541,861 | | 203,238 | |
| Richmond Town Square | | OH | | Richmond Heights (Cleveland) | | 100.0 | % | 1,016,777 | | 685,251 | | 331,526 | |
| Southern Park Mall | | OH | | Boardman | | 100.0 | % | 1,197,780 | | 811,858 | | 385,922 | |
| Summit Mall | | OH | | Akron (Cleveland) | | 100.0 | % | 764,233 | | 432,936 | | 331,297 | |
| Upper Valley Mall | | OH | | Springfield | | 100.0 | % | 750,550 | | 479,418 | | 271,132 | |
| Woodville Mall | | OH | | Northwood | | 100.0 | % | 773,405 | | 518,792 | | 254,613 | |
Eastland Mall |
|
OK |
|
Tulsa |
|
100.0 |
% |
482,898 |
|
305,732 |
|
177,166 |
|
| Heritage Park Mall | | OK | | Midwest City | | 100.0 | % | 606,339 | | 382,700 | | 223,639 | |
| Penn Square Mall | | OK | | Oklahoma City | | 94.5 | % | 1,013,392 | | 588,137 | | 425,255 | |
| Woodland Hills Mall | | OK | | Tulsa | | 47.2 | % | 1,092,295 | | 709,447 | | 382,848 | |
Century III Mall |
|
PA |
|
West Mifflin (Pittsburgh) |
|
100.0 |
% |
1,280,995 |
|
773,439 |
|
507,556 |
|
| Cheltenham Square | | PA | | Philadelphia | | 100.0 | % | 639,253 | | 368,266 | | 270,987 | |
| Granite Run Mall | | PA | | Media (Philadelphia) | | 50.0 | % | 1,047,167 | | 500,809 | | 546,358 | |
| Court & Plaza at King of Prussia, The | | PA | | King of Prussia | | 12.9% | (6) | 2,850,627 | | 1,775,871 | | 1,074,756 | (1) |
| Lehigh Valley Mall | | PA | | Whitehall | | 25.2% | (7) | 1,067,261 | | 564,353 | | 502,908 | (1) |
| Montgomery Mall | | PA | | Montgomeryville | | 23.1% | (6) | 1,120,395 | | 684,855 | | 435,540 | |
| Oxford Valley Mall | | PA | | Langhorne | | 65.8% | (6) | 1,272,232 | | 762,558 | | 509,674 | (1) |
| Ross Park Mall | | PA | | Pittsburgh | | 100.0 | % | 1,234,598 | | 827,015 | | 407,583 | |
| South Hills Village | | PA | | Pittsburgh | | 100.0 | % | 1,110,020 | | 655,987 | | 454,033 | |
Anderson Mall |
|
SC |
|
Anderson |
|
100.0 |
% |
616,731 |
|
404,394 |
|
212,337 |
|
| Haywood Mall | | SC | | Greenville | | 100.0 | % | 1,243,604 | | 913,633 | | 329,971 | |
Empire Mall |
|
SD |
|
Sioux Falls |
|
50.0 |
% |
1,047,283 |
|
497,341 |
|
549,942 |
|
| Rushmore Mall | | SD | | Rapid City | | 50.0 | % | 835,608 | | 470,660 | | 364,948 | |
Knoxville Center |
|
TN |
|
Knoxville |
|
100.0 |
% |
978,567 |
|
597,028 |
|
381,539 |
|
| Oak Court Mall | | TN | | Memphis | | 100.0 | % | 853,375 | | 535,000 | | 318,375 | (1) |
| Raleigh Springs Mall | | TN | | Memphis | | 100.0 | % | 917,599 | | 691,230 | | 226,369 | |
| West Town Mall | | TN | | Knoxville | | 50.1 | % | 1,329,002 | | 878,311 | | 450,691 | |
| Wolfchase Galleria | | TN | | Memphis | | 94.5 | % | 1,268,101 | | 761,648 | | 506,453 | |
Barton Creek Square |
|
TX |
|
Austin |
|
100.0 |
% |
1,429,514 |
|
922,266 |
|
507,248 |
|
| Broadway Square | | TX | | Tyler | | 100.0 | % | 618,741 | | 427,730 | | 191,011 | |
| Cielo Vista Mall | | TX | | El Paso | | 100.0 | % | 1,192,778 | | 793,716 | | 399,062 | |
| Highland Mall | | TX | | Austin | | 50.0 | % | 1,090,685 | | 732,000 | | 358,685 | |
| The Galleria | | TX | | Houston | | 31.5 | % | 2,404,812 | | 1,300,466 | | 1,104,346 | |
| Ingram Park Mall | | TX | | San Antonio | | 100.0 | % | 1,129,240 | | 751,704 | | 377,536 | |
| Irving Mall | | TX | | Irving (Dallas-Ft. Worth) | | 100.0 | % | 1,103,141 | | 726,574 | | 376,567 | |
| La Plaza Mall | | TX | | McAllen | | 100.0 | % | 1,205,519 | | 778,768 | | 426,751 | |
| Lakeline Mall | | TX | | Austin | | 100.0 | % | 1,100,371 | | 745,179 | | 355,192 | |
| Longview Mall | | TX | | Longview | | 100.0 | % | 612,955 | | 402,843 | | 210,112 | |
| Midland Park Mall | | TX | | Midland | | 100.0 | % | 618,093 | | 339,113 | | 278,980 | |
| North East Mall | | TX | | Hurst (Dallas-Ft. Worth) | | 100.0 | % | 1,551,872 | | 1,194,589 | | 357,283 | |
| Richardson Square Mall | | TX | | Richardson
(Dallas-Ft. Worth) | | 100.0 | % | 755,336 | | 471,436 | | 283,900 | |
| Rolling Oaks Mall | | TX | | San Antonio | | 100.0 | % | 737,169 | | 460,857 | | 276,312 | |
| Sunland Park Mall | | TX | | El Paso | | 100.0 | % | 917,968 | | 575,837 | | 342,131 | |
| Valle Vista Mall | | TX | | Harlingen | | 100.0 | % | 656,360 | | 389,781 | | 266,579 | |
Trolley Square |
|
UT |
|
Salt Lake City |
|
90.0 |
% |
221,863 |
|
— |
|
221,863 |
|
Apple Blossom Mall |
|
VA |
|
Winchester |
|
49.1 |
% |
443,425 |
|
229,011 |
|
214,414 |
|
| Charlottesville Fashion Square | | VA | | Charlottesville | | 100.0 | % | 572,441 | | 381,153 | | 191,288 | |
| Chesapeake Square | | VA | | Chesapeake | | 75.0% | (10) | 809,319 | | 537,279 | | 272,040 | |
| Valley Mall | | VA | | Harrisonburg | | 50.0 | % | 487,429 | | 307,798 | | 179,631 | |
| Virginia Center Commons | | VA | | Glen Allen | | 100.0 | % | 787,494 | | 506,639 | | 280,855 | |
Columbia Center |
|
WA |
|
Kennewick |
|
100.0 |
% |
741,605 |
|
408,052 |
|
333,553 |
|
| Northgate Mall | | WA | | Seattle | | 100.0 | % | 997,264 | | 688,391 | | 308,873 | |
30
| Tacoma Mall | | WA | | Tacoma | | 100.0 | % | 1,294,464 | | 924,045 | | 370,419 | |
Bay Park Square |
|
WI |
|
Green Bay |
|
100.0 |
% |
715,790 |
|
447,508 |
|
268,282 |
|
| Forest Mall | | WI | | Fond Du Lac | | 100.0 | % | 501,254 | | 327,260 | | 173,994 | |
| (174 properties) | | | | | | | | | | | | | |
Community Centers |
|
|
|
|
|
|
|
|
|
|
|
|
|
| Plaza at Buckland Hills | | CT | | Manchester | | 35.0% | (9) | 334,487 | | 252,179 | | 82,308 | |
Gaitway Plaza |
|
FL |
|
Ocala |
|
23.3% |
(9) |
216,355 |
|
123,027 |
|
93,328 |
|
| Grove @ Lakeland Square | | FL | | Lakeland | | 100.0 | % | 215,591 | | 142,317 | | 73,274 | |
| Highland Lakes Center | | FL | | Orlando | | 100.0 | % | 478,080 | | 372,316 | | 105,764 | |
| Indian River Commons | | FL | | Vero Beach | | 50.0 | % | 260,868 | | 233,358 | | 27,510 | |
| Royal Eagle Plaza | | FL | | Coral Springs | | 35.0% | (9) | 199,122 | | 124,479 | | 74,643 | |
| Terrace @ the Florida Mall | | FL | | Orlando | | 100.0 | % | 328,977 | | 281,446 | | 47,531 | |
| Waterford Lakes Town Ctr | | FL | | Orlando | | 100.0 | % | 951,803 | | 622,244 | | 329,559 | |
| West Town Corners | | FL | | Altamonte Springs | | 23.3% | (9) | 385,067 | | 263,782 | | 121,285 | |
| Westland Park Plaza | | FL | | Orange Park | | 23.3% | (9) | 163,154 | | 123,548 | | 39,606 | |
Mall of Georgia Crossing |
|
GA |
|
Mill Creek |
|
50.0 |
% |
440,612 |
|
341,503 |
|
99,109 |
|
Bloomingdale Court |
|
IL |
|
Bloomingdale |
|
100.0 |
% |
604,511 |
|
436,255 |
|
168,256 |
|
| Bridgeview Court | | IL | | Bridgeview | | 100.0 | % | 273,678 | | 216,491 | | 57,187 | |
| Countryside Plaza | | IL | | Countryside | | 100.0 | % | 435,608 | | 290,216 | | 145,392 | |
| Crystal Court | | IL | | Crystal Lake | | 35.0% | (9) | 278,971 | | 201,993 | | 76,978 | |
| Forest Plaza | | IL | | Rockford | | 100.0 | % | 425,758 | | 325,170 | | 100,588 | |
| Lake Plaza | | IL | | Waukegan | | 100.0 | % | 215,462 | | 170,789 | | 44,673 | |
| Lake View Plaza | | IL | | Orland Park | | 100.0 | % | 371,480 | | 270,628 | | 100,852 | |
| Lincoln Crossing | | IL | | O'Fallon | | 100.0 | % | 148,381 | | 134,935 | | 13,446 | |
| Matteson Plaza | | IL | | Matteson | | 100.0 | % | 275,455 | | 230,885 | | 44,570 | |
| North Ridge Plaza | | IL | | Joliet | | 100.0 | % | 305,070 | | 190,323 | | 114,747 | |
| White Oaks Plaza | | IL | | Springfield | | 100.0 | % | 391,426 | | 275,703 | | 115,723 | |
| Willow Knolls Court | | IL | | Peoria | | 35.0% | (9) | 382,377 | | 309,440 | | 72,937 | |
| Yards Plaza, The | | IL | | Chicago | | 35.0% | (9) | 265,420 | | 228,813 | | 36,607 | |
Brightwood Plaza |
|
IN |
|
Indianapolis |
|
100.0 |
% |
38,493 |
|
— |
|
38,493 |
|
| Eastland Convenience Ctr. | | IN | | Evansville | | 50.0 | % | 175,639 | | 60,000 | | 115,639 | |
| Greenwood Plus | | IN | | Greenwood | | 100.0 | % | 159,931 | | 134,141 | | 25,790 | |
| Griffith Park Plaza | | IN | | Griffith | | 100.0 | % | 274,235 | | 175,595 | | 98,640 | |
| Keystone Shoppes | | IN | | Indianapolis | | 100.0 | % | 29,140 | | — | | 29,140 | |
| Markland Plaza | | IN | | Kokomo | | 100.0 | % | 91,227 | | 49,552 | | 41,675 | |
| Muncie Plaza | | IN | | Muncie | | 100.0 | % | 298,851 | | 271,656 | | 27,195 | |
| New Castle Plaza | | IN | | New Castle | | 100.0 | % | 91,648 | | 24,912 | | 66,736 | |
| Northwood Plaza | | IN | | Fort Wayne | | 100.0 | % | 170,869 | | 99,028 | | 71,841 | |
| Teal Plaza | | IN | | Lafayette | | 100.0 | % | 101,087 | | 98,337 | | 2,750 | |
| Tippecanoe Plaza | | IN | | Lafayette | | 100.0 | % | 94,598 | | 85,811 | | 8,787 | |
| University Center | | IN | | Mishawaka | | 60.0 | % | 150,536 | | 104,359 | | 46,177 | |
| Village Park Plaza | | IN | | Carmel | | 35.0% | (9) | 543,448 | | 431,018 | | 112,430 | |
| Wabash Village | | IN | | West Lafayette | | 100.0 | % | 124,536 | | 109,388 | | 15,148 | |
| Washington Plaza | | IN | | Indianapolis | | 100.0 | % | 50,107 | | 21,500 | | 28,607 | |
West Ridge Plaza |
|
KS |
|
Topeka |
|
100.0 |
% |
237,783 |
|
182,161 |
|
55,622 |
|
Park Plaza |
|
KY |
|
Hopkinsville |
|
100.0 |
% |
115,024 |
|
82,398 |
|
32,626 |
|
St. Charles Towne Plaza |
|
MD |
|
Waldorf |
|
100.0 |
% |
405,954 |
|
292,752 |
|
113,202 |
|
Regency Plaza |
|
MO |
|
St. Charles |
|
100.0 |
% |
287,526 |
|
210,627 |
|
76,899 |
|
Ridgewood Court |
|
MS |
|
Jackson |
|
35.0% |
(9) |
240,662 |
|
185,939 |
|
54,723 |
|
Rockaway Convenience Ctr. |
|
NJ |
|
Rockaway |
|
100.0 |
% |
231,622 |
|
131,438 |
|
100,184 |
|
Cobblestone Court |
|
NY |
|
Victor |
|
35.0% |
(9) |
265,499 |
|
206,680 |
|
58,819 |
|
Boardman Plaza |
|
OH |
|
Youngstown |
|
100.0 |
% |
640,775 |
|
375,502 |
|
265,273 |
|
| Great Lakes Plaza | | OH | | Mentor | | 100.0 | % | 164,104 | | 142,229 | | 21,875 | |
| Lima Center | | OH | | Lima | | 100.0 | % | 206,878 | | 159,584 | | 47,294 | |
| Northland Plaza | | OH | | Columbus | | 100.0 | % | 209,534 | | 118,304 | | 91,230 | |
Eastland Plaza |
|
OK |
|
Tulsa |
|
100.0 |
% |
186,149 |
|
152,451 |
|
33,698 |
|
DeKalb Plaza |
|
PA |
|
King of Prussia Mall |
|
52.4% |
(6) |
101,713 |
|
81,368 |
|
20,345 |
|
| Great Northeast Plaza | | PA | | Philadelphia | | 50.0 | % | 295,758 | | 238,158 | | 57,600 | |
| Henderson Square | | PA | | King of Prussia | | 79.1% | (6) | 107,344 | | 72,683 | | 34,661 | |
| Lincoln Plaza | | PA | | King of Prussia Mall | | 65.8% | (6) | 267,231 | | 143,649 | | 123,582 | |
31
| Whitehall Mall | | PA | | Whitehall | | 39.6% | (6) | 553,721 | | 378,642 | | 175,079 | |
Charles Towne Square |
|
SC |
|
Charleston |
|
100.0 |
% |
199,693 |
|
199,693 |
|
— |
|
Empire East |
|
SD |
|
Sioux Falls |
|
50.0 |
% |
298,263 |
|
253,388 |
|
44,875 |
|
Knoxville Commons |
|
TN |
|
Knoxville |
|
100.0 |
% |
180,463 |
|
91,483 |
|
88,980 |
|
Arboretum, The |
|
TX |
|
Austin |
|
100.0 |
% |
206,511 |
|
35,773 |
|
170,738 |
|
| Celina Plaza | | TX | | El Paso | | 100.0 | % | 32,622 | | 23,927 | | 8,695 | |
| Ingram Plaza | | TX | | San Antonio | | 100.0 | % | 111,518 | | — | | 111,518 | |
| Lakeline Plaza | | TX | | Austin | | 100.0 | % | 385,748 | | 306,317 | | 79,431 | |
| Shops at North East Mall | | TX | | Hurst | | 100.0 | % | 364,584 | | 265,595 | | 98,989 | |
Chesapeake Center |
|
VA |
|
Chesapeake |
|
100.0 |
% |
299,604 |
|
213,670 |
|
85,934 |
|
| Fairfax Court | | VA | | Fairfax | | 26.3% | (9) | 249,357 | | 168,743 | | 80,614 | |
| Martinsville Plaza | | VA | | Martinsville | | 100.0 | % | 102,105 | | 60,000 | | 42,105 | |
| (67 properties) | | | | | | | | | | | | | |
Mixed-Use |
|
|
|
|
|
|
|
|
|
|
|
|
|
Copley Place |
|
MA |
|
Boston |
|
98.1 |
% |
1,214,212 |
|
104,332 |
|
1,109,880 |
(1) |
| Fashion Centre at Pentagon | | VA | | Arlington (Washington, DC) | | 42.5 | % | 987,708 | | 472,729 | | 514,979 | (1) |
| (2 properties) | | | | | | | | | | | | | |
Office |
|
|
|
|
|
|
|
|
|
|
|
|
|
| O'Hare International Center | | IL | | Rosemont | | 100.0 | % | 495,546 | | — | | 495,546 | (2) |
| Riverway | | IL | | Rosemont | | 100.0 | % | 819,201 | | — | | 819,201 | (3) |
| (2 properties) | | | | | | | | | | | | | |
| | | | | | | | |
| |
| |
| |
Total U.S. Portfolio |
|
|
|
|
|
|
|
190,014,312 |
|
117,183,895 |
|
72,830,417 |
|
CANADA: |
|
|
|
|
|
|
|
|
|
|
|
|
|
| Forum Entertainment Centre | | | | Montreal | | 35.6 | % | 246,972 | | — | | 246,972 | |
| | | | | | | | |
| |
| |
| |
Total North American Portfolio
(246 properties) | | | | | | | | 190,261,284 | | 117,183,895 | | 73,077,389 | |
| | | | | | | | |
| |
| |
| |
- *
- Regional malls generally contain two or more anchors and a wide variety of smaller stores located in enclosed malls connecting the anchors. Additional stores are usually located along the perimeter of the parking area. Community shopping centers are generally unenclosed and smaller than regional malls. Our community shopping centers generally range in size from approximately 50,000 to 600,000 square feet of GLA.
- (1)
- Office space included as follows:
Arsenal Mall—approx. 106,000 sq. ft.
Copley Place—approx. 847,000 sq. ft.
Fashion Centre at Pentagon—approx. 169,000 sq. ft.
Fashion Mall at Keystone—approx. 30,000 sq. ft.
Greendale Mall—approx. 120,000 sq. ft.
King of Prussia—approx. 14,000 sq. ft.
Lehigh Valley Mall—approx. 12,000 sq. ft.
Menlo Park Mall—approx. 50,000 sq. ft.
Oak Court Mall—approx. 130,000 sq. ft.
One Oxford Valley—approx. 111,000 sq. ft.
River Oaks Center—approx. 118,000 sq. ft.
- (2)
- Includes approximately 13,000 sq. ft. of retail space.
- (3)
- Includes approximately 24,000 sq. ft. of retail space.
- (4)
- This interest is currently subject to a constructive trust and The Operating Partnership is no longer recording income attributable to the interest.
- (5)
- The Operating Partnership receives substantially all the economic benefit of this property due to a partner preference.
- (6)
- SPG's indirect ownership interest, evidenced through an approximately 80% ownership interest in Kravco Simon Investments.
- (7)
- The ownership of the property is evidenced by The Operating Partnership's note with two of the other partners.
- (8)
- The Operating Partnership owns a mortgage note that encumbers Pheasant Lane Mall that entitles it to 100% of the economics of this property.
- (9)
- Outside partner receives substantially all the economic benefits of the property.
- (10)
- The Operating Partnership receives substantially all the economic benefits of the property.
32
Simon Property Group
Property Listing—European Assets
As of December 31, 2003
Property Name
| | City (Metropolitan area)
| | SPG
Ownership
| | Hypermarket/
Anchor GLA
| | Mall &
Freestanding
GLA
| | Total GLA
|
|---|
| |
| |
| | (in square feet)
| | (in square feet)
| | (in square feet)
|
|---|
| FRANCE | | | | | | | | | | |
| Bay 2 | | Torcy (Paris) | | 35.2 | % | 132,396 | | 408,910 | | 541,306 |
| Bel'Est | | Bagnolet (Paris) | | 12.3 | % | 150,695 | | 62,980 | | 213,675 |
| Villabe A6 | | Villabe (Paris) | | 5.3 | % | 102,257 | | 104,507 | | 206,764 |
| | | | | | |
| |
| |
|
| | Subtotal France(3) | | | | | | 385,348 | | 576,397 | | 961,745 |
ITALY |
|
|
|
|
|
|
|
|
|
|
| Ancona—Senigallia | | Senigallia (Ancona) | | 49.0 | % | 41,193 | | 41,581 | | 82,774 |
| Ascoli Piceno—Grottammare | | Grottammare (Ascoli Piceno) | | 49.0 | % | 38,901 | | 55,929 | | 94,830 |
| Ascoli Piceno—Porto Sant'Elpidio | | Porto Sant'Elpidio (Ascoli Piceno) | | 49.0 | % | 47,986 | | 114,259 | | 162,245 |
| Bari—Casamassima | | Casamassima (Bari) | | 49.0 | % | 159,015 | | 388,825 | | 547,840 |
| Brescia—Mazzano | | Mazzano (Brescia) | | 49.0% | (1) | 103,290 | | 127,359 | | 230,649 |
| Cagliari—Santa Gilla | | Cagliari | | 49.0% | (1) | 75,939 | | 114,754 | | 190,693 |
| Catania—La Rena | | Catania | | 49.0 | % | 124,065 | | 22,077 | | 146,142 |
| Milano—Rescaldina | | Rescaldina (Milano) | | 49.0 | % | 165,108 | | 212,017 | | 377,125 |
| Milano—Vimodrone | | Vimodrone (Milano) | | 49.0 | % | 110,384 | | 80,202 | | 190,586 |
| Napoli—Pompei | | Pompei (Napoli) | | 49.0 | % | 74,314 | | 17,147 | | 91,461 |
| Padova | | Padova | | 49.0 | % | 73,324 | | 32,485 | | 105,809 |
| Palermo | | Palermo | | 49.0 | % | 73,065 | | 9,849 | | 82,914 |
| Pesaro—Fano | | Fano (Pesaro) | | 49.0 | % | 56,274 | | 55,951 | | 112,225 |
| Pescara | | Pescara | | 49.0 | % | 96,337 | | 65,186 | | 161,523 |
| Pescara—Cepagatti | | Cepagatti (Pescara) | | 49.0 | % | 80,213 | | 189,617 | | 269,830 |
| Piacenza—San Rocco al Porto | | San Rocco al Porto (Piacenza) | | 49.0 | % | 104,485 | | 20,419 | | 124,904 |
| Roma—Collatina | | Collatina (Roma) | | 49.0 | % | 59,524 | | 4,101 | | 63,625 |
| Sassari—Predda Niedda | | Predda Niedda (Sassari) | | 49.0% | (1) | 56,263 | | 107,779 | | 164,042 |
| Taranto | | Taranto | | 49.0 | % | 75,240 | | 126,508 | | 201,748 |
| Torino | | Torino | | 49.0 | % | 105,056 | | 66,682 | | 171,738 |
| Torino—Venaria | | Venaria (Torino) | | 49.0 | % | 101,557 | | 64,045 | | 165,602 |
| Venezia—Mestre | | Mestre (Venezia) | | 49.0 | % | 114,076 | | 132,644 | | 246,720 |
| Vicenza | | Vicenza | | 49.0 | % | 78,415 | | 20,064 | | 98,479 |
| Brindisi—Mesagne | | Mesagne (Brindisi) | | 49.0 | % | 88,049 | | 140,598 | | 228,647 |
| Ancona | | Ancona | | 49.0% | (2) | 82,947 | | 82,333 | | 165,280 |
| Bergamo | | Bergamo | | 49.0% | (2) | 103,011 | | 16,921 | | 119,932 |
| Brescia—Concesio | | Concesio (Brescia) | | 49.0% | (2) | 89,932 | | 27,566 | | 117,498 |
| Cagliari—Marconi | | Cagliari | | 49.0% | (2) | 83,549 | | 109,943 | | 193,492 |
| Catania—Misterbianco | | Misterbianco (Catania) | | 49.0% | (2) | 83,259 | | 15,984 | | 99,243 |
| Merate—Lecco | | Merate (Lecco) | | 49.0% | (2) | 73,496 | | 88,501 | | 161,997 |
| Milano—Cinisello-Balsamo | | Cinisello-Balsamo (Milano) | | 49.0% | (2) | 68,426 | | 18,589 | | 87,015 |
| Milano—Nerviano | | Nerviano (Milano) | | 49.0% | (2) | 83,840 | | 27,782 | | 111,622 |
| Napoli—Mugnano di Napoli | | Mugnano di Napoli | | 49.0% | (2) | 97,952 | | 94,852 | | 192,804 |
| Olbia | | Olbia | | 49.0% | (2) | 48,976 | | 48,814 | | 97,790 |
| Roma—Casalbertone | | Roma | | 49.0% | (2) | 62,667 | | 84,927 | | 147,594 |
| Sassari—Centro Azuni | | Sassari | | 49.0% | (2) | — | | 35,564 | | 35,564 |
| Torino—Rivoli | | Rivoli (Torino) | | 49.0% | (2) | 61,785 | | 32,346 | | 94,131 |
| Verona—Bussolengo | | Bussolengo (Verona) | | 49.0% | (2) | 89,319 | | 75,326 | | 164,645 |
| | | | | | |
| |
| |
|
| Subtotal Italy (38) | | | | | | 3,131,232 | | 2,969,526 | | 6,100,758 |
POLAND |
|
|
|
|
|
|
|
|
|
|
| Borek Shopping Center | | Wroclaw | | 35.2 | % | 119,942 | | 129,393 | | 249,335 |
| Dabrowka Shopping Center | | Katowice | | 35.2 | % | 120,986 | | 172,868 | | 293,854 |
| Turzyn Shopping Center | | Szczecin | | 35.2 | % | 87,188 | | 120,943 | | 208,131 |
| Wilenska Station Shopping Center | | Warsaw | | 35.2 | % | 92,688 | | 215,935 | | 308,623 |
| Zakopianka Shopping Center | | Krakow | | 35.2 | % | 120,190 | | 432,688 | | 552,878 |
| | | | | | |
| |
| |
|
| | Subtotal Poland(5) | | | | | | 540,994 | | 1,071,827 | | 1,612,821 |
PORTUGAL |
|
|
|
|
|
|
|
|
|
|
| Minho Center | | Braga (Porto) | | 35.2% | (2) | 120,018 | | 101,622 | | 221,640 |
| | | | | | |
| |
| |
|
| |
TOTAL EUROPEAN ASSETS (47) |
|
|
|
|
|
4,177,592 |
|
4,719,372 |
|
8,896,964 |
| | | | | | |
| |
| |
|
- (1)
- This property is held partially in fee and partially encumbered by a leasehold on the premises that entitles the lessor to the majority of the economics of the portion of the property subject to the leasehold.
- (2)
- This property is encumbered by a leasehold on the entire premises that entitles the lessor to the majority of the economics of the property.
33
SIMON PROPERTY GROUP
Capital Expenditures
For the Twelve Months Ended December 31, 2003
(In millions)
| |
| | Unconsolidated
Entities
| |
|---|
| | Consolidated
Properties
| | Total
| | Simon Group's
Share
| |
|---|
| New development projects | | $ | 108.2 | | $ | 138.3 | (1) | $ | 67.7 | (1) |
| Redevelopment projects with incremental GLA and/or Anchor Replacement | | | 163.6 | | | 43.1 | | | 16.1 | |
| Renovations with no incremental GLA | | | 16.0 | | | 0.7 | | | 0.1 | |
| Tenant allowances | | | 56.0 | | | 21.1 | | | 8.8 | |
| Operational capital expenditures at properties: | | | | | | | | | | |
| | CAM expenditures(2) | | | 31.1 | | | 16.7 | | | 6.9 | |
| | Non-CAM expenditures | | | 6.4 | | | 41.8 | | | 9.2 | |
| | |
| |
| |
| |
| Totals | | $ | 381.3 | | $ | 376.3 | | $ | 108.8 | |
| | | | | | | | |
| |
| Plus (Less): Conversion from accrual to cash basis | | | (27.4 | ) | | (11.2 | ) | | | |
| | |
| |
| | | | |
| Capital expenditures(3) | | $ | 353.9 | | $ | 365.1 | | | | |
| | |
| |
| | | | |
- (1)
- Does not include the Company's European initiatives (total cost of $114.6 million; the Company's share is $37.8 million)
- (2)
- Expenditure included in the pool of expenses allocated to tenants as common area maintenance or CAM.
- (3)
- Agrees with the line item "Capital expenditures" on the Combined Statements of Cash Flows for the consolidated properties. No statement of cash flows is prepared for the joint venture properties as this is not required by the SEC or GAAP; however, the above reconciliation was completed in the same manner as the reconciliation for the consolidated properties.
34
SIMON PROPERTY GROUP
North American Development Activity Report*
Project Overview, Construction-in-Progress and Land Held for Development
As of December 31, 2003
| |
| |
| |
| |
| |
| |
| |
| | Construction-in-Progress
|
|---|
| |
| |
| |
| |
| |
| |
| |
| |
| | Unconsolidated Entities
|
|---|
Mall/
Location
| | Project Description
| | The Company's
Ownership
Percentage
| | Opening
| | Projected
Gross Cost(1)
(in millions)
| | Projected
Net Cost
(in millions)
| | The Company's
Share of
Net Cost
| | Stabilized
Rate of
Return
| | Consolidated
Properties
| | Total
| | The Company's
Share
|
|---|
| Recently Completed New Development Projects: | | | | | | | | | | | | | | | | | | | | | | | | |
Lakeline Village
Austin, TX | | 42,000 sf community center featuring Ultimate Electronics | | 100 | % | 10/03 | | $ | 7 | | $ | 6 | | $ | 6 | | 11 | % | $ | 0.0 | (2) | | — | | | — |
| Recently Completed Redevelopments: | | | | | | | | | | | | | | | | | | | | | | | | |
Dadeland Mall
Miami, FL | | Remodel of Saks Fifth Avenue and Burdines; mall renovation and new parking deck | | 50 | % | 11/02 (renov)
10/03 (expan) | | $ | 42 | | $ | 34 | | $ | 17 | | 8 | % | | — | | $ | 0.0 | (3) | $ | 0.0 |
| Recently Completed Renovations: | | | | | | | | | | | | | | | | | | | | | | | | |
Melbourne Square
Melbourne, FL | | Mall renovation | | 100 | % | 10/03 | | | | | | | | | | | | | | | | | | | | |
Ocean County Mall
Toms River, NJ | | Mall renovation | | 100 | % | 11/03 | | | | | | | | | | | | | | | | | | | | |
| | | Subtotal Recently Completed Renovations | | | | | | $ | 23 | | $ | 20 | | $ | 20 | | 12 | % | $ | 0.2 | (4) | | — | | | — |
| New Development Projects (Under Construction): | | | | | | | | | | | | | | | | | | | | | | | | |
Chicago Premium Outlets
Aurora, IL (Chicago) | | 438,000 sf upscale outlet center | | 50 | % | 5/04 | | $ | 92 | | $ | 67 | | $ | 33 | | 13 | % | | — | | $ | 59.1 | | $ | 29.6 |
Clay Terrace
Carmel, IN (Indianapolis) | | 570,000 sf lifestyle center featuring Dick's Sporting Goods, Wild Oats, DSW Shoe Warehouse and Circuit City | | 50 | % | 4th Qtr. 2004 | | $ | 108 | | $ | 100 | | $ | 50 | | 11 | % | | — | | $ | 35.6 | | $ | 17.8 |
St. Johns Town Center
Jacksonville, FL | | 1.5 million sf open-air retail center comprised of a village component and community center. Anchors include Dillard's, Barnes & Noble, Dick's Sporting Goods, Target and PetsMart | | 85% | (7) | 1st Qtr. 2005 | | $ | 158 | | $ | 126 | | $ | 107 | | 10 | % | | — | | $ | 41.0 | | $ | 20.5 |
Firewheel Center
Garland, TX | | 785,000 sf open-air regional shopping center featuring Foley's, Dillard's, AMC, Barnes & Noble, Circuit City, Sports Authority and Linens 'N Things | | 100 | % | Fall 2005 | | $ | 126 | | $ | 96 | | $ | 96 | | 12 | % | $ | 16.2 | | | — | | | — |
Wolf Ranch
Georgetown, TX (Austin) | | 670,000 sf open-air retail shopping complex featuring Kohls, Target, Linens 'N Things, Office Depot and PetsMart | | 100 | % | 3rd Qtr. 2005 | | $ | 80 | | $ | 62 | | $ | 62 | | 10 | % | $ | 29.5 | | | — | | | — |
| Redevelopment Projects with Incremental GLA | | | | | | | | | | | | | | | | | | | | | | | | |
Battlefield Mall
Springfield, MO | | Retrofit and expand vacant space into a 17,000 sf cluster of five lifestyle stores including Chico's, Coldwater Creek, Starbuck's, Ann Taylor Loft and Jos. A. Banks. | | 100 | % | 11/04 | | $ | 4 | | $ | 4 | | $ | 4 | | 9 | % | $ | 0.6 | | | — | | | — |
Forum Shops at Caesars
Las Vegas, NV | | Phase III expansion of 175,000 sf | | 100 | % | 10/04 | | $ | 139 | | $ | 139 | | $ | 139 | | 11 | % | $ | 71.4 | | | — | | | — |
Greenwood Park Mall
Greenwood, IN | | Dick's Sporting Goods replacing former Service Merchandise and MCL space; mall and food court renovation | | 100 | % | 10/03 (renov)
4/04 (Dick's) | | $ | 13 | | $ | 13 | | $ | 13 | | 11 | % | $ | 0.0 | (5) | | — | | | — |
35
SIMON PROPERTY GROUP
North American Development Activity Report*
Project Overview, Construction-in-Progress and Land Held for Development
As of December 31, 2003
| |
| |
| |
| |
| |
| |
| |
| | Construction-in-Progress
|
|---|
| |
| |
| |
| |
| |
| |
| |
| |
| | Unconsolidated Entities
|
|---|
Mall/
Location
| | Project Description
| | The Company's
Ownership
Percentage
| | Opening
| | Projected
Gross Cost(1)
(in millions)
| | Projected
Net Cost
(in millions)
| | The Company's
Share of
Net Cost
| | Stabilized
Rate of
Return
| | Consolidated
Properties
| | Total
| | The Company's
Share
|
|---|
| Redevelopment Projects with Incremental GLA | | | | | | | | | | | | | | | | | | | | | | | | |
SouthPark
Charlotte, NC | | Phase I — Addition of Nordstrom (153,000 sf) and additional anchor pad, Hecht's expansion (60,000 sf) and renovation, Belk's expansion (46,000 sf) and renovation, addition of small shops (50,000 sf), three new parking decks and Cheesecake Factory and Maggiano's | | 100 | % | 10/02 (Belk)
12/02 (Cheesecake)
9/03 (Maggiano's)
Fall 2003 (renov)
3/04 (Nordstrom, Hecht's and expansion) | | $ | 97 | | $ | 97 | | $ | 97 | | 10 | % | $ | 59.7 | (6) | | — | | | — |
SouthPark
Charlotte, NC | | Phase II — Demolition of Sears building and addition of Galyan's, small shops, food court and two restaurants | | 100 | % | 3rd Qtr 2004 | | $ | 36 | | $ | 28 | | $ | 28 | | 10 | % | $ | 10.6 | | | — | | | — |
| Anchor/Big Box/Theater Activity | | | | | | | | | | | | | | | | | | | | | | | | |
College Mall
Bloomington, IN | | Target in former JCPenney space | | 100 | % | 3/04 | | | | | | | | | | | | | | | | | | | | |
Dadeland Mall
Miami, FL | | Nordstrom in former Lord & Taylor space | | 50 | % | 11/04 | | | | | | | | | | | | | | | | | | | | |
Gulfview Square
Port Richey, FL | | Best Buy and Linens 'N Things in former Dillard's building | | 100 | % | 9/04 | | | | | | | | | | | | | | | | | | | | |
Irving Mall
Irving, TX | | Relocate food court and inline tenants and add Circuit City | | 100 | % | 10/04 | | | | | | | | | | | | | | | | | | | | |
North East Mall
Hurst, TX (Ft. Worth) | | Theatre and three restaurants in former Montgomery Ward location | | 100 | % | 9/04 | | | | | | | | | | | | | | | | | | | | |
Phipps Plaza
Atlanta, GA | | Nordstrom in former Lord & Taylor space | | 100 | % | 4/05 | | | | | | | | | | | | | | | | | | | | |
Prien Lake Mall
Lake Charles, LA | | Cinemark Theatre in former White House store | | 100 | % | 6/04 | | | | | | | | | | | | | | | | | | | | |
Rolling Oaks Mall
San Antonio, TX | | San Antonio Skate Park in former Regal Cinema building; addition of JCPenney | | 100 | % | 3/04 (Skate)
10/04 (JCP) | | | | | | | | | | | | | | | | | | | | |
Southern Hills Mall
Sioux City, IA | | Addition of Barnes & Noble | | 50 | % | 4/04 | | | | | | | | | | | | | | | | | | | | |
Town Center at Boca Raton
Boca Raton, FL | | Neiman Marcus in former Lord & Taylor space | | 100 | % | 11/05 | | | | | | | | | | | | | | | | | | | | |
Washington Square
Indianapolis, IN | | Burlington Coat Factory in former JCPenney location; demolition of former Lazarus replaced by new Dick's Sporting Goods and Kerasotes Theatre on an outparcel | | 100 | % | 11/04 | | | | | | | | | | | | | | | | | | | | |
White Oaks Mall
Springfield, IL | | Dick's Sporting Goods and Linens 'N Things in former Montgomery Ward location | | 77 | % | 3/05 | | | | | | | | | | | | | | | | | | | | |
| | | Subtotal Anchor/Big Box/Theater Activity | | | | | | $ | 105 | | $ | 98 | | $ | 87 | | 10 | % | $ | 25.0 | | $ | 1.0 | | $ | 0.5 |
| Other Miscellaneous | | | | | | | | | | | | | | | | | | | $ | 6.8 | | $ | 2.6 | | $ | 1.2 |
| Total Construction in Progress (8) | | | | | | | | | | | | | | | | | | | $ | 220.0 | | $ | 139.3 | | $ | 69.6 |
| Land Held for Development | | | | | | | | | | | | | | | | | | | $ | 3.2 | | $ | 26.0 | | $ | 13.0 |
- *
- Cost and return are based upon current budget assumptions. Actual results may vary.
- (1)
- Projected Gross Cost includes soft costs such as architecture and engineering fees, tenant costs (allowances/leasing commissions), development, legal and other fees, marketing costs, cost of capital, and other related costs.
- (2)
- Development costs were transferred from Construction-in-Progress to the fixed asset accounts for Lakeline Village (Total and SPG's Share = $6.5 million)
- (3)
- Prior redevelopment costs were transferred from Construction-in-Progress to the fixed asset accounts for Dadeland Mall (Total = $32.7 million; SPG's Share = $16.4 million)
- (4)
- Prior redevelopment costs were transferred from Construction-in-Progress to the fixed asset accounts for Melbourne Square and Ocean County Mall (Total and SPG's Share = $16.5 million)
- (5)
- Redevelopment costs were transferred from Construction-in-Progress to the fixed asset accounts for Greenwood Park Mall (Total and SPG's Share = $11.3 million)
- (6)
- Prior redevelopment costs were transferred from Construction-in-Progress to the fixed asset accounts for SouthPark (Total and SPG's Share = $15.6 million)
- (7)
- The Company will own 85% of this project until certain financial hurdles are met, at which time ownership reverts to 50/50.
- (8)
- Does not include the Company's European Retail Enterprises B.V. ("ERE") and GCI initiatives (ERE's total of $126.0 million; the Company's share of $44.4 million)
36
SIMON PROPERTY GROUP
European Development Activity Report*
Project Overview, Construction-in-Progress
As of December 31, 2003
| |
| |
| |
| |
| |
| | Construction-in-Progress
|
|---|
Shopping center/
Location (Metropolitan area)
| | Project Description
| | The Company's
Ownership
Percentage
| | Opening
| | Projected
Net Cost
(in millions)
| | The Company's
Share of
Net Cost
| | Total
| | The Company's
Share
|
|---|
| New Development Projects (Under Construction): | | | | | | | | | | | | |
| Arkadia—Warsaw, Poland | | Approx. 1.1 million of total GLA including a hypermarket, approx. 200 shops, a do-it-yourself center, and cinema | | 35.2 | % | Oct-04 | | €155 | | €55 | | €105 | | €37 |
| Bari Modugno—Modugno, Italy (Bari) | | Approx 0.3 million of total GLA including a hypermarket and small shops | | 49.0 | % | Apr-04 | | €11(1 | ) | €5 | | €7 | | €3 |
| Cuneo—Cuneo, Italy | | Approx. 0.5 million of total GLA including a hypermarket and small shops | | 49.0 | % | Dec-04 | | €27(1 | ) | €13 | | €6 | | €3 |
| Porta di Roma—Roma, Italy | | 40% interest in joint venture development. Approx. 1.7 million of total GLA including a hypermarket, department store and do-it-yourself centers | | 19.6 | % | Dec-06 | | €200(1 | ) | €39 | | €25 | | €5 |
| Napoli Nola—Nola, Italy (Napoli) | | 45% interest in joint venture mixed-use development. Approx. 1.3 million of total GLA including a hypermarket and department store. | | 22.1 | % | Jul-06 | | €142(1 | ) | €31 | | N/A | | N/A |
| Bay 1—Torcy, France (Paris) | | Related to new hypermarket redevelopment in Torcy which opened Feb-03. Approx. 0.3 million of GLA redevelopment of old hypermarket site to consist of shops and cinema | | 35.2 | % | Nov-04 | | €19 | | €7 | | €7 | | €2 |
| Other projects (2 developments) | | | | | | | | €1 | | | | | | |
| Total (8 projects) | | | | | | | | €566 | | €154 | | €58 | | €18 |
- *
- Cost and return are based upon current budget assumptions. Actual results may vary.
N/A—Details of CIP were not available at time of the filing of this Form 8-K.
- (1)
- Amounts do not include estimated cost of capital.
37
SIMON PROPERTY GROUP
The Company's Share of Total Debt Amortization and Maturities by Year
As of December 31, 2003
(In thousands)
Year
| |
| | The Company's
Share of
Secured
Consolidated
Debt
| | The Company's
Share of
Unsecured
Consolidated
Debt
| | The Company's
Share of
Unconsolidated
Joint Venture
Debt
| | The Company's
Share of Total
Debt
|
|---|
| 2004 | | 1 | | $ | 544,433 | | $ | 915,000 | | $ | 197,615 | | $ | 1,657,048 |
| 2005 | | 2 | | | 251,744 | | | 660,000 | | | 583,552 | | | 1,495,296 |
| 2006 | | 3 | | | 312,189 | | | 1,082,580 | | | 471,661 | | | 1,866,430 |
| 2007 | | 4 | | | 530,115 | | | 930,000 | | | 187,775 | | | 1,647,890 |
| 2008 | | 5 | | | 332,785 | | | 350,000 | | | 278,701 | | | 961,486 |
| 2009 | | 6 | | | 421,332 | | | 450,000 | | | 130,342 | | | 1,001,674 |
| 2010 | | 7 | | | 719,314 | | | 300,000 | | | 245,107 | | | 1,264,421 |
| 2011 | | 8 | | | 430,962 | | | 200,000 | | | 169,736 | | | 800,698 |
| 2012 | | 9 | | | 347,499 | | | 350,000 | | | 202,990 | | | 900,489 |
| 2013 | | 10 | | | 90,193 | | | 275,000 | | | 255,832 | | | 621,025 |
| Thereafter | | | | | 75,825 | | | 563,100 | | | 14,200 | | | 653,125 |
| | | | |
| |
| |
| |
|
Subtotal Face Amounts |
|
|
|
$ |
4,056,391 |
|
$ |
6,075,680 |
|
$ |
2,737,511 |
|
$ |
12,869,582 |
Premiums (Discounts) on Indebtedness, Net |
|
|
|
|
19,474 |
|
|
(11,614 |
) |
|
2,119 |
|
|
9,979 |
| Fair Value Interest Rate Swaps | | | | | — | | | 1,195 | | | — | | | 1,195 |
| | | | |
| |
| |
| |
|
The Company's Share of Total Indebtedness |
|
|
|
$ |
4,075,865 |
|
$ |
6,065,261 |
|
$ |
2,739,630 |
|
$ |
12,880,756 |
| | | | |
| |
| |
| |
|
38
SIMON PROPERTY GROUP
Summary of Indebtedness
As of December 31, 2003
(In thousands)
| | Total
Indebtedness
| | The Company's Share of Indebtedness
| | Weighted Average Interest Rate
| | Weighted Average Years to Maturity
|
|---|
| Consolidated Indebtedness | | | | | | | | | | |
| |
Mortgage Debt |
|
|
|
|
|
|
|
|
|
|
| | | Fixed Rate(1) | | $ | 3,559,622 | | $ | 3,474,566 | | 6.58 | % | 6.1 |
| | | Floating Rate Debt (Hedged)(2) | | | 157,000 | | | 145,250 | | 2.66 | % | 2.7 |
| | | Floating Rate Debt | | | 462,763 | | | 436,575 | | 2.50 | % | 1.1 |
| | |
| |
| |
| |
|
| |
Total Mortgage Debt |
|
|
4,179,385 |
|
|
4,056,391 |
|
6.00 |
% |
5.5 |
| |
Unsecured Debt |
|
|
|
|
|
|
|
|
|
|
| | | Fixed Rate | | | 5,215,000 | | | 5,215,000 | | 6.75 | % | 4.8 |
| | | Floating Rate Debt | | | 532,779 | | | 532,779 | | 2.18 | % | 3.5 |
| | |
| |
| |
| |
|
| | Subtotal | | | 5,747,779 | | | 5,747,779 | | 6.32 | % | 4.3 |
| | |
Revolving Corporate Credit Facility |
|
|
188,878 |
|
|
188,878 |
|
1.77 |
% |
2.3 |
| | | Revolving Corporate Credit Facility (Hedged)(2) | | | 139,023 | | | 139,023 | | 1.77 | % | 2.3 |
| | |
| |
| |
| |
|
| | Subtotal | | | 327,901 | | | 327,901 | | 1.77 | % | 2.3 |
| |
Total Unsecured Debt |
|
|
6,075,680 |
|
|
6,075,680 |
|
6.08 |
% |
4.53 |
| |
Premium |
|
|
36,591 |
|
|
34,267 |
|
N/A |
|
N/A |
| | Discount | | | (26,463 | ) | | (26,407 | ) | N/A | | N/A |
| | Fair Value Interest Rate Swaps | | | 1,195 | | | 1,195 | | N/A | | N/A |
| | |
| |
| |
| |
|
| Consolidated Mortgages and Other Indebtedness(3) | | $ | 10,266,388 | | $ | 10,141,126 | | 6.05 | % | 4.9 |
| | |
| |
| |
| |
|
Joint Venture Indebtedness |
|
|
|
|
|
|
|
|
|
|
| | Mortgage Debt | | | | | | | | | | |
| | | Fixed Rate | | $ | 4,654,230 | | $ | 1,978,787 | | 7.00 | % | 5.5 |
| | | Floating Rate Debt (Hedged)(2) | | | 899,425 | | | 289,366 | | 2.03 | % | 1.8 |
| | | Floating Rate Debt | | | 1,085,221 | | | 469,358 | | 3.51 | % | 2.7 |
| | |
| |
| |
| |
|
| | Total Mortgage Debt | | | 6,638,876 | | | 2,737,511 | | 5.88 | % | 4.6 |
| |
Premium |
|
|
8,527 |
|
|
4,257 |
|
N/A |
|
N/A |
| | Discount | | | (4,351 | ) | | (2,138 | ) | | | |
| | |
| |
| |
| |
|
| Joint Venture Mortgages and Other Indebtedness | | $ | 6,643,052 | | $ | 2,739,630 | | 5.88 | % | 4.6 |
| | |
| |
| |
| |
|
The Company's Share of Total Indebtedness |
|
|
|
|
$ |
12,880,756 |
|
6.01 |
% |
4.8 |
- (1)
- Includes $48.2 million of variable rate debt, of which substantilly all is effectively fixed to maturity through the use of interest rate hedges with a total notional amount of $48.1 million.
- (2)
- These debt obligations are hedged by interest rate cap agreements.
- (3)
- The Company holds $85.0 million of notional amount fixed rate swap agreements that have a weighted average pay rate of 5.89% and a weighted average receive rate of 1.18% at December 31, 2003. The Company also holds $300.0 million of notional amount variable rate swap agreements that have a weighted average pay rate of 1.25% and a weighted average receive rate of 3.50% at December 31, 2003. All of these swap agreements are designated as hedges on various pools of indebtedness. Also includes a $70 million notional amount variable rate swap with a weighted average pay rate of 1.12% and a receive rate of 3.60% at December 31, 2003.
39
SIMON PROPERTY GROUP
Summary of Indebtedness By Maturity
As of December 31, 2003
(In thousands)
Property Name
| |
| | Maturity
Date
| |
| | Interest
Rate(1)
| | Total
Indebtedness
| | The Company's
Share of
Indebtedness
| | Weighted Avg
Interest Rate
by Year
| |
|---|
| Consolidated Indebtedness | | | | | | | | | | | | | | | |
| Fixed Rate Mortgage Debt: | | | | | | | | | | | | | | | |
| | DeKalb Mall | | | | 10/01/04 | | | | 9.35 | % | 2,711 | | 1,421 | | | |
| | CMBS Loan—Fixed (encumbers 7 Properties) | | (6) | | 12/15/04 | | | | 7.31 | % | 172,290 | | 172,290 | | | |
| | CMBS Loan—Variable (encumbers 7 Properties) | | (6) | | 12/15/04 | | (5) | | 6.20 | % | 48,157 | | 48,157 | | | |
| | | | | | | | | | |
| |
| | | |
| | | Subtotal 2004 | | | | | | | | | | 223,158 | | 221,868 | | 7.08 | % |
| |
Tippecanoe Mall—1 |
|
|
|
01/01/05 |
|
|
|
8.45 |
% |
41,676 |
|
41,676 |
|
|
|
| | Tippecanoe Mall—2 | | | | 01/01/05 | | | | 6.81 | % | 15,049 | | 15,049 | | | |
| | Melbourne Square | | | | 02/01/05 | | | | 7.42 | % | 36,595 | | 36,595 | | | |
| | Chesapeake Center | | (12) | | 06/15/05 | | | | 8.44 | % | 6,563 | | 6,563 | | | |
| | Grove at Lakeland Square, The | | (12) | | 06/15/05 | | | | 8.44 | % | 3,750 | | 3,750 | | | |
| | Terrace at Florida Mall, The | | (12) | | 06/15/05 | | | | 8.44 | % | 4,688 | | 4,688 | | | |
| | Cielo Vista Mall—2 | | | | 11/01/05 | | | | 8.13 | % | 675 | | 675 | | | |
| | | | | | | | | | |
| |
| | | |
| | | Subtotal 2005 | | | | | | | | | | 108,996 | | 108,996 | | 7.87 | % |
| |
Treasure Coast Square—1 |
|
|
|
01/01/06 |
|
|
|
7.42 |
% |
50,254 |
|
50,254 |
|
|
|
| | Treasure Coast Square—2 | | | | 01/01/06 | | | | 8.06 | % | 11,736 | | 11,736 | | | |
| | Gulf View Square | | | | 10/01/06 | | | | 8.25 | % | 34,260 | | 34,260 | | | |
| | Paddock Mall | | | | 10/01/06 | | | | 8.25 | % | 27,248 | | 27,248 | | | |
| | | | | | | | | | |
| |
| | | |
| | | Subtotal 2006 | | | | | | | | | | 123,498 | | 123,498 | | 7.89 | % |
| |
Cielo Vista Mall—1 |
|
(4) |
|
05/01/07 |
|
|
|
9.38 |
% |
51,033 |
|
51,033 |
|
|
|
| | Cielo Vista Mall—3 | | (4) | | 05/01/07 | | | | 6.76 | % | 36,614 | | 36,614 | | | |
| | Lakeline Mall | | | | 05/01/07 | | | | 7.65 | % | 68,549 | | 68,549 | | | |
| | McCain Mall—1 | | (4) | | 05/01/07 | | | | 9.38 | % | 23,829 | | 23,829 | | | |
| | McCain Mall—2 | | (4) | | 05/01/07 | | | | 6.76 | % | 16,900 | | 16,900 | | | |
| | Valle Vista Mall—1 | | (4) | | 05/01/07 | | | | 9.38 | % | 31,561 | | 31,561 | | | |
| | Valle Vista Mall—2 | | (4) | | 05/01/07 | | | | 6.81 | % | 7,515 | | 7,515 | | | |
| | Wolfchase Galleria | | | | 06/30/07 | | | | 7.80 | % | 74,437 | | 70,340 | | | |
| | Copley Place | | | | 08/01/07 | | | | 7.44 | % | 180,836 | | 177,485 | | | |
| | University Park Mall | | | | 10/01/07 | | | | 7.43 | % | 58,799 | | 35,279 | | | |
| | | | | | | | | | |
| |
| | | |
| | | Subtotal 2007 | | | | | | | | | | 550,073 | | 519,105 | | 7.83 | % |
| |
Stanford Shopping Center |
|
|
|
09/11/08 |
|
(13) |
|
3.60 |
% |
220,000 |
|
220,000 |
|
|
|
| | Arsenal Mall—1 | | | | 09/28/08 | | | | 6.75 | % | 32,977 | | 32,977 | | | |
| | | | | | | | | | |
| |
| | | |
| | | Subtotal 2008 | | | | | | | | | | 252,977 | | 252,977 | | 4.01 | % |
40
| |
College Mall—1 |
|
(3) |
|
01/01/09 |
|
|
|
7.00 |
% |
37,013 |
|
37,013 |
|
|
|
| | College Mall—2 | | (3) | | 01/01/09 | | | | 6.76 | % | 11,281 | | 11,281 | | | |
| | Greenwood Park Mall—1 | | (3) | | 01/01/09 | | | | 7.00 | % | 31,000 | | 31,000 | | | |
| | Greenwood Park Mall—2 | | (3) | | 01/01/09 | | | | 6.76 | % | 58,284 | | 58,284 | | | |
| | Towne East Square—1 | | (3) | | 01/01/09 | | | | 7.00 | % | 48,935 | | 48,935 | | | |
| | Towne East Square—2 | | (3) | | 01/01/09 | | | | 6.81 | % | 23,513 | | 23,513 | | | |
| | Penn Square Mall | | | | 03/01/09 | | | | 7.03 | % | 71,319 | | 67,394 | | | |
| | Bloomingdale Court | | (11) | | 11/01/09 | | | | 7.78 | % | 28,695 | | 28,695 | | | |
| | Forest Plaza | | (11) | | 11/01/09 | | | | 7.78 | % | 15,738 | | 15,738 | | | |
| | Lake View Plaza | | (11) | | 11/01/09 | | | | 7.78 | % | 20,921 | | 20,921 | | | |
| | Lakeline Plaza | | (11) | | 11/01/09 | | | | 7.78 | % | 22,937 | | 22,937 | | | |
| | Lincoln Crossing | | (11) | | 11/01/09 | | | | 7.78 | % | 3,167 | | 3,167 | | | |
| | Matteson Plaza | | (11) | | 11/01/09 | | | | 7.78 | % | 9,213 | | 9,213 | | | |
| | Muncie Plaza | | (11) | | 11/01/09 | | | | 7.78 | % | 7,965 | | 7,965 | | | |
| | Regency Plaza | | (11) | | 11/01/09 | | | | 7.78 | % | 4,318 | | 4,318 | | | |
| | St. Charles Towne Plaza | | (11) | | 11/01/09 | | | | 7.78 | % | 27,639 | | 27,639 | | | |
| | West Ridge Plaza | | (11) | | 11/01/09 | | | | 7.78 | % | 5,567 | | 5,567 | | | |
| | White Oaks Plaza | | (11) | | 11/01/09 | | | | 7.78 | % | 16,987 | | 16,987 | | | |
| | | | | | | | | | |
| |
| | | |
| | | Subtotal 2009 | | | | | | | | | | 444,492 | | 440,567 | | 7.24 | % |
| |
Trolley Square |
|
|
|
08/01/10 |
|
|
|
9.03 |
% |
29,133 |
|
26,220 |
|
|
|
| | Coral Square | | | | 10/01/10 | | | | 8.00 | % | 88,946 | | 86,473 | | | |
| | Crystal River | | | | 11/11/10 | | | | 7.63 | % | 15,867 | | 15,867 | | | |
| | Forum Shops at Caesars, The | | | | 12/01/10 | | | | 4.78 | % | 550,000 | | 550,000 | | | |
| | Biltmore Square | | | | 12/11/10 | | | | 7.95 | % | 26,000 | | 26,000 | | | |
| | Port Charlotte Town Center | | | | 12/11/10 | | | | 7.98 | % | 53,250 | | 42,600 | | | |
| | | | | | | | | | |
| |
| | | |
| | | Subtotal 2010 | | | | | | | | | | 763,196 | | 747,160 | | 5.66 | % |
| |
Oxford Valley Mall |
|
|
|
01/10/11 |
|
|
|
6.76 |
% |
86,418 |
|
56,844 |
|
|
|
| | Henderson Square | | | | 07/01/11 | | | | 6.94 | % | 15,625 | | 12,362 | | | |
| | Ingram Park Mall | | (10) | | 08/11/11 | | | | 6.99 | % | 82,423 | | 82,423 | | | |
| | Knoxville Center | | (10) | | 08/11/11 | | | | 6.99 | % | 62,415 | | 62,415 | | | |
| | Northlake Mall | | (10) | | 08/11/11 | | | | 6.99 | % | 72,003 | | 72,003 | | | |
| | Towne West Square | | (10) | | 08/11/11 | | | | 6.99 | % | 53,952 | | 53,952 | | | |
| | Tacoma Mall | | | | 10/01/11 | | | | 7.00 | % | 131,903 | | 131,903 | | | |
| | | | | | | | | | |
| |
| | | |
| | | Subtotal 2011 | | | | | | | | | | 504,739 | | 471,902 | | 6.96 | % |
| |
Anderson Mall |
|
|
|
10/10/12 |
|
|
|
6.20 |
% |
29,763 |
|
29,763 |
|
|
|
| | Century III Mall | | (8) | | 10/10/12 | | | | 6.20 | % | 87,859 | | 87,859 | | | |
| | Crossroads Mall | | | | 10/10/12 | | | | 6.20 | % | 44,127 | | 44,127 | | | |
| | Forest Mall | | (9) | | 10/10/12 | | | | 6.20 | % | 17,671 | | 17,671 | | | |
| | Highland Lakes Center | | (8) | | 10/10/12 | | | | 6.20 | % | 16,288 | | 16,288 | | | |
| | Longview Mall | | (7) | | 10/10/12 | | | | 6.20 | % | 33,070 | | 33,070 | | | |
| | Markland Mall | | (9) | | 10/10/12 | | | | 6.20 | % | 23,397 | | 23,397 | | | |
| | Midland Park Mall | | (9) | | 10/10/12 | | | | 6.20 | % | 34,157 | | 34,157 | | | |
| | Palm Beach Mall | | | | 10/10/12 | | | | 6.20 | % | 54,641 | | 54,641 | | | |
| | Richmond Towne Square | | (9) | | 10/10/12 | | | | 6.20 | % | 47,977 | | 47,977 | | | |
| | | | | | | | | | |
| |
| | | |
| | | Subtotal 2012 | | | | | | | | | | 388,950 | | 388,950 | | 6.20 | % |
41
| |
Battlefield Mall |
|
|
|
07/01/13 |
|
|
|
4.60 |
% |
100,000 |
|
100,000 |
|
|
|
| | | | | | | | | | |
| |
| | | |
| | | Subtotal 2013 | | | | | | | | | | 100,000 | | 100,000 | | 4.60 | % |
| | | | | | | | | | |
| |
| | | |
| |
Arsenal Mall—2 |
|
|
|
05/05/16 |
|
|
|
8.20 |
% |
1,796 |
|
1,796 |
|
|
|
| | | | | | | | | | |
| |
| | | |
| | | Subtotal 2016 | | | | | | | | | | 1,796 | | 1,796 | | 8.20 | % |
| |
Sunland Park Mall |
|
|
|
01/01/26 |
|
|
|
8.63 |
% |
37,229 |
|
37,229 |
|
|
|
| | | | | | | | | | |
| |
| | | |
| | | Subtotal 2026 | | | | | | | | | | 37,229 | | 37,229 | | 8.63 | % |
| |
Keystone at the Crossing |
|
|
|
07/01/27 |
|
|
|
7.85 |
% |
60,518 |
|
60,518 |
|
|
|
| | | | | | | | | | |
| |
| | | |
| | | Subtotal 2027 | | | | | | | | | | 60,518 | | 60,518 | | 7.85 | % |
| | | | | | | | | | |
| |
| |
| |
| |
Total Consolidated Fixed Rate Mortgage Debt |
|
|
|
|
|
|
|
|
|
3,559,622 |
|
3,474,566 |
|
6.58 |
% |
| | | | | | | | | | |
| |
| |
| |
| |
Variable Rate Mortgage Debt: |
|
|
|
|
|
|
|
|
|
|
|
|
|
|
|
| |
Jefferson Valley Mall |
|
|
|
01/11/04 |
|
|
|
2.37 |
% |
60,000 |
|
60,000 |
|
|
|
| | St. Johns Town Center | | | | 03/02/04 | | | | 2.37 | % | 37,500 | | 18,750 | | | |
| | North East Mall | | | | 05/21/04 | | | | 2.50 | % | 140,000 | | 140,000 | | | |
| | Waterford Lakes | | | | 08/16/04 | | | | 2.42 | % | 68,000 | | 68,000 | | | |
| | | | | | | | | | |
| |
| | | |
| | | Subtotal 2004 | | | | | | | | | | 305,500 | | 286,750 | | 2.44 | % |
| |
Brunswick Square |
|
(2) |
|
06/12/05 |
|
|
|
2.62 |
% |
45,000 |
|
45,000 |
|
|
|
| | Raleigh Springs Mall | | | | 12/09/05 | | | | 3.80 | % | 11,000 | | 11,000 | | | |
| | Bowie Mall | | (2) | | 12/14/05 | | | | 2.62 | % | 52,700 | | 52,700 | | | |
| | | | | | | | | | |
| |
| | | |
| | | Subtotal 2005 | | | | | | | | | | 108,700 | | 108,700 | | 2.74 | % |
| |
Chesapeake Square |
|
(2) |
|
07/01/06 |
|
|
|
3.87 |
% |
47,000 |
|
35,250 |
|
|
|
| | Riverway | | (2) | | 10/01/06 | | | | 2.27 | % | 110,000 | | 110,000 | | | |
| | | | | | | | | | |
| |
| | | |
| | | Subtotal 2006 | | | | | | | | | | 157,000 | | 145,250 | | 2.66 | % |
| |
White Oaks Mall |
|
(2) |
|
02/25/08 |
|
|
|
2.22 |
% |
48,563 |
|
41,125 |
|
|
|
| | | | | | | | | | |
| |
| | | |
| | | Subtotal 2008 | | | | | | | | | | 48,563 | | 41,125 | | 2.22 | % |
| | | | | | | | | | |
| |
| |
| |
| |
Total Variable Rate Mortgage Debt |
|
|
|
|
|
|
|
|
|
619,763 |
|
581,825 |
|
2.54 |
% |
| | | | | | | | | | |
| |
| |
| |
| | Total Consolidated Mortgage Debt | | | | | | | | | | 4,179,385 | | 4,056,391 | | 6.00 | % |
| | | | | | | | | | |
| |
| |
| |
| |
Fixed Rate Unsecured Debt: |
|
|
|
|
|
|
|
|
|
|
|
|
|
|
|
| |
Shopping Center Associates (Bonds) |
|
|
|
01/15/04 |
|
|
|
6.75 |
% |
150,000 |
|
150,000 |
|
|
|
| | Simon Property Group, LP (Bonds) | | | | 02/09/04 | | | | 6.75 | % | 300,000 | | 300,000 | | | |
| | Simon Property Group, LP (Bonds) | | | | 07/15/04 | | | | 6.75 | % | 100,000 | | 100,000 | | | |
| | Retail Property Trust (Bonds) | | | | 08/15/04 | | | | 7.75 | % | 150,000 | | 150,000 | | | |
| | | | | | | | | | |
| |
| | | |
| | | Subtotal 2004 | | | | | | | | | | 700,000 | | 700,000 | | 6.96 | % |
42
| |
Shopping Center Associates (Bonds) |
|
|
|
05/15/05 |
|
|
|
7.63 |
% |
110,000 |
|
110,000 |
|
|
|
| | Simon Property Group, LP (Bonds) | | | | 06/15/05 | | | | 6.75 | % | 300,000 | | 300,000 | | | |
| | Simon Property Group, LP (Medium Term Notes) | | | | 06/24/05 | | | | 7.13 | % | 100,000 | | 100,000 | | | |
| | Simon Property Group, LP (Bonds) | | | | 10/27/05 | | | | 6.88 | % | 150,000 | | 150,000 | | | |
| | | | | | | | | | |
| |
| | | |
| | | Subtotal 2005 | | | | | | | | | | 660,000 | | 660,000 | | 6.98 | % |
| |
Simon Property Group, LP (Bonds) |
|
|
|
01/20/06 |
|
|
|
7.38 |
% |
300,000 |
|
300,000 |
|
|
|
| | Simon Property Group, LP (Bonds) | | | | 11/15/06 | | | | 6.88 | % | 250,000 | | 250,000 | | | |
| | | | | | | | | | |
| |
| | | |
| | | Subtotal 2006 | | | | | | | | | | 550,000 | | 550,000 | | 7.15 | % |
| |
Simon Property Group, LP (Medium Term Notes) |
|
|
|
09/20/07 |
|
|
|
7.13 |
% |
180,000 |
|
180,000 |
|
|
|
| | Simon Property Group, LP (Bonds) | | | | 11/15/07 | | | | 6.38 | % | 750,000 | | 750,000 | | | |
| | | | | | | | | | |
| |
| | | |
| | | Subtotal 2007 | | | | | | | | | | 930,000 | | 930,000 | | 6.52 | % |
| |
Simon Property Group, LP (MOPPRS) |
|
|
|
06/15/08 |
|
|
|
7.00 |
% |
200,000 |
|
200,000 |
|
|
|
| | Simon Property Group, LP (Bonds) | | | | 08/28/08 | | | | 5.38 | % | 150,000 | | 150,000 | | | |
| | | | | | | | | | |
| |
| | | |
| | | Subtotal 2008 | | | | | | | | | | 350,000 | | 350,000 | | 6.30 | % |
| |
Simon Property Group, LP (Bonds) |
|
|
|
02/09/09 |
|
|
|
7.13 |
% |
300,000 |
|
300,000 |
|
|
|
| | Simon Property Group, LP (Bonds) | | | | 07/15/09 | | | | 7.00 | % | 150,000 | | 150,000 | | | |
| | | | | | | | | | |
| |
| | | |
| | | Subtotal 2009 | | | | | | | | | | 450,000 | | 450,000 | | 7.08 | % |
| |
Simon Property Group, LP (Bonds) |
|
|
|
03/18/10 |
|
|
|
4.88 |
% |
300,000 |
|
300,000 |
|
|
|
| | | | | | | | | | |
| |
| | | |
| | | Subtotal 2010 | | | | | | | | | | 300,000 | | 300,000 | | 4.88 | % |
| |
Simon Property Group, LP (Bonds) |
|
|
|
01/20/11 |
|
|
|
7.75 |
% |
200,000 |
|
200,000 |
|
|
|
| | | | | | | | | | |
| |
| | | |
| | | Subtotal 2011 | | | | | | | | | | 200,000 | | 200,000 | | 7.75 | % |
| |
Simon Property Group, LP (Bonds) |
|
|
|
08/28/12 |
|
|
|
6.35 |
% |
350,000 |
|
350,000 |
|
|
|
| | | | | | | | | | |
| |
| | | |
| | | Subtotal 2012 | | | | | | | | | | 350,000 | | 350,000 | | 6.35 | % |
| |
Simon Property Group, LP (Bonds) |
|
|
|
03/15/13 |
|
|
|
5.45 |
% |
200,000 |
|
200,000 |
|
|
|
| | Retail Property Trust (Bonds) | | | | 09/01/13 | | | | 7.18 | % | 75,000 | | 75,000 | | | |
| | | | | | | | | | |
| |
| | | |
| | | Subtotal 2013 | | | | | | | | | | 275,000 | | 275,000 | | 5.92 | % |
| |
Retail Property Trust (Bonds) |
|
|
|
03/15/16 |
|
|
|
7.88 |
% |
250,000 |
|
250,000 |
|
|
|
| | | | | | | | | | |
| |
| | | |
| | | Subtotal 2016 | | | | | | | | | | 250,000 | | 250,000 | | 7.88 | % |
| |
Simon Property Group, LP (Bonds) |
|
|
|
06/15/18 |
|
|
|
7.38 |
% |
200,000 |
|
200,000 |
|
|
|
| | | | | | | | | | |
| |
| | | |
| | | Subtotal 2018 | | | | | | | | | | 200,000 | | 200,000 | | 7.38 | % |
| | | | | | | | | | |
| |
| |
| |
| |
Total Unsecured Fixed Rate Debt |
|
|
|
|
|
|
|
|
|
5,215,000 |
|
5,215,000 |
|
6.75 |
% |
| | | | | | | | | | |
| |
| |
| |
| |
Variable Rate Unsecured Debt: |
|
|
|
|
|
|
|
|
|
|
|
|
|
|
|
| |
Simon Property Group, LP (Term Loan) |
|
|
|
02/28/04 |
|
|
|
1.77 |
% |
150,000 |
|
150,000 |
|
|
|
| | Simon Property Group, LP (Term Loan) | | | | 03/15/04 | | | | 1.92 | % | 65,000 | | 65,000 | | | |
| | | | | | | | | | |
| |
| | | |
| | | Subtotal 2004 | | | | | | | | | | 215,000 | | 215,000 | | 1.82 | % |
43
| |
Revolving Credit Facility |
|
(2),(14) |
|
04/16/06 |
|
|
|
1.77 |
% |
327,901 |
|
327,901 |
|
|
|
| | Simon Property Group, LP (Euro Term Loan) | | (2),(15) | | 12/16/06 | | | | 2.70 | % | 204,679 | | 204,679 | | | |
| | | | | | | | | | |
| |
| | | |
| | | Subtotal 2006 | | | | | | | | | | 532,580 | | 532,580 | | 2.13 | % |
| |
Floating Rate Mandatory Extension Notes |
|
(2) |
|
11/15/14 |
|
|
|
1.92 |
% |
113,100 |
|
113,100 |
|
|
|
| | | | | | | | | | |
| |
| | | |
| | | Subtotal 2014 | | | | | | | | | | 113,100 | | 113,100 | | 1.92 | % |
| | | | | | | | | | |
| |
| |
| |
| |
Total Unsecured Variable Rate Debt |
|
|
|
|
|
|
|
|
|
860,680 |
|
860,680 |
|
2.02 |
% |
| | | | | | | | | | |
| |
| |
| |
| | Total Unsecured Debt | | | | | | | | | | 6,075,680 | | 6,075,680 | | 6.08 | % |
| | | | | | | | | | |
| |
| |
| |
| |
Premium on Fixed-Rate Indebtedness |
|
|
|
|
|
|
|
|
|
36,591 |
|
34,267 |
|
N/A |
|
| | Discount on Fixed-Rate Indebtedness | | | | | | | | | | (26,463 | ) | (26,407 | ) | N/A | |
| | Fair Value Interest Rate Swaps | | | | | | | | | | 1,195 | | 1,195 | | N/A | |
| | | | | | | | | | |
| |
| |
| |
| | Total Consolidated Debt | | | | | | | | | | 10,266,388 | | 10,141,126 | | 6.05 | % |
| | | | | | | | | | |
| |
| |
| |
| | Joint Venture Indebtedness | | | | | | | | | | | | | | | |
| | Fixed Rate Mortgage Debt: | | | | | | | | | | | | | | | |
| | Northshore Mall | | | | 05/14/04 | | | | 9.05 | % | 161,000 | | 79,111 | | | |
| | Indian River Commons | | | | 11/01/04 | | | | 7.58 | % | 8,136 | | 4,068 | | | |
| | Indian River Mall | | | | 11/01/04 | | | | 7.58 | % | 45,145 | | 22,573 | | | |
| | | | | | | | | | |
| |
| | | |
| | | Subtotal 2004 | | | | | | | | | | 214,281 | | 105,752 | | 8.68 | % |
| |
Westchester, The—1 |
|
|
|
09/01/05 |
|
|
|
8.74 |
% |
144,712 |
|
57,885 |
|
|
|
| | Westchester, The—2 | | | | 09/01/05 | | | | 7.20 | % | 51,178 | | 20,471 | | | |
| | Houston Galleria—1 | | | | 12/01/05 | | | | 7.93 | % | 217,595 | | 68,510 | | | |
| | | | | | | | | | |
| |
| | | |
| | | Subtotal 2005 | | | | | | | | | | 413,485 | | 146,866 | | 8.15 | % |
| |
Cobblestone Court |
|
|
|
01/01/06 |
|
|
|
7.64 |
% |
6,178 |
|
2,162 |
|
|
|
| | Crystal Court | | | | 01/01/06 | | | | 7.64 | % | 4,044 | | 1,415 | | | |
| | Fairfax Court | | | | 01/01/06 | | | | 7.64 | % | 10,318 | | 2,708 | | | |
| | Gaitway Plaza | | | | 01/01/06 | | | | 7.64 | % | 7,348 | | 1,714 | | | |
| | Plaza at Buckland Hills, The | | | | 01/01/06 | | | | 7.64 | % | 17,678 | | 6,187 | | | |
| | Ridgewood Court | | | | 01/01/06 | | | | 7.64 | % | 7,978 | | 2,792 | | | |
| | Royal Eagle Plaza | | | | 01/01/06 | | | | 7.64 | % | 7,920 | | 2,772 | | | |
| | Village Park Plaza | | | | 01/01/06 | | | | 7.64 | % | 8,482 | | 2,969 | | | |
| | West Town Corners | | | | 01/01/06 | | | | 7.64 | % | 10,328 | | 2,411 | | | |
| | Westland Park Plaza | | | | 01/01/06 | | | | 7.64 | % | 4,950 | | 1,155 | | | |
| | Willow Knolls Court | | | | 01/01/06 | | | | 7.64 | % | 6,488 | | 2,271 | | | |
| | Yards Plaza, The | | | | 01/01/06 | | | | 7.64 | % | 8,270 | | 2,895 | | | |
| | CMBS Loan—Fixed (encumbers 13 Properties) | | (7) | | 05/15/06 | | | | 7.52 | % | 357,100 | | 178,550 | | | |
| | Great Northeast Plaza | | | | 06/01/06 | | | | 9.04 | % | 16,751 | | 8,376 | | | |
| | Smith Haven Mall | | | | 06/01/06 | | | | 7.86 | % | 115,000 | | 28,750 | | | |
| | Montgomery Mall | | | | 08/10/06 | | | | 7.48 | % | 27,000 | | 6,245 | | | |
| | Greendale Mall | | | | 12/10/06 | | | | 8.23 | % | 40,713 | | 20,005 | | | |
| | | | | | | | | | |
| |
| | | |
| | | Subtotal 2006 | | | | | | | | | | 656,546 | | 273,377 | | 7.67 | % |
44
| |
Gwinnett Place—1 |
|
|
|
04/01/07 |
|
|
|
7.54 |
% |
37,454 |
|
18,727 |
|
|
|
| | Gwinnett Place—2 | | | | 04/01/07 | | | | 7.25 | % | 82,568 | | 41,284 | | | |
| | Town Center at Cobb—1 | | | | 04/01/07 | | | | 7.54 | % | 47,718 | | 23,859 | | | |
| | Town Center at Cobb—2 | | | | 04/01/07 | | | | 7.25 | % | 62,837 | | 31,419 | | | |
| | Mall at Rockingham | | | | 09/01/07 | | | | 7.88 | % | 96,938 | | 23,816 | | | |
| | Bangor Mall | | | | 12/01/07 | | | | 7.06 | % | 24,051 | | 7,849 | | | |
| | | | | | | | | | |
| |
| | | |
| | | Subtotal 2007 | | | | | | | | | | 351,566 | | 146,954 | | 7.43 | % |
| |
Metrocenter |
|
|
|
02/28/08 |
|
|
|
8.45 |
% |
28,777 |
|
14,389 |
|
|
|
| | Aventura Mall—A | | | | 04/06/08 | | | | 6.55 | % | 141,000 | | 47,000 | | | |
| | Aventura Mall—B | | | | 04/06/08 | | | | 6.60 | % | 25,400 | | 8,467 | | | |
| | Aventura Mall—C | | | | 04/06/08 | | | | 6.89 | % | 33,600 | | 11,200 | | | |
| | West Town Mall | | | | 05/01/08 | | | | 6.90 | % | 76,000 | | 38,000 | | | |
| | Mall of New Hampshire—1 | | | | 10/01/08 | | | | 6.96 | % | 100,395 | | 49,332 | | | |
| | Mall of New Hampshire—2 | | | | 10/01/08 | | | | 8.53 | % | 8,239 | | 4,048 | | | |
| | Fashion Valley Mall—1 | | | | 10/11/08 | | | | 6.49 | % | 166,263 | | 83,132 | | | |
| | Fashion Valley Mall—2 | | | | 10/11/08 | | | | 6.58 | % | 29,124 | | 14,562 | | | |
| | | | | | | | | | |
| |
| | | |
| | | Subtotal 2008 | | | | | | | | | | 608,798 | | 270,130 | | 6.80 | % |
| |
Woodland Hills Mall |
|
|
|
01/01/09 |
|
|
|
7.00 |
% |
85,244 |
|
40,276 |
|
|
|
| | Source, The | | | | 03/11/09 | | | | 6.65 | % | 124,000 | | 31,000 | | | |
| | Whitehall Mall | | | | 04/01/09 | | | | 6.77 | % | 14,149 | | 5,597 | | | |
| | Apple Blossom Mall | | | | 09/10/09 | | | | 7.99 | % | 39,567 | | 19,442 | | | |
| | Auburn Mall | | | | 09/10/09 | | | | 7.99 | % | 46,322 | | 22,761 | | | |
| | | | | | | | | | |
| |
| | | |
| | | Subtotal 2009 | | | | | | | | | | 309,282 | | 119,076 | | 7.25 | % |
| |
Mall at Chestnut Hill |
|
|
|
02/02/10 |
|
|
|
8.45 |
% |
14,696 |
|
6,939 |
|
|
|
| | Mall of Georgia | | | | 07/01/10 | | | | 7.09 | % | 200,000 | | 100,000 | | | |
| | Florida Mall, The | | | | 12/10/10 | | | | 7.55 | % | 262,948 | | 131,474 | | | |
| | | | | | | | | | |
| |
| | | |
| | | Subtotal 2010 | | | | | | | | | | 477,644 | | 238,413 | | 7.38 | % |
| |
Atrium at Chestnut Hill |
|
|
|
03/11/11 |
|
|
|
6.89 |
% |
47,812 |
|
23,494 |
|
|
|
| | Cape Cod Mall | | | | 03/11/11 | | | | 6.80 | % | 97,222 | | 47,772 | | | |
| | Highland Mall | | | | 07/11/11 | | | | 6.83 | % | 69,297 | | 34,649 | | | |
| | Fashion Centre Pentagon Retail | | | | 09/11/11 | | | | 6.63 | % | 163,085 | | 69,311 | | | |
| | | | | | | | | | |
| |
| | | |
| | | Subtotal 2011 | | | | | | | | | | 377,416 | | 175,226 | | 6.75 | % |
| |
Dadeland Mall |
|
|
|
02/11/12 |
|
|
|
6.75 |
% |
196,290 |
|
98,145 |
|
|
|
| | Square One | | | | 03/11/12 | | | | 6.73 | % | 93,363 | | 45,876 | | | |
| | Crystal Mall | | | | 09/11/12 | | | | 5.62 | % | 104,344 | | 77,808 | | | |
| | | | | | | | | | |
| |
| | | |
| | | Subtotal 2012 | | | | | | | | | | 393,997 | | 221,829 | | 6.35 | % |
| |
European Retail Enterprises—Fixed Components |
|
(16) |
|
01/17/13 |
|
|
|
6.49 |
% |
72,363 |
|
23,352 |
|
|
|
| | Emerald Square Mall | | | | 03/01/13 | | | | 5.13 | % | 143,548 | | 70,536 | | | |
| | Avenues, The | | | | 04/01/13 | | | | 5.29 | % | 79,260 | | 19,815 | | | |
| | Circle Centre Mall | | | | 04/11/13 | | | | 5.02 | % | 79,268 | | 11,629 | | | |
| | Solomon Pond | | | | 08/01/13 | | | | 3.97 | % | 114,000 | | 56,017 | | | |
| | Miami International Mall | | | | 10/01/13 | | | | 5.35 | % | 97,500 | | 46,582 | | | |
| | Liberty Tree Mall | | | | 10/11/13 | | | | 5.22 | % | 35,000 | | 17,198 | | | |
| | | | | | | | | | |
| |
| | | |
| | | Subtotal 2013 | | | | | | | | | | 620,939 | | 245,129 | | 5.05 | % |
45
| |
Quaker Bridge Mall |
|
|
|
04/01/16 |
|
|
|
7.03 |
% |
24,077 |
|
9,525 |
|
|
|
| | | | | | | | | | |
| |
| | | |
| | | Subtotal 2016 | | | | | | | | | | 24,077 | | 9,525 | | 7.03 | % |
| |
King of Prussia—1 |
|
|
|
01/01/17 |
|
|
|
7.49 |
% |
192,940 |
|
24,805 |
|
|
|
| | King of Prussia—2 | | | | 01/01/17 | | | | 8.53 | % | 13,259 | | 1,705 | | | |
| | | | | | | | | | |
| |
| | | |
| | | Subtotal 2017 | | | | | | | | | | 206,199 | | 26,510 | | 7.56 | % |
| | | | | | | | | | |
| |
| |
| |
| |
Total Joint Venture Fixed Rate Mortgage Debt |
|
|
|
|
|
|
|
|
|
4,654,230 |
|
1,978,787 |
|
7.00 |
% |
| | | | | | | | | | |
| |
| |
| |
| |
Variable Rate Mortgage Debt: |
|
|
|
|
|
|
|
|
|
|
|
|
|
|
|
| |
Clay Terrace Partners |
|
|
|
02/15/04 |
|
|
|
2.87 |
% |
22,847 |
|
11,424 |
|
|
|
| | Northfield Square | | | | 04/01/04 | | | | 3.62 | % | 34,670 | | 10,956 | | | |
| | Fashion Centre Pentagon Office | | | | 09/10/04 | | | | 2.62 | % | 33,000 | | 14,025 | | | |
| | Shops at Sunset Place, The | | | | 10/15/04 | | | | 4.12 | % | 95,315 | | 35,743 | | | |
| | | | | | | | | | |
| |
| | | |
| | | Subtotal 2004 | | | | | | | | | | 185,832 | | 72,148 | | 3.55 | % |
| |
Mall of America |
|
(2) |
|
03/10/05 |
|
|
|
1.65 |
% |
312,000 |
|
85,800 |
|
|
|
| | Galleria Commerciali Italia | | (2),(17) | | 06/22/05 | | | | 3.30 | % | 618,294 | | 302,964 | | | |
| | Seminole Towne Center | | (2) | | 07/01/05 | | | | 3.62 | % | 69,355 | | 31,210 | | | |
| | | | | | | | | | |
| |
| | | |
| | | Subtotal 2005 | | | | | | | | | | 999,649 | | 419,974 | | 2.99 | % |
| |
CMBS Loan—1 Floating (encumbers 13 Properties) |
|
(7) |
|
05/15/06 |
|
|
|
1.53 |
% |
186,500 |
|
93,250 |
|
|
|
| | CMBS Loan—2 Floating (encumbers 13 Properties) | | (7) | | 05/15/06 | | | | 1.49 | % | 81,400 | | 40,700 | | | |
| | Westin Hotel—NYC | | | | 06/05/06 | | | | 3.87 | % | 182,500 | | 13,425 | | | |
| | Mall of Georgia Crossing | | | | 06/09/06 | | | | 3.12 | % | 33,214 | | 16,607 | | | |
| | Montreal Forum—Canada | | (2),(18) | | 08/08/06 | | | | 5.76 | % | 43,159 | | 15,375 | | | |
| | | | | | | | | | |
| |
| | | |
| | | Subtotal 2006 | | | | | | | | | | 526,773 | | 179,357 | | 2.21 | % |
| |
Houston Galleria—2 |
|
(2) |
|
06/25/07 |
|
|
|
2.62 |
% |
83,558 |
|
26,308 |
|
|
|
| | | | | | | | | | |
| |
| | | |
| | | Subtotal 2007 | | | | | | | | | | 83,558 | | 26,308 | | 2.62 | % |
| |
European Retail Enterprises—Variable Components |
|
(19) |
|
09/05/13 |
|
|
|
4.27 |
% |
188,834 |
|
60,937 |
|
|
|
| | | | | | | | | | |
| |
| | | |
| | | Subtotal 2013 | | | | | | | | | | 188,834 | | 60,937 | | 4.27 | % |
| | | | | | | | | | |
| |
| |
| |
| |
Total Joint Venture Variable Rate Mortgage Debt |
|
|
|
|
|
|
|
|
|
1,984,646 |
|
758,724 |
|
2.95 |
% |
| | | | | | | | | | |
| |
| |
| |
| |
Premium on JV Fixed-Rate Indebtedness |
|
|
|
|
|
|
|
|
|
8,527 |
|
4,257 |
|
|
|
| | Discount on JV Fixed-Rate Indebtedness | | | | | | | | | | (4,351 | ) | (2,138 | ) | | |
| | | | | | | | | | |
| |
| |
| |
| |
Total Joint Venture Debt |
|
|
|
|
|
|
|
|
|
6,643,052 |
|
2,739,630 |
|
5.88 |
% |
| | | | | | | | | | |
| |
| |
| |
| |
The Company's Share of Total Indebtedness |
|
|
|
|
|
|
|
|
|
|
|
12,880,756 |
|
6.01 |
% |
| | | | | | | | | | | | |
| |
| |
46
Footnotes:
- (1)
- Variable rate debt interest rates are based on the following base rates as of December 31, 2003: LIBOR at 1.12%; EURIBOR at 2.10%.
- (2)
- Includes applicable extensions available at Company's option.
- (3)
- These three Properties are secured by cross-collateralized and cross-defaulted mortgages.
- (4)
- These three Properties are secured by cross-collateralized and cross-defaulted mortgages.
- (5)
- Through an interest rate swap agreement, effectively fixed through the maturity date at the all-in interest rate presented.
- (6)
- These notes are secured by cross-collateralized and cross-defaulted mortgages encumbering seven of the Properties (West Ridge Mall, Bay Park Square, Boardman Plaza, Cheltenham Square, DeSoto Square, Upper Valley Mall and Washington Square).
- (7)
- These Commercial Mortgage Notes are secured by cross-collateralized mortgages encumbering thirteen of the Properties (Eastland Mall, Southern Hills Mall, Lindale Mall, Southridge Mall, Granite Run Mall, Lake Square Mall, Northpark Mall, Southpark Mall, Valley Mall, Mesa Mall, Empire Mall, Empire East Mall and Rushmore Mall). A weighted average rate is used.
- (8)
- These three Properties are secured by cross-collateralized and cross-defaulted mortgages.
- (9)
- These four Properties are secured by cross-collateralized and cross-defaulted mortgages.
- (10)
- These four Properties are secured by cross-collateralized and cross-defaulted mortgages.
- (11)
- These eleven Properties are secured by cross-collateralized and cross-defaulted mortgages.
- (12)
- These three Properties are secured by cross-collateralized and cross-defaulted mortgages.
- (13)
- Simultaneous with the issuance of this loan, the Company entered into a $70 million notional amount variable rate swap agreement which is designated as a hedge against this loan. As of December 31, 2003, after including the impacts of this swap, the terms of the loan are effectively $150 million fixed at 3.60% and $70 million variable rate at 1.16%.
- (14)
- Amounts shown in USD Equivalent. Balance includes borrowings on an Alternative Currency Sub-Tranche of Euros 48.5 million.
- (15)
- Amounts shown in USD Equivalent. Euro equivalent is 163.0 million.
- (16)
- Amounts shown in USD Equivalent. Euro equivalent is 57.6 million.
- (17)
- Amounts shown in USD Equivalent. Euro equivalent is 492.4 million.
- (18)
- Amounts shown in USD Equivalent. Canadian Dollar equivalent is 56.0 million.
- (19)
- Amounts shown in USD Equivalent. Euro equivalent is 150.4 million.
47
SIMON PROPERTY GROUP
Unencumbered Assets
As of December 31, 2003
Property Name
| | City
| | State
|
|---|
| Regional Malls: | | | | |
University Mall |
|
Little Rock |
|
AR |
Southgate Mall |
|
Yuma |
|
AZ |
Brea Mall |
|
Brea |
|
CA |
| Laguna Hills Mall | | Laguna Hills | | CA |
| Santa Rosa Plaza | | Santa Rosa | | CA |
| Shops at Mission Viejo, The | | Mission Viejo | | CA |
| Westminster Mall | | Westminster | | CA |
Aurora Mall |
|
Aurora |
|
CO |
Boynton Beach Mall |
|
Boynton Beach |
|
FL |
| Cordova Mall | | Pensacola | | FL |
| Edison Mall | | Fort Meyers | | FL |
| Orange Park Mall | | Orange Park | | FL |
| Town Center at Boca Raton | | Boca Raton | | FL |
| Tyrone Square | | St. Petersburg | | FL |
| University Mall | | Pensacola | | FL |
Lenox Square |
|
Atlanta |
|
GA |
| Phipps Plaza | | Atlanta | | GA |
Alton Square |
|
Alton |
|
IL |
| Lincolnwood Town Center | | Lincolnwood | | IL |
| Northwoods Shopping Center | | Peoria | | IL |
| Orland Square | | Orland Park | | IL |
| River Oaks Center | | Calumet City | | IL |
Castleton Square Mall |
|
Indianapolis |
|
IN |
| Lafayette Square | | Indianapolis | | IN |
| Muncie Mall | | Muncie | | IN |
Hutchinson Mall |
|
Hutchinson |
|
KS |
Prien Lake Mall |
|
Lake Charles |
|
LA |
Burlington Mall |
|
Burlington |
|
MA |
| South Shore Plaza | | Braintree | | MA |
St. Charles Towne Center |
|
Waldorf |
|
MD |
Maplewood Mall |
|
Minneapolis |
|
MN |
| Miller Hill Mall | | Duluth | | MN |
Independence Center |
|
Independence |
|
MO |
SouthPark Mall |
|
Charlotte |
|
NC |
Pheasant Lane |
|
Nashua |
|
NH |
48
Livingston Mall |
|
Livingston |
|
NJ |
| Menlo Park Mall | | Edison | | NJ |
| Ocean County Mall | | Toms River | | NJ |
| Rockaway Townsquare | | Rockaway | | NJ |
Cottonwood Mall |
|
Albuquerque |
|
NM |
Chautauqua Mall |
|
Lakewood |
|
NY |
| Nanuet Mall | | Nanuet | | NY |
| Roosevelt Field | | Garden City | | NY |
| Walt Whitman Mall | | Huntington Station | | NY |
Great Lakes Mall |
|
Mentor |
|
OH |
| Lima Mall | | Lima | | OH |
| Southern Park Mall | | Boardman | | OH |
| Summit Mall | | Akron | | OH |
| Woodville Mall | | Northwood | | OH |
Eastland Mall |
|
Tulsa |
|
OK |
| Heritage Park Mall | | Midwest City | | OK |
Ross Park Mall |
|
Pittsburgh |
|
PA |
| South Hills Village | | Pittsburgh | | PA |
Haywood Mall |
|
Greenville |
|
SC |
Oak Court Mall |
|
Memphis |
|
TN |
Barton Creek Square |
|
Austin |
|
TX |
| Broadway Square | | Tyler | | TX |
| Irving Mall | | Irving | | TX |
| La Plaza Mall | | McAllen | | TX |
| Richardson Square Mall | | Richardson | | TX |
| Rolling Oaks Mall | | San Antonio | | TX |
Charlottesville Fashion Square |
|
Charlottesville |
|
VA |
| Virginia Center Commons | | Glen Allen | | VA |
Columbia Center |
|
Kennewick |
|
WA |
| Northgate Mall | | Seattle | | WA |
Community Centers: |
|
|
|
|
Bridgeview Court |
|
Bridgeview |
|
IL |
| Countryside Plaza | | Countryside | | IL |
| Lake Plaza | | Waukegan | | IL |
| North Ridge Plaza | | Joliet | | IL |
Brightwood Plaza |
|
Indianapolis |
|
IN |
| Greenwood Plus | | Greenwood | | IN |
| Griffith Park Plaza | | Griffith | | IN |
| Markland Plaza | | Kokomo | | IN |
| New Castle Plaza | | New Castle | | IN |
| Northwood Plaza | | Fort Wayne | | IN |
| Teal Plaza | | Lafayette | | IN |
| Tippecanoe Plaza | | Lafayette | | IN |
49
| University Center | | Mishawaka | | IN |
| Wabash Village | | West Lafayette | | IN |
| Washington Plaza | | Indianapolis | | IN |
Park Plaza |
|
Hopkinsville |
|
KY |
Rockaway Convenience Center |
|
Rockaway |
|
NJ |
Great Lakes Plaza |
|
Mentor |
|
OH |
| Lima Center | | Lima | | OH |
| Northland Plaza | | Columbus | | OH |
Eastland Plaza |
|
Tulsa |
|
OK |
Charles Towne Square |
|
Charleston |
|
SC |
Knoxville Commons |
|
Knoxville |
|
TN |
The Arboretum |
|
Austin |
|
TX |
| Celina Plaza | | El Paso | | TX |
| Ingram Plaza | | San Antonio | | TX |
Martinsville Plaza |
|
Martinsville |
|
VA |
Office: |
|
|
|
|
O'Hare International Center |
|
Rosemont |
|
IL |
50
SIMON PROPERTY GROUP
Preferred Stock/Units Outstanding
As of December 31, 2003
($ in 000's)
Issuer
| | Description
| | Number of
Shares/Units
| | Per Share
Liquidation
Preference
| | Aggregate
Liquidation
Preference
| | Ticker
Symbol
|
|---|
| Perpetual | | | | | | | | | | | | |
| Simon Property Group, Inc. | | Series E Preferred 8% Cumulative Redeemable(1) | | 1,000,000 | | $ | 25 | | $ | 25,000 | | N/A |
| Simon Property Group, Inc. | | Series F Preferred 83/4% Perpetual(2) | | 8,000,000 | | $ | 25 | | $ | 200,000 | | SPGPrF |
| Simon Property Group, Inc. | | Series G Preferred 7.89% Perpetual(3) | | 3,000,000 | | $ | 50 | | $ | 150,000 | | SPGPrG |
| Simon Property Group, Inc. | | Series H Variable Rate Preferred | | 78,012 | | $ | 25 | | $ | 1,950 | | N/A |
| Preferred Units: | | | | | | | | | | | | |
| Simon Property Group, L.P. | | Series C 7% Cumulative Convertible Preferred(4) | | 2,600,895 | | $ | 28 | | $ | 72,825 | | N/A |
| Simon Property Group, L.P. | | Series D 8% Cumulative Redeemable Preferred(5) | | 2,600,895 | | $ | 30 | | $ | 78,027 | | N/A |
| Simon Property Group, L.P. | | 7.50% Cumulative Redeemable Preferred(6) | | 251,096 | | $ | 100 | | $ | 25,110 | | N/A |
| Simon Property Group, L.P. | | 7.75%/8.00% Cumulative Redeemable Preferred | | 822,588 | | $ | 100 | | $ | 82,259 | | N/A |
- (1)
- The shares are not redeemable prior to August 27, 2004.
- (2)
- The shares are redeemable on or after September 29, 2006. The shares are not convertible into any other securities of the Company. The shares are traded on the New York Stock Exchange. The closing price on December 31, 2003, was $27.30 per share.
- (3)
- The Cumulative Step-Up Premium Rate Preferred Stock was issued at 7.89%. The shares are redeemable after September 30, 2007. Beginning October 1, 2012, the rate increases to 9.89%. The shares are not convertible into any other securities of the Company. The shares are traded on the New York Stock Exchange. The closing price on December 31, 2003 was $54.30 per share.
- (4)
- Each unit/share is convertible into 0.75676 shares of common stock on or after August 27, 2004 if certain conditions are met. Each unit/share is not redeemable prior to August 27, 2009.
- (5)
- Each unit/share is not redeemable prior to August 27, 2009.
- (6)
- Each unit/share is not redeemable prior to November 10, 2006.
51
QuickLinks
SIMON PROPERTY GROUP OverviewSIMON PROPERTY GROUP Changes in Common Shares and Unit Ownership For the Period from December 31, 2002 through December 31, 2003SIMON PROPERTY GROUP Selected Financial Information As of December 31, 2003 Unaudited (In thousands, except as noted)Simon Property Group, Inc. Pro-Rata Balance Sheet As of December 31, 2003Simon Property Group, Inc. Pro-Rata Statement of Operations For three months ended December 31, 2003Simon Property Group, Inc. Pro-Rata Statement of Operations For twelve months ended December 31, 2003SIMON PROPERTY GROUP Reconciliation of NOI to Net Income As of December 31, 2003SIMON PROPERTY GROUP Computation of Comparable Property NOI Growth As of December 31, 2003SIMON PROPERTY GROUP Analysis of Other Income and Other Expense As of December 31, 2003 (In thousands)SIMON PROPERTY GROUP Portfolio GLA, Occupancy & Rent Data—U.S. Portfolio As of December 31, 2003SIMON PROPERTY GROUP Rent Information—U.S. Portfolio As of December 31, 2003SIMON PROPERTY GROUP Lease Expirations(1)—U.S. Portfolio As of December 31, 2003SIMON PROPERTY GROUP Lease Expirations(1)—U.S. Portfolio As of December 31, 2003SIMON PROPERTY GROUP Top Regional Mall Tenants—U.S. Portfolio As of December 31, 2003 (Square Feet in 000's)SIMON PROPERTY GROUP 2003 Regional Mall Anchor/Big Box Openings—U.S. PortfolioSIMON PROPERTY GROUP 2004 Projected Regional Mall Anchor/Big Box Openings—U.S. PortfolioSIMON PROPERTY GROUP 2005 Projected Regional Mall Anchor/Big Box Openings—U.S. PortfolioSIMON PROPERTY GROUP Property Listing—North American Assets As of December 31, 2003Simon Property Group Property Listing—European Assets As of December 31, 2003SIMON PROPERTY GROUP Capital Expenditures For the Twelve Months Ended December 31, 2003 (In millions)SIMON PROPERTY GROUP North American Development Activity Report* Project Overview, Construction-in-Progress and Land Held for Development As of December 31, 2003SIMON PROPERTY GROUP North American Development Activity Report* Project Overview, Construction-in-Progress and Land Held for Development As of December 31, 2003SIMON PROPERTY GROUP The Company's Share of Total Debt Amortization and Maturities by Year As of December 31, 2003 (In thousands)SIMON PROPERTY GROUP Summary of Indebtedness As of December 31, 2003 (In thousands)SIMON PROPERTY GROUP Summary of Indebtedness By Maturity As of December 31, 2003 (In thousands)SIMON PROPERTY GROUP Unencumbered Assets As of December 31, 2003SIMON PROPERTY GROUP Preferred Stock/Units Outstanding As of December 31, 2003 ($ in 000's)